improving the usage of fisheries statistics in vietnam for production planning, fisheries management...
TRANSCRIPT

Marine Policy 26 (2002) 13–34
Improving the usage of fisheries statistics in Vietnam for productionplanning, fisheries management and nature conservation
Paul A.M. van Zwietena,*, Wim L.T. van Densenb, Dang Van Thic
aFish Culture and Fisheries Group, P.O. Box 338, 6700 AH Wageningen, NetherlandsbRIVO Netherlands Institute for Fisheries Research, P.O. Box 68, 1970 AB IJmuiden, Netherlands
cResearch Institute of Marine Products, 170 Le Lai, Haiphong, Viet Nam
Received 12 August 2001; accepted 2 October 2001
Abstract
The organisation of a fisheries statistical system dictates the potential usage of its information output. Information is used for
planning of food production (fish as a commodity), for fisheries management (fish as a renewable natural resource), and for nature
conservation (fish as an indicator for ecosystem quality). In this sequence, the required temporal, spatial and categorical resolution
of data increases, while aggregation into meaningful ecological spaces requires a subtle way of organising the data flow. The effective
usage of the present fisheries information of Vietnam is constrained by (1) its low categorical resolution and (2) the non-transparent
aggregation of data into mere administrative spaces. Information requirements can be better articulated with the instalment of
mandatory evaluation procedures at all levels in the fisheries administration. Our examples range from the national administration
of the 4 million ton marine fisheries in Hanoi, to the local administration of a fishing commune in the Red River Delta. r 2002
Elsevier Science Ltd. All rights reserved.
Keywords: Categorical, temporal and spatial resolution; Aggregation; Monitoring; Information requirements; Evaluation
1. Introduction
‘‘Statistics is like counting crabs in holes’’ (Vietna-mese expression)
Management of fisheries and marine coastal resourcescannot be effective without reliable information onecosystem changes and the causes of those changes.Robust fisheries and environmental monitoring systemsare indispensable to address questions regarding long-term changes in the coastal ecosystem and regardingimpacts both of fishing and of other human activities inthe coastal zone [1]. Whereas information needs forfisheries management generally dictate short-term an-nual input of information for decision making, long-term biological information is needed to differentiatebetween natural and human-induced changes in fishstocks and ecosystems and to take action accordingly[2]. In many parts of the world, the main supply of suchinformation is through monitoring of fisheries input
(fishing effort) and output (catch), i.e. through fishery-dependent monitoring. Fishery-independent monitoringthrough experimental surveys is difficult to maintain bydeveloping nations, as they are expensive and oftencannot generate the amount of data needed for theevaluation of states or changes, especially not in thehighly diverse tropical coastal and marine environments.Long-term monitoring of fish stocks, therefore, is almostby necessity dependent on information obtainedthrough the fisheries exploiting them and with that onthe official fisheries statistical system in use.Fishery-dependent monitoring entails at least the
collection of three essential parameters in fisheriesstatistics: catch (C), fishing effort (f ) and catch-rate(C/f ) (Appendix A). Catch and Effort Data CollectionSystems (CEDRS) maintained to address informationneeds for fishery management vary in their degree ofadministrative and statistical sophistication [3]. Over thepast few decades, the methodological core of fisheriesmonitoring programmesFsampling strategies, datacollection and in recent times also data storage andhandlingFhas been consistently addressed in institu-tional assistance and in capacity building in fisheries
*Corresponding author. Tel.: +31-317-483920.
E-mail address: [email protected] (P.A.M. van
Zwieten).
0308-597X/02/$ - see front matter r 2002 Elsevier Science Ltd. All rights reserved.
PII: S 0 3 0 8 - 5 9 7 X ( 0 1 ) 0 0 0 3 6 - 7

management by developing nations. Much less attentionwas given to the better usage of monitoring informationby improving the evaluative capacity of the fisheriesadministration. In capacity building in fisheries manage-ment and research so far, the focus was on data-intensive methods for fish stock assessments, usinginformation on stock structure, on age-specific growthand mortality rates and on catch and effort data. Forthat purpose, time series of high-quality data areneeded. Such series are often difficult to maintainbecause of the high costs involved in data collectionprocedures, the institutional set-up and in the main-tenance of the knowledge base. The required precision indata collection shows the inefficiencies of the presentsystems more clearly, leading to frustrations over theapplicability of knowledge contained in standard butvery analytic fisheries science. The answer to suchinefficiencies may not be just ‘more data’. Instead, theanswer may lie in the development of managementpractices that maximise the use of the existing data,information and knowledge on catch and fishing effortand in the improvement of the capacity of an admin-istration to evaluate such information. This presumes anorganisational set-up in which it is possible to developthe diagnostic powers [1] needed to turn the informationcontained in the monitoring data into a growing body ofknowledge.In this paper, we will categorise the usage of fisheries
statistics in the domains of food production, fisheriesmanagement and nature conservation. We identify thedifferences in data resolution and aggregation requiredin these domains. Next we examine the fisheries data inthe statistical system of Vietnam as available at variousadministrative levelsFfrom landings per harbour to thenational production of marine fishFto assess how wellthe data collected and processed in the system can beturned into information needed for decision making inthese domains. After having identified the majorconstraints in the generation of information, we suggestimprovements to be made in the countrywide fisheriesadministration.
2. Categorising the usage of fisheries information
The organisation of a fisheries statistical data collec-tion system dictates the potential use of the informationit produces. We distinguish three domains of usage: forproduction planning purposes (fish as a commodity), forfisheries management (fish as a renewable resource), andfor nature conservation and environmental impactassessment (fish as an indicator for ecosystem quality)(Table 1). Each of these domains is ultimately relatedto management objectives [4, p. 230], which can begeneralised with the slogans: ‘‘Feed the people’’, ‘‘Setlevels of resource usage’’ and ‘‘Retain the integrity of
nature’’. These three objectives, which often conflictwhile they may represent three different ‘world views’[5], relate to different information requirements toevaluate whether these objectives are reached.Differences in information requirements associate
with differences in categorical, temporal and spatialresolution in catch (C), fishing effort (f ) and catch perunit of effort (C/f ) data [6] (Fig. 2). The resolution ofdata gathered by a CEDRS depends mostly on samplingconsiderations and is thus constrained by the financialcapabilities of the organisation (Appendix A). Require-ments with respect to temporal resolution in fisheriesdata are the least problematic: catch and fishing effortusually are needed as annual totals or averages. Higherresolutions (quarterly, seasonally, weekly) are some-times necessary, for instance, when regulatory action oneffort allocation through fishery closures (temporal orspatial) has to be justified. Spatial resolution is muchmore important and demanding, both in fisheriesmanagement and in nature conservation (Table 2). Infisheries management, sufficient spatial resolution isnecessary to determine the effects of the spatialallocation of fishing effort on stocks, confined toparticular ecological spaces. Issues in environmentalmanagement entail habitat structure, species diversity,and trophic composition; all spatially defined ecosystemproperties which require that indicators obtainedthrough fishery-dependent information should be un-equivocally related to fishing grounds. Categoricalresolution in fisheries data refers to the number of catchcategories distinguished on either taxonomic (species,genera, families), ecological (habitat, trophic groups,migration) or other grounds as required for fisheriesmanagement. This is usually limited to single species ofeconomic valueFabundant or highly valued species towhich a fishery is directed. Information criteria refer tobiologically acceptable, economically efficient and so-cially beneficial harvest levels of important species, forwhich suites of reference points have been constructed[7]. For nature conservation, all fish species or subsets ofecologically highly-valued species and relations betweenthem become important. Information criteria refer tobiological diversity, viability of ecologically importantnon-resource fish species, annual variation in catch ofnon-target species [8,9]. Everything calls for a highcategorical resolution of data on catch and fishingeffort, to ensure the early warning and early controlfunctions [1]1 of fisheries monitoring systems. Therefore,categorical information requirements for nature con-servation purposes are highest and not necessarily
1The basic functions of environmental monitoring systems are ‘early
control’Fjudging causal connections between measures and effects,
and ‘early warning’Ftesting of main categories of possible effects, for
example, through scenario studies.
P.A.M. van Zwieten et al. / Marine Policy 26 (2002) 13–3414

Fig. 1. Vietnam, with the location of Nam Dinh Province. I–IV represent main ecological zones in the gulf of Bac Bo. Inset: the coastal area of Nam
Dinh Province comprising the districts Giao Thuy, Hai Hau and Nghia Hung (from North to South). Shown are main fishing grounds around the Ba
Lat River of three important fisheries, their landing places of fish and locations of fisheries information.
P.A.M. van Zwieten et al. / Marine Policy 26 (2002) 13–34 15

Table 1
Domains of usage of fisheries information in the context of production planning, fisheries management and nature conservation. C=catch, f=effort, and C/f=Catch rate. The term vulnerability
space is used to refer to the more specific spatial and temporal requirements of fisheries information in environmental impact assessments
Usage Production planning Fisheries management Nature conservation
1. Worldview Social-community view Rationalisation view Conservation view
2. Objectives ‘‘Feed the people’’ ‘‘Set levels of resource usage’’ ‘‘Retain the integrity of nature’’
Catch
Effort
3. Evaluation Developments in catch (C) by
administrative area and (efficiency of )
investments in fishery activities (f )
Developments in the size and
composition of fish stocks (resource
depletion, species shifts)
Changes in catch rate as a measure
for stock biomass
Estimate level of sustainable resource
use: e.g. Maximum Sustainable Yield,
when product of C/f� f reaches amaximum
Developments in the size and
composition of the stocks of the most
vulnerable species with C/f as a measure
for stock biomass
4. Information:
Categorical
resolution
Major economic categories of fish
groupings/species
Target groups or species Target groups or species related to
fishing effort
Indicator species
Time series
for evaluation
Total resource output (C) per year Catch rate (C/f) by year Catch rate (C/f) by year Catch rate (C/f) by year
Space of data
aggregation
Administrative space Ecological space Ecological space Vulnerability space
5. Diagnostic
power needed
Early warning: scenarios
Early control: relation catch and
economic/demographic developments
Early warning: specification of
categories of causesF>natural,
anthropogenic: secnarios, hypothesis
forming
Early control: causal connection
between fishery measure and effect
Early control: causal connection
between measure and impact on
habitat/resource
Ultimate goal of monitoring: check on and increase in efficiency of decision making
P.A
.M.
van
Zw
ietenet
al.
/M
arin
eP
olicy
26
(2
00
2)
13
–3
416

contained in the economic value of the target species ofa fishery.Catch and fishing effort data collected to address the
information requirements to evaluate objectives in anyof the three domains relate in different ways to theexploited or affected ecosystem (Table 2). In the case ofproduction planning, the linkage is rather loose: mostimportant here are evaluations of investments made onfish production levels. Time windows and spatialboundaries of the information required are defined inthe context of social and economic objectives. Forinstance, to evaluate the investment programme for theVietnamese offshore fisheryFdescribed belowFcatchinformation is collected at monthly intervals at districtlevel and reported quarterly and annually to theprovincial level in a programme that is implementednationally and extends over a period of 8 years (1997–2005). The information is collected and aggregated at
the different hierarchical levels of the administrationwithout any reference to the causes for possible states orchanges in the environment that produces the fish2. Forboth fisheries management and nature conservation, thedefinition and evaluation of management objectivesrequire the identification of spatial boundaries and timewindows that are relevant to the exploited resource or tothe natural environment. Thus, the three domains ofusage of fisheries data show increasing complexity ofcategorical, spatial and temporal focus of the informa-tion required for decision making. Associated with the
Fig. 2. Levels of aggregation and resolution of the variables (C=catch, f=fishing effort and C/f=catch rate) collected through fisheries-dependent
monitoring set in the dimensions space, time and category. Columns are examples of aggregations of variables over the three dimensions, with their
associated resolution. The thick broken lines represent the level of aggregation of the FAO world catches in its report on the state of world fisheries
and aquaculture [29], where on the first page is depicted a graph of the annual development (time) in world catch (space) by broad groups of
utilisation (category).
Table 2
Relative importance of temporal, spatial and categorical resolution in fisheries data as related to the usage of information
Domains of information usage Temporal Spatial Categorical
Production planning � � �Fisheries management � + 7Nature conservation � + +
2Fishery-independent information is treated in a similar fashion.
Surveys conducted by the Research Institute of Marine Products, the
research institute of the Vietnamese Ministry of Fisheries, yield
spatially detailed estimates of potential yields, whose estimates are
used as guidelines for production planning and are disseminated to
fishermen for advise on the spatial allocation of fishing effort (see also
[10]).
P.A.M. van Zwieten et al. / Marine Policy 26 (2002) 13–34 17

increased complexity of information requirements arespecific requirements for data collection and storage,and for the format in which such complex informationshould be disseminated to be meaningful in a publicadministrative context.The next issue to be tackled is the level of aggregation
at which information contained in the data becomesvisible and interpretable to fulfil the functions of amonitoring system. This question relates to the level ofaggregation at which trends or events become visibleagainst the noise in the data and the temporal andspatial linkage of the information with the ecosystemunder scrutiny. Collection and subsequent aggregationof fishery data always take place within an adminis-trative space. By this, we mean the institutional set-up ofa data collection system. The term institutional is usedhere in a limited physical sense: data collections are setup within administrative boundaries carried out byspecialised organisationsFin Vietnam, these are theDepartment of Fisheries and the Statistical Departmentat national, provincial, district level and the peoplescommittee at communal level. Decision making onproduction planning, fisheries management and natureconservation is prepared through these administrativeunits and these are the sites where information, possiblyrearranged by ecological space, could be evaluated aswell [6]. Ecological space refers to the boundaries ofrelevant ecological subsystems, within a hierarchy ofspatio-temporal classifications of ecosystems. Adminis-trative spaces often do not overlap with the ecologicalspace in which a fishery operates, which implies thatlinkage of aggregated data should take place acrossadministrative boundaries.In the remainder of this contribution we will describe
the Vietnamese fisheries, the present usage of fisheriesdata as available in Vietnam, and then focus on ever-smaller administrative spaces (province, districts andcommune) to illustrate the above-sketched categorisa-tion on the usage of fisheries data and information.Next, we will evaluate the information generated at thevarious administrative levels with respect to its informa-tion quality (resolution, bias/variance), accessibility,availability and adaptability and the administrativecapacity to evaluate this information. Using the dataavailable in the present fisheries administration, wedemonstrate how the existing data usage could beimproved as well as how the evaluative capacity of theVietnamese fisheries statistical system could be en-hanced. Lastly, we will discuss the current instalmentof a completely new fishery monitoring system whichovercomes much of the technical problems described,but will put heavy demands on the evaluative capabil-ities within the fisheries administration.The descriptions and analysis of the Vietnamese
fisheries presented are based on data and reportsobtained from administrative sources (Ministry of
Fisheries (Hanoi); Department of Fisheries of NamDinh Province (provincial office in Nam Dinh anddistrict offices in Giao Thuy, Hai Hau); Hai Ly andGiao Long Peoples Committees; Statistical Offices inNgo Dong (Giao Thuy) and Yen Dinh (Hai Hau);Research Institute of Marine Products (Haiphong) andfrom numerous open-ended interviews with governmentofficials, researchers and fishermen in Hanoi, Haiphongand Nam Dinh Province. The information was collectedduring three extensive field visits in totally 6 months tothe coastal province of Nam Dinh and governmentalfisheries research and administrative institutions inHanoi and Haiphong in 1999, 2000 and 2001. NamDinh Province is situated near the Ba Lat estuary of theRed River, in North Vietnam (Fig. 1). The fishery in theestuary is expected to be affected by the fishing pressurein the coastal area, by up-stream river alterationsFthebuilding of the dam in the Hoa Binh River (1979–1983),a major tributary of the Red River north-west ofHanoiFand by more intensive and diverse use of theriver floodplains. A key question for Vietnameseauthorities could be whether impacts of such environ-mental changes can be perceived by the Vietnamesefisheries administration, with the aid of information oncatch and fishing effort contained in the present fisheriesdata collection system. At what level of aggregationcould these impacts possibly be perceived and with whatcategorical, temporal and spatial resolution?
3. Vietnamese fisheries and data collection
Vietnam has a long history of using fisheriesinformation in particular for planning purposes: inessence, the information used for decision making wasbased on enumeration of fish catches along adminis-trative lines. Broadly defined objectives of the Vietna-mese government include maximising the contributionof fisheries to the national economy and to the foodsupply of the Vietnamese population as well as realisingthese objectives in a sustainable way [10].The marine fisheries of Vietnam, which according to
official Vietnamese statistics [10] contribute 65% of thefishery productionFthe remaining 35% is aquacultureand freshwater fisheriesFis mainly conducted in thecoastal area below 50m depth. Fish stocks present inthis area are considered to be fully exploited. A large-scale investment programme was launched in 1997 toincrease the exploitation of offshore resources both toincrease food supply, while at the same time to maintainthe inshore catches, and with that bring to a halt theincreasing fishing pressure on the coastal zone. Thepolicy aims to increase the fishery production with 40%of the present catch by 2005 [11]. The programme ismonitored through the Ministry of Fisheries, and itseffectiveness must be evaluated to the extent that
P.A.M. van Zwieten et al. / Marine Policy 26 (2002) 13–3418

objectives both for production planning and for natureconservation are reached.Vietnam has a coastline of more than 3200 km shared
by 28 provinces. The exclusive economic zone approx-imates 1million km2. There are four hydrologicallydefined coastal regions, called management areas, thatare considered large ecological spaces as well: the BacBo (Tonkin) Gulf in the North, Central Vietnam,Southeast Vietnam and Southwest Vietnam. The threemajor areas for marine demersal fisheries are located inthe Bac Bo Gulf off the Red River Delta in NorthVietnam, in the coastal waters off the Mekong Delta inSoutheast Vietnam and in the Gulf of Thailand off theSouthwest coast of Vietnam (Fig. 1). Pelagic fisheries areoperated predominantly along the steep continentalshelf in central Vietnam and in Southeast Vietnam.Fisheries in Vietnam are small-scale. In 1995, one-
third of the estimated total of 93,000 [12] (but see [10,13]for different estimates) vessels were non-mechanisedvessels of circa 2–5 ton, including those employed ininland-capture fisheries. Approximately 80% of themechanised vessels were powered with engines o45 hp[14,15]. In 1995, the fishery was operated by anestimated 420,000 fishers fishing mostly near shore(o30m). Major fishing gears include trawls, gillnets,trammelnets and driftnets, lift nets, longlines andhandlines. Gillnets are widely used in the northernprovinces, set with both small, 5–7m and large, 15–20mvessels. Since 1997, the national offshore fisheryinvestment programme is expected to increase theoffshore fishing fleet to 1345 offshore trawlers by theend of 2001.The officially reported marine catch of approximately
1.3 million ton3 [16] in 1999 corresponds with 13 kg/haover the Exclusive Economic Zone. It consisted of about82% of fish, while the remainder consisted of shrimps,crabs, lobsters, squids, cuttlefish and other species. Onlycirca 6% of the reported national catch originated frominland waters. Around 70% of the approximately 1900marine fish species described are demersal species,inhabiting inshore and coastal areas of less than 50mdeep. Around 130 fish species, or 6%, are of economicimportance. Crustacean (1600 species) and mollusc(2500 species) diversity is high as well, and many ofthese are of economic importance [10,14,17–19].The established nationwide collection and processing of
fisheries data in Vietnam is organised at four adminis-trative levels, comprising the nation and 28 coastalprovinces with approximately 100 districts and approxi-mately 1000 coastal communes. In 22 provinces, the
Provincial Peoples Committees have established a Depart-ment of Fisheries. The fisheries data are collected by andaggregated through two distinct governmental depart-ments, the National Statistical Department and theMinistry of Fisheries. The latter has two sub-units thatcollect catch and/or effort data: the Department ofFisheries itself and its Fisheries Resources ProtectionDivision (Fig. 3). The Ministry of Fisheries including itsProvincial Departments employs approximately 1700people, of whom around 25% deal with marine fisheriesdata collection, research and dissemination of information.
3.1. National Statistical Department
This department collects nationwide statistics on alleconomic activities, including catch and effort infisheries. The department resides under the jurisdictionof the Prime–Minister’s Office. At provincial and districtlevels, the statistical departments provide informationboth to the higher administrative levels within theStatistical Department, to line ministries, such asFisheries, and to the Peoples Committees. The fisheriesinformation collected entails a total catch (C) bycommercial category and fishing effort (f ) as the numberof motorised vessels, distinguished by o45 hp and>45 hp, and the number of non-motorised vessels aswell as the total horsepower of all vessels. For thatpurpose once or twice a year a statistical officer,appointed by the commune where fishermen areregistered, obtains catch and effort data through inter-views with individual fishermen or with groups offishermen. Nam Dinh Province has 14 statistical officersin coastal communes. The District Statistical Officerchecks the information given, generally in co-operationwith the Department of Fisheries of the district, throughsample surveys. During these surveys, a selection offishermen categorised by the horsepower of their vesselsis interviewed, based on which a total catch figure perhorsepower category is calculated. Many fishermen keepsmall notebooks in which they record their daily catchesand revenues. Officers obtain an impression of the dailyoutput of a fisherman, by checking these notebooks.Though attempts at checking reported data by thecommune thus take place by Statistical Officers,the basic statistical data are in fact entirely reliant onthe memory of a fisherman and his willingness to divulgeinformation. Based on the interviews, total catches arebroken down into a variable number of broad commer-cial categories. However, in the provincial statisticalyearbook of, for instance, Nam Dinh, only thecategories ‘fish’ and ‘shrimp’ and ‘others’ are reported,while fishing effort as the total number of vessels andtotal horsepower is reported unrelated to the outcome ofthe fishery. All Statistical Officers interviewed have asuccinct notion of the problems associated with themethods of data collection and the discrepancies in
3The Research Institute of Marine Products through its Assessment
of Marine Living Resources programme, with technical and financial
assistance through Danish aid recently estimated marine capture to be
4 million ton, corresponding to 40 kg/ha over the EEZ. See [13] and
Section 6.
P.A.M. van Zwieten et al. / Marine Policy 26 (2002) 13–34 19

reporting, and seek creative solutions that, however,rarely are based on sound (statistical) methodologies.
3.2. Ministry of Fisheries
3.2.1. Provincial Department of Fisheries
Until around 1979, this department was responsiblefor the complete enumeration of total catches in broadcommercial categories (‘fish’, ‘shrimp’, ‘squid’, ‘others’)by commune and district. The sub-unit assured themaintenance of the fishery statistics in the political-administrative system of that timeFthe ‘communal’system. Since 1979, this enumeration system hasdisintegrated. However, the format of the data collectedincluding their poor categorical resolution remained tillthe present day: catch data, when collected through theDistrict Fisheries Office are alwaystotal weights of ‘fish’ by communeFonly sometimesbroken down by commercial categories or industrialproducts. Catches recorded are compared with annualcatches as planned per administrative unit (province,district, and commune) as laid down in their 5-yearplans. From 1979 onwards, fisheries statistics arecollected as a routine procedure with reports going tothe political authorities of the Peoples Committees atprovincial and at district level and to Ministry ofFisheries through its Fisheries Department and itsPlanning and Investment Department. Fisheries Officers
in charge of data collection are generally aware ofproblems and inconsistencies in the information theyprovide. Yet, they do not have the means andmethodologies to make the necessary evaluations inorder to highlight such problems.
3.2.2. Fisheries Resource Protection Department
This department through its Fisheries Inspectorate isresponsible for gear and vessel registration, i.e. solely forthe assessment of fishing effort (f ). Fishermen obtainlicenses directly through the inspectorate, but fishinggear and vessel are licensed separately from each other.The Fisheries Resource Protection Department reportsboth to the Provincial Fisheries Department and to thenational Fisheries Resource Protection Department ofthe Ministry of Fisheries. However, this is not done in astandardised way leading to considerable confusion atall administrative levels over the actual total amount ofeffort, and more so over the effort by horsepowercategory. For instance, the Nam Dinh inspectorate, withtwo offices near the coast in the districts Giao Thuy andNghia Hung, completely ignores the small but numeri-cally large fishery (B950 vessels) with units of o20 hp.Nevertheless, the Provincial Fisheries Department intheir report for 2000 to the Ministry of Fisheries detailsthe total amount of effort in the province by twohorsepower categories: vessels with engines between 2
Provincial Department of Fisheries (22)
Communes (15 coastal communes of which 8 have inhabitants with small scale fishing operations, 10 have offshore operations and 5 have harbours)
Ministry of Fisheries Research Institute of Marine Products (Haiphong) - ALMRV
Small scale fishery Harbour (5), Landing place (app. 35)
Offshore fishery Landing places (3) including harbours (2)
District Statistical Department (3)
Provincial Statistical Department (28)
National Statistical Department (Prime Ministers Office)
Fishery Resources Protection Department: in charge of the Fisheries Inspectorate (2)
C & f (half) yearly verbal reports;
f: licencing
C (f): on requestC& f: (joint) annual surveys
C &f: (half)yearreport
C& f: on request
FAO; SEAFDEC
District Fisheries Division (3)
C ( f)
C on request through standard format
C &f
C &f
C ( f) monthly report(logbooks)
Main harbours (1)
Provincial Fisheries Department (22); Others (6)
C/f and f by fleet (a.o.)
Marine Resources Protection Department
f
f
C ( f)
Fig. 3. Organisation of the Vietnamese fisheries statistical information, exemplified with collection, aggregation and flow of data from Nam Dinh
Province. Both the present data flow and the data flow of a new developed Catch and Effort Data Recording System organised through the Research
Institute of Marine Products of the Ministry of Fisheries are shown. Black arrows: maintenance obligation; open arrows: no maintenance obligation;
broken arrows: occasional joining of efforts to collect data. See text for further description.
P.A.M. van Zwieten et al. / Marine Policy 26 (2002) 13–3420

and 60 hp, including these small vessels, and those with>60 hpFdata obtained directly from the communalPeoples Committees. License registration forms gener-ally show that fishing effort data are far below officiallypublished data.So both the institutions residing under the Depart-
ment of Fisheries and the statistical offices residingunder the National Statistical Department have anobligation to maintain fisheries data collection systems.Only the formats for data collection and recording ofthe Statistical Department are nationally determined.Both provincial and district statistical offices fall underthe jurisdiction of the National Statistical Department.This is unlike the line departments such as Fisheries,whose lower administrations actually function asexecuting agencies of the Peoples Committees and havea much less strong connection to their respectiveministries. Statistical officers at commune level, whoare responsible for the data recording at the lowest levelof aggregation, however, do not officially belong to theadministration of the National Statistical Department,but are appointed by the Peoples Committee of acommune. They need to be co-opted in supplyinginformation, while they in turn have few means ofenforcing co-operation in the provision of fisheriesinformation by fishermen.The Department of Fisheries has an obligation to
maintain data collection systems. However, datacollections are not standardised and are often ad hoc,depending on the persons in charge, requests ofthe Peoples Committees or of higher levels in theadministration, such as is the case in the offshore fisheryinvestment programme. The method of collection ofcatch data by the Department of Fisheries canbe considered a relict of the old enumeration systemand is too incomplete to be of use for any of the types ofinformation usage as described in Section 2, apartfrom short-term economic planning. No protocols seemto be available on the collection of catch and fishingeffort either at the provincial level or at the Ministry ofFisheries. A survey carried out by the Research Instituteof Marine Products shows that there are majordifferences in data collection procedures on fishingeffort within and between provinces.
4. Spatial, temporal and categorical resolution of
fisheries data
4.1. The Bac Bo Gulf, Red River Delta and the coastal
and estuarine fishery Nam Dinh Province
The Bac Bo Gulf in North Vietnam is a part of theMarine Catchment Basin [20] of the South China Sea.The gulf is a semi-enclosed sea strongly influenced bythe water, nutrient and sediment inflow through the Red
River Delta, and by the monsoon winds. The Bac BoGulf can be roughly sub-divided into four ecologicalzones (Fig. 1):
(1) The open water of the Gulf is a shallow sea formedby a wide continental shelf (down to 200m depth).
The inshore area comprises(2) The rocky coast (o30m depth) northeast from the
town of Hai Phong with numerous islands fringedwith coral reefs.
(3) The estuarine and coastal area of the Red RiverDelta extends from Hai Phong to the town of SamSon in Thanh Hoa Province and includes 7 rivermouths, including the Ba Lat river mouth. This is abrackish and salt-water area comprising the tidalflats and mangroves interspersed with beaches to anoffshore depth with mud bottoms at around 30m.This zone extends to the south of Sam Son up toVinh (Nghe An Province), where a number ofsmaller rivers discharge into the sea.
(4) A coastal zone with a steep 40m deep trough, withstrong currents and sandy bottom along the coast ofthe provinces of Ha Tinh and Quang Binh (PhamTuoc, pers. comm.)
Administratively, five provinces share the estuarineand coastal area of the Red River Delta. From North toSouth these are Haiphong, Thai Binh, Nam Dinh, NinhBinh and Thanh Hoa Province.In the Red River Delta estuary and coastal area, so
far 223 fish species (71 families) have been identified.The fish fauna encompasses four ecological groups:freshwater, euryhaline–marine, true estuarine and ana-dromous migrants. The estuary has a high diversity ofshrimpF70 species, 20 of which are commerciallyimportant, mostly PeneidaeFand it is known as the‘Cat Ba-Ba Lat’ shrimp ground [18]. Crabs and cocklessupport locally important fisheries in and around tidalflats [21].The coastal fishery of Nam Dinh Province is a
multispecies–multigear fishery. It is operated by aninshore fleet, which frequently changes its gear andtarget species depending on the seasonal availability ofparticular species groups. Dominant are a demersalfishery, conducted by around 270 bottom-trawlers, and3 pelagic fisheries. The pelagic fisheries comprise adrifnet fishery (85 vessels), a light fishery on cephalo-pods (10 vessels) and a really small-scale, but numeri-cally dominant driftnet/trammelnet/beam-trawl fishery(around 950 vessels). Table 3 summarises the character-istics of these four fisheries. Next to these, numeroussmall-scale, sometimes seasonal, operations are carriedout at or near the shoreline: push-nets (shrimp), beachseining (sardines), electrical fishing (shrimp), collecting(shellfish [21], jellyfish), longlines (rays) and handlines(various). Divers collect cockles from the slopes of tidalflats, at 5–15m depths mainly around the commune of
P.A.M. van Zwieten et al. / Marine Policy 26 (2002) 13–34 21

Table 3
Characteristics of catch and effort in spatial, temporal and categorical dimensions of the main coastal fisheries in Nam Dinh, excluding the offshore fleet of 50 pair trawl vessels
Dimension Variable Potential resolution of data collected through fishery dependent monitoring
Category Effort Type Bottom trawler Driftnetter Gillnetter Light fishery Mung Mung Mung
Nets 4 types of otterboardand pair trawl nets
Gillnets (drifting) Gillnets (stationary) Stick held fallingnet
Gillnets(drifting)
Trammelnets Beamtrawl
Size Depending on type 2,5–3 km� 30m 5km� 4m ? 0.5–1 km� 9m 1–3km� 2mMesh 0.8 cm codend 16 cm 8–10 cm ? 3 cm 13 cm 0.8 cm codendSize vessel (m) 16 16 16 16 7 mEngine (hp) 33–120 33–120 33–120 45–120 12–20Fleet(nr vessels)
B270 B80 B8 B10 B950
Catch Economic target Shrimp Mackerel Pike conger Cuttlefish, Squid Sardines,anchovies
Crabs Shrimp
dominant Trash fish Tuna, catfish ? Trash fishothers High-valued (by
species or group)Sharks, marlin Tuna, catfish,
sharks, mackerel? High valued
(by speciesor group)
Ecological target Sedentary, detritus, Migratory, predator Non-migratory,predator
Predator Migratory?,plankton
migratory?,detritus
Sedentary,detritus
Territorial, demersal Schooling, pelagic Non-schooling,demersal
Schooling,pelagic
Schooling,pelagic
?, demersal
Taxonomic target B8 B3 1 2 B10 8–10 B8(no. of species) dominant 20–30 B3 3 ?
others 20–30 27 B10 ? 100Average dailycatch (kg)
215 75 B75 ? 25
Space Effort Ecological Demersal, estuary,tidal flat, coastal
Pelagic, coastal Demersal, coastal Pelagic,estuarine, coastal
Pelagic, coastal, estuarine
Fishing ground main Around Ba Lat Bac Bo coast: QuangNinh–Thanh Hoa
Bac Bo coast: QuangNinh–Thanh Hoa
10–20 km fromlanding site
5–10 km from landing site
depth 3–25m 12–36m 12–36m 5–10m 5–10mseasonal North of RRD
estuarySeasonal shifts Seasonal shifts
Administrative harbour 3 1 1 1 33 landing places over 40 km of beachcommunes 4 4 4 4 7district Giao Thuy, Nghia Hung Hai Hau Hai Hau Hai Hau Giao Thuy, Hai Hau
Time Effort Hour B4� 4 h hauls 2 settings/night 2 settings/night 2 settings/night VariableDay 0.5 day trips (day or
night)1–10 day trips 1–10 day trips 1–5 day trips 1–2 trips/day
Week 5–7 days a week 5–7 days/weekSeason Less in storm season Less in storm season Not in storm season Not in storm
seasonRarely in storm season
P.A
.M.
van
Zw
ietenet
al.
/M
arin
eP
olicy
26
(2
00
2)
13
–3
422

Hai Ly (Hai Hau District). The offshore fishery in theBac Bo Gulf, North Vietnam, started to develop around1990. The Nam Dinh offshore fleet presently consists of50 pair trawlers.From 1950 onwards, significant changes have taken
place in the coastal fishery of Nam Dinh Province, butthese changes have been poorly documented. Kleinen,Chinh and van Zwieten (in preparation) describe thechanges leading to the present fishery based on inter-views with local fishermen and authorities. In half acentury’s time, the fishery with active gears changedfrom purse seining and trawling, practised by a fleet ofsailing boats, via hand-operated beach seining towardsone operated by a fleet of small-motorised trawlers.Fishing effort thus increased both in numbers and inspatial coverage. The present driftnet fishery for pelagicsis the remnant of a once much larger fishery with passivegears. However, numbers of units operating in thisfishery declined both due to competition for space withsmall trawlers, and due to a decline in larger specimensof their target species tuna, mackerel, shark andpomfrets making the fishery less profitable.
4.2. The fisheries data collection system in Nam Dinh
Province
Catch and effort data collected by whichever institu-tion in Vietnam are already recorded with a lowcategorical and spatial resolution. The Statistical De-partment records these data in highly aggregatedcategories (Catch=‘fish’, ‘shrimp’, ‘cuttlefish’, etc.,effort=‘total vessels’ classified in two or three horse-power categories or ‘total horsepower’), time (annual)and space (total fishery of a commune including itsoffshore fishery). The data are based on reports offishermen registered in one of the 15 coastal communesin the three coastal districtsFGiao Thuy, Hai Hau andNghia HungFof Nam Dinh Province. All individualfishermen are registered in their commune, but theygenerally operate from harbours that are more distinct.So, neither the records with the number and identityof fishing units (fishing effort) nor those with the catchare, therefore, related to harbour, landing place orfishing ground. An example of such a spatial incon-sistency is that catches landed around the towns of DoSon or Haiphong are reported at a distance of 150 kmsouthwards and are recorded there as catch in thecommunes in Nam Dinh Province. Temporal resolutionof the fisheries data as reported in the commune is lowas well, being collected as (bi)annual totals. This meansthat no estimates of within-year variance of catch (C)and Catch per Unit of Effort (C/f ) can be made. In theannual reports of the Statistical Department, thecategorical and spatial resolution of both variables Cand f is even lower, while they are not linked in anyother way.
Data on total fishing effort collected by the FisheriesResource Protection Department of the Department ofFisheries have a high categorical resolution, both interms of vessel type and as gear type. Unfortunately,these two types of data are not connected, which meansthat no distinction by the type of fishery can be made.Moreover, the data are not necessarily associated to theplace of operation but to the place of residence of theowner, which means that no link to fishing grounds canbe made. Lastly, the data are not linked to catch data.The information on catch and fishing effort thuscollected is solely intended and indeed can solely beused for tax purposes, and not for the evaluation ofresource usage and management.Biases are introduced when both under-reporting and
over-reporting take place at different stages of the dataprocessing, simply because taxation is based on catchvolumes, while planning targets need to be reached aswell. Another source of bias in total catch reports is thefocus on the larger inshore trawl and driftnet fisheriesand the emerging offshore fishery. Catch and effort ofthe small driftnet/trammelnet fishery exerted withnumerous small bamboo vessels (‘‘mung’’) is not ornot consistently recorded, though they may contributeup to a quarter of the total catch of the inshore fishery inNam Dinh Province (van Zwieten, unpublished data).Fisheries operated at even smaller scales, such as, forexample, the cockle fisheries [21], push-net fisheries, theseasonal fisheries such as the beach seine fisheries andthe fishery on jellyfish or the riverine fisheries arecompletely out of sight.Further, the reliability of the data is affected by
political developments in Vietnam. Regulation of fish-eries production changed between 1981 and 1990 from acentrally planned and subsidised system, with a state-owned sector that had exclusive right to the exploitationof marine resources to a market-oriented system, wheremore competition was allowed. State-owned fishing co-operatives were replaced by private enterprises. One ofthe consequences was that fisheries data traditionallycollected through enumeration in the fishing co-opera-tives of the communes became unreliable as legitimacyof the co-operative system gave way. However, datacollection systems are still based on enumeration andoriented towards the format of production planning.Therefore, the data collection systems are not suited tothe present situation, with its shift in emphasis fromplanning of production to management. Little incentivesexist for fishers to contribute to accurate data collection,as these are solely intended for tax purposes and, in caseof the offshore fishery programme, repayment of loans.The perception of manyFadministrators, scientists andfishermen alikeFis that a unidirectional deterioration indata quality and reliability in all ways has taken place.The availability and accessibility of the fisheries data
is poor. This is a trait common to all countries that have
P.A.M. van Zwieten et al. / Marine Policy 26 (2002) 13–34 23

Fig. 4. Total output of the marine fisheries of Vietnam by major categories (FAO, Fishstat) and aggregations of catch information of two communes
in Nam Dinh Province, through its three coastal districts to provincial and national level. Data from Nam Dinh Province and districts are from the
Department of Fisheries in Nam Dinh. Data from Giao Long and Hai Ly are from the Peoples Committees of these communes.
P.A.M. van Zwieten et al. / Marine Policy 26 (2002) 13–3424

many highly dispersed small- and medium-scale fisheriesoperated by numerous small fishing units. Data with lowtemporal, spatial or categorical resolution are recordedon hand-written or typed tables and stored in fileswithout a systematic layout. Data in various stages ofaggregation and recorded in various formats, accom-panied by comments and reports are all filed together.Databases are often ‘personalised’. That is, data areavailable in formats other than the immediate require-ments of the present administration and as dependingon the interests of particular officers. The accessibility ofthe data is poor in general. In the past, data fromstatistical departments were often given the status‘secret’ (m
’at) and so even older data are still difficult
to access and to process into time series necessary forlong-term evaluation. Recently, the statistical depart-ments at district and provincial levels have started topublish yearbooks. However, these yearbooks that haveno status as public document are printed in limitednumbers and are, therefore, difficult to access as well.
The Peoples Committees at a communal level,from where the catch data and sometimes fishingeffort at higher administrative levels originate ascollected by a specially appointed statistical officer,rarely maintain databases in any form after 1979. Still,the scarce catch and effort data available often havemore categorical detail than at higher levels in theadministration, where such data resolution quickly getslost (Fig. 4).In Vietnam, catch and effort statistics are still
collected mainly for planning purposes. So data evalua-tion is practised in the context of production planningonly, and is only documented in annual and quarterlyreports, which contain a check on whether productiontargets (C) set by the Peoples Committees at differentadministrative levels were reached. This evaluationcannot be related to fisheries management objectives atall, either through a linkage with fishing effort orthrough a spatial delineation of production by fishingground. During our surveys at the various institutions in
Fig. 5. Example of the use of fisheries statistics in a presentation of the District Statistical Office in Ngo Dong (Giao Thuy District) dated 1965,
probably used for propaganda purposes. From top to bottom are shown developments in salt production, in marine fish production and in
aquaculture from 1958 to 1965 in tons. San Xuat Muoi+Ca=relation of salt (muoi) and fish (ca) production. Bien Dong=the ‘‘East Sea’’ i.e. the
Vietnamese name for the South China Sea.
P.A.M. van Zwieten et al. / Marine Policy 26 (2002) 13–34 25

1999–2001, we encountered no evaluations in the formof tables or verbal descriptions of the developments incatch or effortFand certainly not catch ratesFoverlarger time windows than the planning frame. Graphswere not encountered at all except for one at a districtstatistical office (Fig. 5).
5. Improved usage of fisheries statistics in Vietnam
In Vietnam, many constraints clearly exist forevaluating the developments in fisheries with theinformation produced at the various administrativelevels (Fig. 3). As no formal evaluation of the informa-tion on trends contained in the time series seems tobe made at any level in the administration, thepotential usage of fisheries information in the threedomainsFfish as a commodity, fish as a renewableresource and fish as an indicator of ecosystem qual-ityFis untapped. Despite that data have generally lowresolution and are aggregated in ecologically less mean-ingful administrative spaces only; we will demonstratebelow that there is considerable scope for improvedusage of the information with the data available. Theexamples are representative of the evaluations that couldbe made now at the various levels in the Vietnamesestatistical and fisheries administration.
5.1. Production planning: ‘‘Feed the people’’
The first stage evaluation of the information in timeseries from a production planning perspective starts withan evaluation of trends in production: does productionincrease, and at what rate? The following example showshow the production figures could be used in astandardised, evaluative manner. We chose 1980 as a
starting point for the evaluation of fishery production asthis was the starting year of the economic reforms. At anational level, fish production increased with 6.0% peryear, with not much interannual variability in thedetrended series (Coefficient of Variation (CV)=0.05)(Fig. 6). Rice production, by comparison, much lesssubject to fluctuations as perceived in fish productionprior to 1980, but in volume three times as high as fish,increased by 4.9% per year over the same period(CV=0.04). Fish production in Nam Dinh Province,less than 1% of the national production, increased since1980 with 6.5% per year, but with considerableinterannual variability (CV=0.23). Its districts hadrates of increase since 1980 of 4.8% (Giao Thuy,CV=0.22), 6.9% (Hai Hau, CV=0.38) and 7.3% peryear (Nghia Hung, CV=0.14), while, for example, thecommune Hai Ly had an increased production of 9.2%(CV=0.46) since 1985. The rise in total catches in NamDinh Province between 1975 and 1979 is almost entirelydue to the reported increase in the catch from Hai HauDistrict. This rise is contrary to the nationally observeddrop in catches around the same period. This drop isoften explained as a result of the collapse of the centrallyplanned economy. By then, both marine catches andnumbers of boats decreased sharply. This means that inHai Hau District other processes may have taken placeat that moment.
5.2. Fisheries management: ‘‘Set levels of resource
utilisation’’
A first step in the usage of information from afisheries management perspective is the combinedevaluation of developments and trends in catch (C),fishing effort (f ) and catch rates (C/f ). In our example,we used the fisheries information available at thefisheries office and the statistical department in NamDinh Province (Fig. 2). First to consider is whether theinformation is related to a more or less well-definedecological space. The coast of Nam Dinh Province ismore or less homogeneous in ecological terms, beinglocated at the centre of and thus being an integral partof the estuarine and coastal area of the Red River Delta.As such the provincial administrative boundaries arenested in a broadly defined ecological space at a largerspatial scale. Most of the fishing effort of the provincialfishery is allocated within this area. Next to consider iswhether the fishery in the area confines itself to thefishable biomass of the estuarine coast over the wholeperiod under assessment, thus assuming that no expan-sion in resource area can account for increasedproduction. The data available to evaluate thesemanagement relevant issues are total catch, irrespectiveof species composition, and two indices of fishing effort:number of vessels and engine power (Fig. 7). Enginepower (hp) is a better measure of fishing effort, as it
Fig. 6. Development of the total fish production of Vietnam compared
to the total rice production and the fish production of Nam Dinh
Province. Percentage increases are based on the regression of the
production figures from 1980 onwards.
P.A.M. van Zwieten et al. / Marine Policy 26 (2002) 13–3426

allows evaluations to be made on the changes in the sizeof fishing operations as well.Catch and effort increased rapidly during the 1970s
(Fig. 7A) with the motorisation of the existing fleet(Fig. 7B). The number of boats was stable, but theengine power per vessel increased and so did the totalengine power. From 1978 onwards, catches droppedrapidly, which was followed by a drop of 54% in totalengine power of the fleet between 1984 and 1991 as aresult of mismanagement of the fishery co-operativesresulting in a complete halt of many larger fishingoperations. The horsepower per vessel dropped by 78%over the same period. From 1990 onwards, both catchand fishing effort (both indices) rapidly increased.Overall, development of catch rates using both indicesof fishing effort exhibited the expected decrease over timefor a local resource under increasing fishing pressure.However, catch rates using both fishing effort indiceshad shown opposite trends before 1978: catch perhorsepower decreased while catch per vessel increased.This increase in catch per vessel can only be explainedfrom the motorisation of the fleet, which resulted in an
increased capacity to explore new fishing grounds and/orin more effective fishing hours at sea. The increase in theannual catch after 1990 coincides with a rapid expansionof the fleet in terms of number of vessels, engine powerper vessel and thus of total engine power. This increase ispartly due to the development of an offshore fishery.However, in this case, this expansion to new fishing areasdoes not seem to have led to increased catch rates, aphenomenon that will be explained further.A further step in the evaluation of developments
perceived is by introducing causation between totalcatch and fishing effort according to standard fisherymodels. First, total catch increased by about 2.3% withevery engine of 50 hp installed (Fig. 8A). However, thedevelopment in catch rate set against the total horse-power in the fishery over time reveals that this effect ofmotorisation may be overly optimistic to be taken forgranted. Catch rates (C/f) exhibited a rapid decreaseuntil total engine power was around 10,000 hp, a pointthat is reached around 1982–1983 (Fig. 8B). Totalhorsepower subsequently decreased. With that, catchrates increased again until 1990, but at a lower levelcompared to 15 years earlier with the same amount offishing effort (total horsepower). It is tempting to viewthis trajectory of lowered catch rates after a reduction ineffort as the effect of the slow recovery of a loweredstock biomass after a period of non-equilibrium fishingwith constantly increasing effort [22]. But it could aswell be a spurious effect due to an improper index forfishing effort, if the fleet was not fully motorised after1975. After 1990, a subsequent almost 6-fold increase inengine power did not lead to an expected decrease incatch rates. The data thus indicate indirectly that theNam Dinh fishery ventured into and explored newfishing grounds with the introduction of its offshorefleet: a clear example of how information on the spatialallocation of fishing effort, not recorded routinely, canstill be inferred from the data available.There are three possible explanations for the low but
stable catch rates after 1990:
1. The newly explored areas are not very productivecompared to the inshore area;
2. The offshore fleet is not very efficient; and3. The catch rate of the inshore fleet decreased rapidlyunder increased fishing effort not compensated for bythe catch rates of the offshore fleet.
It will be clear that, on the basis of the existing fisheryinformation in Nam Dinh Province as presented here, itis not possible to decide on any of these explanations(though it is sometimes asserted that the demersal fishresources in the Bac Bo Gulf are poor [23]). Mostimportant in a fishery management context is that it willn !ot be possible to decide on the effectiveness of thenationwide offshore investment programme (informa-tion most wanted by both local and higher authorities!)
Fig. 7. Developments in catch (C), fishing effort (f) indexed as number
of boats (A) and of total horsepower of the fishing fleet. Motorisation
of the fleet is inicated by the ratio horsepower per boat (B). Catch
rates (C/f) are expressed both as catch per horsepower and catch per
boat (C).
P.A.M. van Zwieten et al. / Marine Policy 26 (2002) 13–34 27
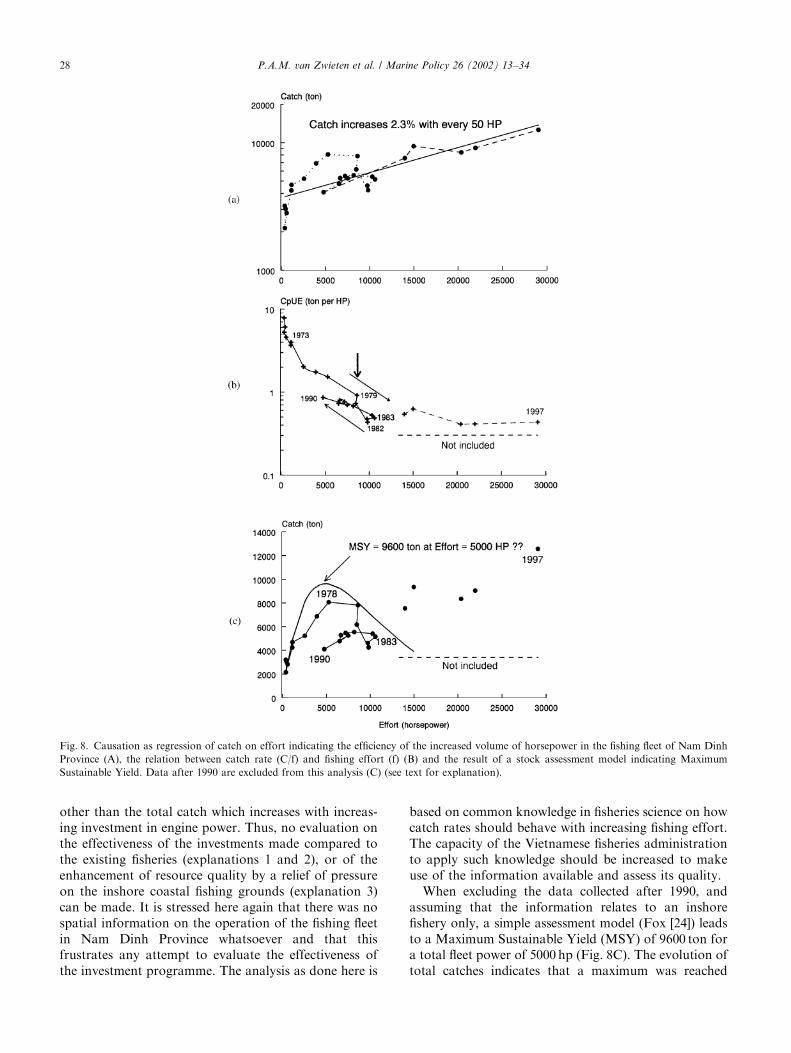
other than the total catch which increases with increas-ing investment in engine power. Thus, no evaluation onthe effectiveness of the investments made compared tothe existing fisheries (explanations 1 and 2), or of theenhancement of resource quality by a relief of pressureon the inshore coastal fishing grounds (explanation 3)can be made. It is stressed here again that there was nospatial information on the operation of the fishing fleetin Nam Dinh Province whatsoever and that thisfrustrates any attempt to evaluate the effectiveness ofthe investment programme. The analysis as done here is
based on common knowledge in fisheries science on howcatch rates should behave with increasing fishing effort.The capacity of the Vietnamese fisheries administrationto apply such knowledge should be increased to makeuse of the information available and assess its quality.When excluding the data collected after 1990, and
assuming that the information relates to an inshorefishery only, a simple assessment model (Fox [24]) leadsto a Maximum Sustainable Yield (MSY) of 9600 ton fora total fleet power of 5000 hp (Fig. 8C). The evolution oftotal catches indicates that a maximum was reached
Fig. 8. Causation as regression of catch on effort indicating the efficiency of the increased volume of horsepower in the fishing fleet of Nam Dinh
Province (A), the relation between catch rate (C/f) and fishing effort (f) (B) and the result of a stock assessment model indicating Maximum
Sustainable Yield. Data after 1990 are excluded from this analysis (C) (see text for explanation).
P.A.M. van Zwieten et al. / Marine Policy 26 (2002) 13–3428

already around 1978, slightly lower (16%) than theestimated MSY. Based on this evaluation, the conclusioncan be drawn that the inshore fishery is overexploiting itsresource base. One should admit that all assumptions ofeven the simplest assessment model are violated here.Effort is not properly indexed, catch does not relate to anidentified fishable stock of a certain species or ecologicalgroup even, and both catch and effort relate to anunidentified ecological space. However, the assessmentstill leads to conclusions about the extent and ways inwhich the existing information can be used in assessinglevels of resource utilisation, and is thus effective infocussing attention on the articulation of informationneeds. Based on the existing information, the state of theinshore fishery of the province of Nam Dinh can bequantified to some extent and this is a starting point forfurther evaluation and strategic use of fisheries data.
5.3. Nature conservation ‘‘Retain integrity of nature’’
The low categorical and spatial resolution of catchand effort data as available in Nam Dinh Provinceprecludes assessments of fishery or environmentalimpacts on the coastal and estuarine ecosystem of theRed River Delta. The low categorical resolution of thecatch (C) does not allow for evaluations of trends ineconomically important species, let alone specific coastaland estuarine indicators for environmental quality thathave little economic importance by themselves. Trendsand events in catch rates (C/f) are already for thatreason impossible to (re)construct, but with the lowcategorical resolution of fishing effort (f), such trendswould be highly biased anyway. Furthermore, no spatialallocation of effort is known, other than that mostfishing effort occurs in the ‘coastal and estuarine zonebelow 30m depth’. An analysis of effects would thusonly be possible on this extended spatial scale, if it isassumed, as we did in the previous assessment, that theoutput of the fishery of Nam Dinh Province isrepresentative for the output of the fishery in theestuarine area as a whole. In the absence of suchinformation, trends in the overall catch rates could beevaluated on possible impacts after the fact. Forinstance, the impact of a large-scale event such as thebuilding of the dam in the Hoa Binh River, a majortributary of the Red River, between 1979 and 1982,could be reviewed by examining trends before and afterthis event. The sudden decline in total catch (Fig. 6a)and accelerated decline in catch rates from 1979onwards (Fig. 6C and 7B) would be an interestingfeature to consider. However, the increase in totalcatches from the province before 1979 is whollyattributable to one district only, while total catchesfrom the other two districts do not perform suchdeclines. In the absence of further evidence corroborat-ing such an overall decline, as could be obtained from
information on catch and catch rate from the neigh-bouring province Thai Binh or from time series thatcould provide evidence towards causation such aschanges in discharge and associated sediment loads[20], dam construction is but one of the many alternativeexplanations. One such explanation could even be thechange in political system that took place around thesame time and its effect on data collections. Thus, theimpact of this large intervention in the river system onthe discharge and sediment transport of the Red Rivercannot be revealed in long-term data series of suchimmediate parameters as total catch or catch rates [25].However, it should be clear that without the first stageevaluations with the aid of clear graphical displays ofinformation as presented here, likely explanationscannot even be identified, let alone be evaluated. Onceagain we stress that an evaluation as the above can andshould be made by the Vietnamese administration toimprove their evaluative capacity no matter whatresolution the present or future data have.Despite these gloomy conclusions on the potential use
of catch and effort statistics on behalf of natureconservation in Vietnam, it may be possible toreconstruct biological changes in fish stocks with morecategorical detail. Much knowledge is present on thetaxonomy and ecology of coastal species, and aclassification of ecosystems with indicator speciesperhaps would be feasible based on such knowledge.Furthermore, during interviews with Nam Dinh trawlerand gillnet fishermen, in particular, those with longertraditions in fishingFwhich is not necessarily the casewith all fishermen along this coast (Kleinen, pers.comm.)Fthe decline in catches in sharks and rays,and other large species were mentioned. Reconstructionof time series through such sources of information maylead to some form of trend analysis or even stockassessment [26,27]. However, it remains to be seenwhether such a reconstruction eventually could becausally linked to trends and events in the environment,given the natural variation in stocks, of which little isquantitatively known, while large changes in the typeand size of fishing effort are also hardly quantified. If so,it is doubtful whether it will be possible to determineenvironmental impacts via such a highly derivedapproach and through ‘expert’ and ‘local’ knowledge.
6. Evolution towards a new catch and fishing effort
monitoring system?
Presently, bias, low resolution and administrativecomplexity are being addressed in part through theinstalment of a completely new CEDRS, which is stillhardly rooted in the current data collection system. Thisnew system simplifies the data collection, and theoreti-cally, much of the basic information needs can be
P.A.M. van Zwieten et al. / Marine Policy 26 (2002) 13–34 29

satisfied. The new CEDRS is a part of a managementinformation system, whose development is realised a/owith technical and financial support through develop-ment aid in the fisheries sector [28]. Since 1996, the newCEDRS has become operational under the ResearchInstitute of Marine Products of the Ministry of Fisheriesin 11 out of the 28 provinces, while the remainingprovinces, among which Nam Dinh, have been includedfrom 2000 onwards. On the basis of the first four yearsof data, the total catch of Vietnam has now beenadjusted upwards from 1.3 to 4 million ton, whichmakes Vietnam the 7th largest marine fish producer inthe world (Fig. 9).The new system follows a completely different
procedure compared to the present total enumerationsystem. It is based on stratified random sampling inwhich catch rates (C/f=catch by commercial categoryper day by vessel-gear type) of fishing vessels aresampled at landing sites. The data collected includegear characteristics, discards and trip information suchas fishing grounds and duration of fishing operations.The system is organised through the provincial Depart-ments of Fisheries. Each province has one enumerator,who samples the main fish-landing places and mainfisheries. This is an enormous simplification comparedto the present system, where for instance in Nam DinhProvince alone already more than 20 people areinvolved in basic data collection.
An implementation problem of the new system is toobtain reliable data on total fishing effort (f, and fishingdays) by fishery, which hampers the estimation of totalcatch (C=C/f� f� days fishing). This means that, whilethe categorical, spatial and temporal resolution of catchrates (C/f) has improved tremendously for most of theimportant fisheries, leading to a virtual explosion ofinformation (Fig. 9), it will still be problematic to obtainproper estimates of both effort and catch. This is notjust a technical or organisational problem. The statis-tically sophisticated set up of the new CEDRS addsconsiderably to the complexity of the informationgenerated, in particular when compared to the existing-Fin statistical terms low profileFenumeration-basedsystem, which has functioned for over 50 years. Thisrequires that not only the fisheries administration has todeal with the tremendously increased diversity andcomplexity of the information, but also with thecognitive skills to be developed, at all administrativelevels, to understand and maintain the monitoringsystem. In other words, a technically advanced systemhas improved the quality and resolution of the datatremendously, but is at present only understood by a fewpeople within the research unit of Ministry and not at allunequivocally supported within the fisheries adminis-tration. The capacity of the fisheries administration tomaintain and assimilate the complex information stillhas to follow suit. The solutions to the observed
Fig. 9. Categorical resolution of total marine catch in 1999 of 116 countries as reported to the Food and Agriculture Organisation of the UN, and
made accessible through FAOSTAT [16] The countries are further grouped by Human Development Index, an aggregate of indicators on Gross
Domestic Product per capita, Adult Literacy Rate, Combined gross enrolment ratio and Life expectancy at birth as reported in the human
development report of the UNPD [30]. Vietnam is rated at medium human development (HDI=0.671 rank 108 out of 174). Present=the present
categorical detail of species in the 1.3 million ton marine catch reported to the FAO. Potential=the potential categorical detail of marine species. In
the newly developed Catch and Effort Data Recording System, 290 different categories of marine species and species groups are distinguished.
P.A.M. van Zwieten et al. / Marine Policy 26 (2002) 13–3430

deficiencies in the traditional monitoring system assignalled here can never be a matter of replacement by acompletely new one. The solution must be found in amore gradual development, for which enlarged evalua-tive capacity of the fisheries administration is indis-pensable.
7. Conclusions: improvement of the evaluative capacity
of the fisheries administration
Formalising evaluation procedures at any adminis-trative level within a fishery information system willenhance the knowledge base for informed decisionmaking. Diagnostic powers developed through regularannual evaluation of fisheries data and information canaid in the development of quantified variables orindicators to address standards or goals to be set inthe context of economic planning, fisheries managementand nature conservation. Progressive understanding oftrends in basic fisheries monitoring indicators will aid insetting standards related to these generalised objectives.Considering the importance of the Vietnamese fishery inthe national economy and welfareFthe sector providesabout half of the annual supply of animal protein in thenational human diet, around 10% of the populationderives their main income from fisheries, while with over10% of total export earnings it is the second mostimportant export-oriented sector after crude oil andahead of rice [12]Fit is of vital importance that suchdiagnostic powers are being developed for a rationalexploitation of the fishery resource base. Our presenta-tion makes clear that the extremely low categorical,spatial and temporal resolution and the large biases inbasic fisheries dataFcatch (C), effort (f) and catch rate(C/f)Fproduced by the present Vietnamese informationsystem will not be conducive to the development of thenecessary evaluative power within the present fisheryadministration. That the Vietnamese fisheries informa-tion base is extremely poor can be highlighted bycomparing one of its elements, the categorical detail ofthe report of annual marine catches to the FAO, withsurrounding countries such as China, Indonesia, Ma-laysia or Thailand (Fig. 9). This figure also indicatesthat the quality of output of the old monitoring systemis much lower than the level of development of Vietnamwould suggest. This may have to do with the politicalhistory of the country. However, it is important herethat a new monitoring system should be embedded inthe fisheries administration given the potentials of thelevel of development in Vietnam.Two further constraintsFnext to the low resolution
and the bias of basic fisheries dataFwill hamperdevelopment of evaluative systems, i.e. the developmentof indicators and the setting of standards such asreference points in the evaluation of fisheries. These are
the administrative complexity of present data collectionsystems and its production planning focus. The first ispartly being addressed to the current establishment of anew management information system. The secondconstraint is more intractable. Vietnam is a signatoryto several international agreements relating to sustain-able development, precautionary approaches and ex-change of fisheries information, which could act asguidelines along which standards of fisheries manage-ment and nature conservation could be developed.However, broadly stated as the objectives mentionedin these agreements are it will take time to operationalisethe ideas contained in them and incorporate them infisheries and ecosystem management. The issue here is agovernance challenge to absorb the developmentsaround sustainability issues in fisheries and ecosystemmanagement. The development of monitoring systemswill aid in this, but only the set-up of protocols andformal procedures for the maintenance and evaluationof this information will generate the knowledge neededto operationalise such goals in quantitative terms.Presently, the Vietnamese fisheries authorities are hardlyaddressing this issue, which renders the newly developedfisheries monitoring system isolated from the adminis-tration and thus extremely fragile.In principle, better usage of information generated
can be reached by establishing mandatory evaluationprocedures at all levels in the organisation, from thefishing commune in the Red River Delta to the Ministryof Fisheries in Hanoi. Improvements on behalf of thefisheries management can be expected from a thoroughanalysis of variances in fishing effort and catch rates inspace and time: though time series of reliable data thatcan be related to fishing grounds and which refer tocommercially important species are still relatively short(since 1996), the analysis will point at proper indicatorsfor the evaluation of the various management goals.However, reliable information on total fishing effortshould be obtained to enable assessments of totalresource usage. For environmental impact assessment,the data requirements and sampling efforts are highest.For that purpose, data should be collected andaggregated for relevant ecological spaces, such as rivercatchments, stretches of coastal area and estuaries.However, it also requires that existing knowledge oncoastal ecosystems available in Vietnam should beincorporated in the fisheries information to enable suchevaluations.Evaluation of trends in time series of existing
monitoring information always leads to useful conclu-sions if only on the utility of the information, as ourexamples from the existing fishery information system ofVietnam demonstrate. It appeared that fish productionin Nam Dinh Province increased rapidly since 1980, butnot as fast as the national fish production. The twosouthern districts of the province did show relatively a
P.A.M. van Zwieten et al. / Marine Policy 26 (2002) 13–34 31

Table 4
Catch (kg, ton or numbers) Effort (unit of) Catch rate (kg, ton or no. per unit of effort)
Explanation ofvariable
Catch expressed in number or weight represents theremoval of fish from an ecosystem. It is thefundamental impact fishing has on fish populations.Interpretation of changes in catch is difficult withoutadditional information on the status of the stock,which is obtained through indices of abundance ordirect estimates of biomass.
Effort in biological assessments is used to estimatefishing mortality (F). F is a fundamental variable instock-assessments, representing the proportion of thestock that is removed by fishing. To relate the effortto fishing mortality for use in biological assessmentsit is necessary to relate it closely to specific gear use.To relate effort to profitability in social andeconomic assessments requires data at the trip level.
Catch rate is the single most useful index for long-term monitoring of a fishery. Used as an index ofabundance of the fished stock, where some propor-tional relation can be assumed between the index andthe size of a stock. Also used as an index of economicefficiency and profitability, combined with informa-tion on costs and earnings.
Categorical Economic Fishing gear and labour Collected by:product (quality) types vessel type: trawler, cutter economicvalue labour: number of crew taxonomic orfor human/animal consumption gear type: trawl, gillnet, longline, purse-seine,
traps, beach seine etc.ecological category
Taxonomic gear construction: mesh size, hook size Per pre-defined unit of effortclassification of groups e.g. fish, shrimp, crabs;
groupers, sardines; family, genus, species and popu-lation/stock
gear size: area, headline, hook spacinggear deployment: bottom, mid-water, surface,fixed, anchored, drifting,subsidiary gear: lights, FAD’s
EcologicalPelagics, demersals etc. (habitat)Predator, herbivore etc. (trophic)Migratory, sedentary etc. (spatial)
The stock=the highest taxonomic resolution thatcan be included in a fishery information systemwhich is meaningful in population dynamic terms
Temporal Aggregations: Annual, bi-annual, quarterly, (moon)monthly, weekly, dailyHigher resolutions (hour, tides): experimental sur-veys
Allocation of effort in time: as under catchDetailed data collections include steaming time, timefishing, speed, start/end of setting of gear, haul,distinctions made to improve estimates of catch rates
Temporal aggregations of catch rates (as under catch)reveal trends, annual or seasonal changes, persistencein stock size etc., and can be related to humanimpacts or environmental changes
Spatial Administrative units: historically defined politicalunits, usually not coinciding with ecologically mean-ingful spatial units. E.g. nation, province, district
Allocation of effort in space Spatial aggregations in biological assessments startwith the stock level
Environmental impacts require information at thestock level
Ecological units: physically bounded units withgeneralised ecological characteristics related in someway to life-histories of species monitored and inwhich fishing effort can be allocated. E.g. Coast–offshore, estuaryFcoral reef, river–floodplain–marsh.
as under catch Fishery assessments require information at the stockor higher meaningful aggregations depending onapproach
Geographical units: ICES quadrants,latitude–longitude
More detailed collections include position of haul orsetting (quadrant; grid id; latitude, longitude; GPSposition; bottom, mid-water, top etc.)
P.A
.M.
van
Zw
ietenet
al.
/M
arin
eP
olicy
26
(2
00
2)
13
–3
432

much more rapid increase in production. Most of thisincrease can be attributed to a fishery expanding tooffshore areas since 1990. Inshore fisheries expandedfast during the period of motorisation in the 1970s.Inshore fishermen are probably exploiting stocks be-yond maximum sustainable yield, with a completespatial coverage of the exploitable inshore stocks.Quantification of impacts of large-scale environmentalchanges, such as effects of the building of the Hoa BinhRiver dam in the Red River catchment, is impossible.These conclusions refer to information from oneprovince, covering a large spatial area that can beconsidered a homogeneous ecological space at the centreof the Red River Delta estuary and as such thegeneralisations are not confounded by informationaggregated for highly divergent ecosystems. We do notimply that all existing data should be treated as shownhere, given the biases and low reliability of theinformation present, but examples such as those shownhere could be instrumental in developing the necessaryprocedures of analysis and evaluative skills.The first stage evaluations in this contribution are
made with the aid of graphical displays of trends andwith textbook assessment tools. Such assessments arefeasible at almost every level within a fishery informa-tion system or fisheries administration. They provide aninsight to the information content of the data despiteknown biases. With that the diagnostic power of theinformation can be assessed both at testing hypotheseson causal connections between interventions and effects(fishery developmentsFcatch rate, dam construc-tionFcatch or catch rate) and in providing buildingblocks for constructing scenarios (offshore/inshore fleet-Fcatch rate). Qualitative and quantitative descriptionof variances and biases can qualify the strength andvalidity of trends perceived. Based on these simpleassessments, information that needs to be addressed bya fishery monitoring system can be more clearlyformulated. With the present availability of relativelycheap desktop computers doing graphics and assess-ments to aid in the evaluation of fisheries data are withinthe reach of every level in a fishery administration.
Acknowledgements
The present study was carried out within the frame-work of the WOTRO/VNU Red River Delta researchproject on the long-term impacts of upstream alterationsof the Red River on its largest estuary, the Ba Lat. Thisis a co-operative project between the Vietnam NationalUniversity (VNU, Hanoi), other Vietnamese partnersincluding the Research Institute of Marine Products(Haiphong) and Wageningen University with 6 otherDutch research groups. The Netherlands Foundation ofthe Advancement of Tropical Research (WOTRO) is
thanked for their financial support and the VietnamNational University for their logistical support. AlbertSoer gave insightful comments on earlier drafts. Wethank Prof. Dr. Vu Trung Tang, Prof. Dr. Bui DinhChung, Prof. Dr. Mai Trong Nhuan and Dr. NguyenXuan Huan for their assistance in making the fieldworkpossible. Tran Thi Hong and Ngo Viet Dung wereindispensable as translators during the field visits inGiao Thuy and Hai Hau.
Appendix A
Basic variables in fisheries assessments and resolutionthat can be attained in CEDRS is shown in Table 4 [3].
References
[1] Vos P, Meelis E, ter Keurs WJ. A framework for the design of
ecological monitoring programs as a tool for environmental and
nature management. Environmental Monitoring and Assessment
2000;61:317–44.
[2] Wolfe DA, Champ MA, Flemer DA, Mearns AJ. Long-term
biological data sets: their role in research, monitoring, and
management of estuarine and coastal communities. Estuaries
1987;10(3):181–93.
[3] FAO. Guidelines for the routine collection of capture fishery data.
Prepared at the FAO/DANIDA Expert Consultation, Bangkok,
Thailand, 18–30 May 1998. Rome: FAO, Report No. 382, 1999.
113pp.
[4] Patton MQ. Utilization-focused evaluation: the new century text.
Thousand Oaks, London, New Delhi: SAGE Publications, 1997.
431pp.
[5] Charles A T. Fishery conflicts: a unified framework. Marine
Policy 1992;16:379–93.
[6] Musters CJM, de Graaf HJ, ter Keurs WJ. Defining socio-
environmental systems for sustainable development. Ecological
Economics 1998;26:243–58.
[7] Caddy JF, Mahon R. Reference points for fisheries management.
Rome: Food and Agriculture Organisation of the United Nations,
Report No. 347, 1995. 83pp.
[8] Murawski SA. Definitions of overfishing from an ecosystem
perspective. ICES Journal of Marine Science 2000;57:649–58.
[9] Gisaslon H, Sinclair M, Sainsbury K, O’Boyle R. Symposium
overview: incorporating ecosystem objectives within
fisheries management. ICES Journal of Marine Science
2000;57:468–75.
[10] Anon. Potential of marine fishing development. http://www.
fistenet.gov.vn/tienganh/thuysanVN/tiemnang/khaithac.htm.
Produced by: Fisheries Information Centre under the Ministry of
Fisheries of Vietnam. Date of access: 12/07/2001; 2001
[11] Anon. Vietnamese fisheries to net more than 1.9 MLN tonnes
of products. http://vietsandiego.com/vietnews/archives/jul00/
vbl1502B.html. Produced by: VNA. Date of access: 27/10/2000;
2000.
[12] Anon. Fishery country profile: the Socialist Republic of Vietnam.
http://www.fao.org/fi/fcp/vietnamese.asp. Produced by: FAO
Fisheries Department. Date of access: 12/07/2001; 1999.
[13] Anon. Summary of results from the enumerator sampling
programme 1996–2000. Hai Phong: Research Institute of Marine
Products-Assessment of the Living Marine Resources in Vietnam;
2001.
P.A.M. van Zwieten et al. / Marine Policy 26 (2002) 13–34 33

[14] Thuoc P, Long N. Overview of the coastal fishery of Vietnam. In:
Silvestre GT, Pauly D, editors. ICLARM Conference Proceed-
ings, 1997. p. 96–106.
[15] Menasveta D. Fisheries Management Frameworks of the Coun-
tries Bordering the South China Sea. Bangkok: FAO Regional
Office for Asia and the Pacific, Report No. 33, 1997. 151pp.
[16] Shatz Y. Fishstat Plus [Database]:2.30. Rome: FAO Fisheries
Department, Fishery Information, Data and Statistics Unit, 2000.
[17] Nguyen Khac Huong. Fish Fauna of Vietnam. In: Nguyen Tac
An, editor. Collection of Marine Research Works, vol. VI.
Nhatrang, Khanh Hoa, Vietnam: Science and Technique Publish-
ing House, 1995. p. 121–6.
[18] Vu Trung Tang. The Eastern Sea: Resources and Environment.
Hanoi, Vietnam: The Gioi Publishers, 2001. 199pp.
[19] Bui Dinh Chung. Socio-economic issues in the management of
coastal fisheries in Vietnam. Bangkok, Thailand: RAPA publica-
tion, 1993. p. 176–82.
[20] Caddy JF, Bakun A. A tentative classification of coastal marine
ecosystems based on dominant processes of nutrient supply.
Ocean and Coastal Management 1994;23:201–11.
[21] Nielsen SS, Pedersen A, Le Trong Trai, Le Dinh Thuy. Local use
of selected wetland resources. Cua Day Estuary, Red River Delta,
Vietnam. Silvius MJ, Howes J, editors. Kuala Lumpur, Malaysia:
ZMUC and Wetlands International-Asia Pacific, 1998. 63pp.
[22] Hilborn R, Walters CJ. Quantitative fisheries stock assessment:
choice, dynamics and uncertainty. New York: Chapman & Hall,
1992. 570p.
[23] Le Trong Phan. Some studies results on the marine fish resource
conducted by the Institute of Oceanography during 1923–1994.
In: Nguyen Tac An, editor. Collection of Marine Research
Works. vol. VI. Nhatrang, Khanh Hoa, Vietnam: Science and
Technique Publishing House, 1995. pp. 127–33.
[24] King M. Fisheries Biology, Assessment and Management.
Oxford: Blackwell Sciences Ltd., 1995. 341p.
[25] van Houwelingen ST. Temporal, spatial variability of the river
regime of the Red River, Vietnam. Utrecht: Institute for Marine
and Atmospheric Research; 2000 June 2000. Report nr R-00-5.
21p.
[26] Neis B, Schneider DC, Felt L, Haedrich RL, Fischer J, Hutchings
JA. Fisheries assessment: what can be learned from interviewing
resource users? Canadian Journal of Fisheries and Aquatic
Sciences 1999;56:1949–63.
[27] Johannes RE. The case for data-less marine resource manage-
ment: examples from tropical nearshore fisheries. Trends in
Ecology and Evolution 1998;13(6):243–6.
[28] Anon. Sector Programme Support Document. Fisheries Sector.
Vietnam. Hanoi: Ministry of Foreign Affairs; DANIDA; Report
No. Ref. No. 104, Vietnam/fisheries, 1999 April, 1999. 85+
Annexes p.
[29] FAO. The state of world fisheries, aquaculture. http://
www.fao.org/docrep/w9900e/w9900e00.htm. Produced by: FAO
Information Division. Date of access: 13 December 1999.
[30] UNDP. Human Development Report 2000. United Nations
Development Program, New York, 2000. 290pp.
P.A.M. van Zwieten et al. / Marine Policy 26 (2002) 13–3434