improved estimates of the national income and product … september/0913...improved estimates of the...
TRANSCRIPT

14 September 2013
Improved Estimates of the National Income and Product Accounts Results of the 2013 Comprehensive Revision By Stephanie H McCulla Alyssa E Holdren and Shelly Smith
N JULY 31 2013 the Bureau of Economic Analy-O sis (BEA) released the initial results of the 14th
comprehensive revision of the national income and product accounts (NIPAs) beginning with revised esshytimates for 1929
Comprehensive revisions provide opportunities for BEA to make changes to its economic accounts in orshyder to increase the overall quality and usefulness of the accounts For instance as part of this comprehensive revision BEA implemented improvements to imporshytant measures such as the value of pension compensashytion and the services provided by the financial sector and it expanded the economic perspective of the acshycounts by recognizing the contributions of innovation to productivity These improvements better align the NIPAs with the recommendations of new international standards for compiling national and international economic accounts in order to maintain comparability with other nationsrsquo accounts1
These and other improvements are implemented through changes in definitions methodologies and source data To facilitate the analysis of the impact of these changes BEA classifies these changes as definishytional changes (those that involve a change in concepts or accounting treatments) and statistical changes (those that involve improvements in the sources or methods underlying the accounts) Most improveshyments were previewed in a series of articles in the SURshyVE Y OF CURRENT BUSINESS earlier this year2
1 See European Commission International Monetary Fund Organisashytion for Economic Co-operation and Development United Nations and World Bank System of National Accounts 2008 (New York United Nations 2009) and International Monetary Fund Balance of Payments and Internashytional Investment Position Manual 6th ed (Washington DC 2009)
2 See ldquoPreview of the 2013 Comprehensive Revision of the National Income and Product Accounts Changes in Definitions and Presentationsrdquo SURVEY OF CURRENT BUSINESS 93 (March 2013) 13ndash39 and Nicole M Mayershyhauser and Sarah J Pack ldquoPreview of the 2013 Comprehensive Revision of the National Income and Product Accounts Statistical Changesrdquo SURVEY 93 (May 2013) 6ndash14
The major improvements include the following Recognizing expenditures by business government
and nonprofit institutions serving households for research and development (RampD) as fixed investshyment thus improving BEArsquos measures of fixed investment and allowing users to better measure the effects of innovation and intangible assets on the economy
Recognizing expenditures by private enterprises for the creation of entertainment literary and artistic originals as fixed investment further expanding BEArsquos measures of intangible assets
Expanding the set of ownership transfer costs for residential fixed assets that are recognized as fixed investment and improving the accuracy of the assoshyciated asset values and service lives
Recording transactions of defined benefit pension plans on an accrual basis and recognizing the costs of unfunded liabilities These improvements better align pension-related compensation with the correshysponding productive activity
Improving the measures of the financial services provided by commercial banks by modifying the set of assets and liabilities included in the calculations by establishing a new treatment of borrower defaults and by refining the computation of the refshyerence rate3 This improvement establishes a more accurate picture of banking output
Harmonizing the treatment of wages and salaries by presenting accrual-based estimates consistently throughout the accounts
Updating the reference year for chain-type quantity and price indexes and for chained-dollar estimates to 2009 from 2005
3 This change in treatment begins with estimates for 1985 For more information see Kyle K Hood ldquoMeasuring the Services of Commercial Banks in the National Income and Product Accounts Changes in Concepts and Methods in the 2013 Comprehensive Revisionrdquo SURVEY 93 (February 2013) 8ndash19
15 September 2013 SURVEY OF CURRENT BUSINESS
Other changes include the following For 1982 forward the estimates of proprietorsrsquo
income are improved to more accurately account for Internal Revenue Service (IRS) section 179 expenses4
For 1992 forward the method for allocating the disshytribution of investment income of regulated investshyment companies by type of income is improved in order to more accurately reflect differences between the timing of each type of income and its distribushytion to shareholders
For 1993 forward the estimates of mortgage interest paid for nonfarm permanent-site housing are improved by incorporating several new data sources The revised estimates also reflect the incorporation
of newly available and revised source data the most
4 The primary source for the estimates of proprietorsrsquo income is tax return information from the IRS BEA makes a series of adjustments to these data to conform to NIPA coverage and definitions One of these adjustments is for ldquosection 179rdquo expenses which the IRS allows to be expensed because the property purchased is under a certain value but which BEA treats as investment Through additional research BEA has improved the estimates of section 179 expenses and the estimates of proshyprietorsrsquo income are revised accordingly
significant of which is BEArsquos 2007 benchmark input-output (I-O) accounts (see the box ldquoNew and Revised Source Datardquo) These accounts which provide the most thorough and detailed information on the strucshyture of the US economy are used to benchmark the expenditure components of GDP and some of the inshycome components
In most important respects the picture of the econshyomy shown by the revised estimates is similar to the picture shown by the previously published estimates The similarity and some of the differences can be seen in the following
The long-run growth rates of real gross domestic product (GDP) are similar to those in the previshyously published estimates For 1929ndash2012 the avershyage annual growth rate of real GDP is 33 percent 01 percentage point higher than in the previously published estimates For 2002ndash2012 the growth rate is 18 percent 02 percentage point higher than in the previously published estimates and for 2009ndash2012 the growth rate is 24 percent 03 pershycentage point higher than in the previously pubshylished estimates The percent change in real GDP is revised up 01 percentage point for 2010 is
New and Revised Source Data The 2013 comprehensive revision of the national income ITAs that have been introduced since 2009 and product accounts (NIPAs) incorporated a wide array The revised estimates for 2010ndash2012 also reflect the of new and revised source data incorporation of newly available and revised source data
The most important source data that affect the esti- that became available after the last annual NIPA revision mates prior to 2010 are BEArsquos benchmark 2007 input- in July 2012 These data include the following output (I-O) accounts which will be released in Decem- Census Bureau annual surveys of state and local govshyber 20131 The revised estimates also incorporate data on ernments for fiscal year 2010 (revised) and fiscal year inventories on receipts and expenses of business estab- 2011 (preliminary) of manufactures for 2010 (revised) lishments and of governments on sales by detailed com- and 2011 (preliminary) of merchant wholesale trade modity and by product line and on final industry and and retail trade for 2010 (revised) and 2011 (prelimishyproduct shipments from the 2007 Economic Census and nary) of services and construction spending (value the 2007 annual surveys of merchant wholesale and retail put in place) for 2010 and 2011 (revised) and 2012 trade (preliminary)
The revised estimates also reflect data on housing from Federal government budget data for fiscal years 2012 the 2010 decennial Census of Population and Housing and 2013 (revised) and data on the expenditures and receipts of state and ITA data for 2010ndash2012 (revised) 2
local governments for fiscal years 2006ndash2009 from Cen- Bureau of Labor Statistics Quarterly Census of sus Bureau government finances surveys In addition Employment and Wages for 2010ndash2012 (revised) estimates that are based on BEArsquos international transac- Internal Revenue Service tabulations of corporate tax tions accounts (ITAs)mdashprimarily net exports of goods returns for 2010 (revised) and 2011 (preliminary) and and services and rest-of-the-world income receipts and of sole proprietorship and partnership tax returns for paymentsmdashare revised to reflect improvements to the 2011
US Department of Agriculture farm statistics for 2010ndash2012 (revised)
1 In the past the benchmark I-O accounts were released before the comprehensive NIPA revisions but this new timing allows the incorpo- 2 Revisions to the ITAs for years prior to 2010 will be incorporated in ration of changes in NIPA definitions and methodologies into the I-O future revisions of the NIPAs see the box ldquoDiscontinuities in the Estishyaccounts and improves the integration of the two sets of accounts For mates of Foreign Transactions in the National Income and Product more information see ldquoPreview Statistical Changesrdquo Accountsrdquo
16 Improved NIPA Estimates September 2013
unrevised for 2011 and is revised up 06 percentage point for 2012 (table 1)
The most recent recession was less steep than previshyously estimated From the fourth quarter of 2007 to the second quarter of 2009 real GDP decreased 29
Table 1 Real Gross Domestic Product [Percent change from preceding year]
Year Revised Previously published Revision
1930 ndash85 ndash86 01 1931 ndash64 ndash65 01 1932 ndash129 ndash131 02 1933 ndash13 ndash13 00 1934 108 109 ndash01 1935 89 89 00 1936 129 131 ndash02 1937 51 51 00 1938 ndash33 ndash34 01 1939 80 81 ndash01 1940 88 88 00 1941 177 171 06 1942 189 185 04 1943 170 164 06 1944 80 81 ndash01 1945 ndash10 ndash11 01 1946 ndash116 ndash109 ndash07 1947 ndash11 ndash09 ndash02 1948 41 44 ndash03 1949 ndash05 ndash05 00 1950 87 87 00 1951 81 77 04 1952 41 38 03 1953 47 46 01 1954 ndash06 ndash06 00 1955 71 72 ndash01 1956 21 20 01 1957 21 20 01 1958 ndash07 ndash09 02 1959 69 72 ndash03 1960 26 25 01 1961 26 23 03 1962 61 61 00 1963 44 44 00 1964 58 58 00 1965 65 64 01 1966 66 65 01 1967 27 25 02 1968 49 48 01 1969 31 31 00 1970 02 02 00 1971 33 34 ndash01 1972 52 53 ndash01 1973 56 58 ndash02 1974 ndash05 ndash06 01 1975 ndash02 ndash02 00 1976 54 54 00 1977 46 46 00 1978 56 56 00 1979 32 31 01 1980 ndash02 ndash03 01 1981 26 25 01 1982 ndash19 ndash19 00 1983 46 45 01 1984 73 72 01 1985 42 41 01 1986 35 35 00 1987 35 32 03 1988 42 41 01 1989 37 36 01 1990 19 19 00 1991 ndash01 ndash02 01 1992 36 34 02 1993 27 29 ndash02 1994 40 41 ndash01 1995 27 25 02 1996 38 37 01 1997 45 45 00 1998 44 44 00 1999 48 48 00 2000 41 41 00 2001 10 11 ndash01 2002 18 18 00 2003 28 25 03 2004 38 35 03 2005 34 31 03 2006 27 27 00 2007 18 19 ndash01 2008 ndash03 ndash03 00 2009 ndash28 ndash31 03 2010 25 24 01 2011 18 18 00 2012 28 22 06
percent at an average annual rate in the previously published estimates it had decreased 32 percent
For the current period of expansion from the secshyond quarter of 2009 through the first quarter of 2013 real GDP increased at an average annual rate of 22 percent revised up 01 percentage point from the previously published estimates
The average rate of change in the prices paid by US residents for 2002ndash2012 was revised down to 23 percent from 24 percent For 2009ndash2012 the avershyage annual increase was revised down to 18 percent from 19 percent
Personal saving and the personal saving rate (pershysonal saving as a percentage of disposable personal income (DPI)) were revised up for most years prishymarily reflecting upward revisions to personal income (table 2) For 2002ndash2012 the personal savshying rate averaged 47 percent revised up 10 pershycentage point from the previously published estimate
Table 2 Personal and National Saving Rates [Percent]
Year
Personal saving rate National saving rate
Revised Previously published Revision Revised Previously
published Revision
1970 126 94 32 212 186 26 1971 133 100 33 211 186 25 1972 121 89 32 216 192 24 1973 131 105 26 234 211 23 1974 129 107 22 224 201 23 1975 130 106 24 206 182 24 1976 111 94 17 213 188 25 1977 102 87 15 220 196 24 1978 102 89 13 233 208 25 1979 98 88 10 234 209 25 1980 106 98 08 221 195 26 1981 112 106 06 232 207 25 1982 115 109 06 216 189 27 1983 94 87 07 199 171 28 1984 107 102 05 219 191 28 1985 86 82 04 205 176 29 1986 82 76 06 192 161 31 1987 73 65 08 196 166 30 1988 78 69 09 205 176 29 1989 78 66 12 198 170 28 1990 78 65 13 189 160 29 1991 82 70 12 189 160 29 1992 89 73 16 178 149 29 1993 74 58 16 173 146 27 1994 63 52 11 181 156 25 1995 64 52 12 188 165 23 1996 59 49 10 196 171 25 1997 57 46 11 207 182 25 1998 62 53 09 211 186 25 1999 43 31 12 205 181 24 2000 40 29 11 202 178 24 2001 43 27 16 191 162 29 2002 50 35 15 179 146 33 2003 48 35 13 172 139 33 2004 46 36 10 174 145 29 2005 26 15 11 177 150 27 2006 34 26 08 188 160 28 2007 30 24 06 172 145 27 2008 50 54 ndash04 154 132 22 2009 61 47 14 143 111 32 2010 56 51 05 149 121 28 2011 57 42 15 155 120 35 2012 56 41 15 162 127 35
17
September 2013 SURVEY OF CURRENT BUSINESS
This article discusses the revisions that are attributshyable to the various definitional and statistical changes for each of the major NIPA aggregates and their comshyponents Specifically it discusses the following
Revisions to the annual current-dollar estimates in detail
Revisions to the annual estimates of real GDP and of prices (see page 32)
Revisions to the quarterly estimates of real GDP (see page 36)
Annual Current-Dollar Estimates GDP The revisions to the level of current-dollar GDP are upward and notable for all years of the revision peshyriod (1929ndash2012) the revisions exceed $100 billion by 1983 and reach about $560 billion (or 36 percent of the previously published estimate) for 2012 (table 3) These revisions reflect the definitional and statistical changes incorporated in this comprehensive revision (chart 1) In the aggregate changes in definitions (mainly the recognition of new forms of fixed investshyment) raise current-dollar GDP and gross domestic inshycome (GDI) for all years Statistical changes (improved source data and methodologies) tend to have smaller effects that are often negative
The definitional change that has the largest impact on the level of GDP is the capitalization of RampD which accounts for over half of the upward revision for all years from 1959 forward the largest impact (about $397 billion) is for 2012 Statistical changes have their
Chart 1 Sources of Revision to Current-Dollar Gross Domestic Product 1983ndash2012 Billions of dollars 600
500
400
300
200
100
0
ndash100
US Bureau of Economic Analysis
greatest impact for 2008 reducing GDP by about $57 billion of which about $44 billion is accounted for by the improved measurement of financial services
GDI By 1941 the revisions to GDI exceed $2 bilshylion from 1942 until the early 1970s the revisions
Table 3 Revisions to Gross Domestic Product Gross Domestic Income National Income and Personal Income
[Billions of dollars]
1959 1997 2002 2007 2010 2011 2012
Gross domestic product 159 2761 3379 4516 4594 4581 5598 Definitional
Capitalization of research and 164 2889 3857 4880 5034 5120 5260
development Capitalization of entertainment literary
87 2070 2444 3309 3625 3806 3967
and artistic originals Expanded set of ownership transfer
22 461 576 704 722 738 743
costs for residential fixed assets Accrual accounting for defined benefit
05 264 461 570 368 369 423
pension plans Reclassification of software to
49 93 377 297 318 208 126
intellectual property products 00 00 00 00 00 00 00 Statistical
Improved measurement of financial ndash05 ndash128 ndash478 ndash364 ndash440 ndash539 338
services 00 ndash108 ndash268 ndash237 ndash554 ndash501 ndash503 Other statistical ndash05 ndash19 ndash211 ndash128 114 ndash37 842
Gross domestic income 162 2499 3859 4194 4396 5437 6170 Definitional
Capitalization of research and 164 2889 3857 4880 5034 5120 5260
development Capitalization of entertainment literary
87 2071 2444 3309 3625 3806 3967
and artistic originals Expanded set of ownership transfer
22 461 576 704 722 738 743
costs for residential fixed assets Accrual accounting for defined benefit
05 264 461 570 368 369 423
pension plans 49 93 377 297 318 208 126 Statistical
Improved measurement of financial ndash02 ndash390 02 ndash686 ndash638 317 910
services Improved distribution of regulated
investment companies investment
00 ndash108 ndash268 ndash237 ndash554 ndash501 ndash503
income Improved measures of IRS section 179
00 00 00 00 00 00 00
expensing Improved mortgage interest paid
00 ndash117 ndash131 ndash211 ndash187 ndash164 ndash170
estimates 00 00 00 00 00 00 00 Other statistical ndash02 ndash164 400 ndash239 103 982 1583
National income 61 ndash256 283 ndash741 ndash719 368 957 Definitional
Capitalization of research and 60 210 341 72 63 43 03
development Capitalization of entertainment literary
12 235 185 394 304 325 335
and artistic originals Expanded set of ownership transfer
06 123 127 134 126 129 117
costs for residential fixed assets Accrual accounting for defined benefit
ndash07 ndash241 ndash348 ndash754 ndash685 ndash619 ndash575
pension plans 49 93 377 297 318 208 126 Statistical
Improved measurement of financial 01 ndash466 ndash58 ndash813 ndash782 325 954
services Improved distribution of regulated
investment companies investment
00 ndash102 ndash250 ndash222 ndash525 ndash469 ndash467
income Improved measures of IRS section 179
00 00 00 00 00 00 00
expensing Improved mortgage interest paid
00 ndash117 ndash131 ndash211 ndash187 ndash164 ndash170
estimates 00 00 00 00 00 00 00 Other statistical 01 ndash247 323 ndash380 ndash69 958 1591
Personal income 109 743 894 834 1133 2440 3127 Definitional
Capitalization of research and 107 634 931 761 1297 1147 1260
development Capitalization of entertainment literary
00 18 46 42 33 33 32
and artistic originals Expanded set of ownership transfer
00 ndash27 ndash22 ndash45 ndash45 ndash47 ndash48
costs for residential fixed assets Accrual accounting for defined benefit
ndash07 ndash235 ndash337 ndash738 ndash674 ndash608 ndash563
pension plans Accrual accounting for wages and
113 908 1244 1566 1984 1770 1839
salaries 00 ndash29 00 ndash63 00 00 00 Statistical
Improved measurement of financial 02 109 ndash37 73 ndash164 1293 1867
services Improved distribution of regulated
investment companies investment
00 ndash07 ndash148 ndash83 ndash94 12 05
income Improved measures of IRS section 179
00 336 ndash11 710 532 357 ndash263
expensing Improved mortgage interest paid
00 ndash117 ndash131 ndash211 ndash187 ndash164 ndash170
estimates 00 00 00 00 00 00 00 Other statistical 02 ndash102 252 ndash344 ndash414 1087 2296
Definitional revisions
Total revisions
Statistical revisions
1983 85 87 89 91 93 95 97 99 2001 03 05 07 09 11 2012
18
Improved NIPA Estimates September 2013
continue to grow slowly but steadily until becoming larger in the late 1970s The revisions exceed $100 bilshylion by 1984 and reach over $615 billion for 2012 The dollar impact of the definitional changes on the level of GDI is the same as the impact on GDP (chart 2) For most years from the mid-1980s through 2012 the upshyward revisions to GDI due to definitional changes are slightly offset by downward revisions due to statistical changes primarily reflecting the improved accounting of IRS section 179 expenses and the improved meashysures of financial services For 2009 2011 and 2012 the statistical revisions are notably upward and add to the total revision to GDI
Na tional income The impacts of a number of revishysions to GDI are the same as those for national income However because national income is net of consumpshytion of fixed capital (CFC) the recognition of RampD as investmentmdashwhich dominates the revisions to GDI and diminishes the relative impact of other changesmdashhas less impact on national income As a reshysult national income is generally affected more by the impacts of the other changes
The revisions to national income vary in both dishyrection and magnitude over time they are downward and small until 1979 and then they are negative and are generally larger through 2001 (chart 3) For 2002ndash2012 the revisions are of mixed sign (upward for 2002ndash2004 downward for 2005ndash2010 and upward for 2011 and 2012)
Chart 2 Sources of Revision to Current-Dollar Gross Domestic Income 1983ndash2012
Prior to 1980 both definitional and statistical changes lead to upward revisions for most years and for 1980ndash1990 both types of changes lead to downshyward revisions For 1991ndash2012 downward revisions due to statistical changes (particularly the improved measures of financial services and the improved acshycounting for IRS section 179 expenses) more than offshyset upward revisions due to definitional changes (particularly the upward impacts of capitalizing RampD and entertainment originals and of incorporating acshycrual-based measures for defined benefit pensions which more than offset the downward impact of inshycluding an expanded set of ownership transfer costs for residential fixed investment)
Personal in come The revisions to personal income are upward for most years for 1929ndash2012 (chart 4) The upward revisions are primarily accounted for by definitional changes particularly the adoption of acshycrual-based measures for defined benefit pension plans statistical changes do not exceed $2 billion until 1983
Additional detail on GDP GDI and other NIPA agshygregates and their major components is presented beshylow The accompanying tables show the revisions for 1959 2002 2007 and 2010ndash2012 as allocated among the changes in definition and the statistical improveshyments Appendix A presents the revised current-dollar estimates for 2007 2009 and 2012 shows the revisions in level for 2007ndash2012 and summarizes the major
Chart 3 Sources of Revision to Current-Dollar National Income 1979ndash2012
Billions of dollars
US Bureau of Economic Analysis
700
600
500
400
300
200
100
0
ndash100
ndash200 1983 85 87 89 91 93 95
Definitional revisions
97 99 2001 03 05 07 09
Total revisions
Statistical revisions
11 2012
Billions of dollars
US Bureau of Economic Analysis
1979 81 83 85 87 89 91 93 95 97
150
100
50
0
ndash50
ndash100
ndash150
ndash200
Definitional revisions
Total revisions
Statistical revisions
99 2001 03 05 07 09 11 2012
19
September 2013 SURVEY OF CURRENT BUSINESS
Chart 4 Sources of Revision to Current-Dollar Personal Income 1983ndash2012 Billions of dollars
350
300
250
200
150
100
50
0
ndash50
ndash100
ndash150 1983 85 87 89 91 93 95 97 99 2001 03 05 07 09 11 2012
Definitional revisions
Total revisions
Statistical revisions
US Bureau of Economic Analysis
source data incorporated and the sources of revision for selected detailed components
The remainder of this section is organized according to the seven-account framework for the NIPAs
Domestic income and product account 1 shows the consolidated production of all sectors of the economy as the sum of goods and services sold to final users and as the sum of incomes generated by the production of those goods and services
Private enterprise income account 2 provides addishytional information on the sources and uses of income by private enterprises
Personal income and outlays account 3 shows the sources and uses of income of individuals entershyprises that are owned by households and nonprofit institutions that serve households
Government current receipts and expenditures account 4 shows the receipts and uses of income for federal state and local governments (including government enterprises)
For foreign transactions the foreign transactions current account account 5 summarizes the current transactions of the United States with the rest of the world and the foreign transactions capital account account 7 summarizes the capital transactions with the rest of the world
Domestic capital account 6 shows the relationship between saving and investment in the US econshyomy
Domestic income and product (account 1) GDP The upward revisions to GDP begin with 1929 though the revisions are less than $10 billion until 1953 The revisions for this early period primarily reshyflect the impact of recognizing new forms of fixed inshyvestment on gross private domestic investment and on government consumption expenditures and gross inshyvestment
With few exceptions the upward revisions to GDP grow larger throughout the period of revision As a percentage of the previously published level of GDP the revisions range from 10 percent to 37 percent the revisions average 28 percent for 1929ndash2012 As noted above definitional changes have a far greater impact on the level of GDP than statistical changes for most years statistical changes result in downward revisions to GDP
GDI and the statistical discrepancy Through 1977 the revisions to GDI increase steadily but slowly for 1978ndash2006 the revisions increase more rapidly prishymarily reflecting the impacts of the definitional changes For 2007ndash2012 the revisions vary in size prishymarily reflecting the impacts of the statistical changes As a percentage of the previously published level of GDI the revisions range from 10 percent to 39 pershycent of GDI For 1929ndash2012 the revisions average 28 percent of the previously published level of GDI
For 1929ndash1992 the statistical discrepancymdashGDP less GDImdashis revised by less than $10 billion in absolute value5 For 1993ndash2000 for 2004ndash2008 and for 2010 upward revisions to GDP are greater than upward revishysions to GDI and revisions to the statistical discrepshyancy range from about $16 billion to about $101 billion For 2001ndash2003 for 2009 and for 2011 and 2012 upward revisions to GDI are greater than upshyward revisions to GDP and the statistical discrepancy is revised down For 1992ndash2012 the revised estimates (without regard to sign) of the statistical discrepancy average 07 percent of GDP the same percentage as in the previously published estimates
Product-side components
Personal consumption expenditures (PCE) For 1929ndash1984 the revisions to PCE are downward and are less than $5 billion reflecting the capitalization of RampD Beginning with 1985 the revisions are downshyward for most years The largest downward revision (about $54 billion) is for 2002 (table 4) For 1985 and
5 In theory GDP should equal GDI in practice GDP and GDI differ because their components are estimated using largely independent and less-than-perfect source data See the box ldquoThe Statistical Discrepancyrdquo in Robert P Parker and Eugene P Seskin ldquoAnnual Revision of the National Income and Product Accountsrdquo SURVEY 77 (August 1997) 19
20 Improved NIPA Estimates September 2013
Table 4 Revisions to Personal Consumption Expenditures [Billions of dollars]
1959 1997 2002 2007 2010 2011 2012
Total revision ndash02 ndash99 ndash539 ndash279 ndash138 ndash172 300 Definitional ndash01 ndash45 ndash57 ndash51 ndash79 ndash108 ndash110
Capitalization of research and development ndash01 ndash45 ndash57 ndash51 ndash79 ndash108 ndash110 Statistical ndash01 ndash54 ndash482 ndash228 ndash59 ndash64 410
Improved measurement of financial services 00 ndash73 ndash193 ndash157 ndash364 ndash300 ndash295 Other statistical ndash01 19 ndash289 ndash71 305 236 705
Source of revision by component Goods 00 00 ndash114 ndash23 ndash21 ndash221 ndash135
Durable goods 00 00 ndash67 ndash38 ndash87 ndash165 ndash162 Definitional 00 00 00 00 00 00 00 Statistical 00 00 ndash67 ndash38 ndash87 ndash165 ndash162
Nondurable goods 00 00 ndash47 14 66 ndash56 28 Definitional 00 00 00 00 00 00 00 Statistical 00 00 ndash47 14 66 ndash56 28
Services ndash02 ndash99 ndash425 ndash254 ndash118 49 434 Definitional ndash01 ndash45 ndash57 ndash51 ndash79 ndash108 ndash110
Capitalization of research and development ndash01 ndash45 ndash57 ndash51 ndash79 ndash108 ndash110 Statistical ndash01 ndash54 ndash368 ndash203 ndash39 157 544
Improved measurement of financial services 00 ndash73 ndash193 ndash157 ndash364 ndash300 ndash295 Other statistical ndash01 19 ndash175 ndash46 325 457 839
1986 there are small upward revisions of about $5 billion and about $2 billion respectively the only noshytable upward revision to PCE is for 2012 ($30 billion)
For 1929ndash1997 revisions to PCE are due to revishysions to services primarily reflecting the impacts of recognizing RampD as investment (for 1929 forward) and the improved measures of financial services (for 1985 forward)
For 1998ndash2011 revisions to PCE also reflect the inshycorporation of a significant amount of new and revised source data BEArsquos 2007 benchmark I-O accounts tabshyulations of Census Bureau data from the service anshynual survey (SAS) the annual retail trade survey the current population survey the housing vacancy survey and the American housing survey and data from the Energy Information Administration The overall imshypacts of these data result in downward revisions to PCE for both goods and services for most years
Private fixed investment Private fixed investment is revised up for all years from 1929 forward prior to 2003 the revisions are due almost exclusively to the impacts of recognizing RampD and entertainment origishynals as nonresidential fixed investment and of expandshying the ownership transfer costs that are recognized as residential fixed investment (table 5)
For 2003 forward the revisions to private fixed inshyvestment also generally reflect upward revisions to equipment and to the change in private inventories that are partly offset by downward revisions to nonresshyidential structures
Nonresidential structures Revisions to this comshyponent begin with 2002 and are downward for most years the largest downward revision is for 2008 (about $34 billion) The revisions are exclusively due to statisshytical changesmdashprimarily the incorporation of data from the 2007 benchmark I-O accounts of revised peshytroleum footage drilled and expenditure data from trade sources and the Census Bureau and of revised Census Bureau construction spending data
Equipment Private equipment (excluding softshyware) was revised up for 2003 forward reflecting stashytistical changes including the incorporation of BEArsquos 2007 benchmark I-O accounts of new and revised data from Census Bureau surveys of manufactures and of other new and revised source data
The revisions to equipment are less than $10 billion until 2005 and remain less than $20 billion until 2010 For 2010ndash2012 new and revised Census Bureau anshynual survey of manufactures data for shipments result in upward revisions particularly to information proshycessing equipment the upward revisions to equipment range from about $31 billion for 2010 to about $43 bilshylion for 2012
Intellectual property products This new category of fixed investment consists of expenditures for softshyware for RampD and for entertainment literary and arshytistic originals
Private investment in software was previously inshycluded in the ldquoequipment and softwarerdquo category Softshyware is not revised until 2003 for 2003ndash2009 there are small generally downward revisions of less than $2 billion For 2010ndash2012 the downward revisions beshycome larger reaching about $12 billion for 2012 The revisions reflect statistical changes that result primarily from the incorporation of data from the 2007 benchshymark I-O accounts and of new and revised Census Bushyreau SAS data
Table 5 Revisions to Gross Private Domestic Investment [Billions of dollars]
1959 1997 2002 2007 2010 2011 2012
Total revision Definitional
Capitalization of research and development
Capitalization of entertainment literary and artistic originals
Expanded set of ownership transfer costs for residential fixed assets
Reclassification of software to intellectual property products
Statistical Source of revision by component
Private fixed investment Nonresidential
Structures Definitional Statistical
Equipment 1 Definitional Statistical
Intellectual property products Definitional
Capitalization of research and development
Capitalization of entertainment literary and ar tistic originals
Statistical revision to software Residential
Definitional Expanded set of ownership transfer
costs for residential fixed assets Statistical
Change in private inventories Definitional Statistical
72 71
44
22
05
00 01
71 66 00 00 00 00 00 00
66
44
22 00 05 05
05 00 00 00 00
2069 2069
1344
461
264
00 00
2070 1805
00 00 00 00 00 00
1805
1344
461 00
265 264
264 01
ndash01 00
ndash01
2780 2694
1657
576
461
00 86
2716 2235
01 00 01 00 00 00
2233
1657
576 00
481 461
461 20 65 00 65
3485 3508
2233
704
570
00 ndash23
3432 2831 ndash280
00 ndash280
182 00
182 2937
2233
704 ndash08 600 570
570 30 54 00 54
3635 3492
2402
722
368
00 143
3603 3198 ndash143
00 ndash143
307 00
307 3124
2402
722 ndash89 405 368
368 37 31 00 31
3772 3659
2552
738
369
00 113
3773 3303 ndash242
00 ndash242 367
00 367
3290
2552
738 ndash111 471 369
369 102 ndash02
00 ndash02
4129 3857
2691
743
423
00 272
4049 3487 ndash261
00 ndash261 431
00 431
3434
2691
743 ndash118 563 423
423 140
80 00 80
1 ldquoEquipmentrdquo is a new NIPA category Revisions are calculated by subtracting the new category from a comparable category derived from the previously published NIPA category ldquoprivate fixed investment in equipshyment and softwarerdquo
21 September 2013 SURVEY OF CURRENT BUSINESS
Expenditures for RampD and for entertainment origishynals were previously treated as intermediate expenses and were not recorded as final expenditures Recognizshying RampD and entertainment originals as fixed investshyment boosts the level of investment for all years For RampD private investment exceeds $10 billion in 1969 and reaches nearly $270 billion in 2012 For entertainshyment originals private investment exceeds $10 billion in 1979 and reaches over $74 billion in 2012
Residential fixed investment This component is revised up generally by increasing amounts for all years The revisions are less than $1 billion until 1965 remain less than $5 billion until 1978 and reach a peak of about $81 billion for 2005 For 2006 forward the upward revisions are of lesser amounts but remain mostly above $40 billion
The revisions for each year are primarily due to the expanded set of ownership transfer costs that are recshyognized as residential fixed investment Statistical changesmdashprimarily reflecting the incorporation of data from the 2007 benchmark I-O accounts and of new and revised Census Bureau construction spending datamdashare generally small and upward after 2000
Change in private inventories Revisions to the change in private inventories (ldquoinventory investmentrdquo) begin with 2002 and are mostly upward they are less than $10 billion for each year The revisions primarily reflect the impact on nonfarm inventory investment of the incorporation of new and revised Census Bureau
data on inventory book values and of new commodity price weights from the 2007 benchmark I-O accounts Revisions to farm inventory investment are less than $5 billion for all years and primarily reflect revised US Department of Agriculture (USDA) farm statistics for 2010ndash2012 For 2012 the revision to farm invenshytory investment of over $4 billion exceeds the revision to nonfarm inventories this revision also reflects the incorporation of revised USDA data
Net exports of goods and services Revisions to net exports begin with 1985 and are of mixed sign but they do not exceed $2 billion in absolute value until 2002 (table 6) Revisions are upward for 2002ndash2007 downward for 2008ndash2011 and upward for 2012 The largest upward revision is for 2012 (about $13 billion) the largest downward revision is for 2010 (almost $7 billion)
For 1985ndash1998 the revisions to net exports are due solely to the impact of the improved measures of fishynancial services on the exports of services
For 1999ndash2012 the revisions to net exports are prishymarily due to the incorporation of revised data from BEArsquos international transactions accounts (ITAs) there are no definitional revisions to net exports6 For exshyports of goods and services the revisions are small for most years the largest revision is an upward revision of
6 Royalties for RampD and for entertainment originals were already included in the previously published estimates of exports of services and of imports of services
Data Availability An extensive set of estimates is presented in ldquoNational incorporated in this comprehensive NIPA revision Income and Product Accountsrdquo (NIPAs) in this issue The following additional revised NIPA estimates and These estimates and annual estimates for 1929 forward related tables will be released on BEArsquos Web site and then and quarterly estimates for 1947 forward are available on published in upcoming issues of the SURVEY NIPA table BEArsquos Web site at wwwbeagov 29 (personal income by households and by nonprofit
The October SURVEY OF CURRENT BUSINESS will present institutions serving households) tables 315ndash317 (govshyrevised estimates of fixed assets and of consumer durable ernment spending by function) table 318 (reconciliashygoods and revised estimates of real inventories sales and tion of NIPA federal government estimates with federal inventory-sales ratios for manufacturing and trade for budget data) table 319 (reconciliation of NIPA state and the fourth quarter of 2009 through the second quarter of local government estimates with Census Bureau data) 2013 tables 320 and 321 (state government and local govern-
The October SURVEY will also present revised estimates ment current receipts and expenditures) and tables 322 of state personal income for 2001ndash2012 that incorporate and 323 (not seasonally adjusted estimates of federal the results of this comprehensive NIPA revision government and state and local government current
The November SURVEY will feature the ldquoUpdated Sum- receipts and expenditures) table 510 (changes in the net mary of NIPA Methodologiesrdquo which lists the principal stock of produced assets) NIPA table 712 (imputations source data and estimating methods that are used in pre- in the NIPAs) table 715 (reconciliation of net farm paring the current-dollar and chained-dollar estimates of income in the NIPAs with net farm income from the US GDP Department of Agriculture) and table 719 (reconcilia-
The January SURVEY will present the results from the tion of NIPA income and outlays of nonprofit institushy2007 benchmark input-output accounts which are tions with IRS revenue and expenses)
22 Improved NIPA Estimates September 2013
Table 6 Revisions to Net Exports of Goods and Services [Billions of dollars]
1959 1997 2002 2007 2010 2011 2012
Total revision 00 ndash06 22 33 ndash69 ndash06 127 Definitional 00 00 00 00 00 00 00 Statistical 00 ndash06 22 33 ndash69 ndash06 127
Improved measurement of financial services 00 ndash07 ndash17 ndash15 ndash29 ndash32 ndash36 Other statistical 00 01 39 48 ndash40 26 163
Source of revision by component Exports of goods and services 00 ndash06 17 40 ndash09 70 119
Goods 00 00 123 33 ndash01 ndash09 ndash68 Definitional 00 00 00 00 00 00 00 Statistical 00 00 123 33 ndash01 ndash09 ndash68
Services 00 ndash06 ndash106 07 ndash08 79 187 Definitional 00 00 00 00 00 00 00 Statistical 00 ndash06 ndash106 07 ndash08 79 187
Improved measurement of financial services 00 ndash07 ndash17 ndash15 ndash29 ndash32 ndash36
Other statistical 00 01 ndash89 22 21 111 223 Imports of goods and services 00 00 ndash05 07 59 76 ndash09
Goods 00 00 42 ndash04 42 54 35 Definitional 00 00 00 00 00 00 00 Statistical 00 00 42 ndash04 42 54 35
Services 00 00 ndash47 13 17 23 ndash44 Definitional 00 00 00 00 00 00 00 Statistical 00 00 ndash47 13 17 23 ndash44
about $12 billion for 2012 For imports of goods and services the revisions are less than $5 billion in absoshylute value for each year except for 2010 and 2011 when they are about $60 billion and about $75 billion reshyspectively
Government consumption expenditures and gross investment Government consumption expenditures and gross investment (ldquogovernment spendingrdquo) is reshyvised up for each year for 1961 forward the revisions exceed $10 billion and generally increase until about 2000 after which they are fairly steady through 2012 (table 7) The largest revision is for 2007 (about $128 billion) For 1929ndash1975 the revisions to government spending are dominated by upward revisions to federal spending For 1976ndash1988 upward revisions to federal spending are partly offset by downward revisions to state and local spending For 1989ndash2012 upward revishysions to state and local spending steadily increase peaking at about $57 billion for 2004 and supplementshying the upward revisions to federal spending
For federal spending both defense and nondefense spending contribute to the upward revisions Beginshyning with 1992 the upward revisions to defense spending begin to decrease while the revisions to nonshydefense spending increase throughout the period
Revisions to defense spending reflect upward revishysions to consumption expenditures until 1979 and upshyward revisions to gross investment for the entire period Defense consumption expenditures are revised up for 1929ndash1978 the largest upward revision (just over $5 billion) is for 1970 Defense consumption exshypenditures are revised down for 1979ndash2012 the largest downward revision (almost $52 billion) is for 2012 The revisions reflect the adoption of accrual-based measures for defined benefit pension plans which have an upward impact in early years but a downward
impact in the recent period and the effects of removshying RampD expenditures from consumption The upshyward revisions to defense gross investment are more than accounted for by the capitalization of RampD exshypenditures (For more on the impacts on government spending of recognizing RampD as investment see the box ldquoGovernment Research and Developmentrdquo)
The revisions to nondefense spending throughout the period are due primarily to the impact on gross inshyvestment of capitalizing RampD revisions to consumpshytion expenditures are small and mostly downward
For state and local spending revisions also begin with 1929 The revisions are upward and less than $3 billion through 1975 are downward and larger for 1976ndash1988 and are upward and even larger for 1989ndash2012 For 1976ndash1988 the downward revisions are due to the impacts of removing RampD expenditures
Table 7 Revisions to Government Consumption Expenditures and Gross Investment
[Billions of dollars]
1959 1997 2002 2007 2010 2011 2012
Total revision 89 798 1116 1277 1165 989 1042 Definitional 93 866 1220 1424 1621 1569 1513
Capitalization of research and development Accrual accounting for defined benefit
44 772 844 1127 1303 1361 1386
pension plans 49 93 377 297 318 208 126 Statistical ndash04 ndash68 ndash104 ndash147 ndash456 ndash580 ndash471
Improved measurement of financial services 00 ndash29 ndash57 ndash65 ndash162 ndash170 ndash173 Other statistical
Source of revision by component ndash04 ndash39 ndash47 ndash82 ndash294 ndash411 ndash298
Federal 82 514 600 735 808 820 814
Defense 71 216 191 164 151 150 80 Consumption expenditures 19 ndash120 ndash226 ndash493 ndash493 ndash493 ndash516
Definitional Capitalization of research and
15 ndash150 ndash259 ndash497 ndash518 ndash539 ndash541
development Accrual accounting for defined benefit
ndash19 55 ndash31 ndash116 ndash40 ndash30 00
pension plans 34 ndash205 ndash228 ndash381 ndash478 ndash509 ndash541 Statistical 04 30 33 04 25 46 25
Gross investment 52 337 417 658 643 643 595 Definitional
Capitalization of research and 57 336 414 654 653 666 643
development 57 336 414 654 653 666 643 Statistical ndash05 01 03 04 ndash10 ndash23 ndash48
Nondefense 11 299 409 570 658 669 735 Consumption expenditures 00 ndash68 ndash76 ndash12 ndash26 ndash36 37
Definitional Capitalization of research and
00 ndash130 ndash197 ndash225 ndash256 ndash224 ndash203
development Accrual accounting for defined benefit
ndash06 ndash46 ndash100 ndash88 ndash110 ndash83 ndash51
pension plans 06 ndash84 ndash97 ndash138 ndash146 ndash141 ndash152 Statistical
Improved measurement of financial 00 62 121 213 230 188 240
services 00 00 ndash01 00 00 00 00 Other statistical 00 62 122 214 230 188 240
Gross investment 11 366 484 583 683 706 698 Definitional
Capitalization of research and 11 371 486 572 667 666 644
development 11 371 486 572 667 666 644 Statistical 00 ndash05 ndash02 11 16 40 54
State and local 06 283 516 543 358 170 228 Consumption expenditures 05 214 416 425 221 ndash06 56
Definitional Capitalization of research and
08 369 677 780 902 821 792
development Accrual accounting for defined benefit
00 ndash13 ndash24 ndash35 ndash41 ndash36 ndash27
pension plans 09 382 701 816 943 857 820 Statistical
Improved measurement of financial ndash03 ndash155 ndash261 ndash355 ndash681 ndash827 ndash736
services 00 ndash29 ndash56 ndash65 ndash161 ndash169 ndash173 Other statistical ndash03 ndash126 ndash205 ndash290 ndash520 ndash658 ndash564
Gross investment 02 69 100 118 137 175 172 Definitional
Capitalization of research and 02 69 100 141 173 178 178
development 02 69 100 141 173 178 178 Statistical 00 00 00 ndash23 ndash36 ndash03 ndash06
23 September 2013 SURVEY OF CURRENT BUSINESS
from consumption of incorporating accrual-based measures for defined benefit pension plans and of other changes including the incorporation of imshyproved measures of state and local government-sponshysored defined contribution pension plans beginning with 1985 the downward revisions also reflect the imshyproved measures of financial services7 These downshyward revisions are partly offset by upward revisions due to the impact on gross investment of capitalizing RampD and the impact on consumption expenditures from the addition of CFC for RampD For 1989ndash2012 upward revisions to both consumption expenditures and gross investment for most years primarily reflect the impacts of incorporating accrual-based measures for defined benefit pension plans and the recognition
7 With this comprehensive revision BEA improved its coverage of state and local defined contribution pension plans by incorporating new source data from the Bureau of Labor Statistics employer costs for employee comshypensation survey See ldquoPreview Statistical Changesrdquo 8ndash9
Government Research and Development In addition to the definitional change that reclassifies government research and development (RampD) spendshying from consumption to investment the new treatshyment of RampD also changes the classification of government spending between the federal governshyment and state and local governments The federal government is a major funder of RampD through research grants while state and local governments are major producers of RampD at public universities and hospitals
With the recognition of RampD as a capital asset ownership of the RampD asset must be assigned to a secshytor of the economy BEA adopted the convention that the entity that funds RampD will be the owner of the RampD asset Thus federally funded RampD performed at public universities and hospitals is recorded as federal gross investment in intellectual property products1
Accordingly federal research grants-in-aid to state and local governments are reclassified as federal gross investment and as state and local sales to other sectors previously they had been recorded as federal current transfer payments and as state and local current transshyfer receipts
In addition to these changes BEA introduced new source data for federal RampD spending Previously the estimates for RampDmdashwhich were treated as intermedishyate goods and services purchasedmdashhad been based on federal budget data the newly published estimates for federal RampD investment are based on data from the National Science Foundation surveys of RampD by pershyformer and by funder when available
1 See ldquoPreview Changes in Definitions and Presentationsrdquo 15ndash16
of RampD as investment these upward revisions are partly offset by downward revisions due to the imshyproved measures of financial services
Income-side components
Compensation of employees paid This aggregate shows the income accruing to employees for their work for domestic production it includes compensation paid to the rest of the world and excludes compensashytion received from the rest of the world8
The revisions to compensation reflect revisions to wages and salaries and to supplements to wages and salaries (table 8) Prior to 1992 the revisions are due exclusively to revisions to supplements
Revisions to wages and salaries reflect only statisshytical changes the introduction of accrual accounting for wages and salaries affects only the measure of wages and salaries in personal income (the measures of wages and salaries in GDI and in national income were alshyready on an accrual basis) The statistical revisions inshyclude updated measures of misreporting based on data from the IRS revised data on wages and salaries paid to and received from the rest of the world from the ITAs improved measures of wages paid by Indian tribal governments revised estimates of wages from cafeteria plans and the incorporation of new and reshyvised data from the Bureau of Labor Statistics (BLS) Quarterly Census of Employment and Wages
Revisions to wages and salaries begin with 1992 For 1992ndash2012 revisions to wages and salaries are of mixed sign the largest downward revision is for 2010
8 This measure of compensation differs from the measure that is a comshyponent of national income The national income measure excludes comshypensation paid to the rest of the world and includes compensation received from the rest of the world
Table 8 Revisions to Compensation of Employees Paid [Billions of dollars]
1959 1997 2002 2007 2010 2011 2012
Total revision 53 491 333 458 ndash19 ndash166 196 Definitional
Accrual accounting for defined benefit 53 421 315 550 35 ndash134 ndash234
pension plans 53 421 315 550 35 ndash134 ndash234 Accrual accounting for wages and salaries 00 00 00 00 00 00 00
Statistical Source of revision by component
00 70 18 ndash92 ndash54 ndash32 430
Wages and salaries 00 32 13 ndash169 ndash261 ndash225 216 Definitional 00 00 00 00 00 00 00
Accrual accounting for wages and salaries 00 00 00 00 00 00 00 Statistical 00 32 13 ndash169 ndash261 ndash225 216
Supplements to wages and salaries 54 458 320 627 244 59 ndash20 Definitional
Accrual accounting for defined benefit 53 421 315 550 35 ndash134 ndash234
pension plans 53 421 315 550 35 ndash134 ndash234 Statistical Employer contributions for employee
01 37 05 77 209 193 214
pension and insurance funds 53 459 321 609 231 64 ndash15 Definitional
Accrual accounting for defined benefit 53 421 315 550 35 ndash134 ndash234
pension plans 53 421 315 550 35 ndash134 ndash234 Statistical
Employer contributions for government 00 38 06 59 196 198 219
social insurance 00 00 ndash01 18 13 ndash05 ndash05 Definitional 00 00 00 00 00 00 00 Statistical 00 00 ndash01 18 13 ndash05 ndash05
24 Improved NIPA Estimates September 2013
(just over $26 billion) and the largest upward revision is for 2012 (over $21 billion)
The revisions to supplements are upward for 1929ndash1975 are downward for 1976ndash1988 and are upshyward for 1989ndash2002 Revisions are downward for 2003 are upward for 2004ndash2011 and are downward for 2012 The largest upward revision is for 2000 (almost $70 billion) and the largest downward revision is for 1984 ($28 billion)
The revisions to supplements primarily reflect the impact on employer contributions for employee penshysion and insurance funds of incorporating accrual-based measures for defined benefit pension plans Beshyginning with 1992 statistical revisions exceed $2 bilshylion and reach a peak of over $21 billion for 2012 Statistical revisions in the later years largely reflect new pensions data from the Department of Labor as well as new medical expenditures panel survey data from the Department of Health and Human Services
Taxes on production and imports The revisions to this component begin with 2002 revisions are downshyward for 2002 are upward for 2003ndash2010 and are downward for 2011 and 2012 (table 9) The largest upshyward revision is for 2007 (over $7 billion) and the largest downward revision is for 2012 (about $7 bilshylion) For each year the revisions are exclusively due to statistical changes including upward revisions to property taxes and to state and local general sales taxes that are based primarily on the incorporation of new and revised Census Bureau government finances data
Table 9 Revisions to Taxes on Production and Imports Less Subsidies
[Billions of dollars]
1959 1997 2002 2007 2010 2011 2012
Total revision 00 00 ndash02 74 32 08 ndash36 Definitional 00 00 00 00 00 00 00 Statistical 00 00 ndash02 74 32 08 ndash36 Source of revision by component
Taxes on production and imports 00 00 ndash02 74 21 ndash08 ndash71 Definitional 00 00 00 00 00 00 00 Statistical 00 00 ndash02 74 21 ndash08 ndash71
Less Subsidies 00 00 00 00 ndash11 ndash16 ndash35 Definitional 00 00 00 00 00 00 00 Statistical 00 00 00 00 ndash11 ndash16 ndash35
Subsidies This component is revised for 1929ndash1958 and for 2006ndash2012 (table 9) For 1929ndash1958 upward revisions result from the adoption of accrual-based measures for defined benefit pension plans for federal government enterprises which are netted against subshysidies in this period9 For 2006ndash2012 the revisions are generally downward and small reaching a peak of less than $4 billion for 2012 The revisions result primarily
9 As part of the 2003 comprehensive revision the current surplus of govshyernment enterprises was reclassified as a government receipt for 1959 forshyward before this revision it was classified as a negative government expenditure and netted against subsidies The available source data do not allow the reclassification prior to 1959
from new and revised federal budget data and the reshyclassification of certain federal transactions from subshysidies to other transactions (such as capital transfers to business)10
Net operating surplus This component is a profits-like measure that shows business income after subshytracting the costs of compensation of employees taxes on production and imports less subsidies and CFC from gross value added but before subtracting financshying costs (such as net interest) and business transfer payments Net operating surplus consists of net intershyest and miscellaneous payments (of domestic indusshytries) business current transfer payments (net) proprietorsrsquo income with inventory valuation adjustshyment (IVA) and capital consumption adjustment (CCAdj) rental income of persons with CCAdj corposhyrate profits with IVA and CCAdj (of domestic indusshytries) and the current surplus of government enterprises Except for the current surplus of governshyment enterprises discussed below the revisions to these components are discussed in the section on the private enterprise income account
Revisions to net operating surplus begin with 1931 and are less than $5 billion until 1973 Revisions are upward for 1973ndash1985 are downward for 1986ndash2002 are upward for 2003 are downward for 2004ndash2010 and are upward for 2011 and 2012 (table 10) The largest downward revision is for 2008 (almost $197 bilshylion) and the largest upward revision is for 2012 (alshymost $70 billion)
Current surplus of government enterprises The revisions to this component begin with 1959 and are fairly small throughout the period reaching $5 billion in absolute value for only 4 years all after 2005 Prior to 2006 the revisions are due primarily to the adoption of accrual-based measures for defined benefit pension plans which results in upward revisions for federal enterprises that are partly offset by downward revishysions to state and local enterprises For 2006ndash2009 the adoption of accrual-based measures results in downshyward revisions that are supplemented by downward statistical revisions For 2011 and 2012 upward statisshytical revisions more than offset the downward revishysions due to the adoption of accrual-based measures for defined benefit pension plans
CFC CFC is revised up for all years revisions reach $10 billion by 1959 and grow steadily thereafter reachshying over $531 billion for 2012 (table 11) Throughout
10 Payments to lenders who refinanced mortgages through the Home Affordable Modification Program are reclassified from subsidies to capital transfers to business based on new information from the Department of Treasury In addition certain payments made to commercial banks through the federal governmentrsquos Student Loan Purchasing Authority are reclassishyfied as financial transactions in order to maintain consistency with how BEA treats similar transactions related to other student loan programs
September 2013 SURVEY OF CURRENT BUSINESS 25
the period the revisions to private CFC exceed those to government CFC and the revisions to business CFC exceed revisions to the CFC of households and institushytions (that is nonprofit institutions) The upward revi-
Table 10 Revisions to Net Operating Surplus [Billions of dollars]
1959 1997 2002 2007 2010 2011 2012
Total revision 08 ndash753 ndash43 ndash1305 ndash700 436 698 Definitional 06 ndash211 26 ndash479 28 177 237
Capitalization of research and development Capitalization of enter tainment literary and
12 235 185 394 304 325 335
artistic originals Expanded set of ownership transfer costs for
06 123 127 134 126 129 117
residential fixed assets Accrual accounting for defined benefit
ndash07 ndash241 ndash348 ndash754 ndash685 ndash619 ndash575
pension plans ndash04 ndash327 61 ndash253 283 342 361 Statistical 02 ndash542 ndash69 ndash826 ndash728 259 461
Improved measurement of financial services Improved distribution of regulated
00 ndash108 ndash268 ndash237 ndash554 ndash501 ndash503
investment companies investment income Improved measures of IRS section 179
00 00 00 00 00 00 00
expensing 00 ndash117 ndash131 ndash211 ndash187 ndash164 ndash170 Improved mor tgage interest paid estimates 00 00 00 00 00 00 00 Other statistical
Source of revision by component 02 ndash317 329 ndash379 13 924 1134
Private enterprises 12 ndash787 ndash50 ndash1258 ndash666 408 635 Definitional 11 ndash245 18 ndash458 66 216 270
Capitalization of research and development Capitalization of enter tainment literary and
12 235 185 394 304 325 335
artistic originals Expanded set of ownership transfer costs for
06 123 127 134 126 129 117
residential fixed assets Accrual accounting for defined benefit
ndash07 ndash241 ndash348 ndash754 ndash685 ndash619 ndash575
pension plans 00 ndash361 54 ndash233 321 381 394 Statistical 01 ndash542 ndash68 ndash800 ndash732 192 365
Improved measurement of financial services Improved distribution of regulated
00 ndash108 ndash268 ndash237 ndash554 ndash501 ndash503
investment companies investment income Improved measures of IRS section 179
00 00 00 00 00 00 00
expensing 00 ndash117 ndash131 ndash211 ndash187 ndash164 ndash170 Improved mor tgage interest paid estimates 00 00 00 00 00 00 00 Other statistical 01 ndash317 330 ndash353 09 857 1038
Current surplus of government enterprises ndash05 34 07 ndash46 ndash34 27 63 Definitional
Accrual accounting for defined benefit ndash04 34 07 ndash20 ndash38 ndash39 ndash33
pension plans ndash04 34 07 ndash20 ndash38 ndash39 ndash33 Statistical ndash01 00 00 ndash27 04 66 97
Table 11 Revisions to Consumption of Fixed Capital [Billions of dollars]
1959 1997 2002 2007 2010 2011 2012
Total revision 100 2762 3571 4969 5082 5158 5312 Definitional 104 2679 3516 4808 4971 5077 5257
Capitalization of research and development Capitalization of enter tainment literary and
75 1836 2258 2914 3322 3481 3632
artistic originals Expanded set of ownership transfer costs for
17 338 449 570 596 608 626
residential fixed assets 12 505 809 1324 1053 988 999 Statistical
Source of revision by component ndash04 83 55 161 111 81 55
Private 58 2004 2740 3888 3836 3870 4015 Business 47 1494 1929 2605 2780 2859 3004
Definitional Capitalization of research and
48 1416 1891 2413 2640 2744 2884
development Capitalization of enter tainment literary
30 1027 1364 1713 1932 2028 2153
and artistic originals Expanded set of ownership transfer costs
17 338 449 570 596 608 626
for residential fixed assets 01 51 78 130 112 107 105 Statistical ndash01 78 38 192 140 115 120
Households and institutions 11 509 811 1282 1056 1012 1011 Definitional
Capitalization of research and 12 491 781 1268 1028 972 987
development Expanded set of ownership transfer costs
01 37 50 74 87 91 94
for residential fixed assets 11 454 731 1194 941 881 894 Statistical 00 18 30 14 28 40 24
Government 41 758 832 1081 1246 1287 1297 Federal 41 706 758 1002 1150 1194 1207
Definitional Capitalization of research and
43 716 768 1021 1170 1220 1236
development 43 716 768 1021 1170 1220 1236 Statistical ndash02 ndash10 ndash10 ndash19 ndash20 ndash26 ndash29
State and local 01 52 72 79 94 93 89 Definitional
Capitalization of research and 01 56 76 106 133 142 151
development 01 56 76 106 133 142 151 Statistical 00 ndash04 ndash04 ndash27 ndash39 ndash49 ndash62
sions to business CFC exceed $300 billion for 2012 and are primarily due to the capitalization of RampD and to a lesser degree of entertainment originals
For households and institutions the upward revishysions which exceed $101 billion for 2012 are primarily due to the expanded set of ownership transfer costs for residential fixed assets these revisions are suppleshymented by smaller upward revisions due to the capitalshyization of RampD11
For the federal government the revisions reach alshymost $121 billion for 2012 and are mostly due to the capitalization of RampD For state and local governshyments the upward revisions are less than $10 billion throughout the period and are also due primarily to the capitalization of RampD
Private enterprise income (account 2) Private enterprises consist of private businesses owner-occupied housing and nonprofit institutions serving households (for purposes of estimating moneshytary and imputed interest payments and imputed inshyterest receipts)
Net interest and miscellaneous payments domesshytic industries Revisions begin with 1951 but are less than $2 billion until 1973 and are less than $5 billion until 1981 For 1973ndash2001 revisions are mostly upshyward For 2002ndash2012 revisions are downward and range from about $17 billion to about $180 billion (tashyble 12) Prior to 1985 the revisions are due primarily to the adoption of accrual-based measures for defined benefit pension plans For 1986 forward the revisions also reflect the impact of the improved measures of fishynancial services that causes the total revision to be
11 The revisions associated with ownership transfer costs also reflect a faster depreciation rate for brokersrsquo commissions on residential structures
Table 12 Revisions to Net Interest and Miscellaneous Payments Domestic Industries
[Billions of dollars]
1959 1997 2002 2007 2010 2011 2012
Total revision 01 64 ndash167 ndash714 ndash824 ndash818 ndash864 Definitional
Accrual accounting for defined benefit 00 ndash136 229 ndash37 241 243 222
pension plans 00 ndash136 229 ndash37 241 243 222 Statistical 01 200 ndash396 ndash677 ndash1065 ndash1061 ndash1086
Improved measurement of financial services Improved distribution of regulated investment
00 ndash108 ndash268 ndash237 ndash554 ndash501 ndash503
companies investment income 1 00 254 ndash22 428 249 19 Improved mortgage interest paid estimates 00 53 ndash134 ndash966 ndash920 ndash954 ndash833 Other statistical
Source of revision by component 01 02 28 98 159 375
Net interest domestic industries 00 64 ndash184 ndash752 ndash845 ndash857 ndash898 Definitional
Accrual accounting for defined benefit 00 ndash136 229 ndash37 241 243 222
pension plans 00 ndash136 229 ndash37 241 243 222 Statistical 00 200 ndash413 ndash715 ndash1086 ndash1100 ndash1120
Improved measurement of financial services Improved distribution of regulated investment
00 ndash108 ndash268 ndash237 ndash554 ndash501 ndash503
companies investment income 1 00 254 ndash22 428 249 19 Improved mortgage interest paid estimates 00 53 ndash134 ndash966 ndash920 ndash954 ndash833 Other statistical 00 02 11 60 138 336
Miscellaneous payments 01 00 17 38 21 39 34 Definitional 00 00 00 00 00 00 00 Statistical 01 00 17 38 21 39 34
1 Revisions for 2012 are not shown because these data were not previously published
26 Improved NIPA Estimates September 2013
downward for 1986 for 1991 and for 1992 For 1992 forward the estimates reflect improvements to the disshytribution of the income of regulated investment comshypanies and to the measures of mortgage interest paid Prior to 2002 the impacts of these changes lead to upshyward revisions For 2002ndash2012 the downward revishysions to net interest are primarily accounted for by the improved measures of mortgage interest paid the downward revisions are partly offset by upward revishysions for most years resulting from the improved disshytribution of the income of regulated investment companies
Business current transfer payments (net) This component consists of payments to persons to govshyernment and to the rest of the world
Revisions to business current transfer payments are less than $2 billion in absolute value until 2001 for 2001ndash2012 revisions are downward for most years and range from less than $10 billion to about $21 billion (table 13) For most years the revisions are the result of the reclassification of certain payments to the fedshyeral government from transfers to rents and royalties For 2010 and 2012 downward revisions to transfer payments to persons also contribute to the overall downward revision For 2012 the reclassification of fines paid by the rest of the world also contributes to the downward revision12
Table 13 Revisions to Business Current Transfer Payments (Net) [Billions of dollars]
1959 1997 2002 2007 2010 2011 2012
Total revision ndash01 ndash12 ndash17 ndash47 ndash115 ndash30 ndash211 Definitional 00 00 00 00 00 00 00 Statistical ndash01 ndash12 ndash17 ndash47 ndash115 ndash30 ndash211
Source of revision by component Payments to persons (net) 00 00 00 01 ndash44 18 ndash45
Definitional 00 00 00 00 00 00 00 Statistical 00 00 00 01 ndash44 18 ndash45
Payments to government (net) ndash01 ndash13 ndash17 ndash48 ndash73 ndash47 ndash138 Definitional 00 00 00 00 00 00 00 Statistical ndash01 ndash13 ndash17 ndash48 ndash73 ndash47 ndash138
Payments to the rest of the world (net) 00 00 00 00 02 ndash01 ndash27 Definitional 00 00 00 00 00 00 00 Statistical 00 00 00 00 02 ndash01 ndash27
Proprietorsrsquo income with IVA and CCAdj For proshyprietorsrsquo income downward revisions begin with 1929 but they are less than $5 billion until 1985 For 1985ndash2011 revisions are downward and generally inshycreasing the largest downward revision is over $111 billion for 2007 The only upward revision is for 2012 (about $23 billion) (table 14)
Prior to 2011 the revisions are almost entirely atshytributable to nonfarm proprietorsrsquo income Prior to
12 The 2013 annual revision of the ITAs reclassified specific fines paid by foreign companies as part of transfer payments to the rest of the world (net) Previously these fines and penalties were not captured in the ITAs For more information see Christopher L Bach ldquoBEA Briefing Fines and Penalties in the US International Transactions Accountsrdquo SURVEY 93 (July 2013) 55ndash60
Table 14 Revisions to Proprietorsrsquo Income With Inventory Valuation and Capital Consumption Adjustments
[Billions of dollars]
1959 1997 2002 2007 2010 2011 2012
Total revision 00 ndash403 ndash193 ndash1112 ndash707 ndash22 226 Definitional
Capitalization of research and 00 ndash51 ndash46 ndash105 ndash87 ndash88 ndash102
development Capitalization of entertainment literary
00 18 46 42 33 33 32
and artistic originals Expanded set of ownership transfer costs
00 ndash27 ndash22 ndash45 ndash45 ndash47 ndash48
for residential fixed assets 00 ndash41 ndash71 ndash101 ndash75 ndash74 ndash86 Statistical
Improved measures of IRS section 179 00 ndash352 ndash147 ndash1007 ndash620 66 329
expensing 00 ndash117 ndash131 ndash211 ndash187 ndash164 ndash170 Other statistical Source of revision by component
00 ndash235 ndash16 ndash797 ndash432 230 499
Farm 00 ndash02 14 03 17 180 192 Definitional 00 00 00 00 00 00 00 Statistical 00 ndash02 14 03 17 180 192
Nonfarm 00 ndash401 ndash207 ndash1115 ndash724 ndash202 35 Definitional
Capitalization of research and 00 ndash51 ndash46 ndash105 ndash87 ndash88 ndash102
development Capitalization of entertainment literary
00 18 46 42 33 33 32
and artistic originals Expanded set of ownership transfer costs
00 ndash27 ndash22 ndash45 ndash45 ndash47 ndash48
for residential fixed assets 00 ndash41 ndash71 ndash101 ndash75 ndash74 ndash86 Statistical
Improved measures of IRS section 179 00 ndash350 ndash161 ndash1010 ndash637 ndash114 137
expensing 00 ndash117 ndash131 ndash211 ndash187 ndash164 ndash170 Other statistical 00 ndash233 ndash30 ndash800 ndash449 50 307
1982 the revisions to nonfarm proprietorsrsquo income are due to the capitalization of RampD and of entertainment originals and to the expanded set of ownership transfer costs for residential fixed assets these revisions are all downward and are generally small (less than $2 bilshylion) For 1982ndash2012 in addition to the changes noted above the revisions also reflect the improved measures of the capital gains and losses attributable to corporate partners and to other statistical revisions
For farm proprietorsrsquo income the revisions are less than $7 billion in absolute value until 2011 For 2011 and for 2012 the upward revisions reach almost $20 billion reflecting the incorporation of revised source data from USDA
Rental income of persons with CCAdj The revishysions to this component are zero or very small (less than $1 billion) and are downward until 1976 for 1976ndash2002 they are downward and larger reaching a peak for 2000 (over $27 billion) (table 15) For 2003ndash2012 the revisions are upward and large reachshying a peak in 2012 (over $78 billion)
Prior to 2002 the downward revisions are due prishymarily to expanding the set of ownership transfer costs
Table 15 Revisions to Rental Income of Persons With Capital Consumption Adjustment
[Billions of dollars]
1959 1997 2002 2007 2010 2011 2012
Total revision ndash04 ndash245 ndash14 457 536 747 786 Definitional ndash06 ndash194 ndash266 ndash637 ndash599 ndash534 ndash477
Expanded set of ownership transfer costs for residential fixed assets ndash06 ndash194 ndash266 ndash637 ndash599 ndash534 ndash477
Statistical 02 ndash51 252 1094 1135 1281 1263 Improved mortgage interest paid estimates 00 ndash53 134 966 920 954 833 Other statistical 02 03 118 128 216 328 430
27 September 2013 SURVEY OF CURRENT BUSINESS
for residential fixed assets Statistical revisions includshying the improved method for estimating mortgage inshyterest paid and new and revised source data also contribute to the downward revisions For 2001 and 2002 the statistical revisions are upward but are more than offset by the downward impact of expanding the set of ownership transfer costs for residential fixed asshysets For 2003ndash2012 the increasing upward statistical revisions especially the improved estimates of mortshygage interest paid outweigh the downward revisions due to the expanded set of ownership transfer costs and result in upward revisions to rental income
Corporate profits with IVA and CCAdj Corposhyrate profits is revised up for 1929ndash1986 down for 1987ndash2001 and up for 2002ndash2012 (table 16) Revisions are less than $2 billion until 1963 and are less than $5 billion until 1972 For all years revisions are almost exshyclusively to profits of domestic industries revisions to profits of the rest of the world begin with 1999 and are generally small (exceeding $2 billion in absolute value for only 4 years)
For 1972ndash1986 upward revisions which reach a peak for 1981 and 1982 (about $24 billion for both years) are primarily due to definitional changesmdashthe
Table 16 Revisions to Corporate Profits With Inventory Valuation and Capital Consumption Adjustments
[Billions of dollars]
1959 1997 2002 2007 2010 2011 2012
Total revision 17 ndash190 350 184 382 507 589 Definitional
Capitalization of research and 17 137 102 320 511 594 626
development Capitalization of entertainment literary
12 217 140 353 271 292 303
and artistic originals Expanded set of ownership transfer
05 150 149 179 171 176 165
costs for residential fixed assets Accrual accounting for defined benefit
00 ndash06 ndash11 ndash16 ndash11 ndash11 ndash13
pension plans 00 ndash225 ndash175 ndash196 80 137 172 Statistical
Improved distribution of regulated investment companies investment
00 ndash327 248 ndash136 ndash129 ndash87 ndash37
income 1 00 ndash254 22 ndash428 ndash249 ndash19 Other statistical Source of revision by component
00 ndash73 226 291 121 ndash68
Profits before tax (without IVA and CCAdj) 22 ndash49 236 100 185 ndash67 278 Definitional
Capitalization of research and 17 100 59 251 436 540 621
development Capitalization of entertainment literary
and artistic originals Expanded set of ownership transfer
17 325 235 447 356 403 449
costs for residential fixed assets Accrual accounting for defined benefit
00 00 00 00 00 00 00
pension plans 00 ndash225 ndash175 ndash196 80 137 172 Statistical
Improved distribution of regulated investment companies investment
05 ndash149 177 ndash151 ndash251 ndash607 ndash343
income 1 00 ndash254 22 ndash428 ndash249 ndash19 Other statistical 05 104 155 277 ndash02 ndash589
IVA 00 00 87 77 ndash23 66 09 Definitional 00 00 00 00 00 00 00 Statistical 00 00 87 77 ndash23 66 09
CCAdj ndash05 ndash142 27 06 219 510 301 Definitional
Capitalization of research and ndash05 ndash114 ndash106 ndash110 ndash97 ndash123 ndash161
development Capitalization of entertainment literary
and artistic originals Expanded set of ownership transfer
ndash05 ndash108 ndash95 ndash95 ndash86 ndash112 ndash148
costs for residential fixed assets 00 ndash06 ndash11 ndash16 ndash11 ndash11 ndash13 Statistical 00 ndash28 133 116 316 633 462
CCAdj Capital consumption adjustment IVA Inventory valuation adjustment 1 Revisions for 2012 are not shown because these data were not previously published
capitalization of RampD and of entertainment originals and the adoption of accrual-based measures for deshyfined benefit pension plans These upward revisions are partly offset by downward revisions due to statistishycal changes which are generally less than $5 billion
For 1987ndash2001 revisions are downward reaching over $38 billion for 2000 Until 1992 the primary cause of the revisions is the adoption of accrual-based measures for defined benefit pension plans these revishysions are supplemented by the smaller downward revishysions due to statistical changes and are only partly offset by the upward revisions due to the capitalization of RampD and of entertainment originals For 1992 forshyward the downward revisions are also due to the imshyproved distribution of the income of regulated investment companies
For 2002ndash2012 the upward revisions primarily reshyflect the capitalization of RampD and of entertainment originals as well as revisions due to certain statistical changes including new and revised IRS tabulations of corporate income tax returns and improved measures of misreported income based on data from the IRS These upward revisions are only partly offset by downshyward revisions that reflect the improved distribution of regulated investment company income and the someshytimes downward impacts of the accrual-based meashysures for defined benefit pension plans
Personal income and outlays (account 3) Personal income Revisions are $1 billion or larger beshyginning with 1940 and reach $10 billion by 1957 The revisions are upward for each year except 2008 which is revised down almost $30 billion The largest upward revision is for 2012 (almost $313 billion) (table 17)
Compensation of employees This component conshysists of wages and salaries and supplements to wages and salaries received by US residents including wages and salaries received from the rest of the world The sources of revision to this aggregate are the same as those already discussed in the section ldquoCompensation of employees paidrdquo but they also include the impacts of introducing accrual-based measures of wages and salaries The sources of revision to supplements are the same as those already discussed
Wages and salaries are revised by less than $1 billion in absolute value until 1992 for 1992ndash2004 revisions are of mixed sign (ranging from ndash$8 billion to about $6 billion) The revisions generally reflect offsetting efshyfects from the adoption of accrual-based measures of wages and salaries and from statistical changes For 2005ndash2009 the revisions to wages and salaries primarshyily reflect statistical revisions including the updated measures of misreporting the impacts of the adoption of accrual-based measures are of mixed sign and are
28 Improved NIPA Estimates September 2013
fairly small For 2010ndash2012 the revisions are due exshyclusively to statistical changes revisions for 2010 and 2011 are downward (reaching over $27 billion for 2010) and for 2012 the revision is upward (almost $21 billion)
Personal income receipts on assets This aggregate consists of personal interest income and personal divishydend income Personal interest income consists of monetary and imputed interest received by persons from all sources and it is calculated as net interest plus interest paid by persons and interest paid by governshyment less interest received by government
Revisions to personal interest income begin with 1929 but are less than $5 billion until 1958 Thereafter
revisions are upward and generally increase for most years The largest upward revision is $219 billion for 2012 For most years the upward revisions are largely accounted for by the adoption of accrual-based meashysures for defined benefit pension plans for 2002ndash2012 these revisions are partly offset by downward revisions resulting from the improved measures of mortgage inshyterest paid The revisions also reflect the impact of the improved measurement of financial services (beginshyning with 1985) of the improved distribution of the income of regulated investment companies (beginning with 1992) and of other statistical changes (which grow to over $10 billion by 2000 and reach about $97 billion for 2011)
Table 17 Personal Income and Its Disposition [Billions of dollars]
1959 1997 2002 2007 2010 2011 2012 1959 1997 2002 2007 2010 2011 2012
Total revision 109 743 894 834 1133 2440 3127 Less Personal current taxes 00 00 ndash01 ndash08 ndash33 60 176 Definitional 107 634 931 761 1297 1147 1260 Definitional 00 00 00 00 00 00 00
Capitalization of research and development 00 18 46 42 33 33 32 Statistical 00 00 ndash01 ndash08 ndash33 60 176 Capitalization of entertainment literary and
artistic originals Expanded set of ownership transfer costs for
residential fixed assets Accrual accounting for defined benefit
pension plans Accrual accounting for wages and salaries
Statistical Improved measurement of financial services Improved distribution of regulated investment
companies investment income Improved measures of IRS section 179
expensing Improved mortgage interest paid estimates Other statistical
Source of revision by component
00
ndash07
113 00 02 00
00
00 00 02
ndash27
ndash235
908 ndash29 109 ndash07
336
ndash117 00
ndash102
ndash22
ndash337
1244 00
ndash37 ndash148
ndash11
ndash131 00
252
ndash45
ndash738
1566 ndash63
73 ndash83
710
ndash211 00
ndash344
ndash45
ndash674
1984 00
ndash164 ndash94
532
ndash187 00
ndash414
ndash47
ndash608
1770 00
1293 12
357
ndash164 00
1087
ndash48
ndash563
1839 00
1867 05
ndash263
ndash170 00
2296
Equals Disposable personal income Definitional
Capitalization of research and development Capitalization of enter tainment literary and
artistic originals Expanded set of ownership transfer costs for
residential fixed assets Accrual accounting for defined benefit pension
plans Accrual accounting for wages and salaries
Statistical Improved measurement of financial services Improved distribution of regulated investment
companies investment income Improved measures of IRS section 179
expensing
108 107 00
00
ndash07
113 00 01 00
00
00
743 634 18
ndash27
ndash235
908 ndash29 109 ndash07
336
ndash117
895 931 46
ndash22
ndash337
1244 00
ndash36 ndash148
ndash11
ndash131
843 761 42
ndash45
ndash738
1566 ndash63
82 ndash83
710
ndash211
1166 1297
33
ndash45
ndash674
1984 00
ndash131 ndash94
532
ndash187
2381 1147
33
ndash47
ndash608
1770 00
1234 12
357
ndash164
2950 1260
32
ndash48
ndash563
1839 00
1690 05
ndash263
ndash170 Compensation of employees 53 461 311 369 ndash27 ndash167 187 Improved mortgage interest paid estimates 00 00 00 00 00 00 00
Definitional 53 391 315 488 35 ndash134 ndash234 Other statistical 01 ndash102 253 ndash335 ndash381 1028 2119 Accrual accounting for defined benefit
pension plans 53 421 315 550 35 ndash134 ndash234 Less Personal outlays ndash02 25 ndash322 157 491 592 981 Accrual accounting for wages and salaries 00 ndash29 00 ndash63 00 00 00 Definitional ndash01 ndash45 ndash57 ndash51 ndash79 ndash108 ndash110
Statistical 00 70 ndash04 ndash119 ndash62 ndash33 421 Capitalization of research and development ndash01 ndash45 ndash57 ndash51 ndash79 ndash108 ndash110
Proprietorsrsquo income with IVA and CCAdj Definitional
Capitalization of research and development
00 00 00
ndash403 ndash51 18
ndash193 ndash46
46
ndash1112 ndash105
42
ndash707 ndash87 33
ndash22 ndash88 33
226 ndash102
32
Statistical Improved measurement of financial services Other statistical
ndash01 00
ndash01
70 ndash07
78
ndash265 ndash148 ndash118
208 ndash83 291
571 ndash94 666
702 12
690
1091 05
1086
Capitalization of entertainment literary and Personal consumption expenditures ndash02 ndash99 ndash539 ndash279 ndash138 ndash172 300 artistic originals 00 ndash27 ndash22 ndash45 ndash45 ndash47 ndash48 Definitional ndash01 ndash45 ndash57 ndash51 ndash79 ndash108 ndash110
Expanded set of ownership transfer costs for Capitalization of research and development ndash01 ndash45 ndash57 ndash51 ndash79 ndash108 ndash110 residential fixed assets 00 ndash41 ndash71 ndash101 ndash75 ndash74 ndash86 Statistical ndash01 ndash54 ndash482 ndash228 ndash59 ndash64 410
Statistical 00 ndash352 ndash147 ndash1007 ndash620 66 329 Improved measurement of financial services 00 ndash73 ndash193 ndash157 ndash364 ndash300 ndash295 Improved measures of IRS section 179 Other statistical ndash01 19 ndash289 ndash71 305 236 705
expensing 00 ndash117 ndash131 ndash211 ndash187 ndash164 ndash170 Personal interest payments 00 124 217 450 670 800 757 Other statistical 00 ndash235 ndash16 ndash797 ndash432 230 499 Definitional 00 00 00 00 00 00 00
Rental income of persons with CCAdj ndash04 ndash245 ndash14 457 536 747 786 Statistical 00 124 217 450 670 800 757 Definitional ndash06 ndash194 ndash266 ndash637 ndash599 ndash534 ndash477 Improved measurement of financial services 00 66 45 74 269 312 299
Expanded set of ownership transfer costs for Other statistical 00 58 172 376 401 488 458 residential fixed assets
Statistical Improved mortgage interest paid estimates Other statistical
ndash06 02 00 02
ndash194 ndash51 ndash53
03
ndash266 252 134 118
ndash637 1094 966 128
ndash599 1135 920 216
ndash534 1281 954 328
ndash477 1263 833 430
Personal current transfer payments Definitional Statistical
00 00 00
00 00 00
00 00 00
ndash14 00
ndash14
ndash40 00
ndash40
ndash34 00
ndash34
ndash76 00
ndash76
Personal income receipts on assets Definitional
Accrual accounting for defined benefit pension plans
Statistical Improved measurement of financial services Improved distribution of regulated investment
companies investment income Improved mortgage interest paid estimates Other statistical
Personal current transfer receipts Definitional Statistical
60 60
60 00 00
00 00 00 00 00 00
930 487
487 443 ndash07
336 53 60 00 00 00
808 928
928 ndash120 ndash148
ndash11 ndash134
172 ndash18
00 ndash18
1096 1015
1015 81
ndash83
710 ndash966
419 43 00 43
1413 1948
1948 ndash535 ndash94
532 ndash920
ndash53 ndash74 00
ndash74
1995 1904
1904 91 12
357 ndash954
675 ndash123
00 ndash123
2088 2073
2073 15 05
ndash263 ndash833 1106 ndash168
00 ndash168
Equals Personal saving Definitional
Capitalization of research and development Capitalization of enter tainment literary and
artistic originals Expanded set of ownership transfer costs for
residential fixed assets Accrual accounting for defined benefit pension
plans Accrual accounting for wages and salaries
Statistical Improved measurement of financial services Improved distribution of regulated investment
companies investment income
110 108 01
00
ndash07
113 00 02 00
00
718 679 64
ndash27
ndash235
908 ndash29
39 00
336
1217 988 103
ndash22
ndash337
1244 00
229 00
ndash11
685 812 93
ndash45
ndash738
1566 ndash63
ndash127 00
710
675 1377 112
ndash45
ndash674
1984 00
ndash702 00
532
1788 1256 141
ndash47
ndash608
1770 00
532 00
357
1969 1370 142
ndash48
ndash563
1839 00
599 00
ndash263 Less Contributions for government social Improved measures of IRS section 179
insurance domestic 00 00 00 19 08 ndash11 ndash08 expensing 00 ndash117 ndash131 ndash211 ndash187 ndash164 ndash170 Definitional 00 00 00 00 00 00 00 Improved mortgage interest paid estimates 00 00 00 00 00 00 00 Statistical 00 00 00 19 08 ndash11 ndash08 Other statistical 02 ndash180 370 ndash627 ndash1046 339 1032
CCAdj Capital consumption adjustment IVA Inventory valuation adjustment
29 September 2013 SURVEY OF CURRENT BUSINESS
The revisions to personal dividend income begin with 1991 and are upward for most years except for notable downward revisions for 2010 and 2012 The largest upward revision is for 2007 (over $24 billion) The upward revisions primarily reflect the impact of the improved distribution of the income of regulated investment companies For 2010 personal dividend income is revised down by about $37 billion the downward impacts of other statistical changes more than offset the upward revision from the improved disshytribution of the income of regulated investment comshypanies For 2012 personal dividend income is revised down by about $10 billion reflecting the impact of stashytistical changes
Personal current transfer receipts This aggregate consists of government social benefits to persons and business current transfer payments to persons (net) The revisions begin with a small downward revision for 2002 revisions are upward and less than $5 billion for 2003ndash2009 For 2010ndash2012 revisions are downshyward and larger (almost $17 billion for 2012) The reshyvisions reflect the incorporation of new and revised source data for government social benefits and for business current transfer payments to persons
Contributions for government social insurance domestic This component is deducted in the calculashytion of personal income and consists of both personal and employer contributions The revisions begin with 2003 are of mixed sign are less than $2 billion in absoshylute value throughout the period and reflect new and revised source data
Personal current taxes The revisions to personal current taxes begin with 2002 are of mixed sign and are less than $5 billion except for 2011 and 2012 ($6 billion and over $17 billion respectively) The revishysions reflect new and revised source data particularly new and revised Census Bureau government finances data
Disposable personal income (DPI) The pattern of revisions to DPI (which is equal to personal income less personal current taxes) primarily reflects the revishysions to personal income Through 1949 the revisions do not exceed $5 billion thereafter the revisions are generally increasing with only one downward revision for 2008 (about $29 billion) The largest upward revishysion is for 2012 ($295 billion)
Personal outlays This component consists of PCE personal interest payments and personal current transfer payments The revisions to personal outlays are generally downward and are less than $5 billion through 1984 thereafter the revisions are of mixed sign range from about ndash$32 billion for 2002 to about $98 billion for 2012 and primarily reflect revisions to
PCE and to personal interest payments PCE is revised down for most years but a notable exception is an upshyward revision for 2012 of $30 billion
For 1985ndash2012 personal interest payments are reshyvised up by steadily increasing amounts primarily reshyflecting the improved measurement of financial services and improved measures of interest payments on consumer loans based on data on interest rates and consumer credit outstanding from the Federal Reserve Board
Personal sav ing This component is the difference between DPI and personal outlays The revisions do not exceed $5 billion until 1950 thereafter personal saving is revised up for all years by generally increasing amounts except for 2008 which is revised down $41 billion the largest upward revision is for 2012 (about $197 billion)
The revisions to personal saving result in correshysponding revisions to the personal saving ratemdashpershysonal saving as a percentage of DPI The revisions to the saving rate reach 10 percentage point by 1938 and peak at 33 percentage points for 1971
Government current receipts and expenditures (account 4) Government current receipts is the sum of current tax receipts contributions for government social insurshyance income receipts on assets current transfer reshyceipts and current surplus of government enterprises Current expenditures is the sum of consumption exshypenditures current transfer payments interest payshyments and subsidies Net government saving is the difference between current receipts and current expenshyditures
Federal government Revisions to current receipts begin with 1959 are downward and are less than $2 billion through 1979 For 1980ndash2009 the revisions are upward and range from less than $10 billion to about $8 billion For 2010ndash2012 the revisions are downward and range from about $3 billion to about $20 billion (table 18) The upward revisions through 2009 mostly reflect the impact on the current surplus of government enterprises of incorporating accrual-based measures for defined benefit pension plans For 2010ndash2012 downward revisions to taxes on corporate income reflect new and revised IRS data as well as new federal tax collections data and the downward revishysions to current transfer receipts reflect in part the reshyclassification of cross-border fines and penalties as negative current transfer payments to the rest of the world (net) these downward revisions are partly offset by upward revisions to the current surplus of governshyment enterprises that primarily reflect the impact of
30 Improved NIPA Estimates September 2013
Table 18 Revisions to Government Current Receipts and Expenditures ward revisions are offset to varying degrees over time [Billions of dollars] by downward revisions to federal consumption expenshy
1959 1997 2002 2007 2010 2011 2012
Federal Current receipts ndash04 54 65 61 ndash37 ndash29 ndash204
Definitional Accrual accounting for defined benefit
ndash04 62 62 45 38 31 35
pension plans ndash04 62 62 45 38 31 35 Statistical
Improved measurement of financial 00 ndash08 03 16 ndash75 ndash60 ndash239
services 00 00 ndash01 00 00 00 00 Other statistical 00 ndash08 04 16 ndash74 ndash60 ndash238
Current expenditures 68 365 246 275 179 79 150 Definitional
Capitalization of research and 66 376 280 214 218 214 284
development Accrual accounting for defined benefit
ndash25 09 ndash132 ndash204 ndash150 ndash113 ndash51
pension plans 91 367 411 418 368 327 335 Accrual accounting for wages and salaries 00 00 00 00 00 00 00
Statistical Improved measurement of financial
02 ndash11 ndash34 61 ndash39 ndash135 ndash134
services 00 00 ndash01 00 00 00 00 Other statistical 02 ndash11 ndash33 61 ndash39 ndash135 ndash134
Net federal government saving ndash72 ndash311 ndash181 ndash215 ndash215 ndash109 ndash354 Definitional
Capitalization of research and ndash70 ndash314 ndash218 ndash168 ndash181 ndash183 ndash250
development Accrual accounting for defined benefit
25 ndash09 132 204 150 113 51
pension plans ndash95 ndash305 ndash349 ndash372 ndash331 ndash296 ndash300 Accrual accounting for wages and salaries 00 00 00 00 00 00 00
Statistical Improved measurement of financial
ndash02 03 37 ndash47 ndash34 74 ndash104
services 00 00 00 00 00 00 00 Other statistical
State and local
ndash02 03 37 ndash47 ndash34 74 ndash104
Current receipts ndash02 ndash137 ndash243 ndash225 ndash439 ndash345 ndash301 Definitional
Accrual accounting for defined benefit ndash01 ndash28 ndash55 ndash66 ndash76 ndash70 ndash67
pension plans ndash01 ndash28 ndash55 ndash66 ndash76 ndash70 ndash67 Statistical
Improved measurement of financial ndash01 ndash109 ndash188 ndash159 ndash363 ndash275 ndash234
services 00 ndash01 ndash10 ndash06 ndash28 ndash28 ndash27 Other statistical ndash01 ndash108 ndash178 ndash153 ndash335 ndash248 ndash207
Current expenditures 13 209 426 625 1037 767 936 Definitional
Capitalization of research and 17 337 640 896 1616 1505 1615
development Accrual accounting for defined benefit
00 ndash13 ndash24 ndash35 ndash41 ndash36 ndash27
pension plans 17 350 664 931 1657 1541 1643 Accrual accounting for wages and salaries 00 00 00 00 00 00 00
Statistical Improved measurement of financial
ndash04 ndash128 ndash214 ndash271 ndash579 ndash738 ndash679
services 00 ndash01 ndash10 ndash06 ndash28 ndash28 ndash27 Other statistical ndash04 ndash127 ndash204 ndash265 ndash551 ndash710 ndash653
Net state and local government saving ndash16 ndash346 ndash668 ndash849 ndash1476 ndash1111 ndash1237 Definitional
Capitalization of research and ndash18 ndash365 ndash695 ndash961 ndash1692 ndash1574 ndash1683
development Accrual accounting for defined benefit
00 13 24 35 41 36 27
pension plans ndash18 ndash378 ndash719 ndash997 ndash1733 ndash1611 ndash1710 Accrual accounting for wages and salaries 00 00 00 00 00 00 00
Statistical Improved measurement of financial
02 19 27 112 216 463 446
services 00 00 00 00 00 00 00 Other statistical 02 19 27 112 216 463 446
the adoption of accrual-based measures for defined benefit pension plans13
Federal government current expenditures is revised up for all years and the revisions generally increase until 1996 when they begin to increase more slowly revisions range from less than $1 billion before 1941 to almost $40 billion for 1995 The upward revisions genshyerally result from the impact of the adoption of acshycrual-based measures for defined benefit pension plans on interest paid by the federal government these upshy
13 As part of the efforts to modernize the ITAs BEA is now using data for specific fines to identify those that are paid by foreign companies and classishyfying them as part of transfer payments to the rest of the world (net) Previshyously these fines and penalties were not captured in the ITAs The source data underlying the previous NIPA estimates of fines received by the federal government included these data but they were not distinguished from fines paid by domestic businesses
ditures that reflect the impact of reclassifying RampD expenditures from consumption to investment (particshyularly in the mid-1980s and the first half of the 2000s)
Federal government net saving is revised down for all years as the upward revisions to current expendishytures either outweigh upward revisions to or suppleshyment downward revisions to current receipts The downward revisions to federal government saving range from less than $1 billion for 1929 to over $35 bilshylion for 2012
State and local government State and local current receipts is revised down for all years by generally inshycreasing amounts ranging from less than $1 billion for 1929 to nearly $44 billion for 2010 Prior to 2002 the downward revisions primarily reflect the incorporashytion of accrual-based measures for defined benefit pension plans (which generally increases compensashytion costs for government enterprises and lowers their surplus) and the recognition of RampD as investment (which reduces grants-in-aid from the federal governshyment (see the box ldquoGovernment Research and Develshyopmentrdquo)) For 2002ndash2012 the revisions also reflect the incorporation of new and revised data from the Census Bureau
State and local government current expenditures is revised up for 1929ndash1981 down for 1982ndash1988 and up for 1989ndash2012 For 1929ndash1981 and 1989ndash2012 the upward revisions reflect the impact on compensation and on interest payments of incorporating accrual-based measures for defined benefit pension plans these revisions are partly offset by downward revisions from other sources including large downward revishysions for 2010ndash2012 that result from the incorporation of new and revised data from the Census Bureau (table 18) For 1982ndash1988 the downward revisions reflect the impact on compensation of incorporating accrual-based measures for defined benefit pension plans14
State and local government net saving is revised down for all years except for 1987 when the revision is slightly upward (less than $1 billion) The largest downward revision is about $159 billion for 2009
Foreign transactions (accounts 5 and 7) Current receipts from the rest of the world This agshygregate consists of exports of goods and services and income receipts from the rest of the world (The revishysions to exports of goods and services were discussed previously) The revisions to income receipts begin
14 The pattern of revisions to state and local compensation is driven prishymarily by the funding status of state and local pension plans See ldquoPreview Changes in Definitions and Presentationsrdquo
31 September 2013 SURVEY OF CURRENT BUSINESS
with 1985 and are upward and less than $5 billion through 2010 The largest revisions are about $19 bilshylion for 2011 and about $36 billion for 2012 (table 19) For 1985ndash1998 the revisions are due solely to the improved measurement of financial services For 1999ndash2010 the revisions are primarily caused by the incorporation of revised estimates from the ITAs and the improved measurement of financial services in fairly similar magnitudes the larger revisions for 2011 and 2012 are due primarily to the incorporation of the revised ITA data (See the box ldquoDiscontinuities in the Estimates of Foreign Transactions in the National Inshycome and Product Accountsrdquo)
Current payments to the rest of the world (net) This aggregate consists of imports of goods and sershyvices income payments to the rest of the world and current taxes and transfer payments to the rest of the world (net) (The revisions to imports of goods and services were discussed previously) The revisions to income payments begin with 1985 they are of mixed
sign and are less than $2 billion in absolute value until 1999 For 1999ndash2007 the revisions are upward and range from about $1 billion to about $7 billion For 2008 and 2009 the revisions are downward and are less than $4 billion For 2010ndash2012 revisions are upward and larger the largest revision is about $26 billion for 2012 (table 19)
For 1985ndash1998 the revisions are due solely to the improved measurement of financial services For 1999ndash2010 the revisions are caused primarily by the incorporation of revised estimates from the ITAs and by the improved measurement of financial services the larger revisions for 2011 and 2012 are due primarily to the incorporation of revised ITA data
The revisions to current taxes and transfer payshyments to the rest of the world (net) begin with 2004 They are generally downward and exceed $1 billion in absolute value for only 2 yearsmdash2010 (over $4 billion) and 2012 (over $12 billion) These revisions are due to the incorporation of revised estimates from the ITAs
Discontinuities in the Estimates of Foreign Transactions in the National Income and Product AccountsThe revision schedule and release for successive vintages exports of goods and services (and for current-dollar of gross domestic product (GDP) and related estimates is GDP) the decline from 2009 to 2010 is overstated by $45 primarily determined by the availability of revised or billion The revisions to the ITAs for years prior to 2010 newly available source data This is also true for the other will be incorporated in a future update to the NIPAs accounts prepared by the Bureau of Economic Analysis including the international transactions accounts (ITAs)
Discontinuities in NIPA Foreign Transactions 2009ndash2010 which are the major source data underlying the NIPA [Billions of dollars] estimates of foreign transactions
Like the NIPAs the ITAs are revised annually the revishysions are typically released in June Annual updates to the NIPAs are typically released in July resulting in producshytion constraints that sometimes prevent incorporating the entire period of ITA revisions As a result a discontishynuity in the NIPA estimates exists between the years for which the revised ITA estimates have been incorporated and the years for which they have not been incorporated1
This yearrsquos comprehensive revision of the NIPAs released on July 31 2013 incorporated revised estimates of foreign transactions for 2010ndash2012 from the annual revision of the ITAs released in June2 However revisions to the data from the ITAs for the years prior to 2010 were not incorporated For most components of foreign transshyactions the revisions to the ITAs for 2010ndash2012 were incorporated at their ldquobest levelrdquo As a result there are discontinuities between the NIPA estimates for 2009 and those for 2010 (see the table) For current-dollar net
1 The differences between the ITAs and the NIPAs are shown in the lines for ldquostatistical differencesrdquo in NIPA table 43B ldquoRelation of Foreign Transactions in the NIPAs to the Corresponding Items in the ITAsrdquo
2 See Barbara H Berman and Jeffrey R Bogen ldquoAnnual Revision of the US International Transaction Accountsrdquo SURVEY OF CURRENT BUSIshyNESS 93 (July 2013) 43ndash54
2009 2010 Change from 2009 to 2010
Published Discontishynuity 1 Adjusted Published Adjusted
Net exports of goods and services ndash3922 ndash45 ndash3967 ndash5185 ndash1263 ndash1218 Exports 15838 ndash08 15830 18435 2597 2605
Goods 10647 ndash03 10644 12784 2137 2140 Services 5191 ndash05 5186 5651 460 465
Imports 19760 37 19797 23620 3860 3823 Goods 15873 45 15918 19512 3639 3594 Services 3887 ndash08 3879 4108 221 229
Net receipts of income 1472 39 1511 2060 588 549 Income receipts 6437 52 6489 7200 763 711
Wage and salary receipts 55 03 58 59 04 01 Income receipts on assets 6382 49 6431 7141 759 710
Interest 1445 06 1451 1295 ndash150 ndash156 Dividends Reinvested earnings of
US direct investment
2309 ndash63 2246 2480 171 234
abroad 2628 107 2735 3366 738 632 Income payments 4965 13 4978 5141 176 163
Wage and salary payments 133 11 144 140 07 ndash04 Income payments on assets 4832 02 4834 5001 169 167
Interest 3423 02 3425 3107 ndash316 ndash318 Dividends Reinvested earnings of
foreign direct investment in the United
1190 00 1190 1266 76 76
States Current taxes and transfer
payments to the rest of the
219 00 219 628 409 409
world (net) Addenda
1361 ndash09 1352 1420 59 68
Gross domestic product 144179 ndash45 144134 149583 5404 5449 Gross national product 145651 ndash06 145645 151642 5991 5997
NIPAs National income and product accounts 1 Equals revisions to the US international transactions accounts that have not been carried back in
the NIPAs at this time
32 Improved NIPA Estimates September 2013
Table 19 Revisions to Foreign Transactions [Billions of dollars]
1959 1997 2002 2007 2010 2011 2012
Current receipts from the rest of the world 00 ndash01 40 86 26 261 482 Definitional 00 00 00 00 00 00 00 Statistical 00 ndash01 40 86 26 261 482
Improved measurement of financial services 00 ndash01 ndash12 ndash07 ndash09 ndash04 ndash10 Other statistical 00 00 52 93 35 265 492
Source of revision by component Exports of goods and services 00 ndash06 17 40 ndash09 70 119
Definitional 00 00 00 00 00 00 00 Statistical 00 ndash06 17 40 ndash09 70 119
Improved measurement of financial services 00 ndash07 ndash17 ndash15 ndash29 ndash32 ndash36 Other statistical 00 01 34 55 20 102 155
Income receipts 00 06 23 45 35 191 363 Definitional 00 00 00 00 00 00 00 Statistical 00 06 23 45 35 191 363
Improved measurement of financial services 00 06 06 08 20 28 25 Other statistical 00 00 17 37 15 163 338
Current payments to the rest of the world 00 ndash01 23 16 83 172 131 Definitional 00 00 00 00 00 00 00 Statistical 00 ndash01 23 16 83 172 131
Improved measurement of financial services 00 ndash01 ndash12 ndash07 ndash09 ndash04 ndash10 Other statistical 00 00 35 23 92 176 141
Source of revision by component Imports of goods and services 00 00 ndash05 07 59 76 ndash09
Definitional 00 00 00 00 00 00 00 Statistical 00 00 ndash05 07 59 76 ndash09
Income payments 00 ndash01 28 14 69 103 264 Definitional 00 00 00 00 00 00 00 Statistical 00 ndash01 28 14 69 103 264
Improved measurement of financial services 00 ndash01 ndash12 ndash07 ndash09 ndash04 ndash10 Other statistical 00 00 40 21 78 107 274
Current taxes and transfer payments (net) 00 00 00 ndash05 ndash45 ndash06 ndash125 Definitional 00 00 00 00 00 00 00 Statistical 00 00 00 ndash05 ndash45 ndash06 ndash125
Balance on current account NIPAs 00 00 17 69 ndash57 88 351 Definitional 00 00 00 00 00 00 00 Statistical 00 00 17 70 ndash57 89 351
Improved measurement of financial services 00 00 00 00 00 00 00 Other statistical 00 00 17 70 ndash57 89 351
Addenda Net lending or net borrowing (ndash) NIPAs 00 00 17 69 ndash57 88 349
Definitional 00 00 00 00 00 00 00 Statistical 00 00 17 69 ndash57 88 349 Balance on current account NIPAs 00 00 17 69 ndash57 88 351
Definitional 00 00 00 00 00 00 00 Statistical 00 00 17 70 ndash57 89 351
Less Capital account transactions (net) 00 00 00 00 00 00 01 Definitional 00 00 00 00 00 00 00 Statistical 00 00 00 00 00 00 01
NIPAs National income and product accounts
Domestic capital (account 6) Gross saving consists of net saving and CFC Net savshying consists of net private saving and net government saving The revisions to gross saving are upward and generally grow larger throughout the period of revishysion they exceed $15 billion by 1960 and peak at over $650 billion for 2012 (table 20) For the entire period upward revisions to CFC (about $531 billion for 2012) dominate the revisions to gross saving Revisions to net saving are of mixed sign the largest downward revision is about $136 billion for 2008 and the largest upward revision is about $121 billion for 2012
Within net saving upward revisions to net private saving partly offset downward revisions to net governshyment saving for most years and primarily reflect the adoption of accrual accounting for defined benefit pension plans
The upward revisions to CFC for the entire period primarily reflect the capitalization of RampD and of enshytertainment originals and the expanded set of ownershy
ship transfer costs of these RampD has the largest effect ldquoNet lending or net borrowing NIPAsrdquo (or ldquonet
lendingrdquo) is the difference between the sum of gross saving and the statistical discrepancy and the sum of gross domestic investment and capital account transshyactions (net)
The revisions to net lending begin with 2000 and are upward for all years except for 2010 The revisions are less than $10 billion in absolute value except for 2012 which is revised up by about $35 billion
Annual Estimates of Real GDP and Real DPI
Real GDP Revisions to the year-to-year growth rates of real GDP are generally small for 59 of the 83 years since 1929 the revisions range from ndash01 percentage point to 01 percentage point and for only 6 years the revisions are greater than 03 percentage point in absolute value (tashyble 21)
The revisions to real GDP result from the following Revisions to the current-dollar components of GDP
such as those discussed above for which chained-dollar estimates are prepared by deflation
Revisions to the prices used to estimate components of real GDP by deflation
Revisions to the quantities used to estimate the components of real GDP by extrapolation or direct valuation In contrast changing the reference year (to 2009
from 2005) does not affect the percent changes in real GDP (It also does not affect the percent changes in the price indexes)
For 40 years the rates of growth of real GDP are reshyvised up (table 22) For 17 of these years the revisions are greater than 01 percentage point upward revisions to the percent change in current-dollar GDP play a role in 14 of these revisions downward revisions to the percent change in prices play a role in 10 of these revishysions The largest upward revision 06 percentage point occurs for 3 years 1941 1943 and 2012
For 16 years the rates of growth of real GDP are reshyvised down Seven of the revisions are larger than 01 percentage point downward revisions to the percent change in current-dollar GDP play a role in three of these revisions and upward revisions to prices play a role in five of these revisions Only one of the revisions is larger than 03 percentage point the growth rate for 1946 is revised down 07 percentage point primarily because of a relatively large upward revision to prices (11 percentage points) that is partly offset by a smaller upward revision to the rate of growth of current-dollar GDP
33 September 2013 SURVEY OF CURRENT BUSINESS
For 27 years the rates of growth of real GDP are un- For 1929ndash2012 the average annual growth rate of revised real GDP is revised up 01 percentage point (from
Table 20 Revisions to Saving and Investment [Billions of dollars]
1959 1997 2002 2007 2010 2011 2012 1959 1997 2002 2007 2010 2011 2012
Gross saving 140 2579 4278 4590 4843 6239 6518 Improved distribution of Definitional 141 2845 3693 4873 4986 5169 5322 regulated investment
Capitalization of research and companies investment development 114 2121 2657 3599 3895 4063 4155 income 00 336 ndash11 710 532 357 ndash263
Capitalization of enter tainment literary Improved measures of IRS and artistic originals 22 461 576 704 722 738 743 section 179 expensing 00 ndash117 ndash131 ndash211 ndash187 ndash164 ndash170
Expanded set of ownership transfer Improved mortgage interest costs for residential fixed assets 05 264 461 570 368 369 423 paid estimates 00 00 00 00 00 00 00
Accrual accounting for defined benefit Other statistical 02 ndash180 370 ndash627 ndash1046 339 1032 pension plans
Accrual accounting for wages and salaries
Statistical Improved measurement of financial
services Improved distribution of regulated
investment companies investment income
Improved measures of IRS section 179 expensing
Improved mor tgage interest paid estimates
00
00 ndash01
00
00
00
00
00
00 ndash266
00
00
ndash117
00
00
00 585
00
00
ndash131
00
00
00 ndash283
00
00
ndash211
00
00
00 ndash143
00
00
ndash187
00
00
00 1070
00
00
ndash164
00
00
00 1196
00
00
ndash170
00
Net government saving Definitional
Capitalization of research and development
Accrual accounting for defined benefit pension plans
Accrual accounting for wages and salaries
Statistical Improved measurement of
financial services Other statistical
ndash87 ndash87
26
ndash113
00 00
00 00
ndash657 ndash679
04
ndash683
00 22
00 22
ndash850 ndash913
156
ndash1068
00 63
00 63
ndash1064 ndash1130
239
ndash1369
00 66
00 66
ndash1691 ndash1873
191
ndash2064
00 182
00 182
ndash1219 ndash1758
149
ndash1907
00 539
00 539
ndash1591 ndash1932
78
ndash2010
00 341
00 341
Other statistical ndash01 ndash149 715 ndash73 45 1233 1366 Consumption of fixed capital 100 2762 3571 4969 5082 5158 5312 Source of revision by component Definitional 104 2679 3516 4808 4971 5077 5257
Net saving Net private saving
40 128
ndash183 474
708 1557
ndash378 686
ndash238 1454
1081 2301
1207 2798
Capitalization of research and development
Capitalization of entertainment 75 1836 2258 2914 3322 3481 3632
Elimination of the adjustment literary and ar tistic originals 17 338 449 570 596 608 626 converting wages to an accrual Expanded set of ownership transfer basis 00 29 00 63 00 00 00 costs for residential fixed assets 12 505 809 1324 1053 988 999
Undistributed corporate profits Statistical ndash04 83 55 161 111 81 55 with IVA and CCAdj Definitional
Capitalization of research and development
17 17
12
ndash273 137
217
341 102
140
ndash61 320
353
778 512
271
512 595
292
829 627
303
Gross domestic investment capital account transactions and net lending NIPAs 136 2841 3797 4912 5041 5383 5947
Capitalization of enter tainment Gross domestic investment 137 2841 3782 4843 5097 5296 5596 literary and artistic originals 05 150 149 179 171 176 165 Private 72 2069 2780 3485 3635 3772 4129
Expanded set of ownership Definitional 71 2069 2694 3508 3492 3659 3857 transfer costs for residential Capitalization of research and fixed assets 00 ndash06 ndash11 ndash16 ndash11 ndash11 ndash13 development 44 1344 1657 2233 2402 2552 2691
Accrual accounting for defined Capitalization of enter tainment benefit pension plans 00 ndash225 ndash175 ndash196 80 137 172 literary and ar tistic originals 22 461 576 704 722 738 743
Statistical 00 ndash410 239 ndash381 266 ndash83 202 Expanded set of ownership Improved distribution of transfer costs for residential
regulated investment fixed assets 05 264 461 570 368 369 423 companies investment Statistical 01 00 86 ndash23 143 113 272 income 00 ndash336 11 ndash710 ndash532 ndash357 263 Government 66 771 1001 1357 1463 1524 1467
Other statistical 00 ndash73 228 329 798 275 ndash61 Definitional 70 777 1000 1366 1493 1510 1465 Personal saving 110 718 1217 685 675 1788 1969 Capitalization of research and
Definitional 108 679 988 812 1377 1256 1370 development 70 777 1000 1366 1493 1510 1465 Capitalization of research and Statistical ndash04 ndash06 01 ndash09 ndash30 14 02
development Capitalization of enter tainment
literary and artistic originals Expanded set of ownership
01
00
64
ndash27
103
ndash22
93
ndash45
112
ndash45
141
ndash47
142
ndash48
Capital account transactions net Definitional Statistical
00 00 00
00 00 00
00 00 00
00 00 00
00 00 00
00 00 00
01 00 01
transfer costs for residential Net lending or net borrowing (ndash) NIPAs 00 00 17 69 ndash57 88 349 fixed assets ndash07 ndash235 ndash337 ndash738 ndash674 ndash608 ndash563 Definitional 00 00 00 00 00 00 00
Accrual accounting for defined Statistical 00 00 17 69 ndash57 88 349 benefit pension plans 113 908 1244 1566 1984 1770 1839 Improved measurement of financial
Accrual accounting for wages services 00 00 00 00 00 00 00 and salaries 00 ndash29 00 ndash63 00 00 00 Other statistical 00 00 17 69 ndash57 88 349
Statistical 02 39 229 ndash127 ndash702 532 599 Improved measurement of Statistical discrepancy ndash04 263 ndash480 322 198 ndash856 ndash572
financial services 00 00 00 00 00 00 00
CCAdj Capital consumption adjustment IVA Inventory valuation adjustment NIPAs National income and product accounts
Table 21 Distribution of Revisions to Percent Change in Real Gross Domestic Product Table 22 Summary of Revisions to Year-to-Year Growth Rates
Size of revision (percentage point)
ndash07 ndash03 ndash02 ndash01 00 01 02 03 04 06
Number of Real Gross Domestic Product for Selected Periods of revisions
1 2 4 9
27 23 5 7 2 3
1929ndash2012 1929ndash1959 1959ndash2002 2002ndash2012
In percentage points Average revision Average absolute revision Largest negative revision Largest positive revision
Number of Upward revisions Downward revisions Zero revisions
01 01
ndash07 06
40 16 27
00 02
ndash07 06
14 9 7
00 01
ndash02 03
20 6
17
02 02
ndash01 06
6 1 3
34 Improved NIPA Estimates September 2013
32 percent to 33 percent) (table 23) The period 1929ndash2012 can be usefully divided into three subpeshyriods 1929ndash1959 1959ndash2002 and 2002ndash2012 For 1929ndash1959 the average growth rate of real GDP is reshyvised up 01 percentage point (from 35 percent to 36 percent) for 1959ndash2002 the average growth rate in the revised estimates is the same as in the previously pubshylished estimates For 2002ndash2012 the average rate of
growth of real GDP is revised up 02 percentage point (from 16 percent to 18 percent)
For all three subperiods the contributions of gross private domestic investment and of government conshysumption expenditures and gross investment are reshyvised up (table 24) Additionally the contribution of net exports is unrevised or revised up very slightly (for 1929ndash1959 both exports and imports are unrevised
Table 23 Gross Domestic Product and Its Major Components Revisions to Average Annual Rates of Change Over Selected Periods
Current dollars Chained dollars Current dollars Chained dollars
Revised Previously published Revision Revised Previously
published Revision Revised Previously published Revision Revised Previously
published Revision
1929ndash2012 1929ndash1959
Gross domestic product Personal consumption expenditures
Goods Durable goods Nondurable goods
Services Gross private domestic investment
Fixed investment Nonresidential
Structures Equipment Intellectual proper ty products
Residential Change in private inventories
Net exports of goods and services Exports
Goods Services
Imports Goods Services
Government consumption expenditures and gross investment Federal
National defense Nondefense
State and local Addenda Gross domestic income Disposable personal income
63 62 55 60 54 67 62 63 64 54 63 87 58
74 71 88 77 78 75
72 82 84 80 68
63 62
62 62 55 60 54 67 60 61 62 55
56
74 71 88 77 78 75
72 82 85 78 68
62 62
01 00 00 00 00 00 02 02 02
ndash01
02
00 00 00 00 00 00
00 00
ndash01 02 00
00 00
33 32 31 45 25 33 37 33 38 13 45 63 21
48 47 53 47 48 44
35 48 49 45 27
33 32
32 31 31 45 25 33 36 32 37 13
19
48 47 53 47 48 44
35 46 49 42 27
32 31
01 01 00 00 00 00 01 01 01 00
02
00 00 00 00 00 00
00 02 00 03 00
01 01
55 48 47 52 45 50 55 57 52 41 56 83 67
46 39 82 47 42 64
88 130 147 96 61
55 50
54 48 47 52 45 50 53 55 49 41
67
46 39 82 47 42 64
85 129 146 93 61
55 49
01 00 00 00 00 00 02 02 03 00
00
00 00 00 00 00 00
03 01 01 03 00
00 01
36 29 27 32 25 32 36 28 24 10 29 59 36
27 21 51 28 22 46
62 104 119 66 29
36 31
35 29 27 32 25 32 36 27 21 10
36
27 21 51 28 22 46
61 104 121 68 29
35 30
01 00 00 00 00 00 00 01 03 00
00
00 00 00 00 00 00
01 00
ndash02 ndash02 00
01 01
Current dollars Chained dollars Current dollars Chained dollars
Revised Previously published Revision Revised Previously
published Revision Revised Previously published Revision Revised Previously
published Revision
1959ndash2002 2002ndash2012
Gross domestic product Personal consumption expenditures
Goods Durable goods Nondurable goods
Services Gross private domestic investment
Fixed investment Nonresidential
Structures Equipment Intellectual proper ty products
Residential Change in private inventories
Net exports of goods and services Exports
Goods Services
Imports Goods Services
Government consumption expenditures and gross investment Federal
National defense Nondefense
State and local Addenda Gross domestic income Disposable personal income
73 76 65 74 61 85 75 76 78 66 76
101 72
92 92 93
102 107 85
69 55 48 75 82
74 75
73 76 65 75 61 85 73 74 77 66
70
92 91 94
102 107 85
70 56 50 74 82
73 76
00 00 00
ndash01 00 00 02 02 01 00
02
00 01
ndash01 00 00 00
ndash01 ndash01 ndash02 01 00
01 ndash01
34 37 36 56 26 38 43 43 50 19 59 72 26
62 65 55 64 70 43
23 14 07 34 32
34 36
34 36 36 56 26 37 43 43 51 19
24
62 64 55 64 71 44
23 11 05 28 33
34 36
00 01 00 00 00 01 00 00
ndash01 00
02
00 01 00 00
ndash01 ndash01
00 03 02 06
ndash01
00 00
40 42 38 20 48 44 25 24 39 45 32 44
ndash24
81 80 85 67 67 68
42 58 60 54 33
39 42
40 41 38 21 47 43 23 21 37 51
ndash28
81 82 78 67 67 67
44 60 63 52 36
39 41
00 01 00
ndash01 01 01 02 03 02
ndash06
04
00 ndash02
07 00 00 01
ndash02 ndash02 ndash03
02 ndash03
00 01
18 20 25 38 17 18 09 07 26
ndash03 32 36
ndash44
52 52 53 31 30 35
09 30 31 28
ndash03
18 20
16 18 24 39 16 15 06 03 24
ndash01
ndash50
53 55 48 31 31 34
09 28 30 24
ndash03
16 18
02 02 01
ndash01 01 03 03 04 02
ndash02
06
ndash01 ndash03 05 00
ndash01 01
00 02 01 04 00
02 02
35 September 2013 SURVEY OF CURRENT BUSINESS
Table 24 Contributions to Percent Change in Real Gross Domestic Product Averages for Selected Periods
1929ndash2012 1929ndash1959 1959ndash2002 2002ndash2012
Revised Previously published Revision Revised Previously
published Revision Revised Previously published Revision Revised Previously
published Revision
Percent change at annual rate Gross domestic product 33 32 01 36 35 01 34 34 00 18 16 02
Percentage points at annual rates Personal consumption expenditures 201 204 ndash003 185 189 ndash004 227 233 ndash006 138 128 010
Goods 095 098 ndash003 103 105 ndash002 098 101 ndash003 058 059 ndash001 Durable goods 038 040 ndash002 027 027 000 048 050 ndash002 032 033 ndash001 Nondurable goods 056 058 ndash002 077 078 ndash001 049 051 ndash002 027 026 001
Services 106 107 ndash001 082 084 ndash002 130 132 ndash002 080 070 010 Gross private domestic investment 057 051 006 042 038 004 077 070 007 018 011 007
Fixed investment 051 046 005 032 028 004 074 067 007 014 006 008 Nonresidential 042 036 006 017 012 005 062 056 006 032 025 007
Structures 003 003 000 ndash002 ndash001 ndash001 007 008 ndash001 ndash001 000 ndash001 Equipment 027 013 038 019 Intellectual proper ty products 012 005 016 013
Residential 010 009 001 015 016 ndash001 012 011 001 ndash018 ndash019 001 Change in private inventories 006 006 000 010 011 ndash001 003 003 000 004 004 000
Net exports of goods and services ndash004 ndash004 000 ndash001 ndash001 000 ndash009 ndash010 001 011 011 000 Exports 034 035 ndash001 010 010 000 046 047 ndash001 057 059 ndash002
Goods 025 026 ndash001 006 006 000 035 036 ndash001 040 043 ndash003 Services 009 009 000 004 004 000 011 011 000 017 016 001
Imports ndash038 ndash039 001 ndash011 ndash011 000 ndash054 ndash056 002 ndash046 ndash048 002 Goods ndash031 ndash032 001 ndash006 ndash006 000 ndash047 ndash049 002 ndash037 ndash039 002 Services ndash007 ndash007 000 ndash006 ndash006 000 ndash007 ndash008 001 ndash009 ndash009 000
Government consumption expenditures and gross investment 086 083 003 162 156 006 050 047 003 018 016 002 Federal 062 057 005 142 135 007 015 011 004 022 020 002
National defense 050 047 003 126 119 007 006 004 002 014 014 000 Nondefense 012 010 002 016 016 000 009 007 002 007 006 001
State and local 025 026 ndash001 020 021 ndash001 034 036 ndash002 ndash004 ndash003 ndash001
and for the other two subperiods the revisions to exshyports offset the revisions to imports)
For 1929ndash1959 and for 1959ndash2002 the contribution of PCE is revised down reflecting downward revisions to spending for both goods and services In contrast for 2002ndash2012 the contribution of PCE is revised up (the upward revision is more than accounted for by services)
Real DPI The average annual rates of growth of real DPI for 1929ndash2012 (32 percent) and for 1929ndash1959 (31 pershycent) are 01 percentage point more than in the previshyously published estimates (table 23) The average annual rate of growth for 1959ndash2002 (36 percent) is the same as the previously published estimate For 2002ndash2012 the average annual rate of growth of real DPI is 20 percent 02 percentage point higher than in the previously published estimates
The revisions to real DPI result from the following Revisions to the current-dollar DPI Revisions to the implicit price deflator for PCE
which is used to deflate DPI For 38 years the percent change in real DPI is reshy
vised up For 17 of these years the revisions are greater than 02 percentage point the largest revisions are for 1942 (10 percentage point) for 2009 (23 percentage points) and for 2011 (11 percentage points) Upward revisions to current-dollar DPI play a role in 16 of these 17 revisions and downward revisions to the imshyplicit price deflator for PCE play a role in eight of these
revisions For 32 years the percent change in real DPI is reshy
vised down Twelve of the downward revisions are larger than 02 percentage point the largest revisions at 09 percentage point are for 1976 and for 2008 Downward revisions to current-dollar DPI play a role in all 12 of these revisions while the implicit price deshyflator for PCE plays a minimal role
For 13 years the percent change in real DPI is unreshyvised
For 1942 and for 1976 the revisions primarily reshyflect the adoption of accrual-based measures for deshyfined benefit pension plans For 2008 the downward revision primarily reflects the impacts of the improved distribution of income of regulated investment compashynies of the improved measurement of financial sershyvices and of other statistical changes For 2009 the upward revision primarily reflects the impacts of the adoption of accrual-based measures for defined benefit pension plans and of statistical changes including the improved measurement of financial services For 2011 the upward revision primarily reflects the incorporashytion of new and revised source data that underlie the components of personal income (see the section ldquoPershysonal income and outlays (account 3)rdquo above)
Annual Prices The revisions to the percent changes in the chain-type price indexes result from the incorporation of revised and newly available source data and of revised weights into the chain formula
36 Improved NIPA Estimates September 2013
For 1929ndash2012 and for the subperiods 1959ndash2002 and 2002ndash2012 the average annual rates of change in the price index for gross domestic purchases are 01 percentage point lower than in the previously pubshylished estimates (table 25) For 1929ndash1959 the average rate of change is unrevised
For 1929ndash2012 and for the subperiods 1929ndash1959 and 1959ndash2002 the revised estimates of the average annual rates of change in the price index for GDP are the same as those in the previously published estishymates For 2002ndash2012 the average annual rate of change in the price index for GDP is 21 percent a downward revision of 02 percentage point
Notable revisions to the prices of major composhynents of GDP for 2002ndash2012 include the following
Prices of PCE for services are revised down 01 pershycentage point
Prices of nonresidential structures are revised down 05 percentage point
Prices of federal consumption expenditures and gross investment are revised down 04 percentage point
Quarterly Real GDP The revisions to the quarterly (and monthly) NIPA esshytimates reflect the revisions to the annual estimates the incorporation of new and revised monthly and
quarterly source data (including the updating of seashysonal factors) and the introduction of changes in methodology
This section focuses on the effect of the revisions on business cycles with an emphasis on the most recent period of contraction and the current period of expanshysion15
In general the revisions have very little effect on business cycles In the revised estimates for the 11 conshytractions since 1947 all but the 2001 recession show more moderate declines than in the previously pubshylished estimates (table 26) For the 2001 recession the average rate of growth in real GDP is revised down from a positive 10 percent to a positive 06 percent16
In the revised estimates for the most recent contracshytion real GDP decreases at an average annual rate of 29 percent through the second quarter of 2009 in the previously published estimates it had decreased at a
15 These turning points are consistent with the business-cycle turning points determined by the National Bureau of Economic Research (NBER)
16 The NBER considers a number of monthly indicatorsmdashsuch as employment personal income and industrial productionmdashas well as the change in GDP growth for dating business cycles Therefore declines in quarterly real GDP often track closely with recessions but the movements of monthly indicators (especially employment) that the NBER also considshyers may affect the relationship between the pattern of change in real GDP and the identification of recessions More information about the NBER business-cycle dating procedure is available at wwwnberorg
Table 25 Prices of Gross Domestic Product and Its Major Components Revisions to Average Annual Rates of Change Over Selected Periods
Revised Previously published Revision Revised Previously
published Revision Revised Previously published Revision Revised Previously
published Revision
1929ndash2012 1929ndash1959 1959ndash2002 2002ndash2012
Gross domestic product (GDP) Personal consumption expenditures (PCE)
Goods Durable goods Nondurable goods
Services Gross private domestic investment
Fixed investment Nonresidential
Structures Equipment Intellectual proper ty products
Residential Change in private inventories
Net exports of goods and services Exports
Goods Services
Imports Goods Services
Government consumption expenditures and gross investment Federal
National defense Nondefense
State and local Addenda Gross domestic purchases Gross domestic purchases excluding food and energy 1
GDP excluding food and energy 2 PCE excluding food and energy
29 29 23 14 28 33 24 28 25 41 18 23 37
25 23 33 29 29 30
36 33 33 33 41
29
29
29 29 23 14 28 33 23 28 24 41
37
25 22 33 29 29 30
36 35 35 35 40
30
29
00 00 00 00 00 00 01 00 01 00
00
00 01 00 00 00 00
00 ndash02 ndash02 ndash02
01
ndash01
00
19 19 19 19 19 18 19 27 27 31 27 22 30
18 17 29 19 20 17
24 24 24 26 31
19
19
19 19 19 19 19 18 17 27 28 31
30
18 17 29 19 20 17
23 23 22 23 31
19
19
00 00 00 00 00 00 02 00
ndash01 00
00
00 00 00 00 00 00
01 01 02 03 00
00
00
38 38 28 17 34 45 30 31 26 46 16 27 45
28 25 36 35 34 40
45 41 41 40 48
38
38
38 38 28 17 34 46 29 30 24 46
44
29 25 37 35 34 39
46 44 44 44 47
39
38
00 00 00 00 00
ndash01 01 01 02 00
01
ndash01 00
ndash01 00 00 01
ndash01 ndash03 ndash03 ndash04
01
ndash01
00
21 21 13
ndash17 30 26 16 16 13 47 00 08 22
28 27 30 35 36 32
33 27 28 25 36
23 21 21 18
23 22 13
ndash18 30 27 17 17 13 52
23
27 26 28 35 36 32
36 31 33 28 38
24 22 23 19
ndash02 ndash01
00 01 00
ndash01 ndash01 ndash01
00 ndash05
ndash01
01 01 02 00 00 00
ndash03 ndash04 ndash05 ndash03 ndash02
ndash01 ndash01 ndash02 ndash01
1 Price index begins with 1982 2 Price index begins with 1985
37 September 2013 SURVEY OF CURRENT BUSINESS
rate of 32 percent The percent change in real GDP is revised down for three quarters and is revised up for three quarters (table 27) The average revision without regard to sign is 07 percentage point
In the revised estimates for the 10 complete expanshysions since 1947 four have slightly stronger increases than in the previously published estimatesmdashthe exshypansions beginning in the fourth quarter of 1949 in the first quarter of 1961 in the fourth quarter of 1982 and in the fourth quarter of 2001 (table 26) For two of the expansions the increases are slightly more moder-
Table 26 Revisions to Cyclical Fluctuations in Real Gross Domestic Product 1948ndash2013
ate than in the previously published estimatesmdashthe exshypansions beginning in the second quarter of 1958 and in the fourth quarter of 1970 For the remaining four expansions the average annual rates of growth for real GDP are unrevised
For the current expansion through the first quarter of 2013 real GDP increases at an average annual rate of 22 percent in the previously published estimates it had increased at a rate of 21 percent The percent change in real GDP is revised up for seven quarters and is revised down for eight quarters (table 27) The avershyage revision without regard to sign is 06 percentage point
Table 27 Rates of Growth of Real Gross Domestic Product Revised Previously
published Revision
Contractions 1948IVndash1949IV ndash15 ndash16 01 1953IIndash1954II ndash24 ndash25 01 1957IIIndash1958II ndash39 ndash42 03 1960IIndash1961I ndash04 ndash07 03 1969IVndash1970IV ndash01 ndash02 01 1973IVndash1975I ndash25 ndash26 01 1980Indash1980III ndash43 ndash44 01 1981IIIndash1982IV ndash20 ndash21 01 1990IIIndash1991I ndash26 ndash27 01 2001Indash2001IV 06 10 ndash04 2007IVndash2009II ndash29 ndash32 03
Expansions 1949IVndash1953II 76 75 01 1954IIndash1957III 40 40 00 1958IIndash1960II 56 57 ndash01 1961Indash1969IV 49 48 01 1970IVndash1973IV 51 52 ndash01 1975Indash1980I 43 43 00 1980IIIndash1981III 44 44 00 1982IVndash1990III 43 42 01 1991Indash2001I 36 36 00 2001IVndash2007IV 28 27 01 2009IIndash2013I 22 21 01
Revised Previously published Revision
2008Indash2009II
2008I ndash27 ndash18 ndash09 2008II 20 13 07 2008III ndash20 ndash37 17 2008IV ndash83 ndash89 06 2009I ndash54 ndash53 ndash01 2009II ndash04 ndash03 ndash01
Revised Previously published Revision
2009IIIndash2013I
2009III 13 14 ndash01 2009IV 39 40 ndash01 2010I 16 23 ndash07 2010II 39 22 17 2010III 28 26 02 2010IV 28 24 04 2011I ndash13 01 ndash14 2011II 32 25 07 2011III 14 13 01 2011IV 49 41 08 2012I 37 20 17 2012II 12 13 ndash01 2012III 28 31 ndash03 2012IV 01 04 ndash03 2013I 11 18 ndash07
38 Improved NIPA Estimates September 2013
Acknowledgments Nicole M Mayerhauser Chief of the National Income and Wealth Division supervised the preparation of this yearrsquos comprehensive revision of the national income and product accounts Pamela A Kelly Chief of the Governshyment Division directed major parts of the revision Brent R Moulton Associate Director for National Economic Accounts provided overall supervision
Bureau of Economic Analysis staff members who made significant contributions to the revision are listed below
Estimate coordination and review David F Sullivan Alyssa E Holdren Donald D Kim Robert J Kornfeld Brendan J Leary Shelly Smith
Personal consumption expenditures Kyle J Brown Goods Harvey L Davis Jr Yukun Fung Megan E Groll Everette P Johnson Danit E Kanal Brian K Sliker Sershyvices Jason Chute Robert N Ganz III Mahmoud Raya Teresita D Teensma Baoline Chen
Investment and foreign transactions Michael Armah Inventories foreign transactions and prices Harry Johnshyson Jr Michael M Cortez Jeffrey Hall Sinan Hastorun Echo Lin Private fixed investment in structures equipshyment and software Christina D Hovland Velma P Henry Sarah J Pack Linden L Webber Private fixed investment in research and development and entertainshyment literary and artistic originals Marissa Crawford Kevin J Furlong Andrew Schmidt
Federal government Benjamin A Mandel Peter G Beall Mark S Ludwick Stan J Bellotti Andrew P Cairns Andrea L Cook Raymen G LaBella Ann Miller Kyle D Mulgrew Farah Naz Michelle D Robinson Mary L Roy Benyam Tsehaye Andrew E Vargo Bryan Williams Keith Zipay
State and local government Bruce E Baker Steven J Andrews Melissa J Braybrooks Michelle S Grier Brian E Parks
Personal income Kurt Kunze Employee compensation Janet H Kmitch Jillian E Fasser Paul Medzerian James E Rankin Dylan G Rassier John Rusinko Brian J
Smith Business income Howard I Krakower Andrew W Hodge M Greg Key Kate L Shoemaker Martin L Simshymons Garth K Trinkl Dennis R Weikel Property income Michael N Hayes Louise V Lusby Denise A McBride Elizabeth M Terroni
Consumption of fixed capital Private Robert J Kornshyfeld Marlyn Rodriguez Michael T Cusick Michael D Glenn Lisa A Lynn Nadia Sadeacutee Government Jennifer A Bennett Mark A Bailey Mark A Ledbetter Christoshypher B Mbu
Computer systems and operations Brendan J Leary Michael J Boehm Wanda Y Chambers Benjamin D Cowan Natalie M Hayes Sung H Lee Ethan C Lincoln Sandip Mehta Ross F Metzger JD Montgomery Andrew J Pinard James J Raley III Michael D Randall Karl V Rohrer David Rozenshtein
Definitional and statistical improvements research Marshyshall Reinsdorf Research and development Jennifer Lee Wendy CY Li Jennifer Ribarsky Entertainment literary and artistic originals Rachel H Soloveichik David B Wasshausen Accrual accounting for defined benefit penshysion plans Marshall Reinsdorf David G Lenze Dylan G Rassier Expanded ownership transfer costs Arnold J Katz Improved measures of financial services Kyle K Hood
Supplemental review materials Duane G Hackmann Colby Johnson Lisa S Mataloni Kristina L Maze Stephshyanie McCulla Bonnie A Retus David F Sullivan Chrisshytopher Wang
NIPA information Jeannine Aversa Thomas B Dail Gianna M Marrone Debra M Blagburn
Secretarial and program assistance Esther M Carter Katherine Dent Beverly B Goodwin Angela P Pointer In addition the National Economic Accounts Directorate expresses gratitude and appreciation for the contribushytions of staff from the Industry Accounts Directorate led by their Associate Director Carol E Moylan and Division Chiefs Erich H Strassner and David B Wasshausen
Table A follows
39 September 2013 SURVEY OF CURRENT BUSINESS
Table A Selected Components Detail and Major Source Data and Conceptual and Statistical Changes Incorporated 2007ndash2012mdashContinues
Line NIPA component
Billions of dollars
Major source data and conceptual and statistical changes incorporated 1Revised level Revision in level
2007 2009 2012 2007 2008 2009 2010 2011 2012
1 Gross domestic product 144803 144179 162446 4516 4288 4442 4594 4581 5598 2 Personal consumption expenditures 97444 98429 111496 ndash279 ndash300 ndash30 ndash138 ndash172 300 3 Goods 33616 31984 37697 ndash23 ndash60 40 ndash21 ndash221 ndash135 4 Durable goods 11846 10233 12027 ndash38 ndash66 ndash63 ndash87 ndash165 ndash162 5 Motor vehicles and parts
Of which 6 Net purchases of used motor
4006 3171 4017 07 03 11 ndash07 ndash49 ndash53
vehicles
7 Furnishings and durable household
1112 997 1031 ndash55 ndash55 ndash45 ndash112 ndash159 ndash158 For 2007 BEA benchmark input-output accounts Revised Census Bureau annual retail trade survey (ARTS) data on gross margins and on retail sales of used motor vehicle dealers for 2010 new ARTS data for 2011 revised Census Bureau monthly retail trade survey (MRTS) data for 2012 new trade source data on cars and trucks in operation for 2012
equipment Of which
2835 2443 2751 122 108 89 91 84 93
8 Furniture and furnishings 1718 1446 1641 106 96 89 92 89 98 For 2007 BEA benchmark input-output accounts Revised ARTS data for 2010 new ARTS data for 2011 revised MRTS data for 2012
9 Recreational goods and vehicles Of which
10 Video audio photographic and information processing
3358 3038 3345 ndash136 ndash147 ndash135 ndash140 ndash190 ndash195
equipment and media 1956 1849 2050 ndash156 ndash159 ndash141 ndash143 ndash166 ndash162 For 2007 BEA benchmark input-output accounts Revised ARTS data for 2010 new ARTS data for 2011 revised MRTS data for 2012
11 Other durable goods 1648 1582 1913 ndash30 ndash31 ndash26 ndash31 ndash11 ndash08 12 Nondurable goods 13 Food and beverages purchased for offshy
21769 21751 25670 14 06 103 66 ndash56 28
premises consumption Of which
14 Food and nonalcoholic beverages purchased for off-premises
7373 7700 8633 261 265 277 283 228 342
consumption 6347 6634 7409 198 203 210 214 172 269 For 2007 BEA benchmark input-output accounts Revised ARTS data for 2010 new ARTS data for 2011 revised MRTS data for 2012 new trade source retail scanner data for 2012
15 Clothing and footwear Of which
3237 3065 3546 ndash117 ndash114 ndash105 ndash110 ndash109 ndash113
16 Menrsquos and boysrsquo clothing 853 815 935 ndash99 ndash98 ndash92 ndash96 ndash99 ndash101 For 2007 BEA benchmark input-output accounts Revised ARTS data for 2010 new ARTS data for 2011 revised MRTS data for 2012
17 Gasoline and other energy goods Of which
18 Motor vehicle fuels lubricants
3455 2845 4170 ndash193 ndash214 ndash148 ndash190 ndash194 ndash233
and fluids 3199 2602 3904 ndash231 ndash262 ndash185 ndash228 ndash243 ndash280 For 2007 BEA benchmark input-output accounts Revised Energy Information Administration supply data on non-diesel fuel for 2010ndash2012 new BLS consumer expenditure survey data on diesel fuel for 2008ndash2011
19 Other nondurable goods Of which
7704 8142 9321 63 68 81 84 19 30
20 Recreational items 1245 1238 1420 ndash113 ndash112 ndash107 ndash111 ndash140 ndash141 For 2007 BEA benchmark input-output accounts Revised ARTS data for 2010 new ARTS data for 2011 revised MRTS data for 2012
21 Personal care products 990 1001 1146 103 105 79 80 69 76 For 2007 BEA benchmark input-output accounts Revised ARTS data for 2010 new ARTS data for 2011 revised MRTS data for 2012
22 Tobacco 843 995 1088 106 107 116 118 122 120 For 2007 BEA benchmark input-output accounts Revised Department of Treasury Alcohol and Tobacco Tax and Trade Bureau data for 2010ndash2012
23 Services 24 Household consumption expenditures (for
63829 66445 73799 ndash254 ndash240 ndash70 ndash118 49 434
services) 61341 63685 70894 ndash203 ndash216 ndash35 ndash75 189 543 25 Housing and utilities 17582 18810 20139 20 81 94 171 310 480 26 Housing
Of which 27 Rental of tenant-occupied
14800 15916 17199 71 138 154 231 367 550
nonfarm housing
28 Imputed rental of ownershy
3160 3597 4304 49 61 66 124 247 363 Revised Census Bureau current population surveyhousing vacancy survey (CPSHVS) data for 2003ndash2011 new CPSHVS data for 2012 revised BEA utilities data for 2003ndash2011 new BEA utilities data for 2012 revised Department of Energy (DOE) residential energy consumption survey (RECS) data for 2005 new DOE RECS data for 2009 new BLS consumer expenditure survey data on tenant expenditures for 2008ndash2011 new Census Bureau decennial census of housing (COH) data for 2010 new Census Bureau American housing survey (AHS) data for 2011
occupied nonfarm housing 11423 12099 12637 10 64 76 94 110 167 Revised Census Bureau CPSHVS data for 2003ndash2011 new CPSHVS data for 2012 revised BEA constant-dollar housing stock data for 2008ndash2011 new BEA constant-dollar housing stock data for 2012 new Census Bureau decennial COH data for 2010 new Census Bureau AHS data for 2011
29 Household utilities 2782 2894 2940 ndash51 ndash57 ndash60 ndash60 ndash58 ndash70
See the footnotes and abbreviations at the end of the table
40 Improved NIPA Estimates September 2013
Table A Selected Components Detail and Major Source Data and Conceptual and Statistical Changes Incorporated 2007ndash2012mdashContinues
Line NIPA component
Billions of dollars
Major source data and conceptual and statistical changes incorporated 1Revised level Revision in level
2007 2009 2012 2007 2008 2009 2010 2011 2012
30 Health care Of which
14818 16274 18476 241 239 258 277 162 295
31 Physician services 3657 3928 4339 55 58 59 59 58 138 For 2007 BEA benchmark input-output accounts Revised Census Bureau service annual survey (SAS) taxable and tax-exempt revenue data for 2010 and 2011 new SAS data for 2012
32 Hospitals 6581 7366 8612 179 199 213 232 179 226 For 2007 BEA benchmark input-output accounts Revised SAS taxable and tax-exempt revenue data for 2010 and 2011 new SAS data for 2012
33 Transpor tation services 3122 2897 3181 52 58 52 53 62 53 34 Recreation services 3758 3760 4166 04 26 53 66 52 64 35 Food services and accommodations 5956 6003 7017 ndash49 ndash58 ndash69 ndash133 ndash122 ndash119 36 Financial services and insurance 7685 7190 8210 ndash218 ndash355 ndash228 ndash331 ndash60 ndash81 37 Financial services 4803 4522 4961 ndash215 ndash383 ndash251 ndash392 ndash278 ndash427
Of which 38 Financial services furnished
without payment 2366 2294 2591 ndash142 ndash320 ndash215 ndash345 ndash240 ndash396 Improved estimates of implicit services of commercial banks Revised FRB flow of funds accounts data for 2010 and 2011 new flow of funds accounts data for 2012 revised IRS tabulations of corporate tax return data for 2010 new IRS tabulations of corporate and of sole proprietorship and partnership tax return data for 2011 new FDIC data for 2012 new trade source data on credit unions and on investment companies for 2012
39 Insurance Of which
2882 2667 3250 ndash03 28 23 62 217 348
40 Life insurance 875 800 1033 37 51 47 51 150 170 Revised trade source data on life insurance company expenses for 2007ndash2010 new trade source data for 2011 new BLS quarterly census of employment and wages data for 2012
41 Net health insurance 1313 1194 1545 ndash43 ndash26 ndash28 05 69 190 Revised benefits-to-premiums ratio based on new trade source data on medical insurance for 2011 new DHHS medical expenditures panel survey data for 2011 and 2012
42 Other services 8419 8751 9704 ndash255 ndash207 ndash196 ndash177 ndash214 ndash151 43 Communication
Of which 2033 2179 2517 ndash38 07 22 32 53 165
44 Telecommunication services 1490 1496 1606 ndash104 ndash104 ndash95 ndash94 ndash130 ndash132 For 2007 BEA benchmark input-output accounts Revised SAS product revenue data for 2007ndash2010 new SAS product revenue data for 2011 new SAS industry revenue data for 2012
45 Internet access 423 563 807 39 75 83 93 157 274 For 2007 BEA benchmark input-output accounts Revised SAS product revenue data for 2007ndash2010 new SAS product revenue data for 2011 new SAS industry revenue data for 2012
46 Education services 1966 2199 2649 09 ndash04 ndash13 ndash15 ndash13 ndash05 47 Professional and other services 1636 1615 1694 ndash02 ndash10 ndash17 ndash13 ndash10 ndash63 48 Personal care and clothing services 49 Social services and religious
1115 1099 1248 04 04 07 40 24 49
activities 1246 1332 1473 ndash132 ndash139 ndash142 ndash146 ndash154 ndash153 For 2007 BEA benchmark input-output accounts Revised SAS taxable and tax-exempt revenue data for 2010 and 2011 new SAS data for 2012
50 Net foreign travel ndash215 ndash275 ndash536 ndash123 ndash89 ndash81 ndash101 ndash129 ndash169 Of which
51 Foreign travel by US residents 2
52 Final consumption expenditures of 1041 979 1100 ndash98 ndash99 ndash92 ndash114 ndash150 ndash171 Revised BEA international transactions accounts data for 1999ndash2012
nonprofit institutions 2488 2760 2905 ndash51 ndash25 ndash35 ndash43 ndash140 ndash109 53 Gross output of nonprofit institutions 9831 10726 11941 ndash63 ndash56 ndash61 ndash75 ndash229 ndash214 New treatment of research and development For 2007 BEA benchmark
input-output accounts Revised SAS tax-exempt expenses data for 2010 and 2011 new SAS data for 2012
54 Less Receipts from sales of goods and services by nonprofit institutions 7344 7965 9036 ndash11 ndash31 ndash27 ndash32 ndash88 ndash105 See entries under Household consumption expenditures (for services) line
24 55 Gross private domestic investment 26437 18781 24752 3485 3372 3288 3635 3772 4129 56 Fixed investment 26093 20257 24091 3432 3281 3222 3603 3773 4049 57 Nonresidential 19206 16334 19700 2831 2847 2841 3198 3303 3487 58 Structures
Of which 4969 4382 4373 ndash280 ndash339 ndash129 ndash143 ndash242 ndash261
59 Power 541 761 832 40 51 57 49 51 33 60 Electric 415 604 668 79 141 186 123 172 229 Improved classifications of wind and solar power structures For 2007 BEA
benchmark input-output accounts 61 Other power 127 157 163 ndash38 ndash90 ndash129 ndash74 ndash121 ndash197 Improved classifications of wind and solar power structures For 2007 BEA
benchmark input-output accounts 62 Petroleum and natural gas 949 694 1165 ndash317 ndash375 ndash159 ndash184 ndash286 ndash277 For 2007 BEA benchmark input-output accounts Revised trade source data
on footage drilled for 2008ndash2011 new trade source data for 2012 new Census Bureau annual capital expenditures survey data for 2011
63 Equipment 3 8858 6443 9076 64 Information processing equipment 3
Of which 3032 2561 2845
65 Communication equipment 1062 794 958 68 68 35 57 134 176 For 2007 BEA benchmark input-output accounts Revised Census Bureau annual survey of manufactures (ASM) data for 2010 new ASM data for 2011 revised Census Bureau monthly industry shipments data for 2012
66 Industrial equipment 1941 1521 1953 11 ndash16 ndash31 ndash24 08 ndash22
See the footnotes and abbreviations at the end of the table
41 September 2013 SURVEY OF CURRENT BUSINESS
Table A Selected Components Detail and Major Source Data and Conceptual and Statistical Changes Incorporated 2007ndash2012mdashContinues
Line NIPA component
Billions of dollars
Major source data and conceptual and statistical changes incorporated 1Revised level Revision in level
2007 2009 2012 2007 2008 2009 2010 2011 2012
67 Transportation equipment 1888 706 2144 ndash14 ndash07 ndash53 43 71 175 For 2007 BEA benchmark input-output accounts Revised trade source data on motor vehicle unit sales and prices for 2007 revised trade source data on auto and light truck average expenditures for 2008ndash2011 revised trade source data on business motor vehicle registrations for 2012
68 Other equipment 2118 1742 2237 105 87 28 103 107 68 For 2007 BEA benchmark input-output accounts Revised Census Bureau ASM data for 2010 new ASM data for 2011 revised Census Bureau monthly industry shipments data for 2012
69 Less Sale of equipment scrap excluding autos 122 86 103 37 60 22 16 13 15
70 Intellectual property products 3 5379 5509 6250 New treatments of research and development and of entertainment literary and artistic originals
71 Software 2442 2568 2816 ndash08 13 ndash01 ndash89 ndash111 ndash118 For 2007 BEA benchmark input-output accounts Revised Census Bureau service annual survey (SAS) revenue data for 2010 and 2011 new SAS data for 2012 new BLS occupational employment survey data for 2012
72 Research and development 3 73 Entertainment literary and ar tistic
2233 2290 2691 New treatment of research and development
originals 3 704 651 743 New treatment of enter tainment literary and artistic originals 74 Residential 6887 3922 4392 600 435 381 405 471 563 75 Structures 6788 3839 4302 604 438 385 410 475 566
Of which 76 Brokersrsquo commissions and other
ownership transfer costs 3 1447 952 1069 New treatment of ownership transfer costs 77 Residential equipment 99 83 90 ndash04 ndash05 ndash05 ndash05 ndash04 ndash04 78 Change in private inventories 345 ndash1476 661 54 91 66 31 ndash02 80 79 Farm ndash07 ndash16 ndash117 00 00 01 00 ndash03 44 80 Nonfarm 352 ndash1460 778 54 91 65 32 01 37 81 Change in book value 924 ndash1537 928 10 60 45 62 06 49 82 Mining utilities and construction 34 ndash53 68 ndash04 10 60 ndash08 ndash64 07 83 Manufacturing 385 ndash335 148 00 ndash07 00 64 11 ndash01 84 Wholesale trade 332 ndash620 285 44 70 00 ndash33 ndash15 ndash19 85 Merchant wholesale 258 ndash494 252 06 12 00 20 ndash31 ndash23 86 Nonmerchant wholesale 75 ndash125 34 39 58 00 ndash52 16 05 87 Retail trade
Of which 138 ndash478 338 16 ndash14 00 28 56 15
88 Retail motor vehicle dealers 37 ndash330 232 00 ndash01 00 24 57 25 89 Other industries 34 ndash51 89 ndash46 00 ndash15 11 18 46 90 IVA ndash572 77 ndash150 43 31 20 ndash30 ndash06 ndash12 91 Net exports of goods and services 2 ndash7098 ndash3922 ndash5472 33 ndash35 ndash35 ndash69 ndash06 127 Revised BEA international transactions accounts data for 1999ndash2012 92 Exports 16657 15838 21959 40 ndash37 ndash36 ndash09 70 119 93 Goods 11653 10647 15360 33 01 00 ndash01 ndash09 ndash68 94 Services
Of which 5004 5191 6599 07 ndash38 ndash36 ndash08 79 187
95 Royalties and license fees 978 984 1242 132 00 00 03 ndash01 ndash07 Reclassification of distribution rights for film and television recordings from exports of ldquootherrdquo private services
96 Other private services 2116 2373 2945 ndash108 00 00 07 94 191 Reclassification of distribution rights for film and television recordings to exports of rents and royalties Improved methodology for estimating expenditures by seasonal border and other short-term workers for 2003ndash2012 New BEA 2011 Benchmark Survey of Transactions in Selected Services and Intangible Assets with Foreign Persons data for 2011 corrected repor ting and new data from major companies for 2011 and 2012
97 Imports 23755 19760 27431 07 ndash01 ndash02 59 76 ndash09 98 Goods
Of which 20003 15873 22954 ndash04 01 ndash02 42 54 35
99 Other 851 755 906 ndash107 02 00 44 55 45 Reallocation of adjustments for low-value imports and for inland freight in Canada and Mexico
100 Services 101 Government consumption expenditures
3753 3887 4477 13 ndash01 00 17 23 ndash44
and gross investment 28019 30891 31670 1277 1251 1219 1165 989 1042 102 Federal 10498 12177 12957 735 755 741 808 820 814 Revised allocations of FY 2011 and FY 2012 OMB Budget data for
2010ndash2012 preliminary FY 2013 OMB Budget data for 2012 103 National defense 6787 7883 8171 164 163 123 151 150 80 104 Consumption expenditures 5261 6133 6520 ndash493 ndash505 ndash511 ndash493 ndash493 ndash516
Of which 105 Compensation of general
government employees 106 Consumption of general
2015 2288 2486 ndash368 ndash402 ndash450 ndash460 ndash494 ndash553 New treatment of defined benefit pension plans
government fixed capital 1299 1446 1611 525 560 581 602 621 626 New treatment of research and development 107 Services 1565 1928 1909 ndash482 ndash492 ndash471 ndash462 ndash436 ndash398 New treatment of research and development 108 Less Own-account investment 186 195 200 165 171 171 173 183 177 New treatment of research and development 109 Gross investment 1527 1750 1651 658 668 635 643 643 595 110 Structures 100 171 84 ndash01 00 00 00 ndash01 ndash01 111 Equipment 3 708 860 862 112 Intellectual property products 3 719 718 705 113 Software 3 65 68 77 114 Research and development 3 654 650 629 New treatment of research and development
See the footnotes and abbreviations at the end of the table
42 Improved NIPA Estimates September 2013
Table A Selected Components Detail and Major Source Data and Conceptual and Statistical Changes Incorporated 2007ndash2012mdashContinues
Line NIPA component
Billions of dollars
Major source data and conceptual and statistical changes incorporated 1Revised level Revision in level
2007 2009 2012 2007 2008 2009 2010 2011 2012
115 Nondefense 3710 4294 4786 570 592 618 658 669 735 116 Consumption expenditures
Of which 117 Compensation of general
2723 3204 3597 ndash12 ndash15 ndash21 ndash26 ndash36 37
government employees 118 Consumption of general
1281 1467 1625 ndash133 ndash137 ndash146 ndash150 ndash144 ndash161 New treatment of defined benefit pension plans
government fixed capital 769 835 943 480 506 519 551 576 586 New treatment of research and development 119 Services 627 814 910 ndash252 ndash276 ndash278 ndash309 ndash336 ndash274 New treatment of research and development 120 Less Own-account investment 142 154 151 116 117 123 124 126 121 New treatment of research and development 121 Gross investment 988 1090 1189 583 606 639 683 706 698 122 Structures 114 120 142 03 00 ndash01 ndash06 06 13 123 Equipment 3 161 177 195 124 Intellectual property products 3 713 793 853 125 Software 3 142 150 172 126 Research and development 3 572 643 680 New treatment of research and development 127 State and local 17522 18714 18713 543 496 478 358 170 228 128 Consumption expenditures
Of which 129 Compensation of general
14114 15084 15364 425 395 351 221 ndash06 56
government employees
130 Consumption of general government
10655 11419 11785 838 836 855 997 936 904 New treatment of defined benefit pension plans Improved estimates of employersrsquo contributions to defined contribution pension plans Improved measures of wages paid by Indian tribal governments
fixed capital 1447 1621 1788 78 93 99 102 104 107 New treatment of research and development 131 Nondurable goods 2071 2120 2478 ndash29 ndash52 05 ndash98 ndash164 ndash127 New treatment of research and development For 2007 BEA benchmark
input-output accounts Revised Census Bureau government finances FY 2006ndashFY 2010 tabulations for 2005ndash2010 new government finances FY 2011 tabulations for 2010 and 2011
132 Services 3468 3728 3709 ndash162 ndash192 ndash304 ndash412 ndash436 ndash370 New treatment of research and development For 2007 BEA benchmark input-output accounts Revised Census Bureau government finances FY 2006ndashFY 2010 tabulations for 2005ndash2010 new government finances FY 2011 tabulations for 2010 and 2011
133 Less Own-account investment 336 362 352 120 129 131 134 140 142 New treatment of research and development 134 Less Sales to other sectors
Of which 3430 3694 4282 181 159 166 222 292 306
135 Other sales 1235 1233 1376 154 136 134 158 184 182 New treatment of research and development For 2007 BEA benchmark input-output accounts Revised Census Bureau government finances FY 2006ndashFY 2010 tabulations for 2005ndash2010 new government finances FY 2011 tabulations for 2010 and 2011
136 Gross investment 3408 3630 3349 118 100 127 137 175 172 137 Structures 2712 2898 2627 28 03 21 45 95 108 Revised Census Bureau government finances FY 2006ndashFY 2010 tabulations
for 2005ndash2010 new government finances FY 2011 tabulations for 2010 and 2011 revised Census Bureau construction spending (value put in place) data for 2011 and 2012
138 Equipment 3 439 445 411 139 Intellectual property products 3 258 287 312 140 Software 3 117 122 134 141 Research and development 3 141 165 178 New treatment of research and development 142 Gross domestic product 144803 144179 162446 4516 4288 4442 4594 4581 5598 143 Less Statistical discrepancy 4 202 722 ndash170 322 1014 ndash461 198 ndash856 ndash572 144 Equals Gross domestic income 144601 143457 162616 4194 3272 4903 4396 5437 6170 145 Compensation of employees paid 79088 77957 86200 458 109 ndash115 ndash19 ndash166 196 See entries under Compensation of employees line 167 146 Wages and salaries 64057 62601 69351 ndash169 ndash130 ndash231 ndash261 ndash225 216 147 To persons 63909 62468 69205 ndash279 ndash181 ndash181 ndash273 ndash229 205 148 To the rest of the world 147 133 146 46 00 00 12 04 11 149 Supplements to wages and salaries 15031 15356 16849 627 239 116 244 59 ndash20 150 Taxes on production and imports 10346 10261 11229 74 33 29 21 ndash08 ndash71 151 Less Subsidies 546 583 573 00 ndash03 ndash14 ndash11 ndash16 ndash35 152 Net operating surplus 33070 32139 40332 ndash1305 ndash1965 ndash45 ndash700 436 698 153 Private enterprises 33235 32345 40609 ndash1258 ndash1913 06 ndash666 408 635 154 Current surplus of government enterprises ndash164 ndash206 ndash277 ndash46 ndash52 ndash50 ndash34 27 63 155 Consumption of fixed capital 22644 23684 25429 4969 5093 5021 5082 5158 5312 156 Private 18650 19257 20493 3888 3940 3829 3836 3870 4015 New treatments of research and development of enter tainment literary and
ar tistic originals and of ownership transfer costs Revised BEA fixed investment and price estimates for 2001ndash2012
157 Domestic business 14512 15224 16394 2605 2740 2724 2780 2859 3004 158 Capital consumption allowances 13300 15586 15950 2428 2595 2757 2839 3277 3374 New treatments of research and development of enter tainment literary and
ar tistic originals and of ownership transfer costs Improved measures of IRS section 179 expensing for sole proprietorships Revised IRS tabulations of corporate tax return data for 2001ndash2010 new IRS tabulations of corporate and of sole proprietorship and partnership tax return data for 2011 revised Office of Tax Analysis bonus depreciation estimates for 2012 revised BEA fixed investment estimates for 2001ndash2012
159 Less CCAdj ndash1212 362 ndash444 ndash176 ndash145 33 59 419 370 CCAdj is calculated as capital consumption allowances less consumption of fixed capital
160 Households and institutions 4137 4033 4099 1282 1200 1106 1056 1012 1011 New treatments of research and development and of ownership transfer costs Revised BEA fixed investment and price estimates for 2001ndash2012
161 Government 3994 4427 4936 1081 1153 1192 1246 1287 1297 New treatment of research and development 162 Plus Income receipts from the rest of the world 2 8755 6437 8186 45 07 13 35 191 363 Revised BEA international transactions accounts data for 1999ndash2012 163 Less Income payments to the rest of the world 2 7491 4965 5657 14 ndash31 ndash24 69 103 264 Revised BEA international transactions accounts data for 1999ndash2012
See the footnotes and abbreviations at the end of the table
43 September 2013 SURVEY OF CURRENT BUSINESS
Table A Selected Components Detail and Major Source Data and Conceptual and Statistical Changes Incorporated 2007ndash2012mdashContinues
Line NIPA component
Billions of dollars
Major source data and conceptual and statistical changes incorporated 1Revised level Revision in level
2007 2009 2012 2007 2008 2009 2010 2011 2012
164 Equals Gross national income 145866 144929 165145 4227 3311 4940 4362 5526 6269 165 Less Consumption of fixed capital 22644 23684 25429 4969 5093 5021 5082 5158 5312 See entries under Consumption of fixed capital line 155 166 Equals National income 123223 121245 139716 ndash741 ndash1783 ndash81 ndash719 368 957 167 Compensation of employees 78991 77878 86116 432 109 ndash116 ndash27 ndash167 187 168 Wages and salaries 63960 62522 69268 ndash195 ndash131 ndash231 ndash271 ndash226 208 169 Government 10888 11751 11973 ndash02 00 ndash01 ndash02 ndash09 ndash42 170 Other 53072 50771 57294 ndash192 ndash131 ndash230 ndash269 ndash217 249 Updated measures of misrepor ting based on IRS National Research
Program (NRP) data for 2006 Revised BLS quarterly census of employment and wages (QCEW) data for 2001ndash2011 new QCEW data for 2012
171 Supplements to wages and salaries 172 Employer contributions for employee
15031 15356 16849 627 239 116 244 59 ndash20
pension and insurance funds
173 Employer contributions for government
10414 10775 11706 609 227 103 231 64 ndash15 New treatment of defined benefit pension plans New Department of Labor pension data for 2010 new DHHS medical expenditures panel survey data for 2011 and 2012
social insurance 4617 4581 5143 18 12 12 13 ndash05 ndash05 174 Proprietorsrsquo income with IVA and CCAdj 9792 9730 12249 ndash1112 ndash714 ndash64 ndash707 ndash22 226 175 Farm 381 355 754 03 ndash48 ndash44 17 180 192 176 Proprietorsrsquo income with IVA 442 418 813 03 ndash48 ndash44 17 180 191 Revised USDA data for 2001ndash2012 177 CCAdj ndash61 ndash64 ndash59 00 00 ndash01 00 00 01 178 Nonfarm 9411 9375 11496 ndash1115 ndash666 ndash20 ndash724 ndash202 35 179 Proprietorsrsquo income 8655 7968 10049 ndash944 ndash472 139 ndash552 ndash104 ndash32 New treatments of research and development of enter tainment literary and
artistic originals and of ownership transfer costs Updated measures of misreporting based on IRS NRP data for 2006 Improved methodology for estimating the adjustment made to remove corporate partnersrsquo income Improved measures of IRS section 179 expensing for sole proprietorships Revised IRS tabulations of corporate tax return data for the posttabulation and mining depreciation adjustments for 2010 new IRS tabulations of sole proprietorship and partnership tax return data for 2011
180 IVA ndash65 14 ndash16 05 17 04 ndash05 01 04 181 CCAdj 820 1393 1462 ndash176 ndash211 ndash163 ndash167 ndash98 62 See entries under Consumption of fixed capital line 155 182 Rental income of persons with CCAdj 1894 3337 5412 457 305 440 536 747 786 183 Rental income of persons 2066 3483 5553 463 306 435 529 739 779 New treatment of ownership transfer costs Improved estimates of mor tgage
interest paid based on new IRS Information Returns Program data on loan discount points for 1999ndash2010 and on new and revised trade source data on mortgage servicing for 2005ndash2012 Revised FRB flow of funds accounts data on residential mor tgage loan liabilities for 1980ndash2012 revised Census Bureau current population surveyhousing vacancy survey (CPSHVS) data for 2003ndash2011 new CPSHVS data for 2012 revised IRS tabulations of corporate and of individual tax return data for 2010 new IRS tabulations for 2011 new Federal National Mortgage Corporation mortgage originations data for 2011 revised trade source data on insurance for 2010 new trade source data on insurance for 2011 revised Census Bureau government finances FY 2002ndashFY 2011 tabulations for 2001ndash2011 new FY 2012 Census Bureau annual survey of state government tax collections data for 2011 and 2012 new and revised OMB Budget data on subsidies for 2003ndash2012
184 CCAdj ndash172 ndash146 ndash141 ndash06 ndash01 05 06 07 06 185 Corporate profits with IVA and CCAdj 15290 13926 20095 184 367 503 382 507 589 186 Domestic industries 11756 10398 15905 158 366 503 445 531 699 187 Financial 2610 3217 4220 ndash628 ndash227 ndash72 ndash165 ndash254 ndash103 188 Nonfinancial 9146 7181 11685 787 593 575 611 785 802 189 Rest of the world 2 3534 3528 4189 25 01 00 ndash64 ndash23 ndash111 Revised BEA international transactions accounts data for 1999ndash2012 190 Less CCAdj ndash1799 ndash822 ndash1705 06 67 191 219 510 301 See entries under Consumption of fixed capital line 155 191 Equals Corporate profits with IVA 17089 14748 21800 178 300 312 161 ndash03 287 See entries under Corporate profits before tax without IVA and CCAdj line
208 192 Domestic industries 13555 11220 17611 153 299 312 225 21 399 193 Financial 3015 3629 4774 ndash440 ndash268 ndash119 ndash190 ndash242 ndash73 194 Federal Reserve banks 360 473 717 00 00 00 00 00 ndash17 195 Other financial 2655 3155 4057 ndash440 ndash267 ndash120 ndash189 ndash242 ndash56 196 Nonfinancial 10540 7592 12837 593 567 432 415 263 472 197 Utilities 495 238 371 ndash08 ndash06 07 19 ndash66 ndash20 198 Manufacturing 3219 1714 4043 506 451 404 514 590 326 199 Durable goods 1189 344 1970 228 75 133 232 353 158 200 Nondurable goods 2030 1370 2073 278 377 271 282 237 168 201 Wholesale trade 1032 893 1378 33 43 27 40 00 ndash15 202 Retail trade 1190 1087 1492 12 ndash13 07 ndash43 72 92 203 Transportation and warehousing 239 224 515 ndash38 ndash31 ndash24 ndash35 ndash134 ndash29 204 Information 1084 812 1106 148 171 84 87 19 ndash18 205 Other nonfinancial 3282 2623 3932 ndash60 ndash49 ndash74 ndash167 ndash220 135 206 Rest of the world 3534 3528 4189 25 01 00 ndash64 ndash23 ndash111 207 Less IVA 208 Equals Corporate profits before tax without
ndash395 67 ndash100 77 75 35 ndash23 66 09
IVA and CCAdj 17484 14682 21900 100 225 277 185 ndash67 278 New treatments of research and development of enter tainment literary and artistic originals of ownership transfer costs and of defined benefit pension plans Improved methodology for distributing the income of regulated investment companies by type Revised IRS tabulations of corporate tax return data for 2010 new IRS tabulations for 2011 revised Census Bureau quar terly financial report data for 2012 new and revised regulatory and public financial repor ts profits data for 2012
See the footnotes and abbreviations at the end of the table
44 Improved NIPA Estimates September 2013
Table A Selected Components Detail and Major Source Data and Conceptual and Statistical Changes Incorporated 2007ndash2012mdashContinues
Line NIPA component
Billions of dollars
Major source data and conceptual and statistical changes incorporated 1Revised level Revision in level
2007 2009 2012 2007 2008 2009 2010 2011 2012
209 Less Taxes on corporate income 4455 2694 4348 00 01 00 ndash27 ndash48 ndash145 210 Equals Profits after tax 13029 11987 17552 100 224 276 213 ndash20 423 211 Less Net corporate dividend payments 8189 5687 7703 244 217 146 ndash370 44 ndash96 212 Equals Undistributed corporate profits 4840 6300 9849 ndash144 07 130 582 ndash63 519 213 Net interest and miscellaneous payments 6634 5631 4396 ndash682 ndash1767 ndash774 ndash785 ndash705 ndash647 214 Net interest 6408 5448 4181 ndash720 ndash1806 ndash797 ndash807 ndash744 ndash681 215 Domestic business 3851 3010 2417 21 ndash1078 ndash263 ndash417 ndash425 216 Monetary interest paid 28668 15820 12670 339 ndash1050 54 ndash68 88 Improved methodology for distributing the income of regulated investment
companies by type Revised IRS tabulations of corporate tax return data for 2010 new IRS tabulations of corporate and of sole proprietorship and par tnership tax return data for 2011 revised FRB flow of funds accounts data on nonfinancial corporate liabilities for 2010 and 2011 new FRB data for 2012 revised USDA interest data for 2010 and 2011 new FDIC data for 2012 new trade source data on credit unions and on investment companies for 2012
217 Less Monetary interest received
218 Imputed interest paid depositor
31515 19243 16922 1492 1426 1293 954 1135 New treatment of defined benefit pension plans Revised IRS tabulations of corporate tax return data for 2010 new IRS tabulations of corporate and of sole proprietorship and par tnership tax return data for 2011 revised FRB flow of funds accounts data on nonfinancial corporate liabilities for 2010 and 2011 new FRB data for 2012 revised USDA interest data for 2010 and 2011 new USDA data for 2012 new FDIC data for 2012 new trade source data on credit unions and on investment companies for 2012
insurance and pension services 3 7753 8446 8563 219 Financial 220 Banks credit agencies and
7775 8190 8366 2476 2394 3175 3105 3161
investment companies 2402 2219 2291 ndash17 ndash546 ndash128 ndash123 31 Improved estimates of implicit services of commercial banks Revised IRS tabulations of corporate tax return data for 2010 new IRS tabulations for 2011 new FDIC data for 2012 new trade source data on credit unions and on investment companies for 2012
221 Life insurance carriers
222 Property and casualty insurance
2552 2381 2346 ndash02 02 00 ndash56 ndash162 New trade source data on investment income of life insurance carriers for 2011 revised FRB flow of funds accounts data on life insurance company assets for 2010 and 2011 new FRB data for 2012
companies 315 276 302 ndash12 08 ndash11 05 ndash04 223 Employee pension plans 3 2507 3284 3403 New treatment of defined benefit pension plans 224 Other 3 ndash01 29 24 New treatment of defined benefit pension plans 225 Nonfinancial 3 226 Less Imputed interest received
depositor insurance and pension
ndash22 256 197 New treatment of defined benefit pension plans
services
227 Imputed interest paid borrower
1756 2562 2527 1102 1272 2013 1957 1908 New treatment of defined benefit pension plans Improved estimates of implicit services of commercial banks Revised FRB flow of funds accounts data for 2010 and 2011 new flow of funds accounts data for 2012 revised IRS tabulations of corporate tax return data for 2010 new IRS tabulations for 2011 new FDIC data for 2012
services
228 Less Imputed interest received
ndash733 ndash671 ndash730 231 68 397 566 632 Improved estimates of implicit services of commercial banks Improved estimates of mor tgage interest paid Revised FRB flow of funds accounts data for 2010 and 2011 new FRB data for 2012
borrower services ndash1435 ndash1221 ndash1362 407 152 838 1320 1477 Improved estimates of implicit services of commercial banks 229 Owner-occupied housing 4606 4301 3248 ndash783 ndash769 ndash587 ndash455 ndash460 230 Monetary interest paid
231 Imputed interest paid borrower
5109 4678 3619 ndash808 ndash749 ndash754 ndash761 ndash796 Improved estimates of mortgage interest paid Revised FRB flow of funds accounts data on residential mortgage liabilities for 2010ndash2012
services
232 Less Imputed interest received depositor insurance and pension
ndash489 ndash365 ndash358 26 ndash21 166 306 336 Improved estimates of implicit services of commercial banks Improved estimates of mor tgage interest paid Revised FRB flow of funds accounts data for 2010 and 2011 new FRB data for 2012
services 14 12 13 00 00 00 00 00 233 Nonprofit institutions 123 115 94 09 04 17 26 27 234 Rest of the world 2 ndash2173 ndash1978 ndash1577 32 37 36 39 113 Improved estimates of implicit services of commercial banks Revised BEA
international transactions accounts data for 1999ndash2012 235 Miscellaneous payments 226 182 215 38 39 23 21 39 34 236 Taxes on production and imports 10346 10261 11229 74 33 29 21 ndash08 ndash71 237 Federal 946 914 1180 01 00 00 13 12 20 238 State and local 9400 9348 10049 73 33 30 09 ndash19 ndash91 239 Less Subsidies 546 583 573 00 ndash03 ndash14 ndash11 ndash16 ndash35 240 Federal 475 569 568 01 ndash03 ndash14 ndash11 ndash17 ndash36 241 State and local 71 14 05 00 00 00 00 00 00 242 Business current transfer payments (net) 986 1272 1069 ndash47 ndash66 ndash62 ndash115 ndash30 ndash211 243 To persons (net) 306 387 414 01 ndash02 ndash09 ndash44 18 ndash45 244 To government (net) 620 907 706 ndash48 ndash64 ndash53 ndash73 ndash47 ndash138 Reclassification of certain federal transfer receipts as rents and royalties and
transfers to the rest of the world (net) 245 To the rest of the world (net) 60 ndash23 ndash51 00 00 00 02 ndash01 ndash27 246 Current surplus of government enterprises ndash164 ndash206 ndash277 ndash46 ndash52 ndash50 ndash34 27 63 247 Federal 20 08 ndash134 47 45 53 39 54 44 248 State and local ndash185 ndash214 ndash143 ndash94 ndash97 ndash103 ndash73 ndash27 20 New treatment of defined benefit pension plans Revised Census Bureau
government finances FY 2006ndashFY 2010 tabulations for 2005ndash2010 new government finances FY 2011 tabulations for 2010 and 2011
See the footnotes and abbreviations at the end of the table
45 September 2013 SURVEY OF CURRENT BUSINESS
Table A Selected Components Detail and Major Source Data and Conceptual and Statistical Changes Incorporated 2007ndash2012mdashTable Ends
Line NIPA component
Billions of dollars
Major source data and conceptual and statistical changes incorporated 1Revised level Revision in level
2007 2009 2012 2007 2008 2009 2010 2011 2012
Addenda 249 Gross national product 146068 145651 164974 4549 4325 4479 4560 4671 5696 250 Gross saving 25067 20717 26722 4590 3737 5159 4843 6239 6518 251 Personal income 119957 120821 137438 834 ndash296 2151 1133 2440 3127 See entries under National income and additional sources below 252 Compensation of employees 78991 77878 86116 369 59 ndash66 ndash27 ndash167 187 253 Proprietorsrsquo income with IVA and CCAdj 9792 9730 12249 ndash1112 ndash714 ndash64 ndash707 ndash22 226 254 Rental income of persons with CCAdj 1894 3337 5412 457 305 440 536 747 786 255 Personal income receipts on assets 21666 18118 19585 1096 17 1853 1413 1995 2088 256 Personal interest income 13501 12639 12116 850 ndash204 1706 1784 1953 2190 New treatment of defined benefit pension plans Improved estimates of
implicit services of commercial banks Improved methodology for distributing the income of regulated investment companies by type Revised FRB flow of funds accounts data for 2010 and 2011 new FRB data for 2012 revised IRS tabulations of corporate tax return data for 2010 new IRS tabulations of corporate and of sole proprietorship and partnership tax return data for 2011 new trade source data on investment income of life insurance carriers for 2011 new FDIC data for 2012 new trade source data on credit unions and on investment companies for 2012
257 Personal dividend income 8165 5479 7469 246 220 147 ndash371 42 ndash101 Improved methodology for distributing the income of regulated investment companies by type Revised IRS tabulations of corporate tax return data for 2010 new IRS tabulations for 2011 new and revised regulatory agency and public financial statements data on dividends for 2012 revised BEA international transactions accounts data for 1999ndash2012
258 Personal current transfer receipts 17228 21402 23583 43 48 01 ndash74 ndash123 ndash168 259 Government social benefits to persons 16922 21015 23168 43 49 10 ndash29 ndash140 ndash124 260 Federal 12589 16089 17725 47 62 35 15 ndash76 ndash25 261 State and local 4333 4926 5443 ndash04 ndash13 ndash25 ndash45 ndash65 ndash99 262 Other current transfer receipts from
business (net) 306 387 414 01 ndash02 ndash09 ndash44 18 ndash45 263 Less Contributions for government social
insurance domestic 9614 9644 9507 19 09 13 08 ndash11 ndash08 264 Federal 9425 9458 9332 19 13 16 11 ndash11 ndash08 265 State and local 189 186 175 00 ndash03 ndash04 ndash03 00 00 266 Less Personal current taxes 14879 11449 14980 ndash08 ndash05 03 ndash33 60 176 267 Federal 11644 8572 11492 ndash12 04 02 ndash04 18 46 268 State and local 3235 2878 3488 04 ndash09 02 ndash30 42 130 Revised Census Bureau government finances FY 2006ndashFY 2011 tabulations
for 2005ndash2011 new government finances FY 2012 tabulations for 2011 and 2012
269 Equals Disposable personal income 105079 109372 122458 843 ndash291 2148 1166 2381 2950 270 Less Personal outlays 101906 102665 115584 157 118 522 491 592 981 271 Personal consumption expenditures 97444 98429 111496 ndash279 ndash300 ndash30 ndash138 ndash172 300 272 Personal interest payments 3059 2739 2484 450 440 568 670 800 757 Improved estimates of implicit services of commercial banks and of
mortgage interest paid Improved treatment for the derivation of monetary interest paid on consumer loans Revised FRB interest rate data for 1980ndash2012 revised FRB flow of funds accounts data for 2010 and 2011 new flow of funds accounts data for 2012 revised FRB consumer credit outstanding data for 2010ndash2012 new FDIC data for 2012
273 Personal current transfer payments 1403 1496 1604 ndash14 ndash21 ndash17 ndash40 ndash34 ndash76 274 To government 810 835 885 ndash14 ndash21 ndash17 ndash35 ndash36 ndash30 275 To the rest of the world (net) 593 661 719 00 00 00 ndash05 02 ndash45 276 Equals Personal saving 3172 6707 6874 685 ndash410 1625 675 1788 1969
1 In these descriptions ldquonewrdquo indicates this is the first time that data from the specific source are being incorshyporated into the component estimate for the given year and ldquorevisedrdquo indicates that data from the specific source were incorporated previously and now revised data from that source are being incorporated
2 Revisions reflect the annual revision of BEArsquos international transactions accounts (ITAs) The revised ITA estimates were incorporated into the NIPAs at their ldquobest levelrdquo for 2010ndash2012 As a result there are differences between the NIPA estimates and the ITA estimates for 1999ndash2009 For more information on the revisions to the International Transactions Accounts see Barbara H Berman and Jeffrey R Bogen Annual Revision of the US International Transactions Accounts SUR VEY 93 (July 2013) 43ndash54 Additionally revised estimates for 1999ndash2007 reflect changes previously incorporated into the ITAs but not into the NIPAs because they affected years outside of the periods open for revision including the reclassification of distribution rights for film and teleshyvision recordings and the reallocation of adjustments for low-value imports and for inland freight in Canada and Mexico these changes were incorporated in the previously published NIPA estimates for 2008ndash2012
3 Revisions are not shown because this component was not previously published 4 The statistical discrepancy is gross domestic product (GDP) less gross domestic income (GDI) it is also
the difference between gross national product (GNP) and gross national income (GNI) which is GDI plus net income receipts from the rest of the world The statistical discrepancy arises because the product-side measures of GDP and GNP are estimated independently from the income-side measures of GDI and GNI
NOTE The new treatments of research and development of entertainment literary and artistic originals of ownership transfer costs and of defined benefit pension plans begin with the estimates for 1929 The improved estimates of employersrsquo contributions to state and local government-sponsored defined contribution pension plans begin with 1966 The improved measures of IRS section 179 expensing for sole proprietorships begin with the estimates for 1982 The improved estimates of the implicit services of commercial banks begin with 1985 The improved measures of wages paid by Indian tribal governments begin with the estimates for
1990 The improved methodology for distributing the income of regulated investment companies by type begins with the estimates for 1992 The improved classifications of wind and solar power structures the improved methodology for estimating the adjustment made to remove corporate partnersrsquo income from nonfarm proprietorsrsquo income and the improved estimates of mortgage interest paid begin with 1993 Updated measures of misreporting begin with the estimates for 2002 The improved treatment for the derivation of monetary interest paid on consumer loans begins with the estimates for 1980 For more information on the changes in definitions and in methodologies that were introduced as par t of the 2013 comprehensive revision of the NIPAs see ldquoPreview of the 2013 Comprehensive Revision of the National Income and Product Accounts Changes in Definitions and Presentationsrdquo SUR VEY 93 (March 2013) 13ndash39 and Nicole M Mayershyhauser and Sarah J Pack ldquoPreview of the 2013 Comprehensive Revision of the National Income and Product Accounts Statistical Changesrdquo SURVEY 93 (May 2013) 6ndash14
BEA Bureau of Economic Analysis BLS Bureau of Labor Statistics CCAdj Capital consumption adjustment DHHS Department of Health and Human Services FDIC Federal Deposit Insurance Corporation FRB Federal Reserve Board FY Fiscal year IRS Internal Revenue Service IVA Inventory valuation adjustment NIPA National income and product account OMB Office of Management and Budget USDA US Depar tment of Agriculture
- Improved Estimates of the National Income and Product Accounts Results of the 2013 Comprehensive Revision
-
- Annual Current-Dollar Estimates
-
- Domestic income and product (account 1)
-
- Product-side components
-
- Box Government Research and Development
-
- Income-side components
-
- Private enterprise income (account 2)
- Personal income and outlays (account 3)
- Government current receipts and expenditures (account 4)
- Foreign transactions (accounts 5 and 7)
-
- Box Discontinuities in the Estimates of Foreign Transactions in the National Income and Product Accounts
-
- Domestic capital (account 6)
-
- Annual Estimates of Real GDP and Real DPI
-
- Real GDP
- Real DPI
-
- Annual Prices
- Quarterly Real GDP
- Box New and Revised Source Data
- Box Data Availability
- Box Acknowledgments
-
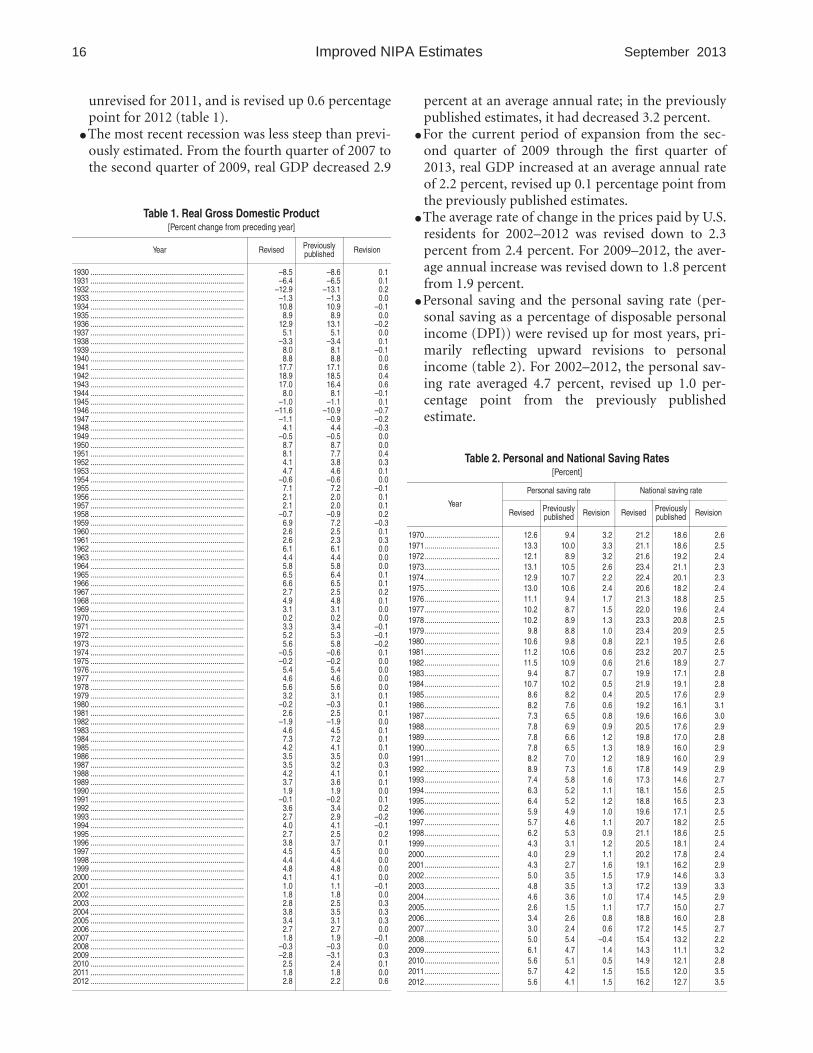

17
September 2013 SURVEY OF CURRENT BUSINESS
This article discusses the revisions that are attributshyable to the various definitional and statistical changes for each of the major NIPA aggregates and their comshyponents Specifically it discusses the following
Revisions to the annual current-dollar estimates in detail
Revisions to the annual estimates of real GDP and of prices (see page 32)
Revisions to the quarterly estimates of real GDP (see page 36)
Annual Current-Dollar Estimates GDP The revisions to the level of current-dollar GDP are upward and notable for all years of the revision peshyriod (1929ndash2012) the revisions exceed $100 billion by 1983 and reach about $560 billion (or 36 percent of the previously published estimate) for 2012 (table 3) These revisions reflect the definitional and statistical changes incorporated in this comprehensive revision (chart 1) In the aggregate changes in definitions (mainly the recognition of new forms of fixed investshyment) raise current-dollar GDP and gross domestic inshycome (GDI) for all years Statistical changes (improved source data and methodologies) tend to have smaller effects that are often negative
The definitional change that has the largest impact on the level of GDP is the capitalization of RampD which accounts for over half of the upward revision for all years from 1959 forward the largest impact (about $397 billion) is for 2012 Statistical changes have their
Chart 1 Sources of Revision to Current-Dollar Gross Domestic Product 1983ndash2012 Billions of dollars 600
500
400
300
200
100
0
ndash100
US Bureau of Economic Analysis
greatest impact for 2008 reducing GDP by about $57 billion of which about $44 billion is accounted for by the improved measurement of financial services
GDI By 1941 the revisions to GDI exceed $2 bilshylion from 1942 until the early 1970s the revisions
Table 3 Revisions to Gross Domestic Product Gross Domestic Income National Income and Personal Income
[Billions of dollars]
1959 1997 2002 2007 2010 2011 2012
Gross domestic product 159 2761 3379 4516 4594 4581 5598 Definitional
Capitalization of research and 164 2889 3857 4880 5034 5120 5260
development Capitalization of entertainment literary
87 2070 2444 3309 3625 3806 3967
and artistic originals Expanded set of ownership transfer
22 461 576 704 722 738 743
costs for residential fixed assets Accrual accounting for defined benefit
05 264 461 570 368 369 423
pension plans Reclassification of software to
49 93 377 297 318 208 126
intellectual property products 00 00 00 00 00 00 00 Statistical
Improved measurement of financial ndash05 ndash128 ndash478 ndash364 ndash440 ndash539 338
services 00 ndash108 ndash268 ndash237 ndash554 ndash501 ndash503 Other statistical ndash05 ndash19 ndash211 ndash128 114 ndash37 842
Gross domestic income 162 2499 3859 4194 4396 5437 6170 Definitional
Capitalization of research and 164 2889 3857 4880 5034 5120 5260
development Capitalization of entertainment literary
87 2071 2444 3309 3625 3806 3967
and artistic originals Expanded set of ownership transfer
22 461 576 704 722 738 743
costs for residential fixed assets Accrual accounting for defined benefit
05 264 461 570 368 369 423
pension plans 49 93 377 297 318 208 126 Statistical
Improved measurement of financial ndash02 ndash390 02 ndash686 ndash638 317 910
services Improved distribution of regulated
investment companies investment
00 ndash108 ndash268 ndash237 ndash554 ndash501 ndash503
income Improved measures of IRS section 179
00 00 00 00 00 00 00
expensing Improved mortgage interest paid
00 ndash117 ndash131 ndash211 ndash187 ndash164 ndash170
estimates 00 00 00 00 00 00 00 Other statistical ndash02 ndash164 400 ndash239 103 982 1583
National income 61 ndash256 283 ndash741 ndash719 368 957 Definitional
Capitalization of research and 60 210 341 72 63 43 03
development Capitalization of entertainment literary
12 235 185 394 304 325 335
and artistic originals Expanded set of ownership transfer
06 123 127 134 126 129 117
costs for residential fixed assets Accrual accounting for defined benefit
ndash07 ndash241 ndash348 ndash754 ndash685 ndash619 ndash575
pension plans 49 93 377 297 318 208 126 Statistical
Improved measurement of financial 01 ndash466 ndash58 ndash813 ndash782 325 954
services Improved distribution of regulated
investment companies investment
00 ndash102 ndash250 ndash222 ndash525 ndash469 ndash467
income Improved measures of IRS section 179
00 00 00 00 00 00 00
expensing Improved mortgage interest paid
00 ndash117 ndash131 ndash211 ndash187 ndash164 ndash170
estimates 00 00 00 00 00 00 00 Other statistical 01 ndash247 323 ndash380 ndash69 958 1591
Personal income 109 743 894 834 1133 2440 3127 Definitional
Capitalization of research and 107 634 931 761 1297 1147 1260
development Capitalization of entertainment literary
00 18 46 42 33 33 32
and artistic originals Expanded set of ownership transfer
00 ndash27 ndash22 ndash45 ndash45 ndash47 ndash48
costs for residential fixed assets Accrual accounting for defined benefit
ndash07 ndash235 ndash337 ndash738 ndash674 ndash608 ndash563
pension plans Accrual accounting for wages and
113 908 1244 1566 1984 1770 1839
salaries 00 ndash29 00 ndash63 00 00 00 Statistical
Improved measurement of financial 02 109 ndash37 73 ndash164 1293 1867
services Improved distribution of regulated
investment companies investment
00 ndash07 ndash148 ndash83 ndash94 12 05
income Improved measures of IRS section 179
00 336 ndash11 710 532 357 ndash263
expensing Improved mortgage interest paid
00 ndash117 ndash131 ndash211 ndash187 ndash164 ndash170
estimates 00 00 00 00 00 00 00 Other statistical 02 ndash102 252 ndash344 ndash414 1087 2296
Definitional revisions
Total revisions
Statistical revisions
1983 85 87 89 91 93 95 97 99 2001 03 05 07 09 11 2012
18
Improved NIPA Estimates September 2013
continue to grow slowly but steadily until becoming larger in the late 1970s The revisions exceed $100 bilshylion by 1984 and reach over $615 billion for 2012 The dollar impact of the definitional changes on the level of GDI is the same as the impact on GDP (chart 2) For most years from the mid-1980s through 2012 the upshyward revisions to GDI due to definitional changes are slightly offset by downward revisions due to statistical changes primarily reflecting the improved accounting of IRS section 179 expenses and the improved meashysures of financial services For 2009 2011 and 2012 the statistical revisions are notably upward and add to the total revision to GDI
Na tional income The impacts of a number of revishysions to GDI are the same as those for national income However because national income is net of consumpshytion of fixed capital (CFC) the recognition of RampD as investmentmdashwhich dominates the revisions to GDI and diminishes the relative impact of other changesmdashhas less impact on national income As a reshysult national income is generally affected more by the impacts of the other changes
The revisions to national income vary in both dishyrection and magnitude over time they are downward and small until 1979 and then they are negative and are generally larger through 2001 (chart 3) For 2002ndash2012 the revisions are of mixed sign (upward for 2002ndash2004 downward for 2005ndash2010 and upward for 2011 and 2012)
Chart 2 Sources of Revision to Current-Dollar Gross Domestic Income 1983ndash2012
Prior to 1980 both definitional and statistical changes lead to upward revisions for most years and for 1980ndash1990 both types of changes lead to downshyward revisions For 1991ndash2012 downward revisions due to statistical changes (particularly the improved measures of financial services and the improved acshycounting for IRS section 179 expenses) more than offshyset upward revisions due to definitional changes (particularly the upward impacts of capitalizing RampD and entertainment originals and of incorporating acshycrual-based measures for defined benefit pensions which more than offset the downward impact of inshycluding an expanded set of ownership transfer costs for residential fixed investment)
Personal in come The revisions to personal income are upward for most years for 1929ndash2012 (chart 4) The upward revisions are primarily accounted for by definitional changes particularly the adoption of acshycrual-based measures for defined benefit pension plans statistical changes do not exceed $2 billion until 1983
Additional detail on GDP GDI and other NIPA agshygregates and their major components is presented beshylow The accompanying tables show the revisions for 1959 2002 2007 and 2010ndash2012 as allocated among the changes in definition and the statistical improveshyments Appendix A presents the revised current-dollar estimates for 2007 2009 and 2012 shows the revisions in level for 2007ndash2012 and summarizes the major
Chart 3 Sources of Revision to Current-Dollar National Income 1979ndash2012
Billions of dollars
US Bureau of Economic Analysis
700
600
500
400
300
200
100
0
ndash100
ndash200 1983 85 87 89 91 93 95
Definitional revisions
97 99 2001 03 05 07 09
Total revisions
Statistical revisions
11 2012
Billions of dollars
US Bureau of Economic Analysis
1979 81 83 85 87 89 91 93 95 97
150
100
50
0
ndash50
ndash100
ndash150
ndash200
Definitional revisions
Total revisions
Statistical revisions
99 2001 03 05 07 09 11 2012
19
September 2013 SURVEY OF CURRENT BUSINESS
Chart 4 Sources of Revision to Current-Dollar Personal Income 1983ndash2012 Billions of dollars
350
300
250
200
150
100
50
0
ndash50
ndash100
ndash150 1983 85 87 89 91 93 95 97 99 2001 03 05 07 09 11 2012
Definitional revisions
Total revisions
Statistical revisions
US Bureau of Economic Analysis
source data incorporated and the sources of revision for selected detailed components
The remainder of this section is organized according to the seven-account framework for the NIPAs
Domestic income and product account 1 shows the consolidated production of all sectors of the economy as the sum of goods and services sold to final users and as the sum of incomes generated by the production of those goods and services
Private enterprise income account 2 provides addishytional information on the sources and uses of income by private enterprises
Personal income and outlays account 3 shows the sources and uses of income of individuals entershyprises that are owned by households and nonprofit institutions that serve households
Government current receipts and expenditures account 4 shows the receipts and uses of income for federal state and local governments (including government enterprises)
For foreign transactions the foreign transactions current account account 5 summarizes the current transactions of the United States with the rest of the world and the foreign transactions capital account account 7 summarizes the capital transactions with the rest of the world
Domestic capital account 6 shows the relationship between saving and investment in the US econshyomy
Domestic income and product (account 1) GDP The upward revisions to GDP begin with 1929 though the revisions are less than $10 billion until 1953 The revisions for this early period primarily reshyflect the impact of recognizing new forms of fixed inshyvestment on gross private domestic investment and on government consumption expenditures and gross inshyvestment
With few exceptions the upward revisions to GDP grow larger throughout the period of revision As a percentage of the previously published level of GDP the revisions range from 10 percent to 37 percent the revisions average 28 percent for 1929ndash2012 As noted above definitional changes have a far greater impact on the level of GDP than statistical changes for most years statistical changes result in downward revisions to GDP
GDI and the statistical discrepancy Through 1977 the revisions to GDI increase steadily but slowly for 1978ndash2006 the revisions increase more rapidly prishymarily reflecting the impacts of the definitional changes For 2007ndash2012 the revisions vary in size prishymarily reflecting the impacts of the statistical changes As a percentage of the previously published level of GDI the revisions range from 10 percent to 39 pershycent of GDI For 1929ndash2012 the revisions average 28 percent of the previously published level of GDI
For 1929ndash1992 the statistical discrepancymdashGDP less GDImdashis revised by less than $10 billion in absolute value5 For 1993ndash2000 for 2004ndash2008 and for 2010 upward revisions to GDP are greater than upward revishysions to GDI and revisions to the statistical discrepshyancy range from about $16 billion to about $101 billion For 2001ndash2003 for 2009 and for 2011 and 2012 upward revisions to GDI are greater than upshyward revisions to GDP and the statistical discrepancy is revised down For 1992ndash2012 the revised estimates (without regard to sign) of the statistical discrepancy average 07 percent of GDP the same percentage as in the previously published estimates
Product-side components
Personal consumption expenditures (PCE) For 1929ndash1984 the revisions to PCE are downward and are less than $5 billion reflecting the capitalization of RampD Beginning with 1985 the revisions are downshyward for most years The largest downward revision (about $54 billion) is for 2002 (table 4) For 1985 and
5 In theory GDP should equal GDI in practice GDP and GDI differ because their components are estimated using largely independent and less-than-perfect source data See the box ldquoThe Statistical Discrepancyrdquo in Robert P Parker and Eugene P Seskin ldquoAnnual Revision of the National Income and Product Accountsrdquo SURVEY 77 (August 1997) 19
20 Improved NIPA Estimates September 2013
Table 4 Revisions to Personal Consumption Expenditures [Billions of dollars]
1959 1997 2002 2007 2010 2011 2012
Total revision ndash02 ndash99 ndash539 ndash279 ndash138 ndash172 300 Definitional ndash01 ndash45 ndash57 ndash51 ndash79 ndash108 ndash110
Capitalization of research and development ndash01 ndash45 ndash57 ndash51 ndash79 ndash108 ndash110 Statistical ndash01 ndash54 ndash482 ndash228 ndash59 ndash64 410
Improved measurement of financial services 00 ndash73 ndash193 ndash157 ndash364 ndash300 ndash295 Other statistical ndash01 19 ndash289 ndash71 305 236 705
Source of revision by component Goods 00 00 ndash114 ndash23 ndash21 ndash221 ndash135
Durable goods 00 00 ndash67 ndash38 ndash87 ndash165 ndash162 Definitional 00 00 00 00 00 00 00 Statistical 00 00 ndash67 ndash38 ndash87 ndash165 ndash162
Nondurable goods 00 00 ndash47 14 66 ndash56 28 Definitional 00 00 00 00 00 00 00 Statistical 00 00 ndash47 14 66 ndash56 28
Services ndash02 ndash99 ndash425 ndash254 ndash118 49 434 Definitional ndash01 ndash45 ndash57 ndash51 ndash79 ndash108 ndash110
Capitalization of research and development ndash01 ndash45 ndash57 ndash51 ndash79 ndash108 ndash110 Statistical ndash01 ndash54 ndash368 ndash203 ndash39 157 544
Improved measurement of financial services 00 ndash73 ndash193 ndash157 ndash364 ndash300 ndash295 Other statistical ndash01 19 ndash175 ndash46 325 457 839
1986 there are small upward revisions of about $5 billion and about $2 billion respectively the only noshytable upward revision to PCE is for 2012 ($30 billion)
For 1929ndash1997 revisions to PCE are due to revishysions to services primarily reflecting the impacts of recognizing RampD as investment (for 1929 forward) and the improved measures of financial services (for 1985 forward)
For 1998ndash2011 revisions to PCE also reflect the inshycorporation of a significant amount of new and revised source data BEArsquos 2007 benchmark I-O accounts tabshyulations of Census Bureau data from the service anshynual survey (SAS) the annual retail trade survey the current population survey the housing vacancy survey and the American housing survey and data from the Energy Information Administration The overall imshypacts of these data result in downward revisions to PCE for both goods and services for most years
Private fixed investment Private fixed investment is revised up for all years from 1929 forward prior to 2003 the revisions are due almost exclusively to the impacts of recognizing RampD and entertainment origishynals as nonresidential fixed investment and of expandshying the ownership transfer costs that are recognized as residential fixed investment (table 5)
For 2003 forward the revisions to private fixed inshyvestment also generally reflect upward revisions to equipment and to the change in private inventories that are partly offset by downward revisions to nonresshyidential structures
Nonresidential structures Revisions to this comshyponent begin with 2002 and are downward for most years the largest downward revision is for 2008 (about $34 billion) The revisions are exclusively due to statisshytical changesmdashprimarily the incorporation of data from the 2007 benchmark I-O accounts of revised peshytroleum footage drilled and expenditure data from trade sources and the Census Bureau and of revised Census Bureau construction spending data
Equipment Private equipment (excluding softshyware) was revised up for 2003 forward reflecting stashytistical changes including the incorporation of BEArsquos 2007 benchmark I-O accounts of new and revised data from Census Bureau surveys of manufactures and of other new and revised source data
The revisions to equipment are less than $10 billion until 2005 and remain less than $20 billion until 2010 For 2010ndash2012 new and revised Census Bureau anshynual survey of manufactures data for shipments result in upward revisions particularly to information proshycessing equipment the upward revisions to equipment range from about $31 billion for 2010 to about $43 bilshylion for 2012
Intellectual property products This new category of fixed investment consists of expenditures for softshyware for RampD and for entertainment literary and arshytistic originals
Private investment in software was previously inshycluded in the ldquoequipment and softwarerdquo category Softshyware is not revised until 2003 for 2003ndash2009 there are small generally downward revisions of less than $2 billion For 2010ndash2012 the downward revisions beshycome larger reaching about $12 billion for 2012 The revisions reflect statistical changes that result primarily from the incorporation of data from the 2007 benchshymark I-O accounts and of new and revised Census Bushyreau SAS data
Table 5 Revisions to Gross Private Domestic Investment [Billions of dollars]
1959 1997 2002 2007 2010 2011 2012
Total revision Definitional
Capitalization of research and development
Capitalization of entertainment literary and artistic originals
Expanded set of ownership transfer costs for residential fixed assets
Reclassification of software to intellectual property products
Statistical Source of revision by component
Private fixed investment Nonresidential
Structures Definitional Statistical
Equipment 1 Definitional Statistical
Intellectual property products Definitional
Capitalization of research and development
Capitalization of entertainment literary and ar tistic originals
Statistical revision to software Residential
Definitional Expanded set of ownership transfer
costs for residential fixed assets Statistical
Change in private inventories Definitional Statistical
72 71
44
22
05
00 01
71 66 00 00 00 00 00 00
66
44
22 00 05 05
05 00 00 00 00
2069 2069
1344
461
264
00 00
2070 1805
00 00 00 00 00 00
1805
1344
461 00
265 264
264 01
ndash01 00
ndash01
2780 2694
1657
576
461
00 86
2716 2235
01 00 01 00 00 00
2233
1657
576 00
481 461
461 20 65 00 65
3485 3508
2233
704
570
00 ndash23
3432 2831 ndash280
00 ndash280
182 00
182 2937
2233
704 ndash08 600 570
570 30 54 00 54
3635 3492
2402
722
368
00 143
3603 3198 ndash143
00 ndash143
307 00
307 3124
2402
722 ndash89 405 368
368 37 31 00 31
3772 3659
2552
738
369
00 113
3773 3303 ndash242
00 ndash242 367
00 367
3290
2552
738 ndash111 471 369
369 102 ndash02
00 ndash02
4129 3857
2691
743
423
00 272
4049 3487 ndash261
00 ndash261 431
00 431
3434
2691
743 ndash118 563 423
423 140
80 00 80
1 ldquoEquipmentrdquo is a new NIPA category Revisions are calculated by subtracting the new category from a comparable category derived from the previously published NIPA category ldquoprivate fixed investment in equipshyment and softwarerdquo
21 September 2013 SURVEY OF CURRENT BUSINESS
Expenditures for RampD and for entertainment origishynals were previously treated as intermediate expenses and were not recorded as final expenditures Recognizshying RampD and entertainment originals as fixed investshyment boosts the level of investment for all years For RampD private investment exceeds $10 billion in 1969 and reaches nearly $270 billion in 2012 For entertainshyment originals private investment exceeds $10 billion in 1979 and reaches over $74 billion in 2012
Residential fixed investment This component is revised up generally by increasing amounts for all years The revisions are less than $1 billion until 1965 remain less than $5 billion until 1978 and reach a peak of about $81 billion for 2005 For 2006 forward the upward revisions are of lesser amounts but remain mostly above $40 billion
The revisions for each year are primarily due to the expanded set of ownership transfer costs that are recshyognized as residential fixed investment Statistical changesmdashprimarily reflecting the incorporation of data from the 2007 benchmark I-O accounts and of new and revised Census Bureau construction spending datamdashare generally small and upward after 2000
Change in private inventories Revisions to the change in private inventories (ldquoinventory investmentrdquo) begin with 2002 and are mostly upward they are less than $10 billion for each year The revisions primarily reflect the impact on nonfarm inventory investment of the incorporation of new and revised Census Bureau
data on inventory book values and of new commodity price weights from the 2007 benchmark I-O accounts Revisions to farm inventory investment are less than $5 billion for all years and primarily reflect revised US Department of Agriculture (USDA) farm statistics for 2010ndash2012 For 2012 the revision to farm invenshytory investment of over $4 billion exceeds the revision to nonfarm inventories this revision also reflects the incorporation of revised USDA data
Net exports of goods and services Revisions to net exports begin with 1985 and are of mixed sign but they do not exceed $2 billion in absolute value until 2002 (table 6) Revisions are upward for 2002ndash2007 downward for 2008ndash2011 and upward for 2012 The largest upward revision is for 2012 (about $13 billion) the largest downward revision is for 2010 (almost $7 billion)
For 1985ndash1998 the revisions to net exports are due solely to the impact of the improved measures of fishynancial services on the exports of services
For 1999ndash2012 the revisions to net exports are prishymarily due to the incorporation of revised data from BEArsquos international transactions accounts (ITAs) there are no definitional revisions to net exports6 For exshyports of goods and services the revisions are small for most years the largest revision is an upward revision of
6 Royalties for RampD and for entertainment originals were already included in the previously published estimates of exports of services and of imports of services
Data Availability An extensive set of estimates is presented in ldquoNational incorporated in this comprehensive NIPA revision Income and Product Accountsrdquo (NIPAs) in this issue The following additional revised NIPA estimates and These estimates and annual estimates for 1929 forward related tables will be released on BEArsquos Web site and then and quarterly estimates for 1947 forward are available on published in upcoming issues of the SURVEY NIPA table BEArsquos Web site at wwwbeagov 29 (personal income by households and by nonprofit
The October SURVEY OF CURRENT BUSINESS will present institutions serving households) tables 315ndash317 (govshyrevised estimates of fixed assets and of consumer durable ernment spending by function) table 318 (reconciliashygoods and revised estimates of real inventories sales and tion of NIPA federal government estimates with federal inventory-sales ratios for manufacturing and trade for budget data) table 319 (reconciliation of NIPA state and the fourth quarter of 2009 through the second quarter of local government estimates with Census Bureau data) 2013 tables 320 and 321 (state government and local govern-
The October SURVEY will also present revised estimates ment current receipts and expenditures) and tables 322 of state personal income for 2001ndash2012 that incorporate and 323 (not seasonally adjusted estimates of federal the results of this comprehensive NIPA revision government and state and local government current
The November SURVEY will feature the ldquoUpdated Sum- receipts and expenditures) table 510 (changes in the net mary of NIPA Methodologiesrdquo which lists the principal stock of produced assets) NIPA table 712 (imputations source data and estimating methods that are used in pre- in the NIPAs) table 715 (reconciliation of net farm paring the current-dollar and chained-dollar estimates of income in the NIPAs with net farm income from the US GDP Department of Agriculture) and table 719 (reconcilia-
The January SURVEY will present the results from the tion of NIPA income and outlays of nonprofit institushy2007 benchmark input-output accounts which are tions with IRS revenue and expenses)
22 Improved NIPA Estimates September 2013
Table 6 Revisions to Net Exports of Goods and Services [Billions of dollars]
1959 1997 2002 2007 2010 2011 2012
Total revision 00 ndash06 22 33 ndash69 ndash06 127 Definitional 00 00 00 00 00 00 00 Statistical 00 ndash06 22 33 ndash69 ndash06 127
Improved measurement of financial services 00 ndash07 ndash17 ndash15 ndash29 ndash32 ndash36 Other statistical 00 01 39 48 ndash40 26 163
Source of revision by component Exports of goods and services 00 ndash06 17 40 ndash09 70 119
Goods 00 00 123 33 ndash01 ndash09 ndash68 Definitional 00 00 00 00 00 00 00 Statistical 00 00 123 33 ndash01 ndash09 ndash68
Services 00 ndash06 ndash106 07 ndash08 79 187 Definitional 00 00 00 00 00 00 00 Statistical 00 ndash06 ndash106 07 ndash08 79 187
Improved measurement of financial services 00 ndash07 ndash17 ndash15 ndash29 ndash32 ndash36
Other statistical 00 01 ndash89 22 21 111 223 Imports of goods and services 00 00 ndash05 07 59 76 ndash09
Goods 00 00 42 ndash04 42 54 35 Definitional 00 00 00 00 00 00 00 Statistical 00 00 42 ndash04 42 54 35
Services 00 00 ndash47 13 17 23 ndash44 Definitional 00 00 00 00 00 00 00 Statistical 00 00 ndash47 13 17 23 ndash44
about $12 billion for 2012 For imports of goods and services the revisions are less than $5 billion in absoshylute value for each year except for 2010 and 2011 when they are about $60 billion and about $75 billion reshyspectively
Government consumption expenditures and gross investment Government consumption expenditures and gross investment (ldquogovernment spendingrdquo) is reshyvised up for each year for 1961 forward the revisions exceed $10 billion and generally increase until about 2000 after which they are fairly steady through 2012 (table 7) The largest revision is for 2007 (about $128 billion) For 1929ndash1975 the revisions to government spending are dominated by upward revisions to federal spending For 1976ndash1988 upward revisions to federal spending are partly offset by downward revisions to state and local spending For 1989ndash2012 upward revishysions to state and local spending steadily increase peaking at about $57 billion for 2004 and supplementshying the upward revisions to federal spending
For federal spending both defense and nondefense spending contribute to the upward revisions Beginshyning with 1992 the upward revisions to defense spending begin to decrease while the revisions to nonshydefense spending increase throughout the period
Revisions to defense spending reflect upward revishysions to consumption expenditures until 1979 and upshyward revisions to gross investment for the entire period Defense consumption expenditures are revised up for 1929ndash1978 the largest upward revision (just over $5 billion) is for 1970 Defense consumption exshypenditures are revised down for 1979ndash2012 the largest downward revision (almost $52 billion) is for 2012 The revisions reflect the adoption of accrual-based measures for defined benefit pension plans which have an upward impact in early years but a downward
impact in the recent period and the effects of removshying RampD expenditures from consumption The upshyward revisions to defense gross investment are more than accounted for by the capitalization of RampD exshypenditures (For more on the impacts on government spending of recognizing RampD as investment see the box ldquoGovernment Research and Developmentrdquo)
The revisions to nondefense spending throughout the period are due primarily to the impact on gross inshyvestment of capitalizing RampD revisions to consumpshytion expenditures are small and mostly downward
For state and local spending revisions also begin with 1929 The revisions are upward and less than $3 billion through 1975 are downward and larger for 1976ndash1988 and are upward and even larger for 1989ndash2012 For 1976ndash1988 the downward revisions are due to the impacts of removing RampD expenditures
Table 7 Revisions to Government Consumption Expenditures and Gross Investment
[Billions of dollars]
1959 1997 2002 2007 2010 2011 2012
Total revision 89 798 1116 1277 1165 989 1042 Definitional 93 866 1220 1424 1621 1569 1513
Capitalization of research and development Accrual accounting for defined benefit
44 772 844 1127 1303 1361 1386
pension plans 49 93 377 297 318 208 126 Statistical ndash04 ndash68 ndash104 ndash147 ndash456 ndash580 ndash471
Improved measurement of financial services 00 ndash29 ndash57 ndash65 ndash162 ndash170 ndash173 Other statistical
Source of revision by component ndash04 ndash39 ndash47 ndash82 ndash294 ndash411 ndash298
Federal 82 514 600 735 808 820 814
Defense 71 216 191 164 151 150 80 Consumption expenditures 19 ndash120 ndash226 ndash493 ndash493 ndash493 ndash516
Definitional Capitalization of research and
15 ndash150 ndash259 ndash497 ndash518 ndash539 ndash541
development Accrual accounting for defined benefit
ndash19 55 ndash31 ndash116 ndash40 ndash30 00
pension plans 34 ndash205 ndash228 ndash381 ndash478 ndash509 ndash541 Statistical 04 30 33 04 25 46 25
Gross investment 52 337 417 658 643 643 595 Definitional
Capitalization of research and 57 336 414 654 653 666 643
development 57 336 414 654 653 666 643 Statistical ndash05 01 03 04 ndash10 ndash23 ndash48
Nondefense 11 299 409 570 658 669 735 Consumption expenditures 00 ndash68 ndash76 ndash12 ndash26 ndash36 37
Definitional Capitalization of research and
00 ndash130 ndash197 ndash225 ndash256 ndash224 ndash203
development Accrual accounting for defined benefit
ndash06 ndash46 ndash100 ndash88 ndash110 ndash83 ndash51
pension plans 06 ndash84 ndash97 ndash138 ndash146 ndash141 ndash152 Statistical
Improved measurement of financial 00 62 121 213 230 188 240
services 00 00 ndash01 00 00 00 00 Other statistical 00 62 122 214 230 188 240
Gross investment 11 366 484 583 683 706 698 Definitional
Capitalization of research and 11 371 486 572 667 666 644
development 11 371 486 572 667 666 644 Statistical 00 ndash05 ndash02 11 16 40 54
State and local 06 283 516 543 358 170 228 Consumption expenditures 05 214 416 425 221 ndash06 56
Definitional Capitalization of research and
08 369 677 780 902 821 792
development Accrual accounting for defined benefit
00 ndash13 ndash24 ndash35 ndash41 ndash36 ndash27
pension plans 09 382 701 816 943 857 820 Statistical
Improved measurement of financial ndash03 ndash155 ndash261 ndash355 ndash681 ndash827 ndash736
services 00 ndash29 ndash56 ndash65 ndash161 ndash169 ndash173 Other statistical ndash03 ndash126 ndash205 ndash290 ndash520 ndash658 ndash564
Gross investment 02 69 100 118 137 175 172 Definitional
Capitalization of research and 02 69 100 141 173 178 178
development 02 69 100 141 173 178 178 Statistical 00 00 00 ndash23 ndash36 ndash03 ndash06
23 September 2013 SURVEY OF CURRENT BUSINESS
from consumption of incorporating accrual-based measures for defined benefit pension plans and of other changes including the incorporation of imshyproved measures of state and local government-sponshysored defined contribution pension plans beginning with 1985 the downward revisions also reflect the imshyproved measures of financial services7 These downshyward revisions are partly offset by upward revisions due to the impact on gross investment of capitalizing RampD and the impact on consumption expenditures from the addition of CFC for RampD For 1989ndash2012 upward revisions to both consumption expenditures and gross investment for most years primarily reflect the impacts of incorporating accrual-based measures for defined benefit pension plans and the recognition
7 With this comprehensive revision BEA improved its coverage of state and local defined contribution pension plans by incorporating new source data from the Bureau of Labor Statistics employer costs for employee comshypensation survey See ldquoPreview Statistical Changesrdquo 8ndash9
Government Research and Development In addition to the definitional change that reclassifies government research and development (RampD) spendshying from consumption to investment the new treatshyment of RampD also changes the classification of government spending between the federal governshyment and state and local governments The federal government is a major funder of RampD through research grants while state and local governments are major producers of RampD at public universities and hospitals
With the recognition of RampD as a capital asset ownership of the RampD asset must be assigned to a secshytor of the economy BEA adopted the convention that the entity that funds RampD will be the owner of the RampD asset Thus federally funded RampD performed at public universities and hospitals is recorded as federal gross investment in intellectual property products1
Accordingly federal research grants-in-aid to state and local governments are reclassified as federal gross investment and as state and local sales to other sectors previously they had been recorded as federal current transfer payments and as state and local current transshyfer receipts
In addition to these changes BEA introduced new source data for federal RampD spending Previously the estimates for RampDmdashwhich were treated as intermedishyate goods and services purchasedmdashhad been based on federal budget data the newly published estimates for federal RampD investment are based on data from the National Science Foundation surveys of RampD by pershyformer and by funder when available
1 See ldquoPreview Changes in Definitions and Presentationsrdquo 15ndash16
of RampD as investment these upward revisions are partly offset by downward revisions due to the imshyproved measures of financial services
Income-side components
Compensation of employees paid This aggregate shows the income accruing to employees for their work for domestic production it includes compensation paid to the rest of the world and excludes compensashytion received from the rest of the world8
The revisions to compensation reflect revisions to wages and salaries and to supplements to wages and salaries (table 8) Prior to 1992 the revisions are due exclusively to revisions to supplements
Revisions to wages and salaries reflect only statisshytical changes the introduction of accrual accounting for wages and salaries affects only the measure of wages and salaries in personal income (the measures of wages and salaries in GDI and in national income were alshyready on an accrual basis) The statistical revisions inshyclude updated measures of misreporting based on data from the IRS revised data on wages and salaries paid to and received from the rest of the world from the ITAs improved measures of wages paid by Indian tribal governments revised estimates of wages from cafeteria plans and the incorporation of new and reshyvised data from the Bureau of Labor Statistics (BLS) Quarterly Census of Employment and Wages
Revisions to wages and salaries begin with 1992 For 1992ndash2012 revisions to wages and salaries are of mixed sign the largest downward revision is for 2010
8 This measure of compensation differs from the measure that is a comshyponent of national income The national income measure excludes comshypensation paid to the rest of the world and includes compensation received from the rest of the world
Table 8 Revisions to Compensation of Employees Paid [Billions of dollars]
1959 1997 2002 2007 2010 2011 2012
Total revision 53 491 333 458 ndash19 ndash166 196 Definitional
Accrual accounting for defined benefit 53 421 315 550 35 ndash134 ndash234
pension plans 53 421 315 550 35 ndash134 ndash234 Accrual accounting for wages and salaries 00 00 00 00 00 00 00
Statistical Source of revision by component
00 70 18 ndash92 ndash54 ndash32 430
Wages and salaries 00 32 13 ndash169 ndash261 ndash225 216 Definitional 00 00 00 00 00 00 00
Accrual accounting for wages and salaries 00 00 00 00 00 00 00 Statistical 00 32 13 ndash169 ndash261 ndash225 216
Supplements to wages and salaries 54 458 320 627 244 59 ndash20 Definitional
Accrual accounting for defined benefit 53 421 315 550 35 ndash134 ndash234
pension plans 53 421 315 550 35 ndash134 ndash234 Statistical Employer contributions for employee
01 37 05 77 209 193 214
pension and insurance funds 53 459 321 609 231 64 ndash15 Definitional
Accrual accounting for defined benefit 53 421 315 550 35 ndash134 ndash234
pension plans 53 421 315 550 35 ndash134 ndash234 Statistical
Employer contributions for government 00 38 06 59 196 198 219
social insurance 00 00 ndash01 18 13 ndash05 ndash05 Definitional 00 00 00 00 00 00 00 Statistical 00 00 ndash01 18 13 ndash05 ndash05
24 Improved NIPA Estimates September 2013
(just over $26 billion) and the largest upward revision is for 2012 (over $21 billion)
The revisions to supplements are upward for 1929ndash1975 are downward for 1976ndash1988 and are upshyward for 1989ndash2002 Revisions are downward for 2003 are upward for 2004ndash2011 and are downward for 2012 The largest upward revision is for 2000 (almost $70 billion) and the largest downward revision is for 1984 ($28 billion)
The revisions to supplements primarily reflect the impact on employer contributions for employee penshysion and insurance funds of incorporating accrual-based measures for defined benefit pension plans Beshyginning with 1992 statistical revisions exceed $2 bilshylion and reach a peak of over $21 billion for 2012 Statistical revisions in the later years largely reflect new pensions data from the Department of Labor as well as new medical expenditures panel survey data from the Department of Health and Human Services
Taxes on production and imports The revisions to this component begin with 2002 revisions are downshyward for 2002 are upward for 2003ndash2010 and are downward for 2011 and 2012 (table 9) The largest upshyward revision is for 2007 (over $7 billion) and the largest downward revision is for 2012 (about $7 bilshylion) For each year the revisions are exclusively due to statistical changes including upward revisions to property taxes and to state and local general sales taxes that are based primarily on the incorporation of new and revised Census Bureau government finances data
Table 9 Revisions to Taxes on Production and Imports Less Subsidies
[Billions of dollars]
1959 1997 2002 2007 2010 2011 2012
Total revision 00 00 ndash02 74 32 08 ndash36 Definitional 00 00 00 00 00 00 00 Statistical 00 00 ndash02 74 32 08 ndash36 Source of revision by component
Taxes on production and imports 00 00 ndash02 74 21 ndash08 ndash71 Definitional 00 00 00 00 00 00 00 Statistical 00 00 ndash02 74 21 ndash08 ndash71
Less Subsidies 00 00 00 00 ndash11 ndash16 ndash35 Definitional 00 00 00 00 00 00 00 Statistical 00 00 00 00 ndash11 ndash16 ndash35
Subsidies This component is revised for 1929ndash1958 and for 2006ndash2012 (table 9) For 1929ndash1958 upward revisions result from the adoption of accrual-based measures for defined benefit pension plans for federal government enterprises which are netted against subshysidies in this period9 For 2006ndash2012 the revisions are generally downward and small reaching a peak of less than $4 billion for 2012 The revisions result primarily
9 As part of the 2003 comprehensive revision the current surplus of govshyernment enterprises was reclassified as a government receipt for 1959 forshyward before this revision it was classified as a negative government expenditure and netted against subsidies The available source data do not allow the reclassification prior to 1959
from new and revised federal budget data and the reshyclassification of certain federal transactions from subshysidies to other transactions (such as capital transfers to business)10
Net operating surplus This component is a profits-like measure that shows business income after subshytracting the costs of compensation of employees taxes on production and imports less subsidies and CFC from gross value added but before subtracting financshying costs (such as net interest) and business transfer payments Net operating surplus consists of net intershyest and miscellaneous payments (of domestic indusshytries) business current transfer payments (net) proprietorsrsquo income with inventory valuation adjustshyment (IVA) and capital consumption adjustment (CCAdj) rental income of persons with CCAdj corposhyrate profits with IVA and CCAdj (of domestic indusshytries) and the current surplus of government enterprises Except for the current surplus of governshyment enterprises discussed below the revisions to these components are discussed in the section on the private enterprise income account
Revisions to net operating surplus begin with 1931 and are less than $5 billion until 1973 Revisions are upward for 1973ndash1985 are downward for 1986ndash2002 are upward for 2003 are downward for 2004ndash2010 and are upward for 2011 and 2012 (table 10) The largest downward revision is for 2008 (almost $197 bilshylion) and the largest upward revision is for 2012 (alshymost $70 billion)
Current surplus of government enterprises The revisions to this component begin with 1959 and are fairly small throughout the period reaching $5 billion in absolute value for only 4 years all after 2005 Prior to 2006 the revisions are due primarily to the adoption of accrual-based measures for defined benefit pension plans which results in upward revisions for federal enterprises that are partly offset by downward revishysions to state and local enterprises For 2006ndash2009 the adoption of accrual-based measures results in downshyward revisions that are supplemented by downward statistical revisions For 2011 and 2012 upward statisshytical revisions more than offset the downward revishysions due to the adoption of accrual-based measures for defined benefit pension plans
CFC CFC is revised up for all years revisions reach $10 billion by 1959 and grow steadily thereafter reachshying over $531 billion for 2012 (table 11) Throughout
10 Payments to lenders who refinanced mortgages through the Home Affordable Modification Program are reclassified from subsidies to capital transfers to business based on new information from the Department of Treasury In addition certain payments made to commercial banks through the federal governmentrsquos Student Loan Purchasing Authority are reclassishyfied as financial transactions in order to maintain consistency with how BEA treats similar transactions related to other student loan programs
September 2013 SURVEY OF CURRENT BUSINESS 25
the period the revisions to private CFC exceed those to government CFC and the revisions to business CFC exceed revisions to the CFC of households and institushytions (that is nonprofit institutions) The upward revi-
Table 10 Revisions to Net Operating Surplus [Billions of dollars]
1959 1997 2002 2007 2010 2011 2012
Total revision 08 ndash753 ndash43 ndash1305 ndash700 436 698 Definitional 06 ndash211 26 ndash479 28 177 237
Capitalization of research and development Capitalization of enter tainment literary and
12 235 185 394 304 325 335
artistic originals Expanded set of ownership transfer costs for
06 123 127 134 126 129 117
residential fixed assets Accrual accounting for defined benefit
ndash07 ndash241 ndash348 ndash754 ndash685 ndash619 ndash575
pension plans ndash04 ndash327 61 ndash253 283 342 361 Statistical 02 ndash542 ndash69 ndash826 ndash728 259 461
Improved measurement of financial services Improved distribution of regulated
00 ndash108 ndash268 ndash237 ndash554 ndash501 ndash503
investment companies investment income Improved measures of IRS section 179
00 00 00 00 00 00 00
expensing 00 ndash117 ndash131 ndash211 ndash187 ndash164 ndash170 Improved mor tgage interest paid estimates 00 00 00 00 00 00 00 Other statistical
Source of revision by component 02 ndash317 329 ndash379 13 924 1134
Private enterprises 12 ndash787 ndash50 ndash1258 ndash666 408 635 Definitional 11 ndash245 18 ndash458 66 216 270
Capitalization of research and development Capitalization of enter tainment literary and
12 235 185 394 304 325 335
artistic originals Expanded set of ownership transfer costs for
06 123 127 134 126 129 117
residential fixed assets Accrual accounting for defined benefit
ndash07 ndash241 ndash348 ndash754 ndash685 ndash619 ndash575
pension plans 00 ndash361 54 ndash233 321 381 394 Statistical 01 ndash542 ndash68 ndash800 ndash732 192 365
Improved measurement of financial services Improved distribution of regulated
00 ndash108 ndash268 ndash237 ndash554 ndash501 ndash503
investment companies investment income Improved measures of IRS section 179
00 00 00 00 00 00 00
expensing 00 ndash117 ndash131 ndash211 ndash187 ndash164 ndash170 Improved mor tgage interest paid estimates 00 00 00 00 00 00 00 Other statistical 01 ndash317 330 ndash353 09 857 1038
Current surplus of government enterprises ndash05 34 07 ndash46 ndash34 27 63 Definitional
Accrual accounting for defined benefit ndash04 34 07 ndash20 ndash38 ndash39 ndash33
pension plans ndash04 34 07 ndash20 ndash38 ndash39 ndash33 Statistical ndash01 00 00 ndash27 04 66 97
Table 11 Revisions to Consumption of Fixed Capital [Billions of dollars]
1959 1997 2002 2007 2010 2011 2012
Total revision 100 2762 3571 4969 5082 5158 5312 Definitional 104 2679 3516 4808 4971 5077 5257
Capitalization of research and development Capitalization of enter tainment literary and
75 1836 2258 2914 3322 3481 3632
artistic originals Expanded set of ownership transfer costs for
17 338 449 570 596 608 626
residential fixed assets 12 505 809 1324 1053 988 999 Statistical
Source of revision by component ndash04 83 55 161 111 81 55
Private 58 2004 2740 3888 3836 3870 4015 Business 47 1494 1929 2605 2780 2859 3004
Definitional Capitalization of research and
48 1416 1891 2413 2640 2744 2884
development Capitalization of enter tainment literary
30 1027 1364 1713 1932 2028 2153
and artistic originals Expanded set of ownership transfer costs
17 338 449 570 596 608 626
for residential fixed assets 01 51 78 130 112 107 105 Statistical ndash01 78 38 192 140 115 120
Households and institutions 11 509 811 1282 1056 1012 1011 Definitional
Capitalization of research and 12 491 781 1268 1028 972 987
development Expanded set of ownership transfer costs
01 37 50 74 87 91 94
for residential fixed assets 11 454 731 1194 941 881 894 Statistical 00 18 30 14 28 40 24
Government 41 758 832 1081 1246 1287 1297 Federal 41 706 758 1002 1150 1194 1207
Definitional Capitalization of research and
43 716 768 1021 1170 1220 1236
development 43 716 768 1021 1170 1220 1236 Statistical ndash02 ndash10 ndash10 ndash19 ndash20 ndash26 ndash29
State and local 01 52 72 79 94 93 89 Definitional
Capitalization of research and 01 56 76 106 133 142 151
development 01 56 76 106 133 142 151 Statistical 00 ndash04 ndash04 ndash27 ndash39 ndash49 ndash62
sions to business CFC exceed $300 billion for 2012 and are primarily due to the capitalization of RampD and to a lesser degree of entertainment originals
For households and institutions the upward revishysions which exceed $101 billion for 2012 are primarily due to the expanded set of ownership transfer costs for residential fixed assets these revisions are suppleshymented by smaller upward revisions due to the capitalshyization of RampD11
For the federal government the revisions reach alshymost $121 billion for 2012 and are mostly due to the capitalization of RampD For state and local governshyments the upward revisions are less than $10 billion throughout the period and are also due primarily to the capitalization of RampD
Private enterprise income (account 2) Private enterprises consist of private businesses owner-occupied housing and nonprofit institutions serving households (for purposes of estimating moneshytary and imputed interest payments and imputed inshyterest receipts)
Net interest and miscellaneous payments domesshytic industries Revisions begin with 1951 but are less than $2 billion until 1973 and are less than $5 billion until 1981 For 1973ndash2001 revisions are mostly upshyward For 2002ndash2012 revisions are downward and range from about $17 billion to about $180 billion (tashyble 12) Prior to 1985 the revisions are due primarily to the adoption of accrual-based measures for defined benefit pension plans For 1986 forward the revisions also reflect the impact of the improved measures of fishynancial services that causes the total revision to be
11 The revisions associated with ownership transfer costs also reflect a faster depreciation rate for brokersrsquo commissions on residential structures
Table 12 Revisions to Net Interest and Miscellaneous Payments Domestic Industries
[Billions of dollars]
1959 1997 2002 2007 2010 2011 2012
Total revision 01 64 ndash167 ndash714 ndash824 ndash818 ndash864 Definitional
Accrual accounting for defined benefit 00 ndash136 229 ndash37 241 243 222
pension plans 00 ndash136 229 ndash37 241 243 222 Statistical 01 200 ndash396 ndash677 ndash1065 ndash1061 ndash1086
Improved measurement of financial services Improved distribution of regulated investment
00 ndash108 ndash268 ndash237 ndash554 ndash501 ndash503
companies investment income 1 00 254 ndash22 428 249 19 Improved mortgage interest paid estimates 00 53 ndash134 ndash966 ndash920 ndash954 ndash833 Other statistical
Source of revision by component 01 02 28 98 159 375
Net interest domestic industries 00 64 ndash184 ndash752 ndash845 ndash857 ndash898 Definitional
Accrual accounting for defined benefit 00 ndash136 229 ndash37 241 243 222
pension plans 00 ndash136 229 ndash37 241 243 222 Statistical 00 200 ndash413 ndash715 ndash1086 ndash1100 ndash1120
Improved measurement of financial services Improved distribution of regulated investment
00 ndash108 ndash268 ndash237 ndash554 ndash501 ndash503
companies investment income 1 00 254 ndash22 428 249 19 Improved mortgage interest paid estimates 00 53 ndash134 ndash966 ndash920 ndash954 ndash833 Other statistical 00 02 11 60 138 336
Miscellaneous payments 01 00 17 38 21 39 34 Definitional 00 00 00 00 00 00 00 Statistical 01 00 17 38 21 39 34
1 Revisions for 2012 are not shown because these data were not previously published
26 Improved NIPA Estimates September 2013
downward for 1986 for 1991 and for 1992 For 1992 forward the estimates reflect improvements to the disshytribution of the income of regulated investment comshypanies and to the measures of mortgage interest paid Prior to 2002 the impacts of these changes lead to upshyward revisions For 2002ndash2012 the downward revishysions to net interest are primarily accounted for by the improved measures of mortgage interest paid the downward revisions are partly offset by upward revishysions for most years resulting from the improved disshytribution of the income of regulated investment companies
Business current transfer payments (net) This component consists of payments to persons to govshyernment and to the rest of the world
Revisions to business current transfer payments are less than $2 billion in absolute value until 2001 for 2001ndash2012 revisions are downward for most years and range from less than $10 billion to about $21 billion (table 13) For most years the revisions are the result of the reclassification of certain payments to the fedshyeral government from transfers to rents and royalties For 2010 and 2012 downward revisions to transfer payments to persons also contribute to the overall downward revision For 2012 the reclassification of fines paid by the rest of the world also contributes to the downward revision12
Table 13 Revisions to Business Current Transfer Payments (Net) [Billions of dollars]
1959 1997 2002 2007 2010 2011 2012
Total revision ndash01 ndash12 ndash17 ndash47 ndash115 ndash30 ndash211 Definitional 00 00 00 00 00 00 00 Statistical ndash01 ndash12 ndash17 ndash47 ndash115 ndash30 ndash211
Source of revision by component Payments to persons (net) 00 00 00 01 ndash44 18 ndash45
Definitional 00 00 00 00 00 00 00 Statistical 00 00 00 01 ndash44 18 ndash45
Payments to government (net) ndash01 ndash13 ndash17 ndash48 ndash73 ndash47 ndash138 Definitional 00 00 00 00 00 00 00 Statistical ndash01 ndash13 ndash17 ndash48 ndash73 ndash47 ndash138
Payments to the rest of the world (net) 00 00 00 00 02 ndash01 ndash27 Definitional 00 00 00 00 00 00 00 Statistical 00 00 00 00 02 ndash01 ndash27
Proprietorsrsquo income with IVA and CCAdj For proshyprietorsrsquo income downward revisions begin with 1929 but they are less than $5 billion until 1985 For 1985ndash2011 revisions are downward and generally inshycreasing the largest downward revision is over $111 billion for 2007 The only upward revision is for 2012 (about $23 billion) (table 14)
Prior to 2011 the revisions are almost entirely atshytributable to nonfarm proprietorsrsquo income Prior to
12 The 2013 annual revision of the ITAs reclassified specific fines paid by foreign companies as part of transfer payments to the rest of the world (net) Previously these fines and penalties were not captured in the ITAs For more information see Christopher L Bach ldquoBEA Briefing Fines and Penalties in the US International Transactions Accountsrdquo SURVEY 93 (July 2013) 55ndash60
Table 14 Revisions to Proprietorsrsquo Income With Inventory Valuation and Capital Consumption Adjustments
[Billions of dollars]
1959 1997 2002 2007 2010 2011 2012
Total revision 00 ndash403 ndash193 ndash1112 ndash707 ndash22 226 Definitional
Capitalization of research and 00 ndash51 ndash46 ndash105 ndash87 ndash88 ndash102
development Capitalization of entertainment literary
00 18 46 42 33 33 32
and artistic originals Expanded set of ownership transfer costs
00 ndash27 ndash22 ndash45 ndash45 ndash47 ndash48
for residential fixed assets 00 ndash41 ndash71 ndash101 ndash75 ndash74 ndash86 Statistical
Improved measures of IRS section 179 00 ndash352 ndash147 ndash1007 ndash620 66 329
expensing 00 ndash117 ndash131 ndash211 ndash187 ndash164 ndash170 Other statistical Source of revision by component
00 ndash235 ndash16 ndash797 ndash432 230 499
Farm 00 ndash02 14 03 17 180 192 Definitional 00 00 00 00 00 00 00 Statistical 00 ndash02 14 03 17 180 192
Nonfarm 00 ndash401 ndash207 ndash1115 ndash724 ndash202 35 Definitional
Capitalization of research and 00 ndash51 ndash46 ndash105 ndash87 ndash88 ndash102
development Capitalization of entertainment literary
00 18 46 42 33 33 32
and artistic originals Expanded set of ownership transfer costs
00 ndash27 ndash22 ndash45 ndash45 ndash47 ndash48
for residential fixed assets 00 ndash41 ndash71 ndash101 ndash75 ndash74 ndash86 Statistical
Improved measures of IRS section 179 00 ndash350 ndash161 ndash1010 ndash637 ndash114 137
expensing 00 ndash117 ndash131 ndash211 ndash187 ndash164 ndash170 Other statistical 00 ndash233 ndash30 ndash800 ndash449 50 307
1982 the revisions to nonfarm proprietorsrsquo income are due to the capitalization of RampD and of entertainment originals and to the expanded set of ownership transfer costs for residential fixed assets these revisions are all downward and are generally small (less than $2 bilshylion) For 1982ndash2012 in addition to the changes noted above the revisions also reflect the improved measures of the capital gains and losses attributable to corporate partners and to other statistical revisions
For farm proprietorsrsquo income the revisions are less than $7 billion in absolute value until 2011 For 2011 and for 2012 the upward revisions reach almost $20 billion reflecting the incorporation of revised source data from USDA
Rental income of persons with CCAdj The revishysions to this component are zero or very small (less than $1 billion) and are downward until 1976 for 1976ndash2002 they are downward and larger reaching a peak for 2000 (over $27 billion) (table 15) For 2003ndash2012 the revisions are upward and large reachshying a peak in 2012 (over $78 billion)
Prior to 2002 the downward revisions are due prishymarily to expanding the set of ownership transfer costs
Table 15 Revisions to Rental Income of Persons With Capital Consumption Adjustment
[Billions of dollars]
1959 1997 2002 2007 2010 2011 2012
Total revision ndash04 ndash245 ndash14 457 536 747 786 Definitional ndash06 ndash194 ndash266 ndash637 ndash599 ndash534 ndash477
Expanded set of ownership transfer costs for residential fixed assets ndash06 ndash194 ndash266 ndash637 ndash599 ndash534 ndash477
Statistical 02 ndash51 252 1094 1135 1281 1263 Improved mortgage interest paid estimates 00 ndash53 134 966 920 954 833 Other statistical 02 03 118 128 216 328 430
27 September 2013 SURVEY OF CURRENT BUSINESS
for residential fixed assets Statistical revisions includshying the improved method for estimating mortgage inshyterest paid and new and revised source data also contribute to the downward revisions For 2001 and 2002 the statistical revisions are upward but are more than offset by the downward impact of expanding the set of ownership transfer costs for residential fixed asshysets For 2003ndash2012 the increasing upward statistical revisions especially the improved estimates of mortshygage interest paid outweigh the downward revisions due to the expanded set of ownership transfer costs and result in upward revisions to rental income
Corporate profits with IVA and CCAdj Corposhyrate profits is revised up for 1929ndash1986 down for 1987ndash2001 and up for 2002ndash2012 (table 16) Revisions are less than $2 billion until 1963 and are less than $5 billion until 1972 For all years revisions are almost exshyclusively to profits of domestic industries revisions to profits of the rest of the world begin with 1999 and are generally small (exceeding $2 billion in absolute value for only 4 years)
For 1972ndash1986 upward revisions which reach a peak for 1981 and 1982 (about $24 billion for both years) are primarily due to definitional changesmdashthe
Table 16 Revisions to Corporate Profits With Inventory Valuation and Capital Consumption Adjustments
[Billions of dollars]
1959 1997 2002 2007 2010 2011 2012
Total revision 17 ndash190 350 184 382 507 589 Definitional
Capitalization of research and 17 137 102 320 511 594 626
development Capitalization of entertainment literary
12 217 140 353 271 292 303
and artistic originals Expanded set of ownership transfer
05 150 149 179 171 176 165
costs for residential fixed assets Accrual accounting for defined benefit
00 ndash06 ndash11 ndash16 ndash11 ndash11 ndash13
pension plans 00 ndash225 ndash175 ndash196 80 137 172 Statistical
Improved distribution of regulated investment companies investment
00 ndash327 248 ndash136 ndash129 ndash87 ndash37
income 1 00 ndash254 22 ndash428 ndash249 ndash19 Other statistical Source of revision by component
00 ndash73 226 291 121 ndash68
Profits before tax (without IVA and CCAdj) 22 ndash49 236 100 185 ndash67 278 Definitional
Capitalization of research and 17 100 59 251 436 540 621
development Capitalization of entertainment literary
and artistic originals Expanded set of ownership transfer
17 325 235 447 356 403 449
costs for residential fixed assets Accrual accounting for defined benefit
00 00 00 00 00 00 00
pension plans 00 ndash225 ndash175 ndash196 80 137 172 Statistical
Improved distribution of regulated investment companies investment
05 ndash149 177 ndash151 ndash251 ndash607 ndash343
income 1 00 ndash254 22 ndash428 ndash249 ndash19 Other statistical 05 104 155 277 ndash02 ndash589
IVA 00 00 87 77 ndash23 66 09 Definitional 00 00 00 00 00 00 00 Statistical 00 00 87 77 ndash23 66 09
CCAdj ndash05 ndash142 27 06 219 510 301 Definitional
Capitalization of research and ndash05 ndash114 ndash106 ndash110 ndash97 ndash123 ndash161
development Capitalization of entertainment literary
and artistic originals Expanded set of ownership transfer
ndash05 ndash108 ndash95 ndash95 ndash86 ndash112 ndash148
costs for residential fixed assets 00 ndash06 ndash11 ndash16 ndash11 ndash11 ndash13 Statistical 00 ndash28 133 116 316 633 462
CCAdj Capital consumption adjustment IVA Inventory valuation adjustment 1 Revisions for 2012 are not shown because these data were not previously published
capitalization of RampD and of entertainment originals and the adoption of accrual-based measures for deshyfined benefit pension plans These upward revisions are partly offset by downward revisions due to statistishycal changes which are generally less than $5 billion
For 1987ndash2001 revisions are downward reaching over $38 billion for 2000 Until 1992 the primary cause of the revisions is the adoption of accrual-based measures for defined benefit pension plans these revishysions are supplemented by the smaller downward revishysions due to statistical changes and are only partly offset by the upward revisions due to the capitalization of RampD and of entertainment originals For 1992 forshyward the downward revisions are also due to the imshyproved distribution of the income of regulated investment companies
For 2002ndash2012 the upward revisions primarily reshyflect the capitalization of RampD and of entertainment originals as well as revisions due to certain statistical changes including new and revised IRS tabulations of corporate income tax returns and improved measures of misreported income based on data from the IRS These upward revisions are only partly offset by downshyward revisions that reflect the improved distribution of regulated investment company income and the someshytimes downward impacts of the accrual-based meashysures for defined benefit pension plans
Personal income and outlays (account 3) Personal income Revisions are $1 billion or larger beshyginning with 1940 and reach $10 billion by 1957 The revisions are upward for each year except 2008 which is revised down almost $30 billion The largest upward revision is for 2012 (almost $313 billion) (table 17)
Compensation of employees This component conshysists of wages and salaries and supplements to wages and salaries received by US residents including wages and salaries received from the rest of the world The sources of revision to this aggregate are the same as those already discussed in the section ldquoCompensation of employees paidrdquo but they also include the impacts of introducing accrual-based measures of wages and salaries The sources of revision to supplements are the same as those already discussed
Wages and salaries are revised by less than $1 billion in absolute value until 1992 for 1992ndash2004 revisions are of mixed sign (ranging from ndash$8 billion to about $6 billion) The revisions generally reflect offsetting efshyfects from the adoption of accrual-based measures of wages and salaries and from statistical changes For 2005ndash2009 the revisions to wages and salaries primarshyily reflect statistical revisions including the updated measures of misreporting the impacts of the adoption of accrual-based measures are of mixed sign and are
28 Improved NIPA Estimates September 2013
fairly small For 2010ndash2012 the revisions are due exshyclusively to statistical changes revisions for 2010 and 2011 are downward (reaching over $27 billion for 2010) and for 2012 the revision is upward (almost $21 billion)
Personal income receipts on assets This aggregate consists of personal interest income and personal divishydend income Personal interest income consists of monetary and imputed interest received by persons from all sources and it is calculated as net interest plus interest paid by persons and interest paid by governshyment less interest received by government
Revisions to personal interest income begin with 1929 but are less than $5 billion until 1958 Thereafter
revisions are upward and generally increase for most years The largest upward revision is $219 billion for 2012 For most years the upward revisions are largely accounted for by the adoption of accrual-based meashysures for defined benefit pension plans for 2002ndash2012 these revisions are partly offset by downward revisions resulting from the improved measures of mortgage inshyterest paid The revisions also reflect the impact of the improved measurement of financial services (beginshyning with 1985) of the improved distribution of the income of regulated investment companies (beginning with 1992) and of other statistical changes (which grow to over $10 billion by 2000 and reach about $97 billion for 2011)
Table 17 Personal Income and Its Disposition [Billions of dollars]
1959 1997 2002 2007 2010 2011 2012 1959 1997 2002 2007 2010 2011 2012
Total revision 109 743 894 834 1133 2440 3127 Less Personal current taxes 00 00 ndash01 ndash08 ndash33 60 176 Definitional 107 634 931 761 1297 1147 1260 Definitional 00 00 00 00 00 00 00
Capitalization of research and development 00 18 46 42 33 33 32 Statistical 00 00 ndash01 ndash08 ndash33 60 176 Capitalization of entertainment literary and
artistic originals Expanded set of ownership transfer costs for
residential fixed assets Accrual accounting for defined benefit
pension plans Accrual accounting for wages and salaries
Statistical Improved measurement of financial services Improved distribution of regulated investment
companies investment income Improved measures of IRS section 179
expensing Improved mortgage interest paid estimates Other statistical
Source of revision by component
00
ndash07
113 00 02 00
00
00 00 02
ndash27
ndash235
908 ndash29 109 ndash07
336
ndash117 00
ndash102
ndash22
ndash337
1244 00
ndash37 ndash148
ndash11
ndash131 00
252
ndash45
ndash738
1566 ndash63
73 ndash83
710
ndash211 00
ndash344
ndash45
ndash674
1984 00
ndash164 ndash94
532
ndash187 00
ndash414
ndash47
ndash608
1770 00
1293 12
357
ndash164 00
1087
ndash48
ndash563
1839 00
1867 05
ndash263
ndash170 00
2296
Equals Disposable personal income Definitional
Capitalization of research and development Capitalization of enter tainment literary and
artistic originals Expanded set of ownership transfer costs for
residential fixed assets Accrual accounting for defined benefit pension
plans Accrual accounting for wages and salaries
Statistical Improved measurement of financial services Improved distribution of regulated investment
companies investment income Improved measures of IRS section 179
expensing
108 107 00
00
ndash07
113 00 01 00
00
00
743 634 18
ndash27
ndash235
908 ndash29 109 ndash07
336
ndash117
895 931 46
ndash22
ndash337
1244 00
ndash36 ndash148
ndash11
ndash131
843 761 42
ndash45
ndash738
1566 ndash63
82 ndash83
710
ndash211
1166 1297
33
ndash45
ndash674
1984 00
ndash131 ndash94
532
ndash187
2381 1147
33
ndash47
ndash608
1770 00
1234 12
357
ndash164
2950 1260
32
ndash48
ndash563
1839 00
1690 05
ndash263
ndash170 Compensation of employees 53 461 311 369 ndash27 ndash167 187 Improved mortgage interest paid estimates 00 00 00 00 00 00 00
Definitional 53 391 315 488 35 ndash134 ndash234 Other statistical 01 ndash102 253 ndash335 ndash381 1028 2119 Accrual accounting for defined benefit
pension plans 53 421 315 550 35 ndash134 ndash234 Less Personal outlays ndash02 25 ndash322 157 491 592 981 Accrual accounting for wages and salaries 00 ndash29 00 ndash63 00 00 00 Definitional ndash01 ndash45 ndash57 ndash51 ndash79 ndash108 ndash110
Statistical 00 70 ndash04 ndash119 ndash62 ndash33 421 Capitalization of research and development ndash01 ndash45 ndash57 ndash51 ndash79 ndash108 ndash110
Proprietorsrsquo income with IVA and CCAdj Definitional
Capitalization of research and development
00 00 00
ndash403 ndash51 18
ndash193 ndash46
46
ndash1112 ndash105
42
ndash707 ndash87 33
ndash22 ndash88 33
226 ndash102
32
Statistical Improved measurement of financial services Other statistical
ndash01 00
ndash01
70 ndash07
78
ndash265 ndash148 ndash118
208 ndash83 291
571 ndash94 666
702 12
690
1091 05
1086
Capitalization of entertainment literary and Personal consumption expenditures ndash02 ndash99 ndash539 ndash279 ndash138 ndash172 300 artistic originals 00 ndash27 ndash22 ndash45 ndash45 ndash47 ndash48 Definitional ndash01 ndash45 ndash57 ndash51 ndash79 ndash108 ndash110
Expanded set of ownership transfer costs for Capitalization of research and development ndash01 ndash45 ndash57 ndash51 ndash79 ndash108 ndash110 residential fixed assets 00 ndash41 ndash71 ndash101 ndash75 ndash74 ndash86 Statistical ndash01 ndash54 ndash482 ndash228 ndash59 ndash64 410
Statistical 00 ndash352 ndash147 ndash1007 ndash620 66 329 Improved measurement of financial services 00 ndash73 ndash193 ndash157 ndash364 ndash300 ndash295 Improved measures of IRS section 179 Other statistical ndash01 19 ndash289 ndash71 305 236 705
expensing 00 ndash117 ndash131 ndash211 ndash187 ndash164 ndash170 Personal interest payments 00 124 217 450 670 800 757 Other statistical 00 ndash235 ndash16 ndash797 ndash432 230 499 Definitional 00 00 00 00 00 00 00
Rental income of persons with CCAdj ndash04 ndash245 ndash14 457 536 747 786 Statistical 00 124 217 450 670 800 757 Definitional ndash06 ndash194 ndash266 ndash637 ndash599 ndash534 ndash477 Improved measurement of financial services 00 66 45 74 269 312 299
Expanded set of ownership transfer costs for Other statistical 00 58 172 376 401 488 458 residential fixed assets
Statistical Improved mortgage interest paid estimates Other statistical
ndash06 02 00 02
ndash194 ndash51 ndash53
03
ndash266 252 134 118
ndash637 1094 966 128
ndash599 1135 920 216
ndash534 1281 954 328
ndash477 1263 833 430
Personal current transfer payments Definitional Statistical
00 00 00
00 00 00
00 00 00
ndash14 00
ndash14
ndash40 00
ndash40
ndash34 00
ndash34
ndash76 00
ndash76
Personal income receipts on assets Definitional
Accrual accounting for defined benefit pension plans
Statistical Improved measurement of financial services Improved distribution of regulated investment
companies investment income Improved mortgage interest paid estimates Other statistical
Personal current transfer receipts Definitional Statistical
60 60
60 00 00
00 00 00 00 00 00
930 487
487 443 ndash07
336 53 60 00 00 00
808 928
928 ndash120 ndash148
ndash11 ndash134
172 ndash18
00 ndash18
1096 1015
1015 81
ndash83
710 ndash966
419 43 00 43
1413 1948
1948 ndash535 ndash94
532 ndash920
ndash53 ndash74 00
ndash74
1995 1904
1904 91 12
357 ndash954
675 ndash123
00 ndash123
2088 2073
2073 15 05
ndash263 ndash833 1106 ndash168
00 ndash168
Equals Personal saving Definitional
Capitalization of research and development Capitalization of enter tainment literary and
artistic originals Expanded set of ownership transfer costs for
residential fixed assets Accrual accounting for defined benefit pension
plans Accrual accounting for wages and salaries
Statistical Improved measurement of financial services Improved distribution of regulated investment
companies investment income
110 108 01
00
ndash07
113 00 02 00
00
718 679 64
ndash27
ndash235
908 ndash29
39 00
336
1217 988 103
ndash22
ndash337
1244 00
229 00
ndash11
685 812 93
ndash45
ndash738
1566 ndash63
ndash127 00
710
675 1377 112
ndash45
ndash674
1984 00
ndash702 00
532
1788 1256 141
ndash47
ndash608
1770 00
532 00
357
1969 1370 142
ndash48
ndash563
1839 00
599 00
ndash263 Less Contributions for government social Improved measures of IRS section 179
insurance domestic 00 00 00 19 08 ndash11 ndash08 expensing 00 ndash117 ndash131 ndash211 ndash187 ndash164 ndash170 Definitional 00 00 00 00 00 00 00 Improved mortgage interest paid estimates 00 00 00 00 00 00 00 Statistical 00 00 00 19 08 ndash11 ndash08 Other statistical 02 ndash180 370 ndash627 ndash1046 339 1032
CCAdj Capital consumption adjustment IVA Inventory valuation adjustment
29 September 2013 SURVEY OF CURRENT BUSINESS
The revisions to personal dividend income begin with 1991 and are upward for most years except for notable downward revisions for 2010 and 2012 The largest upward revision is for 2007 (over $24 billion) The upward revisions primarily reflect the impact of the improved distribution of the income of regulated investment companies For 2010 personal dividend income is revised down by about $37 billion the downward impacts of other statistical changes more than offset the upward revision from the improved disshytribution of the income of regulated investment comshypanies For 2012 personal dividend income is revised down by about $10 billion reflecting the impact of stashytistical changes
Personal current transfer receipts This aggregate consists of government social benefits to persons and business current transfer payments to persons (net) The revisions begin with a small downward revision for 2002 revisions are upward and less than $5 billion for 2003ndash2009 For 2010ndash2012 revisions are downshyward and larger (almost $17 billion for 2012) The reshyvisions reflect the incorporation of new and revised source data for government social benefits and for business current transfer payments to persons
Contributions for government social insurance domestic This component is deducted in the calculashytion of personal income and consists of both personal and employer contributions The revisions begin with 2003 are of mixed sign are less than $2 billion in absoshylute value throughout the period and reflect new and revised source data
Personal current taxes The revisions to personal current taxes begin with 2002 are of mixed sign and are less than $5 billion except for 2011 and 2012 ($6 billion and over $17 billion respectively) The revishysions reflect new and revised source data particularly new and revised Census Bureau government finances data
Disposable personal income (DPI) The pattern of revisions to DPI (which is equal to personal income less personal current taxes) primarily reflects the revishysions to personal income Through 1949 the revisions do not exceed $5 billion thereafter the revisions are generally increasing with only one downward revision for 2008 (about $29 billion) The largest upward revishysion is for 2012 ($295 billion)
Personal outlays This component consists of PCE personal interest payments and personal current transfer payments The revisions to personal outlays are generally downward and are less than $5 billion through 1984 thereafter the revisions are of mixed sign range from about ndash$32 billion for 2002 to about $98 billion for 2012 and primarily reflect revisions to
PCE and to personal interest payments PCE is revised down for most years but a notable exception is an upshyward revision for 2012 of $30 billion
For 1985ndash2012 personal interest payments are reshyvised up by steadily increasing amounts primarily reshyflecting the improved measurement of financial services and improved measures of interest payments on consumer loans based on data on interest rates and consumer credit outstanding from the Federal Reserve Board
Personal sav ing This component is the difference between DPI and personal outlays The revisions do not exceed $5 billion until 1950 thereafter personal saving is revised up for all years by generally increasing amounts except for 2008 which is revised down $41 billion the largest upward revision is for 2012 (about $197 billion)
The revisions to personal saving result in correshysponding revisions to the personal saving ratemdashpershysonal saving as a percentage of DPI The revisions to the saving rate reach 10 percentage point by 1938 and peak at 33 percentage points for 1971
Government current receipts and expenditures (account 4) Government current receipts is the sum of current tax receipts contributions for government social insurshyance income receipts on assets current transfer reshyceipts and current surplus of government enterprises Current expenditures is the sum of consumption exshypenditures current transfer payments interest payshyments and subsidies Net government saving is the difference between current receipts and current expenshyditures
Federal government Revisions to current receipts begin with 1959 are downward and are less than $2 billion through 1979 For 1980ndash2009 the revisions are upward and range from less than $10 billion to about $8 billion For 2010ndash2012 the revisions are downward and range from about $3 billion to about $20 billion (table 18) The upward revisions through 2009 mostly reflect the impact on the current surplus of government enterprises of incorporating accrual-based measures for defined benefit pension plans For 2010ndash2012 downward revisions to taxes on corporate income reflect new and revised IRS data as well as new federal tax collections data and the downward revishysions to current transfer receipts reflect in part the reshyclassification of cross-border fines and penalties as negative current transfer payments to the rest of the world (net) these downward revisions are partly offset by upward revisions to the current surplus of governshyment enterprises that primarily reflect the impact of
30 Improved NIPA Estimates September 2013
Table 18 Revisions to Government Current Receipts and Expenditures ward revisions are offset to varying degrees over time [Billions of dollars] by downward revisions to federal consumption expenshy
1959 1997 2002 2007 2010 2011 2012
Federal Current receipts ndash04 54 65 61 ndash37 ndash29 ndash204
Definitional Accrual accounting for defined benefit
ndash04 62 62 45 38 31 35
pension plans ndash04 62 62 45 38 31 35 Statistical
Improved measurement of financial 00 ndash08 03 16 ndash75 ndash60 ndash239
services 00 00 ndash01 00 00 00 00 Other statistical 00 ndash08 04 16 ndash74 ndash60 ndash238
Current expenditures 68 365 246 275 179 79 150 Definitional
Capitalization of research and 66 376 280 214 218 214 284
development Accrual accounting for defined benefit
ndash25 09 ndash132 ndash204 ndash150 ndash113 ndash51
pension plans 91 367 411 418 368 327 335 Accrual accounting for wages and salaries 00 00 00 00 00 00 00
Statistical Improved measurement of financial
02 ndash11 ndash34 61 ndash39 ndash135 ndash134
services 00 00 ndash01 00 00 00 00 Other statistical 02 ndash11 ndash33 61 ndash39 ndash135 ndash134
Net federal government saving ndash72 ndash311 ndash181 ndash215 ndash215 ndash109 ndash354 Definitional
Capitalization of research and ndash70 ndash314 ndash218 ndash168 ndash181 ndash183 ndash250
development Accrual accounting for defined benefit
25 ndash09 132 204 150 113 51
pension plans ndash95 ndash305 ndash349 ndash372 ndash331 ndash296 ndash300 Accrual accounting for wages and salaries 00 00 00 00 00 00 00
Statistical Improved measurement of financial
ndash02 03 37 ndash47 ndash34 74 ndash104
services 00 00 00 00 00 00 00 Other statistical
State and local
ndash02 03 37 ndash47 ndash34 74 ndash104
Current receipts ndash02 ndash137 ndash243 ndash225 ndash439 ndash345 ndash301 Definitional
Accrual accounting for defined benefit ndash01 ndash28 ndash55 ndash66 ndash76 ndash70 ndash67
pension plans ndash01 ndash28 ndash55 ndash66 ndash76 ndash70 ndash67 Statistical
Improved measurement of financial ndash01 ndash109 ndash188 ndash159 ndash363 ndash275 ndash234
services 00 ndash01 ndash10 ndash06 ndash28 ndash28 ndash27 Other statistical ndash01 ndash108 ndash178 ndash153 ndash335 ndash248 ndash207
Current expenditures 13 209 426 625 1037 767 936 Definitional
Capitalization of research and 17 337 640 896 1616 1505 1615
development Accrual accounting for defined benefit
00 ndash13 ndash24 ndash35 ndash41 ndash36 ndash27
pension plans 17 350 664 931 1657 1541 1643 Accrual accounting for wages and salaries 00 00 00 00 00 00 00
Statistical Improved measurement of financial
ndash04 ndash128 ndash214 ndash271 ndash579 ndash738 ndash679
services 00 ndash01 ndash10 ndash06 ndash28 ndash28 ndash27 Other statistical ndash04 ndash127 ndash204 ndash265 ndash551 ndash710 ndash653
Net state and local government saving ndash16 ndash346 ndash668 ndash849 ndash1476 ndash1111 ndash1237 Definitional
Capitalization of research and ndash18 ndash365 ndash695 ndash961 ndash1692 ndash1574 ndash1683
development Accrual accounting for defined benefit
00 13 24 35 41 36 27
pension plans ndash18 ndash378 ndash719 ndash997 ndash1733 ndash1611 ndash1710 Accrual accounting for wages and salaries 00 00 00 00 00 00 00
Statistical Improved measurement of financial
02 19 27 112 216 463 446
services 00 00 00 00 00 00 00 Other statistical 02 19 27 112 216 463 446
the adoption of accrual-based measures for defined benefit pension plans13
Federal government current expenditures is revised up for all years and the revisions generally increase until 1996 when they begin to increase more slowly revisions range from less than $1 billion before 1941 to almost $40 billion for 1995 The upward revisions genshyerally result from the impact of the adoption of acshycrual-based measures for defined benefit pension plans on interest paid by the federal government these upshy
13 As part of the efforts to modernize the ITAs BEA is now using data for specific fines to identify those that are paid by foreign companies and classishyfying them as part of transfer payments to the rest of the world (net) Previshyously these fines and penalties were not captured in the ITAs The source data underlying the previous NIPA estimates of fines received by the federal government included these data but they were not distinguished from fines paid by domestic businesses
ditures that reflect the impact of reclassifying RampD expenditures from consumption to investment (particshyularly in the mid-1980s and the first half of the 2000s)
Federal government net saving is revised down for all years as the upward revisions to current expendishytures either outweigh upward revisions to or suppleshyment downward revisions to current receipts The downward revisions to federal government saving range from less than $1 billion for 1929 to over $35 bilshylion for 2012
State and local government State and local current receipts is revised down for all years by generally inshycreasing amounts ranging from less than $1 billion for 1929 to nearly $44 billion for 2010 Prior to 2002 the downward revisions primarily reflect the incorporashytion of accrual-based measures for defined benefit pension plans (which generally increases compensashytion costs for government enterprises and lowers their surplus) and the recognition of RampD as investment (which reduces grants-in-aid from the federal governshyment (see the box ldquoGovernment Research and Develshyopmentrdquo)) For 2002ndash2012 the revisions also reflect the incorporation of new and revised data from the Census Bureau
State and local government current expenditures is revised up for 1929ndash1981 down for 1982ndash1988 and up for 1989ndash2012 For 1929ndash1981 and 1989ndash2012 the upward revisions reflect the impact on compensation and on interest payments of incorporating accrual-based measures for defined benefit pension plans these revisions are partly offset by downward revisions from other sources including large downward revishysions for 2010ndash2012 that result from the incorporation of new and revised data from the Census Bureau (table 18) For 1982ndash1988 the downward revisions reflect the impact on compensation of incorporating accrual-based measures for defined benefit pension plans14
State and local government net saving is revised down for all years except for 1987 when the revision is slightly upward (less than $1 billion) The largest downward revision is about $159 billion for 2009
Foreign transactions (accounts 5 and 7) Current receipts from the rest of the world This agshygregate consists of exports of goods and services and income receipts from the rest of the world (The revishysions to exports of goods and services were discussed previously) The revisions to income receipts begin
14 The pattern of revisions to state and local compensation is driven prishymarily by the funding status of state and local pension plans See ldquoPreview Changes in Definitions and Presentationsrdquo
31 September 2013 SURVEY OF CURRENT BUSINESS
with 1985 and are upward and less than $5 billion through 2010 The largest revisions are about $19 bilshylion for 2011 and about $36 billion for 2012 (table 19) For 1985ndash1998 the revisions are due solely to the improved measurement of financial services For 1999ndash2010 the revisions are primarily caused by the incorporation of revised estimates from the ITAs and the improved measurement of financial services in fairly similar magnitudes the larger revisions for 2011 and 2012 are due primarily to the incorporation of the revised ITA data (See the box ldquoDiscontinuities in the Estimates of Foreign Transactions in the National Inshycome and Product Accountsrdquo)
Current payments to the rest of the world (net) This aggregate consists of imports of goods and sershyvices income payments to the rest of the world and current taxes and transfer payments to the rest of the world (net) (The revisions to imports of goods and services were discussed previously) The revisions to income payments begin with 1985 they are of mixed
sign and are less than $2 billion in absolute value until 1999 For 1999ndash2007 the revisions are upward and range from about $1 billion to about $7 billion For 2008 and 2009 the revisions are downward and are less than $4 billion For 2010ndash2012 revisions are upward and larger the largest revision is about $26 billion for 2012 (table 19)
For 1985ndash1998 the revisions are due solely to the improved measurement of financial services For 1999ndash2010 the revisions are caused primarily by the incorporation of revised estimates from the ITAs and by the improved measurement of financial services the larger revisions for 2011 and 2012 are due primarily to the incorporation of revised ITA data
The revisions to current taxes and transfer payshyments to the rest of the world (net) begin with 2004 They are generally downward and exceed $1 billion in absolute value for only 2 yearsmdash2010 (over $4 billion) and 2012 (over $12 billion) These revisions are due to the incorporation of revised estimates from the ITAs
Discontinuities in the Estimates of Foreign Transactions in the National Income and Product AccountsThe revision schedule and release for successive vintages exports of goods and services (and for current-dollar of gross domestic product (GDP) and related estimates is GDP) the decline from 2009 to 2010 is overstated by $45 primarily determined by the availability of revised or billion The revisions to the ITAs for years prior to 2010 newly available source data This is also true for the other will be incorporated in a future update to the NIPAs accounts prepared by the Bureau of Economic Analysis including the international transactions accounts (ITAs)
Discontinuities in NIPA Foreign Transactions 2009ndash2010 which are the major source data underlying the NIPA [Billions of dollars] estimates of foreign transactions
Like the NIPAs the ITAs are revised annually the revishysions are typically released in June Annual updates to the NIPAs are typically released in July resulting in producshytion constraints that sometimes prevent incorporating the entire period of ITA revisions As a result a discontishynuity in the NIPA estimates exists between the years for which the revised ITA estimates have been incorporated and the years for which they have not been incorporated1
This yearrsquos comprehensive revision of the NIPAs released on July 31 2013 incorporated revised estimates of foreign transactions for 2010ndash2012 from the annual revision of the ITAs released in June2 However revisions to the data from the ITAs for the years prior to 2010 were not incorporated For most components of foreign transshyactions the revisions to the ITAs for 2010ndash2012 were incorporated at their ldquobest levelrdquo As a result there are discontinuities between the NIPA estimates for 2009 and those for 2010 (see the table) For current-dollar net
1 The differences between the ITAs and the NIPAs are shown in the lines for ldquostatistical differencesrdquo in NIPA table 43B ldquoRelation of Foreign Transactions in the NIPAs to the Corresponding Items in the ITAsrdquo
2 See Barbara H Berman and Jeffrey R Bogen ldquoAnnual Revision of the US International Transaction Accountsrdquo SURVEY OF CURRENT BUSIshyNESS 93 (July 2013) 43ndash54
2009 2010 Change from 2009 to 2010
Published Discontishynuity 1 Adjusted Published Adjusted
Net exports of goods and services ndash3922 ndash45 ndash3967 ndash5185 ndash1263 ndash1218 Exports 15838 ndash08 15830 18435 2597 2605
Goods 10647 ndash03 10644 12784 2137 2140 Services 5191 ndash05 5186 5651 460 465
Imports 19760 37 19797 23620 3860 3823 Goods 15873 45 15918 19512 3639 3594 Services 3887 ndash08 3879 4108 221 229
Net receipts of income 1472 39 1511 2060 588 549 Income receipts 6437 52 6489 7200 763 711
Wage and salary receipts 55 03 58 59 04 01 Income receipts on assets 6382 49 6431 7141 759 710
Interest 1445 06 1451 1295 ndash150 ndash156 Dividends Reinvested earnings of
US direct investment
2309 ndash63 2246 2480 171 234
abroad 2628 107 2735 3366 738 632 Income payments 4965 13 4978 5141 176 163
Wage and salary payments 133 11 144 140 07 ndash04 Income payments on assets 4832 02 4834 5001 169 167
Interest 3423 02 3425 3107 ndash316 ndash318 Dividends Reinvested earnings of
foreign direct investment in the United
1190 00 1190 1266 76 76
States Current taxes and transfer
payments to the rest of the
219 00 219 628 409 409
world (net) Addenda
1361 ndash09 1352 1420 59 68
Gross domestic product 144179 ndash45 144134 149583 5404 5449 Gross national product 145651 ndash06 145645 151642 5991 5997
NIPAs National income and product accounts 1 Equals revisions to the US international transactions accounts that have not been carried back in
the NIPAs at this time
32 Improved NIPA Estimates September 2013
Table 19 Revisions to Foreign Transactions [Billions of dollars]
1959 1997 2002 2007 2010 2011 2012
Current receipts from the rest of the world 00 ndash01 40 86 26 261 482 Definitional 00 00 00 00 00 00 00 Statistical 00 ndash01 40 86 26 261 482
Improved measurement of financial services 00 ndash01 ndash12 ndash07 ndash09 ndash04 ndash10 Other statistical 00 00 52 93 35 265 492
Source of revision by component Exports of goods and services 00 ndash06 17 40 ndash09 70 119
Definitional 00 00 00 00 00 00 00 Statistical 00 ndash06 17 40 ndash09 70 119
Improved measurement of financial services 00 ndash07 ndash17 ndash15 ndash29 ndash32 ndash36 Other statistical 00 01 34 55 20 102 155
Income receipts 00 06 23 45 35 191 363 Definitional 00 00 00 00 00 00 00 Statistical 00 06 23 45 35 191 363
Improved measurement of financial services 00 06 06 08 20 28 25 Other statistical 00 00 17 37 15 163 338
Current payments to the rest of the world 00 ndash01 23 16 83 172 131 Definitional 00 00 00 00 00 00 00 Statistical 00 ndash01 23 16 83 172 131
Improved measurement of financial services 00 ndash01 ndash12 ndash07 ndash09 ndash04 ndash10 Other statistical 00 00 35 23 92 176 141
Source of revision by component Imports of goods and services 00 00 ndash05 07 59 76 ndash09
Definitional 00 00 00 00 00 00 00 Statistical 00 00 ndash05 07 59 76 ndash09
Income payments 00 ndash01 28 14 69 103 264 Definitional 00 00 00 00 00 00 00 Statistical 00 ndash01 28 14 69 103 264
Improved measurement of financial services 00 ndash01 ndash12 ndash07 ndash09 ndash04 ndash10 Other statistical 00 00 40 21 78 107 274
Current taxes and transfer payments (net) 00 00 00 ndash05 ndash45 ndash06 ndash125 Definitional 00 00 00 00 00 00 00 Statistical 00 00 00 ndash05 ndash45 ndash06 ndash125
Balance on current account NIPAs 00 00 17 69 ndash57 88 351 Definitional 00 00 00 00 00 00 00 Statistical 00 00 17 70 ndash57 89 351
Improved measurement of financial services 00 00 00 00 00 00 00 Other statistical 00 00 17 70 ndash57 89 351
Addenda Net lending or net borrowing (ndash) NIPAs 00 00 17 69 ndash57 88 349
Definitional 00 00 00 00 00 00 00 Statistical 00 00 17 69 ndash57 88 349 Balance on current account NIPAs 00 00 17 69 ndash57 88 351
Definitional 00 00 00 00 00 00 00 Statistical 00 00 17 70 ndash57 89 351
Less Capital account transactions (net) 00 00 00 00 00 00 01 Definitional 00 00 00 00 00 00 00 Statistical 00 00 00 00 00 00 01
NIPAs National income and product accounts
Domestic capital (account 6) Gross saving consists of net saving and CFC Net savshying consists of net private saving and net government saving The revisions to gross saving are upward and generally grow larger throughout the period of revishysion they exceed $15 billion by 1960 and peak at over $650 billion for 2012 (table 20) For the entire period upward revisions to CFC (about $531 billion for 2012) dominate the revisions to gross saving Revisions to net saving are of mixed sign the largest downward revision is about $136 billion for 2008 and the largest upward revision is about $121 billion for 2012
Within net saving upward revisions to net private saving partly offset downward revisions to net governshyment saving for most years and primarily reflect the adoption of accrual accounting for defined benefit pension plans
The upward revisions to CFC for the entire period primarily reflect the capitalization of RampD and of enshytertainment originals and the expanded set of ownershy
ship transfer costs of these RampD has the largest effect ldquoNet lending or net borrowing NIPAsrdquo (or ldquonet
lendingrdquo) is the difference between the sum of gross saving and the statistical discrepancy and the sum of gross domestic investment and capital account transshyactions (net)
The revisions to net lending begin with 2000 and are upward for all years except for 2010 The revisions are less than $10 billion in absolute value except for 2012 which is revised up by about $35 billion
Annual Estimates of Real GDP and Real DPI
Real GDP Revisions to the year-to-year growth rates of real GDP are generally small for 59 of the 83 years since 1929 the revisions range from ndash01 percentage point to 01 percentage point and for only 6 years the revisions are greater than 03 percentage point in absolute value (tashyble 21)
The revisions to real GDP result from the following Revisions to the current-dollar components of GDP
such as those discussed above for which chained-dollar estimates are prepared by deflation
Revisions to the prices used to estimate components of real GDP by deflation
Revisions to the quantities used to estimate the components of real GDP by extrapolation or direct valuation In contrast changing the reference year (to 2009
from 2005) does not affect the percent changes in real GDP (It also does not affect the percent changes in the price indexes)
For 40 years the rates of growth of real GDP are reshyvised up (table 22) For 17 of these years the revisions are greater than 01 percentage point upward revisions to the percent change in current-dollar GDP play a role in 14 of these revisions downward revisions to the percent change in prices play a role in 10 of these revishysions The largest upward revision 06 percentage point occurs for 3 years 1941 1943 and 2012
For 16 years the rates of growth of real GDP are reshyvised down Seven of the revisions are larger than 01 percentage point downward revisions to the percent change in current-dollar GDP play a role in three of these revisions and upward revisions to prices play a role in five of these revisions Only one of the revisions is larger than 03 percentage point the growth rate for 1946 is revised down 07 percentage point primarily because of a relatively large upward revision to prices (11 percentage points) that is partly offset by a smaller upward revision to the rate of growth of current-dollar GDP
33 September 2013 SURVEY OF CURRENT BUSINESS
For 27 years the rates of growth of real GDP are un- For 1929ndash2012 the average annual growth rate of revised real GDP is revised up 01 percentage point (from
Table 20 Revisions to Saving and Investment [Billions of dollars]
1959 1997 2002 2007 2010 2011 2012 1959 1997 2002 2007 2010 2011 2012
Gross saving 140 2579 4278 4590 4843 6239 6518 Improved distribution of Definitional 141 2845 3693 4873 4986 5169 5322 regulated investment
Capitalization of research and companies investment development 114 2121 2657 3599 3895 4063 4155 income 00 336 ndash11 710 532 357 ndash263
Capitalization of enter tainment literary Improved measures of IRS and artistic originals 22 461 576 704 722 738 743 section 179 expensing 00 ndash117 ndash131 ndash211 ndash187 ndash164 ndash170
Expanded set of ownership transfer Improved mortgage interest costs for residential fixed assets 05 264 461 570 368 369 423 paid estimates 00 00 00 00 00 00 00
Accrual accounting for defined benefit Other statistical 02 ndash180 370 ndash627 ndash1046 339 1032 pension plans
Accrual accounting for wages and salaries
Statistical Improved measurement of financial
services Improved distribution of regulated
investment companies investment income
Improved measures of IRS section 179 expensing
Improved mor tgage interest paid estimates
00
00 ndash01
00
00
00
00
00
00 ndash266
00
00
ndash117
00
00
00 585
00
00
ndash131
00
00
00 ndash283
00
00
ndash211
00
00
00 ndash143
00
00
ndash187
00
00
00 1070
00
00
ndash164
00
00
00 1196
00
00
ndash170
00
Net government saving Definitional
Capitalization of research and development
Accrual accounting for defined benefit pension plans
Accrual accounting for wages and salaries
Statistical Improved measurement of
financial services Other statistical
ndash87 ndash87
26
ndash113
00 00
00 00
ndash657 ndash679
04
ndash683
00 22
00 22
ndash850 ndash913
156
ndash1068
00 63
00 63
ndash1064 ndash1130
239
ndash1369
00 66
00 66
ndash1691 ndash1873
191
ndash2064
00 182
00 182
ndash1219 ndash1758
149
ndash1907
00 539
00 539
ndash1591 ndash1932
78
ndash2010
00 341
00 341
Other statistical ndash01 ndash149 715 ndash73 45 1233 1366 Consumption of fixed capital 100 2762 3571 4969 5082 5158 5312 Source of revision by component Definitional 104 2679 3516 4808 4971 5077 5257
Net saving Net private saving
40 128
ndash183 474
708 1557
ndash378 686
ndash238 1454
1081 2301
1207 2798
Capitalization of research and development
Capitalization of entertainment 75 1836 2258 2914 3322 3481 3632
Elimination of the adjustment literary and ar tistic originals 17 338 449 570 596 608 626 converting wages to an accrual Expanded set of ownership transfer basis 00 29 00 63 00 00 00 costs for residential fixed assets 12 505 809 1324 1053 988 999
Undistributed corporate profits Statistical ndash04 83 55 161 111 81 55 with IVA and CCAdj Definitional
Capitalization of research and development
17 17
12
ndash273 137
217
341 102
140
ndash61 320
353
778 512
271
512 595
292
829 627
303
Gross domestic investment capital account transactions and net lending NIPAs 136 2841 3797 4912 5041 5383 5947
Capitalization of enter tainment Gross domestic investment 137 2841 3782 4843 5097 5296 5596 literary and artistic originals 05 150 149 179 171 176 165 Private 72 2069 2780 3485 3635 3772 4129
Expanded set of ownership Definitional 71 2069 2694 3508 3492 3659 3857 transfer costs for residential Capitalization of research and fixed assets 00 ndash06 ndash11 ndash16 ndash11 ndash11 ndash13 development 44 1344 1657 2233 2402 2552 2691
Accrual accounting for defined Capitalization of enter tainment benefit pension plans 00 ndash225 ndash175 ndash196 80 137 172 literary and ar tistic originals 22 461 576 704 722 738 743
Statistical 00 ndash410 239 ndash381 266 ndash83 202 Expanded set of ownership Improved distribution of transfer costs for residential
regulated investment fixed assets 05 264 461 570 368 369 423 companies investment Statistical 01 00 86 ndash23 143 113 272 income 00 ndash336 11 ndash710 ndash532 ndash357 263 Government 66 771 1001 1357 1463 1524 1467
Other statistical 00 ndash73 228 329 798 275 ndash61 Definitional 70 777 1000 1366 1493 1510 1465 Personal saving 110 718 1217 685 675 1788 1969 Capitalization of research and
Definitional 108 679 988 812 1377 1256 1370 development 70 777 1000 1366 1493 1510 1465 Capitalization of research and Statistical ndash04 ndash06 01 ndash09 ndash30 14 02
development Capitalization of enter tainment
literary and artistic originals Expanded set of ownership
01
00
64
ndash27
103
ndash22
93
ndash45
112
ndash45
141
ndash47
142
ndash48
Capital account transactions net Definitional Statistical
00 00 00
00 00 00
00 00 00
00 00 00
00 00 00
00 00 00
01 00 01
transfer costs for residential Net lending or net borrowing (ndash) NIPAs 00 00 17 69 ndash57 88 349 fixed assets ndash07 ndash235 ndash337 ndash738 ndash674 ndash608 ndash563 Definitional 00 00 00 00 00 00 00
Accrual accounting for defined Statistical 00 00 17 69 ndash57 88 349 benefit pension plans 113 908 1244 1566 1984 1770 1839 Improved measurement of financial
Accrual accounting for wages services 00 00 00 00 00 00 00 and salaries 00 ndash29 00 ndash63 00 00 00 Other statistical 00 00 17 69 ndash57 88 349
Statistical 02 39 229 ndash127 ndash702 532 599 Improved measurement of Statistical discrepancy ndash04 263 ndash480 322 198 ndash856 ndash572
financial services 00 00 00 00 00 00 00
CCAdj Capital consumption adjustment IVA Inventory valuation adjustment NIPAs National income and product accounts
Table 21 Distribution of Revisions to Percent Change in Real Gross Domestic Product Table 22 Summary of Revisions to Year-to-Year Growth Rates
Size of revision (percentage point)
ndash07 ndash03 ndash02 ndash01 00 01 02 03 04 06
Number of Real Gross Domestic Product for Selected Periods of revisions
1 2 4 9
27 23 5 7 2 3
1929ndash2012 1929ndash1959 1959ndash2002 2002ndash2012
In percentage points Average revision Average absolute revision Largest negative revision Largest positive revision
Number of Upward revisions Downward revisions Zero revisions
01 01
ndash07 06
40 16 27
00 02
ndash07 06
14 9 7
00 01
ndash02 03
20 6
17
02 02
ndash01 06
6 1 3
34 Improved NIPA Estimates September 2013
32 percent to 33 percent) (table 23) The period 1929ndash2012 can be usefully divided into three subpeshyriods 1929ndash1959 1959ndash2002 and 2002ndash2012 For 1929ndash1959 the average growth rate of real GDP is reshyvised up 01 percentage point (from 35 percent to 36 percent) for 1959ndash2002 the average growth rate in the revised estimates is the same as in the previously pubshylished estimates For 2002ndash2012 the average rate of
growth of real GDP is revised up 02 percentage point (from 16 percent to 18 percent)
For all three subperiods the contributions of gross private domestic investment and of government conshysumption expenditures and gross investment are reshyvised up (table 24) Additionally the contribution of net exports is unrevised or revised up very slightly (for 1929ndash1959 both exports and imports are unrevised
Table 23 Gross Domestic Product and Its Major Components Revisions to Average Annual Rates of Change Over Selected Periods
Current dollars Chained dollars Current dollars Chained dollars
Revised Previously published Revision Revised Previously
published Revision Revised Previously published Revision Revised Previously
published Revision
1929ndash2012 1929ndash1959
Gross domestic product Personal consumption expenditures
Goods Durable goods Nondurable goods
Services Gross private domestic investment
Fixed investment Nonresidential
Structures Equipment Intellectual proper ty products
Residential Change in private inventories
Net exports of goods and services Exports
Goods Services
Imports Goods Services
Government consumption expenditures and gross investment Federal
National defense Nondefense
State and local Addenda Gross domestic income Disposable personal income
63 62 55 60 54 67 62 63 64 54 63 87 58
74 71 88 77 78 75
72 82 84 80 68
63 62
62 62 55 60 54 67 60 61 62 55
56
74 71 88 77 78 75
72 82 85 78 68
62 62
01 00 00 00 00 00 02 02 02
ndash01
02
00 00 00 00 00 00
00 00
ndash01 02 00
00 00
33 32 31 45 25 33 37 33 38 13 45 63 21
48 47 53 47 48 44
35 48 49 45 27
33 32
32 31 31 45 25 33 36 32 37 13
19
48 47 53 47 48 44
35 46 49 42 27
32 31
01 01 00 00 00 00 01 01 01 00
02
00 00 00 00 00 00
00 02 00 03 00
01 01
55 48 47 52 45 50 55 57 52 41 56 83 67
46 39 82 47 42 64
88 130 147 96 61
55 50
54 48 47 52 45 50 53 55 49 41
67
46 39 82 47 42 64
85 129 146 93 61
55 49
01 00 00 00 00 00 02 02 03 00
00
00 00 00 00 00 00
03 01 01 03 00
00 01
36 29 27 32 25 32 36 28 24 10 29 59 36
27 21 51 28 22 46
62 104 119 66 29
36 31
35 29 27 32 25 32 36 27 21 10
36
27 21 51 28 22 46
61 104 121 68 29
35 30
01 00 00 00 00 00 00 01 03 00
00
00 00 00 00 00 00
01 00
ndash02 ndash02 00
01 01
Current dollars Chained dollars Current dollars Chained dollars
Revised Previously published Revision Revised Previously
published Revision Revised Previously published Revision Revised Previously
published Revision
1959ndash2002 2002ndash2012
Gross domestic product Personal consumption expenditures
Goods Durable goods Nondurable goods
Services Gross private domestic investment
Fixed investment Nonresidential
Structures Equipment Intellectual proper ty products
Residential Change in private inventories
Net exports of goods and services Exports
Goods Services
Imports Goods Services
Government consumption expenditures and gross investment Federal
National defense Nondefense
State and local Addenda Gross domestic income Disposable personal income
73 76 65 74 61 85 75 76 78 66 76
101 72
92 92 93
102 107 85
69 55 48 75 82
74 75
73 76 65 75 61 85 73 74 77 66
70
92 91 94
102 107 85
70 56 50 74 82
73 76
00 00 00
ndash01 00 00 02 02 01 00
02
00 01
ndash01 00 00 00
ndash01 ndash01 ndash02 01 00
01 ndash01
34 37 36 56 26 38 43 43 50 19 59 72 26
62 65 55 64 70 43
23 14 07 34 32
34 36
34 36 36 56 26 37 43 43 51 19
24
62 64 55 64 71 44
23 11 05 28 33
34 36
00 01 00 00 00 01 00 00
ndash01 00
02
00 01 00 00
ndash01 ndash01
00 03 02 06
ndash01
00 00
40 42 38 20 48 44 25 24 39 45 32 44
ndash24
81 80 85 67 67 68
42 58 60 54 33
39 42
40 41 38 21 47 43 23 21 37 51
ndash28
81 82 78 67 67 67
44 60 63 52 36
39 41
00 01 00
ndash01 01 01 02 03 02
ndash06
04
00 ndash02
07 00 00 01
ndash02 ndash02 ndash03
02 ndash03
00 01
18 20 25 38 17 18 09 07 26
ndash03 32 36
ndash44
52 52 53 31 30 35
09 30 31 28
ndash03
18 20
16 18 24 39 16 15 06 03 24
ndash01
ndash50
53 55 48 31 31 34
09 28 30 24
ndash03
16 18
02 02 01
ndash01 01 03 03 04 02
ndash02
06
ndash01 ndash03 05 00
ndash01 01
00 02 01 04 00
02 02
35 September 2013 SURVEY OF CURRENT BUSINESS
Table 24 Contributions to Percent Change in Real Gross Domestic Product Averages for Selected Periods
1929ndash2012 1929ndash1959 1959ndash2002 2002ndash2012
Revised Previously published Revision Revised Previously
published Revision Revised Previously published Revision Revised Previously
published Revision
Percent change at annual rate Gross domestic product 33 32 01 36 35 01 34 34 00 18 16 02
Percentage points at annual rates Personal consumption expenditures 201 204 ndash003 185 189 ndash004 227 233 ndash006 138 128 010
Goods 095 098 ndash003 103 105 ndash002 098 101 ndash003 058 059 ndash001 Durable goods 038 040 ndash002 027 027 000 048 050 ndash002 032 033 ndash001 Nondurable goods 056 058 ndash002 077 078 ndash001 049 051 ndash002 027 026 001
Services 106 107 ndash001 082 084 ndash002 130 132 ndash002 080 070 010 Gross private domestic investment 057 051 006 042 038 004 077 070 007 018 011 007
Fixed investment 051 046 005 032 028 004 074 067 007 014 006 008 Nonresidential 042 036 006 017 012 005 062 056 006 032 025 007
Structures 003 003 000 ndash002 ndash001 ndash001 007 008 ndash001 ndash001 000 ndash001 Equipment 027 013 038 019 Intellectual proper ty products 012 005 016 013
Residential 010 009 001 015 016 ndash001 012 011 001 ndash018 ndash019 001 Change in private inventories 006 006 000 010 011 ndash001 003 003 000 004 004 000
Net exports of goods and services ndash004 ndash004 000 ndash001 ndash001 000 ndash009 ndash010 001 011 011 000 Exports 034 035 ndash001 010 010 000 046 047 ndash001 057 059 ndash002
Goods 025 026 ndash001 006 006 000 035 036 ndash001 040 043 ndash003 Services 009 009 000 004 004 000 011 011 000 017 016 001
Imports ndash038 ndash039 001 ndash011 ndash011 000 ndash054 ndash056 002 ndash046 ndash048 002 Goods ndash031 ndash032 001 ndash006 ndash006 000 ndash047 ndash049 002 ndash037 ndash039 002 Services ndash007 ndash007 000 ndash006 ndash006 000 ndash007 ndash008 001 ndash009 ndash009 000
Government consumption expenditures and gross investment 086 083 003 162 156 006 050 047 003 018 016 002 Federal 062 057 005 142 135 007 015 011 004 022 020 002
National defense 050 047 003 126 119 007 006 004 002 014 014 000 Nondefense 012 010 002 016 016 000 009 007 002 007 006 001
State and local 025 026 ndash001 020 021 ndash001 034 036 ndash002 ndash004 ndash003 ndash001
and for the other two subperiods the revisions to exshyports offset the revisions to imports)
For 1929ndash1959 and for 1959ndash2002 the contribution of PCE is revised down reflecting downward revisions to spending for both goods and services In contrast for 2002ndash2012 the contribution of PCE is revised up (the upward revision is more than accounted for by services)
Real DPI The average annual rates of growth of real DPI for 1929ndash2012 (32 percent) and for 1929ndash1959 (31 pershycent) are 01 percentage point more than in the previshyously published estimates (table 23) The average annual rate of growth for 1959ndash2002 (36 percent) is the same as the previously published estimate For 2002ndash2012 the average annual rate of growth of real DPI is 20 percent 02 percentage point higher than in the previously published estimates
The revisions to real DPI result from the following Revisions to the current-dollar DPI Revisions to the implicit price deflator for PCE
which is used to deflate DPI For 38 years the percent change in real DPI is reshy
vised up For 17 of these years the revisions are greater than 02 percentage point the largest revisions are for 1942 (10 percentage point) for 2009 (23 percentage points) and for 2011 (11 percentage points) Upward revisions to current-dollar DPI play a role in 16 of these 17 revisions and downward revisions to the imshyplicit price deflator for PCE play a role in eight of these
revisions For 32 years the percent change in real DPI is reshy
vised down Twelve of the downward revisions are larger than 02 percentage point the largest revisions at 09 percentage point are for 1976 and for 2008 Downward revisions to current-dollar DPI play a role in all 12 of these revisions while the implicit price deshyflator for PCE plays a minimal role
For 13 years the percent change in real DPI is unreshyvised
For 1942 and for 1976 the revisions primarily reshyflect the adoption of accrual-based measures for deshyfined benefit pension plans For 2008 the downward revision primarily reflects the impacts of the improved distribution of income of regulated investment compashynies of the improved measurement of financial sershyvices and of other statistical changes For 2009 the upward revision primarily reflects the impacts of the adoption of accrual-based measures for defined benefit pension plans and of statistical changes including the improved measurement of financial services For 2011 the upward revision primarily reflects the incorporashytion of new and revised source data that underlie the components of personal income (see the section ldquoPershysonal income and outlays (account 3)rdquo above)
Annual Prices The revisions to the percent changes in the chain-type price indexes result from the incorporation of revised and newly available source data and of revised weights into the chain formula
36 Improved NIPA Estimates September 2013
For 1929ndash2012 and for the subperiods 1959ndash2002 and 2002ndash2012 the average annual rates of change in the price index for gross domestic purchases are 01 percentage point lower than in the previously pubshylished estimates (table 25) For 1929ndash1959 the average rate of change is unrevised
For 1929ndash2012 and for the subperiods 1929ndash1959 and 1959ndash2002 the revised estimates of the average annual rates of change in the price index for GDP are the same as those in the previously published estishymates For 2002ndash2012 the average annual rate of change in the price index for GDP is 21 percent a downward revision of 02 percentage point
Notable revisions to the prices of major composhynents of GDP for 2002ndash2012 include the following
Prices of PCE for services are revised down 01 pershycentage point
Prices of nonresidential structures are revised down 05 percentage point
Prices of federal consumption expenditures and gross investment are revised down 04 percentage point
Quarterly Real GDP The revisions to the quarterly (and monthly) NIPA esshytimates reflect the revisions to the annual estimates the incorporation of new and revised monthly and
quarterly source data (including the updating of seashysonal factors) and the introduction of changes in methodology
This section focuses on the effect of the revisions on business cycles with an emphasis on the most recent period of contraction and the current period of expanshysion15
In general the revisions have very little effect on business cycles In the revised estimates for the 11 conshytractions since 1947 all but the 2001 recession show more moderate declines than in the previously pubshylished estimates (table 26) For the 2001 recession the average rate of growth in real GDP is revised down from a positive 10 percent to a positive 06 percent16
In the revised estimates for the most recent contracshytion real GDP decreases at an average annual rate of 29 percent through the second quarter of 2009 in the previously published estimates it had decreased at a
15 These turning points are consistent with the business-cycle turning points determined by the National Bureau of Economic Research (NBER)
16 The NBER considers a number of monthly indicatorsmdashsuch as employment personal income and industrial productionmdashas well as the change in GDP growth for dating business cycles Therefore declines in quarterly real GDP often track closely with recessions but the movements of monthly indicators (especially employment) that the NBER also considshyers may affect the relationship between the pattern of change in real GDP and the identification of recessions More information about the NBER business-cycle dating procedure is available at wwwnberorg
Table 25 Prices of Gross Domestic Product and Its Major Components Revisions to Average Annual Rates of Change Over Selected Periods
Revised Previously published Revision Revised Previously
published Revision Revised Previously published Revision Revised Previously
published Revision
1929ndash2012 1929ndash1959 1959ndash2002 2002ndash2012
Gross domestic product (GDP) Personal consumption expenditures (PCE)
Goods Durable goods Nondurable goods
Services Gross private domestic investment
Fixed investment Nonresidential
Structures Equipment Intellectual proper ty products
Residential Change in private inventories
Net exports of goods and services Exports
Goods Services
Imports Goods Services
Government consumption expenditures and gross investment Federal
National defense Nondefense
State and local Addenda Gross domestic purchases Gross domestic purchases excluding food and energy 1
GDP excluding food and energy 2 PCE excluding food and energy
29 29 23 14 28 33 24 28 25 41 18 23 37
25 23 33 29 29 30
36 33 33 33 41
29
29
29 29 23 14 28 33 23 28 24 41
37
25 22 33 29 29 30
36 35 35 35 40
30
29
00 00 00 00 00 00 01 00 01 00
00
00 01 00 00 00 00
00 ndash02 ndash02 ndash02
01
ndash01
00
19 19 19 19 19 18 19 27 27 31 27 22 30
18 17 29 19 20 17
24 24 24 26 31
19
19
19 19 19 19 19 18 17 27 28 31
30
18 17 29 19 20 17
23 23 22 23 31
19
19
00 00 00 00 00 00 02 00
ndash01 00
00
00 00 00 00 00 00
01 01 02 03 00
00
00
38 38 28 17 34 45 30 31 26 46 16 27 45
28 25 36 35 34 40
45 41 41 40 48
38
38
38 38 28 17 34 46 29 30 24 46
44
29 25 37 35 34 39
46 44 44 44 47
39
38
00 00 00 00 00
ndash01 01 01 02 00
01
ndash01 00
ndash01 00 00 01
ndash01 ndash03 ndash03 ndash04
01
ndash01
00
21 21 13
ndash17 30 26 16 16 13 47 00 08 22
28 27 30 35 36 32
33 27 28 25 36
23 21 21 18
23 22 13
ndash18 30 27 17 17 13 52
23
27 26 28 35 36 32
36 31 33 28 38
24 22 23 19
ndash02 ndash01
00 01 00
ndash01 ndash01 ndash01
00 ndash05
ndash01
01 01 02 00 00 00
ndash03 ndash04 ndash05 ndash03 ndash02
ndash01 ndash01 ndash02 ndash01
1 Price index begins with 1982 2 Price index begins with 1985
37 September 2013 SURVEY OF CURRENT BUSINESS
rate of 32 percent The percent change in real GDP is revised down for three quarters and is revised up for three quarters (table 27) The average revision without regard to sign is 07 percentage point
In the revised estimates for the 10 complete expanshysions since 1947 four have slightly stronger increases than in the previously published estimatesmdashthe exshypansions beginning in the fourth quarter of 1949 in the first quarter of 1961 in the fourth quarter of 1982 and in the fourth quarter of 2001 (table 26) For two of the expansions the increases are slightly more moder-
Table 26 Revisions to Cyclical Fluctuations in Real Gross Domestic Product 1948ndash2013
ate than in the previously published estimatesmdashthe exshypansions beginning in the second quarter of 1958 and in the fourth quarter of 1970 For the remaining four expansions the average annual rates of growth for real GDP are unrevised
For the current expansion through the first quarter of 2013 real GDP increases at an average annual rate of 22 percent in the previously published estimates it had increased at a rate of 21 percent The percent change in real GDP is revised up for seven quarters and is revised down for eight quarters (table 27) The avershyage revision without regard to sign is 06 percentage point
Table 27 Rates of Growth of Real Gross Domestic Product Revised Previously
published Revision
Contractions 1948IVndash1949IV ndash15 ndash16 01 1953IIndash1954II ndash24 ndash25 01 1957IIIndash1958II ndash39 ndash42 03 1960IIndash1961I ndash04 ndash07 03 1969IVndash1970IV ndash01 ndash02 01 1973IVndash1975I ndash25 ndash26 01 1980Indash1980III ndash43 ndash44 01 1981IIIndash1982IV ndash20 ndash21 01 1990IIIndash1991I ndash26 ndash27 01 2001Indash2001IV 06 10 ndash04 2007IVndash2009II ndash29 ndash32 03
Expansions 1949IVndash1953II 76 75 01 1954IIndash1957III 40 40 00 1958IIndash1960II 56 57 ndash01 1961Indash1969IV 49 48 01 1970IVndash1973IV 51 52 ndash01 1975Indash1980I 43 43 00 1980IIIndash1981III 44 44 00 1982IVndash1990III 43 42 01 1991Indash2001I 36 36 00 2001IVndash2007IV 28 27 01 2009IIndash2013I 22 21 01
Revised Previously published Revision
2008Indash2009II
2008I ndash27 ndash18 ndash09 2008II 20 13 07 2008III ndash20 ndash37 17 2008IV ndash83 ndash89 06 2009I ndash54 ndash53 ndash01 2009II ndash04 ndash03 ndash01
Revised Previously published Revision
2009IIIndash2013I
2009III 13 14 ndash01 2009IV 39 40 ndash01 2010I 16 23 ndash07 2010II 39 22 17 2010III 28 26 02 2010IV 28 24 04 2011I ndash13 01 ndash14 2011II 32 25 07 2011III 14 13 01 2011IV 49 41 08 2012I 37 20 17 2012II 12 13 ndash01 2012III 28 31 ndash03 2012IV 01 04 ndash03 2013I 11 18 ndash07
38 Improved NIPA Estimates September 2013
Acknowledgments Nicole M Mayerhauser Chief of the National Income and Wealth Division supervised the preparation of this yearrsquos comprehensive revision of the national income and product accounts Pamela A Kelly Chief of the Governshyment Division directed major parts of the revision Brent R Moulton Associate Director for National Economic Accounts provided overall supervision
Bureau of Economic Analysis staff members who made significant contributions to the revision are listed below
Estimate coordination and review David F Sullivan Alyssa E Holdren Donald D Kim Robert J Kornfeld Brendan J Leary Shelly Smith
Personal consumption expenditures Kyle J Brown Goods Harvey L Davis Jr Yukun Fung Megan E Groll Everette P Johnson Danit E Kanal Brian K Sliker Sershyvices Jason Chute Robert N Ganz III Mahmoud Raya Teresita D Teensma Baoline Chen
Investment and foreign transactions Michael Armah Inventories foreign transactions and prices Harry Johnshyson Jr Michael M Cortez Jeffrey Hall Sinan Hastorun Echo Lin Private fixed investment in structures equipshyment and software Christina D Hovland Velma P Henry Sarah J Pack Linden L Webber Private fixed investment in research and development and entertainshyment literary and artistic originals Marissa Crawford Kevin J Furlong Andrew Schmidt
Federal government Benjamin A Mandel Peter G Beall Mark S Ludwick Stan J Bellotti Andrew P Cairns Andrea L Cook Raymen G LaBella Ann Miller Kyle D Mulgrew Farah Naz Michelle D Robinson Mary L Roy Benyam Tsehaye Andrew E Vargo Bryan Williams Keith Zipay
State and local government Bruce E Baker Steven J Andrews Melissa J Braybrooks Michelle S Grier Brian E Parks
Personal income Kurt Kunze Employee compensation Janet H Kmitch Jillian E Fasser Paul Medzerian James E Rankin Dylan G Rassier John Rusinko Brian J
Smith Business income Howard I Krakower Andrew W Hodge M Greg Key Kate L Shoemaker Martin L Simshymons Garth K Trinkl Dennis R Weikel Property income Michael N Hayes Louise V Lusby Denise A McBride Elizabeth M Terroni
Consumption of fixed capital Private Robert J Kornshyfeld Marlyn Rodriguez Michael T Cusick Michael D Glenn Lisa A Lynn Nadia Sadeacutee Government Jennifer A Bennett Mark A Bailey Mark A Ledbetter Christoshypher B Mbu
Computer systems and operations Brendan J Leary Michael J Boehm Wanda Y Chambers Benjamin D Cowan Natalie M Hayes Sung H Lee Ethan C Lincoln Sandip Mehta Ross F Metzger JD Montgomery Andrew J Pinard James J Raley III Michael D Randall Karl V Rohrer David Rozenshtein
Definitional and statistical improvements research Marshyshall Reinsdorf Research and development Jennifer Lee Wendy CY Li Jennifer Ribarsky Entertainment literary and artistic originals Rachel H Soloveichik David B Wasshausen Accrual accounting for defined benefit penshysion plans Marshall Reinsdorf David G Lenze Dylan G Rassier Expanded ownership transfer costs Arnold J Katz Improved measures of financial services Kyle K Hood
Supplemental review materials Duane G Hackmann Colby Johnson Lisa S Mataloni Kristina L Maze Stephshyanie McCulla Bonnie A Retus David F Sullivan Chrisshytopher Wang
NIPA information Jeannine Aversa Thomas B Dail Gianna M Marrone Debra M Blagburn
Secretarial and program assistance Esther M Carter Katherine Dent Beverly B Goodwin Angela P Pointer In addition the National Economic Accounts Directorate expresses gratitude and appreciation for the contribushytions of staff from the Industry Accounts Directorate led by their Associate Director Carol E Moylan and Division Chiefs Erich H Strassner and David B Wasshausen
Table A follows
39 September 2013 SURVEY OF CURRENT BUSINESS
Table A Selected Components Detail and Major Source Data and Conceptual and Statistical Changes Incorporated 2007ndash2012mdashContinues
Line NIPA component
Billions of dollars
Major source data and conceptual and statistical changes incorporated 1Revised level Revision in level
2007 2009 2012 2007 2008 2009 2010 2011 2012
1 Gross domestic product 144803 144179 162446 4516 4288 4442 4594 4581 5598 2 Personal consumption expenditures 97444 98429 111496 ndash279 ndash300 ndash30 ndash138 ndash172 300 3 Goods 33616 31984 37697 ndash23 ndash60 40 ndash21 ndash221 ndash135 4 Durable goods 11846 10233 12027 ndash38 ndash66 ndash63 ndash87 ndash165 ndash162 5 Motor vehicles and parts
Of which 6 Net purchases of used motor
4006 3171 4017 07 03 11 ndash07 ndash49 ndash53
vehicles
7 Furnishings and durable household
1112 997 1031 ndash55 ndash55 ndash45 ndash112 ndash159 ndash158 For 2007 BEA benchmark input-output accounts Revised Census Bureau annual retail trade survey (ARTS) data on gross margins and on retail sales of used motor vehicle dealers for 2010 new ARTS data for 2011 revised Census Bureau monthly retail trade survey (MRTS) data for 2012 new trade source data on cars and trucks in operation for 2012
equipment Of which
2835 2443 2751 122 108 89 91 84 93
8 Furniture and furnishings 1718 1446 1641 106 96 89 92 89 98 For 2007 BEA benchmark input-output accounts Revised ARTS data for 2010 new ARTS data for 2011 revised MRTS data for 2012
9 Recreational goods and vehicles Of which
10 Video audio photographic and information processing
3358 3038 3345 ndash136 ndash147 ndash135 ndash140 ndash190 ndash195
equipment and media 1956 1849 2050 ndash156 ndash159 ndash141 ndash143 ndash166 ndash162 For 2007 BEA benchmark input-output accounts Revised ARTS data for 2010 new ARTS data for 2011 revised MRTS data for 2012
11 Other durable goods 1648 1582 1913 ndash30 ndash31 ndash26 ndash31 ndash11 ndash08 12 Nondurable goods 13 Food and beverages purchased for offshy
21769 21751 25670 14 06 103 66 ndash56 28
premises consumption Of which
14 Food and nonalcoholic beverages purchased for off-premises
7373 7700 8633 261 265 277 283 228 342
consumption 6347 6634 7409 198 203 210 214 172 269 For 2007 BEA benchmark input-output accounts Revised ARTS data for 2010 new ARTS data for 2011 revised MRTS data for 2012 new trade source retail scanner data for 2012
15 Clothing and footwear Of which
3237 3065 3546 ndash117 ndash114 ndash105 ndash110 ndash109 ndash113
16 Menrsquos and boysrsquo clothing 853 815 935 ndash99 ndash98 ndash92 ndash96 ndash99 ndash101 For 2007 BEA benchmark input-output accounts Revised ARTS data for 2010 new ARTS data for 2011 revised MRTS data for 2012
17 Gasoline and other energy goods Of which
18 Motor vehicle fuels lubricants
3455 2845 4170 ndash193 ndash214 ndash148 ndash190 ndash194 ndash233
and fluids 3199 2602 3904 ndash231 ndash262 ndash185 ndash228 ndash243 ndash280 For 2007 BEA benchmark input-output accounts Revised Energy Information Administration supply data on non-diesel fuel for 2010ndash2012 new BLS consumer expenditure survey data on diesel fuel for 2008ndash2011
19 Other nondurable goods Of which
7704 8142 9321 63 68 81 84 19 30
20 Recreational items 1245 1238 1420 ndash113 ndash112 ndash107 ndash111 ndash140 ndash141 For 2007 BEA benchmark input-output accounts Revised ARTS data for 2010 new ARTS data for 2011 revised MRTS data for 2012
21 Personal care products 990 1001 1146 103 105 79 80 69 76 For 2007 BEA benchmark input-output accounts Revised ARTS data for 2010 new ARTS data for 2011 revised MRTS data for 2012
22 Tobacco 843 995 1088 106 107 116 118 122 120 For 2007 BEA benchmark input-output accounts Revised Department of Treasury Alcohol and Tobacco Tax and Trade Bureau data for 2010ndash2012
23 Services 24 Household consumption expenditures (for
63829 66445 73799 ndash254 ndash240 ndash70 ndash118 49 434
services) 61341 63685 70894 ndash203 ndash216 ndash35 ndash75 189 543 25 Housing and utilities 17582 18810 20139 20 81 94 171 310 480 26 Housing
Of which 27 Rental of tenant-occupied
14800 15916 17199 71 138 154 231 367 550
nonfarm housing
28 Imputed rental of ownershy
3160 3597 4304 49 61 66 124 247 363 Revised Census Bureau current population surveyhousing vacancy survey (CPSHVS) data for 2003ndash2011 new CPSHVS data for 2012 revised BEA utilities data for 2003ndash2011 new BEA utilities data for 2012 revised Department of Energy (DOE) residential energy consumption survey (RECS) data for 2005 new DOE RECS data for 2009 new BLS consumer expenditure survey data on tenant expenditures for 2008ndash2011 new Census Bureau decennial census of housing (COH) data for 2010 new Census Bureau American housing survey (AHS) data for 2011
occupied nonfarm housing 11423 12099 12637 10 64 76 94 110 167 Revised Census Bureau CPSHVS data for 2003ndash2011 new CPSHVS data for 2012 revised BEA constant-dollar housing stock data for 2008ndash2011 new BEA constant-dollar housing stock data for 2012 new Census Bureau decennial COH data for 2010 new Census Bureau AHS data for 2011
29 Household utilities 2782 2894 2940 ndash51 ndash57 ndash60 ndash60 ndash58 ndash70
See the footnotes and abbreviations at the end of the table
40 Improved NIPA Estimates September 2013
Table A Selected Components Detail and Major Source Data and Conceptual and Statistical Changes Incorporated 2007ndash2012mdashContinues
Line NIPA component
Billions of dollars
Major source data and conceptual and statistical changes incorporated 1Revised level Revision in level
2007 2009 2012 2007 2008 2009 2010 2011 2012
30 Health care Of which
14818 16274 18476 241 239 258 277 162 295
31 Physician services 3657 3928 4339 55 58 59 59 58 138 For 2007 BEA benchmark input-output accounts Revised Census Bureau service annual survey (SAS) taxable and tax-exempt revenue data for 2010 and 2011 new SAS data for 2012
32 Hospitals 6581 7366 8612 179 199 213 232 179 226 For 2007 BEA benchmark input-output accounts Revised SAS taxable and tax-exempt revenue data for 2010 and 2011 new SAS data for 2012
33 Transpor tation services 3122 2897 3181 52 58 52 53 62 53 34 Recreation services 3758 3760 4166 04 26 53 66 52 64 35 Food services and accommodations 5956 6003 7017 ndash49 ndash58 ndash69 ndash133 ndash122 ndash119 36 Financial services and insurance 7685 7190 8210 ndash218 ndash355 ndash228 ndash331 ndash60 ndash81 37 Financial services 4803 4522 4961 ndash215 ndash383 ndash251 ndash392 ndash278 ndash427
Of which 38 Financial services furnished
without payment 2366 2294 2591 ndash142 ndash320 ndash215 ndash345 ndash240 ndash396 Improved estimates of implicit services of commercial banks Revised FRB flow of funds accounts data for 2010 and 2011 new flow of funds accounts data for 2012 revised IRS tabulations of corporate tax return data for 2010 new IRS tabulations of corporate and of sole proprietorship and partnership tax return data for 2011 new FDIC data for 2012 new trade source data on credit unions and on investment companies for 2012
39 Insurance Of which
2882 2667 3250 ndash03 28 23 62 217 348
40 Life insurance 875 800 1033 37 51 47 51 150 170 Revised trade source data on life insurance company expenses for 2007ndash2010 new trade source data for 2011 new BLS quarterly census of employment and wages data for 2012
41 Net health insurance 1313 1194 1545 ndash43 ndash26 ndash28 05 69 190 Revised benefits-to-premiums ratio based on new trade source data on medical insurance for 2011 new DHHS medical expenditures panel survey data for 2011 and 2012
42 Other services 8419 8751 9704 ndash255 ndash207 ndash196 ndash177 ndash214 ndash151 43 Communication
Of which 2033 2179 2517 ndash38 07 22 32 53 165
44 Telecommunication services 1490 1496 1606 ndash104 ndash104 ndash95 ndash94 ndash130 ndash132 For 2007 BEA benchmark input-output accounts Revised SAS product revenue data for 2007ndash2010 new SAS product revenue data for 2011 new SAS industry revenue data for 2012
45 Internet access 423 563 807 39 75 83 93 157 274 For 2007 BEA benchmark input-output accounts Revised SAS product revenue data for 2007ndash2010 new SAS product revenue data for 2011 new SAS industry revenue data for 2012
46 Education services 1966 2199 2649 09 ndash04 ndash13 ndash15 ndash13 ndash05 47 Professional and other services 1636 1615 1694 ndash02 ndash10 ndash17 ndash13 ndash10 ndash63 48 Personal care and clothing services 49 Social services and religious
1115 1099 1248 04 04 07 40 24 49
activities 1246 1332 1473 ndash132 ndash139 ndash142 ndash146 ndash154 ndash153 For 2007 BEA benchmark input-output accounts Revised SAS taxable and tax-exempt revenue data for 2010 and 2011 new SAS data for 2012
50 Net foreign travel ndash215 ndash275 ndash536 ndash123 ndash89 ndash81 ndash101 ndash129 ndash169 Of which
51 Foreign travel by US residents 2
52 Final consumption expenditures of 1041 979 1100 ndash98 ndash99 ndash92 ndash114 ndash150 ndash171 Revised BEA international transactions accounts data for 1999ndash2012
nonprofit institutions 2488 2760 2905 ndash51 ndash25 ndash35 ndash43 ndash140 ndash109 53 Gross output of nonprofit institutions 9831 10726 11941 ndash63 ndash56 ndash61 ndash75 ndash229 ndash214 New treatment of research and development For 2007 BEA benchmark
input-output accounts Revised SAS tax-exempt expenses data for 2010 and 2011 new SAS data for 2012
54 Less Receipts from sales of goods and services by nonprofit institutions 7344 7965 9036 ndash11 ndash31 ndash27 ndash32 ndash88 ndash105 See entries under Household consumption expenditures (for services) line
24 55 Gross private domestic investment 26437 18781 24752 3485 3372 3288 3635 3772 4129 56 Fixed investment 26093 20257 24091 3432 3281 3222 3603 3773 4049 57 Nonresidential 19206 16334 19700 2831 2847 2841 3198 3303 3487 58 Structures
Of which 4969 4382 4373 ndash280 ndash339 ndash129 ndash143 ndash242 ndash261
59 Power 541 761 832 40 51 57 49 51 33 60 Electric 415 604 668 79 141 186 123 172 229 Improved classifications of wind and solar power structures For 2007 BEA
benchmark input-output accounts 61 Other power 127 157 163 ndash38 ndash90 ndash129 ndash74 ndash121 ndash197 Improved classifications of wind and solar power structures For 2007 BEA
benchmark input-output accounts 62 Petroleum and natural gas 949 694 1165 ndash317 ndash375 ndash159 ndash184 ndash286 ndash277 For 2007 BEA benchmark input-output accounts Revised trade source data
on footage drilled for 2008ndash2011 new trade source data for 2012 new Census Bureau annual capital expenditures survey data for 2011
63 Equipment 3 8858 6443 9076 64 Information processing equipment 3
Of which 3032 2561 2845
65 Communication equipment 1062 794 958 68 68 35 57 134 176 For 2007 BEA benchmark input-output accounts Revised Census Bureau annual survey of manufactures (ASM) data for 2010 new ASM data for 2011 revised Census Bureau monthly industry shipments data for 2012
66 Industrial equipment 1941 1521 1953 11 ndash16 ndash31 ndash24 08 ndash22
See the footnotes and abbreviations at the end of the table
41 September 2013 SURVEY OF CURRENT BUSINESS
Table A Selected Components Detail and Major Source Data and Conceptual and Statistical Changes Incorporated 2007ndash2012mdashContinues
Line NIPA component
Billions of dollars
Major source data and conceptual and statistical changes incorporated 1Revised level Revision in level
2007 2009 2012 2007 2008 2009 2010 2011 2012
67 Transportation equipment 1888 706 2144 ndash14 ndash07 ndash53 43 71 175 For 2007 BEA benchmark input-output accounts Revised trade source data on motor vehicle unit sales and prices for 2007 revised trade source data on auto and light truck average expenditures for 2008ndash2011 revised trade source data on business motor vehicle registrations for 2012
68 Other equipment 2118 1742 2237 105 87 28 103 107 68 For 2007 BEA benchmark input-output accounts Revised Census Bureau ASM data for 2010 new ASM data for 2011 revised Census Bureau monthly industry shipments data for 2012
69 Less Sale of equipment scrap excluding autos 122 86 103 37 60 22 16 13 15
70 Intellectual property products 3 5379 5509 6250 New treatments of research and development and of entertainment literary and artistic originals
71 Software 2442 2568 2816 ndash08 13 ndash01 ndash89 ndash111 ndash118 For 2007 BEA benchmark input-output accounts Revised Census Bureau service annual survey (SAS) revenue data for 2010 and 2011 new SAS data for 2012 new BLS occupational employment survey data for 2012
72 Research and development 3 73 Entertainment literary and ar tistic
2233 2290 2691 New treatment of research and development
originals 3 704 651 743 New treatment of enter tainment literary and artistic originals 74 Residential 6887 3922 4392 600 435 381 405 471 563 75 Structures 6788 3839 4302 604 438 385 410 475 566
Of which 76 Brokersrsquo commissions and other
ownership transfer costs 3 1447 952 1069 New treatment of ownership transfer costs 77 Residential equipment 99 83 90 ndash04 ndash05 ndash05 ndash05 ndash04 ndash04 78 Change in private inventories 345 ndash1476 661 54 91 66 31 ndash02 80 79 Farm ndash07 ndash16 ndash117 00 00 01 00 ndash03 44 80 Nonfarm 352 ndash1460 778 54 91 65 32 01 37 81 Change in book value 924 ndash1537 928 10 60 45 62 06 49 82 Mining utilities and construction 34 ndash53 68 ndash04 10 60 ndash08 ndash64 07 83 Manufacturing 385 ndash335 148 00 ndash07 00 64 11 ndash01 84 Wholesale trade 332 ndash620 285 44 70 00 ndash33 ndash15 ndash19 85 Merchant wholesale 258 ndash494 252 06 12 00 20 ndash31 ndash23 86 Nonmerchant wholesale 75 ndash125 34 39 58 00 ndash52 16 05 87 Retail trade
Of which 138 ndash478 338 16 ndash14 00 28 56 15
88 Retail motor vehicle dealers 37 ndash330 232 00 ndash01 00 24 57 25 89 Other industries 34 ndash51 89 ndash46 00 ndash15 11 18 46 90 IVA ndash572 77 ndash150 43 31 20 ndash30 ndash06 ndash12 91 Net exports of goods and services 2 ndash7098 ndash3922 ndash5472 33 ndash35 ndash35 ndash69 ndash06 127 Revised BEA international transactions accounts data for 1999ndash2012 92 Exports 16657 15838 21959 40 ndash37 ndash36 ndash09 70 119 93 Goods 11653 10647 15360 33 01 00 ndash01 ndash09 ndash68 94 Services
Of which 5004 5191 6599 07 ndash38 ndash36 ndash08 79 187
95 Royalties and license fees 978 984 1242 132 00 00 03 ndash01 ndash07 Reclassification of distribution rights for film and television recordings from exports of ldquootherrdquo private services
96 Other private services 2116 2373 2945 ndash108 00 00 07 94 191 Reclassification of distribution rights for film and television recordings to exports of rents and royalties Improved methodology for estimating expenditures by seasonal border and other short-term workers for 2003ndash2012 New BEA 2011 Benchmark Survey of Transactions in Selected Services and Intangible Assets with Foreign Persons data for 2011 corrected repor ting and new data from major companies for 2011 and 2012
97 Imports 23755 19760 27431 07 ndash01 ndash02 59 76 ndash09 98 Goods
Of which 20003 15873 22954 ndash04 01 ndash02 42 54 35
99 Other 851 755 906 ndash107 02 00 44 55 45 Reallocation of adjustments for low-value imports and for inland freight in Canada and Mexico
100 Services 101 Government consumption expenditures
3753 3887 4477 13 ndash01 00 17 23 ndash44
and gross investment 28019 30891 31670 1277 1251 1219 1165 989 1042 102 Federal 10498 12177 12957 735 755 741 808 820 814 Revised allocations of FY 2011 and FY 2012 OMB Budget data for
2010ndash2012 preliminary FY 2013 OMB Budget data for 2012 103 National defense 6787 7883 8171 164 163 123 151 150 80 104 Consumption expenditures 5261 6133 6520 ndash493 ndash505 ndash511 ndash493 ndash493 ndash516
Of which 105 Compensation of general
government employees 106 Consumption of general
2015 2288 2486 ndash368 ndash402 ndash450 ndash460 ndash494 ndash553 New treatment of defined benefit pension plans
government fixed capital 1299 1446 1611 525 560 581 602 621 626 New treatment of research and development 107 Services 1565 1928 1909 ndash482 ndash492 ndash471 ndash462 ndash436 ndash398 New treatment of research and development 108 Less Own-account investment 186 195 200 165 171 171 173 183 177 New treatment of research and development 109 Gross investment 1527 1750 1651 658 668 635 643 643 595 110 Structures 100 171 84 ndash01 00 00 00 ndash01 ndash01 111 Equipment 3 708 860 862 112 Intellectual property products 3 719 718 705 113 Software 3 65 68 77 114 Research and development 3 654 650 629 New treatment of research and development
See the footnotes and abbreviations at the end of the table
42 Improved NIPA Estimates September 2013
Table A Selected Components Detail and Major Source Data and Conceptual and Statistical Changes Incorporated 2007ndash2012mdashContinues
Line NIPA component
Billions of dollars
Major source data and conceptual and statistical changes incorporated 1Revised level Revision in level
2007 2009 2012 2007 2008 2009 2010 2011 2012
115 Nondefense 3710 4294 4786 570 592 618 658 669 735 116 Consumption expenditures
Of which 117 Compensation of general
2723 3204 3597 ndash12 ndash15 ndash21 ndash26 ndash36 37
government employees 118 Consumption of general
1281 1467 1625 ndash133 ndash137 ndash146 ndash150 ndash144 ndash161 New treatment of defined benefit pension plans
government fixed capital 769 835 943 480 506 519 551 576 586 New treatment of research and development 119 Services 627 814 910 ndash252 ndash276 ndash278 ndash309 ndash336 ndash274 New treatment of research and development 120 Less Own-account investment 142 154 151 116 117 123 124 126 121 New treatment of research and development 121 Gross investment 988 1090 1189 583 606 639 683 706 698 122 Structures 114 120 142 03 00 ndash01 ndash06 06 13 123 Equipment 3 161 177 195 124 Intellectual property products 3 713 793 853 125 Software 3 142 150 172 126 Research and development 3 572 643 680 New treatment of research and development 127 State and local 17522 18714 18713 543 496 478 358 170 228 128 Consumption expenditures
Of which 129 Compensation of general
14114 15084 15364 425 395 351 221 ndash06 56
government employees
130 Consumption of general government
10655 11419 11785 838 836 855 997 936 904 New treatment of defined benefit pension plans Improved estimates of employersrsquo contributions to defined contribution pension plans Improved measures of wages paid by Indian tribal governments
fixed capital 1447 1621 1788 78 93 99 102 104 107 New treatment of research and development 131 Nondurable goods 2071 2120 2478 ndash29 ndash52 05 ndash98 ndash164 ndash127 New treatment of research and development For 2007 BEA benchmark
input-output accounts Revised Census Bureau government finances FY 2006ndashFY 2010 tabulations for 2005ndash2010 new government finances FY 2011 tabulations for 2010 and 2011
132 Services 3468 3728 3709 ndash162 ndash192 ndash304 ndash412 ndash436 ndash370 New treatment of research and development For 2007 BEA benchmark input-output accounts Revised Census Bureau government finances FY 2006ndashFY 2010 tabulations for 2005ndash2010 new government finances FY 2011 tabulations for 2010 and 2011
133 Less Own-account investment 336 362 352 120 129 131 134 140 142 New treatment of research and development 134 Less Sales to other sectors
Of which 3430 3694 4282 181 159 166 222 292 306
135 Other sales 1235 1233 1376 154 136 134 158 184 182 New treatment of research and development For 2007 BEA benchmark input-output accounts Revised Census Bureau government finances FY 2006ndashFY 2010 tabulations for 2005ndash2010 new government finances FY 2011 tabulations for 2010 and 2011
136 Gross investment 3408 3630 3349 118 100 127 137 175 172 137 Structures 2712 2898 2627 28 03 21 45 95 108 Revised Census Bureau government finances FY 2006ndashFY 2010 tabulations
for 2005ndash2010 new government finances FY 2011 tabulations for 2010 and 2011 revised Census Bureau construction spending (value put in place) data for 2011 and 2012
138 Equipment 3 439 445 411 139 Intellectual property products 3 258 287 312 140 Software 3 117 122 134 141 Research and development 3 141 165 178 New treatment of research and development 142 Gross domestic product 144803 144179 162446 4516 4288 4442 4594 4581 5598 143 Less Statistical discrepancy 4 202 722 ndash170 322 1014 ndash461 198 ndash856 ndash572 144 Equals Gross domestic income 144601 143457 162616 4194 3272 4903 4396 5437 6170 145 Compensation of employees paid 79088 77957 86200 458 109 ndash115 ndash19 ndash166 196 See entries under Compensation of employees line 167 146 Wages and salaries 64057 62601 69351 ndash169 ndash130 ndash231 ndash261 ndash225 216 147 To persons 63909 62468 69205 ndash279 ndash181 ndash181 ndash273 ndash229 205 148 To the rest of the world 147 133 146 46 00 00 12 04 11 149 Supplements to wages and salaries 15031 15356 16849 627 239 116 244 59 ndash20 150 Taxes on production and imports 10346 10261 11229 74 33 29 21 ndash08 ndash71 151 Less Subsidies 546 583 573 00 ndash03 ndash14 ndash11 ndash16 ndash35 152 Net operating surplus 33070 32139 40332 ndash1305 ndash1965 ndash45 ndash700 436 698 153 Private enterprises 33235 32345 40609 ndash1258 ndash1913 06 ndash666 408 635 154 Current surplus of government enterprises ndash164 ndash206 ndash277 ndash46 ndash52 ndash50 ndash34 27 63 155 Consumption of fixed capital 22644 23684 25429 4969 5093 5021 5082 5158 5312 156 Private 18650 19257 20493 3888 3940 3829 3836 3870 4015 New treatments of research and development of enter tainment literary and
ar tistic originals and of ownership transfer costs Revised BEA fixed investment and price estimates for 2001ndash2012
157 Domestic business 14512 15224 16394 2605 2740 2724 2780 2859 3004 158 Capital consumption allowances 13300 15586 15950 2428 2595 2757 2839 3277 3374 New treatments of research and development of enter tainment literary and
ar tistic originals and of ownership transfer costs Improved measures of IRS section 179 expensing for sole proprietorships Revised IRS tabulations of corporate tax return data for 2001ndash2010 new IRS tabulations of corporate and of sole proprietorship and partnership tax return data for 2011 revised Office of Tax Analysis bonus depreciation estimates for 2012 revised BEA fixed investment estimates for 2001ndash2012
159 Less CCAdj ndash1212 362 ndash444 ndash176 ndash145 33 59 419 370 CCAdj is calculated as capital consumption allowances less consumption of fixed capital
160 Households and institutions 4137 4033 4099 1282 1200 1106 1056 1012 1011 New treatments of research and development and of ownership transfer costs Revised BEA fixed investment and price estimates for 2001ndash2012
161 Government 3994 4427 4936 1081 1153 1192 1246 1287 1297 New treatment of research and development 162 Plus Income receipts from the rest of the world 2 8755 6437 8186 45 07 13 35 191 363 Revised BEA international transactions accounts data for 1999ndash2012 163 Less Income payments to the rest of the world 2 7491 4965 5657 14 ndash31 ndash24 69 103 264 Revised BEA international transactions accounts data for 1999ndash2012
See the footnotes and abbreviations at the end of the table
43 September 2013 SURVEY OF CURRENT BUSINESS
Table A Selected Components Detail and Major Source Data and Conceptual and Statistical Changes Incorporated 2007ndash2012mdashContinues
Line NIPA component
Billions of dollars
Major source data and conceptual and statistical changes incorporated 1Revised level Revision in level
2007 2009 2012 2007 2008 2009 2010 2011 2012
164 Equals Gross national income 145866 144929 165145 4227 3311 4940 4362 5526 6269 165 Less Consumption of fixed capital 22644 23684 25429 4969 5093 5021 5082 5158 5312 See entries under Consumption of fixed capital line 155 166 Equals National income 123223 121245 139716 ndash741 ndash1783 ndash81 ndash719 368 957 167 Compensation of employees 78991 77878 86116 432 109 ndash116 ndash27 ndash167 187 168 Wages and salaries 63960 62522 69268 ndash195 ndash131 ndash231 ndash271 ndash226 208 169 Government 10888 11751 11973 ndash02 00 ndash01 ndash02 ndash09 ndash42 170 Other 53072 50771 57294 ndash192 ndash131 ndash230 ndash269 ndash217 249 Updated measures of misrepor ting based on IRS National Research
Program (NRP) data for 2006 Revised BLS quarterly census of employment and wages (QCEW) data for 2001ndash2011 new QCEW data for 2012
171 Supplements to wages and salaries 172 Employer contributions for employee
15031 15356 16849 627 239 116 244 59 ndash20
pension and insurance funds
173 Employer contributions for government
10414 10775 11706 609 227 103 231 64 ndash15 New treatment of defined benefit pension plans New Department of Labor pension data for 2010 new DHHS medical expenditures panel survey data for 2011 and 2012
social insurance 4617 4581 5143 18 12 12 13 ndash05 ndash05 174 Proprietorsrsquo income with IVA and CCAdj 9792 9730 12249 ndash1112 ndash714 ndash64 ndash707 ndash22 226 175 Farm 381 355 754 03 ndash48 ndash44 17 180 192 176 Proprietorsrsquo income with IVA 442 418 813 03 ndash48 ndash44 17 180 191 Revised USDA data for 2001ndash2012 177 CCAdj ndash61 ndash64 ndash59 00 00 ndash01 00 00 01 178 Nonfarm 9411 9375 11496 ndash1115 ndash666 ndash20 ndash724 ndash202 35 179 Proprietorsrsquo income 8655 7968 10049 ndash944 ndash472 139 ndash552 ndash104 ndash32 New treatments of research and development of enter tainment literary and
artistic originals and of ownership transfer costs Updated measures of misreporting based on IRS NRP data for 2006 Improved methodology for estimating the adjustment made to remove corporate partnersrsquo income Improved measures of IRS section 179 expensing for sole proprietorships Revised IRS tabulations of corporate tax return data for the posttabulation and mining depreciation adjustments for 2010 new IRS tabulations of sole proprietorship and partnership tax return data for 2011
180 IVA ndash65 14 ndash16 05 17 04 ndash05 01 04 181 CCAdj 820 1393 1462 ndash176 ndash211 ndash163 ndash167 ndash98 62 See entries under Consumption of fixed capital line 155 182 Rental income of persons with CCAdj 1894 3337 5412 457 305 440 536 747 786 183 Rental income of persons 2066 3483 5553 463 306 435 529 739 779 New treatment of ownership transfer costs Improved estimates of mor tgage
interest paid based on new IRS Information Returns Program data on loan discount points for 1999ndash2010 and on new and revised trade source data on mortgage servicing for 2005ndash2012 Revised FRB flow of funds accounts data on residential mor tgage loan liabilities for 1980ndash2012 revised Census Bureau current population surveyhousing vacancy survey (CPSHVS) data for 2003ndash2011 new CPSHVS data for 2012 revised IRS tabulations of corporate and of individual tax return data for 2010 new IRS tabulations for 2011 new Federal National Mortgage Corporation mortgage originations data for 2011 revised trade source data on insurance for 2010 new trade source data on insurance for 2011 revised Census Bureau government finances FY 2002ndashFY 2011 tabulations for 2001ndash2011 new FY 2012 Census Bureau annual survey of state government tax collections data for 2011 and 2012 new and revised OMB Budget data on subsidies for 2003ndash2012
184 CCAdj ndash172 ndash146 ndash141 ndash06 ndash01 05 06 07 06 185 Corporate profits with IVA and CCAdj 15290 13926 20095 184 367 503 382 507 589 186 Domestic industries 11756 10398 15905 158 366 503 445 531 699 187 Financial 2610 3217 4220 ndash628 ndash227 ndash72 ndash165 ndash254 ndash103 188 Nonfinancial 9146 7181 11685 787 593 575 611 785 802 189 Rest of the world 2 3534 3528 4189 25 01 00 ndash64 ndash23 ndash111 Revised BEA international transactions accounts data for 1999ndash2012 190 Less CCAdj ndash1799 ndash822 ndash1705 06 67 191 219 510 301 See entries under Consumption of fixed capital line 155 191 Equals Corporate profits with IVA 17089 14748 21800 178 300 312 161 ndash03 287 See entries under Corporate profits before tax without IVA and CCAdj line
208 192 Domestic industries 13555 11220 17611 153 299 312 225 21 399 193 Financial 3015 3629 4774 ndash440 ndash268 ndash119 ndash190 ndash242 ndash73 194 Federal Reserve banks 360 473 717 00 00 00 00 00 ndash17 195 Other financial 2655 3155 4057 ndash440 ndash267 ndash120 ndash189 ndash242 ndash56 196 Nonfinancial 10540 7592 12837 593 567 432 415 263 472 197 Utilities 495 238 371 ndash08 ndash06 07 19 ndash66 ndash20 198 Manufacturing 3219 1714 4043 506 451 404 514 590 326 199 Durable goods 1189 344 1970 228 75 133 232 353 158 200 Nondurable goods 2030 1370 2073 278 377 271 282 237 168 201 Wholesale trade 1032 893 1378 33 43 27 40 00 ndash15 202 Retail trade 1190 1087 1492 12 ndash13 07 ndash43 72 92 203 Transportation and warehousing 239 224 515 ndash38 ndash31 ndash24 ndash35 ndash134 ndash29 204 Information 1084 812 1106 148 171 84 87 19 ndash18 205 Other nonfinancial 3282 2623 3932 ndash60 ndash49 ndash74 ndash167 ndash220 135 206 Rest of the world 3534 3528 4189 25 01 00 ndash64 ndash23 ndash111 207 Less IVA 208 Equals Corporate profits before tax without
ndash395 67 ndash100 77 75 35 ndash23 66 09
IVA and CCAdj 17484 14682 21900 100 225 277 185 ndash67 278 New treatments of research and development of enter tainment literary and artistic originals of ownership transfer costs and of defined benefit pension plans Improved methodology for distributing the income of regulated investment companies by type Revised IRS tabulations of corporate tax return data for 2010 new IRS tabulations for 2011 revised Census Bureau quar terly financial report data for 2012 new and revised regulatory and public financial repor ts profits data for 2012
See the footnotes and abbreviations at the end of the table
44 Improved NIPA Estimates September 2013
Table A Selected Components Detail and Major Source Data and Conceptual and Statistical Changes Incorporated 2007ndash2012mdashContinues
Line NIPA component
Billions of dollars
Major source data and conceptual and statistical changes incorporated 1Revised level Revision in level
2007 2009 2012 2007 2008 2009 2010 2011 2012
209 Less Taxes on corporate income 4455 2694 4348 00 01 00 ndash27 ndash48 ndash145 210 Equals Profits after tax 13029 11987 17552 100 224 276 213 ndash20 423 211 Less Net corporate dividend payments 8189 5687 7703 244 217 146 ndash370 44 ndash96 212 Equals Undistributed corporate profits 4840 6300 9849 ndash144 07 130 582 ndash63 519 213 Net interest and miscellaneous payments 6634 5631 4396 ndash682 ndash1767 ndash774 ndash785 ndash705 ndash647 214 Net interest 6408 5448 4181 ndash720 ndash1806 ndash797 ndash807 ndash744 ndash681 215 Domestic business 3851 3010 2417 21 ndash1078 ndash263 ndash417 ndash425 216 Monetary interest paid 28668 15820 12670 339 ndash1050 54 ndash68 88 Improved methodology for distributing the income of regulated investment
companies by type Revised IRS tabulations of corporate tax return data for 2010 new IRS tabulations of corporate and of sole proprietorship and par tnership tax return data for 2011 revised FRB flow of funds accounts data on nonfinancial corporate liabilities for 2010 and 2011 new FRB data for 2012 revised USDA interest data for 2010 and 2011 new FDIC data for 2012 new trade source data on credit unions and on investment companies for 2012
217 Less Monetary interest received
218 Imputed interest paid depositor
31515 19243 16922 1492 1426 1293 954 1135 New treatment of defined benefit pension plans Revised IRS tabulations of corporate tax return data for 2010 new IRS tabulations of corporate and of sole proprietorship and par tnership tax return data for 2011 revised FRB flow of funds accounts data on nonfinancial corporate liabilities for 2010 and 2011 new FRB data for 2012 revised USDA interest data for 2010 and 2011 new USDA data for 2012 new FDIC data for 2012 new trade source data on credit unions and on investment companies for 2012
insurance and pension services 3 7753 8446 8563 219 Financial 220 Banks credit agencies and
7775 8190 8366 2476 2394 3175 3105 3161
investment companies 2402 2219 2291 ndash17 ndash546 ndash128 ndash123 31 Improved estimates of implicit services of commercial banks Revised IRS tabulations of corporate tax return data for 2010 new IRS tabulations for 2011 new FDIC data for 2012 new trade source data on credit unions and on investment companies for 2012
221 Life insurance carriers
222 Property and casualty insurance
2552 2381 2346 ndash02 02 00 ndash56 ndash162 New trade source data on investment income of life insurance carriers for 2011 revised FRB flow of funds accounts data on life insurance company assets for 2010 and 2011 new FRB data for 2012
companies 315 276 302 ndash12 08 ndash11 05 ndash04 223 Employee pension plans 3 2507 3284 3403 New treatment of defined benefit pension plans 224 Other 3 ndash01 29 24 New treatment of defined benefit pension plans 225 Nonfinancial 3 226 Less Imputed interest received
depositor insurance and pension
ndash22 256 197 New treatment of defined benefit pension plans
services
227 Imputed interest paid borrower
1756 2562 2527 1102 1272 2013 1957 1908 New treatment of defined benefit pension plans Improved estimates of implicit services of commercial banks Revised FRB flow of funds accounts data for 2010 and 2011 new flow of funds accounts data for 2012 revised IRS tabulations of corporate tax return data for 2010 new IRS tabulations for 2011 new FDIC data for 2012
services
228 Less Imputed interest received
ndash733 ndash671 ndash730 231 68 397 566 632 Improved estimates of implicit services of commercial banks Improved estimates of mor tgage interest paid Revised FRB flow of funds accounts data for 2010 and 2011 new FRB data for 2012
borrower services ndash1435 ndash1221 ndash1362 407 152 838 1320 1477 Improved estimates of implicit services of commercial banks 229 Owner-occupied housing 4606 4301 3248 ndash783 ndash769 ndash587 ndash455 ndash460 230 Monetary interest paid
231 Imputed interest paid borrower
5109 4678 3619 ndash808 ndash749 ndash754 ndash761 ndash796 Improved estimates of mortgage interest paid Revised FRB flow of funds accounts data on residential mortgage liabilities for 2010ndash2012
services
232 Less Imputed interest received depositor insurance and pension
ndash489 ndash365 ndash358 26 ndash21 166 306 336 Improved estimates of implicit services of commercial banks Improved estimates of mor tgage interest paid Revised FRB flow of funds accounts data for 2010 and 2011 new FRB data for 2012
services 14 12 13 00 00 00 00 00 233 Nonprofit institutions 123 115 94 09 04 17 26 27 234 Rest of the world 2 ndash2173 ndash1978 ndash1577 32 37 36 39 113 Improved estimates of implicit services of commercial banks Revised BEA
international transactions accounts data for 1999ndash2012 235 Miscellaneous payments 226 182 215 38 39 23 21 39 34 236 Taxes on production and imports 10346 10261 11229 74 33 29 21 ndash08 ndash71 237 Federal 946 914 1180 01 00 00 13 12 20 238 State and local 9400 9348 10049 73 33 30 09 ndash19 ndash91 239 Less Subsidies 546 583 573 00 ndash03 ndash14 ndash11 ndash16 ndash35 240 Federal 475 569 568 01 ndash03 ndash14 ndash11 ndash17 ndash36 241 State and local 71 14 05 00 00 00 00 00 00 242 Business current transfer payments (net) 986 1272 1069 ndash47 ndash66 ndash62 ndash115 ndash30 ndash211 243 To persons (net) 306 387 414 01 ndash02 ndash09 ndash44 18 ndash45 244 To government (net) 620 907 706 ndash48 ndash64 ndash53 ndash73 ndash47 ndash138 Reclassification of certain federal transfer receipts as rents and royalties and
transfers to the rest of the world (net) 245 To the rest of the world (net) 60 ndash23 ndash51 00 00 00 02 ndash01 ndash27 246 Current surplus of government enterprises ndash164 ndash206 ndash277 ndash46 ndash52 ndash50 ndash34 27 63 247 Federal 20 08 ndash134 47 45 53 39 54 44 248 State and local ndash185 ndash214 ndash143 ndash94 ndash97 ndash103 ndash73 ndash27 20 New treatment of defined benefit pension plans Revised Census Bureau
government finances FY 2006ndashFY 2010 tabulations for 2005ndash2010 new government finances FY 2011 tabulations for 2010 and 2011
See the footnotes and abbreviations at the end of the table
45 September 2013 SURVEY OF CURRENT BUSINESS
Table A Selected Components Detail and Major Source Data and Conceptual and Statistical Changes Incorporated 2007ndash2012mdashTable Ends
Line NIPA component
Billions of dollars
Major source data and conceptual and statistical changes incorporated 1Revised level Revision in level
2007 2009 2012 2007 2008 2009 2010 2011 2012
Addenda 249 Gross national product 146068 145651 164974 4549 4325 4479 4560 4671 5696 250 Gross saving 25067 20717 26722 4590 3737 5159 4843 6239 6518 251 Personal income 119957 120821 137438 834 ndash296 2151 1133 2440 3127 See entries under National income and additional sources below 252 Compensation of employees 78991 77878 86116 369 59 ndash66 ndash27 ndash167 187 253 Proprietorsrsquo income with IVA and CCAdj 9792 9730 12249 ndash1112 ndash714 ndash64 ndash707 ndash22 226 254 Rental income of persons with CCAdj 1894 3337 5412 457 305 440 536 747 786 255 Personal income receipts on assets 21666 18118 19585 1096 17 1853 1413 1995 2088 256 Personal interest income 13501 12639 12116 850 ndash204 1706 1784 1953 2190 New treatment of defined benefit pension plans Improved estimates of
implicit services of commercial banks Improved methodology for distributing the income of regulated investment companies by type Revised FRB flow of funds accounts data for 2010 and 2011 new FRB data for 2012 revised IRS tabulations of corporate tax return data for 2010 new IRS tabulations of corporate and of sole proprietorship and partnership tax return data for 2011 new trade source data on investment income of life insurance carriers for 2011 new FDIC data for 2012 new trade source data on credit unions and on investment companies for 2012
257 Personal dividend income 8165 5479 7469 246 220 147 ndash371 42 ndash101 Improved methodology for distributing the income of regulated investment companies by type Revised IRS tabulations of corporate tax return data for 2010 new IRS tabulations for 2011 new and revised regulatory agency and public financial statements data on dividends for 2012 revised BEA international transactions accounts data for 1999ndash2012
258 Personal current transfer receipts 17228 21402 23583 43 48 01 ndash74 ndash123 ndash168 259 Government social benefits to persons 16922 21015 23168 43 49 10 ndash29 ndash140 ndash124 260 Federal 12589 16089 17725 47 62 35 15 ndash76 ndash25 261 State and local 4333 4926 5443 ndash04 ndash13 ndash25 ndash45 ndash65 ndash99 262 Other current transfer receipts from
business (net) 306 387 414 01 ndash02 ndash09 ndash44 18 ndash45 263 Less Contributions for government social
insurance domestic 9614 9644 9507 19 09 13 08 ndash11 ndash08 264 Federal 9425 9458 9332 19 13 16 11 ndash11 ndash08 265 State and local 189 186 175 00 ndash03 ndash04 ndash03 00 00 266 Less Personal current taxes 14879 11449 14980 ndash08 ndash05 03 ndash33 60 176 267 Federal 11644 8572 11492 ndash12 04 02 ndash04 18 46 268 State and local 3235 2878 3488 04 ndash09 02 ndash30 42 130 Revised Census Bureau government finances FY 2006ndashFY 2011 tabulations
for 2005ndash2011 new government finances FY 2012 tabulations for 2011 and 2012
269 Equals Disposable personal income 105079 109372 122458 843 ndash291 2148 1166 2381 2950 270 Less Personal outlays 101906 102665 115584 157 118 522 491 592 981 271 Personal consumption expenditures 97444 98429 111496 ndash279 ndash300 ndash30 ndash138 ndash172 300 272 Personal interest payments 3059 2739 2484 450 440 568 670 800 757 Improved estimates of implicit services of commercial banks and of
mortgage interest paid Improved treatment for the derivation of monetary interest paid on consumer loans Revised FRB interest rate data for 1980ndash2012 revised FRB flow of funds accounts data for 2010 and 2011 new flow of funds accounts data for 2012 revised FRB consumer credit outstanding data for 2010ndash2012 new FDIC data for 2012
273 Personal current transfer payments 1403 1496 1604 ndash14 ndash21 ndash17 ndash40 ndash34 ndash76 274 To government 810 835 885 ndash14 ndash21 ndash17 ndash35 ndash36 ndash30 275 To the rest of the world (net) 593 661 719 00 00 00 ndash05 02 ndash45 276 Equals Personal saving 3172 6707 6874 685 ndash410 1625 675 1788 1969
1 In these descriptions ldquonewrdquo indicates this is the first time that data from the specific source are being incorshyporated into the component estimate for the given year and ldquorevisedrdquo indicates that data from the specific source were incorporated previously and now revised data from that source are being incorporated
2 Revisions reflect the annual revision of BEArsquos international transactions accounts (ITAs) The revised ITA estimates were incorporated into the NIPAs at their ldquobest levelrdquo for 2010ndash2012 As a result there are differences between the NIPA estimates and the ITA estimates for 1999ndash2009 For more information on the revisions to the International Transactions Accounts see Barbara H Berman and Jeffrey R Bogen Annual Revision of the US International Transactions Accounts SUR VEY 93 (July 2013) 43ndash54 Additionally revised estimates for 1999ndash2007 reflect changes previously incorporated into the ITAs but not into the NIPAs because they affected years outside of the periods open for revision including the reclassification of distribution rights for film and teleshyvision recordings and the reallocation of adjustments for low-value imports and for inland freight in Canada and Mexico these changes were incorporated in the previously published NIPA estimates for 2008ndash2012
3 Revisions are not shown because this component was not previously published 4 The statistical discrepancy is gross domestic product (GDP) less gross domestic income (GDI) it is also
the difference between gross national product (GNP) and gross national income (GNI) which is GDI plus net income receipts from the rest of the world The statistical discrepancy arises because the product-side measures of GDP and GNP are estimated independently from the income-side measures of GDI and GNI
NOTE The new treatments of research and development of entertainment literary and artistic originals of ownership transfer costs and of defined benefit pension plans begin with the estimates for 1929 The improved estimates of employersrsquo contributions to state and local government-sponsored defined contribution pension plans begin with 1966 The improved measures of IRS section 179 expensing for sole proprietorships begin with the estimates for 1982 The improved estimates of the implicit services of commercial banks begin with 1985 The improved measures of wages paid by Indian tribal governments begin with the estimates for
1990 The improved methodology for distributing the income of regulated investment companies by type begins with the estimates for 1992 The improved classifications of wind and solar power structures the improved methodology for estimating the adjustment made to remove corporate partnersrsquo income from nonfarm proprietorsrsquo income and the improved estimates of mortgage interest paid begin with 1993 Updated measures of misreporting begin with the estimates for 2002 The improved treatment for the derivation of monetary interest paid on consumer loans begins with the estimates for 1980 For more information on the changes in definitions and in methodologies that were introduced as par t of the 2013 comprehensive revision of the NIPAs see ldquoPreview of the 2013 Comprehensive Revision of the National Income and Product Accounts Changes in Definitions and Presentationsrdquo SUR VEY 93 (March 2013) 13ndash39 and Nicole M Mayershyhauser and Sarah J Pack ldquoPreview of the 2013 Comprehensive Revision of the National Income and Product Accounts Statistical Changesrdquo SURVEY 93 (May 2013) 6ndash14
BEA Bureau of Economic Analysis BLS Bureau of Labor Statistics CCAdj Capital consumption adjustment DHHS Department of Health and Human Services FDIC Federal Deposit Insurance Corporation FRB Federal Reserve Board FY Fiscal year IRS Internal Revenue Service IVA Inventory valuation adjustment NIPA National income and product account OMB Office of Management and Budget USDA US Depar tment of Agriculture
- Improved Estimates of the National Income and Product Accounts Results of the 2013 Comprehensive Revision
-
- Annual Current-Dollar Estimates
-
- Domestic income and product (account 1)
-
- Product-side components
-
- Box Government Research and Development
-
- Income-side components
-
- Private enterprise income (account 2)
- Personal income and outlays (account 3)
- Government current receipts and expenditures (account 4)
- Foreign transactions (accounts 5 and 7)
-
- Box Discontinuities in the Estimates of Foreign Transactions in the National Income and Product Accounts
-
- Domestic capital (account 6)
-
- Annual Estimates of Real GDP and Real DPI
-
- Real GDP
- Real DPI
-
- Annual Prices
- Quarterly Real GDP
- Box New and Revised Source Data
- Box Data Availability
- Box Acknowledgments
-
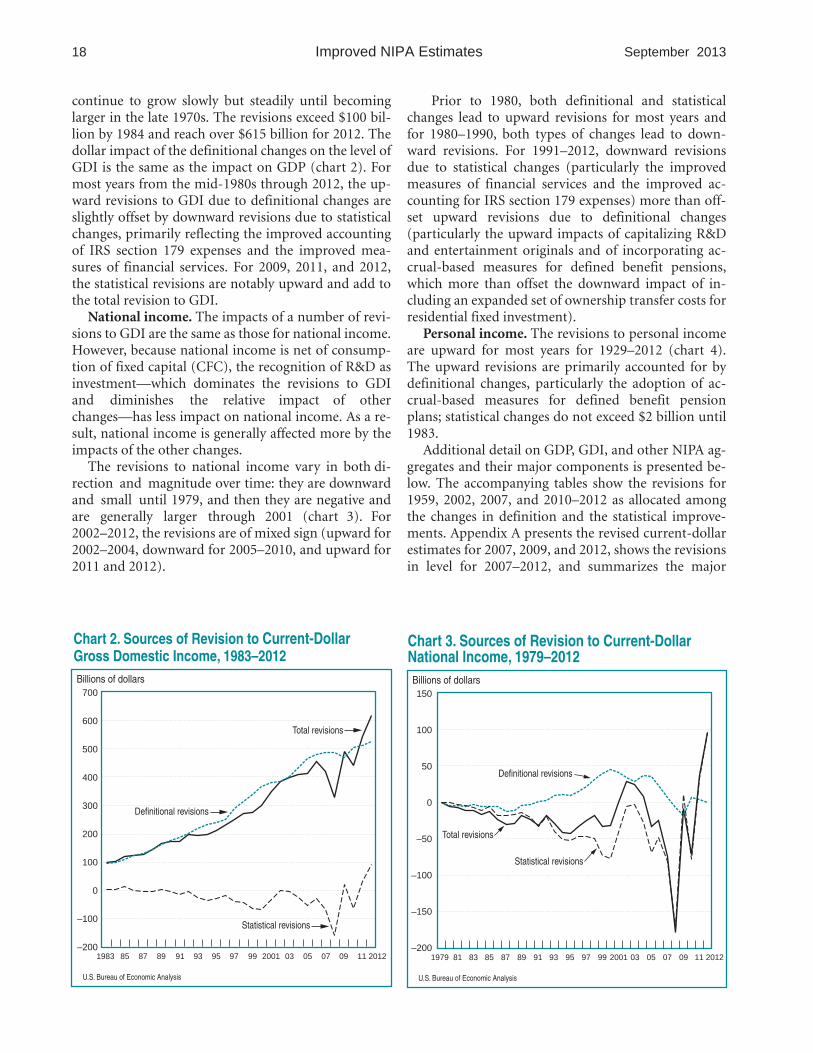
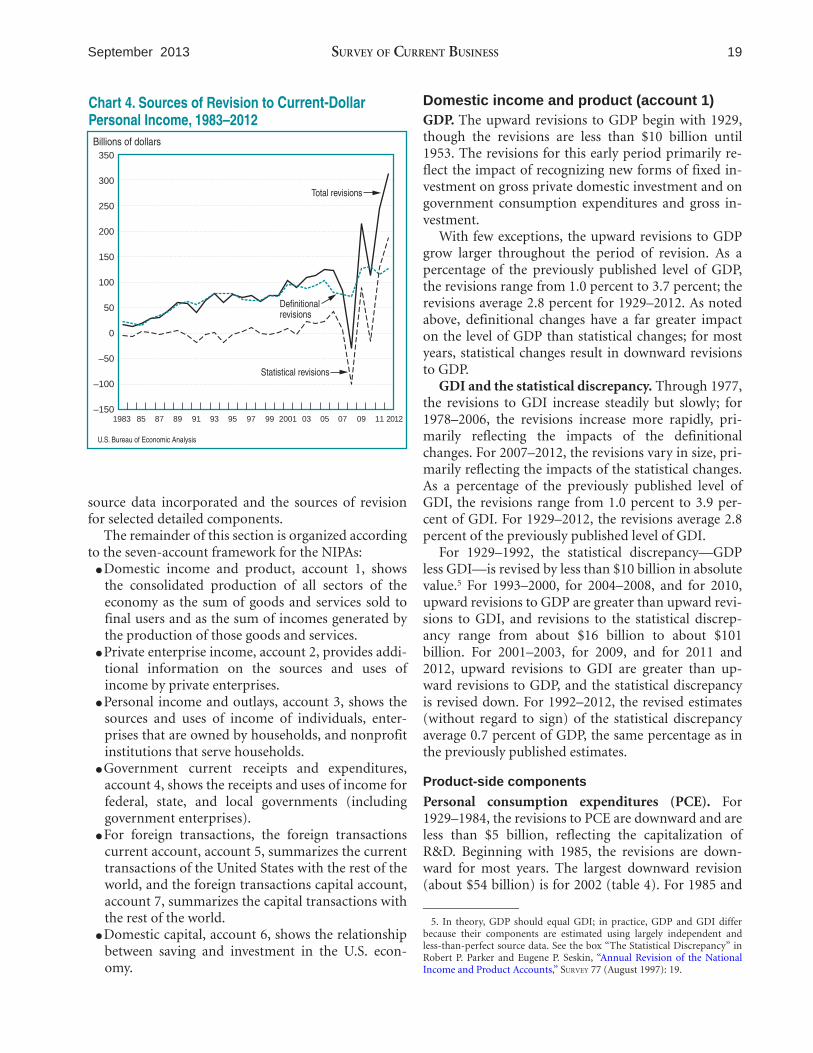
19
September 2013 SURVEY OF CURRENT BUSINESS
Chart 4 Sources of Revision to Current-Dollar Personal Income 1983ndash2012 Billions of dollars
350
300
250
200
150
100
50
0
ndash50
ndash100
ndash150 1983 85 87 89 91 93 95 97 99 2001 03 05 07 09 11 2012
Definitional revisions
Total revisions
Statistical revisions
US Bureau of Economic Analysis
source data incorporated and the sources of revision for selected detailed components
The remainder of this section is organized according to the seven-account framework for the NIPAs
Domestic income and product account 1 shows the consolidated production of all sectors of the economy as the sum of goods and services sold to final users and as the sum of incomes generated by the production of those goods and services
Private enterprise income account 2 provides addishytional information on the sources and uses of income by private enterprises
Personal income and outlays account 3 shows the sources and uses of income of individuals entershyprises that are owned by households and nonprofit institutions that serve households
Government current receipts and expenditures account 4 shows the receipts and uses of income for federal state and local governments (including government enterprises)
For foreign transactions the foreign transactions current account account 5 summarizes the current transactions of the United States with the rest of the world and the foreign transactions capital account account 7 summarizes the capital transactions with the rest of the world
Domestic capital account 6 shows the relationship between saving and investment in the US econshyomy
Domestic income and product (account 1) GDP The upward revisions to GDP begin with 1929 though the revisions are less than $10 billion until 1953 The revisions for this early period primarily reshyflect the impact of recognizing new forms of fixed inshyvestment on gross private domestic investment and on government consumption expenditures and gross inshyvestment
With few exceptions the upward revisions to GDP grow larger throughout the period of revision As a percentage of the previously published level of GDP the revisions range from 10 percent to 37 percent the revisions average 28 percent for 1929ndash2012 As noted above definitional changes have a far greater impact on the level of GDP than statistical changes for most years statistical changes result in downward revisions to GDP
GDI and the statistical discrepancy Through 1977 the revisions to GDI increase steadily but slowly for 1978ndash2006 the revisions increase more rapidly prishymarily reflecting the impacts of the definitional changes For 2007ndash2012 the revisions vary in size prishymarily reflecting the impacts of the statistical changes As a percentage of the previously published level of GDI the revisions range from 10 percent to 39 pershycent of GDI For 1929ndash2012 the revisions average 28 percent of the previously published level of GDI
For 1929ndash1992 the statistical discrepancymdashGDP less GDImdashis revised by less than $10 billion in absolute value5 For 1993ndash2000 for 2004ndash2008 and for 2010 upward revisions to GDP are greater than upward revishysions to GDI and revisions to the statistical discrepshyancy range from about $16 billion to about $101 billion For 2001ndash2003 for 2009 and for 2011 and 2012 upward revisions to GDI are greater than upshyward revisions to GDP and the statistical discrepancy is revised down For 1992ndash2012 the revised estimates (without regard to sign) of the statistical discrepancy average 07 percent of GDP the same percentage as in the previously published estimates
Product-side components
Personal consumption expenditures (PCE) For 1929ndash1984 the revisions to PCE are downward and are less than $5 billion reflecting the capitalization of RampD Beginning with 1985 the revisions are downshyward for most years The largest downward revision (about $54 billion) is for 2002 (table 4) For 1985 and
5 In theory GDP should equal GDI in practice GDP and GDI differ because their components are estimated using largely independent and less-than-perfect source data See the box ldquoThe Statistical Discrepancyrdquo in Robert P Parker and Eugene P Seskin ldquoAnnual Revision of the National Income and Product Accountsrdquo SURVEY 77 (August 1997) 19
20 Improved NIPA Estimates September 2013
Table 4 Revisions to Personal Consumption Expenditures [Billions of dollars]
1959 1997 2002 2007 2010 2011 2012
Total revision ndash02 ndash99 ndash539 ndash279 ndash138 ndash172 300 Definitional ndash01 ndash45 ndash57 ndash51 ndash79 ndash108 ndash110
Capitalization of research and development ndash01 ndash45 ndash57 ndash51 ndash79 ndash108 ndash110 Statistical ndash01 ndash54 ndash482 ndash228 ndash59 ndash64 410
Improved measurement of financial services 00 ndash73 ndash193 ndash157 ndash364 ndash300 ndash295 Other statistical ndash01 19 ndash289 ndash71 305 236 705
Source of revision by component Goods 00 00 ndash114 ndash23 ndash21 ndash221 ndash135
Durable goods 00 00 ndash67 ndash38 ndash87 ndash165 ndash162 Definitional 00 00 00 00 00 00 00 Statistical 00 00 ndash67 ndash38 ndash87 ndash165 ndash162
Nondurable goods 00 00 ndash47 14 66 ndash56 28 Definitional 00 00 00 00 00 00 00 Statistical 00 00 ndash47 14 66 ndash56 28
Services ndash02 ndash99 ndash425 ndash254 ndash118 49 434 Definitional ndash01 ndash45 ndash57 ndash51 ndash79 ndash108 ndash110
Capitalization of research and development ndash01 ndash45 ndash57 ndash51 ndash79 ndash108 ndash110 Statistical ndash01 ndash54 ndash368 ndash203 ndash39 157 544
Improved measurement of financial services 00 ndash73 ndash193 ndash157 ndash364 ndash300 ndash295 Other statistical ndash01 19 ndash175 ndash46 325 457 839
1986 there are small upward revisions of about $5 billion and about $2 billion respectively the only noshytable upward revision to PCE is for 2012 ($30 billion)
For 1929ndash1997 revisions to PCE are due to revishysions to services primarily reflecting the impacts of recognizing RampD as investment (for 1929 forward) and the improved measures of financial services (for 1985 forward)
For 1998ndash2011 revisions to PCE also reflect the inshycorporation of a significant amount of new and revised source data BEArsquos 2007 benchmark I-O accounts tabshyulations of Census Bureau data from the service anshynual survey (SAS) the annual retail trade survey the current population survey the housing vacancy survey and the American housing survey and data from the Energy Information Administration The overall imshypacts of these data result in downward revisions to PCE for both goods and services for most years
Private fixed investment Private fixed investment is revised up for all years from 1929 forward prior to 2003 the revisions are due almost exclusively to the impacts of recognizing RampD and entertainment origishynals as nonresidential fixed investment and of expandshying the ownership transfer costs that are recognized as residential fixed investment (table 5)
For 2003 forward the revisions to private fixed inshyvestment also generally reflect upward revisions to equipment and to the change in private inventories that are partly offset by downward revisions to nonresshyidential structures
Nonresidential structures Revisions to this comshyponent begin with 2002 and are downward for most years the largest downward revision is for 2008 (about $34 billion) The revisions are exclusively due to statisshytical changesmdashprimarily the incorporation of data from the 2007 benchmark I-O accounts of revised peshytroleum footage drilled and expenditure data from trade sources and the Census Bureau and of revised Census Bureau construction spending data
Equipment Private equipment (excluding softshyware) was revised up for 2003 forward reflecting stashytistical changes including the incorporation of BEArsquos 2007 benchmark I-O accounts of new and revised data from Census Bureau surveys of manufactures and of other new and revised source data
The revisions to equipment are less than $10 billion until 2005 and remain less than $20 billion until 2010 For 2010ndash2012 new and revised Census Bureau anshynual survey of manufactures data for shipments result in upward revisions particularly to information proshycessing equipment the upward revisions to equipment range from about $31 billion for 2010 to about $43 bilshylion for 2012
Intellectual property products This new category of fixed investment consists of expenditures for softshyware for RampD and for entertainment literary and arshytistic originals
Private investment in software was previously inshycluded in the ldquoequipment and softwarerdquo category Softshyware is not revised until 2003 for 2003ndash2009 there are small generally downward revisions of less than $2 billion For 2010ndash2012 the downward revisions beshycome larger reaching about $12 billion for 2012 The revisions reflect statistical changes that result primarily from the incorporation of data from the 2007 benchshymark I-O accounts and of new and revised Census Bushyreau SAS data
Table 5 Revisions to Gross Private Domestic Investment [Billions of dollars]
1959 1997 2002 2007 2010 2011 2012
Total revision Definitional
Capitalization of research and development
Capitalization of entertainment literary and artistic originals
Expanded set of ownership transfer costs for residential fixed assets
Reclassification of software to intellectual property products
Statistical Source of revision by component
Private fixed investment Nonresidential
Structures Definitional Statistical
Equipment 1 Definitional Statistical
Intellectual property products Definitional
Capitalization of research and development
Capitalization of entertainment literary and ar tistic originals
Statistical revision to software Residential
Definitional Expanded set of ownership transfer
costs for residential fixed assets Statistical
Change in private inventories Definitional Statistical
72 71
44
22
05
00 01
71 66 00 00 00 00 00 00
66
44
22 00 05 05
05 00 00 00 00
2069 2069
1344
461
264
00 00
2070 1805
00 00 00 00 00 00
1805
1344
461 00
265 264
264 01
ndash01 00
ndash01
2780 2694
1657
576
461
00 86
2716 2235
01 00 01 00 00 00
2233
1657
576 00
481 461
461 20 65 00 65
3485 3508
2233
704
570
00 ndash23
3432 2831 ndash280
00 ndash280
182 00
182 2937
2233
704 ndash08 600 570
570 30 54 00 54
3635 3492
2402
722
368
00 143
3603 3198 ndash143
00 ndash143
307 00
307 3124
2402
722 ndash89 405 368
368 37 31 00 31
3772 3659
2552
738
369
00 113
3773 3303 ndash242
00 ndash242 367
00 367
3290
2552
738 ndash111 471 369
369 102 ndash02
00 ndash02
4129 3857
2691
743
423
00 272
4049 3487 ndash261
00 ndash261 431
00 431
3434
2691
743 ndash118 563 423
423 140
80 00 80
1 ldquoEquipmentrdquo is a new NIPA category Revisions are calculated by subtracting the new category from a comparable category derived from the previously published NIPA category ldquoprivate fixed investment in equipshyment and softwarerdquo
21 September 2013 SURVEY OF CURRENT BUSINESS
Expenditures for RampD and for entertainment origishynals were previously treated as intermediate expenses and were not recorded as final expenditures Recognizshying RampD and entertainment originals as fixed investshyment boosts the level of investment for all years For RampD private investment exceeds $10 billion in 1969 and reaches nearly $270 billion in 2012 For entertainshyment originals private investment exceeds $10 billion in 1979 and reaches over $74 billion in 2012
Residential fixed investment This component is revised up generally by increasing amounts for all years The revisions are less than $1 billion until 1965 remain less than $5 billion until 1978 and reach a peak of about $81 billion for 2005 For 2006 forward the upward revisions are of lesser amounts but remain mostly above $40 billion
The revisions for each year are primarily due to the expanded set of ownership transfer costs that are recshyognized as residential fixed investment Statistical changesmdashprimarily reflecting the incorporation of data from the 2007 benchmark I-O accounts and of new and revised Census Bureau construction spending datamdashare generally small and upward after 2000
Change in private inventories Revisions to the change in private inventories (ldquoinventory investmentrdquo) begin with 2002 and are mostly upward they are less than $10 billion for each year The revisions primarily reflect the impact on nonfarm inventory investment of the incorporation of new and revised Census Bureau
data on inventory book values and of new commodity price weights from the 2007 benchmark I-O accounts Revisions to farm inventory investment are less than $5 billion for all years and primarily reflect revised US Department of Agriculture (USDA) farm statistics for 2010ndash2012 For 2012 the revision to farm invenshytory investment of over $4 billion exceeds the revision to nonfarm inventories this revision also reflects the incorporation of revised USDA data
Net exports of goods and services Revisions to net exports begin with 1985 and are of mixed sign but they do not exceed $2 billion in absolute value until 2002 (table 6) Revisions are upward for 2002ndash2007 downward for 2008ndash2011 and upward for 2012 The largest upward revision is for 2012 (about $13 billion) the largest downward revision is for 2010 (almost $7 billion)
For 1985ndash1998 the revisions to net exports are due solely to the impact of the improved measures of fishynancial services on the exports of services
For 1999ndash2012 the revisions to net exports are prishymarily due to the incorporation of revised data from BEArsquos international transactions accounts (ITAs) there are no definitional revisions to net exports6 For exshyports of goods and services the revisions are small for most years the largest revision is an upward revision of
6 Royalties for RampD and for entertainment originals were already included in the previously published estimates of exports of services and of imports of services
Data Availability An extensive set of estimates is presented in ldquoNational incorporated in this comprehensive NIPA revision Income and Product Accountsrdquo (NIPAs) in this issue The following additional revised NIPA estimates and These estimates and annual estimates for 1929 forward related tables will be released on BEArsquos Web site and then and quarterly estimates for 1947 forward are available on published in upcoming issues of the SURVEY NIPA table BEArsquos Web site at wwwbeagov 29 (personal income by households and by nonprofit
The October SURVEY OF CURRENT BUSINESS will present institutions serving households) tables 315ndash317 (govshyrevised estimates of fixed assets and of consumer durable ernment spending by function) table 318 (reconciliashygoods and revised estimates of real inventories sales and tion of NIPA federal government estimates with federal inventory-sales ratios for manufacturing and trade for budget data) table 319 (reconciliation of NIPA state and the fourth quarter of 2009 through the second quarter of local government estimates with Census Bureau data) 2013 tables 320 and 321 (state government and local govern-
The October SURVEY will also present revised estimates ment current receipts and expenditures) and tables 322 of state personal income for 2001ndash2012 that incorporate and 323 (not seasonally adjusted estimates of federal the results of this comprehensive NIPA revision government and state and local government current
The November SURVEY will feature the ldquoUpdated Sum- receipts and expenditures) table 510 (changes in the net mary of NIPA Methodologiesrdquo which lists the principal stock of produced assets) NIPA table 712 (imputations source data and estimating methods that are used in pre- in the NIPAs) table 715 (reconciliation of net farm paring the current-dollar and chained-dollar estimates of income in the NIPAs with net farm income from the US GDP Department of Agriculture) and table 719 (reconcilia-
The January SURVEY will present the results from the tion of NIPA income and outlays of nonprofit institushy2007 benchmark input-output accounts which are tions with IRS revenue and expenses)
22 Improved NIPA Estimates September 2013
Table 6 Revisions to Net Exports of Goods and Services [Billions of dollars]
1959 1997 2002 2007 2010 2011 2012
Total revision 00 ndash06 22 33 ndash69 ndash06 127 Definitional 00 00 00 00 00 00 00 Statistical 00 ndash06 22 33 ndash69 ndash06 127
Improved measurement of financial services 00 ndash07 ndash17 ndash15 ndash29 ndash32 ndash36 Other statistical 00 01 39 48 ndash40 26 163
Source of revision by component Exports of goods and services 00 ndash06 17 40 ndash09 70 119
Goods 00 00 123 33 ndash01 ndash09 ndash68 Definitional 00 00 00 00 00 00 00 Statistical 00 00 123 33 ndash01 ndash09 ndash68
Services 00 ndash06 ndash106 07 ndash08 79 187 Definitional 00 00 00 00 00 00 00 Statistical 00 ndash06 ndash106 07 ndash08 79 187
Improved measurement of financial services 00 ndash07 ndash17 ndash15 ndash29 ndash32 ndash36
Other statistical 00 01 ndash89 22 21 111 223 Imports of goods and services 00 00 ndash05 07 59 76 ndash09
Goods 00 00 42 ndash04 42 54 35 Definitional 00 00 00 00 00 00 00 Statistical 00 00 42 ndash04 42 54 35
Services 00 00 ndash47 13 17 23 ndash44 Definitional 00 00 00 00 00 00 00 Statistical 00 00 ndash47 13 17 23 ndash44
about $12 billion for 2012 For imports of goods and services the revisions are less than $5 billion in absoshylute value for each year except for 2010 and 2011 when they are about $60 billion and about $75 billion reshyspectively
Government consumption expenditures and gross investment Government consumption expenditures and gross investment (ldquogovernment spendingrdquo) is reshyvised up for each year for 1961 forward the revisions exceed $10 billion and generally increase until about 2000 after which they are fairly steady through 2012 (table 7) The largest revision is for 2007 (about $128 billion) For 1929ndash1975 the revisions to government spending are dominated by upward revisions to federal spending For 1976ndash1988 upward revisions to federal spending are partly offset by downward revisions to state and local spending For 1989ndash2012 upward revishysions to state and local spending steadily increase peaking at about $57 billion for 2004 and supplementshying the upward revisions to federal spending
For federal spending both defense and nondefense spending contribute to the upward revisions Beginshyning with 1992 the upward revisions to defense spending begin to decrease while the revisions to nonshydefense spending increase throughout the period
Revisions to defense spending reflect upward revishysions to consumption expenditures until 1979 and upshyward revisions to gross investment for the entire period Defense consumption expenditures are revised up for 1929ndash1978 the largest upward revision (just over $5 billion) is for 1970 Defense consumption exshypenditures are revised down for 1979ndash2012 the largest downward revision (almost $52 billion) is for 2012 The revisions reflect the adoption of accrual-based measures for defined benefit pension plans which have an upward impact in early years but a downward
impact in the recent period and the effects of removshying RampD expenditures from consumption The upshyward revisions to defense gross investment are more than accounted for by the capitalization of RampD exshypenditures (For more on the impacts on government spending of recognizing RampD as investment see the box ldquoGovernment Research and Developmentrdquo)
The revisions to nondefense spending throughout the period are due primarily to the impact on gross inshyvestment of capitalizing RampD revisions to consumpshytion expenditures are small and mostly downward
For state and local spending revisions also begin with 1929 The revisions are upward and less than $3 billion through 1975 are downward and larger for 1976ndash1988 and are upward and even larger for 1989ndash2012 For 1976ndash1988 the downward revisions are due to the impacts of removing RampD expenditures
Table 7 Revisions to Government Consumption Expenditures and Gross Investment
[Billions of dollars]
1959 1997 2002 2007 2010 2011 2012
Total revision 89 798 1116 1277 1165 989 1042 Definitional 93 866 1220 1424 1621 1569 1513
Capitalization of research and development Accrual accounting for defined benefit
44 772 844 1127 1303 1361 1386
pension plans 49 93 377 297 318 208 126 Statistical ndash04 ndash68 ndash104 ndash147 ndash456 ndash580 ndash471
Improved measurement of financial services 00 ndash29 ndash57 ndash65 ndash162 ndash170 ndash173 Other statistical
Source of revision by component ndash04 ndash39 ndash47 ndash82 ndash294 ndash411 ndash298
Federal 82 514 600 735 808 820 814
Defense 71 216 191 164 151 150 80 Consumption expenditures 19 ndash120 ndash226 ndash493 ndash493 ndash493 ndash516
Definitional Capitalization of research and
15 ndash150 ndash259 ndash497 ndash518 ndash539 ndash541
development Accrual accounting for defined benefit
ndash19 55 ndash31 ndash116 ndash40 ndash30 00
pension plans 34 ndash205 ndash228 ndash381 ndash478 ndash509 ndash541 Statistical 04 30 33 04 25 46 25
Gross investment 52 337 417 658 643 643 595 Definitional
Capitalization of research and 57 336 414 654 653 666 643
development 57 336 414 654 653 666 643 Statistical ndash05 01 03 04 ndash10 ndash23 ndash48
Nondefense 11 299 409 570 658 669 735 Consumption expenditures 00 ndash68 ndash76 ndash12 ndash26 ndash36 37
Definitional Capitalization of research and
00 ndash130 ndash197 ndash225 ndash256 ndash224 ndash203
development Accrual accounting for defined benefit
ndash06 ndash46 ndash100 ndash88 ndash110 ndash83 ndash51
pension plans 06 ndash84 ndash97 ndash138 ndash146 ndash141 ndash152 Statistical
Improved measurement of financial 00 62 121 213 230 188 240
services 00 00 ndash01 00 00 00 00 Other statistical 00 62 122 214 230 188 240
Gross investment 11 366 484 583 683 706 698 Definitional
Capitalization of research and 11 371 486 572 667 666 644
development 11 371 486 572 667 666 644 Statistical 00 ndash05 ndash02 11 16 40 54
State and local 06 283 516 543 358 170 228 Consumption expenditures 05 214 416 425 221 ndash06 56
Definitional Capitalization of research and
08 369 677 780 902 821 792
development Accrual accounting for defined benefit
00 ndash13 ndash24 ndash35 ndash41 ndash36 ndash27
pension plans 09 382 701 816 943 857 820 Statistical
Improved measurement of financial ndash03 ndash155 ndash261 ndash355 ndash681 ndash827 ndash736
services 00 ndash29 ndash56 ndash65 ndash161 ndash169 ndash173 Other statistical ndash03 ndash126 ndash205 ndash290 ndash520 ndash658 ndash564
Gross investment 02 69 100 118 137 175 172 Definitional
Capitalization of research and 02 69 100 141 173 178 178
development 02 69 100 141 173 178 178 Statistical 00 00 00 ndash23 ndash36 ndash03 ndash06
23 September 2013 SURVEY OF CURRENT BUSINESS
from consumption of incorporating accrual-based measures for defined benefit pension plans and of other changes including the incorporation of imshyproved measures of state and local government-sponshysored defined contribution pension plans beginning with 1985 the downward revisions also reflect the imshyproved measures of financial services7 These downshyward revisions are partly offset by upward revisions due to the impact on gross investment of capitalizing RampD and the impact on consumption expenditures from the addition of CFC for RampD For 1989ndash2012 upward revisions to both consumption expenditures and gross investment for most years primarily reflect the impacts of incorporating accrual-based measures for defined benefit pension plans and the recognition
7 With this comprehensive revision BEA improved its coverage of state and local defined contribution pension plans by incorporating new source data from the Bureau of Labor Statistics employer costs for employee comshypensation survey See ldquoPreview Statistical Changesrdquo 8ndash9
Government Research and Development In addition to the definitional change that reclassifies government research and development (RampD) spendshying from consumption to investment the new treatshyment of RampD also changes the classification of government spending between the federal governshyment and state and local governments The federal government is a major funder of RampD through research grants while state and local governments are major producers of RampD at public universities and hospitals
With the recognition of RampD as a capital asset ownership of the RampD asset must be assigned to a secshytor of the economy BEA adopted the convention that the entity that funds RampD will be the owner of the RampD asset Thus federally funded RampD performed at public universities and hospitals is recorded as federal gross investment in intellectual property products1
Accordingly federal research grants-in-aid to state and local governments are reclassified as federal gross investment and as state and local sales to other sectors previously they had been recorded as federal current transfer payments and as state and local current transshyfer receipts
In addition to these changes BEA introduced new source data for federal RampD spending Previously the estimates for RampDmdashwhich were treated as intermedishyate goods and services purchasedmdashhad been based on federal budget data the newly published estimates for federal RampD investment are based on data from the National Science Foundation surveys of RampD by pershyformer and by funder when available
1 See ldquoPreview Changes in Definitions and Presentationsrdquo 15ndash16
of RampD as investment these upward revisions are partly offset by downward revisions due to the imshyproved measures of financial services
Income-side components
Compensation of employees paid This aggregate shows the income accruing to employees for their work for domestic production it includes compensation paid to the rest of the world and excludes compensashytion received from the rest of the world8
The revisions to compensation reflect revisions to wages and salaries and to supplements to wages and salaries (table 8) Prior to 1992 the revisions are due exclusively to revisions to supplements
Revisions to wages and salaries reflect only statisshytical changes the introduction of accrual accounting for wages and salaries affects only the measure of wages and salaries in personal income (the measures of wages and salaries in GDI and in national income were alshyready on an accrual basis) The statistical revisions inshyclude updated measures of misreporting based on data from the IRS revised data on wages and salaries paid to and received from the rest of the world from the ITAs improved measures of wages paid by Indian tribal governments revised estimates of wages from cafeteria plans and the incorporation of new and reshyvised data from the Bureau of Labor Statistics (BLS) Quarterly Census of Employment and Wages
Revisions to wages and salaries begin with 1992 For 1992ndash2012 revisions to wages and salaries are of mixed sign the largest downward revision is for 2010
8 This measure of compensation differs from the measure that is a comshyponent of national income The national income measure excludes comshypensation paid to the rest of the world and includes compensation received from the rest of the world
Table 8 Revisions to Compensation of Employees Paid [Billions of dollars]
1959 1997 2002 2007 2010 2011 2012
Total revision 53 491 333 458 ndash19 ndash166 196 Definitional
Accrual accounting for defined benefit 53 421 315 550 35 ndash134 ndash234
pension plans 53 421 315 550 35 ndash134 ndash234 Accrual accounting for wages and salaries 00 00 00 00 00 00 00
Statistical Source of revision by component
00 70 18 ndash92 ndash54 ndash32 430
Wages and salaries 00 32 13 ndash169 ndash261 ndash225 216 Definitional 00 00 00 00 00 00 00
Accrual accounting for wages and salaries 00 00 00 00 00 00 00 Statistical 00 32 13 ndash169 ndash261 ndash225 216
Supplements to wages and salaries 54 458 320 627 244 59 ndash20 Definitional
Accrual accounting for defined benefit 53 421 315 550 35 ndash134 ndash234
pension plans 53 421 315 550 35 ndash134 ndash234 Statistical Employer contributions for employee
01 37 05 77 209 193 214
pension and insurance funds 53 459 321 609 231 64 ndash15 Definitional
Accrual accounting for defined benefit 53 421 315 550 35 ndash134 ndash234
pension plans 53 421 315 550 35 ndash134 ndash234 Statistical
Employer contributions for government 00 38 06 59 196 198 219
social insurance 00 00 ndash01 18 13 ndash05 ndash05 Definitional 00 00 00 00 00 00 00 Statistical 00 00 ndash01 18 13 ndash05 ndash05
24 Improved NIPA Estimates September 2013
(just over $26 billion) and the largest upward revision is for 2012 (over $21 billion)
The revisions to supplements are upward for 1929ndash1975 are downward for 1976ndash1988 and are upshyward for 1989ndash2002 Revisions are downward for 2003 are upward for 2004ndash2011 and are downward for 2012 The largest upward revision is for 2000 (almost $70 billion) and the largest downward revision is for 1984 ($28 billion)
The revisions to supplements primarily reflect the impact on employer contributions for employee penshysion and insurance funds of incorporating accrual-based measures for defined benefit pension plans Beshyginning with 1992 statistical revisions exceed $2 bilshylion and reach a peak of over $21 billion for 2012 Statistical revisions in the later years largely reflect new pensions data from the Department of Labor as well as new medical expenditures panel survey data from the Department of Health and Human Services
Taxes on production and imports The revisions to this component begin with 2002 revisions are downshyward for 2002 are upward for 2003ndash2010 and are downward for 2011 and 2012 (table 9) The largest upshyward revision is for 2007 (over $7 billion) and the largest downward revision is for 2012 (about $7 bilshylion) For each year the revisions are exclusively due to statistical changes including upward revisions to property taxes and to state and local general sales taxes that are based primarily on the incorporation of new and revised Census Bureau government finances data
Table 9 Revisions to Taxes on Production and Imports Less Subsidies
[Billions of dollars]
1959 1997 2002 2007 2010 2011 2012
Total revision 00 00 ndash02 74 32 08 ndash36 Definitional 00 00 00 00 00 00 00 Statistical 00 00 ndash02 74 32 08 ndash36 Source of revision by component
Taxes on production and imports 00 00 ndash02 74 21 ndash08 ndash71 Definitional 00 00 00 00 00 00 00 Statistical 00 00 ndash02 74 21 ndash08 ndash71
Less Subsidies 00 00 00 00 ndash11 ndash16 ndash35 Definitional 00 00 00 00 00 00 00 Statistical 00 00 00 00 ndash11 ndash16 ndash35
Subsidies This component is revised for 1929ndash1958 and for 2006ndash2012 (table 9) For 1929ndash1958 upward revisions result from the adoption of accrual-based measures for defined benefit pension plans for federal government enterprises which are netted against subshysidies in this period9 For 2006ndash2012 the revisions are generally downward and small reaching a peak of less than $4 billion for 2012 The revisions result primarily
9 As part of the 2003 comprehensive revision the current surplus of govshyernment enterprises was reclassified as a government receipt for 1959 forshyward before this revision it was classified as a negative government expenditure and netted against subsidies The available source data do not allow the reclassification prior to 1959
from new and revised federal budget data and the reshyclassification of certain federal transactions from subshysidies to other transactions (such as capital transfers to business)10
Net operating surplus This component is a profits-like measure that shows business income after subshytracting the costs of compensation of employees taxes on production and imports less subsidies and CFC from gross value added but before subtracting financshying costs (such as net interest) and business transfer payments Net operating surplus consists of net intershyest and miscellaneous payments (of domestic indusshytries) business current transfer payments (net) proprietorsrsquo income with inventory valuation adjustshyment (IVA) and capital consumption adjustment (CCAdj) rental income of persons with CCAdj corposhyrate profits with IVA and CCAdj (of domestic indusshytries) and the current surplus of government enterprises Except for the current surplus of governshyment enterprises discussed below the revisions to these components are discussed in the section on the private enterprise income account
Revisions to net operating surplus begin with 1931 and are less than $5 billion until 1973 Revisions are upward for 1973ndash1985 are downward for 1986ndash2002 are upward for 2003 are downward for 2004ndash2010 and are upward for 2011 and 2012 (table 10) The largest downward revision is for 2008 (almost $197 bilshylion) and the largest upward revision is for 2012 (alshymost $70 billion)
Current surplus of government enterprises The revisions to this component begin with 1959 and are fairly small throughout the period reaching $5 billion in absolute value for only 4 years all after 2005 Prior to 2006 the revisions are due primarily to the adoption of accrual-based measures for defined benefit pension plans which results in upward revisions for federal enterprises that are partly offset by downward revishysions to state and local enterprises For 2006ndash2009 the adoption of accrual-based measures results in downshyward revisions that are supplemented by downward statistical revisions For 2011 and 2012 upward statisshytical revisions more than offset the downward revishysions due to the adoption of accrual-based measures for defined benefit pension plans
CFC CFC is revised up for all years revisions reach $10 billion by 1959 and grow steadily thereafter reachshying over $531 billion for 2012 (table 11) Throughout
10 Payments to lenders who refinanced mortgages through the Home Affordable Modification Program are reclassified from subsidies to capital transfers to business based on new information from the Department of Treasury In addition certain payments made to commercial banks through the federal governmentrsquos Student Loan Purchasing Authority are reclassishyfied as financial transactions in order to maintain consistency with how BEA treats similar transactions related to other student loan programs
September 2013 SURVEY OF CURRENT BUSINESS 25
the period the revisions to private CFC exceed those to government CFC and the revisions to business CFC exceed revisions to the CFC of households and institushytions (that is nonprofit institutions) The upward revi-
Table 10 Revisions to Net Operating Surplus [Billions of dollars]
1959 1997 2002 2007 2010 2011 2012
Total revision 08 ndash753 ndash43 ndash1305 ndash700 436 698 Definitional 06 ndash211 26 ndash479 28 177 237
Capitalization of research and development Capitalization of enter tainment literary and
12 235 185 394 304 325 335
artistic originals Expanded set of ownership transfer costs for
06 123 127 134 126 129 117
residential fixed assets Accrual accounting for defined benefit
ndash07 ndash241 ndash348 ndash754 ndash685 ndash619 ndash575
pension plans ndash04 ndash327 61 ndash253 283 342 361 Statistical 02 ndash542 ndash69 ndash826 ndash728 259 461
Improved measurement of financial services Improved distribution of regulated
00 ndash108 ndash268 ndash237 ndash554 ndash501 ndash503
investment companies investment income Improved measures of IRS section 179
00 00 00 00 00 00 00
expensing 00 ndash117 ndash131 ndash211 ndash187 ndash164 ndash170 Improved mor tgage interest paid estimates 00 00 00 00 00 00 00 Other statistical
Source of revision by component 02 ndash317 329 ndash379 13 924 1134
Private enterprises 12 ndash787 ndash50 ndash1258 ndash666 408 635 Definitional 11 ndash245 18 ndash458 66 216 270
Capitalization of research and development Capitalization of enter tainment literary and
12 235 185 394 304 325 335
artistic originals Expanded set of ownership transfer costs for
06 123 127 134 126 129 117
residential fixed assets Accrual accounting for defined benefit
ndash07 ndash241 ndash348 ndash754 ndash685 ndash619 ndash575
pension plans 00 ndash361 54 ndash233 321 381 394 Statistical 01 ndash542 ndash68 ndash800 ndash732 192 365
Improved measurement of financial services Improved distribution of regulated
00 ndash108 ndash268 ndash237 ndash554 ndash501 ndash503
investment companies investment income Improved measures of IRS section 179
00 00 00 00 00 00 00
expensing 00 ndash117 ndash131 ndash211 ndash187 ndash164 ndash170 Improved mor tgage interest paid estimates 00 00 00 00 00 00 00 Other statistical 01 ndash317 330 ndash353 09 857 1038
Current surplus of government enterprises ndash05 34 07 ndash46 ndash34 27 63 Definitional
Accrual accounting for defined benefit ndash04 34 07 ndash20 ndash38 ndash39 ndash33
pension plans ndash04 34 07 ndash20 ndash38 ndash39 ndash33 Statistical ndash01 00 00 ndash27 04 66 97
Table 11 Revisions to Consumption of Fixed Capital [Billions of dollars]
1959 1997 2002 2007 2010 2011 2012
Total revision 100 2762 3571 4969 5082 5158 5312 Definitional 104 2679 3516 4808 4971 5077 5257
Capitalization of research and development Capitalization of enter tainment literary and
75 1836 2258 2914 3322 3481 3632
artistic originals Expanded set of ownership transfer costs for
17 338 449 570 596 608 626
residential fixed assets 12 505 809 1324 1053 988 999 Statistical
Source of revision by component ndash04 83 55 161 111 81 55
Private 58 2004 2740 3888 3836 3870 4015 Business 47 1494 1929 2605 2780 2859 3004
Definitional Capitalization of research and
48 1416 1891 2413 2640 2744 2884
development Capitalization of enter tainment literary
30 1027 1364 1713 1932 2028 2153
and artistic originals Expanded set of ownership transfer costs
17 338 449 570 596 608 626
for residential fixed assets 01 51 78 130 112 107 105 Statistical ndash01 78 38 192 140 115 120
Households and institutions 11 509 811 1282 1056 1012 1011 Definitional
Capitalization of research and 12 491 781 1268 1028 972 987
development Expanded set of ownership transfer costs
01 37 50 74 87 91 94
for residential fixed assets 11 454 731 1194 941 881 894 Statistical 00 18 30 14 28 40 24
Government 41 758 832 1081 1246 1287 1297 Federal 41 706 758 1002 1150 1194 1207
Definitional Capitalization of research and
43 716 768 1021 1170 1220 1236
development 43 716 768 1021 1170 1220 1236 Statistical ndash02 ndash10 ndash10 ndash19 ndash20 ndash26 ndash29
State and local 01 52 72 79 94 93 89 Definitional
Capitalization of research and 01 56 76 106 133 142 151
development 01 56 76 106 133 142 151 Statistical 00 ndash04 ndash04 ndash27 ndash39 ndash49 ndash62
sions to business CFC exceed $300 billion for 2012 and are primarily due to the capitalization of RampD and to a lesser degree of entertainment originals
For households and institutions the upward revishysions which exceed $101 billion for 2012 are primarily due to the expanded set of ownership transfer costs for residential fixed assets these revisions are suppleshymented by smaller upward revisions due to the capitalshyization of RampD11
For the federal government the revisions reach alshymost $121 billion for 2012 and are mostly due to the capitalization of RampD For state and local governshyments the upward revisions are less than $10 billion throughout the period and are also due primarily to the capitalization of RampD
Private enterprise income (account 2) Private enterprises consist of private businesses owner-occupied housing and nonprofit institutions serving households (for purposes of estimating moneshytary and imputed interest payments and imputed inshyterest receipts)
Net interest and miscellaneous payments domesshytic industries Revisions begin with 1951 but are less than $2 billion until 1973 and are less than $5 billion until 1981 For 1973ndash2001 revisions are mostly upshyward For 2002ndash2012 revisions are downward and range from about $17 billion to about $180 billion (tashyble 12) Prior to 1985 the revisions are due primarily to the adoption of accrual-based measures for defined benefit pension plans For 1986 forward the revisions also reflect the impact of the improved measures of fishynancial services that causes the total revision to be
11 The revisions associated with ownership transfer costs also reflect a faster depreciation rate for brokersrsquo commissions on residential structures
Table 12 Revisions to Net Interest and Miscellaneous Payments Domestic Industries
[Billions of dollars]
1959 1997 2002 2007 2010 2011 2012
Total revision 01 64 ndash167 ndash714 ndash824 ndash818 ndash864 Definitional
Accrual accounting for defined benefit 00 ndash136 229 ndash37 241 243 222
pension plans 00 ndash136 229 ndash37 241 243 222 Statistical 01 200 ndash396 ndash677 ndash1065 ndash1061 ndash1086
Improved measurement of financial services Improved distribution of regulated investment
00 ndash108 ndash268 ndash237 ndash554 ndash501 ndash503
companies investment income 1 00 254 ndash22 428 249 19 Improved mortgage interest paid estimates 00 53 ndash134 ndash966 ndash920 ndash954 ndash833 Other statistical
Source of revision by component 01 02 28 98 159 375
Net interest domestic industries 00 64 ndash184 ndash752 ndash845 ndash857 ndash898 Definitional
Accrual accounting for defined benefit 00 ndash136 229 ndash37 241 243 222
pension plans 00 ndash136 229 ndash37 241 243 222 Statistical 00 200 ndash413 ndash715 ndash1086 ndash1100 ndash1120
Improved measurement of financial services Improved distribution of regulated investment
00 ndash108 ndash268 ndash237 ndash554 ndash501 ndash503
companies investment income 1 00 254 ndash22 428 249 19 Improved mortgage interest paid estimates 00 53 ndash134 ndash966 ndash920 ndash954 ndash833 Other statistical 00 02 11 60 138 336
Miscellaneous payments 01 00 17 38 21 39 34 Definitional 00 00 00 00 00 00 00 Statistical 01 00 17 38 21 39 34
1 Revisions for 2012 are not shown because these data were not previously published
26 Improved NIPA Estimates September 2013
downward for 1986 for 1991 and for 1992 For 1992 forward the estimates reflect improvements to the disshytribution of the income of regulated investment comshypanies and to the measures of mortgage interest paid Prior to 2002 the impacts of these changes lead to upshyward revisions For 2002ndash2012 the downward revishysions to net interest are primarily accounted for by the improved measures of mortgage interest paid the downward revisions are partly offset by upward revishysions for most years resulting from the improved disshytribution of the income of regulated investment companies
Business current transfer payments (net) This component consists of payments to persons to govshyernment and to the rest of the world
Revisions to business current transfer payments are less than $2 billion in absolute value until 2001 for 2001ndash2012 revisions are downward for most years and range from less than $10 billion to about $21 billion (table 13) For most years the revisions are the result of the reclassification of certain payments to the fedshyeral government from transfers to rents and royalties For 2010 and 2012 downward revisions to transfer payments to persons also contribute to the overall downward revision For 2012 the reclassification of fines paid by the rest of the world also contributes to the downward revision12
Table 13 Revisions to Business Current Transfer Payments (Net) [Billions of dollars]
1959 1997 2002 2007 2010 2011 2012
Total revision ndash01 ndash12 ndash17 ndash47 ndash115 ndash30 ndash211 Definitional 00 00 00 00 00 00 00 Statistical ndash01 ndash12 ndash17 ndash47 ndash115 ndash30 ndash211
Source of revision by component Payments to persons (net) 00 00 00 01 ndash44 18 ndash45
Definitional 00 00 00 00 00 00 00 Statistical 00 00 00 01 ndash44 18 ndash45
Payments to government (net) ndash01 ndash13 ndash17 ndash48 ndash73 ndash47 ndash138 Definitional 00 00 00 00 00 00 00 Statistical ndash01 ndash13 ndash17 ndash48 ndash73 ndash47 ndash138
Payments to the rest of the world (net) 00 00 00 00 02 ndash01 ndash27 Definitional 00 00 00 00 00 00 00 Statistical 00 00 00 00 02 ndash01 ndash27
Proprietorsrsquo income with IVA and CCAdj For proshyprietorsrsquo income downward revisions begin with 1929 but they are less than $5 billion until 1985 For 1985ndash2011 revisions are downward and generally inshycreasing the largest downward revision is over $111 billion for 2007 The only upward revision is for 2012 (about $23 billion) (table 14)
Prior to 2011 the revisions are almost entirely atshytributable to nonfarm proprietorsrsquo income Prior to
12 The 2013 annual revision of the ITAs reclassified specific fines paid by foreign companies as part of transfer payments to the rest of the world (net) Previously these fines and penalties were not captured in the ITAs For more information see Christopher L Bach ldquoBEA Briefing Fines and Penalties in the US International Transactions Accountsrdquo SURVEY 93 (July 2013) 55ndash60
Table 14 Revisions to Proprietorsrsquo Income With Inventory Valuation and Capital Consumption Adjustments
[Billions of dollars]
1959 1997 2002 2007 2010 2011 2012
Total revision 00 ndash403 ndash193 ndash1112 ndash707 ndash22 226 Definitional
Capitalization of research and 00 ndash51 ndash46 ndash105 ndash87 ndash88 ndash102
development Capitalization of entertainment literary
00 18 46 42 33 33 32
and artistic originals Expanded set of ownership transfer costs
00 ndash27 ndash22 ndash45 ndash45 ndash47 ndash48
for residential fixed assets 00 ndash41 ndash71 ndash101 ndash75 ndash74 ndash86 Statistical
Improved measures of IRS section 179 00 ndash352 ndash147 ndash1007 ndash620 66 329
expensing 00 ndash117 ndash131 ndash211 ndash187 ndash164 ndash170 Other statistical Source of revision by component
00 ndash235 ndash16 ndash797 ndash432 230 499
Farm 00 ndash02 14 03 17 180 192 Definitional 00 00 00 00 00 00 00 Statistical 00 ndash02 14 03 17 180 192
Nonfarm 00 ndash401 ndash207 ndash1115 ndash724 ndash202 35 Definitional
Capitalization of research and 00 ndash51 ndash46 ndash105 ndash87 ndash88 ndash102
development Capitalization of entertainment literary
00 18 46 42 33 33 32
and artistic originals Expanded set of ownership transfer costs
00 ndash27 ndash22 ndash45 ndash45 ndash47 ndash48
for residential fixed assets 00 ndash41 ndash71 ndash101 ndash75 ndash74 ndash86 Statistical
Improved measures of IRS section 179 00 ndash350 ndash161 ndash1010 ndash637 ndash114 137
expensing 00 ndash117 ndash131 ndash211 ndash187 ndash164 ndash170 Other statistical 00 ndash233 ndash30 ndash800 ndash449 50 307
1982 the revisions to nonfarm proprietorsrsquo income are due to the capitalization of RampD and of entertainment originals and to the expanded set of ownership transfer costs for residential fixed assets these revisions are all downward and are generally small (less than $2 bilshylion) For 1982ndash2012 in addition to the changes noted above the revisions also reflect the improved measures of the capital gains and losses attributable to corporate partners and to other statistical revisions
For farm proprietorsrsquo income the revisions are less than $7 billion in absolute value until 2011 For 2011 and for 2012 the upward revisions reach almost $20 billion reflecting the incorporation of revised source data from USDA
Rental income of persons with CCAdj The revishysions to this component are zero or very small (less than $1 billion) and are downward until 1976 for 1976ndash2002 they are downward and larger reaching a peak for 2000 (over $27 billion) (table 15) For 2003ndash2012 the revisions are upward and large reachshying a peak in 2012 (over $78 billion)
Prior to 2002 the downward revisions are due prishymarily to expanding the set of ownership transfer costs
Table 15 Revisions to Rental Income of Persons With Capital Consumption Adjustment
[Billions of dollars]
1959 1997 2002 2007 2010 2011 2012
Total revision ndash04 ndash245 ndash14 457 536 747 786 Definitional ndash06 ndash194 ndash266 ndash637 ndash599 ndash534 ndash477
Expanded set of ownership transfer costs for residential fixed assets ndash06 ndash194 ndash266 ndash637 ndash599 ndash534 ndash477
Statistical 02 ndash51 252 1094 1135 1281 1263 Improved mortgage interest paid estimates 00 ndash53 134 966 920 954 833 Other statistical 02 03 118 128 216 328 430
27 September 2013 SURVEY OF CURRENT BUSINESS
for residential fixed assets Statistical revisions includshying the improved method for estimating mortgage inshyterest paid and new and revised source data also contribute to the downward revisions For 2001 and 2002 the statistical revisions are upward but are more than offset by the downward impact of expanding the set of ownership transfer costs for residential fixed asshysets For 2003ndash2012 the increasing upward statistical revisions especially the improved estimates of mortshygage interest paid outweigh the downward revisions due to the expanded set of ownership transfer costs and result in upward revisions to rental income
Corporate profits with IVA and CCAdj Corposhyrate profits is revised up for 1929ndash1986 down for 1987ndash2001 and up for 2002ndash2012 (table 16) Revisions are less than $2 billion until 1963 and are less than $5 billion until 1972 For all years revisions are almost exshyclusively to profits of domestic industries revisions to profits of the rest of the world begin with 1999 and are generally small (exceeding $2 billion in absolute value for only 4 years)
For 1972ndash1986 upward revisions which reach a peak for 1981 and 1982 (about $24 billion for both years) are primarily due to definitional changesmdashthe
Table 16 Revisions to Corporate Profits With Inventory Valuation and Capital Consumption Adjustments
[Billions of dollars]
1959 1997 2002 2007 2010 2011 2012
Total revision 17 ndash190 350 184 382 507 589 Definitional
Capitalization of research and 17 137 102 320 511 594 626
development Capitalization of entertainment literary
12 217 140 353 271 292 303
and artistic originals Expanded set of ownership transfer
05 150 149 179 171 176 165
costs for residential fixed assets Accrual accounting for defined benefit
00 ndash06 ndash11 ndash16 ndash11 ndash11 ndash13
pension plans 00 ndash225 ndash175 ndash196 80 137 172 Statistical
Improved distribution of regulated investment companies investment
00 ndash327 248 ndash136 ndash129 ndash87 ndash37
income 1 00 ndash254 22 ndash428 ndash249 ndash19 Other statistical Source of revision by component
00 ndash73 226 291 121 ndash68
Profits before tax (without IVA and CCAdj) 22 ndash49 236 100 185 ndash67 278 Definitional
Capitalization of research and 17 100 59 251 436 540 621
development Capitalization of entertainment literary
and artistic originals Expanded set of ownership transfer
17 325 235 447 356 403 449
costs for residential fixed assets Accrual accounting for defined benefit
00 00 00 00 00 00 00
pension plans 00 ndash225 ndash175 ndash196 80 137 172 Statistical
Improved distribution of regulated investment companies investment
05 ndash149 177 ndash151 ndash251 ndash607 ndash343
income 1 00 ndash254 22 ndash428 ndash249 ndash19 Other statistical 05 104 155 277 ndash02 ndash589
IVA 00 00 87 77 ndash23 66 09 Definitional 00 00 00 00 00 00 00 Statistical 00 00 87 77 ndash23 66 09
CCAdj ndash05 ndash142 27 06 219 510 301 Definitional
Capitalization of research and ndash05 ndash114 ndash106 ndash110 ndash97 ndash123 ndash161
development Capitalization of entertainment literary
and artistic originals Expanded set of ownership transfer
ndash05 ndash108 ndash95 ndash95 ndash86 ndash112 ndash148
costs for residential fixed assets 00 ndash06 ndash11 ndash16 ndash11 ndash11 ndash13 Statistical 00 ndash28 133 116 316 633 462
CCAdj Capital consumption adjustment IVA Inventory valuation adjustment 1 Revisions for 2012 are not shown because these data were not previously published
capitalization of RampD and of entertainment originals and the adoption of accrual-based measures for deshyfined benefit pension plans These upward revisions are partly offset by downward revisions due to statistishycal changes which are generally less than $5 billion
For 1987ndash2001 revisions are downward reaching over $38 billion for 2000 Until 1992 the primary cause of the revisions is the adoption of accrual-based measures for defined benefit pension plans these revishysions are supplemented by the smaller downward revishysions due to statistical changes and are only partly offset by the upward revisions due to the capitalization of RampD and of entertainment originals For 1992 forshyward the downward revisions are also due to the imshyproved distribution of the income of regulated investment companies
For 2002ndash2012 the upward revisions primarily reshyflect the capitalization of RampD and of entertainment originals as well as revisions due to certain statistical changes including new and revised IRS tabulations of corporate income tax returns and improved measures of misreported income based on data from the IRS These upward revisions are only partly offset by downshyward revisions that reflect the improved distribution of regulated investment company income and the someshytimes downward impacts of the accrual-based meashysures for defined benefit pension plans
Personal income and outlays (account 3) Personal income Revisions are $1 billion or larger beshyginning with 1940 and reach $10 billion by 1957 The revisions are upward for each year except 2008 which is revised down almost $30 billion The largest upward revision is for 2012 (almost $313 billion) (table 17)
Compensation of employees This component conshysists of wages and salaries and supplements to wages and salaries received by US residents including wages and salaries received from the rest of the world The sources of revision to this aggregate are the same as those already discussed in the section ldquoCompensation of employees paidrdquo but they also include the impacts of introducing accrual-based measures of wages and salaries The sources of revision to supplements are the same as those already discussed
Wages and salaries are revised by less than $1 billion in absolute value until 1992 for 1992ndash2004 revisions are of mixed sign (ranging from ndash$8 billion to about $6 billion) The revisions generally reflect offsetting efshyfects from the adoption of accrual-based measures of wages and salaries and from statistical changes For 2005ndash2009 the revisions to wages and salaries primarshyily reflect statistical revisions including the updated measures of misreporting the impacts of the adoption of accrual-based measures are of mixed sign and are
28 Improved NIPA Estimates September 2013
fairly small For 2010ndash2012 the revisions are due exshyclusively to statistical changes revisions for 2010 and 2011 are downward (reaching over $27 billion for 2010) and for 2012 the revision is upward (almost $21 billion)
Personal income receipts on assets This aggregate consists of personal interest income and personal divishydend income Personal interest income consists of monetary and imputed interest received by persons from all sources and it is calculated as net interest plus interest paid by persons and interest paid by governshyment less interest received by government
Revisions to personal interest income begin with 1929 but are less than $5 billion until 1958 Thereafter
revisions are upward and generally increase for most years The largest upward revision is $219 billion for 2012 For most years the upward revisions are largely accounted for by the adoption of accrual-based meashysures for defined benefit pension plans for 2002ndash2012 these revisions are partly offset by downward revisions resulting from the improved measures of mortgage inshyterest paid The revisions also reflect the impact of the improved measurement of financial services (beginshyning with 1985) of the improved distribution of the income of regulated investment companies (beginning with 1992) and of other statistical changes (which grow to over $10 billion by 2000 and reach about $97 billion for 2011)
Table 17 Personal Income and Its Disposition [Billions of dollars]
1959 1997 2002 2007 2010 2011 2012 1959 1997 2002 2007 2010 2011 2012
Total revision 109 743 894 834 1133 2440 3127 Less Personal current taxes 00 00 ndash01 ndash08 ndash33 60 176 Definitional 107 634 931 761 1297 1147 1260 Definitional 00 00 00 00 00 00 00
Capitalization of research and development 00 18 46 42 33 33 32 Statistical 00 00 ndash01 ndash08 ndash33 60 176 Capitalization of entertainment literary and
artistic originals Expanded set of ownership transfer costs for
residential fixed assets Accrual accounting for defined benefit
pension plans Accrual accounting for wages and salaries
Statistical Improved measurement of financial services Improved distribution of regulated investment
companies investment income Improved measures of IRS section 179
expensing Improved mortgage interest paid estimates Other statistical
Source of revision by component
00
ndash07
113 00 02 00
00
00 00 02
ndash27
ndash235
908 ndash29 109 ndash07
336
ndash117 00
ndash102
ndash22
ndash337
1244 00
ndash37 ndash148
ndash11
ndash131 00
252
ndash45
ndash738
1566 ndash63
73 ndash83
710
ndash211 00
ndash344
ndash45
ndash674
1984 00
ndash164 ndash94
532
ndash187 00
ndash414
ndash47
ndash608
1770 00
1293 12
357
ndash164 00
1087
ndash48
ndash563
1839 00
1867 05
ndash263
ndash170 00
2296
Equals Disposable personal income Definitional
Capitalization of research and development Capitalization of enter tainment literary and
artistic originals Expanded set of ownership transfer costs for
residential fixed assets Accrual accounting for defined benefit pension
plans Accrual accounting for wages and salaries
Statistical Improved measurement of financial services Improved distribution of regulated investment
companies investment income Improved measures of IRS section 179
expensing
108 107 00
00
ndash07
113 00 01 00
00
00
743 634 18
ndash27
ndash235
908 ndash29 109 ndash07
336
ndash117
895 931 46
ndash22
ndash337
1244 00
ndash36 ndash148
ndash11
ndash131
843 761 42
ndash45
ndash738
1566 ndash63
82 ndash83
710
ndash211
1166 1297
33
ndash45
ndash674
1984 00
ndash131 ndash94
532
ndash187
2381 1147
33
ndash47
ndash608
1770 00
1234 12
357
ndash164
2950 1260
32
ndash48
ndash563
1839 00
1690 05
ndash263
ndash170 Compensation of employees 53 461 311 369 ndash27 ndash167 187 Improved mortgage interest paid estimates 00 00 00 00 00 00 00
Definitional 53 391 315 488 35 ndash134 ndash234 Other statistical 01 ndash102 253 ndash335 ndash381 1028 2119 Accrual accounting for defined benefit
pension plans 53 421 315 550 35 ndash134 ndash234 Less Personal outlays ndash02 25 ndash322 157 491 592 981 Accrual accounting for wages and salaries 00 ndash29 00 ndash63 00 00 00 Definitional ndash01 ndash45 ndash57 ndash51 ndash79 ndash108 ndash110
Statistical 00 70 ndash04 ndash119 ndash62 ndash33 421 Capitalization of research and development ndash01 ndash45 ndash57 ndash51 ndash79 ndash108 ndash110
Proprietorsrsquo income with IVA and CCAdj Definitional
Capitalization of research and development
00 00 00
ndash403 ndash51 18
ndash193 ndash46
46
ndash1112 ndash105
42
ndash707 ndash87 33
ndash22 ndash88 33
226 ndash102
32
Statistical Improved measurement of financial services Other statistical
ndash01 00
ndash01
70 ndash07
78
ndash265 ndash148 ndash118
208 ndash83 291
571 ndash94 666
702 12
690
1091 05
1086
Capitalization of entertainment literary and Personal consumption expenditures ndash02 ndash99 ndash539 ndash279 ndash138 ndash172 300 artistic originals 00 ndash27 ndash22 ndash45 ndash45 ndash47 ndash48 Definitional ndash01 ndash45 ndash57 ndash51 ndash79 ndash108 ndash110
Expanded set of ownership transfer costs for Capitalization of research and development ndash01 ndash45 ndash57 ndash51 ndash79 ndash108 ndash110 residential fixed assets 00 ndash41 ndash71 ndash101 ndash75 ndash74 ndash86 Statistical ndash01 ndash54 ndash482 ndash228 ndash59 ndash64 410
Statistical 00 ndash352 ndash147 ndash1007 ndash620 66 329 Improved measurement of financial services 00 ndash73 ndash193 ndash157 ndash364 ndash300 ndash295 Improved measures of IRS section 179 Other statistical ndash01 19 ndash289 ndash71 305 236 705
expensing 00 ndash117 ndash131 ndash211 ndash187 ndash164 ndash170 Personal interest payments 00 124 217 450 670 800 757 Other statistical 00 ndash235 ndash16 ndash797 ndash432 230 499 Definitional 00 00 00 00 00 00 00
Rental income of persons with CCAdj ndash04 ndash245 ndash14 457 536 747 786 Statistical 00 124 217 450 670 800 757 Definitional ndash06 ndash194 ndash266 ndash637 ndash599 ndash534 ndash477 Improved measurement of financial services 00 66 45 74 269 312 299
Expanded set of ownership transfer costs for Other statistical 00 58 172 376 401 488 458 residential fixed assets
Statistical Improved mortgage interest paid estimates Other statistical
ndash06 02 00 02
ndash194 ndash51 ndash53
03
ndash266 252 134 118
ndash637 1094 966 128
ndash599 1135 920 216
ndash534 1281 954 328
ndash477 1263 833 430
Personal current transfer payments Definitional Statistical
00 00 00
00 00 00
00 00 00
ndash14 00
ndash14
ndash40 00
ndash40
ndash34 00
ndash34
ndash76 00
ndash76
Personal income receipts on assets Definitional
Accrual accounting for defined benefit pension plans
Statistical Improved measurement of financial services Improved distribution of regulated investment
companies investment income Improved mortgage interest paid estimates Other statistical
Personal current transfer receipts Definitional Statistical
60 60
60 00 00
00 00 00 00 00 00
930 487
487 443 ndash07
336 53 60 00 00 00
808 928
928 ndash120 ndash148
ndash11 ndash134
172 ndash18
00 ndash18
1096 1015
1015 81
ndash83
710 ndash966
419 43 00 43
1413 1948
1948 ndash535 ndash94
532 ndash920
ndash53 ndash74 00
ndash74
1995 1904
1904 91 12
357 ndash954
675 ndash123
00 ndash123
2088 2073
2073 15 05
ndash263 ndash833 1106 ndash168
00 ndash168
Equals Personal saving Definitional
Capitalization of research and development Capitalization of enter tainment literary and
artistic originals Expanded set of ownership transfer costs for
residential fixed assets Accrual accounting for defined benefit pension
plans Accrual accounting for wages and salaries
Statistical Improved measurement of financial services Improved distribution of regulated investment
companies investment income
110 108 01
00
ndash07
113 00 02 00
00
718 679 64
ndash27
ndash235
908 ndash29
39 00
336
1217 988 103
ndash22
ndash337
1244 00
229 00
ndash11
685 812 93
ndash45
ndash738
1566 ndash63
ndash127 00
710
675 1377 112
ndash45
ndash674
1984 00
ndash702 00
532
1788 1256 141
ndash47
ndash608
1770 00
532 00
357
1969 1370 142
ndash48
ndash563
1839 00
599 00
ndash263 Less Contributions for government social Improved measures of IRS section 179
insurance domestic 00 00 00 19 08 ndash11 ndash08 expensing 00 ndash117 ndash131 ndash211 ndash187 ndash164 ndash170 Definitional 00 00 00 00 00 00 00 Improved mortgage interest paid estimates 00 00 00 00 00 00 00 Statistical 00 00 00 19 08 ndash11 ndash08 Other statistical 02 ndash180 370 ndash627 ndash1046 339 1032
CCAdj Capital consumption adjustment IVA Inventory valuation adjustment
29 September 2013 SURVEY OF CURRENT BUSINESS
The revisions to personal dividend income begin with 1991 and are upward for most years except for notable downward revisions for 2010 and 2012 The largest upward revision is for 2007 (over $24 billion) The upward revisions primarily reflect the impact of the improved distribution of the income of regulated investment companies For 2010 personal dividend income is revised down by about $37 billion the downward impacts of other statistical changes more than offset the upward revision from the improved disshytribution of the income of regulated investment comshypanies For 2012 personal dividend income is revised down by about $10 billion reflecting the impact of stashytistical changes
Personal current transfer receipts This aggregate consists of government social benefits to persons and business current transfer payments to persons (net) The revisions begin with a small downward revision for 2002 revisions are upward and less than $5 billion for 2003ndash2009 For 2010ndash2012 revisions are downshyward and larger (almost $17 billion for 2012) The reshyvisions reflect the incorporation of new and revised source data for government social benefits and for business current transfer payments to persons
Contributions for government social insurance domestic This component is deducted in the calculashytion of personal income and consists of both personal and employer contributions The revisions begin with 2003 are of mixed sign are less than $2 billion in absoshylute value throughout the period and reflect new and revised source data
Personal current taxes The revisions to personal current taxes begin with 2002 are of mixed sign and are less than $5 billion except for 2011 and 2012 ($6 billion and over $17 billion respectively) The revishysions reflect new and revised source data particularly new and revised Census Bureau government finances data
Disposable personal income (DPI) The pattern of revisions to DPI (which is equal to personal income less personal current taxes) primarily reflects the revishysions to personal income Through 1949 the revisions do not exceed $5 billion thereafter the revisions are generally increasing with only one downward revision for 2008 (about $29 billion) The largest upward revishysion is for 2012 ($295 billion)
Personal outlays This component consists of PCE personal interest payments and personal current transfer payments The revisions to personal outlays are generally downward and are less than $5 billion through 1984 thereafter the revisions are of mixed sign range from about ndash$32 billion for 2002 to about $98 billion for 2012 and primarily reflect revisions to
PCE and to personal interest payments PCE is revised down for most years but a notable exception is an upshyward revision for 2012 of $30 billion
For 1985ndash2012 personal interest payments are reshyvised up by steadily increasing amounts primarily reshyflecting the improved measurement of financial services and improved measures of interest payments on consumer loans based on data on interest rates and consumer credit outstanding from the Federal Reserve Board
Personal sav ing This component is the difference between DPI and personal outlays The revisions do not exceed $5 billion until 1950 thereafter personal saving is revised up for all years by generally increasing amounts except for 2008 which is revised down $41 billion the largest upward revision is for 2012 (about $197 billion)
The revisions to personal saving result in correshysponding revisions to the personal saving ratemdashpershysonal saving as a percentage of DPI The revisions to the saving rate reach 10 percentage point by 1938 and peak at 33 percentage points for 1971
Government current receipts and expenditures (account 4) Government current receipts is the sum of current tax receipts contributions for government social insurshyance income receipts on assets current transfer reshyceipts and current surplus of government enterprises Current expenditures is the sum of consumption exshypenditures current transfer payments interest payshyments and subsidies Net government saving is the difference between current receipts and current expenshyditures
Federal government Revisions to current receipts begin with 1959 are downward and are less than $2 billion through 1979 For 1980ndash2009 the revisions are upward and range from less than $10 billion to about $8 billion For 2010ndash2012 the revisions are downward and range from about $3 billion to about $20 billion (table 18) The upward revisions through 2009 mostly reflect the impact on the current surplus of government enterprises of incorporating accrual-based measures for defined benefit pension plans For 2010ndash2012 downward revisions to taxes on corporate income reflect new and revised IRS data as well as new federal tax collections data and the downward revishysions to current transfer receipts reflect in part the reshyclassification of cross-border fines and penalties as negative current transfer payments to the rest of the world (net) these downward revisions are partly offset by upward revisions to the current surplus of governshyment enterprises that primarily reflect the impact of
30 Improved NIPA Estimates September 2013
Table 18 Revisions to Government Current Receipts and Expenditures ward revisions are offset to varying degrees over time [Billions of dollars] by downward revisions to federal consumption expenshy
1959 1997 2002 2007 2010 2011 2012
Federal Current receipts ndash04 54 65 61 ndash37 ndash29 ndash204
Definitional Accrual accounting for defined benefit
ndash04 62 62 45 38 31 35
pension plans ndash04 62 62 45 38 31 35 Statistical
Improved measurement of financial 00 ndash08 03 16 ndash75 ndash60 ndash239
services 00 00 ndash01 00 00 00 00 Other statistical 00 ndash08 04 16 ndash74 ndash60 ndash238
Current expenditures 68 365 246 275 179 79 150 Definitional
Capitalization of research and 66 376 280 214 218 214 284
development Accrual accounting for defined benefit
ndash25 09 ndash132 ndash204 ndash150 ndash113 ndash51
pension plans 91 367 411 418 368 327 335 Accrual accounting for wages and salaries 00 00 00 00 00 00 00
Statistical Improved measurement of financial
02 ndash11 ndash34 61 ndash39 ndash135 ndash134
services 00 00 ndash01 00 00 00 00 Other statistical 02 ndash11 ndash33 61 ndash39 ndash135 ndash134
Net federal government saving ndash72 ndash311 ndash181 ndash215 ndash215 ndash109 ndash354 Definitional
Capitalization of research and ndash70 ndash314 ndash218 ndash168 ndash181 ndash183 ndash250
development Accrual accounting for defined benefit
25 ndash09 132 204 150 113 51
pension plans ndash95 ndash305 ndash349 ndash372 ndash331 ndash296 ndash300 Accrual accounting for wages and salaries 00 00 00 00 00 00 00
Statistical Improved measurement of financial
ndash02 03 37 ndash47 ndash34 74 ndash104
services 00 00 00 00 00 00 00 Other statistical
State and local
ndash02 03 37 ndash47 ndash34 74 ndash104
Current receipts ndash02 ndash137 ndash243 ndash225 ndash439 ndash345 ndash301 Definitional
Accrual accounting for defined benefit ndash01 ndash28 ndash55 ndash66 ndash76 ndash70 ndash67
pension plans ndash01 ndash28 ndash55 ndash66 ndash76 ndash70 ndash67 Statistical
Improved measurement of financial ndash01 ndash109 ndash188 ndash159 ndash363 ndash275 ndash234
services 00 ndash01 ndash10 ndash06 ndash28 ndash28 ndash27 Other statistical ndash01 ndash108 ndash178 ndash153 ndash335 ndash248 ndash207
Current expenditures 13 209 426 625 1037 767 936 Definitional
Capitalization of research and 17 337 640 896 1616 1505 1615
development Accrual accounting for defined benefit
00 ndash13 ndash24 ndash35 ndash41 ndash36 ndash27
pension plans 17 350 664 931 1657 1541 1643 Accrual accounting for wages and salaries 00 00 00 00 00 00 00
Statistical Improved measurement of financial
ndash04 ndash128 ndash214 ndash271 ndash579 ndash738 ndash679
services 00 ndash01 ndash10 ndash06 ndash28 ndash28 ndash27 Other statistical ndash04 ndash127 ndash204 ndash265 ndash551 ndash710 ndash653
Net state and local government saving ndash16 ndash346 ndash668 ndash849 ndash1476 ndash1111 ndash1237 Definitional
Capitalization of research and ndash18 ndash365 ndash695 ndash961 ndash1692 ndash1574 ndash1683
development Accrual accounting for defined benefit
00 13 24 35 41 36 27
pension plans ndash18 ndash378 ndash719 ndash997 ndash1733 ndash1611 ndash1710 Accrual accounting for wages and salaries 00 00 00 00 00 00 00
Statistical Improved measurement of financial
02 19 27 112 216 463 446
services 00 00 00 00 00 00 00 Other statistical 02 19 27 112 216 463 446
the adoption of accrual-based measures for defined benefit pension plans13
Federal government current expenditures is revised up for all years and the revisions generally increase until 1996 when they begin to increase more slowly revisions range from less than $1 billion before 1941 to almost $40 billion for 1995 The upward revisions genshyerally result from the impact of the adoption of acshycrual-based measures for defined benefit pension plans on interest paid by the federal government these upshy
13 As part of the efforts to modernize the ITAs BEA is now using data for specific fines to identify those that are paid by foreign companies and classishyfying them as part of transfer payments to the rest of the world (net) Previshyously these fines and penalties were not captured in the ITAs The source data underlying the previous NIPA estimates of fines received by the federal government included these data but they were not distinguished from fines paid by domestic businesses
ditures that reflect the impact of reclassifying RampD expenditures from consumption to investment (particshyularly in the mid-1980s and the first half of the 2000s)
Federal government net saving is revised down for all years as the upward revisions to current expendishytures either outweigh upward revisions to or suppleshyment downward revisions to current receipts The downward revisions to federal government saving range from less than $1 billion for 1929 to over $35 bilshylion for 2012
State and local government State and local current receipts is revised down for all years by generally inshycreasing amounts ranging from less than $1 billion for 1929 to nearly $44 billion for 2010 Prior to 2002 the downward revisions primarily reflect the incorporashytion of accrual-based measures for defined benefit pension plans (which generally increases compensashytion costs for government enterprises and lowers their surplus) and the recognition of RampD as investment (which reduces grants-in-aid from the federal governshyment (see the box ldquoGovernment Research and Develshyopmentrdquo)) For 2002ndash2012 the revisions also reflect the incorporation of new and revised data from the Census Bureau
State and local government current expenditures is revised up for 1929ndash1981 down for 1982ndash1988 and up for 1989ndash2012 For 1929ndash1981 and 1989ndash2012 the upward revisions reflect the impact on compensation and on interest payments of incorporating accrual-based measures for defined benefit pension plans these revisions are partly offset by downward revisions from other sources including large downward revishysions for 2010ndash2012 that result from the incorporation of new and revised data from the Census Bureau (table 18) For 1982ndash1988 the downward revisions reflect the impact on compensation of incorporating accrual-based measures for defined benefit pension plans14
State and local government net saving is revised down for all years except for 1987 when the revision is slightly upward (less than $1 billion) The largest downward revision is about $159 billion for 2009
Foreign transactions (accounts 5 and 7) Current receipts from the rest of the world This agshygregate consists of exports of goods and services and income receipts from the rest of the world (The revishysions to exports of goods and services were discussed previously) The revisions to income receipts begin
14 The pattern of revisions to state and local compensation is driven prishymarily by the funding status of state and local pension plans See ldquoPreview Changes in Definitions and Presentationsrdquo
31 September 2013 SURVEY OF CURRENT BUSINESS
with 1985 and are upward and less than $5 billion through 2010 The largest revisions are about $19 bilshylion for 2011 and about $36 billion for 2012 (table 19) For 1985ndash1998 the revisions are due solely to the improved measurement of financial services For 1999ndash2010 the revisions are primarily caused by the incorporation of revised estimates from the ITAs and the improved measurement of financial services in fairly similar magnitudes the larger revisions for 2011 and 2012 are due primarily to the incorporation of the revised ITA data (See the box ldquoDiscontinuities in the Estimates of Foreign Transactions in the National Inshycome and Product Accountsrdquo)
Current payments to the rest of the world (net) This aggregate consists of imports of goods and sershyvices income payments to the rest of the world and current taxes and transfer payments to the rest of the world (net) (The revisions to imports of goods and services were discussed previously) The revisions to income payments begin with 1985 they are of mixed
sign and are less than $2 billion in absolute value until 1999 For 1999ndash2007 the revisions are upward and range from about $1 billion to about $7 billion For 2008 and 2009 the revisions are downward and are less than $4 billion For 2010ndash2012 revisions are upward and larger the largest revision is about $26 billion for 2012 (table 19)
For 1985ndash1998 the revisions are due solely to the improved measurement of financial services For 1999ndash2010 the revisions are caused primarily by the incorporation of revised estimates from the ITAs and by the improved measurement of financial services the larger revisions for 2011 and 2012 are due primarily to the incorporation of revised ITA data
The revisions to current taxes and transfer payshyments to the rest of the world (net) begin with 2004 They are generally downward and exceed $1 billion in absolute value for only 2 yearsmdash2010 (over $4 billion) and 2012 (over $12 billion) These revisions are due to the incorporation of revised estimates from the ITAs
Discontinuities in the Estimates of Foreign Transactions in the National Income and Product AccountsThe revision schedule and release for successive vintages exports of goods and services (and for current-dollar of gross domestic product (GDP) and related estimates is GDP) the decline from 2009 to 2010 is overstated by $45 primarily determined by the availability of revised or billion The revisions to the ITAs for years prior to 2010 newly available source data This is also true for the other will be incorporated in a future update to the NIPAs accounts prepared by the Bureau of Economic Analysis including the international transactions accounts (ITAs)
Discontinuities in NIPA Foreign Transactions 2009ndash2010 which are the major source data underlying the NIPA [Billions of dollars] estimates of foreign transactions
Like the NIPAs the ITAs are revised annually the revishysions are typically released in June Annual updates to the NIPAs are typically released in July resulting in producshytion constraints that sometimes prevent incorporating the entire period of ITA revisions As a result a discontishynuity in the NIPA estimates exists between the years for which the revised ITA estimates have been incorporated and the years for which they have not been incorporated1
This yearrsquos comprehensive revision of the NIPAs released on July 31 2013 incorporated revised estimates of foreign transactions for 2010ndash2012 from the annual revision of the ITAs released in June2 However revisions to the data from the ITAs for the years prior to 2010 were not incorporated For most components of foreign transshyactions the revisions to the ITAs for 2010ndash2012 were incorporated at their ldquobest levelrdquo As a result there are discontinuities between the NIPA estimates for 2009 and those for 2010 (see the table) For current-dollar net
1 The differences between the ITAs and the NIPAs are shown in the lines for ldquostatistical differencesrdquo in NIPA table 43B ldquoRelation of Foreign Transactions in the NIPAs to the Corresponding Items in the ITAsrdquo
2 See Barbara H Berman and Jeffrey R Bogen ldquoAnnual Revision of the US International Transaction Accountsrdquo SURVEY OF CURRENT BUSIshyNESS 93 (July 2013) 43ndash54
2009 2010 Change from 2009 to 2010
Published Discontishynuity 1 Adjusted Published Adjusted
Net exports of goods and services ndash3922 ndash45 ndash3967 ndash5185 ndash1263 ndash1218 Exports 15838 ndash08 15830 18435 2597 2605
Goods 10647 ndash03 10644 12784 2137 2140 Services 5191 ndash05 5186 5651 460 465
Imports 19760 37 19797 23620 3860 3823 Goods 15873 45 15918 19512 3639 3594 Services 3887 ndash08 3879 4108 221 229
Net receipts of income 1472 39 1511 2060 588 549 Income receipts 6437 52 6489 7200 763 711
Wage and salary receipts 55 03 58 59 04 01 Income receipts on assets 6382 49 6431 7141 759 710
Interest 1445 06 1451 1295 ndash150 ndash156 Dividends Reinvested earnings of
US direct investment
2309 ndash63 2246 2480 171 234
abroad 2628 107 2735 3366 738 632 Income payments 4965 13 4978 5141 176 163
Wage and salary payments 133 11 144 140 07 ndash04 Income payments on assets 4832 02 4834 5001 169 167
Interest 3423 02 3425 3107 ndash316 ndash318 Dividends Reinvested earnings of
foreign direct investment in the United
1190 00 1190 1266 76 76
States Current taxes and transfer
payments to the rest of the
219 00 219 628 409 409
world (net) Addenda
1361 ndash09 1352 1420 59 68
Gross domestic product 144179 ndash45 144134 149583 5404 5449 Gross national product 145651 ndash06 145645 151642 5991 5997
NIPAs National income and product accounts 1 Equals revisions to the US international transactions accounts that have not been carried back in
the NIPAs at this time
32 Improved NIPA Estimates September 2013
Table 19 Revisions to Foreign Transactions [Billions of dollars]
1959 1997 2002 2007 2010 2011 2012
Current receipts from the rest of the world 00 ndash01 40 86 26 261 482 Definitional 00 00 00 00 00 00 00 Statistical 00 ndash01 40 86 26 261 482
Improved measurement of financial services 00 ndash01 ndash12 ndash07 ndash09 ndash04 ndash10 Other statistical 00 00 52 93 35 265 492
Source of revision by component Exports of goods and services 00 ndash06 17 40 ndash09 70 119
Definitional 00 00 00 00 00 00 00 Statistical 00 ndash06 17 40 ndash09 70 119
Improved measurement of financial services 00 ndash07 ndash17 ndash15 ndash29 ndash32 ndash36 Other statistical 00 01 34 55 20 102 155
Income receipts 00 06 23 45 35 191 363 Definitional 00 00 00 00 00 00 00 Statistical 00 06 23 45 35 191 363
Improved measurement of financial services 00 06 06 08 20 28 25 Other statistical 00 00 17 37 15 163 338
Current payments to the rest of the world 00 ndash01 23 16 83 172 131 Definitional 00 00 00 00 00 00 00 Statistical 00 ndash01 23 16 83 172 131
Improved measurement of financial services 00 ndash01 ndash12 ndash07 ndash09 ndash04 ndash10 Other statistical 00 00 35 23 92 176 141
Source of revision by component Imports of goods and services 00 00 ndash05 07 59 76 ndash09
Definitional 00 00 00 00 00 00 00 Statistical 00 00 ndash05 07 59 76 ndash09
Income payments 00 ndash01 28 14 69 103 264 Definitional 00 00 00 00 00 00 00 Statistical 00 ndash01 28 14 69 103 264
Improved measurement of financial services 00 ndash01 ndash12 ndash07 ndash09 ndash04 ndash10 Other statistical 00 00 40 21 78 107 274
Current taxes and transfer payments (net) 00 00 00 ndash05 ndash45 ndash06 ndash125 Definitional 00 00 00 00 00 00 00 Statistical 00 00 00 ndash05 ndash45 ndash06 ndash125
Balance on current account NIPAs 00 00 17 69 ndash57 88 351 Definitional 00 00 00 00 00 00 00 Statistical 00 00 17 70 ndash57 89 351
Improved measurement of financial services 00 00 00 00 00 00 00 Other statistical 00 00 17 70 ndash57 89 351
Addenda Net lending or net borrowing (ndash) NIPAs 00 00 17 69 ndash57 88 349
Definitional 00 00 00 00 00 00 00 Statistical 00 00 17 69 ndash57 88 349 Balance on current account NIPAs 00 00 17 69 ndash57 88 351
Definitional 00 00 00 00 00 00 00 Statistical 00 00 17 70 ndash57 89 351
Less Capital account transactions (net) 00 00 00 00 00 00 01 Definitional 00 00 00 00 00 00 00 Statistical 00 00 00 00 00 00 01
NIPAs National income and product accounts
Domestic capital (account 6) Gross saving consists of net saving and CFC Net savshying consists of net private saving and net government saving The revisions to gross saving are upward and generally grow larger throughout the period of revishysion they exceed $15 billion by 1960 and peak at over $650 billion for 2012 (table 20) For the entire period upward revisions to CFC (about $531 billion for 2012) dominate the revisions to gross saving Revisions to net saving are of mixed sign the largest downward revision is about $136 billion for 2008 and the largest upward revision is about $121 billion for 2012
Within net saving upward revisions to net private saving partly offset downward revisions to net governshyment saving for most years and primarily reflect the adoption of accrual accounting for defined benefit pension plans
The upward revisions to CFC for the entire period primarily reflect the capitalization of RampD and of enshytertainment originals and the expanded set of ownershy
ship transfer costs of these RampD has the largest effect ldquoNet lending or net borrowing NIPAsrdquo (or ldquonet
lendingrdquo) is the difference between the sum of gross saving and the statistical discrepancy and the sum of gross domestic investment and capital account transshyactions (net)
The revisions to net lending begin with 2000 and are upward for all years except for 2010 The revisions are less than $10 billion in absolute value except for 2012 which is revised up by about $35 billion
Annual Estimates of Real GDP and Real DPI
Real GDP Revisions to the year-to-year growth rates of real GDP are generally small for 59 of the 83 years since 1929 the revisions range from ndash01 percentage point to 01 percentage point and for only 6 years the revisions are greater than 03 percentage point in absolute value (tashyble 21)
The revisions to real GDP result from the following Revisions to the current-dollar components of GDP
such as those discussed above for which chained-dollar estimates are prepared by deflation
Revisions to the prices used to estimate components of real GDP by deflation
Revisions to the quantities used to estimate the components of real GDP by extrapolation or direct valuation In contrast changing the reference year (to 2009
from 2005) does not affect the percent changes in real GDP (It also does not affect the percent changes in the price indexes)
For 40 years the rates of growth of real GDP are reshyvised up (table 22) For 17 of these years the revisions are greater than 01 percentage point upward revisions to the percent change in current-dollar GDP play a role in 14 of these revisions downward revisions to the percent change in prices play a role in 10 of these revishysions The largest upward revision 06 percentage point occurs for 3 years 1941 1943 and 2012
For 16 years the rates of growth of real GDP are reshyvised down Seven of the revisions are larger than 01 percentage point downward revisions to the percent change in current-dollar GDP play a role in three of these revisions and upward revisions to prices play a role in five of these revisions Only one of the revisions is larger than 03 percentage point the growth rate for 1946 is revised down 07 percentage point primarily because of a relatively large upward revision to prices (11 percentage points) that is partly offset by a smaller upward revision to the rate of growth of current-dollar GDP
33 September 2013 SURVEY OF CURRENT BUSINESS
For 27 years the rates of growth of real GDP are un- For 1929ndash2012 the average annual growth rate of revised real GDP is revised up 01 percentage point (from
Table 20 Revisions to Saving and Investment [Billions of dollars]
1959 1997 2002 2007 2010 2011 2012 1959 1997 2002 2007 2010 2011 2012
Gross saving 140 2579 4278 4590 4843 6239 6518 Improved distribution of Definitional 141 2845 3693 4873 4986 5169 5322 regulated investment
Capitalization of research and companies investment development 114 2121 2657 3599 3895 4063 4155 income 00 336 ndash11 710 532 357 ndash263
Capitalization of enter tainment literary Improved measures of IRS and artistic originals 22 461 576 704 722 738 743 section 179 expensing 00 ndash117 ndash131 ndash211 ndash187 ndash164 ndash170
Expanded set of ownership transfer Improved mortgage interest costs for residential fixed assets 05 264 461 570 368 369 423 paid estimates 00 00 00 00 00 00 00
Accrual accounting for defined benefit Other statistical 02 ndash180 370 ndash627 ndash1046 339 1032 pension plans
Accrual accounting for wages and salaries
Statistical Improved measurement of financial
services Improved distribution of regulated
investment companies investment income
Improved measures of IRS section 179 expensing
Improved mor tgage interest paid estimates
00
00 ndash01
00
00
00
00
00
00 ndash266
00
00
ndash117
00
00
00 585
00
00
ndash131
00
00
00 ndash283
00
00
ndash211
00
00
00 ndash143
00
00
ndash187
00
00
00 1070
00
00
ndash164
00
00
00 1196
00
00
ndash170
00
Net government saving Definitional
Capitalization of research and development
Accrual accounting for defined benefit pension plans
Accrual accounting for wages and salaries
Statistical Improved measurement of
financial services Other statistical
ndash87 ndash87
26
ndash113
00 00
00 00
ndash657 ndash679
04
ndash683
00 22
00 22
ndash850 ndash913
156
ndash1068
00 63
00 63
ndash1064 ndash1130
239
ndash1369
00 66
00 66
ndash1691 ndash1873
191
ndash2064
00 182
00 182
ndash1219 ndash1758
149
ndash1907
00 539
00 539
ndash1591 ndash1932
78
ndash2010
00 341
00 341
Other statistical ndash01 ndash149 715 ndash73 45 1233 1366 Consumption of fixed capital 100 2762 3571 4969 5082 5158 5312 Source of revision by component Definitional 104 2679 3516 4808 4971 5077 5257
Net saving Net private saving
40 128
ndash183 474
708 1557
ndash378 686
ndash238 1454
1081 2301
1207 2798
Capitalization of research and development
Capitalization of entertainment 75 1836 2258 2914 3322 3481 3632
Elimination of the adjustment literary and ar tistic originals 17 338 449 570 596 608 626 converting wages to an accrual Expanded set of ownership transfer basis 00 29 00 63 00 00 00 costs for residential fixed assets 12 505 809 1324 1053 988 999
Undistributed corporate profits Statistical ndash04 83 55 161 111 81 55 with IVA and CCAdj Definitional
Capitalization of research and development
17 17
12
ndash273 137
217
341 102
140
ndash61 320
353
778 512
271
512 595
292
829 627
303
Gross domestic investment capital account transactions and net lending NIPAs 136 2841 3797 4912 5041 5383 5947
Capitalization of enter tainment Gross domestic investment 137 2841 3782 4843 5097 5296 5596 literary and artistic originals 05 150 149 179 171 176 165 Private 72 2069 2780 3485 3635 3772 4129
Expanded set of ownership Definitional 71 2069 2694 3508 3492 3659 3857 transfer costs for residential Capitalization of research and fixed assets 00 ndash06 ndash11 ndash16 ndash11 ndash11 ndash13 development 44 1344 1657 2233 2402 2552 2691
Accrual accounting for defined Capitalization of enter tainment benefit pension plans 00 ndash225 ndash175 ndash196 80 137 172 literary and ar tistic originals 22 461 576 704 722 738 743
Statistical 00 ndash410 239 ndash381 266 ndash83 202 Expanded set of ownership Improved distribution of transfer costs for residential
regulated investment fixed assets 05 264 461 570 368 369 423 companies investment Statistical 01 00 86 ndash23 143 113 272 income 00 ndash336 11 ndash710 ndash532 ndash357 263 Government 66 771 1001 1357 1463 1524 1467
Other statistical 00 ndash73 228 329 798 275 ndash61 Definitional 70 777 1000 1366 1493 1510 1465 Personal saving 110 718 1217 685 675 1788 1969 Capitalization of research and
Definitional 108 679 988 812 1377 1256 1370 development 70 777 1000 1366 1493 1510 1465 Capitalization of research and Statistical ndash04 ndash06 01 ndash09 ndash30 14 02
development Capitalization of enter tainment
literary and artistic originals Expanded set of ownership
01
00
64
ndash27
103
ndash22
93
ndash45
112
ndash45
141
ndash47
142
ndash48
Capital account transactions net Definitional Statistical
00 00 00
00 00 00
00 00 00
00 00 00
00 00 00
00 00 00
01 00 01
transfer costs for residential Net lending or net borrowing (ndash) NIPAs 00 00 17 69 ndash57 88 349 fixed assets ndash07 ndash235 ndash337 ndash738 ndash674 ndash608 ndash563 Definitional 00 00 00 00 00 00 00
Accrual accounting for defined Statistical 00 00 17 69 ndash57 88 349 benefit pension plans 113 908 1244 1566 1984 1770 1839 Improved measurement of financial
Accrual accounting for wages services 00 00 00 00 00 00 00 and salaries 00 ndash29 00 ndash63 00 00 00 Other statistical 00 00 17 69 ndash57 88 349
Statistical 02 39 229 ndash127 ndash702 532 599 Improved measurement of Statistical discrepancy ndash04 263 ndash480 322 198 ndash856 ndash572
financial services 00 00 00 00 00 00 00
CCAdj Capital consumption adjustment IVA Inventory valuation adjustment NIPAs National income and product accounts
Table 21 Distribution of Revisions to Percent Change in Real Gross Domestic Product Table 22 Summary of Revisions to Year-to-Year Growth Rates
Size of revision (percentage point)
ndash07 ndash03 ndash02 ndash01 00 01 02 03 04 06
Number of Real Gross Domestic Product for Selected Periods of revisions
1 2 4 9
27 23 5 7 2 3
1929ndash2012 1929ndash1959 1959ndash2002 2002ndash2012
In percentage points Average revision Average absolute revision Largest negative revision Largest positive revision
Number of Upward revisions Downward revisions Zero revisions
01 01
ndash07 06
40 16 27
00 02
ndash07 06
14 9 7
00 01
ndash02 03
20 6
17
02 02
ndash01 06
6 1 3
34 Improved NIPA Estimates September 2013
32 percent to 33 percent) (table 23) The period 1929ndash2012 can be usefully divided into three subpeshyriods 1929ndash1959 1959ndash2002 and 2002ndash2012 For 1929ndash1959 the average growth rate of real GDP is reshyvised up 01 percentage point (from 35 percent to 36 percent) for 1959ndash2002 the average growth rate in the revised estimates is the same as in the previously pubshylished estimates For 2002ndash2012 the average rate of
growth of real GDP is revised up 02 percentage point (from 16 percent to 18 percent)
For all three subperiods the contributions of gross private domestic investment and of government conshysumption expenditures and gross investment are reshyvised up (table 24) Additionally the contribution of net exports is unrevised or revised up very slightly (for 1929ndash1959 both exports and imports are unrevised
Table 23 Gross Domestic Product and Its Major Components Revisions to Average Annual Rates of Change Over Selected Periods
Current dollars Chained dollars Current dollars Chained dollars
Revised Previously published Revision Revised Previously
published Revision Revised Previously published Revision Revised Previously
published Revision
1929ndash2012 1929ndash1959
Gross domestic product Personal consumption expenditures
Goods Durable goods Nondurable goods
Services Gross private domestic investment
Fixed investment Nonresidential
Structures Equipment Intellectual proper ty products
Residential Change in private inventories
Net exports of goods and services Exports
Goods Services
Imports Goods Services
Government consumption expenditures and gross investment Federal
National defense Nondefense
State and local Addenda Gross domestic income Disposable personal income
63 62 55 60 54 67 62 63 64 54 63 87 58
74 71 88 77 78 75
72 82 84 80 68
63 62
62 62 55 60 54 67 60 61 62 55
56
74 71 88 77 78 75
72 82 85 78 68
62 62
01 00 00 00 00 00 02 02 02
ndash01
02
00 00 00 00 00 00
00 00
ndash01 02 00
00 00
33 32 31 45 25 33 37 33 38 13 45 63 21
48 47 53 47 48 44
35 48 49 45 27
33 32
32 31 31 45 25 33 36 32 37 13
19
48 47 53 47 48 44
35 46 49 42 27
32 31
01 01 00 00 00 00 01 01 01 00
02
00 00 00 00 00 00
00 02 00 03 00
01 01
55 48 47 52 45 50 55 57 52 41 56 83 67
46 39 82 47 42 64
88 130 147 96 61
55 50
54 48 47 52 45 50 53 55 49 41
67
46 39 82 47 42 64
85 129 146 93 61
55 49
01 00 00 00 00 00 02 02 03 00
00
00 00 00 00 00 00
03 01 01 03 00
00 01
36 29 27 32 25 32 36 28 24 10 29 59 36
27 21 51 28 22 46
62 104 119 66 29
36 31
35 29 27 32 25 32 36 27 21 10
36
27 21 51 28 22 46
61 104 121 68 29
35 30
01 00 00 00 00 00 00 01 03 00
00
00 00 00 00 00 00
01 00
ndash02 ndash02 00
01 01
Current dollars Chained dollars Current dollars Chained dollars
Revised Previously published Revision Revised Previously
published Revision Revised Previously published Revision Revised Previously
published Revision
1959ndash2002 2002ndash2012
Gross domestic product Personal consumption expenditures
Goods Durable goods Nondurable goods
Services Gross private domestic investment
Fixed investment Nonresidential
Structures Equipment Intellectual proper ty products
Residential Change in private inventories
Net exports of goods and services Exports
Goods Services
Imports Goods Services
Government consumption expenditures and gross investment Federal
National defense Nondefense
State and local Addenda Gross domestic income Disposable personal income
73 76 65 74 61 85 75 76 78 66 76
101 72
92 92 93
102 107 85
69 55 48 75 82
74 75
73 76 65 75 61 85 73 74 77 66
70
92 91 94
102 107 85
70 56 50 74 82
73 76
00 00 00
ndash01 00 00 02 02 01 00
02
00 01
ndash01 00 00 00
ndash01 ndash01 ndash02 01 00
01 ndash01
34 37 36 56 26 38 43 43 50 19 59 72 26
62 65 55 64 70 43
23 14 07 34 32
34 36
34 36 36 56 26 37 43 43 51 19
24
62 64 55 64 71 44
23 11 05 28 33
34 36
00 01 00 00 00 01 00 00
ndash01 00
02
00 01 00 00
ndash01 ndash01
00 03 02 06
ndash01
00 00
40 42 38 20 48 44 25 24 39 45 32 44
ndash24
81 80 85 67 67 68
42 58 60 54 33
39 42
40 41 38 21 47 43 23 21 37 51
ndash28
81 82 78 67 67 67
44 60 63 52 36
39 41
00 01 00
ndash01 01 01 02 03 02
ndash06
04
00 ndash02
07 00 00 01
ndash02 ndash02 ndash03
02 ndash03
00 01
18 20 25 38 17 18 09 07 26
ndash03 32 36
ndash44
52 52 53 31 30 35
09 30 31 28
ndash03
18 20
16 18 24 39 16 15 06 03 24
ndash01
ndash50
53 55 48 31 31 34
09 28 30 24
ndash03
16 18
02 02 01
ndash01 01 03 03 04 02
ndash02
06
ndash01 ndash03 05 00
ndash01 01
00 02 01 04 00
02 02
35 September 2013 SURVEY OF CURRENT BUSINESS
Table 24 Contributions to Percent Change in Real Gross Domestic Product Averages for Selected Periods
1929ndash2012 1929ndash1959 1959ndash2002 2002ndash2012
Revised Previously published Revision Revised Previously
published Revision Revised Previously published Revision Revised Previously
published Revision
Percent change at annual rate Gross domestic product 33 32 01 36 35 01 34 34 00 18 16 02
Percentage points at annual rates Personal consumption expenditures 201 204 ndash003 185 189 ndash004 227 233 ndash006 138 128 010
Goods 095 098 ndash003 103 105 ndash002 098 101 ndash003 058 059 ndash001 Durable goods 038 040 ndash002 027 027 000 048 050 ndash002 032 033 ndash001 Nondurable goods 056 058 ndash002 077 078 ndash001 049 051 ndash002 027 026 001
Services 106 107 ndash001 082 084 ndash002 130 132 ndash002 080 070 010 Gross private domestic investment 057 051 006 042 038 004 077 070 007 018 011 007
Fixed investment 051 046 005 032 028 004 074 067 007 014 006 008 Nonresidential 042 036 006 017 012 005 062 056 006 032 025 007
Structures 003 003 000 ndash002 ndash001 ndash001 007 008 ndash001 ndash001 000 ndash001 Equipment 027 013 038 019 Intellectual proper ty products 012 005 016 013
Residential 010 009 001 015 016 ndash001 012 011 001 ndash018 ndash019 001 Change in private inventories 006 006 000 010 011 ndash001 003 003 000 004 004 000
Net exports of goods and services ndash004 ndash004 000 ndash001 ndash001 000 ndash009 ndash010 001 011 011 000 Exports 034 035 ndash001 010 010 000 046 047 ndash001 057 059 ndash002
Goods 025 026 ndash001 006 006 000 035 036 ndash001 040 043 ndash003 Services 009 009 000 004 004 000 011 011 000 017 016 001
Imports ndash038 ndash039 001 ndash011 ndash011 000 ndash054 ndash056 002 ndash046 ndash048 002 Goods ndash031 ndash032 001 ndash006 ndash006 000 ndash047 ndash049 002 ndash037 ndash039 002 Services ndash007 ndash007 000 ndash006 ndash006 000 ndash007 ndash008 001 ndash009 ndash009 000
Government consumption expenditures and gross investment 086 083 003 162 156 006 050 047 003 018 016 002 Federal 062 057 005 142 135 007 015 011 004 022 020 002
National defense 050 047 003 126 119 007 006 004 002 014 014 000 Nondefense 012 010 002 016 016 000 009 007 002 007 006 001
State and local 025 026 ndash001 020 021 ndash001 034 036 ndash002 ndash004 ndash003 ndash001
and for the other two subperiods the revisions to exshyports offset the revisions to imports)
For 1929ndash1959 and for 1959ndash2002 the contribution of PCE is revised down reflecting downward revisions to spending for both goods and services In contrast for 2002ndash2012 the contribution of PCE is revised up (the upward revision is more than accounted for by services)
Real DPI The average annual rates of growth of real DPI for 1929ndash2012 (32 percent) and for 1929ndash1959 (31 pershycent) are 01 percentage point more than in the previshyously published estimates (table 23) The average annual rate of growth for 1959ndash2002 (36 percent) is the same as the previously published estimate For 2002ndash2012 the average annual rate of growth of real DPI is 20 percent 02 percentage point higher than in the previously published estimates
The revisions to real DPI result from the following Revisions to the current-dollar DPI Revisions to the implicit price deflator for PCE
which is used to deflate DPI For 38 years the percent change in real DPI is reshy
vised up For 17 of these years the revisions are greater than 02 percentage point the largest revisions are for 1942 (10 percentage point) for 2009 (23 percentage points) and for 2011 (11 percentage points) Upward revisions to current-dollar DPI play a role in 16 of these 17 revisions and downward revisions to the imshyplicit price deflator for PCE play a role in eight of these
revisions For 32 years the percent change in real DPI is reshy
vised down Twelve of the downward revisions are larger than 02 percentage point the largest revisions at 09 percentage point are for 1976 and for 2008 Downward revisions to current-dollar DPI play a role in all 12 of these revisions while the implicit price deshyflator for PCE plays a minimal role
For 13 years the percent change in real DPI is unreshyvised
For 1942 and for 1976 the revisions primarily reshyflect the adoption of accrual-based measures for deshyfined benefit pension plans For 2008 the downward revision primarily reflects the impacts of the improved distribution of income of regulated investment compashynies of the improved measurement of financial sershyvices and of other statistical changes For 2009 the upward revision primarily reflects the impacts of the adoption of accrual-based measures for defined benefit pension plans and of statistical changes including the improved measurement of financial services For 2011 the upward revision primarily reflects the incorporashytion of new and revised source data that underlie the components of personal income (see the section ldquoPershysonal income and outlays (account 3)rdquo above)
Annual Prices The revisions to the percent changes in the chain-type price indexes result from the incorporation of revised and newly available source data and of revised weights into the chain formula
36 Improved NIPA Estimates September 2013
For 1929ndash2012 and for the subperiods 1959ndash2002 and 2002ndash2012 the average annual rates of change in the price index for gross domestic purchases are 01 percentage point lower than in the previously pubshylished estimates (table 25) For 1929ndash1959 the average rate of change is unrevised
For 1929ndash2012 and for the subperiods 1929ndash1959 and 1959ndash2002 the revised estimates of the average annual rates of change in the price index for GDP are the same as those in the previously published estishymates For 2002ndash2012 the average annual rate of change in the price index for GDP is 21 percent a downward revision of 02 percentage point
Notable revisions to the prices of major composhynents of GDP for 2002ndash2012 include the following
Prices of PCE for services are revised down 01 pershycentage point
Prices of nonresidential structures are revised down 05 percentage point
Prices of federal consumption expenditures and gross investment are revised down 04 percentage point
Quarterly Real GDP The revisions to the quarterly (and monthly) NIPA esshytimates reflect the revisions to the annual estimates the incorporation of new and revised monthly and
quarterly source data (including the updating of seashysonal factors) and the introduction of changes in methodology
This section focuses on the effect of the revisions on business cycles with an emphasis on the most recent period of contraction and the current period of expanshysion15
In general the revisions have very little effect on business cycles In the revised estimates for the 11 conshytractions since 1947 all but the 2001 recession show more moderate declines than in the previously pubshylished estimates (table 26) For the 2001 recession the average rate of growth in real GDP is revised down from a positive 10 percent to a positive 06 percent16
In the revised estimates for the most recent contracshytion real GDP decreases at an average annual rate of 29 percent through the second quarter of 2009 in the previously published estimates it had decreased at a
15 These turning points are consistent with the business-cycle turning points determined by the National Bureau of Economic Research (NBER)
16 The NBER considers a number of monthly indicatorsmdashsuch as employment personal income and industrial productionmdashas well as the change in GDP growth for dating business cycles Therefore declines in quarterly real GDP often track closely with recessions but the movements of monthly indicators (especially employment) that the NBER also considshyers may affect the relationship between the pattern of change in real GDP and the identification of recessions More information about the NBER business-cycle dating procedure is available at wwwnberorg
Table 25 Prices of Gross Domestic Product and Its Major Components Revisions to Average Annual Rates of Change Over Selected Periods
Revised Previously published Revision Revised Previously
published Revision Revised Previously published Revision Revised Previously
published Revision
1929ndash2012 1929ndash1959 1959ndash2002 2002ndash2012
Gross domestic product (GDP) Personal consumption expenditures (PCE)
Goods Durable goods Nondurable goods
Services Gross private domestic investment
Fixed investment Nonresidential
Structures Equipment Intellectual proper ty products
Residential Change in private inventories
Net exports of goods and services Exports
Goods Services
Imports Goods Services
Government consumption expenditures and gross investment Federal
National defense Nondefense
State and local Addenda Gross domestic purchases Gross domestic purchases excluding food and energy 1
GDP excluding food and energy 2 PCE excluding food and energy
29 29 23 14 28 33 24 28 25 41 18 23 37
25 23 33 29 29 30
36 33 33 33 41
29
29
29 29 23 14 28 33 23 28 24 41
37
25 22 33 29 29 30
36 35 35 35 40
30
29
00 00 00 00 00 00 01 00 01 00
00
00 01 00 00 00 00
00 ndash02 ndash02 ndash02
01
ndash01
00
19 19 19 19 19 18 19 27 27 31 27 22 30
18 17 29 19 20 17
24 24 24 26 31
19
19
19 19 19 19 19 18 17 27 28 31
30
18 17 29 19 20 17
23 23 22 23 31
19
19
00 00 00 00 00 00 02 00
ndash01 00
00
00 00 00 00 00 00
01 01 02 03 00
00
00
38 38 28 17 34 45 30 31 26 46 16 27 45
28 25 36 35 34 40
45 41 41 40 48
38
38
38 38 28 17 34 46 29 30 24 46
44
29 25 37 35 34 39
46 44 44 44 47
39
38
00 00 00 00 00
ndash01 01 01 02 00
01
ndash01 00
ndash01 00 00 01
ndash01 ndash03 ndash03 ndash04
01
ndash01
00
21 21 13
ndash17 30 26 16 16 13 47 00 08 22
28 27 30 35 36 32
33 27 28 25 36
23 21 21 18
23 22 13
ndash18 30 27 17 17 13 52
23
27 26 28 35 36 32
36 31 33 28 38
24 22 23 19
ndash02 ndash01
00 01 00
ndash01 ndash01 ndash01
00 ndash05
ndash01
01 01 02 00 00 00
ndash03 ndash04 ndash05 ndash03 ndash02
ndash01 ndash01 ndash02 ndash01
1 Price index begins with 1982 2 Price index begins with 1985
37 September 2013 SURVEY OF CURRENT BUSINESS
rate of 32 percent The percent change in real GDP is revised down for three quarters and is revised up for three quarters (table 27) The average revision without regard to sign is 07 percentage point
In the revised estimates for the 10 complete expanshysions since 1947 four have slightly stronger increases than in the previously published estimatesmdashthe exshypansions beginning in the fourth quarter of 1949 in the first quarter of 1961 in the fourth quarter of 1982 and in the fourth quarter of 2001 (table 26) For two of the expansions the increases are slightly more moder-
Table 26 Revisions to Cyclical Fluctuations in Real Gross Domestic Product 1948ndash2013
ate than in the previously published estimatesmdashthe exshypansions beginning in the second quarter of 1958 and in the fourth quarter of 1970 For the remaining four expansions the average annual rates of growth for real GDP are unrevised
For the current expansion through the first quarter of 2013 real GDP increases at an average annual rate of 22 percent in the previously published estimates it had increased at a rate of 21 percent The percent change in real GDP is revised up for seven quarters and is revised down for eight quarters (table 27) The avershyage revision without regard to sign is 06 percentage point
Table 27 Rates of Growth of Real Gross Domestic Product Revised Previously
published Revision
Contractions 1948IVndash1949IV ndash15 ndash16 01 1953IIndash1954II ndash24 ndash25 01 1957IIIndash1958II ndash39 ndash42 03 1960IIndash1961I ndash04 ndash07 03 1969IVndash1970IV ndash01 ndash02 01 1973IVndash1975I ndash25 ndash26 01 1980Indash1980III ndash43 ndash44 01 1981IIIndash1982IV ndash20 ndash21 01 1990IIIndash1991I ndash26 ndash27 01 2001Indash2001IV 06 10 ndash04 2007IVndash2009II ndash29 ndash32 03
Expansions 1949IVndash1953II 76 75 01 1954IIndash1957III 40 40 00 1958IIndash1960II 56 57 ndash01 1961Indash1969IV 49 48 01 1970IVndash1973IV 51 52 ndash01 1975Indash1980I 43 43 00 1980IIIndash1981III 44 44 00 1982IVndash1990III 43 42 01 1991Indash2001I 36 36 00 2001IVndash2007IV 28 27 01 2009IIndash2013I 22 21 01
Revised Previously published Revision
2008Indash2009II
2008I ndash27 ndash18 ndash09 2008II 20 13 07 2008III ndash20 ndash37 17 2008IV ndash83 ndash89 06 2009I ndash54 ndash53 ndash01 2009II ndash04 ndash03 ndash01
Revised Previously published Revision
2009IIIndash2013I
2009III 13 14 ndash01 2009IV 39 40 ndash01 2010I 16 23 ndash07 2010II 39 22 17 2010III 28 26 02 2010IV 28 24 04 2011I ndash13 01 ndash14 2011II 32 25 07 2011III 14 13 01 2011IV 49 41 08 2012I 37 20 17 2012II 12 13 ndash01 2012III 28 31 ndash03 2012IV 01 04 ndash03 2013I 11 18 ndash07
38 Improved NIPA Estimates September 2013
Acknowledgments Nicole M Mayerhauser Chief of the National Income and Wealth Division supervised the preparation of this yearrsquos comprehensive revision of the national income and product accounts Pamela A Kelly Chief of the Governshyment Division directed major parts of the revision Brent R Moulton Associate Director for National Economic Accounts provided overall supervision
Bureau of Economic Analysis staff members who made significant contributions to the revision are listed below
Estimate coordination and review David F Sullivan Alyssa E Holdren Donald D Kim Robert J Kornfeld Brendan J Leary Shelly Smith
Personal consumption expenditures Kyle J Brown Goods Harvey L Davis Jr Yukun Fung Megan E Groll Everette P Johnson Danit E Kanal Brian K Sliker Sershyvices Jason Chute Robert N Ganz III Mahmoud Raya Teresita D Teensma Baoline Chen
Investment and foreign transactions Michael Armah Inventories foreign transactions and prices Harry Johnshyson Jr Michael M Cortez Jeffrey Hall Sinan Hastorun Echo Lin Private fixed investment in structures equipshyment and software Christina D Hovland Velma P Henry Sarah J Pack Linden L Webber Private fixed investment in research and development and entertainshyment literary and artistic originals Marissa Crawford Kevin J Furlong Andrew Schmidt
Federal government Benjamin A Mandel Peter G Beall Mark S Ludwick Stan J Bellotti Andrew P Cairns Andrea L Cook Raymen G LaBella Ann Miller Kyle D Mulgrew Farah Naz Michelle D Robinson Mary L Roy Benyam Tsehaye Andrew E Vargo Bryan Williams Keith Zipay
State and local government Bruce E Baker Steven J Andrews Melissa J Braybrooks Michelle S Grier Brian E Parks
Personal income Kurt Kunze Employee compensation Janet H Kmitch Jillian E Fasser Paul Medzerian James E Rankin Dylan G Rassier John Rusinko Brian J
Smith Business income Howard I Krakower Andrew W Hodge M Greg Key Kate L Shoemaker Martin L Simshymons Garth K Trinkl Dennis R Weikel Property income Michael N Hayes Louise V Lusby Denise A McBride Elizabeth M Terroni
Consumption of fixed capital Private Robert J Kornshyfeld Marlyn Rodriguez Michael T Cusick Michael D Glenn Lisa A Lynn Nadia Sadeacutee Government Jennifer A Bennett Mark A Bailey Mark A Ledbetter Christoshypher B Mbu
Computer systems and operations Brendan J Leary Michael J Boehm Wanda Y Chambers Benjamin D Cowan Natalie M Hayes Sung H Lee Ethan C Lincoln Sandip Mehta Ross F Metzger JD Montgomery Andrew J Pinard James J Raley III Michael D Randall Karl V Rohrer David Rozenshtein
Definitional and statistical improvements research Marshyshall Reinsdorf Research and development Jennifer Lee Wendy CY Li Jennifer Ribarsky Entertainment literary and artistic originals Rachel H Soloveichik David B Wasshausen Accrual accounting for defined benefit penshysion plans Marshall Reinsdorf David G Lenze Dylan G Rassier Expanded ownership transfer costs Arnold J Katz Improved measures of financial services Kyle K Hood
Supplemental review materials Duane G Hackmann Colby Johnson Lisa S Mataloni Kristina L Maze Stephshyanie McCulla Bonnie A Retus David F Sullivan Chrisshytopher Wang
NIPA information Jeannine Aversa Thomas B Dail Gianna M Marrone Debra M Blagburn
Secretarial and program assistance Esther M Carter Katherine Dent Beverly B Goodwin Angela P Pointer In addition the National Economic Accounts Directorate expresses gratitude and appreciation for the contribushytions of staff from the Industry Accounts Directorate led by their Associate Director Carol E Moylan and Division Chiefs Erich H Strassner and David B Wasshausen
Table A follows
39 September 2013 SURVEY OF CURRENT BUSINESS
Table A Selected Components Detail and Major Source Data and Conceptual and Statistical Changes Incorporated 2007ndash2012mdashContinues
Line NIPA component
Billions of dollars
Major source data and conceptual and statistical changes incorporated 1Revised level Revision in level
2007 2009 2012 2007 2008 2009 2010 2011 2012
1 Gross domestic product 144803 144179 162446 4516 4288 4442 4594 4581 5598 2 Personal consumption expenditures 97444 98429 111496 ndash279 ndash300 ndash30 ndash138 ndash172 300 3 Goods 33616 31984 37697 ndash23 ndash60 40 ndash21 ndash221 ndash135 4 Durable goods 11846 10233 12027 ndash38 ndash66 ndash63 ndash87 ndash165 ndash162 5 Motor vehicles and parts
Of which 6 Net purchases of used motor
4006 3171 4017 07 03 11 ndash07 ndash49 ndash53
vehicles
7 Furnishings and durable household
1112 997 1031 ndash55 ndash55 ndash45 ndash112 ndash159 ndash158 For 2007 BEA benchmark input-output accounts Revised Census Bureau annual retail trade survey (ARTS) data on gross margins and on retail sales of used motor vehicle dealers for 2010 new ARTS data for 2011 revised Census Bureau monthly retail trade survey (MRTS) data for 2012 new trade source data on cars and trucks in operation for 2012
equipment Of which
2835 2443 2751 122 108 89 91 84 93
8 Furniture and furnishings 1718 1446 1641 106 96 89 92 89 98 For 2007 BEA benchmark input-output accounts Revised ARTS data for 2010 new ARTS data for 2011 revised MRTS data for 2012
9 Recreational goods and vehicles Of which
10 Video audio photographic and information processing
3358 3038 3345 ndash136 ndash147 ndash135 ndash140 ndash190 ndash195
equipment and media 1956 1849 2050 ndash156 ndash159 ndash141 ndash143 ndash166 ndash162 For 2007 BEA benchmark input-output accounts Revised ARTS data for 2010 new ARTS data for 2011 revised MRTS data for 2012
11 Other durable goods 1648 1582 1913 ndash30 ndash31 ndash26 ndash31 ndash11 ndash08 12 Nondurable goods 13 Food and beverages purchased for offshy
21769 21751 25670 14 06 103 66 ndash56 28
premises consumption Of which
14 Food and nonalcoholic beverages purchased for off-premises
7373 7700 8633 261 265 277 283 228 342
consumption 6347 6634 7409 198 203 210 214 172 269 For 2007 BEA benchmark input-output accounts Revised ARTS data for 2010 new ARTS data for 2011 revised MRTS data for 2012 new trade source retail scanner data for 2012
15 Clothing and footwear Of which
3237 3065 3546 ndash117 ndash114 ndash105 ndash110 ndash109 ndash113
16 Menrsquos and boysrsquo clothing 853 815 935 ndash99 ndash98 ndash92 ndash96 ndash99 ndash101 For 2007 BEA benchmark input-output accounts Revised ARTS data for 2010 new ARTS data for 2011 revised MRTS data for 2012
17 Gasoline and other energy goods Of which
18 Motor vehicle fuels lubricants
3455 2845 4170 ndash193 ndash214 ndash148 ndash190 ndash194 ndash233
and fluids 3199 2602 3904 ndash231 ndash262 ndash185 ndash228 ndash243 ndash280 For 2007 BEA benchmark input-output accounts Revised Energy Information Administration supply data on non-diesel fuel for 2010ndash2012 new BLS consumer expenditure survey data on diesel fuel for 2008ndash2011
19 Other nondurable goods Of which
7704 8142 9321 63 68 81 84 19 30
20 Recreational items 1245 1238 1420 ndash113 ndash112 ndash107 ndash111 ndash140 ndash141 For 2007 BEA benchmark input-output accounts Revised ARTS data for 2010 new ARTS data for 2011 revised MRTS data for 2012
21 Personal care products 990 1001 1146 103 105 79 80 69 76 For 2007 BEA benchmark input-output accounts Revised ARTS data for 2010 new ARTS data for 2011 revised MRTS data for 2012
22 Tobacco 843 995 1088 106 107 116 118 122 120 For 2007 BEA benchmark input-output accounts Revised Department of Treasury Alcohol and Tobacco Tax and Trade Bureau data for 2010ndash2012
23 Services 24 Household consumption expenditures (for
63829 66445 73799 ndash254 ndash240 ndash70 ndash118 49 434
services) 61341 63685 70894 ndash203 ndash216 ndash35 ndash75 189 543 25 Housing and utilities 17582 18810 20139 20 81 94 171 310 480 26 Housing
Of which 27 Rental of tenant-occupied
14800 15916 17199 71 138 154 231 367 550
nonfarm housing
28 Imputed rental of ownershy
3160 3597 4304 49 61 66 124 247 363 Revised Census Bureau current population surveyhousing vacancy survey (CPSHVS) data for 2003ndash2011 new CPSHVS data for 2012 revised BEA utilities data for 2003ndash2011 new BEA utilities data for 2012 revised Department of Energy (DOE) residential energy consumption survey (RECS) data for 2005 new DOE RECS data for 2009 new BLS consumer expenditure survey data on tenant expenditures for 2008ndash2011 new Census Bureau decennial census of housing (COH) data for 2010 new Census Bureau American housing survey (AHS) data for 2011
occupied nonfarm housing 11423 12099 12637 10 64 76 94 110 167 Revised Census Bureau CPSHVS data for 2003ndash2011 new CPSHVS data for 2012 revised BEA constant-dollar housing stock data for 2008ndash2011 new BEA constant-dollar housing stock data for 2012 new Census Bureau decennial COH data for 2010 new Census Bureau AHS data for 2011
29 Household utilities 2782 2894 2940 ndash51 ndash57 ndash60 ndash60 ndash58 ndash70
See the footnotes and abbreviations at the end of the table
40 Improved NIPA Estimates September 2013
Table A Selected Components Detail and Major Source Data and Conceptual and Statistical Changes Incorporated 2007ndash2012mdashContinues
Line NIPA component
Billions of dollars
Major source data and conceptual and statistical changes incorporated 1Revised level Revision in level
2007 2009 2012 2007 2008 2009 2010 2011 2012
30 Health care Of which
14818 16274 18476 241 239 258 277 162 295
31 Physician services 3657 3928 4339 55 58 59 59 58 138 For 2007 BEA benchmark input-output accounts Revised Census Bureau service annual survey (SAS) taxable and tax-exempt revenue data for 2010 and 2011 new SAS data for 2012
32 Hospitals 6581 7366 8612 179 199 213 232 179 226 For 2007 BEA benchmark input-output accounts Revised SAS taxable and tax-exempt revenue data for 2010 and 2011 new SAS data for 2012
33 Transpor tation services 3122 2897 3181 52 58 52 53 62 53 34 Recreation services 3758 3760 4166 04 26 53 66 52 64 35 Food services and accommodations 5956 6003 7017 ndash49 ndash58 ndash69 ndash133 ndash122 ndash119 36 Financial services and insurance 7685 7190 8210 ndash218 ndash355 ndash228 ndash331 ndash60 ndash81 37 Financial services 4803 4522 4961 ndash215 ndash383 ndash251 ndash392 ndash278 ndash427
Of which 38 Financial services furnished
without payment 2366 2294 2591 ndash142 ndash320 ndash215 ndash345 ndash240 ndash396 Improved estimates of implicit services of commercial banks Revised FRB flow of funds accounts data for 2010 and 2011 new flow of funds accounts data for 2012 revised IRS tabulations of corporate tax return data for 2010 new IRS tabulations of corporate and of sole proprietorship and partnership tax return data for 2011 new FDIC data for 2012 new trade source data on credit unions and on investment companies for 2012
39 Insurance Of which
2882 2667 3250 ndash03 28 23 62 217 348
40 Life insurance 875 800 1033 37 51 47 51 150 170 Revised trade source data on life insurance company expenses for 2007ndash2010 new trade source data for 2011 new BLS quarterly census of employment and wages data for 2012
41 Net health insurance 1313 1194 1545 ndash43 ndash26 ndash28 05 69 190 Revised benefits-to-premiums ratio based on new trade source data on medical insurance for 2011 new DHHS medical expenditures panel survey data for 2011 and 2012
42 Other services 8419 8751 9704 ndash255 ndash207 ndash196 ndash177 ndash214 ndash151 43 Communication
Of which 2033 2179 2517 ndash38 07 22 32 53 165
44 Telecommunication services 1490 1496 1606 ndash104 ndash104 ndash95 ndash94 ndash130 ndash132 For 2007 BEA benchmark input-output accounts Revised SAS product revenue data for 2007ndash2010 new SAS product revenue data for 2011 new SAS industry revenue data for 2012
45 Internet access 423 563 807 39 75 83 93 157 274 For 2007 BEA benchmark input-output accounts Revised SAS product revenue data for 2007ndash2010 new SAS product revenue data for 2011 new SAS industry revenue data for 2012
46 Education services 1966 2199 2649 09 ndash04 ndash13 ndash15 ndash13 ndash05 47 Professional and other services 1636 1615 1694 ndash02 ndash10 ndash17 ndash13 ndash10 ndash63 48 Personal care and clothing services 49 Social services and religious
1115 1099 1248 04 04 07 40 24 49
activities 1246 1332 1473 ndash132 ndash139 ndash142 ndash146 ndash154 ndash153 For 2007 BEA benchmark input-output accounts Revised SAS taxable and tax-exempt revenue data for 2010 and 2011 new SAS data for 2012
50 Net foreign travel ndash215 ndash275 ndash536 ndash123 ndash89 ndash81 ndash101 ndash129 ndash169 Of which
51 Foreign travel by US residents 2
52 Final consumption expenditures of 1041 979 1100 ndash98 ndash99 ndash92 ndash114 ndash150 ndash171 Revised BEA international transactions accounts data for 1999ndash2012
nonprofit institutions 2488 2760 2905 ndash51 ndash25 ndash35 ndash43 ndash140 ndash109 53 Gross output of nonprofit institutions 9831 10726 11941 ndash63 ndash56 ndash61 ndash75 ndash229 ndash214 New treatment of research and development For 2007 BEA benchmark
input-output accounts Revised SAS tax-exempt expenses data for 2010 and 2011 new SAS data for 2012
54 Less Receipts from sales of goods and services by nonprofit institutions 7344 7965 9036 ndash11 ndash31 ndash27 ndash32 ndash88 ndash105 See entries under Household consumption expenditures (for services) line
24 55 Gross private domestic investment 26437 18781 24752 3485 3372 3288 3635 3772 4129 56 Fixed investment 26093 20257 24091 3432 3281 3222 3603 3773 4049 57 Nonresidential 19206 16334 19700 2831 2847 2841 3198 3303 3487 58 Structures
Of which 4969 4382 4373 ndash280 ndash339 ndash129 ndash143 ndash242 ndash261
59 Power 541 761 832 40 51 57 49 51 33 60 Electric 415 604 668 79 141 186 123 172 229 Improved classifications of wind and solar power structures For 2007 BEA
benchmark input-output accounts 61 Other power 127 157 163 ndash38 ndash90 ndash129 ndash74 ndash121 ndash197 Improved classifications of wind and solar power structures For 2007 BEA
benchmark input-output accounts 62 Petroleum and natural gas 949 694 1165 ndash317 ndash375 ndash159 ndash184 ndash286 ndash277 For 2007 BEA benchmark input-output accounts Revised trade source data
on footage drilled for 2008ndash2011 new trade source data for 2012 new Census Bureau annual capital expenditures survey data for 2011
63 Equipment 3 8858 6443 9076 64 Information processing equipment 3
Of which 3032 2561 2845
65 Communication equipment 1062 794 958 68 68 35 57 134 176 For 2007 BEA benchmark input-output accounts Revised Census Bureau annual survey of manufactures (ASM) data for 2010 new ASM data for 2011 revised Census Bureau monthly industry shipments data for 2012
66 Industrial equipment 1941 1521 1953 11 ndash16 ndash31 ndash24 08 ndash22
See the footnotes and abbreviations at the end of the table
41 September 2013 SURVEY OF CURRENT BUSINESS
Table A Selected Components Detail and Major Source Data and Conceptual and Statistical Changes Incorporated 2007ndash2012mdashContinues
Line NIPA component
Billions of dollars
Major source data and conceptual and statistical changes incorporated 1Revised level Revision in level
2007 2009 2012 2007 2008 2009 2010 2011 2012
67 Transportation equipment 1888 706 2144 ndash14 ndash07 ndash53 43 71 175 For 2007 BEA benchmark input-output accounts Revised trade source data on motor vehicle unit sales and prices for 2007 revised trade source data on auto and light truck average expenditures for 2008ndash2011 revised trade source data on business motor vehicle registrations for 2012
68 Other equipment 2118 1742 2237 105 87 28 103 107 68 For 2007 BEA benchmark input-output accounts Revised Census Bureau ASM data for 2010 new ASM data for 2011 revised Census Bureau monthly industry shipments data for 2012
69 Less Sale of equipment scrap excluding autos 122 86 103 37 60 22 16 13 15
70 Intellectual property products 3 5379 5509 6250 New treatments of research and development and of entertainment literary and artistic originals
71 Software 2442 2568 2816 ndash08 13 ndash01 ndash89 ndash111 ndash118 For 2007 BEA benchmark input-output accounts Revised Census Bureau service annual survey (SAS) revenue data for 2010 and 2011 new SAS data for 2012 new BLS occupational employment survey data for 2012
72 Research and development 3 73 Entertainment literary and ar tistic
2233 2290 2691 New treatment of research and development
originals 3 704 651 743 New treatment of enter tainment literary and artistic originals 74 Residential 6887 3922 4392 600 435 381 405 471 563 75 Structures 6788 3839 4302 604 438 385 410 475 566
Of which 76 Brokersrsquo commissions and other
ownership transfer costs 3 1447 952 1069 New treatment of ownership transfer costs 77 Residential equipment 99 83 90 ndash04 ndash05 ndash05 ndash05 ndash04 ndash04 78 Change in private inventories 345 ndash1476 661 54 91 66 31 ndash02 80 79 Farm ndash07 ndash16 ndash117 00 00 01 00 ndash03 44 80 Nonfarm 352 ndash1460 778 54 91 65 32 01 37 81 Change in book value 924 ndash1537 928 10 60 45 62 06 49 82 Mining utilities and construction 34 ndash53 68 ndash04 10 60 ndash08 ndash64 07 83 Manufacturing 385 ndash335 148 00 ndash07 00 64 11 ndash01 84 Wholesale trade 332 ndash620 285 44 70 00 ndash33 ndash15 ndash19 85 Merchant wholesale 258 ndash494 252 06 12 00 20 ndash31 ndash23 86 Nonmerchant wholesale 75 ndash125 34 39 58 00 ndash52 16 05 87 Retail trade
Of which 138 ndash478 338 16 ndash14 00 28 56 15
88 Retail motor vehicle dealers 37 ndash330 232 00 ndash01 00 24 57 25 89 Other industries 34 ndash51 89 ndash46 00 ndash15 11 18 46 90 IVA ndash572 77 ndash150 43 31 20 ndash30 ndash06 ndash12 91 Net exports of goods and services 2 ndash7098 ndash3922 ndash5472 33 ndash35 ndash35 ndash69 ndash06 127 Revised BEA international transactions accounts data for 1999ndash2012 92 Exports 16657 15838 21959 40 ndash37 ndash36 ndash09 70 119 93 Goods 11653 10647 15360 33 01 00 ndash01 ndash09 ndash68 94 Services
Of which 5004 5191 6599 07 ndash38 ndash36 ndash08 79 187
95 Royalties and license fees 978 984 1242 132 00 00 03 ndash01 ndash07 Reclassification of distribution rights for film and television recordings from exports of ldquootherrdquo private services
96 Other private services 2116 2373 2945 ndash108 00 00 07 94 191 Reclassification of distribution rights for film and television recordings to exports of rents and royalties Improved methodology for estimating expenditures by seasonal border and other short-term workers for 2003ndash2012 New BEA 2011 Benchmark Survey of Transactions in Selected Services and Intangible Assets with Foreign Persons data for 2011 corrected repor ting and new data from major companies for 2011 and 2012
97 Imports 23755 19760 27431 07 ndash01 ndash02 59 76 ndash09 98 Goods
Of which 20003 15873 22954 ndash04 01 ndash02 42 54 35
99 Other 851 755 906 ndash107 02 00 44 55 45 Reallocation of adjustments for low-value imports and for inland freight in Canada and Mexico
100 Services 101 Government consumption expenditures
3753 3887 4477 13 ndash01 00 17 23 ndash44
and gross investment 28019 30891 31670 1277 1251 1219 1165 989 1042 102 Federal 10498 12177 12957 735 755 741 808 820 814 Revised allocations of FY 2011 and FY 2012 OMB Budget data for
2010ndash2012 preliminary FY 2013 OMB Budget data for 2012 103 National defense 6787 7883 8171 164 163 123 151 150 80 104 Consumption expenditures 5261 6133 6520 ndash493 ndash505 ndash511 ndash493 ndash493 ndash516
Of which 105 Compensation of general
government employees 106 Consumption of general
2015 2288 2486 ndash368 ndash402 ndash450 ndash460 ndash494 ndash553 New treatment of defined benefit pension plans
government fixed capital 1299 1446 1611 525 560 581 602 621 626 New treatment of research and development 107 Services 1565 1928 1909 ndash482 ndash492 ndash471 ndash462 ndash436 ndash398 New treatment of research and development 108 Less Own-account investment 186 195 200 165 171 171 173 183 177 New treatment of research and development 109 Gross investment 1527 1750 1651 658 668 635 643 643 595 110 Structures 100 171 84 ndash01 00 00 00 ndash01 ndash01 111 Equipment 3 708 860 862 112 Intellectual property products 3 719 718 705 113 Software 3 65 68 77 114 Research and development 3 654 650 629 New treatment of research and development
See the footnotes and abbreviations at the end of the table
42 Improved NIPA Estimates September 2013
Table A Selected Components Detail and Major Source Data and Conceptual and Statistical Changes Incorporated 2007ndash2012mdashContinues
Line NIPA component
Billions of dollars
Major source data and conceptual and statistical changes incorporated 1Revised level Revision in level
2007 2009 2012 2007 2008 2009 2010 2011 2012
115 Nondefense 3710 4294 4786 570 592 618 658 669 735 116 Consumption expenditures
Of which 117 Compensation of general
2723 3204 3597 ndash12 ndash15 ndash21 ndash26 ndash36 37
government employees 118 Consumption of general
1281 1467 1625 ndash133 ndash137 ndash146 ndash150 ndash144 ndash161 New treatment of defined benefit pension plans
government fixed capital 769 835 943 480 506 519 551 576 586 New treatment of research and development 119 Services 627 814 910 ndash252 ndash276 ndash278 ndash309 ndash336 ndash274 New treatment of research and development 120 Less Own-account investment 142 154 151 116 117 123 124 126 121 New treatment of research and development 121 Gross investment 988 1090 1189 583 606 639 683 706 698 122 Structures 114 120 142 03 00 ndash01 ndash06 06 13 123 Equipment 3 161 177 195 124 Intellectual property products 3 713 793 853 125 Software 3 142 150 172 126 Research and development 3 572 643 680 New treatment of research and development 127 State and local 17522 18714 18713 543 496 478 358 170 228 128 Consumption expenditures
Of which 129 Compensation of general
14114 15084 15364 425 395 351 221 ndash06 56
government employees
130 Consumption of general government
10655 11419 11785 838 836 855 997 936 904 New treatment of defined benefit pension plans Improved estimates of employersrsquo contributions to defined contribution pension plans Improved measures of wages paid by Indian tribal governments
fixed capital 1447 1621 1788 78 93 99 102 104 107 New treatment of research and development 131 Nondurable goods 2071 2120 2478 ndash29 ndash52 05 ndash98 ndash164 ndash127 New treatment of research and development For 2007 BEA benchmark
input-output accounts Revised Census Bureau government finances FY 2006ndashFY 2010 tabulations for 2005ndash2010 new government finances FY 2011 tabulations for 2010 and 2011
132 Services 3468 3728 3709 ndash162 ndash192 ndash304 ndash412 ndash436 ndash370 New treatment of research and development For 2007 BEA benchmark input-output accounts Revised Census Bureau government finances FY 2006ndashFY 2010 tabulations for 2005ndash2010 new government finances FY 2011 tabulations for 2010 and 2011
133 Less Own-account investment 336 362 352 120 129 131 134 140 142 New treatment of research and development 134 Less Sales to other sectors
Of which 3430 3694 4282 181 159 166 222 292 306
135 Other sales 1235 1233 1376 154 136 134 158 184 182 New treatment of research and development For 2007 BEA benchmark input-output accounts Revised Census Bureau government finances FY 2006ndashFY 2010 tabulations for 2005ndash2010 new government finances FY 2011 tabulations for 2010 and 2011
136 Gross investment 3408 3630 3349 118 100 127 137 175 172 137 Structures 2712 2898 2627 28 03 21 45 95 108 Revised Census Bureau government finances FY 2006ndashFY 2010 tabulations
for 2005ndash2010 new government finances FY 2011 tabulations for 2010 and 2011 revised Census Bureau construction spending (value put in place) data for 2011 and 2012
138 Equipment 3 439 445 411 139 Intellectual property products 3 258 287 312 140 Software 3 117 122 134 141 Research and development 3 141 165 178 New treatment of research and development 142 Gross domestic product 144803 144179 162446 4516 4288 4442 4594 4581 5598 143 Less Statistical discrepancy 4 202 722 ndash170 322 1014 ndash461 198 ndash856 ndash572 144 Equals Gross domestic income 144601 143457 162616 4194 3272 4903 4396 5437 6170 145 Compensation of employees paid 79088 77957 86200 458 109 ndash115 ndash19 ndash166 196 See entries under Compensation of employees line 167 146 Wages and salaries 64057 62601 69351 ndash169 ndash130 ndash231 ndash261 ndash225 216 147 To persons 63909 62468 69205 ndash279 ndash181 ndash181 ndash273 ndash229 205 148 To the rest of the world 147 133 146 46 00 00 12 04 11 149 Supplements to wages and salaries 15031 15356 16849 627 239 116 244 59 ndash20 150 Taxes on production and imports 10346 10261 11229 74 33 29 21 ndash08 ndash71 151 Less Subsidies 546 583 573 00 ndash03 ndash14 ndash11 ndash16 ndash35 152 Net operating surplus 33070 32139 40332 ndash1305 ndash1965 ndash45 ndash700 436 698 153 Private enterprises 33235 32345 40609 ndash1258 ndash1913 06 ndash666 408 635 154 Current surplus of government enterprises ndash164 ndash206 ndash277 ndash46 ndash52 ndash50 ndash34 27 63 155 Consumption of fixed capital 22644 23684 25429 4969 5093 5021 5082 5158 5312 156 Private 18650 19257 20493 3888 3940 3829 3836 3870 4015 New treatments of research and development of enter tainment literary and
ar tistic originals and of ownership transfer costs Revised BEA fixed investment and price estimates for 2001ndash2012
157 Domestic business 14512 15224 16394 2605 2740 2724 2780 2859 3004 158 Capital consumption allowances 13300 15586 15950 2428 2595 2757 2839 3277 3374 New treatments of research and development of enter tainment literary and
ar tistic originals and of ownership transfer costs Improved measures of IRS section 179 expensing for sole proprietorships Revised IRS tabulations of corporate tax return data for 2001ndash2010 new IRS tabulations of corporate and of sole proprietorship and partnership tax return data for 2011 revised Office of Tax Analysis bonus depreciation estimates for 2012 revised BEA fixed investment estimates for 2001ndash2012
159 Less CCAdj ndash1212 362 ndash444 ndash176 ndash145 33 59 419 370 CCAdj is calculated as capital consumption allowances less consumption of fixed capital
160 Households and institutions 4137 4033 4099 1282 1200 1106 1056 1012 1011 New treatments of research and development and of ownership transfer costs Revised BEA fixed investment and price estimates for 2001ndash2012
161 Government 3994 4427 4936 1081 1153 1192 1246 1287 1297 New treatment of research and development 162 Plus Income receipts from the rest of the world 2 8755 6437 8186 45 07 13 35 191 363 Revised BEA international transactions accounts data for 1999ndash2012 163 Less Income payments to the rest of the world 2 7491 4965 5657 14 ndash31 ndash24 69 103 264 Revised BEA international transactions accounts data for 1999ndash2012
See the footnotes and abbreviations at the end of the table
43 September 2013 SURVEY OF CURRENT BUSINESS
Table A Selected Components Detail and Major Source Data and Conceptual and Statistical Changes Incorporated 2007ndash2012mdashContinues
Line NIPA component
Billions of dollars
Major source data and conceptual and statistical changes incorporated 1Revised level Revision in level
2007 2009 2012 2007 2008 2009 2010 2011 2012
164 Equals Gross national income 145866 144929 165145 4227 3311 4940 4362 5526 6269 165 Less Consumption of fixed capital 22644 23684 25429 4969 5093 5021 5082 5158 5312 See entries under Consumption of fixed capital line 155 166 Equals National income 123223 121245 139716 ndash741 ndash1783 ndash81 ndash719 368 957 167 Compensation of employees 78991 77878 86116 432 109 ndash116 ndash27 ndash167 187 168 Wages and salaries 63960 62522 69268 ndash195 ndash131 ndash231 ndash271 ndash226 208 169 Government 10888 11751 11973 ndash02 00 ndash01 ndash02 ndash09 ndash42 170 Other 53072 50771 57294 ndash192 ndash131 ndash230 ndash269 ndash217 249 Updated measures of misrepor ting based on IRS National Research
Program (NRP) data for 2006 Revised BLS quarterly census of employment and wages (QCEW) data for 2001ndash2011 new QCEW data for 2012
171 Supplements to wages and salaries 172 Employer contributions for employee
15031 15356 16849 627 239 116 244 59 ndash20
pension and insurance funds
173 Employer contributions for government
10414 10775 11706 609 227 103 231 64 ndash15 New treatment of defined benefit pension plans New Department of Labor pension data for 2010 new DHHS medical expenditures panel survey data for 2011 and 2012
social insurance 4617 4581 5143 18 12 12 13 ndash05 ndash05 174 Proprietorsrsquo income with IVA and CCAdj 9792 9730 12249 ndash1112 ndash714 ndash64 ndash707 ndash22 226 175 Farm 381 355 754 03 ndash48 ndash44 17 180 192 176 Proprietorsrsquo income with IVA 442 418 813 03 ndash48 ndash44 17 180 191 Revised USDA data for 2001ndash2012 177 CCAdj ndash61 ndash64 ndash59 00 00 ndash01 00 00 01 178 Nonfarm 9411 9375 11496 ndash1115 ndash666 ndash20 ndash724 ndash202 35 179 Proprietorsrsquo income 8655 7968 10049 ndash944 ndash472 139 ndash552 ndash104 ndash32 New treatments of research and development of enter tainment literary and
artistic originals and of ownership transfer costs Updated measures of misreporting based on IRS NRP data for 2006 Improved methodology for estimating the adjustment made to remove corporate partnersrsquo income Improved measures of IRS section 179 expensing for sole proprietorships Revised IRS tabulations of corporate tax return data for the posttabulation and mining depreciation adjustments for 2010 new IRS tabulations of sole proprietorship and partnership tax return data for 2011
180 IVA ndash65 14 ndash16 05 17 04 ndash05 01 04 181 CCAdj 820 1393 1462 ndash176 ndash211 ndash163 ndash167 ndash98 62 See entries under Consumption of fixed capital line 155 182 Rental income of persons with CCAdj 1894 3337 5412 457 305 440 536 747 786 183 Rental income of persons 2066 3483 5553 463 306 435 529 739 779 New treatment of ownership transfer costs Improved estimates of mor tgage
interest paid based on new IRS Information Returns Program data on loan discount points for 1999ndash2010 and on new and revised trade source data on mortgage servicing for 2005ndash2012 Revised FRB flow of funds accounts data on residential mor tgage loan liabilities for 1980ndash2012 revised Census Bureau current population surveyhousing vacancy survey (CPSHVS) data for 2003ndash2011 new CPSHVS data for 2012 revised IRS tabulations of corporate and of individual tax return data for 2010 new IRS tabulations for 2011 new Federal National Mortgage Corporation mortgage originations data for 2011 revised trade source data on insurance for 2010 new trade source data on insurance for 2011 revised Census Bureau government finances FY 2002ndashFY 2011 tabulations for 2001ndash2011 new FY 2012 Census Bureau annual survey of state government tax collections data for 2011 and 2012 new and revised OMB Budget data on subsidies for 2003ndash2012
184 CCAdj ndash172 ndash146 ndash141 ndash06 ndash01 05 06 07 06 185 Corporate profits with IVA and CCAdj 15290 13926 20095 184 367 503 382 507 589 186 Domestic industries 11756 10398 15905 158 366 503 445 531 699 187 Financial 2610 3217 4220 ndash628 ndash227 ndash72 ndash165 ndash254 ndash103 188 Nonfinancial 9146 7181 11685 787 593 575 611 785 802 189 Rest of the world 2 3534 3528 4189 25 01 00 ndash64 ndash23 ndash111 Revised BEA international transactions accounts data for 1999ndash2012 190 Less CCAdj ndash1799 ndash822 ndash1705 06 67 191 219 510 301 See entries under Consumption of fixed capital line 155 191 Equals Corporate profits with IVA 17089 14748 21800 178 300 312 161 ndash03 287 See entries under Corporate profits before tax without IVA and CCAdj line
208 192 Domestic industries 13555 11220 17611 153 299 312 225 21 399 193 Financial 3015 3629 4774 ndash440 ndash268 ndash119 ndash190 ndash242 ndash73 194 Federal Reserve banks 360 473 717 00 00 00 00 00 ndash17 195 Other financial 2655 3155 4057 ndash440 ndash267 ndash120 ndash189 ndash242 ndash56 196 Nonfinancial 10540 7592 12837 593 567 432 415 263 472 197 Utilities 495 238 371 ndash08 ndash06 07 19 ndash66 ndash20 198 Manufacturing 3219 1714 4043 506 451 404 514 590 326 199 Durable goods 1189 344 1970 228 75 133 232 353 158 200 Nondurable goods 2030 1370 2073 278 377 271 282 237 168 201 Wholesale trade 1032 893 1378 33 43 27 40 00 ndash15 202 Retail trade 1190 1087 1492 12 ndash13 07 ndash43 72 92 203 Transportation and warehousing 239 224 515 ndash38 ndash31 ndash24 ndash35 ndash134 ndash29 204 Information 1084 812 1106 148 171 84 87 19 ndash18 205 Other nonfinancial 3282 2623 3932 ndash60 ndash49 ndash74 ndash167 ndash220 135 206 Rest of the world 3534 3528 4189 25 01 00 ndash64 ndash23 ndash111 207 Less IVA 208 Equals Corporate profits before tax without
ndash395 67 ndash100 77 75 35 ndash23 66 09
IVA and CCAdj 17484 14682 21900 100 225 277 185 ndash67 278 New treatments of research and development of enter tainment literary and artistic originals of ownership transfer costs and of defined benefit pension plans Improved methodology for distributing the income of regulated investment companies by type Revised IRS tabulations of corporate tax return data for 2010 new IRS tabulations for 2011 revised Census Bureau quar terly financial report data for 2012 new and revised regulatory and public financial repor ts profits data for 2012
See the footnotes and abbreviations at the end of the table
44 Improved NIPA Estimates September 2013
Table A Selected Components Detail and Major Source Data and Conceptual and Statistical Changes Incorporated 2007ndash2012mdashContinues
Line NIPA component
Billions of dollars
Major source data and conceptual and statistical changes incorporated 1Revised level Revision in level
2007 2009 2012 2007 2008 2009 2010 2011 2012
209 Less Taxes on corporate income 4455 2694 4348 00 01 00 ndash27 ndash48 ndash145 210 Equals Profits after tax 13029 11987 17552 100 224 276 213 ndash20 423 211 Less Net corporate dividend payments 8189 5687 7703 244 217 146 ndash370 44 ndash96 212 Equals Undistributed corporate profits 4840 6300 9849 ndash144 07 130 582 ndash63 519 213 Net interest and miscellaneous payments 6634 5631 4396 ndash682 ndash1767 ndash774 ndash785 ndash705 ndash647 214 Net interest 6408 5448 4181 ndash720 ndash1806 ndash797 ndash807 ndash744 ndash681 215 Domestic business 3851 3010 2417 21 ndash1078 ndash263 ndash417 ndash425 216 Monetary interest paid 28668 15820 12670 339 ndash1050 54 ndash68 88 Improved methodology for distributing the income of regulated investment
companies by type Revised IRS tabulations of corporate tax return data for 2010 new IRS tabulations of corporate and of sole proprietorship and par tnership tax return data for 2011 revised FRB flow of funds accounts data on nonfinancial corporate liabilities for 2010 and 2011 new FRB data for 2012 revised USDA interest data for 2010 and 2011 new FDIC data for 2012 new trade source data on credit unions and on investment companies for 2012
217 Less Monetary interest received
218 Imputed interest paid depositor
31515 19243 16922 1492 1426 1293 954 1135 New treatment of defined benefit pension plans Revised IRS tabulations of corporate tax return data for 2010 new IRS tabulations of corporate and of sole proprietorship and par tnership tax return data for 2011 revised FRB flow of funds accounts data on nonfinancial corporate liabilities for 2010 and 2011 new FRB data for 2012 revised USDA interest data for 2010 and 2011 new USDA data for 2012 new FDIC data for 2012 new trade source data on credit unions and on investment companies for 2012
insurance and pension services 3 7753 8446 8563 219 Financial 220 Banks credit agencies and
7775 8190 8366 2476 2394 3175 3105 3161
investment companies 2402 2219 2291 ndash17 ndash546 ndash128 ndash123 31 Improved estimates of implicit services of commercial banks Revised IRS tabulations of corporate tax return data for 2010 new IRS tabulations for 2011 new FDIC data for 2012 new trade source data on credit unions and on investment companies for 2012
221 Life insurance carriers
222 Property and casualty insurance
2552 2381 2346 ndash02 02 00 ndash56 ndash162 New trade source data on investment income of life insurance carriers for 2011 revised FRB flow of funds accounts data on life insurance company assets for 2010 and 2011 new FRB data for 2012
companies 315 276 302 ndash12 08 ndash11 05 ndash04 223 Employee pension plans 3 2507 3284 3403 New treatment of defined benefit pension plans 224 Other 3 ndash01 29 24 New treatment of defined benefit pension plans 225 Nonfinancial 3 226 Less Imputed interest received
depositor insurance and pension
ndash22 256 197 New treatment of defined benefit pension plans
services
227 Imputed interest paid borrower
1756 2562 2527 1102 1272 2013 1957 1908 New treatment of defined benefit pension plans Improved estimates of implicit services of commercial banks Revised FRB flow of funds accounts data for 2010 and 2011 new flow of funds accounts data for 2012 revised IRS tabulations of corporate tax return data for 2010 new IRS tabulations for 2011 new FDIC data for 2012
services
228 Less Imputed interest received
ndash733 ndash671 ndash730 231 68 397 566 632 Improved estimates of implicit services of commercial banks Improved estimates of mor tgage interest paid Revised FRB flow of funds accounts data for 2010 and 2011 new FRB data for 2012
borrower services ndash1435 ndash1221 ndash1362 407 152 838 1320 1477 Improved estimates of implicit services of commercial banks 229 Owner-occupied housing 4606 4301 3248 ndash783 ndash769 ndash587 ndash455 ndash460 230 Monetary interest paid
231 Imputed interest paid borrower
5109 4678 3619 ndash808 ndash749 ndash754 ndash761 ndash796 Improved estimates of mortgage interest paid Revised FRB flow of funds accounts data on residential mortgage liabilities for 2010ndash2012
services
232 Less Imputed interest received depositor insurance and pension
ndash489 ndash365 ndash358 26 ndash21 166 306 336 Improved estimates of implicit services of commercial banks Improved estimates of mor tgage interest paid Revised FRB flow of funds accounts data for 2010 and 2011 new FRB data for 2012
services 14 12 13 00 00 00 00 00 233 Nonprofit institutions 123 115 94 09 04 17 26 27 234 Rest of the world 2 ndash2173 ndash1978 ndash1577 32 37 36 39 113 Improved estimates of implicit services of commercial banks Revised BEA
international transactions accounts data for 1999ndash2012 235 Miscellaneous payments 226 182 215 38 39 23 21 39 34 236 Taxes on production and imports 10346 10261 11229 74 33 29 21 ndash08 ndash71 237 Federal 946 914 1180 01 00 00 13 12 20 238 State and local 9400 9348 10049 73 33 30 09 ndash19 ndash91 239 Less Subsidies 546 583 573 00 ndash03 ndash14 ndash11 ndash16 ndash35 240 Federal 475 569 568 01 ndash03 ndash14 ndash11 ndash17 ndash36 241 State and local 71 14 05 00 00 00 00 00 00 242 Business current transfer payments (net) 986 1272 1069 ndash47 ndash66 ndash62 ndash115 ndash30 ndash211 243 To persons (net) 306 387 414 01 ndash02 ndash09 ndash44 18 ndash45 244 To government (net) 620 907 706 ndash48 ndash64 ndash53 ndash73 ndash47 ndash138 Reclassification of certain federal transfer receipts as rents and royalties and
transfers to the rest of the world (net) 245 To the rest of the world (net) 60 ndash23 ndash51 00 00 00 02 ndash01 ndash27 246 Current surplus of government enterprises ndash164 ndash206 ndash277 ndash46 ndash52 ndash50 ndash34 27 63 247 Federal 20 08 ndash134 47 45 53 39 54 44 248 State and local ndash185 ndash214 ndash143 ndash94 ndash97 ndash103 ndash73 ndash27 20 New treatment of defined benefit pension plans Revised Census Bureau
government finances FY 2006ndashFY 2010 tabulations for 2005ndash2010 new government finances FY 2011 tabulations for 2010 and 2011
See the footnotes and abbreviations at the end of the table
45 September 2013 SURVEY OF CURRENT BUSINESS
Table A Selected Components Detail and Major Source Data and Conceptual and Statistical Changes Incorporated 2007ndash2012mdashTable Ends
Line NIPA component
Billions of dollars
Major source data and conceptual and statistical changes incorporated 1Revised level Revision in level
2007 2009 2012 2007 2008 2009 2010 2011 2012
Addenda 249 Gross national product 146068 145651 164974 4549 4325 4479 4560 4671 5696 250 Gross saving 25067 20717 26722 4590 3737 5159 4843 6239 6518 251 Personal income 119957 120821 137438 834 ndash296 2151 1133 2440 3127 See entries under National income and additional sources below 252 Compensation of employees 78991 77878 86116 369 59 ndash66 ndash27 ndash167 187 253 Proprietorsrsquo income with IVA and CCAdj 9792 9730 12249 ndash1112 ndash714 ndash64 ndash707 ndash22 226 254 Rental income of persons with CCAdj 1894 3337 5412 457 305 440 536 747 786 255 Personal income receipts on assets 21666 18118 19585 1096 17 1853 1413 1995 2088 256 Personal interest income 13501 12639 12116 850 ndash204 1706 1784 1953 2190 New treatment of defined benefit pension plans Improved estimates of
implicit services of commercial banks Improved methodology for distributing the income of regulated investment companies by type Revised FRB flow of funds accounts data for 2010 and 2011 new FRB data for 2012 revised IRS tabulations of corporate tax return data for 2010 new IRS tabulations of corporate and of sole proprietorship and partnership tax return data for 2011 new trade source data on investment income of life insurance carriers for 2011 new FDIC data for 2012 new trade source data on credit unions and on investment companies for 2012
257 Personal dividend income 8165 5479 7469 246 220 147 ndash371 42 ndash101 Improved methodology for distributing the income of regulated investment companies by type Revised IRS tabulations of corporate tax return data for 2010 new IRS tabulations for 2011 new and revised regulatory agency and public financial statements data on dividends for 2012 revised BEA international transactions accounts data for 1999ndash2012
258 Personal current transfer receipts 17228 21402 23583 43 48 01 ndash74 ndash123 ndash168 259 Government social benefits to persons 16922 21015 23168 43 49 10 ndash29 ndash140 ndash124 260 Federal 12589 16089 17725 47 62 35 15 ndash76 ndash25 261 State and local 4333 4926 5443 ndash04 ndash13 ndash25 ndash45 ndash65 ndash99 262 Other current transfer receipts from
business (net) 306 387 414 01 ndash02 ndash09 ndash44 18 ndash45 263 Less Contributions for government social
insurance domestic 9614 9644 9507 19 09 13 08 ndash11 ndash08 264 Federal 9425 9458 9332 19 13 16 11 ndash11 ndash08 265 State and local 189 186 175 00 ndash03 ndash04 ndash03 00 00 266 Less Personal current taxes 14879 11449 14980 ndash08 ndash05 03 ndash33 60 176 267 Federal 11644 8572 11492 ndash12 04 02 ndash04 18 46 268 State and local 3235 2878 3488 04 ndash09 02 ndash30 42 130 Revised Census Bureau government finances FY 2006ndashFY 2011 tabulations
for 2005ndash2011 new government finances FY 2012 tabulations for 2011 and 2012
269 Equals Disposable personal income 105079 109372 122458 843 ndash291 2148 1166 2381 2950 270 Less Personal outlays 101906 102665 115584 157 118 522 491 592 981 271 Personal consumption expenditures 97444 98429 111496 ndash279 ndash300 ndash30 ndash138 ndash172 300 272 Personal interest payments 3059 2739 2484 450 440 568 670 800 757 Improved estimates of implicit services of commercial banks and of
mortgage interest paid Improved treatment for the derivation of monetary interest paid on consumer loans Revised FRB interest rate data for 1980ndash2012 revised FRB flow of funds accounts data for 2010 and 2011 new flow of funds accounts data for 2012 revised FRB consumer credit outstanding data for 2010ndash2012 new FDIC data for 2012
273 Personal current transfer payments 1403 1496 1604 ndash14 ndash21 ndash17 ndash40 ndash34 ndash76 274 To government 810 835 885 ndash14 ndash21 ndash17 ndash35 ndash36 ndash30 275 To the rest of the world (net) 593 661 719 00 00 00 ndash05 02 ndash45 276 Equals Personal saving 3172 6707 6874 685 ndash410 1625 675 1788 1969
1 In these descriptions ldquonewrdquo indicates this is the first time that data from the specific source are being incorshyporated into the component estimate for the given year and ldquorevisedrdquo indicates that data from the specific source were incorporated previously and now revised data from that source are being incorporated
2 Revisions reflect the annual revision of BEArsquos international transactions accounts (ITAs) The revised ITA estimates were incorporated into the NIPAs at their ldquobest levelrdquo for 2010ndash2012 As a result there are differences between the NIPA estimates and the ITA estimates for 1999ndash2009 For more information on the revisions to the International Transactions Accounts see Barbara H Berman and Jeffrey R Bogen Annual Revision of the US International Transactions Accounts SUR VEY 93 (July 2013) 43ndash54 Additionally revised estimates for 1999ndash2007 reflect changes previously incorporated into the ITAs but not into the NIPAs because they affected years outside of the periods open for revision including the reclassification of distribution rights for film and teleshyvision recordings and the reallocation of adjustments for low-value imports and for inland freight in Canada and Mexico these changes were incorporated in the previously published NIPA estimates for 2008ndash2012
3 Revisions are not shown because this component was not previously published 4 The statistical discrepancy is gross domestic product (GDP) less gross domestic income (GDI) it is also
the difference between gross national product (GNP) and gross national income (GNI) which is GDI plus net income receipts from the rest of the world The statistical discrepancy arises because the product-side measures of GDP and GNP are estimated independently from the income-side measures of GDI and GNI
NOTE The new treatments of research and development of entertainment literary and artistic originals of ownership transfer costs and of defined benefit pension plans begin with the estimates for 1929 The improved estimates of employersrsquo contributions to state and local government-sponsored defined contribution pension plans begin with 1966 The improved measures of IRS section 179 expensing for sole proprietorships begin with the estimates for 1982 The improved estimates of the implicit services of commercial banks begin with 1985 The improved measures of wages paid by Indian tribal governments begin with the estimates for
1990 The improved methodology for distributing the income of regulated investment companies by type begins with the estimates for 1992 The improved classifications of wind and solar power structures the improved methodology for estimating the adjustment made to remove corporate partnersrsquo income from nonfarm proprietorsrsquo income and the improved estimates of mortgage interest paid begin with 1993 Updated measures of misreporting begin with the estimates for 2002 The improved treatment for the derivation of monetary interest paid on consumer loans begins with the estimates for 1980 For more information on the changes in definitions and in methodologies that were introduced as par t of the 2013 comprehensive revision of the NIPAs see ldquoPreview of the 2013 Comprehensive Revision of the National Income and Product Accounts Changes in Definitions and Presentationsrdquo SUR VEY 93 (March 2013) 13ndash39 and Nicole M Mayershyhauser and Sarah J Pack ldquoPreview of the 2013 Comprehensive Revision of the National Income and Product Accounts Statistical Changesrdquo SURVEY 93 (May 2013) 6ndash14
BEA Bureau of Economic Analysis BLS Bureau of Labor Statistics CCAdj Capital consumption adjustment DHHS Department of Health and Human Services FDIC Federal Deposit Insurance Corporation FRB Federal Reserve Board FY Fiscal year IRS Internal Revenue Service IVA Inventory valuation adjustment NIPA National income and product account OMB Office of Management and Budget USDA US Depar tment of Agriculture
- Improved Estimates of the National Income and Product Accounts Results of the 2013 Comprehensive Revision
-
- Annual Current-Dollar Estimates
-
- Domestic income and product (account 1)
-
- Product-side components
-
- Box Government Research and Development
-
- Income-side components
-
- Private enterprise income (account 2)
- Personal income and outlays (account 3)
- Government current receipts and expenditures (account 4)
- Foreign transactions (accounts 5 and 7)
-
- Box Discontinuities in the Estimates of Foreign Transactions in the National Income and Product Accounts
-
- Domestic capital (account 6)
-
- Annual Estimates of Real GDP and Real DPI
-
- Real GDP
- Real DPI
-
- Annual Prices
- Quarterly Real GDP
- Box New and Revised Source Data
- Box Data Availability
- Box Acknowledgments
-
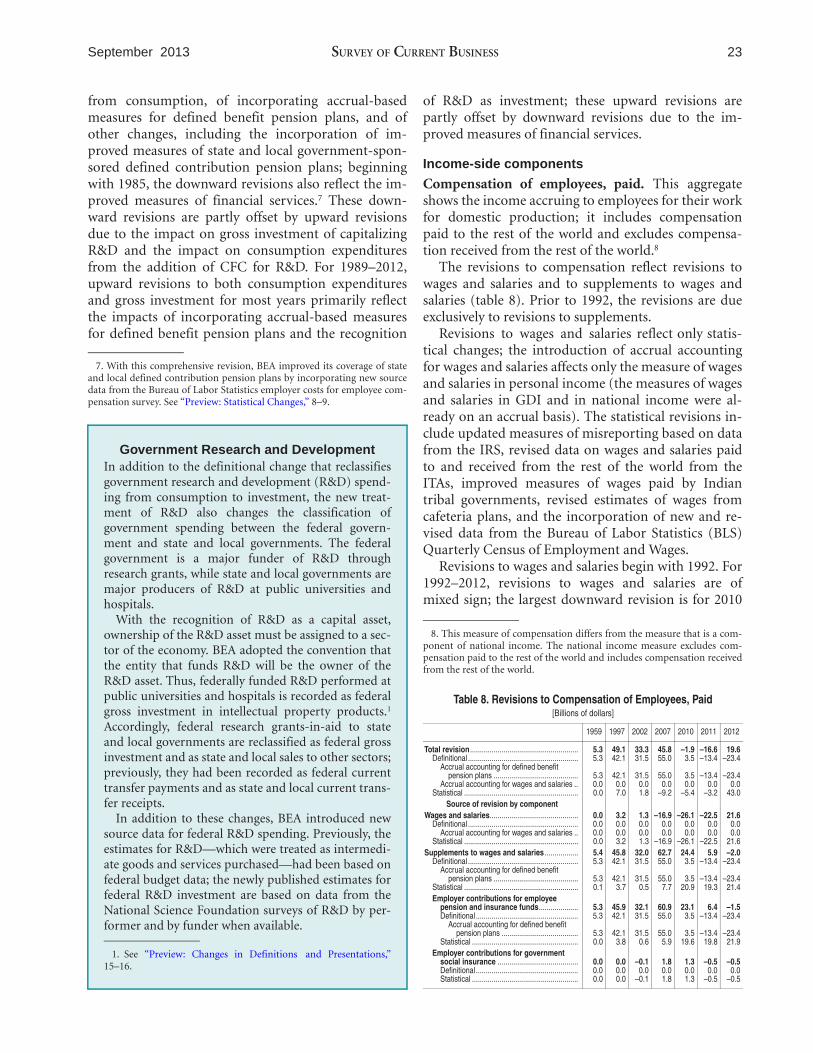
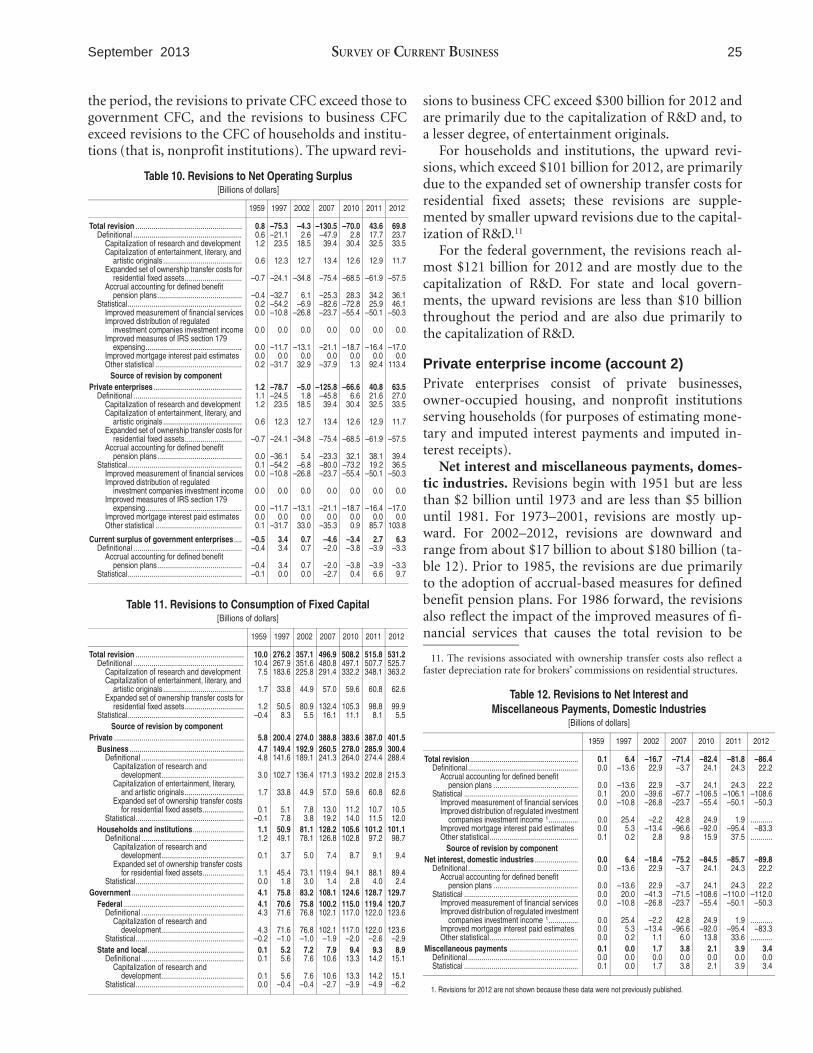
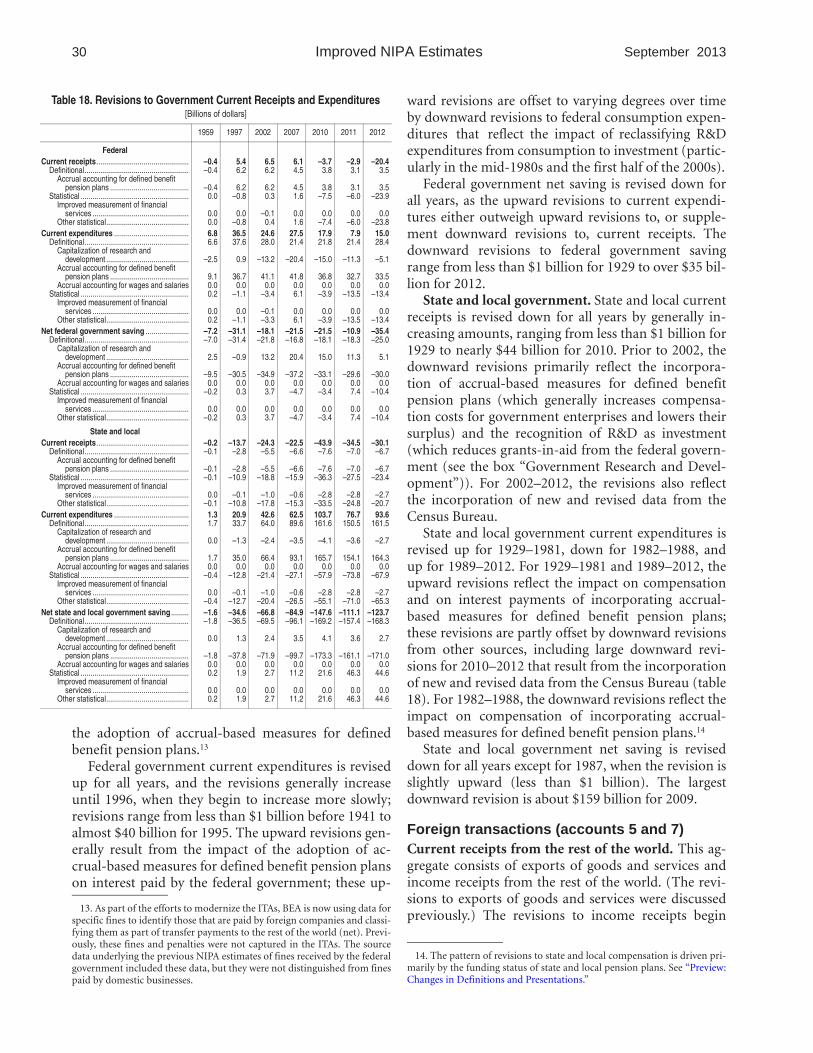
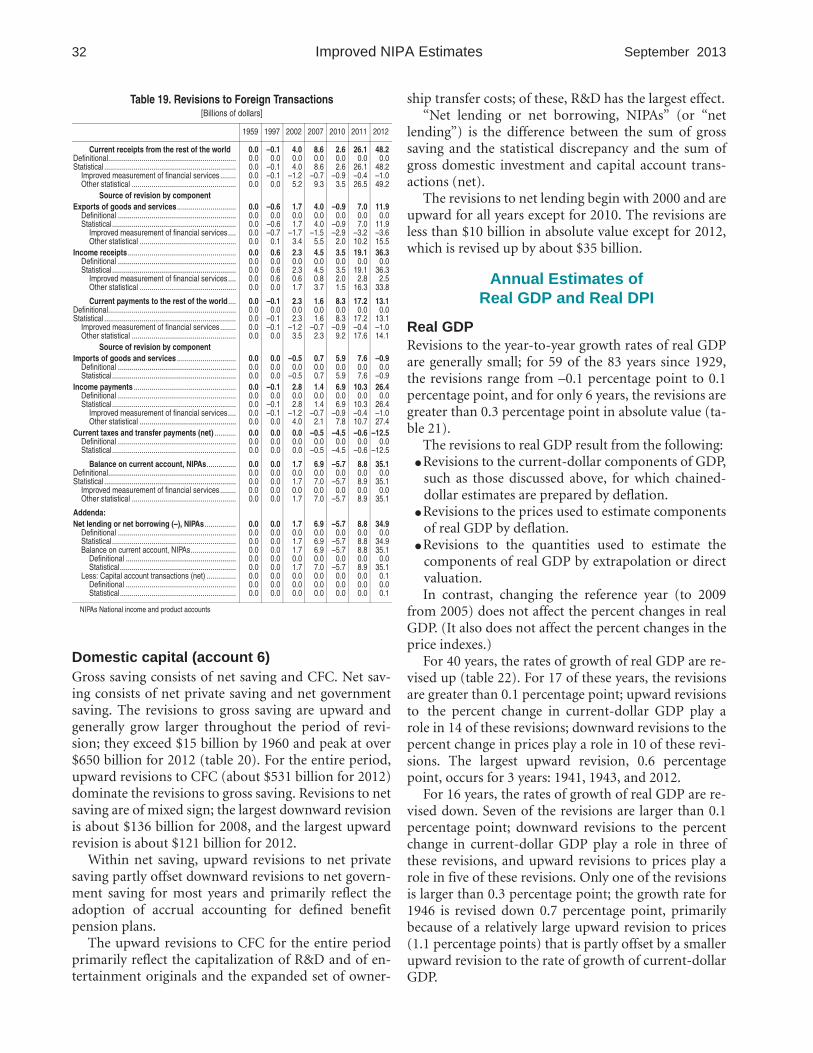
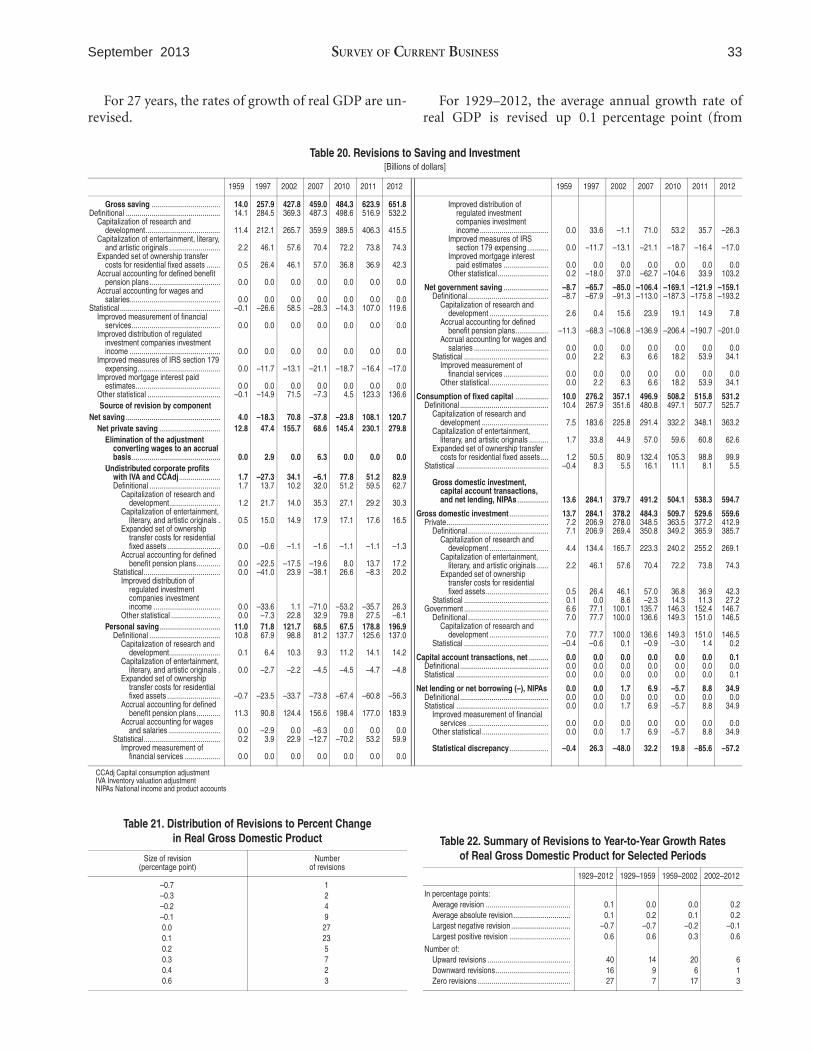
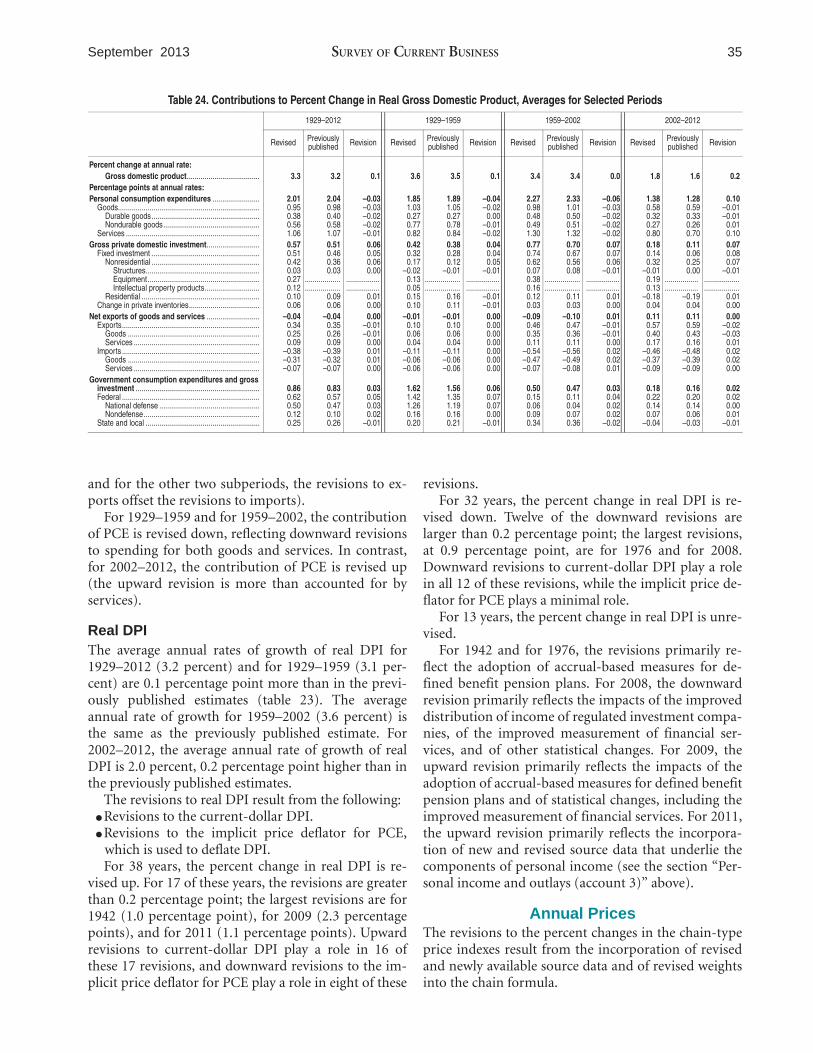
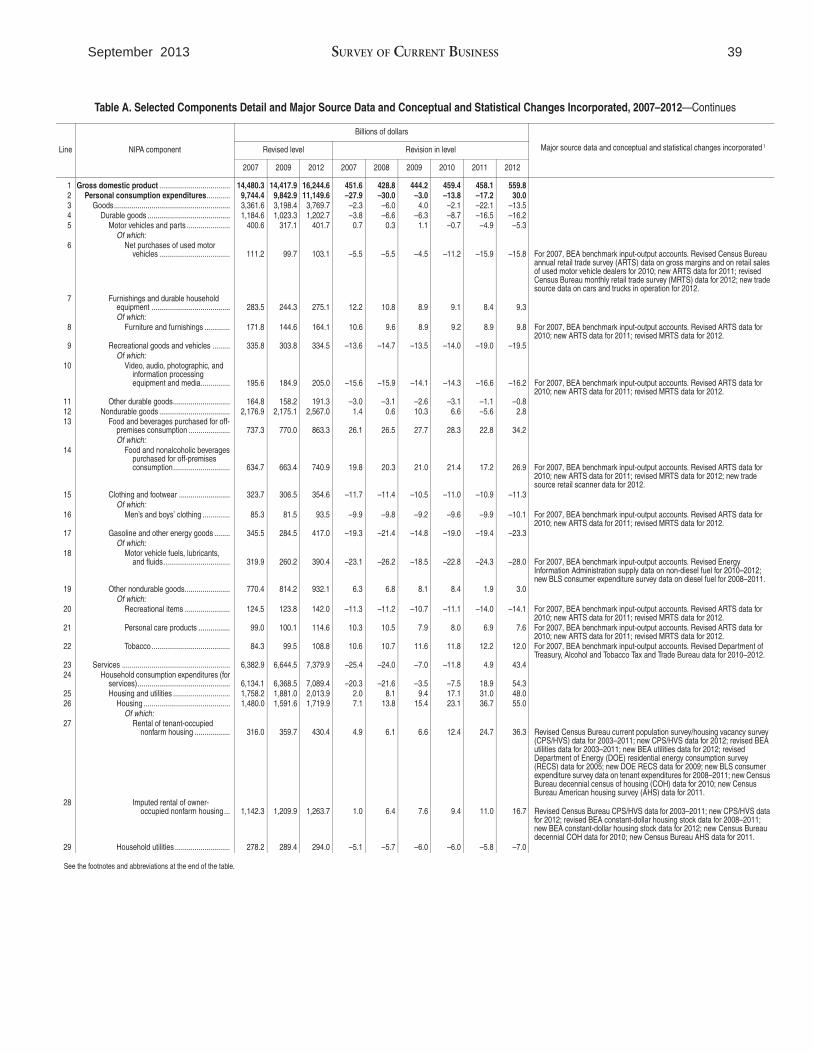
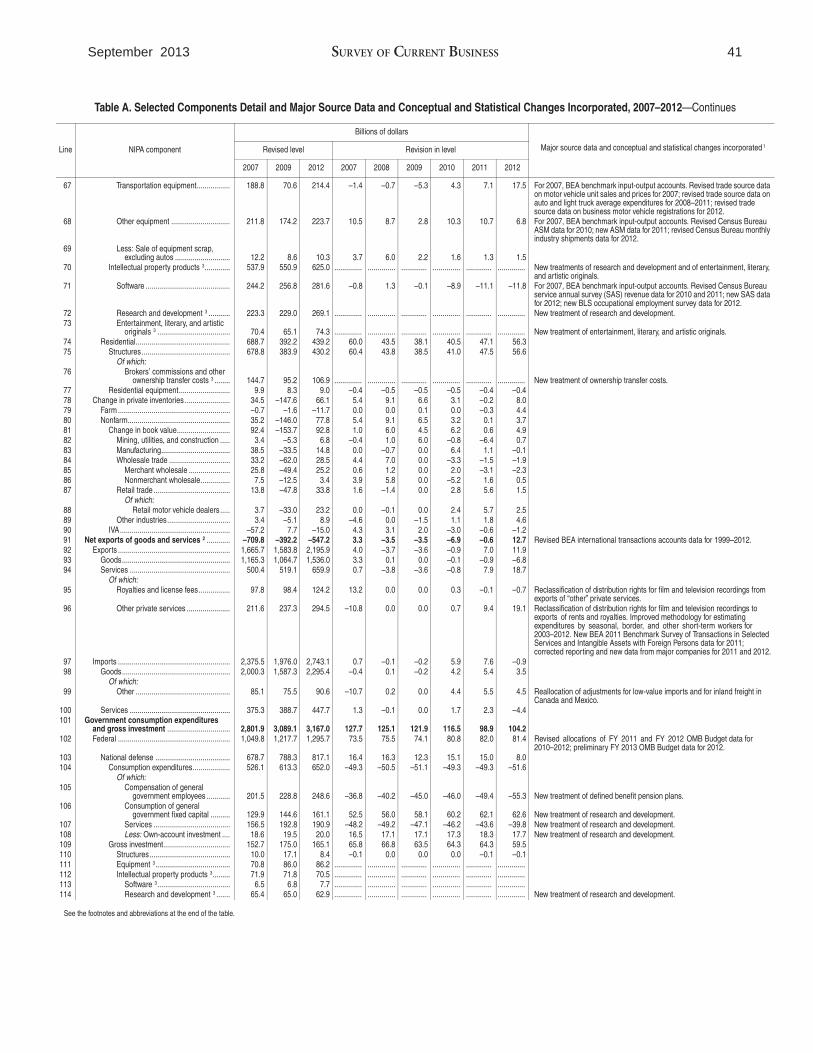
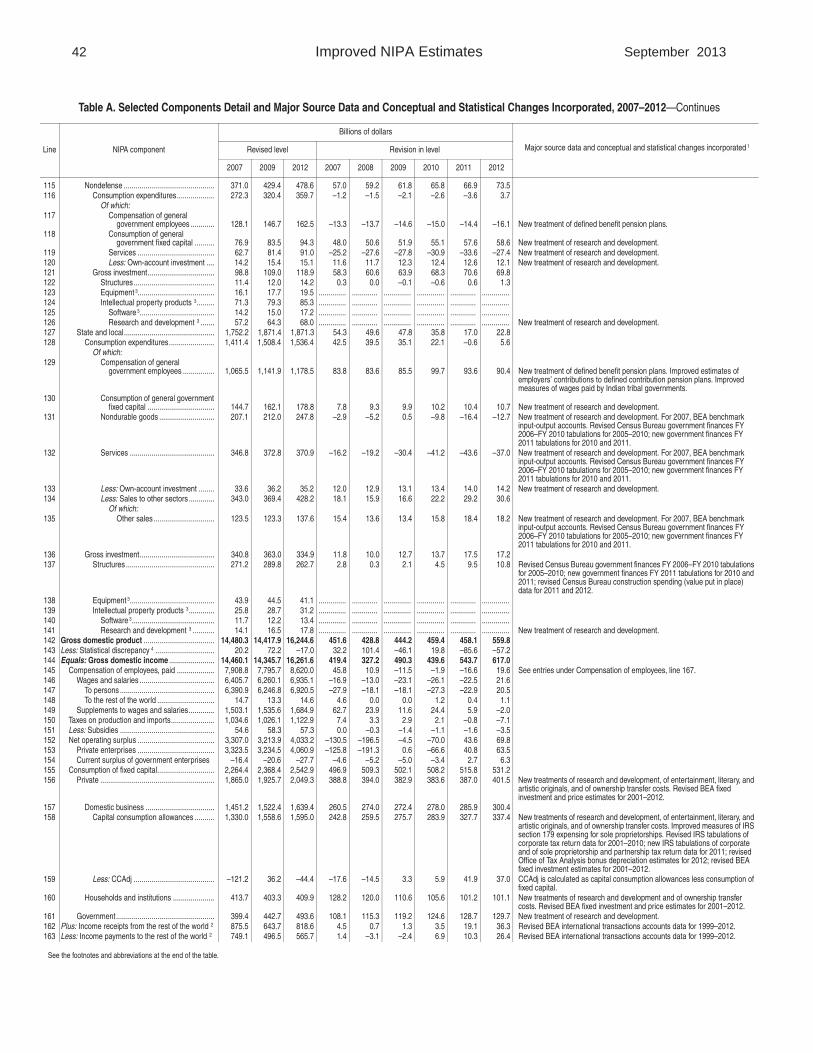
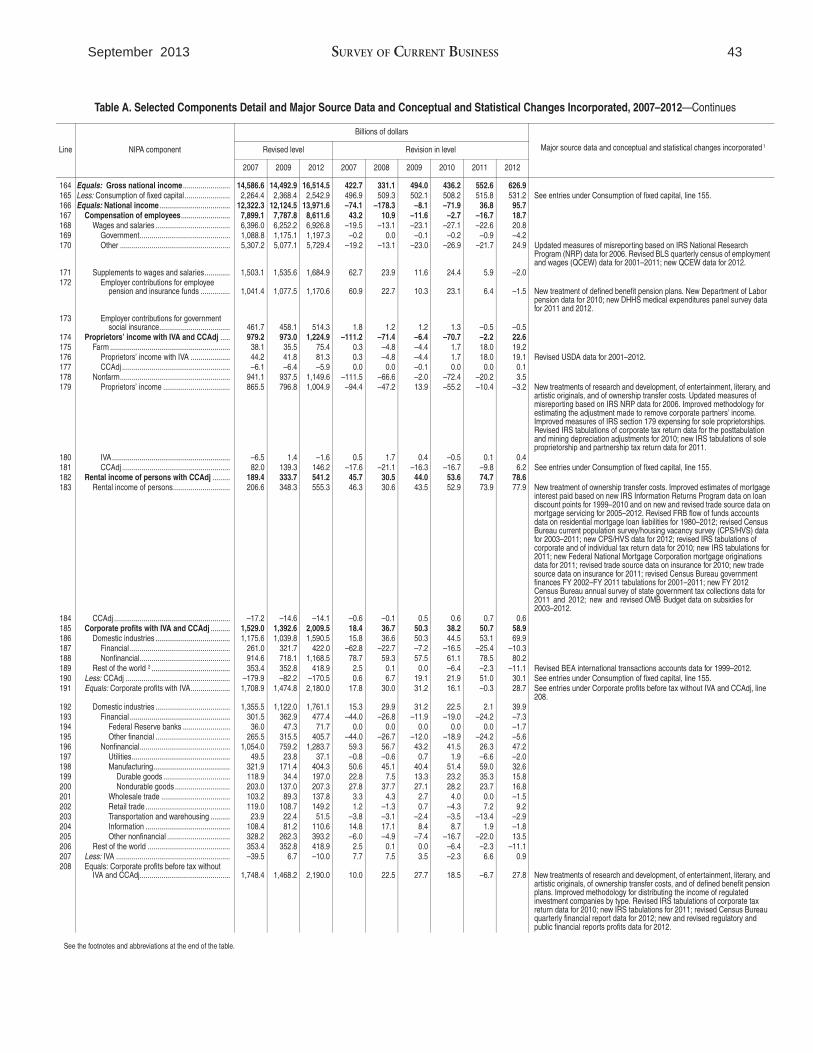