improved 3d heart segmentation using surface parameterization … · 2017-11-29 · manual...
TRANSCRIPT

Improved 3D Heart Segmentation Using Surface Parameterization
for Volumetric Heart Data
A Thesis
Submitted to the Faculty of the
WORCESTER POLYTECHNIC INSTITUTE
in partial fulfillment of the requirements for
the degree of Master of Science
in
Electrical & Computer Engineering
by
Baoyuan,Xing
May 2013
APPROVED:
Prof. Michael A Gennert, Major Thesis Advisor
Prof. Taskin Padir, Thesis Committee
Prof. Matthew Ward, Thesis Committee

Abstract
Imaging modalities such as CT, MRI, and SPECT have had a tremendous impact on
diagnosis and treatment planning. These imaging techniques have given doctors the
capability to visualize 3D anatomy structures of human body and soft tissues while
being non-invasive. Unfortunately, the 3D images produced by these modalities often
have boundaries between the organs and soft tissues that are difficult to delineate due to
low signal to noise ratios and other factors. Image segmentation is employed as a
method for differentiating Regions of Interest in these images by creating artificial
contours or boundaries in the images. There are many different techniques for
performing segmentation and automating these methods is an active area of research,
but currently there are no generalized methods for automatic segmentation due to the
complexity of the problem. Therefore hand-segmentation is still widely used in the
medical community and is the “Gold standard” by which all other segmentation
methods are measured. However, existing manual segmentation techniques have
several drawbacks such as being time consuming, introduce slice interpolation errors
when segmenting slice-by-slice, and are generally not reproducible. In this thesis, we
present a novel semi-automated method for 3D hand-segmentation that uses mesh
extraction and surface parameterization to project several 3D meshes to 2D plane . We
hypothesize that allowing the user to better view the relationships between neighboring
voxels will aid in delineating Regions of Interest resulting in reduced segmentation
time, alleviating slice interpolation artifacts, and be more reproducible.
Keywords - segmentation, surface parameterization, triangulated mesh, marching
cube, MRI

Acknowledgements
I take this opportunity to express my gratitude to all the people who have helped and
inspired me during my master studies.
I wish to thank, in the first place, my research advisor, Prof. Michael A Gennert for
his guidance during my research and studies at WPI. Especially, his funding supports
in the summer. With his enthusiasm and his rigorous attitude for academia, he showed
me what and how the research is different from the course study. This thesis would
not have been possible without his advice and encouragement.
Then, my sincere thanks also go to rest of my thesis committee: Prof. Matthew Ward
and Prof. Taskin Padir, for taking time out of their extremely busy schedule, and for
their insightful comments.
In particular, I owed much thanks to the mentors of this thesis, Dr. Cliff Lindsay and
Dr. Michael A King from UMass Medical School. Dr. Cliff Lindsay is another
cooperated researcher in this work. We design the whole method together and he
proposed some important advice. In addition, he help me with much medical
knowledge about heart and understanding of MRI techniques.
Last and most importantly, I wish to thank my parents, Yuhua Xing and Yongping
Guo, for giving birth to me, supporting me, and loving me. I also would like to share
this with my lovely little brother Lucas and other relatives.

Contents
Abstract ..................................................................................................................................... 2
Acknowledgements ................................................................................................................... 3
Contents .................................................................................................................................... 4
Lists of Figures and Tables ......................................................................................................... 6
I. Introduction ............................................................................................................................ 7
II. Overview of Segmentation Techniques ............................................................................... 11
2.1) Rule-based method ...................................................................................................... 11
2.2) Atlas-based method ..................................................................................................... 12
2.4) Manual Segmentation .................................................................................................. 13
III. Marching Cube Algorithm .................................................................................................. 15
3.1) Isovalue and Isosurface ................................................................................................ 15
3.2) Anisotropic Diffusion Filter for Smoothing .................................................................. 15
3.3) Marching Cube Algorithm ............................................................................................ 16
IV. Surface Parameterization ................................................................................................... 18
4.1) Surface Parameterization ............................................................................................. 18
4.2) Measurement of surface parameterization ................................................................. 18
V. Improved 3D Heart Segmentation Algorithm ..................................................................... 21
5.1) Stage One : Extraction of mesh from volumetric data ................................................. 22
5.1.1) Denoise and smooth for volume ........................................................................... 22
5.1.2) Mesh extraction by Marching Cube and approximated mesh validation ............. 23
5.2) Stage two: Refinement for meshes using projected 2D maps ..................................... 27
5.2.1) Project from 3D mesh to 2D map using surface parameterization....................... 27
5.2.2) Interact with isosurface in 2D instead of in 3D ..................................................... 28
5.2.3) Feature calculation for parameterized map ......................................................... 29
5.2.4) Revalidation in statistics for both approximation and refined surface ................. 32
VI. Experiments and Evaluation ............................................................................................... 34
6.1) Datasets used in the study ........................................................................................... 34
6.2) Experiments and evaluation in statistics ...................................................................... 35

VII. Implementation ................................................................................................................. 41
VIII. Conclusion and Future work ............................................................................................ 42
References ............................................................................................................................... 44
Appendix. A – MRI and MRI Scanner ....................................................................................... 48
Appendix. B – Optimized Coherence-Enhancing Diffusion ..................................................... 49

Lists of Figures and Tables
Figure 1[18]
: Organ segmentation in sagittal MRI .................................................................... 7
Figure 2: Outer surface and inner surface of heart (Original Image Courtesy of Google
BioDigital Human) ............................................................................................................ 9
Figure 3: Region growing for segmentation (Original Image Courtesy of Cardiff School) ... 11
Figure 4[26]: Atlas-based segmentation for mouse embryo ..................................................... 13
Figure 5[25]
: Segmentation for of a mid-ventricular short axis slice in end-diastole and
end-systole ....................................................................................................................... 14
Figure 6: A simple case in Marching Cube (Original Image Courtesy of MIPAV Wiki) ......... 16
Figure 7[29]
: Cases of Marching Cubes ................................................................................... 17
Figure 8[6]
: Conformal mapping ............................................................................................. 19
Figure 9: Flow of proposed method ........................................................................................ 21
Figure 10: Median and coherence-enhancing diffusion filter applied for volume .................. 23
Figure 11[2]
: histogram of a typical cardiac MRI volume ....................................................... 24
Figure 12: histogram of cardiac MRI from a volunteer .......................................................... 24
Figure 13: volume for extracted meshes with various isovalue .............................................. 26
Figure 14: Extracted meshes by Marching Cube from volume with various isovalue. ........... 26
Figure 15: "Tri-Map" of approximated surfaces ..................................................................... 27
Figure 16: 3D mesh and its Authalic (middle) and LSCM parameterization(right) ............... 28
Figure 17: Refinement on "2D" map and its reconstruction ................................................... 29
Figure 18: 3D mesh and its parameterization, colorized by normal ...................................... 30
Figure 19: Gradient of volume and its mapping on parameterized surface ........................... 31
Figure 20 Local density of volume and its mapping on parameterized surface ...................... 32
Figure 21: Outer surface and inner surface of XCAT phantom .............................................. 33
Figure 22: Histograms of MRI from volunteers and its iso-values selection .......................... 35
Figure 23: Volume of MRI simulation and its histogram with iso-values selection ................ 36
Figure 24: Parameterized 2D map colorized by gradient of volume and area to be modified
......................................................................................................................................... 36
Figure 25: Approximated (left) and refined(right) inner surface of cardiac muscle ............... 37
Figure 26: Volume of raw MRI, segmented cardiac muscle, and X-CAT muscle wall ............ 38
Figure 27: User Interface of RefineMesh ................................................................................ 41
Table 1: Total heart volume during cardiac cycle and related parameter .............................. 25
Table 2: Volume of approximated iso-surfaces........................................................................ 35
Table 3: Performance of segmentation for MRI simulation .................................................... 37
Table 4: Performance of segmentation for MRI of volunteer M001 ....................................... 39
Table 5: Performance of segmentation for MRI of volunteer M009 ....................................... 39
Table 6: Performance of segmentation for MRI of volunteer M012 ....................................... 40
Table 7: Averaging performance of segmentation for three volunteers .................................. 40

I. Introduction
In medicine, segmentation for medical imaging is very important tool for diagnosis
and therapy planning. Recently in the medical imaging community, a fair amount of
research has gone into creating semi-automated and automated algorithms for
segmentation with mixed success. Most of these methods are highly specialized to
specific Regions-of-Interest (ROI) and therefore rely on specific features of data that
exist only in that region. However, developing a general method for automatic
segmentation of 3D medical image datasets is still an active area of research. In most
cases though, manual slice-by-slice segmentation is still used extensively to the
medical community, and it is regarded as the “Gold-standard” with which all methods
are compared. Unfortunately, hand-segmentation for 3D volume is very labor
intensive, can be difficult to reproduce, and interpolating the segmented slice often
introduces artifacts into the data. Figure 1 shows organ segmentation in sagittal view
of MRI from UMass Medical School, which costs almost a whole week to
accomplish.
Figure 1[18]
: Organ segmentation in sagittal MRI
Traditional hand segmentation of medical volumetric datasets is typically performed
by delineating the boundaries of ROI at each slice of the datasets, then interpolating
the slices to generate 3D volumes. These datasets typically have 50-100 slices or more
and can contain noisy and low contrast data, which make it difficult to relate
inter-slice regions and take hours to perform [18]. In this thesis, we develop a new

method for semi-automated segmentation that reduces time cost while allowing
manual refinement, to be more reproducible compared to traditional hand
segmentation. Additionally, our method prevents inter-slice artifacts that result from
segmenting ROI within each 2D slice and interpolating to create 3D volume datasets.
In this thesis, we propose a two-stage approach, which first performs an approximate
segmentation automatically, by generating isosurface of the ROI using Marching
Cube algorithm with a histogram-based analysis to set isovalues. In our second stage,
we are able to perform refinement manually for approximated isosurfaces from a
whole view of ROI by transforming a 3D isosurface to 2D using a Least Squares
Conformal Mapping (LSCM) [6] surface parameterization. With 2D maps, users
could draw contours or useful marks and interact with them for refinement. In essence,
our second step flattens the approximation and allows the user to see the entire ROI
and its features simultaneously without any folds, gaps and occlusion from common
3D perspective. Previous researches [21, 22, 23] have demonstrated that 2D views can
be more precise and efficient for users to gauge relative position and spatial locations
features than in 3D view for certain tasks like 3D selection and 3D objects location
due to 2D view omitting perceptual cues that do not aid in these tasks such as
occlusions, non uniformity, and perspective[15]. Additionally, it has also shown that
there is an inherent difficulty with interacting with objects in 3D space and
performing 3D operation using 2D interaction techniques, in particular for our case
drawing 3D contours and interaction with it. Although these tasks are different from
segmentation, they are similar in many respects. Therefore, it should be more efficient
and reproducible to perform refinement in 2D where the user can visualize the whole
of complex structure.
This work primarily focuses on the cardiac muscles, so the segmented volume
consists of two surfaces, which outline the outer and inner surface of cardiac muscles
(shown as Figure 2). MRI volumetric data that will be used in this work will contain
low-contrast and noisy voxels, therefore in Stage 1 of our method we perform a

pre-processing of the data to denoise and smooth prior to creating isosurfaces of
cardiac muscles.
Figure 2: Outer surface and inner surface of heart (Original Image Courtesy of Google
BioDigital Human)
This pre-processing increases the contrast of edge/boundary information of the
volume and smoothes the volume. Next, based on histogram analysis, we select
several isovalues to approximate the outer and inner surface of cardiac muscles by
extracting triangulated meshes from volume by Marching Cube algorithm. To validate
such isosurfaces approximation primarily, we exploit the method outlined in [19],
which calculates the volume of the approximation, to compare with the volume range
from published paper. Then the approximated meshes are used in Stage 2 in our
method, by being projected to a 2D image using LSCM surface parameterization.
Features calculated from approximated meshes and original volume, such as gradient
of the volume, the normal of mesh surface, are mapped on such 2D maps as colors.
The hints from color are used to refine the approximation. We implement a custom
program with a user interface (UI) based on mesh operation that allows users easy to
perform refinement. Then the refined mesh are projected back to 3D and are
compared with the Gold Standard using a Dice's similarity coefficient (DSC) [20], as
well as other statistic index for re-validation and evaluation.
The remainder of the thesis is organized as follows. Overview of previous
segmentation principles and algorithms along with limitations are demonstrated in
Section 2. In Section 3 and 4, we introduce two basic techniques, Marching Cube and

Surface parameterization, applied in our proposed method. Then step-by-step
introduction of our improved method is listed in Section 5. In Section 6, experiments
and results are presented and summarized. Implementation of our method is briefly
described in Section 7. Finally, we conclude this thesis and propose some future work
in Section 8.

II. Overview of Segmentation Techniques
In this section, some important previous work of segmentation techniques will be
reviewed. This review aims at pointing out the limitation of automated/hand
segmentation techniques to seek improvement.
In recent years, many researchers addressed different segmentation techniques for
medical images [13]. Such techniques could be divided into two categories:
automated segmentation and manual segmentation. In the following two automated
segmentation methods are introduced in details since their ideas are applied in our
proposed approach. And manual segmentation as "Gold Standard" in clinic medicine
is very important to review.
2.1) Rule-based method
The most basic automated segmentation techniques is Rule-based methods, such as
threshold selection, region growing, and marching square, etc. These techniques are
usually based on any kind of heuristic rule to segment the image/volume, by which it
can determine the pixels/voxels inside ROI or not. Representative technique of
rule-based method is region growing. After seeding, iteratively pixels are determined
if they are in the ROI along growing directions (shown in Figure 3).
Figure 3: Region growing for segmentation (Original Image Courtesy of Cardiff School)

Moreover, in order to investigate more characteristics of medical volume, features
calculation is investigated in previous work. These features also are exploited for
feature-rule based segmentation. Some classic features are demonstrated to
characterize volume in both 2D and 3D. In [21], gradient of 3D volume is claimed to
be of fundamental value for image analysis, segmentation, visualization and many
other tasks. Clustering related algorithms like K-means clustering, spectral clustering
are also used in 3D segmentation [23]. Histogram is graphical representation of the
distribution of data. Analysis of histogram in imaging is a very important method to
figure out the composition of images. In [22], authors present an approach to perform
segmentation using histogram thresholding with fuzzy sets.
However, it is impossible to accomplish medical segmentation only by ruled-based
techniques in most cases, because it is very sensitive to noise and hard to segment
complex 3D anatomical structure. In particular, usually there is much noise in MRI of
heart with low contrast.
2.2) Atlas-based method
Atlas-based segmentation [13] is more efficient and popular applied in medical image.
For each target, medical images are used for training to generate an atlas model.
When performing segmentation, atlas is used to register the original image volume.
Therefore, atlas-based segmentation could depict prototypical location and shape of
anatomical structure together with spatial relations (shown in Figure 4). The accuracy
of atlas-based segmentation usually replies on elastic registration so it is time
consuming. In addition, the time to construct the atlas is quite considerable, since
adequate images should be used to train the atlas for the organs.
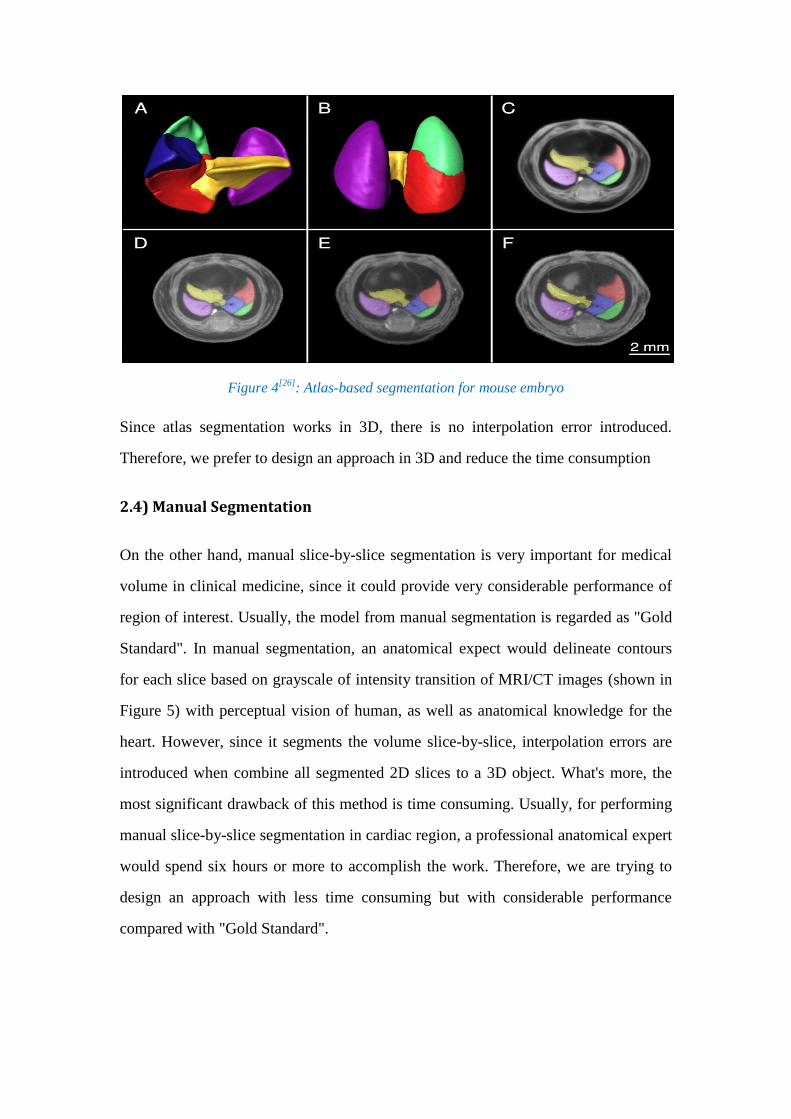
Figure 4[26]
: Atlas-based segmentation for mouse embryo
Since atlas segmentation works in 3D, there is no interpolation error introduced.
Therefore, we prefer to design an approach in 3D and reduce the time consumption
2.4) Manual Segmentation
On the other hand, manual slice-by-slice segmentation is very important for medical
volume in clinical medicine, since it could provide very considerable performance of
region of interest. Usually, the model from manual segmentation is regarded as "Gold
Standard". In manual segmentation, an anatomical expect would delineate contours
for each slice based on grayscale of intensity transition of MRI/CT images (shown in
Figure 5) with perceptual vision of human, as well as anatomical knowledge for the
heart. However, since it segments the volume slice-by-slice, interpolation errors are
introduced when combine all segmented 2D slices to a 3D object. What's more, the
most significant drawback of this method is time consuming. Usually, for performing
manual slice-by-slice segmentation in cardiac region, a professional anatomical expert
would spend six hours or more to accomplish the work. Therefore, we are trying to
design an approach with less time consuming but with considerable performance
compared with "Gold Standard".

Figure 5[25]
: Segmentation for of a mid-ventricular short axis slice in end-diastole and
end-systole

III. Marching Cube Algorithm
In order to avoid slice-by-slice processing in our proposed method, we deploy classic
3D segmentation technique Marching Cube [1] to segment the volume approximately
in the first place. Some important terms and classic Marching Cube are presented here
before introducing our improved method in details.
3.1) Isovalue and Isosurface
In Marching Cube, the pre-fixed threshold is necessary. Isovalue/isosurface are some
basic concepts used. They are involved to selected pixels/voxels or surface within a
volume.
An isovalue is the set of points with equivalent value in a dataset/volume, i.e.
Isovalue: { }
Isovolume: { }
An isosurface is the surface generated from an isovalue/isovolume, i.e.
Isosurface: { }
In essence, isosurface is generated from an isovolume, by surface generation
algorithm like triangulation/quadrangulation.
3.2) Anisotropic Diffusion Filter for Smoothing
Since Marching Cube algorithm is a kind of rule-based techniques, the importance of
denoising for CT/MRI images to accomplish the segmentation is discussed and
proven in previous work. There are many techniques for smoothing proposed in the
past, such as median filter, Gaussian filter, Laplacian smoothing, etc. In addition,
filtering with edges preserving had been proposed in previous works. In[10], C.
Tomasi et al demonstrated non-linear bilateral filter with two Gaussian core to smooth
the image/volume and preserve the edge information. Perona et al. [9] introduced an

alternative to non-linear filter that they called anisotropic diffusion, by introducing a
diffusion tensor. It is closely related to the earlier work of Grossberg [11].
In our study, we will apply a optimized anisotropic diffusion filter, which combines a
anisotropic diffusion filter [8] with orientation analysis in terms of the structure tensor
(second-moment matrix) [9, 16]. The tensor allows anisotropic smoothing by perform
along the better structure direction, which could preserve the edge information better
than original anisotropic diffusion filter. Detail formula derivation is presented in
Appendix. B.
3.3) Marching Cube Algorithm
The main idea of marching cubes algorithm is a two-step discretisation of the
isosurface.
Subdivision of the volume
In Marching Cube, the rendering volume is discretised into cube-shaped, where each
cube consists of twelve edges and eight vertices. Index for vertices and edges of each
cell is computed and then the values of volumetric data are allocated to each vertex.
Therefore, vertex potentials can be classified into two groups: less or equal to
isovalue/ isosurface and above the isovalue/isosurface shown in Figure 6.
Figure 6: A simple case in Marching Cube (Original Image Courtesy of MIPAV Wiki)

In Marching Cube, it defines 28=256 different vertex distribution, which corresponds
to 256 possible intersection of a surface to each cube. Two different symmetries of the
cube reduce the problem from 256 cases to 14 patterns, shown in Figure 7. For each
case, the index based on state of vertices is created then.
Figure 7[29]
: Cases of Marching Cubes
Triangulation of intersection surface
The intersection of the isosurface with the edges of the cube defines points of
intersection. These crossing points on the cube edges are computed by linear
interpolation between the vertex potentials. The next step in marching cubes
calculates a unit normal for each triangle vertex. Then such normal can be used for
rendering to produce Gouraud-shaded images and are linearly interpolated along the
edges.
In recent years, improved or optimized marching cubes algorithm already had been
addressed by many researchers. Lopes and Brodlie [12] improved marching cubes
algorithm by improving the representation of the surface in the interior of each grid
cell. Sergey V. Matveyev [3] had focus on the ambiguity problem in MC algorithm.

IV. Surface Parameterization
To reduce time-consuming problem of manual segmentation, we are trying to
approximately perform segmentation in 3D by Marching Cube algorithm and then
refine it. However, refine the approximation in 3D is not intuitive and hard to operate.
Therefore, we propose transform 3D object to 2D plane using surface
parameterization for convenience and quickness.
4.1) Surface Parameterization
Parameterization is a mathematical process involving the identification of a
set of coordinates. In our thesis, we just need the parameterization of a surface, which
implies identification of a set of coordinates that allows one to uniquely identify any
point on 3D triangulated surface with an ordered list of numbers.
We introduce some basic theory of mappings from Kreyszig [20, Chap. VI]. Suppose
a surface has the parametric representation
, where points in some domain . Therefore each of the coordinates can be
defined parametrically in a 2D plane. Parameterizing a surface amounts to finding a
one-to-one mapping from a suitable domain to the surface.
4.2) Measurement of surface parameterization
Since surface parameterization could map 3D object to 2D domain, the deformation
should be measured. A reasonable and helpful mapping is the one, which minimizes
either angle distortions (conformal parameterization) or area distortions in some sense.
In the following, we will start with the conception of conformal parameterization and
one of representative algorithm.
Conformal Parameterization and Least Square Conformal Mapping

In general, a conformal map can be viewed as locally isotropic mapping. As shown in
Fig 8, a function mapping a domain to a surface is conformal if for each
the tangent vectors to the iso- and iso- curves passing through are
orthogonal and have the same norm, which can be written[6]
as:
where denotes the unit normal to the surface.
Figure 8[6]
: Conformal mapping
The Least Squares Conformal Maps (LSCM) parameterization method was
introduced by L evy et al. [6]. It refers to an approximate conformal method but has a
free border (using two vertices to be constrained to obtain a unique solution), which
minimize conformal distortion. Although it is not a completely conformal mapping
technique, free border might make more sense for comparison in our work.
We consider the restriction of to a triangle and apply the conformality criterion
to the inverse map (i.e. the coordinates of the points are given and
we want their parameterization). In the local frame of the triangle, Equation (1)
becomes
, where has been written using complex numbers, i.e. . By the theorem
on the derivatives of inverse functions, this implies that

, where (This is a concise formulation of the Cauchy- Riemann
equations.)
Since this equation can't in general be strictly enforced, we minimize the violation of
the conformality condition in least squares sense, which defines the criterion [6]:
Summing over the whole triangulation, the criterion to minimize is then:
By minimizing , we make sure angle distortion from surface parameterization is
optimally reduced. Further details on LSCM parameterization we refers to [6].

V. Improved 3D Heart Segmentation Algorithm
In this section, we will present our two stages method in details. The objective of our
proposed system is to solve the problems of manual slice-by-slice segmentation for
medical images. Such problems are time consuming, irreproducible, combination
errors, etc as mentioned above. We provide an improved 3D segmentation method for
cardiac muscles based on Marching Cube algorithm and surface parameterization.
Overview of proposed method
The goal of our proposed method is to seek an
approach of segmentation, easy to use, without
lots of errors, and non-labor-intensive. Since
almost no previous automated approaches could
accomplish 3D segmentation precisely, we
propose we could obtain approximated 3D
segmentation and then refine it. However, 3D
operation is non-intuitive with occlusion,
perceptually non-uniform, poor sense of relative
position. Therefore, instead of performing
refinement in 3D, we are trying to project 3D
object to 2D with ease of view and operation.
Therefore, the proposed solution that combines
3D segmentation and 2D operation, which
reduces time consuming and eliminates
slice-by-slice errors. In order to perform 3D to 2D
projection, we would ignore data in the volume
that is not in the ROI by analysis of histogram of
volumetric data. After analysis of histogram of
data, we could figure out several surfaces, which
Figure 9: Flow of proposed method

include the ROI and generate related approximated 3D triangular meshes using
Marching Cube algorithm. Then the approximated meshes are projected to 2D by
surface parameterization. Intuitively, we cut the 3D triangulated meshes and then
flatten them to achieve 3D to 2D projection. Finally, for refining the approximation to
make it closer to expected one.
In general, we propose and implement a two-stage system to complete segmentation
for 3D volume of heart (shown in Figure 9) :
1) Approximate segmentation by mesh extraction from volume;
2) Refine for approximated mesh using projected 2D mesh.
5.1) Stage One : Extraction of mesh from volumetric data
Since 3D volumetric data/voxel is difficult to project into 2D plane without data loss,
we need to find ROI-related surface that it is possible to project to 2D. So we extract
surfaces from volume using triangulated mesh by Marching Cube algorithm. Since
Marching Cube algorithm is a rule-based method, it is very important to find
appropriate isovalues as the rule. The appropriate isovalues should provide surfaces to
approximate to the ROI of ideal segmentation. In our method, histogram analysis for
volumetric data is the base for appropriate isovalue selection. Meanwhile, since
Marching Cube algorithm is sensitive to noise, a pre-processing of denoise is applied
for clearance.
5.1.1) Denoise and smooth for volume
Noise in MRI volume would dramatically deteriorate the quality of approximated
meshes from Marching Cube. In order to extract triangulated mesh approximation
with considerable quality, it is necessary to denoise for the volume in the first place.
In previous work, much algorithm for denoise is addressed and demonstrated in [7] [8]
[39] [12]. In our method, a 3D median filter within 2-2-2 space is applied to sweep
Salt and Pepper/ flipped voxel noises. Subsequently the data will pass

coherence-enhancing anisotropic diffusion filter, which could smooth the data with
preserving edges, introduced in Section 3.2 and Appendix. B. Figure 10 shows the
results of applied filters for a slice of a heart MRI data in sagittal plane. The left
shows the raw slice. The middle shows the result after median filter. The right shows
the result after anisotropic diffusion filter.
Figure 10: Median and coherence-enhancing diffusion filter applied for volume
5.1.2) Mesh extraction by Marching Cube and approximated mesh validation
With filtered volumetric data, Marching Cube Algorithm is used to create meshes. As
mentioned in Section 3.3, an appropriate isovalue is fixed before performing mesh
extraction. Expected approximations should be no holes and flipped pieces, as well as
has volume consistent with published papers, which ensure the extracted mesh close
to ideal segmentation approximately. Therefore, we first analyze the statistics of the
filtered volume data as reference of selecting isovalues for mesh extraction.
In [24], related work for MRI data histogram is published. The histogram of typical
cardiac MRI is shown in Figure 11, where the cardiac muscles (myocardium), blood
pool of heart are corresponding to different intensity value of MRI volume. Therefore
we approximately separate the cardiac muscles from MRI of heart by selecting voxels
from windowed histogram.

Figure 11[2]
: histogram of a typical cardiac MRI volume
Figure 12 is the example of histogram of cardiac MRI from real data. Based on the
histogram and the published Figure 4.1.3, we choose threshold isovalue for isosurface
extraction from 25 to 160 to create triangulated meshes. In our work, we just focus on
cardiac muscles, which consist of voxels between two surfaces (shown as red double
arrow in Figure 12, the expected surface of muscles might not be in single grayscale
intensity). Therefore we will select four isovalues (shown as green line in Figure 12)
to generate four isosurfaces, which should lay the voxels of expected two surfaces in
between.
Figure 12: histogram of cardiac MRI from a volunteer

For more accurate estimation of the four surfaces mentioned before, we in the first
place investigated datasets of MRI and created mesh samples with different isovalues
increased by 10. Through the statistical analysis of geometric attributes for such
sample meshes, we are able to obtain hints for finding needed isovalues for
approximation cardiac muscles.
From the statistics of [2], published in American Physiological Society, the total
volume of heart for males has a mean round 778 55 cm3
(shown in Table 1)
Table 1: Total heart volume during cardiac cycle and related parameter
So we will first validate the approximated triangulated mesh by volume estimation. In
order to estimate the volume of meshes, to confirm the extracted mesh with no holes
is necessary. In [4], it defines the projected volume of a mesh, and discusses the
properties of projected volume. It hints that if the difference between volume and
projected volume is greater than 0.1% volume, this should identify a problem: either
the mesh is not closed or the mesh contains triangle that are flipped.
Figure 13 shows the estimated volume of created sample meshes by the increment of
isovalues and the approximated isosurface are shown as green line. It indicates
calculated volume of approximated meshes is in the published heart volume range of
Table 1. Therefore, through such analysis we could have a basic confirmation the
voxels in the 'valley' of histogram are approximately closed to the cardiac muscles.

Figure 13: volume for extracted meshes with various isovalue
The following Figure 14 gives created 3D mesh samples by marching cube algorithm
with various fours isovalues. It provides a simple overall view of extracted meshes for
four approximations mentioned above. Left column is corresponding to the
approximated outer surface of cardiac muscles, and the right is corresponding to the
approximated inner surface.
Figure 14: Extracted meshes by Marching Cube from volume with various isovalue.

With several approximated surfaces, we would refine one of them to make it closer to
the expected one. Figure 15 provides an example of overlapped approximated
surfaces and the expected surface in between, where red surface in the middle is
imaginary expected one, between two approximated surfaces.
Figure 15: "Tri-Map" of approximated surfaces
5.2) Stage two: Refinement for meshes using projected 2D maps
After we extract approximated 3D isosurfaces from the volume, we want to refine it
to make it closer to the expected one. However, 3D operation is not quite intuitive and
with drawbacks like occlusion, poor sense of relative position, etc mentioned in
[15][16][17]. Therefore, we propose to project 3D surfaces to 2D plane so that we
could perform refinement in 2D plane instead.
5.2.1) Project from 3D mesh to 2D map using surface parameterization
Surface parameterization techniques discussed in Section 5 could transform 3D object
to 2D. With approximated meshes, different surface parameterization might be
applied to map the approximation to 2D plane. Since most of parameterization
algorithms need the meshes that are homeomorphic to a disk, we need cut closed
mesh surface along a path before parameterization. Cutting path selection is a quite
extended topic, so we just describe a simple cutting algorithm proven in published

paper [5]. In that paper, in order to obtain efficient surface parameterization, it is
important for cutting to pass through the vertices with higher curvature. In our thesis,
we will cut along the "extrema", vertices with higher curvature of meshes.
On the other hand, it is hard to demonstrate minimization for which measurement of
distortion is more suitable in proposed method theoretically. In consideration of free
border should make more sense in our work, we test LSCM parameterization in the
first place, and also compared with another representative area-preserving
parameterization algorithm -- Authalic parameterization.
Here we just view two samples using different measurement for an approximated
mesh (different algorithms would lead to various borders based on their nature).
Figure 16: 3D mesh and its Authalic (middle) and LSCM parameterization(right)
Hence, from Figure 16 presented two samples, and LSCM provides free border while
Authalic with square border. In the following, we use LSCM as testing and further
investigations for better performance will be necessary in future work.
5.2.2) Interact with isosurface in 2D instead of in 3D
We transformed 3D approximated meshes to 2D maps. Therefore, it is possible to
interact with 2D maps for refinement instead of operating in 3D.
In the following, the designed User Interface is described. User could select area of
2D map and push/pull the vertices along z-axis, which means actually unrefined "2D"
map is put in 3D space but all with same z coordinate. Since the two approximated

meshes are closed to each other, we assigned such modification along local normal
direction of the 3D surface. (shown as Figure 17).
Figure 17: Refinement on "2D" map and its reconstruction
User is allowed to view the whole of extracted mesh without occlusion, and it is easy
to modify it without folds, holes, gaps of 3D surface. But as Figure 18 shown, 2D
maps are not useful for refinement without any guidance. So features will be
calculated and applied on the 2D maps as colorization.
5.2.3) Feature calculation for parameterized map
Features are the key to perform refinement since it is few hints from the original
parameterized 2D iso-surfaces. Based on the source data of feature extraction, we
divide features into two categories: features obtained from surface characteristics, like
suggestive contours, normal, curvature etc, categorized as Surface Features (SF). On
the other side, features calculated from the volumetric data, such as local density of
each voxel, gradient of volume, distance to centroid of clusters of each voxel etc,
categorized as Volume Features (VF). In general, SF is used as considerable
information of 3D objects, rendered by RGB model. VF is computed from volume, so
rendering of VF is implemented by mapping the VF of voxels on the corresponding
pixels of 2D map. So VF could provide direct useful information of the volume, by
which it is possible to find relationship between extracted isosurface and the expected
one. Since it is much extended topic of features application in image segmentation,

we just focus on several important features for our proposed method in the rest part.
In particular, the key feature of the volume is selected as gradient of the volume
though it is the not exactly same as basis of manual segmentation mentioned above.
Features might be applied on the parameterized meshes by different colorization
models. In this work, colorization models are selected from 24bits RGB model or
grayscale model.
Normal of Surface: A surface normal of a triangle can be calculated by taking the
vector cross product of two edges of that triangle, so for one triangle (p1, p2,
p3), the normal is:
, where vector , vector .
Since normal of surface is a three dimensional vector, RGB model is exploited as
. Figure 18 provides the parameterized surface, colorized by
surface normal. Obviously, color transition on the surface could be used to localize
different parts of surface of 3D object. In addition, the 2D map is easier to view the
whole object without occlusion problem.
Figure 18: 3D mesh and its parameterization, colorized by normal

Gradient of the volume: The gradient of each voxel in the volume is computed by
following formula:
In previous work [21], gradient of grayscale intensity for image is used to perform
segmentation in 2D. Similarly, in 3D space gradient also could indicate important
edge/boundary of the volume. In this work, the gradient of volume is shown as
grayscale intensity by using the magnitude . The value of gradient magnitude is
normalized and scaled to 255, then used as grayscale to colorize the 2D map. In the
following Figure 19, the left column is the gradient magnitude of the volume (top)
and one slice of it (bottom), and the right is the parameterized surface colorized by
magnitude of gradient.
Figure 19: Gradient of volume and its mapping on parameterized surface
Local density of the volume: The local density in volume is
computed by counting the number of voxels in the surrounding , where the voxels
belong to volume range of cardiac muscle .
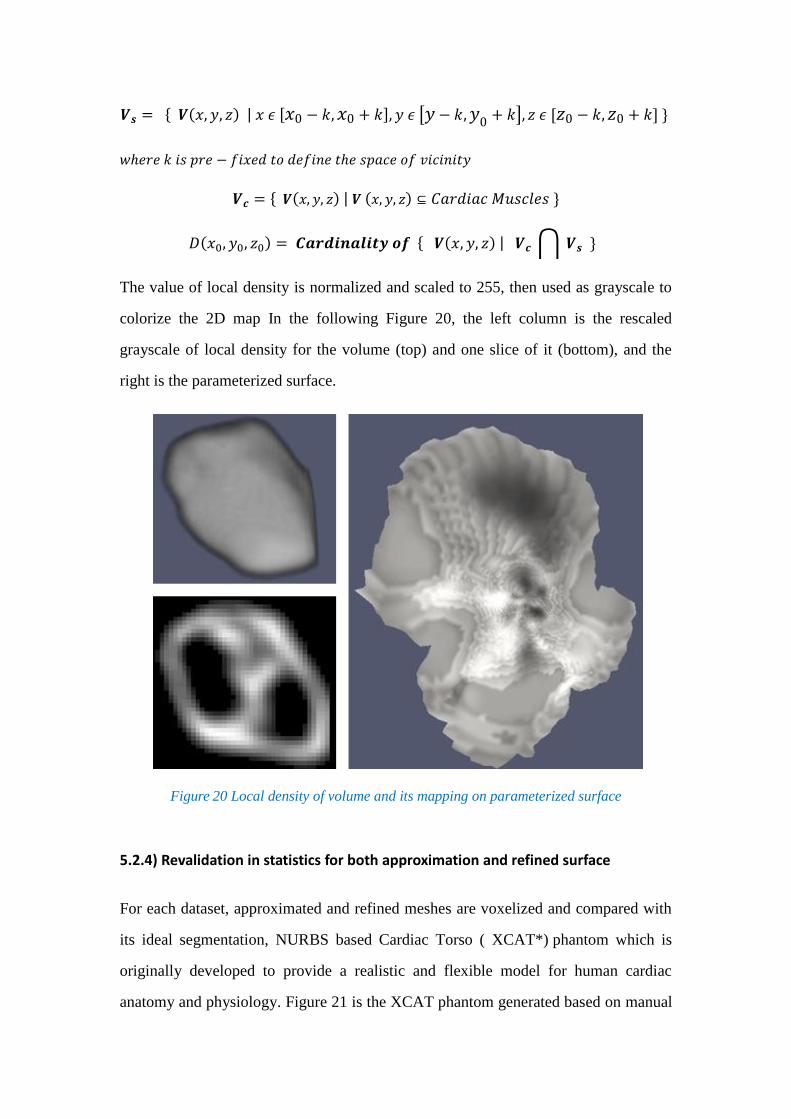
The value of local density is normalized and scaled to 255, then used as grayscale to
colorize the 2D map In the following Figure 20, the left column is the rescaled
grayscale of local density for the volume (top) and one slice of it (bottom), and the
right is the parameterized surface.
Figure 20 Local density of volume and its mapping on parameterized surface
5.2.4) Revalidation in statistics for both approximation and refined surface
For each dataset, approximated and refined meshes are voxelized and compared with
its ideal segmentation, NURBS based Cardiac Torso ( XCAT*) phantom which is
originally developed to provide a realistic and flexible model for human cardiac
anatomy and physiology. Figure 21 is the XCAT phantom generated based on manual

segmentation for volunteer MRI dataset using anatomical knowledge. However, it is
necessary to point out that the XCAT should not be the ground truth of segmentation
for the real data but with same anatomical structure.
Figure 21: Outer surface and inner surface of XCAT phantom
Approximated and refined meshes of outer, inner, and combined out & inner surfaces
are voxelized and compared with their XCAT phantoms.
Some classic index in statistics are used for evaluation listed in the follow, where
Dice Similarity Coefficient represents the degree of overlap between two sets, the
value range from 0 (No overlap) to 1 (Complete overlap).
True Positive (TP) :
False Positive (FP) :
False Negative (FN) :
Precision Rate (PR) :
Dice Similarity Coefficient (DSC) :

VI. Experiments and Evaluation
In this section, the test of proposed method is performed given in order to verify the
plausibility of it. Our goal is to determine whether the precision of approximation
reached expected level and how much the refinement could improve it.
6.1) Datasets used in the study
Three MRI datasets from volunteers are used in this study ( MRI scanner and settings
used in this study presented in Appendix. A), marked as M001, M009, M012.
Through the method described above to analyze the histogram of these datasets, we
select two relatively wide windows (shown as green line in Figure 22), four
iso-surfaces to approximate the expected outer and inner surfaces (shown as dashed
red line in Figure 22). .

Figure 22: Histograms of MRI from volunteers and its iso-values selection
In the first place, we compute the volume of outer surface approximation listed in the
Table 2. From [2], we knew the heart volume of human should be from 600 cm3
to
900 cm3. The volumes of our approximations are in the range of normal heart so we
ensure that the approximations are not out of bound.
Table 2: Volume of approximated iso-surfaces
6.2) Experiments and evaluation in statistics
Since the XCAT phantom is ideal segmentation of the heart with same anatomical
structure but the real shape of the heart should be different with XCAT, we test our
method using MRI simulation in the first place which is generated from the XCAT
phantom (shown in Figure 23), which means we have the ground truth of
segmentation in simulation testing.

Figure 23: Volume of MRI simulation and its histogram with iso-values selection
Since the refinement is manually performed, the result of each test might be different
to some extent. So we test for MRI simulation twice independently. Left image in
Figure 24 shows parameterized 2D map of isosurface with 100 grayscale (green line
in Figure 23), colorized by the feature gradient of volume. When performing
refinement on the 2D featured map, the darker area is regarded as to be modified
marked in red in right column in Figure 23. When interacting with this 2D map, the
selected are is pulled along the z-axis.
Figure 24: Parameterized 2D map colorized by gradient of volume and area to be modified
It is difficult to view the difference between approximation and refined surface mesh
for simulation, because the approximation is quite closed to the expected
segmentation, measured by Dice Similarity Coefficient up to 92%. Therefore

comparison is shown in Table 3 using statistic index, where we notice precision rate is
increased by 8.6%, 10.4% after refinement, as well as dice similarity coefficient is
increased by 2.3% and 3.7% respectively. But we also notice refinement could reduce
the false positive by 38.1% and 51.2%, though it reduces some true positive voxels
unexpectedly.
Table 3: Performance of segmentation for MRI simulation
Through testing for simulation, we verified the feasibility of proposed method with
high DSC compared with ground truth of segmentation.
In the following, we demonstrate the results of approximated and refined meshes
generated from three real MRI datasets of volunteers using previous histogram
analysis (Figure 22).
Figure 25 provides approximated and refined mesh samples for inner surface in
cardiac region along with a slice of heart boundary. We find that after refinement
some parts of mesh are closer to the boundary obviously.
Figure 25: Approximated (left) and refined(right) inner surface of cardiac muscle
Because it is hard to measure the differences between approximated 3D meshes and
refined meshes, for each dataset from volunteers outer, inner, and outer & inner
combined surfaces are voxelized and compared with its voxelized corresponding
XCAT phantom using statistic index and Dice Similarity Coefficient.
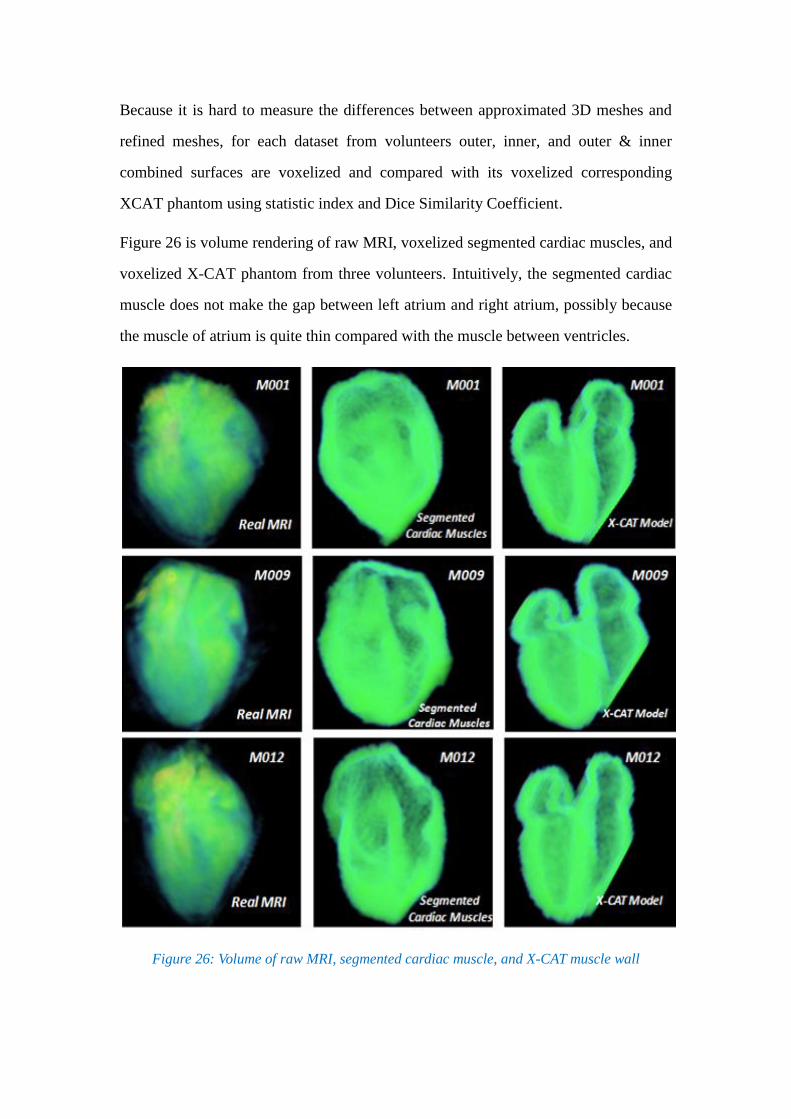
Figure 26 is volume rendering of raw MRI, voxelized segmented cardiac muscles, and
voxelized X-CAT phantom from three volunteers. Intuitively, the segmented cardiac
muscle does not make the gap between left atrium and right atrium, possibly because
the muscle of atrium is quite thin compared with the muscle between ventricles.
Figure 26: Volume of raw MRI, segmented cardiac muscle, and X-CAT muscle wall

We evaluate the performance of proposed method for approximation and refined
surfaces using statistic index. In Table 4, 5, 6, each of datasets is evaluated. It
indicates the false positive is the most significant factor that need to be cleared. After
refinement, the false positive is reduced to some extent but not much. However it also
indicates refinement sometimes decreases true positive a little, in the meantime
increases the false negative (true positive + false negative = XCAT phantom; true
positive + false positive = segmented cardiac muscle).
Table 4: Performance of segmentation for MRI of volunteer M001
Table 5: Performance of segmentation for MRI of volunteer M009

Table 6: Performance of segmentation for MRI of volunteer M012
In general, the results from volunteers indicate the approximation could match with
the XCAT phantoms with averaging 74.2% Dice Similarity Coefficient for outer
surface and 68.2% for inner surface and 51.4% for combined cardiac muscle wall.
Refinement for approximation could improve Dice Similarity Coefficient averaging to
77.5% for outer surface and 70.1% for inner surface and 56.7% for combined cardiac
muscle wall. It shows that the refinement could provide overall 4~7% percent
improvement. Averaging performance is given in Table 7.
Since the XCAT phantom is not the ground truth for real MRI data, round 70%
percent Dice Similarity Coefficient is acceptable in this case. More strictly, more than
80% DSC index usually is viewed as "good" performance.
Table 7: Averaging performance of segmentation for three volunteers
VII. Implementation
In order to implement proposed segmentation method for cardiac region, we develop
software using available open source libraries.
The first stage of our method is to perform an approximation by generating isosurface
from the volume. Such processing is automated performed except isovalue selection
based on histogram analysis. We implement a Matlab script, which could figure the
histogram of input volume data, and perform mesh approximation by marching cube
using Insight Toolkit (ITK) libraries. The volume calculation for approximation is
implemented by Visualization Toolkit (VTK) libraries.
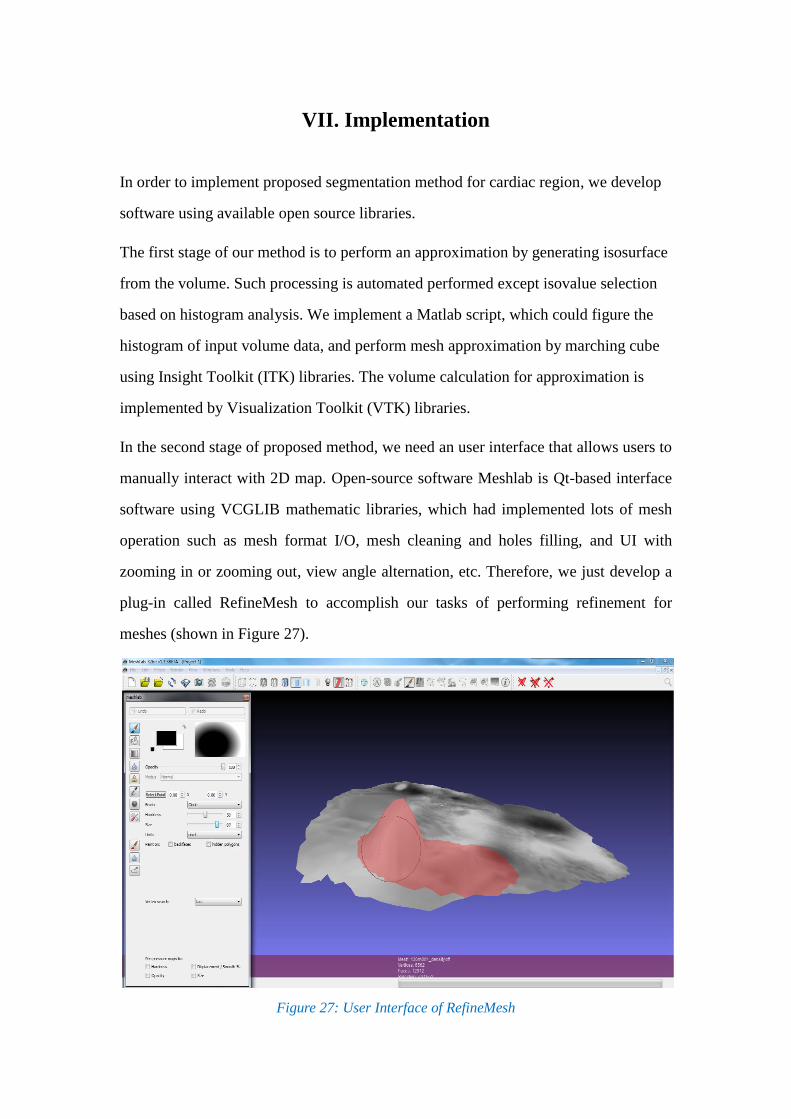
In the second stage of proposed method, we need an user interface that allows users to
manually interact with 2D map. Open-source software Meshlab is Qt-based interface
software using VCGLIB mathematic libraries, which had implemented lots of mesh
operation such as mesh format I/O, mesh cleaning and holes filling, and UI with
zooming in or zooming out, view angle alternation, etc. Therefore, we just develop a
plug-in called RefineMesh to accomplish our tasks of performing refinement for
meshes (shown in Figure 27).
Figure 27: User Interface of RefineMesh

VIII. Conclusion and Future work
We have demonstrated the proposed improved 3D segmentation approach in details
and provided some tests with evaluation. The goal of this thesis is to seek a high
quality, easy to use method to perform segmentation for cardiac muscle.
We briefly summarize our main contributions:
i) Our proposed method could accomplish segmentation within 30 minutes, including
approximation and refinement. Compared with manual slice-by-slice segmentation
costing several hours, the proposed method is much faster. In addition, since the
approximation and refinement for cardiac muscles is performed based on 3D volume
directly, there is no interpolation error there.
ii) The performance of our proposed method is considerable. For MRI simulation,
compared with ground truth, the Dice Similarity Coefficient could reach up to 92.1%
of approximation and 95.0% after refinement. In addition, we conduct a study for
testing with MRI data from volunteers and evaluate the results by comparing with
corresponding XCAT phantoms with averaging 70% of DSC index.
iii) The implementation of RefineMesh plug-in for Meshlab allows users to interact
with 2D mesh map instead of 3D object, with whole view of ROI and convenience of
operation.
Upon finishing our proposed method, we notice there is much improvement potentials
there. The overall performance might be improved further and other techniques might
be applied in addition for more benefits. Some future directions for further improve
our work is discussed in the following part.
Some more user studies should be conducted by individuals with various education
backgrounds and major knowledge. We suppose our method could be used by either
anatomical experts or commons without any medical knowledge.

On the other hand, more different features and different surface parameterization
algorithms will be investigated, to improve the 2D map view perceptually. For
instance, the feature of local density mentioned in Section 5 is not tested in the study
since there is still some questions to be figured out, like the cardiac muscle of left
ventricle is quite thinner than that of right ventricle, so it is not reasonable to measure
local density of such two area in same metrics.
For UI design, we have the idea that if we could implement rendering of feature in
real-time, refinement processing would be more intuitive and with higher
performance. The rendering of volume feature is based on the original approximation
and won't vary during refinement. It leads to the problem when to stop the refinement
during interaction with 2D map. The unresolved problem is that when mapping the
feature on the original 2D map, we need spend round 2~4 minutes to map the value of
volume feature to the closest corresponding vertex on the 2D map.

References
[1] Lorensen W.E. and Cline H.E. “Marching Cubes: A High-Resolution 3D Surface
Construction Algorithm”, SIGGRAPH 87 Conference Proceedings, Computer
Graphics, Vol. 21, No. 4, pp. 163-169, July 1987.
[2] Marcus Carlsson et, "Total heart volume variation throughout the cardiac cycle in
humans" Am J Physiol Heart Circ Physiol 287:H243-H250, 2004
[3] Sergey V. Matveyev, "Approximation of Isosurface in the Marching Cube:
Ambiguity Problem". Visualization, 1994. Visualization 94, Proceedings., IEEE
Conference on 17-21 Oct 1994
[4] Alyassin A.M. et , "Evaluation of new algorithms for the interactive measurement
of surface area and volume", Med Phys 21(6) 1994.
[5] Xianfeng Gu.et, "Geometry Images", ACM Trans. on Graphics (SIGGRAPH),
21(3), 2002.
[6] Bruno L evy, Sylvain Petitjean, Nicolas Ray, and J erome Maillot. "Least squares
conformal maps for automatic texture atlas generation". In Proceedings of the 29th
Conference on Computer Graphics and Interactive Techniques SIGGRAPH, volume
21(3) of ACM Transactions on Graphics, pages 362–371, 2002.
[7] Fernand Meyer. "Un algorithme optimal pour la ligne de partage des eaux".
Dans 8me congrès de reconnaissance des formes et intelligence artificielle, Vol. 2
(1991), pages 847–857, Lyon, France.
[8] Joachim Weickert , Hanno Scharr, "A Scheme for Coherence-Enhancing
Diffusion Filtering with Optimized Rotation Invariance", Journal of Visual
Communication and Image Representation 13, 103–118 (2002)
[9] P. Perona and J. Malik. "Scale-space and edge detection using anisotropic
diffusion". IEEE Transactions on Pattern Analysis Machine Intelligence, 12:629–639,
1990. 6.7.3, 6.7.3, 6.7.3
[10] C. Tomasi, R. Manduchi, "Bilateral filtering for gray and color images", in:
Proceedings of IEEE International Conference on Computer Vision, 1998, pp. 839–
846.
[11] Stephen Grossberg. "Neural dynamics of brightness perception: Features,
boundaries, diffusion, and resonance". Perception and Psychophysics, 36(5):428–456,
1984.
[12] A. Lopes, K. Brodlie, "Improving the robustness and accuracy of the marching
cubes algorithm for isosurfacing", IEEE Trans Visualization Comput. Graphics (2000)
19–26.
[13] Ayman S. El-Baz, "Multi Modality State-Of-The-Art Medical Image
Segmentation and registration methodologies", Chapter 1, Volume 2, Springer 2011
ISBN : 9781441981950
[14] Sheil, W. C.. "Magnetic Resonance Imaging (MRI Scan)". MedicineNet.com.
Retrieved 27 April 2012.
[15] Colin Ware "Designing with a 2 1/2D Attitude " Information Design Journal, 10
(3): 255–262, 2001.
[16] Harvey S. Smallman , Mark St. John , Heather M. Oonk , Michael B. Cowen,
"Information Availability in 2D and 3D Displays", IEEE Computer Graphics and
Applications, v.21 n.5, p.51-57, September 2001
[17] I. Heynderickx and R. Kaptein, “Perception of detail in 3D images,” in Proc.
SPIE 7242, 2009, p. 72420W
[18] C. Lindsay ; M. A. Gennert ; C. M. Connolly ; A. Konik ; P. K. Dasari ; W. P.
Segarsand M. A. King "Interactive generation of digital anthropomorphic phantoms
from XCAT shape priors", Proc. SPIE 8317, Medical Imaging 2012: Biomedical
Applications in Molecular, Structural, and Functional Imaging, 83170M (March 23,
2012)

[19] Alyassin AM, Lancaster JL, Downs JH 3rd, Fox PT. " Evaluation of new
algorithms for the interactive measurement of surface area and volume", Med
Phys. 1994 Jun;21(6):741-52
[20] Dice, Lee R. (1945). "Measures of the Amount of Ecologic Association Between
Species". Ecology 26 (3): 297–302. doi:10.2307/1932409. JSTOR 1932409
[21] J. Dehmeshki, X.Ye, and J. Costello, "Shape based region growing using
derivatives of 3d medical images: Application to semi-automated detection of
pulmonary nodules," in IEEE ICIP, 2003, vol. 1,pp. 1085-1088.
[22] J. T. Orlando and S. Rui "Image segmentation by histogram thresholding using
fuzzy sets", IEEE Trans. Image Process., vol. 11, no. 12, pp.1457 -1465 2002
[23] LIU, R., AND ZHANG, H. "Segmentation of 3d meshes through spectral
clustering". In Proc. Pacific Graphics (2004), pp. 298-305
[24] Nachtomy E, Cooperstein R, Vaturi M, Bosak E, Vered Z, Akselrod
S. "Automatic assessment of cardiac function from short-axis MRI: procedure and
clinical evaluation". Magn Reson Imaging 1998; 16: 365–376.
[25] K.S. Teo, A. Carbone, C. Piantadosi, D.P. Chew, C.J. Hammett, M.A. Brown,
S.G. Worthley, M.R.I. Cardiac "Assessment of left and right ventricular parameters in
healthy Australian normal volunteers" Heart Lung Circ, 17 (2008), pp. 313–317
[26] Wong MD, Dorr AE, Walls JR, Lerch JP, Henkelman RM (2012) "A novel 3D
mouse embryo atlas based on micro-CT " Development 139: 3248-3256.
[27] J. Weickert, "Coherence-enhancing diffusion filtering", Int. J. Comput. Vision 31,
1999, 111–127.
[28] B. J ahne, H. Scharr, and S. K orkel, "Principles of filter design", in Handbook
on Computer Vision and Applications,Vol. 2: Signal Processing and Pattern
Recognition (B. J ahne, H. Haußecker, and P. Geißler, Eds.), pp. 125–152, Academic
Press, San Diego, 1999.

[29] G. Johansson, "Accelerating isosurface extraction by caching cell topology in
graphics hardware," M.S. thesis, University College Dublin, Dublin, Ireland, 2005

Appendix. A – MRI and MRI Scanner
Magnetic resonance imaging (MRI) is a technique for imaging and rendering the
different soft tissues of the body. An MRI scanner is a medical device, by which the
patient lies within a powerful magnet where the magnetic field is used to align
the magnetization of atomic nuclei in the body, and radio frequency fields to alter the
alignment of this magnetization systematically. In clinical practice, MRI is used to
distinguish pathologic tissue (such as a brain/heart tumor) from normal tissue. One
advantage of an MRI scan is that it is harmless to the patient. It uses strong magnetic
fields and non-ionizing electromagnetic fields in the radio frequency range, unlike CT
scans and traditional X-rays, which use ionizing radiation [14].
Three MRI datasets of volunteers used in this work are from MRI pool of UMass
Medical School. Datasets of volunteers are captured by "Phillips 3T" MRI device
(Figure 6) with following specific settings:
Technique: Gradient Echo
Field strength: 3T
T1 = 31; T2 = 11
Flip Angle = 30 degree
Figure : Phillips 3T MRI scanner

Appendix. B – Optimized Coherence-Enhancing Diffusion
Anisotropic diffusion filtering with a diffusion tensor evolves the initial image under
an evolution equation of type:
, where is the evolving image, denotes the diffusion time, and
is the diffusion tensor, a positive definite symmetric matrix that may be adapted to the
local image structure.
This local image structure is measured by the so-called structure tensor (scatter metric)
which is given by
The function denotes a Gaussian with standard deviation , and is
a regularized version of that is obtained by convolution with a Gaussian . The
eigenvectors of give the preferred local orientations, and the corresponding
eigenvalues denote the local contrast along these directions.
For more details on coherence-enhancing anisotropic diffusion we refer to [27].
In order to explain the scheme used in this optimized coherence-enhancing
anisotropic diffusion which works on a stencil, we rewrite the divergence
operator as
This expression is now evaluated in an explicit way, i.e., using only known values
form the old time level k.
The key point is that we use first derivative operators with the stencil notations

(1)
They have been derived in [36,37], where it has been shown that they approximate
rotation invariance significantly better than related popular stencils like the Sobel
filters.
Now we can turn our attention to the diffusion approximation again. We proceed in
five steps:
1. Calculate the structure tensor using the optimized derivative filters from (1).
2. Assemble the diffusion tensor as a function of the structure tensor.
3. Calculate the flux components and
with the optimized filters.
4. Calculate by means of the optimized derivative filters.
5. Update in an explicit way.
Since the resulting scheme makes consequent use of the derivative filters with
optimized rotation invariance, we may expect good directional behavior. It should be
noted that the total stencil of this scheme has size since we are approaching the
second order derivatives by consecutively applying first order derivatives of size 3.
However, there is no need to write down a complicated stencil, since it is
nowhere required in the entire algorithm.