implementing pulse oximeter using max30100 · implementing pulse oximeter using max30100 for my...
TRANSCRIPT
© Raivis Strogonovs 08.03.2017
1
Implementing pulse oximeter using MAX30100
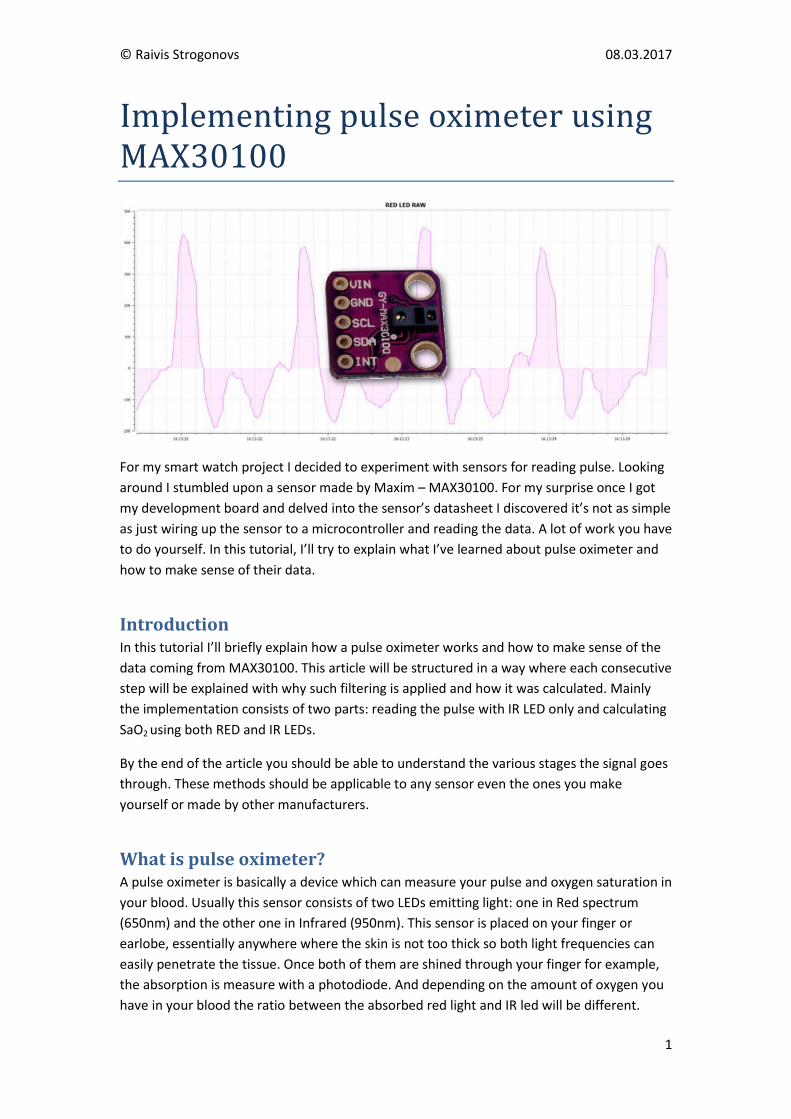
For my smart watch project I decided to experiment with sensors for reading pulse. Looking
around I stumbled upon a sensor made by Maxim – MAX30100. For my surprise once I got
my development board and delved into the sensor’s datasheet I discovered it’s not as simple
as just wiring up the sensor to a microcontroller and reading the data. A lot of work you have
to do yourself. In this tutorial, I’ll try to explain what I’ve learned about pulse oximeter and
how to make sense of their data.
Introduction In this tutorial I’ll briefly explain how a pulse oximeter works and how to make sense of the
data coming from MAX30100. This article will be structured in a way where each consecutive
step will be explained with why such filtering is applied and how it was calculated. Mainly
the implementation consists of two parts: reading the pulse with IR LED only and calculating
SaO2 using both RED and IR LEDs.
By the end of the article you should be able to understand the various stages the signal goes
through. These methods should be applicable to any sensor even the ones you make
yourself or made by other manufacturers.
What is pulse oximeter? A pulse oximeter is basically a device which can measure your pulse and oxygen saturation in
your blood. Usually this sensor consists of two LEDs emitting light: one in Red spectrum
(650nm) and the other one in Infrared (950nm). This sensor is placed on your finger or
earlobe, essentially anywhere where the skin is not too thick so both light frequencies can
easily penetrate the tissue. Once both of them are shined through your finger for example,
the absorption is measure with a photodiode. And depending on the amount of oxygen you
have in your blood the ratio between the absorbed red light and IR led will be different.
© Raivis Strogonovs 08.03.2017
2
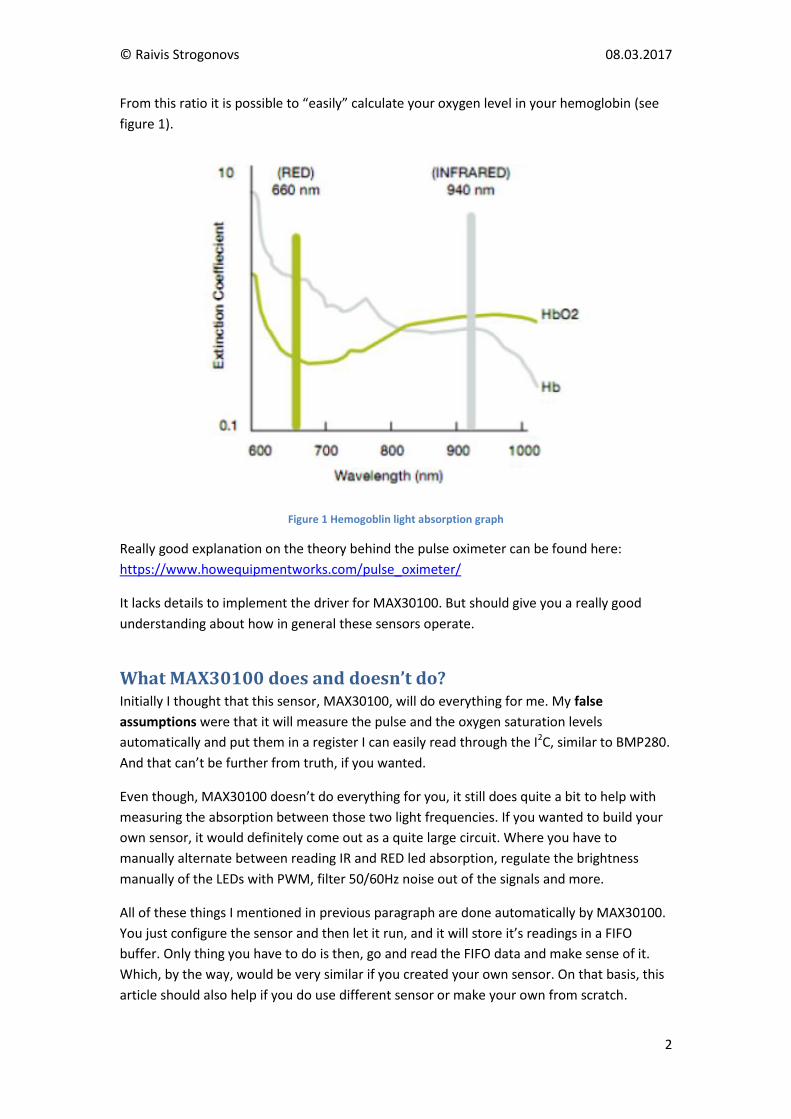
From this ratio it is possible to “easily” calculate your oxygen level in your hemoglobin (see
figure 1).
Figure 1 Hemogoblin light absorption graph
Really good explanation on the theory behind the pulse oximeter can be found here:
https://www.howequipmentworks.com/pulse_oximeter/
It lacks details to implement the driver for MAX30100. But should give you a really good
understanding about how in general these sensors operate.
What MAX30100 does and doesn’t do? Initially I thought that this sensor, MAX30100, will do everything for me. My false
assumptions were that it will measure the pulse and the oxygen saturation levels
automatically and put them in a register I can easily read through the I2C, similar to BMP280.
And that can’t be further from truth, if you wanted.
Even though, MAX30100 doesn’t do everything for you, it still does quite a bit to help with
measuring the absorption between those two light frequencies. If you wanted to build your
own sensor, it would definitely come out as a quite large circuit. Where you have to
manually alternate between reading IR and RED led absorption, regulate the brightness
manually of the LEDs with PWM, filter 50/60Hz noise out of the signals and more.
All of these things I mentioned in previous paragraph are done automatically by MAX30100.
You just configure the sensor and then let it run, and it will store it’s readings in a FIFO
buffer. Only thing you have to do is then, go and read the FIFO data and make sense of it.
Which, by the way, would be very similar if you created your own sensor. On that basis, this
article should also help if you do use different sensor or make your own from scratch.
© Raivis Strogonovs 08.03.2017
3
In short don’t assume MAX30100 will do everything for you, a lot of deciphering will still be
up to you.
Background information on MAX30100 First thing we have to do, is to connect the sensor to our microcontroller and read its data. I
won’t go in a lot of details; just some small notes and tips how it is done. Since I feel this is a
rather simple process.
First some important background about MAX30100:
1. I2C address of MAX30100: 0x57
2. Data is stored in a FIFO buffer. It can store up to 16 measurements, where each
sample is size of 4 bytes. First two bytes are for IR measurement and last two bytes
are for RED measurement.
3. FIFO buffer can’t be read consequently with I2C, since the FIFO points to the same
address. You have to finish transaction for FIFO output address to contain the next
values.
4. MAX30100 has built in 50/60Hz filter
5. If you want to just detect pulse, only IR is required
6. For oxygen saturation you’ll need to enable both IR and RED LEDs
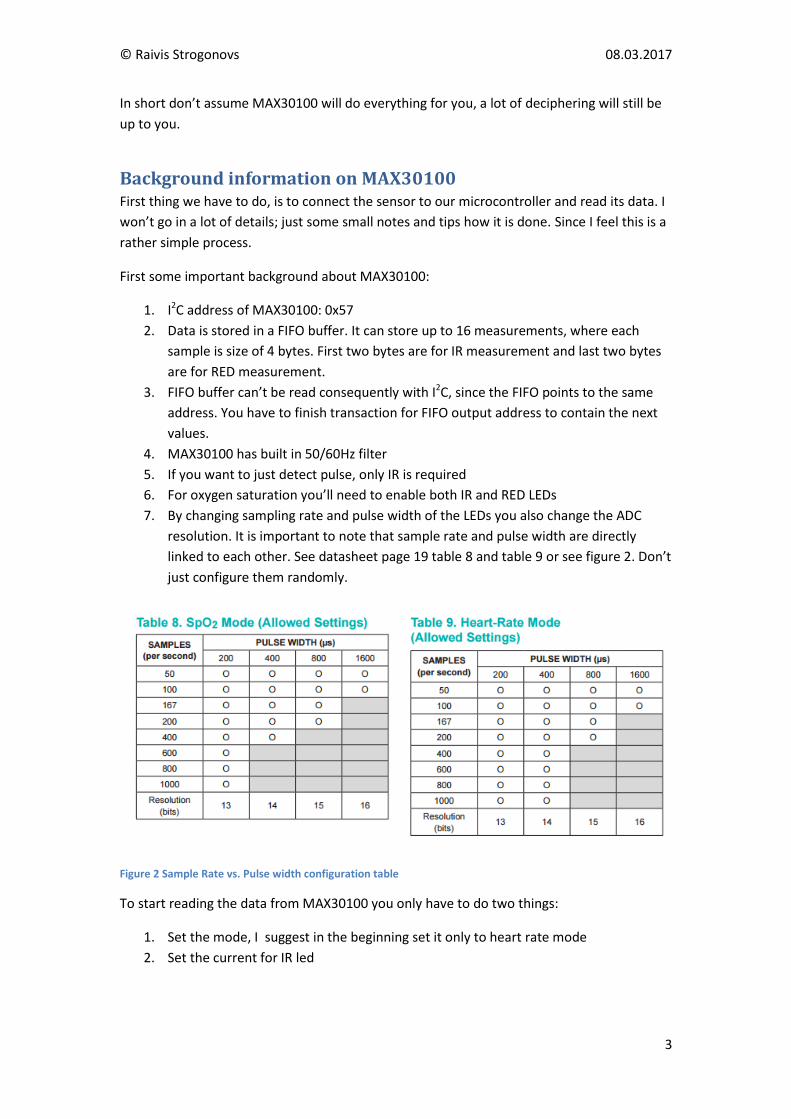
7. By changing sampling rate and pulse width of the LEDs you also change the ADC
resolution. It is important to note that sample rate and pulse width are directly
linked to each other. See datasheet page 19 table 8 and table 9 or see figure 2. Don’t
just configure them randomly.
Figure 2 Sample Rate vs. Pulse width configuration table
To start reading the data from MAX30100 you only have to do two things:
1. Set the mode, I suggest in the beginning set it only to heart rate mode
2. Set the current for IR led
© Raivis Strogonovs 08.03.2017
4
This will enable us to measure heart rate, once we are done with filtering. You can check
how did I do it, by looking at three functions in my library: setMode(),setLEDCurrents() and
readFIFO()
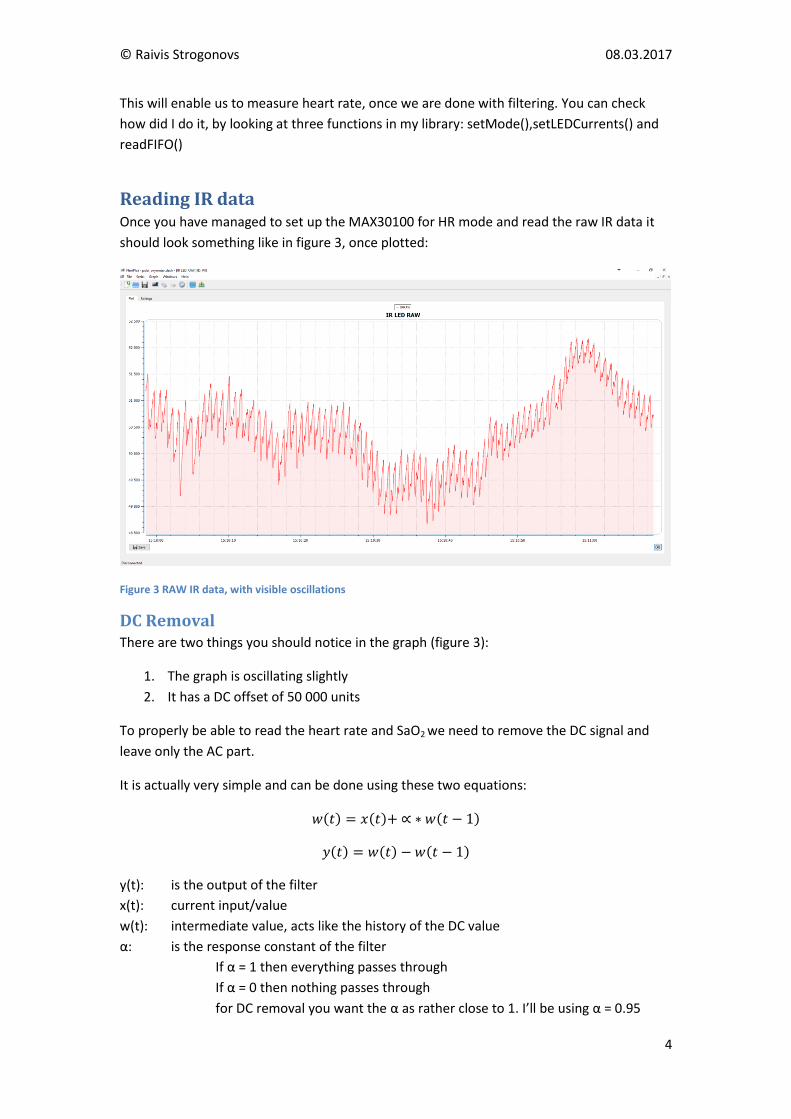
Reading IR data Once you have managed to set up the MAX30100 for HR mode and read the raw IR data it
should look something like in figure 3, once plotted:
Figure 3 RAW IR data, with visible oscillations
DC Removal There are two things you should notice in the graph (figure 3):
1. The graph is oscillating slightly
2. It has a DC offset of 50 000 units
To properly be able to read the heart rate and SaO2 we need to remove the DC signal and
leave only the AC part.
It is actually very simple and can be done using these two equations:
( ) ( ) ( )
( ) ( ) ( )
y(t): is the output of the filter
x(t): current input/value
w(t): intermediate value, acts like the history of the DC value
α: is the response constant of the filter
If α = 1 then everything passes through
If α = 0 then nothing passes through
for DC removal you want the α as rather close to 1. I’ll be using α = 0.95
© Raivis Strogonovs 08.03.2017
5
If you want to read more about DC removal, here is a good tutorial and much more detailed
description of how it functions: http://sam-koblenski.blogspot.co.uk/2015/11/everyday-
dsp-for-programmers-dc-and.html
Here is the filter implemented in a code:
struct fifo_t {
uint16_t rawIR;
uint16_t rawRed;
};
dcFilter_t MAX30100::dcRemoval(float x, float prev_w, float alpha)
{
dcFilter_t filtered;
filtered.w = x + alpha * prev_w;
filtered.result = filtered.w - prev_w;
return filtered;
}
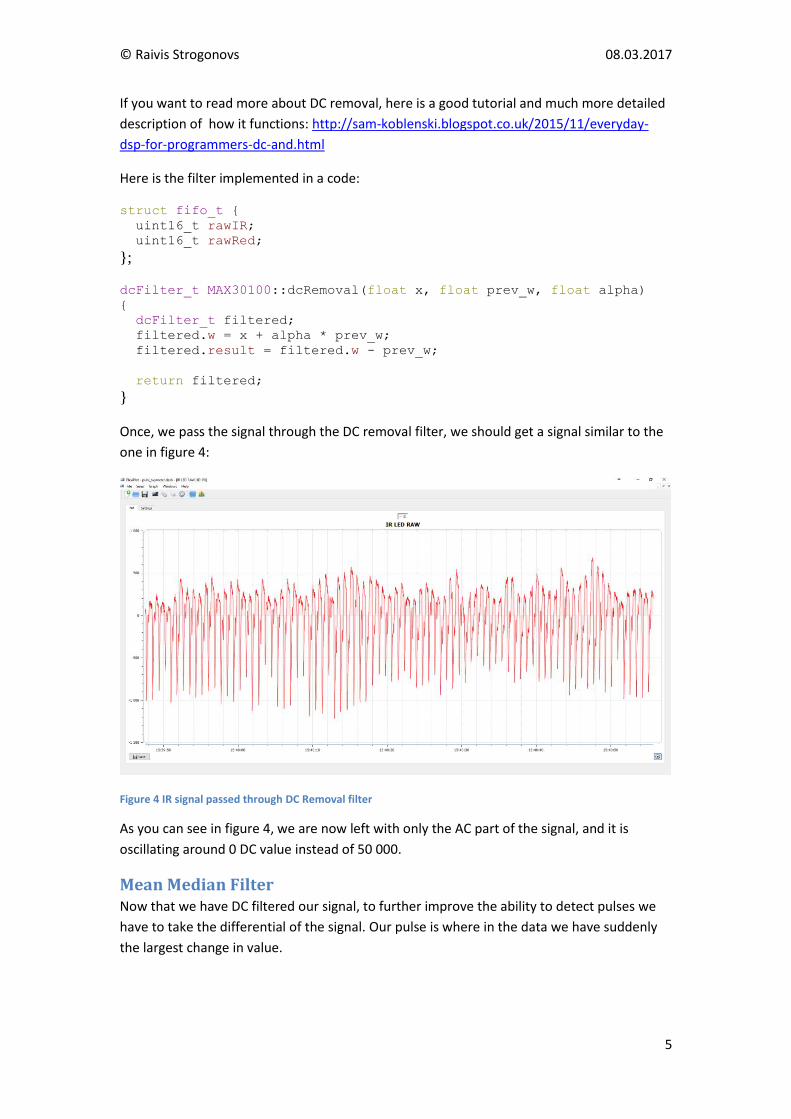
Once, we pass the signal through the DC removal filter, we should get a signal similar to the
one in figure 4:
Figure 4 IR signal passed through DC Removal filter
As you can see in figure 4, we are now left with only the AC part of the signal, and it is
oscillating around 0 DC value instead of 50 000.
Mean Median Filter Now that we have DC filtered our signal, to further improve the ability to detect pulses we
have to take the differential of the signal. Our pulse is where in the data we have suddenly
the largest change in value.

© Raivis Strogonovs 08.03.2017
6
However, I’ve decided to implement mean median filter instead of just taking the difference
to further clean up the signal. This will give us the value change from the average, as the
name implies. Here is my simple implementation of such filter:
struct meanDiffFilter_t
{
float values[MEAN_FILTER_SIZE];
byte index;
float sum;
byte count;
};
float MAX30100::meanDiff(float M, meanDiffFilter_t* filterValues)
{
float avg = 0;
filterValues->sum -= filterValues->values[filterValues->index];
filterValues->values[filterValues->index] = M;
filterValues->sum += filterValues->values[filterValues->index];
filterValues->index++;
filterValues->index = filterValues->index % MEAN_FILTER_SIZE;
if(filterValues->count < MEAN_FILTER_SIZE)
filterValues->count++;
avg = filterValues->sum / filterValues->count;
return avg - M;
}
After we pass the DC filtered signal through the mean difference filter we get a familiar
signal which reassembles a cardiogram (see figure 5)
Figure 5 Mean Difference filtered IR signal

© Raivis Strogonovs 08.03.2017
7
The really tall peaks are my heart beats. From this data it should already be quite easy to
extrapolate my heartbeat, however if you look closely to the wave form, there are some
higher level harmonies in the data. They are especially visible at the bottom part of the
signal. We can filter them out easily if we pass the signal through a low pass filter or band
pass filter.
Butterworth filter To remove the higher level harmonies I shall be using Butterworth filter in low pass filter
configuration. Technically it is a band pass filter. And also, any low pass filter would do just
fine. It’s just relatively easy to work with Butterworth. There is a good online tool for
generating Butterworth filter constants for your desired frequencies:
http://www.schwietering.com/jayduino/filtuino/
So to implement this filter we have to establish two variables: sampling rate (FS) and cut-off
frequency (FC ).
Technically the fastest sampling rate available for MAX30100 is 1kHz, nonetheless the
configuration I’ve chosen is with long pulse width, which allows the sampling rate to be only
100Hz. So from this we can extrapolate that our sampling rate is 100Hz.
Next we need to choose the cut-off frequency. Since we are measuring heart rate, as far as I
know, 220 BPM is dangerously high heart rate but still achievable in certain cases. So I’ve
chosen that to be our maximum frequency we have to pass through.
Our fastest frequency we would require to let through can be calculated like so:
If we assume we want to measure as low as 50 BPM we can apply the same calculations:
It is very important to remember that Butterworth filter work on a normalised frequency
So if your sampling rate is not spot-on 100Hz, Butterworth filter will start to cut-off different
frequencies. In figure 6 you can see how quickly one loop finishes in my current
implementation.

© Raivis Strogonovs 08.03.2017
8
Figure 6 Diagram showing how quickly one loop finishes while reading and filtering MAX30100 data. Note that output pin is flipped every time a loop finishes. Actual execution speed is 75Hz
As you can see in the figure 6 our sampling rate is about 75Hz. Let’s assume we actually
implemented our Butterworth filter with FS = 100Hz and FC = 4Hz.
If we apply the normalisation, at our real FS = 75Hz, our cut-off frequency would be FC = 3Hz
And because of that we have a problem, our cut-off frequency is lower than our intended
3.66Hz. That means we could only measure up to 180BPM instead of our desired 220BPM.
Nonetheless, if the update speed is even lower, we would cut-off even more frequencies we
actually want to keep.
To fix this issue, we have two options available, either have a precise sampling rate or
increase the cut-off frequency. Effectively increasing available sampling rate error margin
and decreasing a bit the quality of the filtered signal.
I adopted the second option and chose a new FC value.
That would give us ratio of:

© Raivis Strogonovs 08.03.2017
9
Assuming 220BPM or that is 3.66Hz is our target frequency. Butterworth filter would now
still let through desired frequencies with as low as a sample rate of:
In our real world example of FS = 75Hz it would give us actual FC = 7.5Hz.
I believe it is good enough for our filtering needs, because we don’t need to be ultra-precise
about filtering the signal; just enough to clear it up a bit and improve the signal for detecting
peaks.
Taking into account our FS = 100Hz and FC = 10Hz, we get the following code for Butterworth
filter:
struct butterworthFilter_t
{
float v[2];
float result;
};
void MAX30100::lowPassButterworthFilter( float x, butterworthFilter_t
* filterResult )
{
filterResult->v[0] = filterResult->v[1];
//Fs = 100Hz and Fc = 10Hz
filterResult->v[1] = (2.452372752527856026e-1 * x) +
(0.50952544949442879485 * filterResult->v[0]);
//Fs = 100Hz and Fc = 4Hz
//filterResult->v[1] = (1.367287359973195227e-1 * x) +
(0.72654252800536101020 * filterResult->v[0]); //Very precise
butterworth filter
filterResult->result = filterResult->v[0] + filterResult->v[1];
}
Once we pass the cardiogram looking signal, we get a much smoother signal out (see figure
7)

© Raivis Strogonovs 08.03.2017
10
Figure 7 Butterworth filtered signal with Fs = 100Hz and Fc = 10Hz. Real sampling rate Fs = 75Hz, which gives Fc = 7.5Hz
And that is all we have to do for our IR output. At this stage it should be pretty clear where
the pulses are, and as a matter of fact it generates a nice cardiogram.
Beat Detection Now that we have a relatively clean signal from our MAX30100 we can start calculating the
heart rate. I’ve decided to implement a very simple state machine. By no means is my design
error free or industry ready. It isn’t, and can easily miss-detect pulses or not detect them at
all, but it is good as proof of concept.
Idea for the state machine is very simple. Once a threshold is reached, follow the curve. As
soon as one or more times the signal starts to fall, save a timestamp. Once you have two
timestamps, the difference between them is our measured delay between two beats. From
this we can calculate the BPM.
Arduino has a nice function called millis(), which gives you a timestamp in milliseconds. If we
get two timestamps we can calculate the heart rate using this equation:
On top of that because we are calculating in such a way BPM, I’ve decided to also implement
a moving average filter on the BPM results. Just to give a more accurate measurement of the
heart rate.
© Raivis Strogonovs 08.03.2017
11
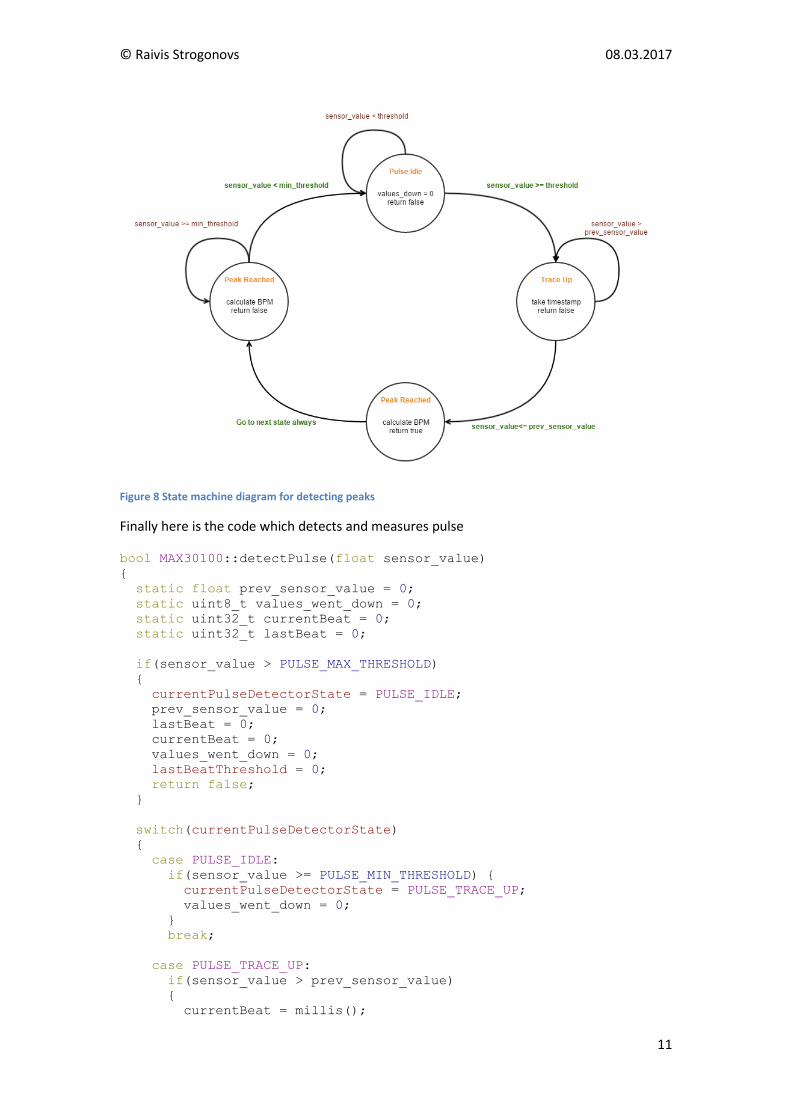
Figure 8 State machine diagram for detecting peaks
Finally here is the code which detects and measures pulse
bool MAX30100::detectPulse(float sensor_value)
{
static float prev_sensor_value = 0;
static uint8_t values_went_down = 0;
static uint32_t currentBeat = 0;
static uint32_t lastBeat = 0;
if(sensor_value > PULSE_MAX_THRESHOLD)
{
currentPulseDetectorState = PULSE_IDLE;
prev_sensor_value = 0;
lastBeat = 0;
currentBeat = 0;
values_went_down = 0;
lastBeatThreshold = 0;
return false;
}
switch(currentPulseDetectorState)
{
case PULSE_IDLE:
if(sensor_value >= PULSE_MIN_THRESHOLD) {
currentPulseDetectorState = PULSE_TRACE_UP;
values_went_down = 0;
}
break;
case PULSE_TRACE_UP:
if(sensor_value > prev_sensor_value)
{
currentBeat = millis();
© Raivis Strogonovs 08.03.2017
12
lastBeatThreshold = sensor_value;
}
else
{
if(debug == true)
{
Serial.print("Peak reached: ");
Serial.print(sensor_value);
Serial.print(" ");
Serial.println(prev_sensor_value);
}
uint32_t beatDuration = currentBeat - lastBeat;
lastBeat = currentBeat;
float rawBPM = 0;
if(beatDuration > 0)
rawBPM = 60000.0 / (float)beatDuration;
if(debug == true)
Serial.println(rawBPM);
//This method sometimes glitches, it's better to go through
whole moving average everytime
//IT's a neat idea to optimize the amount of work for moving
avg. but while placing, removing finger it can screw up
//valuesBPMSum -= valuesBPM[bpmIndex];
//valuesBPM[bpmIndex] = rawBPM;
//valuesBPMSum += valuesBPM[bpmIndex];
valuesBPM[bpmIndex] = rawBPM;
valuesBPMSum = 0;
for(int i=0; i<PULSE_BPM_SAMPLE_SIZE; i++)
{
valuesBPMSum += valuesBPM[i];
}
if(debug == true)
{
Serial.print("CurrentMoving Avg: ");
for(int i=0; i<PULSE_BPM_SAMPLE_SIZE; i++)
{
Serial.print(valuesBPM[i]);
Serial.print(" ");
}
Serial.println(" ");
}
bpmIndex++;
bpmIndex = bpmIndex % PULSE_BPM_SAMPLE_SIZE;
if(valuesBPMCount < PULSE_BPM_SAMPLE_SIZE)
valuesBPMCount++;
currentBPM = valuesBPMSum / valuesBPMCount;
if(debug == true)
{
Serial.print("AVg. BPM: ");
Serial.println(currentBPM);
}
© Raivis Strogonovs 08.03.2017
13
currentPulseDetectorState = PULSE_TRACE_DOWN;
return true;
}
break;
case PULSE_TRACE_DOWN:
if(sensor_value < prev_sensor_value)
{
values_went_down++;
}
if(sensor_value < PULSE_MIN_THRESHOLD)
{
currentPulseDetectorState = PULSE_IDLE;
}
break;
}
prev_sensor_value = sensor_value;
return false;
}
At this stage we have applied multiple filters to our signal. Moreover we also have detected
the pulse and measured the heart rate. However, as previously mentioned, this state
machine can still be greatly improved and should not be used in a real product.
Measuring SpO2 As mentioned in the introduction, oxygen concentration can be measured by calculating the
ratio between absorbed light from IR LED and Red LED. In this section I will explore how it is
theoretically done, but due to some limitation the sensor won’t be calibrated properly.
Unfortunately for that you need proper empirical data to create a lookup table.
Balancing IR and Red Current First of all, we have to switch the MAX30100 mode to SaO2 + HR. That can be done by
sending 0x03 to MODE config register. That will enable both LEDs and MAX30100 will start
filling the FIFO buffer with readings from both light spectrums.
Also, RED readings should be passed through the same DC removal filter as IR readings. But
it is not necessary to pass it through mean average filter and Butterworth filter, since we are
not using RED light to detect pulses.
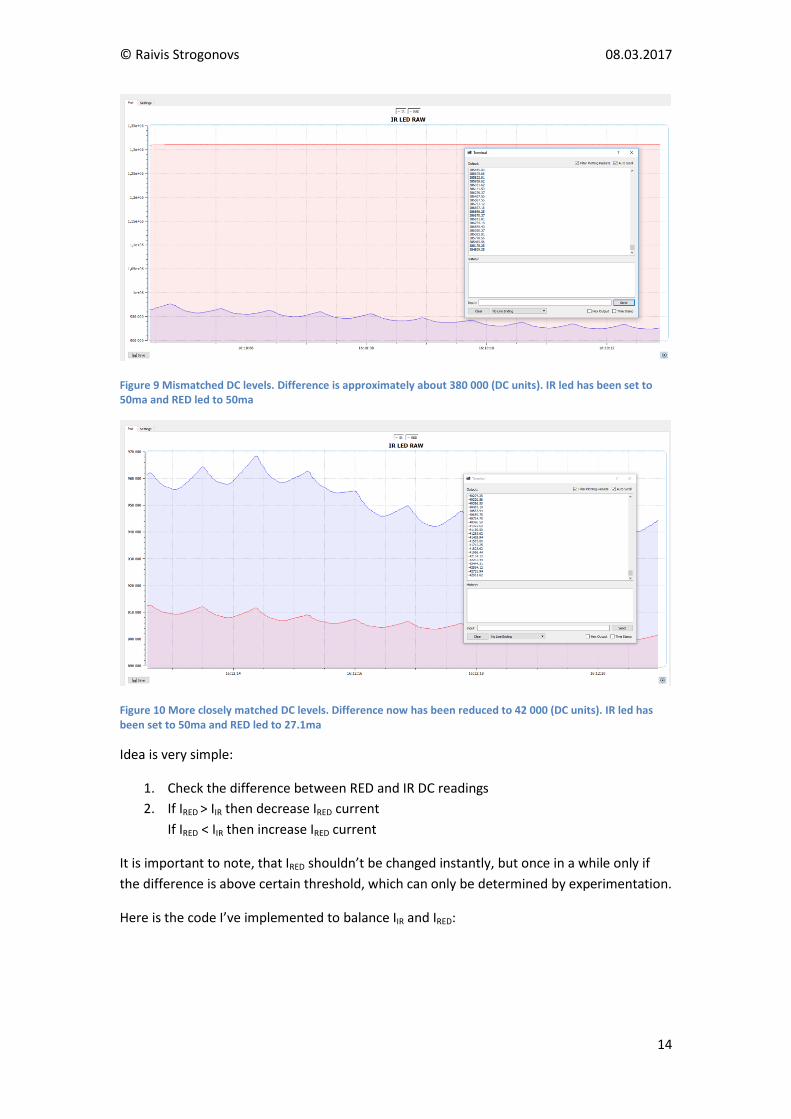
If you just enabled both LEDs with maximum output current of 50ma, you’ll quickly realize
that readings from Red LED will be extremely saturated. Also to be able to measure the
ratios between our two readings, on base level their DC levels should be nearly identical (see
figure 9 and figure 10).
© Raivis Strogonovs 08.03.2017
14
Figure 9 Mismatched DC levels. Difference is approximately about 380 000 (DC units). IR led has been set to 50ma and RED led to 50ma
Figure 10 More closely matched DC levels. Difference now has been reduced to 42 000 (DC units). IR led has been set to 50ma and RED led to 27.1ma
Idea is very simple:
1. Check the difference between RED and IR DC readings
2. If IRED > IIR then decrease IRED current
If IRED < IIR then increase IRED current
It is important to note, that IRED shouldn’t be changed instantly, but once in a while only if
the difference is above certain threshold, which can only be determined by experimentation.
Here is the code I’ve implemented to balance IIR and IRED:
© Raivis Strogonovs 08.03.2017
15
void MAX30100::balanceIntesities( float redLedDC, float IRLedDC )
{
if( millis() - lastREDLedCurrentCheck >=
RED_LED_CURRENT_ADJUSTMENT_MS)
{
//Serial.println( redLedDC - IRLedDC );
if( IRLedDC - redLedDC > MAGIC_ACCEPTABLE_INTENSITY_DIFF &&
redLEDCurrent < MAX30100_LED_CURRENT_50MA)
{
redLEDCurrent++;
setLEDCurrents( redLEDCurrent, IrLedCurrent );
if(debug == true)
Serial.println("RED LED Current +");
}
else if(redLedDC - IRLedDC > MAGIC_ACCEPTABLE_INTENSITY_DIFF &&
redLEDCurrent > 0)
{
redLEDCurrent--;
setLEDCurrents( redLEDCurrent, IrLedCurrent );
if(debug == true)
Serial.println("RED LED Current -");
}
lastREDLedCurrentCheck = millis();
}
}
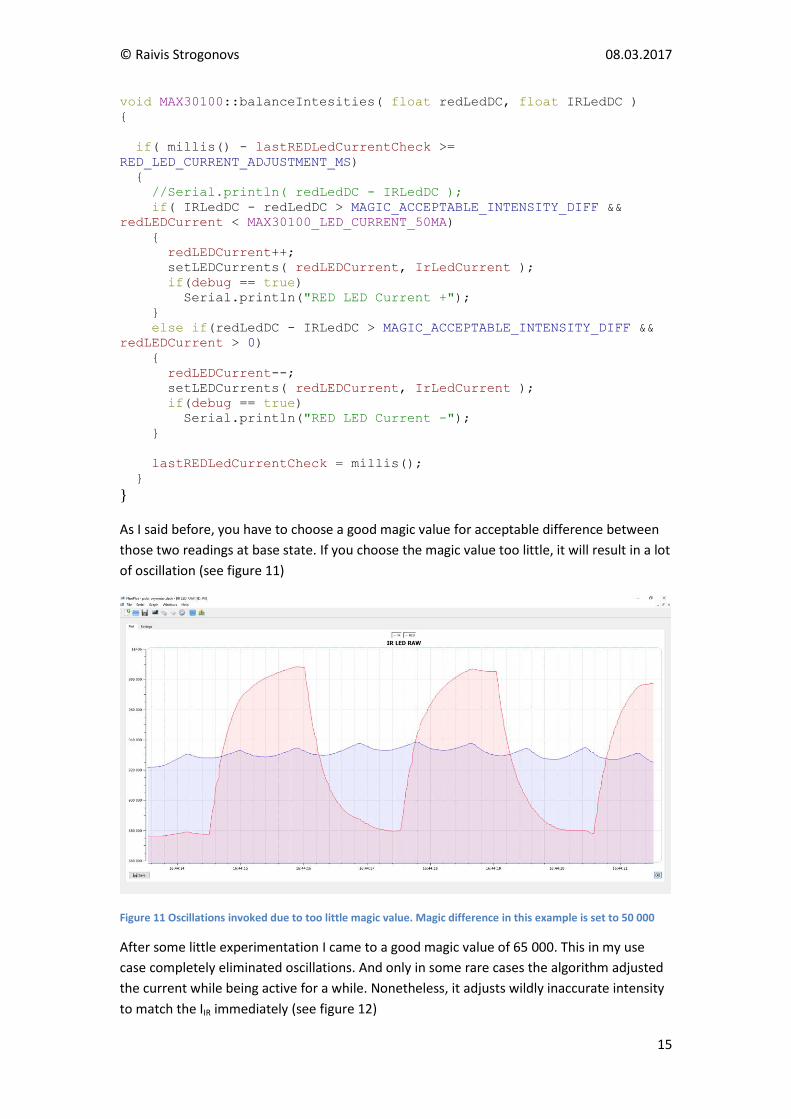
As I said before, you have to choose a good magic value for acceptable difference between
those two readings at base state. If you choose the magic value too little, it will result in a lot
of oscillation (see figure 11)
Figure 11 Oscillations invoked due to too little magic value. Magic difference in this example is set to 50 000
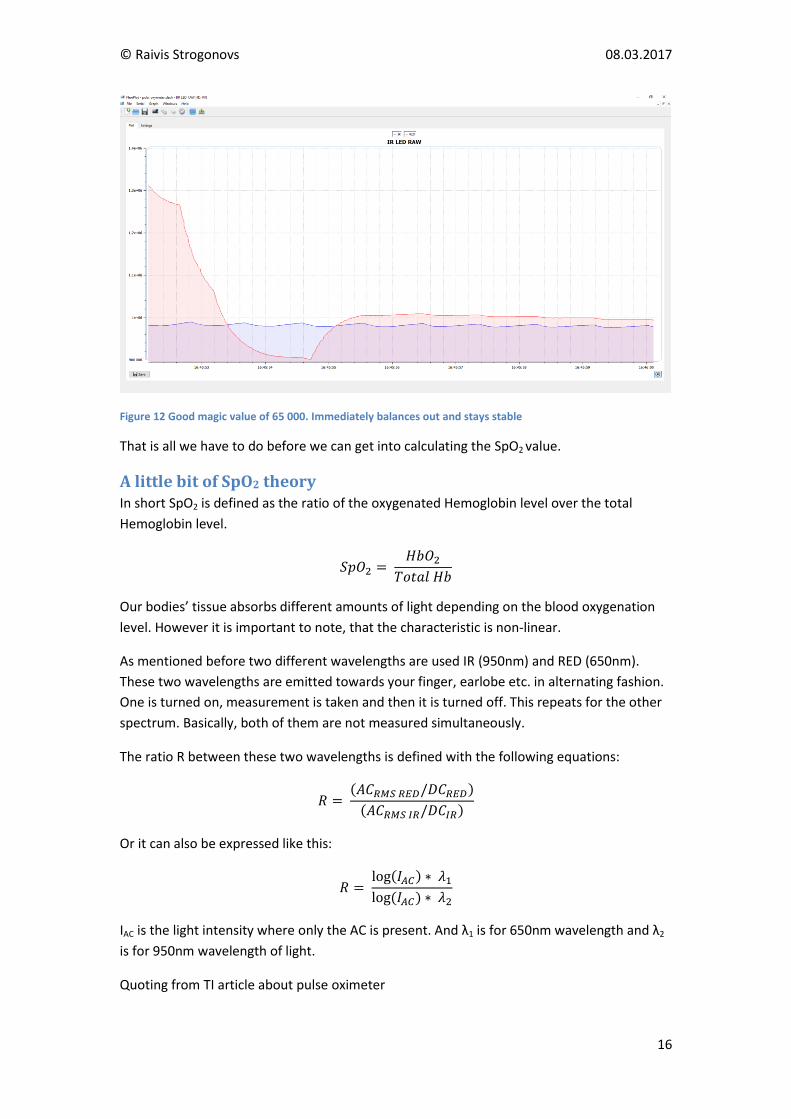
After some little experimentation I came to a good magic value of 65 000. This in my use
case completely eliminated oscillations. And only in some rare cases the algorithm adjusted
the current while being active for a while. Nonetheless, it adjusts wildly inaccurate intensity
to match the IIR immediately (see figure 12)
© Raivis Strogonovs 08.03.2017
16
Figure 12 Good magic value of 65 000. Immediately balances out and stays stable
That is all we have to do before we can get into calculating the SpO2 value.
A little bit of SpO2 theory In short SpO2 is defined as the ratio of the oxygenated Hemoglobin level over the total
Hemoglobin level.
Our bodies’ tissue absorbs different amounts of light depending on the blood oxygenation
level. However it is important to note, that the characteristic is non-linear.
As mentioned before two different wavelengths are used IR (950nm) and RED (650nm).
These two wavelengths are emitted towards your finger, earlobe etc. in alternating fashion.
One is turned on, measurement is taken and then it is turned off. This repeats for the other
spectrum. Basically, both of them are not measured simultaneously.
The ratio R between these two wavelengths is defined with the following equations:
( )
( )
Or it can also be expressed like this:
( ) ( )
IAC is the light intensity where only the AC is present. And λ1 is for 650nm wavelength and λ2
is for 950nm wavelength of light.
Quoting from TI article about pulse oximeter
© Raivis Strogonovs 08.03.2017
17
“Once the DC levels match, then the SpO2 is calculated by dividing the logs of the RMS
values”
As you know, we have already balanced our DC levels, and only thing left to do is to calculate
RMS for both IIR and IRED
If you don’t know, calculating basic RMS value is extremely simple; you just have to take the
sum of squares of your signal, average them and then take square root of the average. It
won’t be true RMS, but more than enough for our application.
See this article for basic explanation: http://practicalphysics.org/explaining-rms-voltage-and-
current.html
I also want to stress out, that RMS values how to be calculated for the whole signal, not only
when there is a pulse. And it is advised to reset it once in a while; otherwise it will hold
whole historical garbage data. In my final implementation I reset RMS every 4 heart beats.
Now that we have calculated the RMS values for both of our wavelengths, and also
calculated ratio R value, only thing left to do is to calculate the actual SpO2 value.
This is where it gets very interesting. To be able to have precise measurements of the
oxygen saturation, you’ll need to calibrate the sensor. There is no formula which fits them
all.
Nonetheless a standard model of computing SpO2, which is referenced basically in all text
books, is as follows:
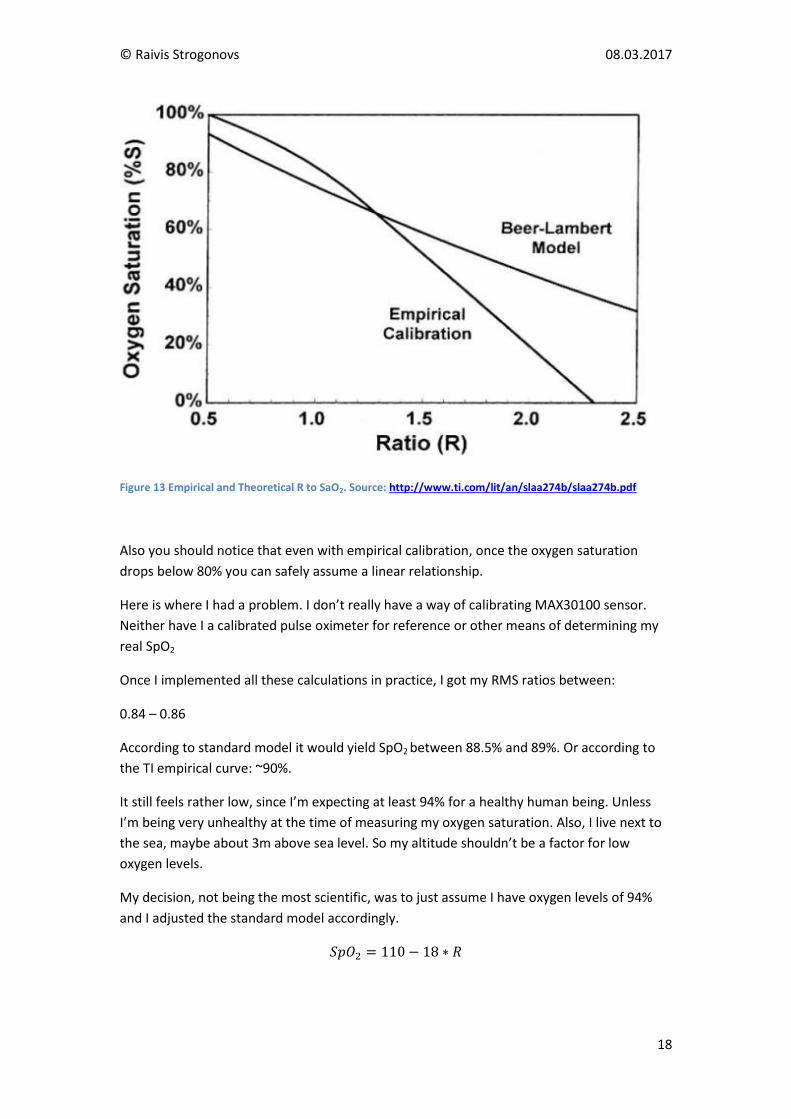
As I said before, the relationship is non-linear. But standard model is clearly suggesting a
linear relationship which is not true. See figure 13 for an excellent comparison between
empirical and theoretical R to SpO2
© Raivis Strogonovs 08.03.2017
18
Figure 13 Empirical and Theoretical R to SaO2. Source: http://www.ti.com/lit/an/slaa274b/slaa274b.pdf
Also you should notice that even with empirical calibration, once the oxygen saturation
drops below 80% you can safely assume a linear relationship.
Here is where I had a problem. I don’t really have a way of calibrating MAX30100 sensor.
Neither have I a calibrated pulse oximeter for reference or other means of determining my
real SpO2
Once I implemented all these calculations in practice, I got my RMS ratios between:
0.84 – 0.86
According to standard model it would yield SpO2 between 88.5% and 89%. Or according to
the TI empirical curve: ~90%.
It still feels rather low, since I’m expecting at least 94% for a healthy human being. Unless
I’m being very unhealthy at the time of measuring my oxygen saturation. Also, I live next to
the sea, maybe about 3m above sea level. So my altitude shouldn’t be a factor for low
oxygen levels.
My decision, not being the most scientific, was to just assume I have oxygen levels of 94%
and I adjusted the standard model accordingly.
© Raivis Strogonovs 08.03.2017
19
I really have to stress out! This is not a scientific or proper way of determining SpO2. You
must have a proper calibration in place; this is merely an estimate (and extremely poor at
that)!
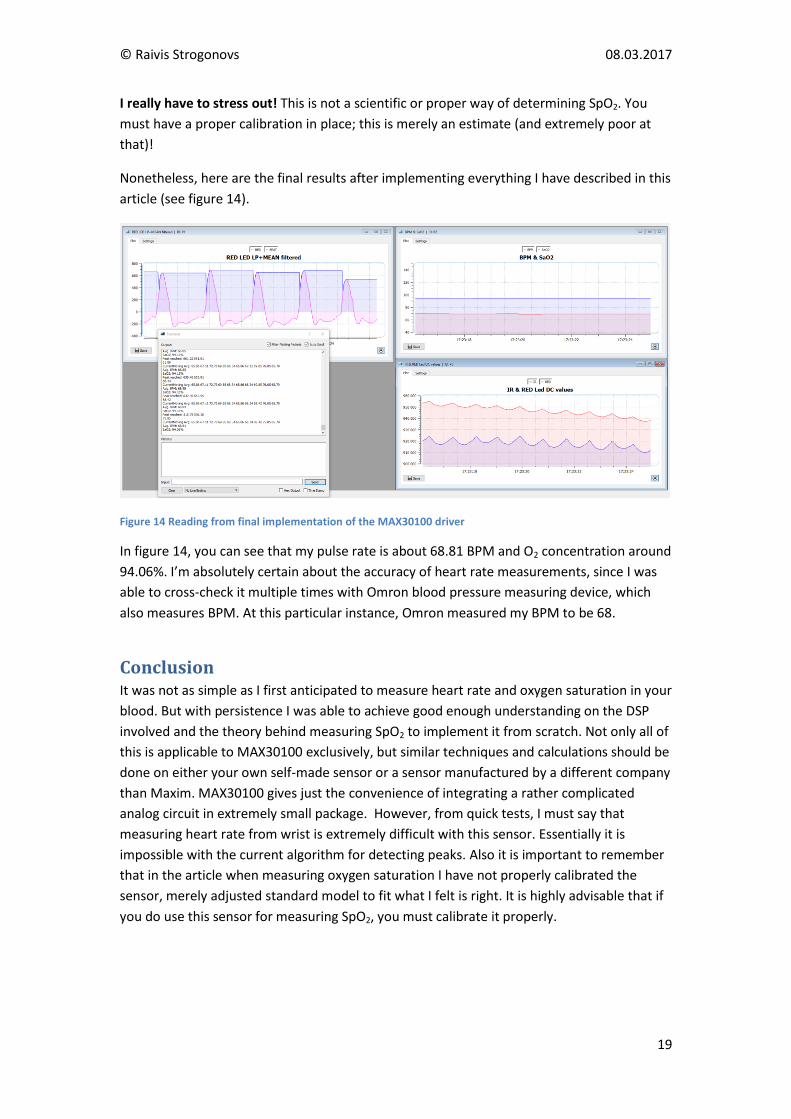
Nonetheless, here are the final results after implementing everything I have described in this
article (see figure 14).
Figure 14 Reading from final implementation of the MAX30100 driver
In figure 14, you can see that my pulse rate is about 68.81 BPM and O2 concentration around
94.06%. I’m absolutely certain about the accuracy of heart rate measurements, since I was
able to cross-check it multiple times with Omron blood pressure measuring device, which
also measures BPM. At this particular instance, Omron measured my BPM to be 68.
Conclusion It was not as simple as I first anticipated to measure heart rate and oxygen saturation in your
blood. But with persistence I was able to achieve good enough understanding on the DSP
involved and the theory behind measuring SpO2 to implement it from scratch. Not only all of
this is applicable to MAX30100 exclusively, but similar techniques and calculations should be
done on either your own self-made sensor or a sensor manufactured by a different company
than Maxim. MAX30100 gives just the convenience of integrating a rather complicated
analog circuit in extremely small package. However, from quick tests, I must say that
measuring heart rate from wrist is extremely difficult with this sensor. Essentially it is
impossible with the current algorithm for detecting peaks. Also it is important to remember
that in the article when measuring oxygen saturation I have not properly calibrated the
sensor, merely adjusted standard model to fit what I felt is right. It is highly advisable that if
you do use this sensor for measuring SpO2, you must calibrate it properly.
© Raivis Strogonovs 08.03.2017
20
References ElectronicsTutorials. “Butterworth Filter Design.” ElectronicsTutorials. n.d.
http://www.electronics-tutorials.ws/filter/filter_8.html (accessed February 17,
2017).
Erken, Eray. How to Measure Heart Rate with MAX30100 Pulse Oximeter. 30 April 2016.
https://www.youtube.com/watch?v=36cELpNGJZYHow to Measure Heart Rate with
MAX30100 Pulse Oximeter (accessed December 1, 2016).
Intersecans, OXullo. Arduino-MAX30100. n.d. https://github.com/oxullo/Arduino-MAX30100
(accessed January 20, 2017).
IOP Institute of Physics. Explaining rms voltage and current. n.d.
http://practicalphysics.org/explaining-rms-voltage-and-current.html (accessed
February 27, 2017).
Iowegian International. “IIR Filter Basics.” dspGuru. n.d.
http://dspguru.com/dsp/faqs/iir/basics (accessed December 3, 2016).
Kennedy, Stephen M. “AN INTRODUCTION TO PULSE OXIMETERS: EQUATIONS AND
THEORY.” University of Wisconsin-Madison. 20 April 2015.
http://www.imt.liu.se/FoUtb/kurser/oxikurs/restricted/pulseoximetersequationsan
dtheory-stephenkennedy.pdf (accessed January 15, 2017).
Koblenski, Sam. Everyday DSP for Programmers: DC and Impulsive Noise Removal. 23
November 2015. http://sam-koblenski.blogspot.co.uk/2015/11/everyday-dsp-for-
programmers-dc-and.html (accessed December 4, 2016).
Lopez, Santiago. “Pulse Oximeter Fundamentals and Design.” NXP. November 2012.
http://www.nxp.com/assets/documents/data/en/application-
notes/AN4327.pdf?&tid=AMdlDR (accessed January 17, 2017).
Maxim. “Pulse Oximeter and Heart-Rate Sensor IC for Wearable Health.” MaximIntegrated.
September 2014. https://datasheets.maximintegrated.com/en/ds/MAX30100.pdf
(accessed November 18, 2016).
Sang-Soo Oak, Praveen Aroul. “How to Design Peripheral Oxygen Saturation (SpO2) and
Optical Heart Rate Monitoring (OHRM) Systems Using the AFE4403.” TI. March 2015.
http://www.ti.com/lit/an/slaa655/slaa655.pdf (accessed December 5, 2016).
Tilakaratna, Prasanna. How pulse oximeters work explained simply. n.d.
https://www.howequipmentworks.com/pulse_oximeter/ (accessed November 22,
2016).
Vincent Chan, Steve Underwood. “A Single-Chip Pulsoximeter Design Using the MSP430.” TI.
February 2012. http://www.ti.com/lit/an/slaa274b/slaa274b.pdf (accessed January
20, 2017).