impact of the raw water seasonal variations on the reverse
TRANSCRIPT

359
Original ArticleImpact of the Raw Water Seasonal Variations on the Reverse
Osmosis Performance: Khenifra Plant, MoroccoHicham Boulahfa1, Sakina Belhamidi1, Fatima Elhannouni1, Mohamed Taky1, Abdelhakim El Fadil2,
Azzedine Elmidaoui1
1 Laboratory of Separation Processes, Department of Chemistry, Faculty of Sciences, Ibn Tofail University, Kenitra, Morocco
2 Dow Deutschland Anlagengesellschaft, Rheinmunster, Germany
ABSTRACTReverse osmosis (RO) plays an outstanding role in water desalination worldwide. Performance of this technique depends on membrane fouling and the raw water seasonal variations, especially tem-perature and raw water salt concentration. Hence, to neutralize the impact of temperature and feed concentration on the performance parameters, the data collected from the brackish surface water plant were standardized through the use of the American Society for Testing and Materials methods. The value of this normalization is to be able to discern the performance variation which is due to the membrane aging and the membrane fouling, scaling or degradation. The present research investigates the real industrial results gathered from the first experience of brackish surface water demineraliza-tion by RO in Morocco. The results obtained evidently show that the feed water is subject to serious seasonal variations in terms of feed temperature and feed salts concentration, which noticeably affect the feed pressure, membrane permeability, and permeate conductivity. The standardized permeate flow, standardized pressure drop, and standardized salt passage show that the performance of the plant was steady all over the period of the monitoring and the observed performance decline-was due to membrane fouling.
Keywords: brackish surface water, reverse osmosis, desalination, performance, normalization
INTRODUCTION
The most critical issue threatening people around the globe by the 21st century is the overall water insufficiency [1–6], under which many areas of the world will face chronic water scarcity owing to climate change, demographic development and increased water pollution [4,7]. The amount of potable water available in our planet is less than 3% of the overall water resources, the rest is salt water [8,9]. According to the reports of water authorities, universally, the issue is aggra-vating as cities and populations expand dramatically, and the needs for water increase in the industry [10].
The application of unconventional methods, principally brackish water and seawater desalination, becomes a crucial and imperative solution to provide drinking water [11,12]. In
areas experiencing great problems of water deficit, desalina-tion of saline water plays a crucial role in supplying potable water for the population [13,14].
Owing to current advancement in membrane separation technology, the tendency in desalination industries is to ap-ply reverse osmosis (RO) technique for saline water desalting [14]. As the salinity of groundwater increases, water desali-nation process becomes more expensive [11]. RO is among the credible and economical techniques to overcome water deficiency and has been largely applied in water desalination [4,15–17].
Among all the desalination techniques, RO has been extensively utilized in water treatment to take out various impurities, including viruses and dissolved organic matter [18,19]. Once it is able to provide drinking water from raw water containing dissolved salts, really with low energy consumption, RO separation method has gained great im-
Corresponding author: Hicham Boulahfa, E-mail: [email protected]: March 25, 2019, Accepted: June 25, 2019, Published online: October 10, 2019Copyright © 2019 Japan Society on Water Environment
Journal of Water and Environment Technology, Vol.17, No.5: 359–374, 2019doi: 10.2965/jwet.19-028

Journal of Water and Environment Technology, Vol. 17, No. 5, 2019 360
portance in the water industry around the world [19–22].However, RO technique is still limited by the membrane
fouling phenomenon. The key interest of the preliminary treatment steps is the elimination of solids in suspension, colloids, and dissolved matters, avoiding bacterial devel-opment, and preventing scaling problems [23–26]. The RO performance is impacted by fouling formation, which leads to the augmentation in power consumption, cleanup frequency and consumption of cleaning products, membrane substitution and water treatment expense [27]. Hence, it is essential to prevent fouling with the intention of enhancing the RO technique [27]. To identify fouling expansion, several parameters, including product flow rate, product conductiv-ity and differential pressure are measured. Nevertheless, this procedure is not reliable for detecting the issue of the deposited elements. To determine the species and amounts of the deposits, it is indispensable to carry out the membrane autopsy [28].
Water desalination applying the RO technique includes several parameters that need a deep investigation to un-derstand the relationship between operation and design parameters [29]. To understand deeply the operation of RO plant, it is crucial to collect the correct and significant data, to interpret the gathered data using the required analytical methods, and to carry out operations of maintenance in order to ensure the correct operation of the RO and pretreatment systems as designed [30].
Data standardization was elaborated to provide the RO performance comparison at different times by ‟neutralizing” via standardization the impacts of temperature, pressure, and salts concentration on the operation parameters. Stan-dardization transforms the gathered data at a given time and conditions to those at a designed initial time, generally at startup of the RO plant operation [31]. In this way, influences of temperature, pressure, and salt concentration are discarded in order that the variations in standardized performance are a consequence of membrane fouling, scaling, and/or deteriora-tion [30].
The Khenifra RO Plant is the first water treatment plant in Morocco, which combines conventional treatment with RO process. The plant will cover the production of 36.290 m3/d of potable water by the year 2030 [31]. This brackish water RO plant was commissioned in June 2013 and since back then the RO plant unit performance has experienced several ups and downs.
The main aims of this paper were to report the real in-dustrial results gathered from the first experience of brack-ish surface water demineralization by RO in Morocco, to
explain the influence of the raw water seasonal variations on RO operating parameters, to evaluate the RO performance regardless of the seasonal variations via data normalization, to show that theoretical predictions match in a conservative way to the practical applications, and to bring to light a real industrial topic that will be good practice for the water indus-try projects worldwide.
MATERIALS AND METHODS
Plant process descriptionThe RO demineralization plant that is the subject of our
study is situated in Morocco; it was designed to desalinate brackish surface water coming from the dam in order to di-minish chloride concentrations from 866 mg/L to 250 mg/L.
Pretreatment processThe pretreatment consists of a conventional treatment en-
closing coagulation-flocculation, lamellar settling, and dual media filtration [31].
Aluminum sulfate was injected continuously during coag-ulation process and was extensively used in water treatment, this coagulant can modify the colloids charge characteristics to promote aggregation of small particles in greater flocs [31–33] for a contact time of about 2 minutes. The dosing rate depends on the feed water suspended solids. The aver-age dosing rate was approximately 25 mg/L for a pH ranging between 7.5 and 8.
Acidification (H2SO4) was ultimately needed to further effective coagulation for the solids in suspension [31]. It was injected if necessary to correct the pH inlet of coagulation.
Anionic polymer was performed continuously during floc-culation process for a detention time of about 20 minutes. The flocculation aims to gather destabilized colloids through the medium of a slow stirring [31]. The dosing rate depends on the feed water suspended solids. The average dosing rate was approximately 0.1 mg/L.
Lamellar settling consists of suspended solids and colloids separation that are gathered in flocs throughout the floccula-tion process [31].
Dual media filtration was conducted.
Reverse osmosis processFigure 1 illustrates the RO system. It contains 3 trains.
Each train has one pass and two stages. The first and second stages include 52 and 23 pressure vessels, respectively. Ev-ery pressure vessel is loaded with 7 FilmTecTM XLE440 RO elements [34].

Journal of Water and Environment Technology, Vol. 17, No. 5, 2019 361
Three cartridge filters of 5 micron are installed upstream of the RO units [31]. They operate as a security device that secures the FilmTecTM elements and the pumps [14].
The high pressure pumps are equipped with speed control-lers, connected to an automatic regulator called proportional integral derivative (PID) [31]. This regulation allows the control of the permeate set point flow rate with respect to the flow measurement.
The following reagent injections are carried out in the inlet of the RO units:
• H2SO4 injection: It was provided to diminish the calcium carbonate (CaCO3) deposition on the membrane surface [35]. The injection was carried out continuously with a dosing rate of 20 mg/L.
• Antiscalant addition: It was injected to avoid CaSO4 deposition on the membrane surface [35]. The injec-tion was carried out continuously with a dosing rate of 3 mg/L.
• Dechlorination: Injection of sodium bisulphate was done in order to prevent polyamide membrane deterioration [28].
The injection was carried out continuously with an average dosing rate of about 2 mg/L. The dosing rate depended on the filtered water free chlorine concentra-tion.
Feed water characteristicsThe chemical composition of the feed water at the inlet of
the reverse osmosis system is shown in Table 1.
FilmTecTM Reverse Osmosis elementThe RO FilmTecTM element utilized in the present work
was an 8-inch spiral wound element (FILMTECTMXLE440, USA) containing 28 mil feed spacers. According to the con-structor, the product flow and salt rejection of the elements under the normal conditions were 36.8 L/min and 99.5%, respectively (standard conditions: 2000 ppm NaCl, 125 psi (8.6 Bar), 77°F (25°C), pH 8, and 15% recovery) [31].
The FilmTecTM element belongs to the FILMTEC™ FT30 membrane family. It is constituted of thin film composite membrane consisting of three layers: a polyester support
Fig. 1 Flow chart of Khenifra Demineralization Plant.

Journal of Water and Environment Technology, Vol. 17, No. 5, 2019 362
web, a micro-porous polysulfone interlayer, and an ultra-thin polyamide barrier layer on the upper surface [31]. Each layer is adapted to special specifications. The diagram of the ele-ment is presented in Fig. 2.
Microfiltration cartridgesThe microfiltration contains PALL Claris5 micron car-
tridges based on polypropylene [31].
MethodsThe software GENESYS MM4 version: v1.22.1 (DLL
v1.8.7) was used to determine the antiscalant dose [31].The WTW laboratory conductivity meter inoLab Cond
7110 was utilized to measure the permeate conductivity [31].
Membrane cleaning procedureTo perform the cleaning in place, it is required to use the
permeate dechlorinated water in order to prevent the degra-dation of the polyamide layer [28].
There exist six main phases in the membrane chemical cleaning in place [28].
1) preparation of the chemical cleaning solutions2) pumping of the prepared chemical solution to the
pressure vessels under the terms of minimal flow and minimal pressure to evacuate existing water from the pressure vessels
3) monitoring of the cleaning solution chemical proprieties and rectifying some parameters such as temperature and pH
4) soaking of the membrane elements by turning off the pump
5) high flux rinsing: supply the chemical solution for 30–60 min. The operation is launched once the differential pressure raises by 15% [28]
6) rinsing the chemical solution contained in the mem-branes with the RO permeate
It is required to clean the RO stages independently and after starting the plant the first production is rejected [28].
Operating data and normalizationThe RO desalination plant exploitation requirements
including supply pressure, recovery rate, and feed water characteristics can change, resulting in variation of produc-tion flow and salt rejection. It is required to contrast produc-tion flow and salt rejection values according to the similar
Table 1 Feed water characteristics at the inlet of the reverse osmosis demineralization plant.Chemical composition AmountpH 8Alkalinity TAC,°F 17.6Calcium (Ca), mg/L 95Magnesium (Mg), mg/L 32.5Sodium (Na), mg/L 466Potassium (K), mg/L 2.9Manganese total, mg/L 0Aluminum (Al), mg/L < 0.2Iron, mg/L < 0.03Bicarbonate, mg/L 214Chloride, mg/L 866Sulphate, mg/L 117Silica (SiO2), mg/L 14Nitrate, mg/L 6.49Total dissolved solids TDS, mg/L 1 800FilmTecTM reverse osmosis element
Fig. 2 Membrane composition: a: polyamide 0.2 micro-m, b: micro-porous polysulfone 40 micro-m, c: polyester sup-port web, ultra-thin barrier layer 120 micro-m [32].

Journal of Water and Environment Technology, Vol. 17, No. 5, 2019 363
conditions of operation, thus the procedure utilized for the RO data was the American Society for Testing and Materials standard [36,37].
Standardization provides data on salt flow, product flow, differential pressure and conductivity of the product to be rectified under a set of standard conditions. Consequently, the operating performance of the installation can be evalu-ated and adapted to the different operating conditions [36].
The RO data program [36] was carried out in the present research to standardize the operating parameters relative to temperature, pressure, and osmotic pressure as well as the measured parameters for the first control point for the period of the installation commissioning [28].
Normalization method:The normalization of the RO operation data was carried
out using the ASTM method [38]. The principal equations integrated with this technique were [39]:
a. Normalization of the permeate flow
fb f
1 C C ln / Y1 Y = −
(1)
where Cfb is the feed-brine concentration in mg/L NaCl, Cf is the feed concentration in mg/L NaCl, and Y is the fractional water recovery.
( ) ( )fb fb fbOP 0.2654 C T 273.15 / 1000 C /1000= + − (2)
where OPfb is the feed-brine osmotic pressure.
fbsfs ps fbs ps s
PDA P P OP OP TCF
2 = − − − +
(3)
Where Pfs, PDfbs, Pps, OPfbs, OPps and TCFs are feed pres-sure, average feed-brine pressure drop, permeate pressure, average feed-brine osmotic pressure, permeate osmotic pres-sure, and temperature correction factor at standard condi-tions, respectively. The standard conditions were taken from the standard sample, which was the closest to the averages in terms of feed water conductivity and pH, temperature, feed pressure, etc.
fbafa pa fba pa a
PDB P P OP OP TCF
2 = − − − +
(4)
where Pfa, PDfba, Ppa, OPfba, OPpa and TCFa are feed pres-sure, average feed-brine pressure drop, permeate pressure, average feed-brine osmotic pressure, permeate osmotic pres-
sure, and temperature correction factor at actual conditions, respectively.
pa sps
a
Q .A.TCF Q
B.TCF=
(5)
where Qps and Qpa are permeate flow in standard and real conditions, respectively.
b. Normalization of the salt passage
a a fbs fas
s fba fs
EPF .%SP .B C .C %SP
EPF .A.C .C=
(6)
Where EPFa, EPFs, SPs, SPa, Cfbs, Cfba, Cfa and Cfs are the average element permeate flow, salt passage, average feed-brine concentration, and feed concentration at standard (reference) and real (actual) conditions, respectively.
c. Normalization of the pressure dropNormalized RO linear concentrate-side pressure drop was
calculated according to equation (7),
( )( )
1.5
bs pss s 1.5
ba pa
2.Q QP P
2.Q Q
+=
+
(7)
where Qbs, Qps, Qba and Qpa are the brine flow, permeate flow at standard conditions, brine flow, and permeate flow at actual conditions, respectively and ΔP is the pressure drop.
RESULTS AND DISCUSSION
In this section of the paper, the first part intends to examine the feed water seasonal variation and its impact on RO oper-ating parameters. The second part analyses the performance of the RO operating parameters, and the last part discusses the RO normalized parameters.
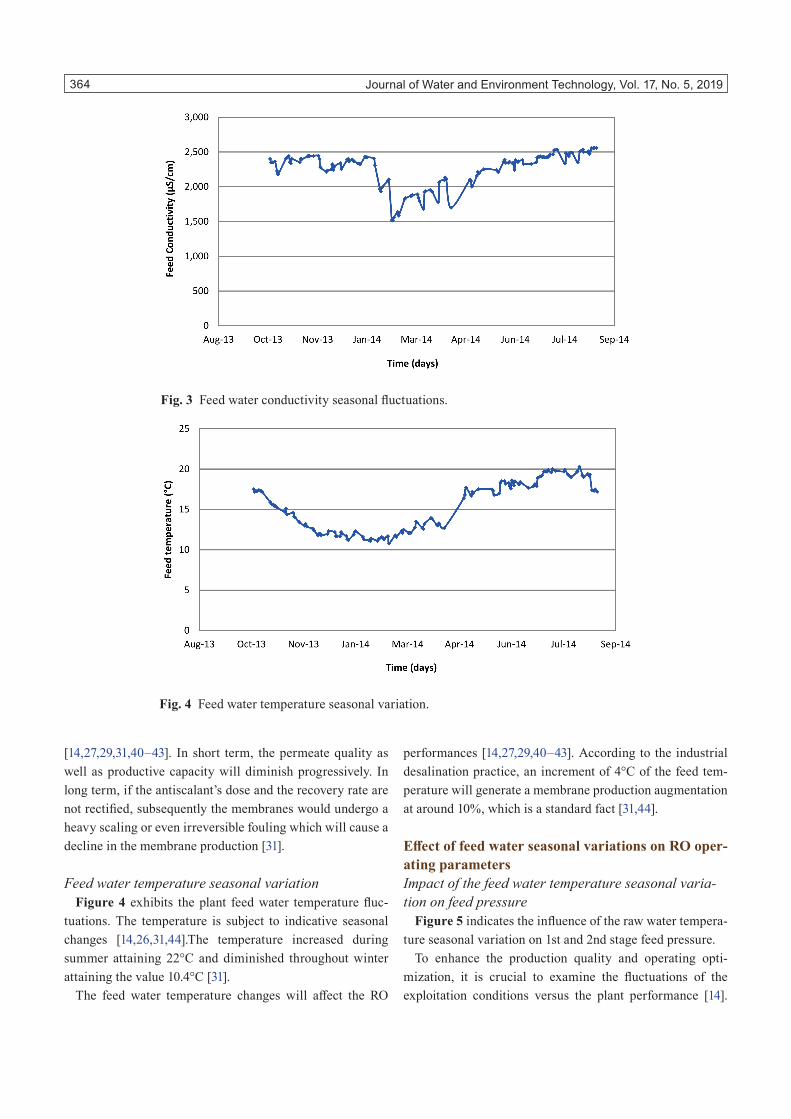
Feed water seasonal variationsFeed water conductivity seasonal variation
Figure 3 illustrates the variations of the feed water con-ductivity supplying the treatment plant. The conductivity experienced significant seasonal fluctuations [14,26,31]. It was enhanced during the summer attaining 2512.3 µS/cm. This enhancement was due to the temperature increase in summer which led to water evaporation, while in winter, the rain led to the dilution which decreased the conductivity at-taining the value of 1333.8 µS/cm [31].
Certainly, the conductivity boost will considerably af-fect the membrane production in short and long terms
Journal of Water and Environment Technology, Vol. 17, No. 5, 2019 364
[14,27,29,31,40–43]. In short term, the permeate quality as well as productive capacity will diminish progressively. In long term, if the antiscalant’s dose and the recovery rate are not rectified, subsequently the membranes would undergo a heavy scaling or even irreversible fouling which will cause a decline in the membrane production [31].
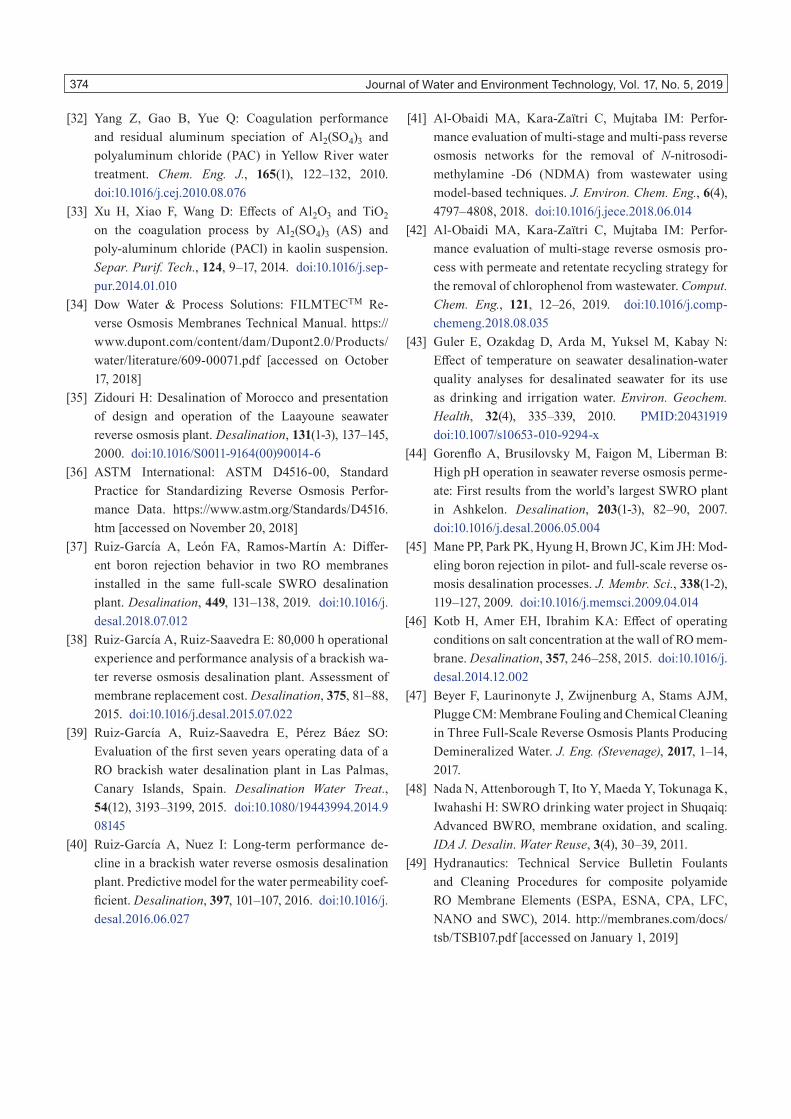
Feed water temperature seasonal variationFigure 4 exhibits the plant feed water temperature fluc-
tuations. The temperature is subject to indicative seasonal changes [14,26,31,44].The temperature increased during summer attaining 22°C and diminished throughout winter attaining the value 10.4°C [31].
The feed water temperature changes will affect the RO
performances [14,27,29,40–43]. According to the industrial desalination practice, an increment of 4°C of the feed tem-perature will generate a membrane production augmentation at around 10%, which is a standard fact [31,44].
Effect of feed water seasonal variations on RO oper-ating parametersImpact of the feed water temperature seasonal varia-tion on feed pressure
Figure 5 indicates the influence of the raw water tempera-ture seasonal variation on 1st and 2nd stage feed pressure.
To enhance the production quality and operating opti-mization, it is crucial to examine the fluctuations of the exploitation conditions versus the plant performance [14].
Fig. 3 Feed water conductivity seasonal fluctuations.
Fig. 4 Feed water temperature seasonal variation.

Journal of Water and Environment Technology, Vol. 17, No. 5, 2019 365
To determine the effect of the raw water temperature on the RO feed pressure regardless of the conductivity variations and fouling phenomenon, a monitoring was performed in the period between October 2013 and January 2014, where the conductivity was relatively steady.
During the first days of the plant commissioning, the feed temperature was around 17.2°C. Supplied pressure values to the 1st and 2nd stages were 11.1 and 9.2 bars, respectively. After about two months of operation, the temperature gradu-ally decreased to a minimum of 11.2°C. This decrease was followed by a gradual increase in the supply pressure of the two stages. Indeed, the pressure of the 1stand 2ndstage passed to 12.8 and 10.5 bars, respectively. The pressure in-crease was due to the feed temperature decline that changed the structure and physical characteristics of the polymeric membrane such as the pore size [14,29]. Also the augmen-tation of the feed temperature diminished water viscosity [14,41] and therefore affected the pressure.
As a consequence, in these operating conditions, a raw water temperature decline of 6°C generated an increase of the feed pressure of about 1.7 bars in the 1st stage and 1.3 bars in the 2nd stage.
Influence of the supply temperature seasonal variation on RO membrane permeability
Figure 6 displays the impact of the feed temperature [29] seasonal variation on membrane permeability of the 1st and 2nd stages.
The temperature of the feed water diminished gradually. It passed from 17.2 to 11.2°C after about three months of operation. This significant decline affected the membrane permeability of both stages. In fact, the membrane perme-ability varied from 2.9 L/(h∙m2∙bar) to 2.5 L/(h∙m2∙bar) in the 1st stage and from 2.3 to 2.04 L/(h∙m2∙bar) in the 2nd stage.
It can be concluded that according to these operating con-ditions, a temperature decline of 6°C results in a membrane permeability decline of about 0.4 L/(h∙m2∙bar) in the 1st stage and 0.26 L(/h∙m2∙bar) in the 2nd stage.
This performance decline might be attributed to the fact that the temperature of the RO operation substantially in-fluenced the permeability constant of the membrane [41]. In addition to the temperature impact, the fouling and/or scal-ing along these months of operation have a significant effect on RO membranes.
Specifically, the composition of the membrane, transport parameters of water and solute besides physical character-istics were affected with the feed temperature diminution. Hence, decreasing the temperature led to decreasing the flux of the solute across membranes as a consequence of reducing membrane pore size [14,29,42]. This is mainly indicated by various scientists such as Mane et al. [45] and Kotb et al. [46].
To that end, every augmentation in the temperature of the plant feed water will diminish water viscosity and raise the water transport factor [14,41]. However, increasing the feed temperature introduces an increase in the flow rate across
Fig. 5 Influence of the raw water temperature on the feed pressure of the 1st and 2nd stages.

Journal of Water and Environment Technology, Vol. 17, No. 5, 2019 366
the membrane, owing to the thermodynamic augmentation in the osmotic pressure as a consequence of an augmentation in the permeability factor [41].
The permeability of the 2nd stage continuously declined due to the influence of the scaling formation during the period of operation. However, the 1st stage permeability increased in order to compensate the 2nd stage permeance decline. This process is provided by the automatic regulation linked to the high pressure pump that controls the permeate flow set point regardless of the pressure increase.
Impact of feed water conductivity seasonal variation on permeate quality
As mentioned before, the conductivity of the feed water undergoes serious seasonal variation. The conductivity of the raw water reached a maximum of 2561 μS/cm in the dry season and decreased markedly during the rainfall season reaching a minimum value of 1515 μS/cm.
Figure 7 illustrates the influence of the raw water salt concentration seasonal variations on permeate conductivity of the 1st and 2nd stages.
To explain the impact of the feed water conductivity on the 1st and 2nd stage RO salt rejection regardless of the tempera-ture variations and fouling phenomenon, a monitoring of the permeate conductivity was performed in the period between December 2013 and April 2014, where the temperature was substantially stable.
Throughout the monitoring phase, the raw water conduc-tivity passed from an average of 2323 µS/cm over the dry
season to an average of 1788µS/cm over the rainy season, a decay of 23%. This progression influenced the membrane salt rejection.
As an outcome, 23% abatement in feed water conductivity has a considerable effect on permeate conductivity of the 1st and 2nd stages. Indeed, a 23% decline in feed conductivity resulted in 47.7% and 9.4% decrease in permeate conductiv-ity of the 1st and 2nd stages, respectively.
This permeate conductivity reduction is explained with the fact that an increase in raw water salt concentration gener-ated an augmentation in the osmotic pressure as well as the high salt concentration on the membrane area [46], which diminished the driving force of water flux throughout the membrane and diminished the recovery rate. This instead boosted the concentration polarization, which enhanced the solute flux. This on the other hand upgraded the product salinity. In that regard, it is reasonable to require that raising the salinity of the raw water will boost the membrane salt concentration, which previously starts a diminution of the mass transfer factor. Accordingly, increasing the salinity of the raw water led to a significant increase of permeate salin-ity [14,29,42].
Performance assessment of the RO operation pa-rameters
The RO unit that is the subject of this research was operat-ing according to low pressure conditions as a result of the low salinity of the supply water. This pressure is deemed to get over the osmotic pressure, friction losses and membrane
Fig. 6 Effect of the temperature on membrane permeability of the 1st and 2nd stages.

Journal of Water and Environment Technology, Vol. 17, No. 5, 2019 367
resistance [14]. The 1st and 2ndstage exploitation parameters such as supply pressure, differential pressure, permeate flow; temperature, recovery rate, and produced water conductivity were checked daily since the commissioning of the plant.
The figures below represent the plant operation data col-lected daily. Six diagrams of the demineralization plant operation over approximately one year of exploitation indicate plant performance. Figs. 8–12 exhibit the RO unit performance, mainly the fluctuation of supply pressure, dif-ferential pressure, product flow, recovery rate, and permeate conductivity [31].
The plant check-up aims to provide details that enable corrections to reduce the extent of fouling or ideally to an-ticipate fouling [27]. The RO unit that is the subject of this study experienced several ups and downs from October 2013 to August 2014.
From October 2013 to June 2014, the feed pressure varied substantially. It began to increase progressively and remark-ably due to the osmotic pressure that rose with the augmen-tation of the supply water salt concentration [29]. The feed pressure passed from around 11.1 to a maximum of 12.8 bars in the 1st stage and from around 9.2 to a maximum of 10.6
Fig. 7 Effect of feed conductivity on permeate quality of the 1st and 2nd stages.
Fig. 8 1st and 2nd stage reverse osmosis feed pressure.

Journal of Water and Environment Technology, Vol. 17, No. 5, 2019 368
bars in the 2nd stage after nearly two months (Fig. 8). Dur-ing the same period, the pressure drop augmented in both stages (Fig. 9). The permeate flux remained stable in both stages (Fig. 10) due to the automatic regulation linked to the high pressure pump that controlled the permeate set point regardless of the pressure increase [31]. Even the recovery rate showed a steady behavior (Fig. 11). The conductivity rose notably in the 1st stage and slightly increased in the 2nd stage (Fig. 12). This can be attributed to the augmentation of the feed water salt concentration [14,29,42].
From December 2013 to June 2014 the feed pressure of the
two stages declined gradually. After nearly two months of operation, the pressure stabilized around an average of 10.6 and 8.8 bars for the 1st and 2nd stage, respectively. This has immediately affected the pressure drop, although the recov-ery rate and the permeate flow showed stable behavior. The permeate conductivity has increased progressively in both stages. This boost is owing to the seasonal variations of the raw water salts [14,42].
From June to August 2014, the RO unit has experienced the fouling phenomena. It has occurred in June 2014 and July 2014, respectively.
Fig. 9 1st and 2nd stage reverse osmosis pressure drop.
Fig. 10 1st stage, 2nd stage and reverse osmosis unit permeate flow.

Journal of Water and Environment Technology, Vol. 17, No. 5, 2019 369
During June 2014, the feed pressure has suddenly in-creased and achieved 13 bars in the 1st stage and 11.2 bars in the 2nd stage (Fig. 8). The feed pressure ups and downs have substantially impacted the other functioning measures including the permeate flow, pressure drop, recovery rate, and permeate quality (Figs. 9–12). The permeate flow rate enhanced from 300 to 350 m3/h in the 1st stage and from 95 to 37 m3/h in the 2nd stage (Fig. 10). The 1st stage production flow rate increase is explicated by the automatic regulation PID [31], connected to the frequency regulator of the high-pressure pump [31]. This control warrants the controlling of the production set point flow in relation to the flow measure-
ment. It offsets the flux decay in the 2nd stage by boosting the 1st stage flux [31].
The recovery rate expanded in the 1st stage while it di-minished in the 2nd stage (Fig. 11) owing to the permeate flow fluctuation [31]. The differential pressure augmented to a certain extent in the 1st stage as a consequence of the flux rise; likewise, it declined in the 2nd stage (Fig. 9), as a result of the flux decreasing across the membranes because of the 2nd stage membrane fouling (Fig. 10) [31].
The 1st stage permeate conductivity was steady (Fig. 12); moreover, it raised in the 2nd stage as consequence of the salt passage increase, caused by the possible precipitation of the
Fig. 11 1ststage, 2nd stage and reverse osmosis unit recovery rate.
Fig. 12 1st stage, 2nd stage and reverse osmosis unit permeate conductivity.

Journal of Water and Environment Technology, Vol. 17, No. 5, 2019 370
salts comprised in the supply water on the membrane area, particularly, the salts NaCl, CaCO3,and CaSO4 [31].
The production flux decline signifies organic fouling. However, the progressive augmentation of the product salin-ity shows inorganic scaling [28,31].
Performance assessment of the plant normalized data
To neutralize the impact of the temperature, feed pressure, and feed concentration on the RO operation parameters and assess correctly the plant performance, the data gathered over the monitoring period were normalized [30].
Figure 13 illustrates the fluctuation of the normalized permeate flow (NPF) of the 1st stage and 2nd stage.
Since the plant commissioning, the 2nd stage NPF showed a steady behavior during seven months of operation. How-ever, the 1st stage NPF began to decline from the first days of operation. The NPF remained below the start-up value throughout six months of operation. In the beginning of May 2014, the 1st stage NPF decreased gradually reaching a mini-mal value, 77% lower than the start-up value. Throughout the same period the 1st stage NPF increased gradually and exceeded its start-up value of about 34%. The performances decline is a consequence of the production deterioration particularly membrane fouling and scaling throughout the period of operation [40].
The decrease of NPF is obvious, which implies the exis-tence of fouling and/or scaling [30]. The scaling can result from the major salts present in the feed water such as NaCl,
CaCO3, and CaSO4 [31]. These salts can precipitate and cause membrane scaling, especially at the 2nd stage, sup-plied by the concentrate of the 1st stage. However, the foul-ing of the 1st stage might be generated by eventual bacterial development or by the organic matter included in the feed water provided from the surface water, which was very rich in organic matter.
Figure 14 describes the progression of the normalized dif-ferential pressure (NDP). The NDP of the 1st and 2nd stage was relatively steady over time between October 2013 and June 2014. Since back then it increased noticeably in the 1st stage and declined in the 2nd stage.
Figure 15 presents the normalized salt rejection (NSR); it shows that the NSR was quite stable over the phase of the follow-up. Thus, we can presume the absence of some types of chemical or physical deterioration of the RO membranes [39].
To restitute the initial performance of RO unit and control the fouling phenomenon [47], the Dow FilmTecTM company recommended to carry out a standard chemical cleaning, ap-plying basic (1% 4Na-EDTA + 0.1% NaOH) and acidic (0.2% HCl) chemical solutions [26,31,48].
Basic chemical agents including sodium hydroxide (NaOH) clean off organic fouling and biofouling by hydrolysis and solubilization; instead, acid agents including hydrochloric acid (HCl) disperse inorganic fouling, break up the composi-tion of the bacterial cell wall and promote precipitation of proteins [24,32,47,49]. Concerning RO membranes, cleaning procedures involve various steps of high flow recirculation
Fig. 13 1st and 2nd stage reverse osmosis normalized permeate flow.

Journal of Water and Environment Technology, Vol. 17, No. 5, 2019 371
and soaking [31], enduring all over between 6.5 to 24 hours in period at a usual temperature of 35°C [32,47].
The cleaning with acidic solution was applied in order to disperse the salts precipitated on the membrane area, par-ticularly, NaCl, CaCO3, and CaSO4 included in supply water [31]. Basic cleaning was performed to remove organic fouling in particular biomass, which might be generated by eventual bacterial development or by the organic matter included in the raw water [31]. The 1st operation of chemical cleaning has been much successful. Indeed, the start-up flow rate of the 1st stage and 2nd stage were recovered. After almost one
week of running with steady parameters. The RO unit has faced a second membrane fouling phenomenon. The normal-ized parameters reveal the same behavior noticed over the first fouling phenomenon. Unluckily, due to the exploitation needs, the RO unit remained in operation, despite exceeding the values recommended by the membrane manufacturer. Preferably, membrane cleaning is programmed when the production drops by 10% and it will be necessarily finished when the performance enhanced by 15% [34,40]. Allowing the RO unit in operation for a long time without chemical cleaning can generate membrane irreversible fouling [40].
Fig. 14 1st and 2nd stage reverse osmosis normalized pressure drop.
Fig. 15 1st and 2nd stage reverse osmosis normalized salt rejection.

Journal of Water and Environment Technology, Vol. 17, No. 5, 2019 372
Luckily, the RO performance was restituted after the second chemical cleaning which was carried out using the same chemical products.
CONCLUSION
This article outlined the Khenifra RO plant performances after approximately one year of operation.
The check-up of feed water seasonal fluctuations, operating parameters (supply pressure, differential pressure, permeate flow rate, recovery rate, and product conductivity), and oper-ating normalized parameters were utilized to understand the reasons of the RO performance decline after approximately one year of exploitation. The following conclusions were obtained:
• The feed water is subject to serious seasonal variations.• The feed temperature affects both the feed pressure and
membrane permeability.• The normalized data shows that the plant performance
was steady and the performance decay was due to the membrane fouling and scaling.
• The theoretical predictions match in a conservative way to the industrial practical applications and will be good practice for the desalination projects.
To improve the operation of the Khenifra RO plant and achieve high performance, it is recommended to proceed with the pretreatment optimization and the membrane autopsy to identify the origin of the deposits on the RO membranes.
ACKNOWLEDGEMENTS
The authors gratefully acknowledge the laboratory of separation processes team. Furthermore the authors wish to thank the National Office of Water and Electricity (ONEE), Dow Chemical Company and OTV-Veolia Water Technolo-gies for their outstanding contribution to the success of this project.
REFERENCES
[1] Xu G, Xu X, Tang W, Liu W, Shi J, Liu M, Wang K: Fighting against water crisis in China—A glimpse of water regime shift at county level. Environ. Sci. Policy, 61, 33–41, 2016. doi:10.1016/j.envsci.2016.03.021
[2] Zhang R, Liu Y, He M, Su Y, Zhao X, Elimelech M, Jiang Z: Antifouling membranes for sustainable water purification: strategies and mechanisms. Chem. Soc. Rev., 45(21), 5888–5924, 2016. PMID:27494001 doi:10.1039/C5CS00579E
[3] Hibbs MR, McGrath LK, Kang S, Adout A, Altman SJ, Elimelech M, Cornelius CJ: Designing a biocidal reverse osmosis membrane coating: Synthesis and biofouling properties. Desalination, 380, 52–59, 2016. doi:10.1016/j.desal.2015.11.017
[4] Misdan N, Lau WJ, Ismail AF: Seawater Reverse Osmosis (SWRO) desalination by thin-film composite membrane—Current development, challenges and future prospects. Desalination, 287, 228–237, 2012. doi:10.1016/j.desal.2011.11.001
[5] Shannon MA, Bohn PW, Elimelech M, Georgiadis JG, Mariñas BJ, Mayes AM: Science and technol-ogy for water purification in the coming decades. Nature, 452(7185), 301–310, 2008. PMID:18354474 doi:10.1038/nature06599
[6] Anis SF, Hashaikeh R, Hilal N: Reverse osmosis pretreatment technologies and future trends: A com-prehensive review. Desalination, 452, 159–195, 2019. doi:10.1016/j.desal.2018.11.006
[7] Balfaqih H, Al-Nory MT, Nopiah ZM, Saibani N: Environmental and economic performance assessment of desalination supply chain. Desalination, 406, 2–9, 2017. doi:10.1016/j.desal.2016.08.004
[8] Santoro C, Abad FB, Serov A, Kodali M, Howe KJ, Soavi F, Atanassov P: Supercapacitive microbial de-salination cells: New class of power generating devices for reduction of salinity content. Appl. Energy, 208, 25–36, 2017. PMID:29302130 doi:10.1016/j.apen-ergy.2017.10.056
[9] Ziaedini A, Rashedi H, Alaie E, Zeinali M: Perfor-mance assessment of the stacked microbial desalination cells with internally parallel and series flow configura-tions. J. Environ. Chem. Eng., 6(4), 5079–5086, 2018. doi:10.1016/j.jece.2018.07.051
[10] Bay U, Guler E, Yavuz E, Yuksel M, Yuksel U, Kabay N: Time-Dependent Desalination Tests for Small-Scale SWRO Pilot Plant Installed at Article info. J. Membr. Sci. Res., 4, 167–173, 2018. doi:10.22079/JMSR.2018.79881.1170
[11] Arras W, Ghaffour N, Hamou A: Performance evalu-ation of BWRO desalination plant — A case study. Desalination, 235(1-3), 170–178, 2009. doi:10.1016/j.desal.2008.02.009

Journal of Water and Environment Technology, Vol. 17, No. 5, 2019 373
[12] Jia TZ, Lu JP, Cheng XY, Xia QC, Cao XL, Wang Y, Xing W, Sun SP: Surface enriched sulfonated polyarylene ether benzonitrile (SPEB) that enhances heavy metal removal from polyacrylonitrile (PAN) thin-film composite nanofiltration membranes. J. Membr. Sci., 580, 214–223, 2019. doi:10.1016/j.mem-sci.2019.03.015
[13] Altaee A, Hilal N: High recovery rate NF–FO–RO hybrid system for inland brackish water treatment. Desalination, 363, 19–25, 2015. doi:10.1016/j.de-sal.2014.12.017
[14] Al-Obaidi MA, Alsarayreh AA, Al-Hroub AM, Alsadaie S, Mujtaba IM: Performance analysis of a medium-sized industrial reverse osmosis brackish water desalination plant. Desalination, 443, 272–284, 2018. doi:10.1016/j.desal.2018.06.010
[15] Kabay N, Sarp S, Yuksel M, Kitis M, Koseoğlu H, Arar Ö, Bryjak M, Semiat R: Removal of boron from SWRO permeate by boron selective ion exchange resins con-taining N-methyl glucamine groups. Desalination, 223(1-3), 49–56, 2008. doi:10.1016/j.desal.2007.01.199
[16] Sassi KM, Mujtaba IM: Effective design of reverse osmosis based desalination process considering wide range of salinity and seawater temperature. Desalina-tion, 306, 8–16, 2012. doi:10.1016/j.desal.2012.08.007
[17] Sassi KM, Mujtaba IM: Optimal operation of RO sys-tem with daily variation of freshwater demand and sea-water temperature. Comput. Chem. Eng., 59, 101–110, 2013. doi:10.1016/j.compchemeng.2013.03.020
[18] George JS, Ramos A, Shipley HJ: Tanning facility wastewater treatment: Analysis of physical–chemical and reverse osmosis methods. J. Environ. Chem. Eng., 3(2), 969–976, 2015. doi:10.1016/j.jece.2015.03.011
[19] Shi M, Wang Z, Zhao S, Wang J, Zhang P, Cao X: A novel pathway for high performance RO membrane: Preparing active layer with decreased thickness and enhanced compactness by incorporating tannic acid into the support. J. Membr. Sci., 555, 157–168, 2018. doi:10.1016/j.memsci.2018.03.025
[20] Wang J, Zhu J, Zhang Y, Liu J, Van der Bruggen B: Na-noscale tailor-made membranes for precise and rapid molecular sieve separation. Nanoscale, 9(9), 2942–2957, 2017. PMID:28197584 doi:10.1039/C6NR08417F
[21] Shi B, Marchetti P, Peshev D, Zhang S, Livingston AG: Will ultra-high permeance membranes lead to ultra-efficient processes? Challenges for molecular separa-tions in liquid systems. J. Membr. Sci., 525, 35–47, 2017. doi:10.1016/j.memsci.2016.10.014
[22] Cui Y, Liu XY, Chung TS: Ultrathin Polyamide Membranes Fabricated from Free-Standing Interfacial Polymerization: Synthesis, Modifications, and Post-treatment. Ind. Eng. Chem. Res., 56(2), 513–523, 2017. doi:10.1021/acs.iecr.6b04283
[23] Pandey SR, Jegatheesan V, Baskaran K, Shu L: Fouling in reverse osmosis (RO) membrane in water recovery from secondary effluent: a review. Rev. Environ. Sci. Biotechnol., 11(2), 125–145, 2012. doi:10.1007/s11157-012-9272-0
[24] Jiang S, Li Y, Ladewig BP: A review of reverse os-mosis membrane fouling and control strategies. Sci. Total Environ., 595, 567–583, 2017. PMID:28399496 doi:10.1016/j.scitotenv.2017.03.235
[25] Asadollahi M, Bastani D, Musavi SA: Enhancement of surface properties and performance of reverse osmosis membranes after surface modification: A re-view. Desalination, 420, 330–383, 2017. doi:10.1016/j.desal.2017.05.027
[26] Zheng L, Yu D, Wang G, Yue Z, Zhang C, Wang Y, Zhang J, Wang J, Liang G, Wei Y: Characteristics and formation mechanism of membrane fouling in a full-scale RO wastewater reclamation process: Membrane autopsy and fouling characterization. J. Memb. Sci., 563, 843–856, 2018. doi:10.1016/j.memsci.2018.06.043
[27] Sim LN, Chong TH, Taheri AH, Sim STV, Lai L, Krantz WB, Fane AG: A review of fouling indices and moni-toring techniques for reverse osmosis. Desalination, 434, 169–188, 2018. doi:10.1016/j.desal.2017.12.009
[28] Farhat S, Bali M, Kamel F: Membrane autopsy to provide solutions to operational problems of Jerba brackish water desalination plant. Desalination, 445, 225–235, 2018. doi:10.1016/j.desal.2018.08.013
[29] Shaaban S, Yahya H: Detailed analysis of reverse os-mosis systems in hot climate conditions. Desalination, 423, 41–51, 2017. doi:10.1016/j.desal.2017.09.002
[30] Kucera J: Reverse Osmosis : Design, Processes, and Applications for Engineers. Wiley, Hoboken, USA, 2011.
[31] Boulahfa H, Belhamidi S, Elhannouni F, Taky M, El Fadil A, Elmidaoui A: Demineralization of brackish surface water by reverse osmosis: The first experience in Morocco. J. Environ. Chem. Eng., 7(2), 102937, 2019. doi:10.1016/j.jece.2019.102937
Journal of Water and Environment Technology, Vol. 17, No. 5, 2019 374
[32] Yang Z, Gao B, Yue Q: Coagulation performance and residual aluminum speciation of Al2(SO4)3 and polyaluminum chloride (PAC) in Yellow River water treatment. Chem. Eng. J., 165(1), 122–132, 2010. doi:10.1016/j.cej.2010.08.076
[33] Xu H, Xiao F, Wang D: Effects of Al2O3 and TiO2 on the coagulation process by Al2(SO4)3 (AS) and poly-aluminum chloride (PACl) in kaolin suspension. Separ. Purif. Tech., 124, 9–17, 2014. doi:10.1016/j.sep-pur.2014.01.010
[34] Dow Water & Process Solutions: FILMTECTM Re-verse Osmosis Membranes Technical Manual. https://www.dupont.com/content/dam/Dupont2.0/Products/water/literature/609-00071.pdf [accessed on October 17, 2018]
[35] Zidouri H: Desalination of Morocco and presentation of design and operation of the Laayoune seawater reverse osmosis plant. Desalination, 131(1-3), 137–145, 2000. doi:10.1016/S0011-9164(00)90014-6
[36] ASTM International: ASTM D4516-00, Standard Practice for Standardizing Reverse Osmosis Perfor-mance Data. https://www.astm.org/Standards/D4516.htm [accessed on November 20, 2018]
[37] Ruiz-García A, León FA, Ramos-Martín A: Differ-ent boron rejection behavior in two RO membranes installed in the same full-scale SWRO desalination plant. Desalination, 449, 131–138, 2019. doi:10.1016/j.desal.2018.07.012
[38] Ruiz-García A, Ruiz-Saavedra E: 80,000 h operational experience and performance analysis of a brackish wa-ter reverse osmosis desalination plant. Assessment of membrane replacement cost. Desalination, 375, 81–88, 2015. doi:10.1016/j.desal.2015.07.022
[39] Ruiz-García A, Ruiz-Saavedra E, Pérez Báez SO: Evaluation of the first seven years operating data of a RO brackish water desalination plant in Las Palmas, Canary Islands, Spain. Desalination Water Treat., 54(12), 3193–3199, 2015. doi:10.1080/19443994.2014.908145
[40] Ruiz-García A, Nuez I: Long-term performance de-cline in a brackish water reverse osmosis desalination plant. Predictive model for the water permeability coef-ficient. Desalination, 397, 101–107, 2016. doi:10.1016/j.desal.2016.06.027
[41] Al-Obaidi MA, Kara-Zaïtri C, Mujtaba IM: Perfor-mance evaluation of multi-stage and multi-pass reverse osmosis networks for the removal of N-nitrosodi-methylamine -D6 (NDMA) from wastewater using model-based techniques. J. Environ. Chem. Eng., 6(4), 4797–4808, 2018. doi:10.1016/j.jece.2018.06.014
[42] Al-Obaidi MA, Kara-Zaïtri C, Mujtaba IM: Perfor-mance evaluation of multi-stage reverse osmosis pro-cess with permeate and retentate recycling strategy for the removal of chlorophenol from wastewater. Comput. Chem. Eng., 121, 12–26, 2019. doi:10.1016/j.comp-chemeng.2018.08.035
[43] Guler E, Ozakdag D, Arda M, Yuksel M, Kabay N: Effect of temperature on seawater desalination-water quality analyses for desalinated seawater for its use as drinking and irrigation water. Environ. Geochem. Health, 32(4), 335–339, 2010. PMID:20431919 doi:10.1007/s10653-010-9294-x
[44] Gorenflo A, Brusilovsky M, Faigon M, Liberman B: High pH operation in seawater reverse osmosis perme-ate: First results from the world’s largest SWRO plant in Ashkelon. Desalination, 203(1-3), 82–90, 2007. doi:10.1016/j.desal.2006.05.004
[45] Mane PP, Park PK, Hyung H, Brown JC, Kim JH: Mod-eling boron rejection in pilot- and full-scale reverse os-mosis desalination processes. J. Membr. Sci., 338(1-2), 119–127, 2009. doi:10.1016/j.memsci.2009.04.014
[46] Kotb H, Amer EH, Ibrahim KA: Effect of operating conditions on salt concentration at the wall of RO mem-brane. Desalination, 357, 246–258, 2015. doi:10.1016/j.desal.2014.12.002
[47] Beyer F, Laurinonyte J, Zwijnenburg A, Stams AJM, Plugge CM: Membrane Fouling and Chemical Cleaning in Three Full-Scale Reverse Osmosis Plants Producing Demineralized Water. J. Eng. (Stevenage), 2017, 1–14, 2017.
[48] Nada N, Attenborough T, Ito Y, Maeda Y, Tokunaga K, Iwahashi H: SWRO drinking water project in Shuqaiq: Advanced BWRO, membrane oxidation, and scaling. IDA J. Desalin. Water Reuse, 3(4), 30–39, 2011.
[49] Hydranautics: Technical Service Bulletin Foulants and Cleaning Procedures for composite polyamide RO Membrane Elements (ESPA, ESNA, CPA, LFC, NANO and SWC), 2014. http://membranes.com/docs/tsb/TSB107.pdf [accessed on January 1, 2019]