imf country report no. 15/289 ecuador · 2015-10-21 · imf country report no. 15/289 ecuador ......
TRANSCRIPT

© 2015 International Monetary Fund
IMF Country Report No. 15/289
ECUADOR 2015 ARTICLE IV CONSULTATION—PRESS RELEASE; STAFF REPORT; AND STATEMENT BY THE EXECUTIVE DIRECTOR FOR ECUADOR
Under Article IV of the IMF’s Articles of Agreement, the IMF holds bilateral discussions
with members, usually every year. In the context of the 2015 Article IV consultation with
Ecuador, the following documents have been released and are included in this package:
A Press Release summarizing the views of the Executive Board as expressed during its
September 25, 2015 consideration of the staff report that concluded the Article IV
consultation with Ecuador.
The Staff Report prepared by a staff team of the IMF for the Executive Board’s
consideration on September 25, 2015, following discussions that ended on July 15,
2015, with the officials of Ecuador on economic developments and policies. Based on
information available at the time of these discussions, the staff report was completed
on September 10, 2015.
An Informational Annex prepared by the IMF staff.
A Statement by the Executive Director for Ecuador.
The documents listed below have been or will be separately released.
Selected Issues
The IMF’s transparency policy allows for the deletion of market-sensitive information and
premature disclosure of the authorities’ policy intentions in published staff reports and
other documents.
Copies of this report are available to the public from
International Monetary Fund Publication Services
PO Box 92780 Washington, D.C. 20090
Telephone: (202) 623-7430 Fax: (202) 623-7201
E-mail: [email protected] Web: http://www.imf.org
Price: $18.00 per printed copy
International Monetary Fund
Washington, D.C.
October 2015

Press Release No. 15/475
FOR IMMEDIATE RELEASE
October 21, 2015
IMF Executive Board Concludes 2015 Article IV Consultation with Ecuador
On September 25, 2015, the Executive Board of the International Monetary Fund (IMF)
concluded the Article IV consultation1 with Ecuador.
Supported by positive terms of trade and large public investments, growth averaged 4.5 percent
over the past decade, while social indicators improved. Reflecting Ecuador’s goals of
diversifying energy production and improving infrastructure and social equality, the overall
fiscal position of the non-financial public sector (NFPS) deteriorated from balance in 2011 to a
deficit of 3.5 percent of GDP in 2012–14, mainly driven by high capital spending. The poverty
rate and the GINI coefficient fell, respectively, from 38 percent and 0.54 in 2006 to 22.5 percent
and 0.47 in 2014, while the unemployment rate declined significantly. Financial stability was
preserved, supported by dollarization. In 2014, growth moderated to 3.8 percent in line with
developments in the region.
Since the fourth quarter of 2014, the economy has been hit by external shocks and is slowing
down. The sharp decline in the international oil price, by about half for the Ecuadorian mix,
significantly undercut oil revenues. In addition, competitiveness is being eroded by the real
appreciation of the exchange rate—by 16 percent year-over-year through June 2015.
The authorities responded rapidly to the shocks by cutting public spending, introducing balance
of payment safeguards, and containing minimum wage growth. As a result, non-oil imports have
been declining significantly from April 2015, and the 2015 fiscal deficit is expected to be
contained to the original budget target. Nonetheless gross financing needs remain large, and
international access to credit has tightened.
In the face of the economic slowdown, bank liquidity conditions have tightened, credit growth
has slowed, and non-performing loans have risen (albeit from a low level). Despite the
slowdown, inflation is picking up, reflecting changes in transport tariffs as well as in food prices
and utilities.
1 Under Article IV of the IMF's Articles of Agreement, the IMF holds bilateral discussions with members, usually
every year. A staff team visits the country, collects economic and financial information, and discusses with officials
the country's economic developments and policies. On return to headquarters, the staff prepares a report, which
forms the basis for discussion by the Executive Board.
International Monetary Fund
700 19th Street, NW
Washington, D. C. 20431 USA
2
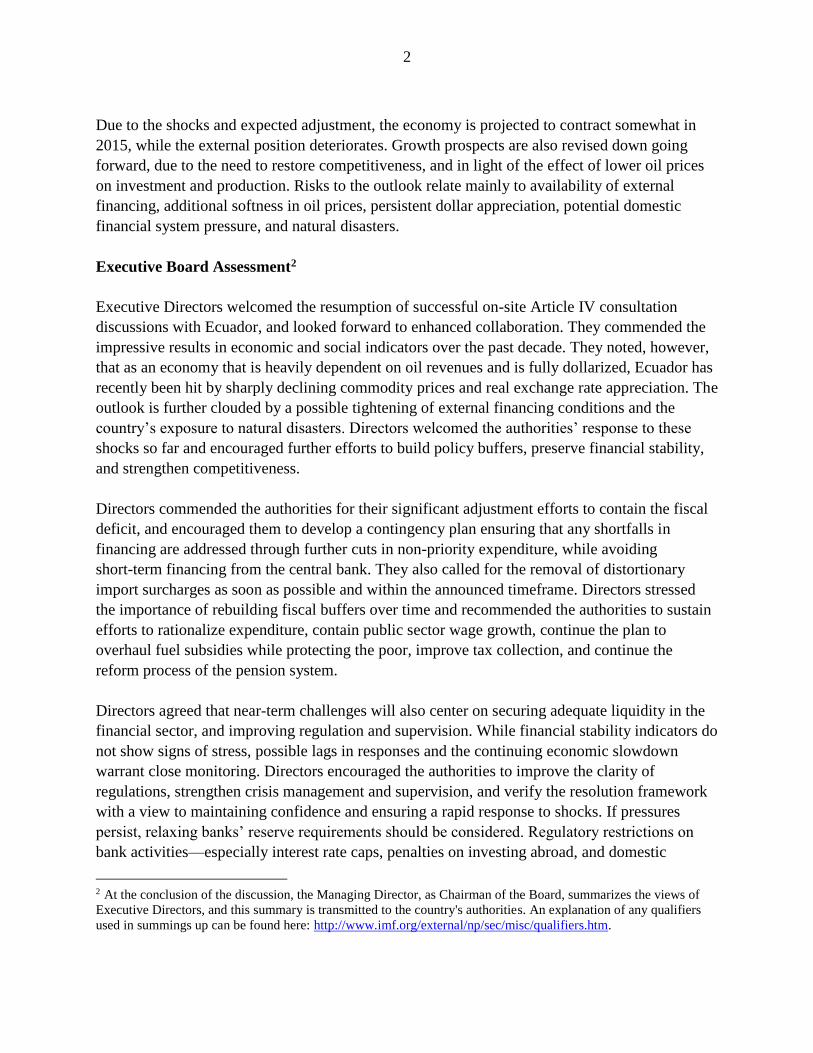
Due to the shocks and expected adjustment, the economy is projected to contract somewhat in
2015, while the external position deteriorates. Growth prospects are also revised down going
forward, due to the need to restore competitiveness, and in light of the effect of lower oil prices
on investment and production. Risks to the outlook relate mainly to availability of external
financing, additional softness in oil prices, persistent dollar appreciation, potential domestic
financial system pressure, and natural disasters.
Executive Board Assessment2
Executive Directors welcomed the resumption of successful on-site Article IV consultation
discussions with Ecuador, and looked forward to enhanced collaboration. They commended the
impressive results in economic and social indicators over the past decade. They noted, however,
that as an economy that is heavily dependent on oil revenues and is fully dollarized, Ecuador has
recently been hit by sharply declining commodity prices and real exchange rate appreciation. The
outlook is further clouded by a possible tightening of external financing conditions and the
country’s exposure to natural disasters. Directors welcomed the authorities’ response to these
shocks so far and encouraged further efforts to build policy buffers, preserve financial stability,
and strengthen competitiveness.
Directors commended the authorities for their significant adjustment efforts to contain the fiscal
deficit, and encouraged them to develop a contingency plan ensuring that any shortfalls in
financing are addressed through further cuts in non-priority expenditure, while avoiding
short-term financing from the central bank. They also called for the removal of distortionary
import surcharges as soon as possible and within the announced timeframe. Directors stressed
the importance of rebuilding fiscal buffers over time and recommended the authorities to sustain
efforts to rationalize expenditure, contain public sector wage growth, continue the plan to
overhaul fuel subsidies while protecting the poor, improve tax collection, and continue the
reform process of the pension system.
Directors agreed that near-term challenges will also center on securing adequate liquidity in the
financial sector, and improving regulation and supervision. While financial stability indicators do
not show signs of stress, possible lags in responses and the continuing economic slowdown
warrant close monitoring. Directors encouraged the authorities to improve the clarity of
regulations, strengthen crisis management and supervision, and verify the resolution framework
with a view to maintaining confidence and ensuring a rapid response to shocks. If pressures
persist, relaxing banks’ reserve requirements should be considered. Regulatory restrictions on
bank activities—especially interest rate caps, penalties on investing abroad, and domestic
2 At the conclusion of the discussion, the Managing Director, as Chairman of the Board, summarizes the views of
Executive Directors, and this summary is transmitted to the country's authorities. An explanation of any qualifiers
used in summings up can be found here: http://www.imf.org/external/np/sec/misc/qualifiers.htm.

3
liquidity requirements—should be progressively lifted, credibility in the system of electronic
money should be ensured, and directed lending should be discontinued. Directors also
encouraged the authorities to strengthen the AML/CFT framework, and undertake a new
financial sector assessment (FSAP) in light of significant changes to the financial landscape
since the last assessment.
Directors underscored that improving competitiveness is key to safeguard the external balance
and sustain medium-term growth. They welcomed reforms and investment in infrastructure,
education, and private sector development, but also stressed the importance of efforts to contain
wage growth and address labor market rigidities. More broadly, Directors supported reforms
aimed at improving productivity, crowding-in the private sector, attracting foreign direct
investment, diversifying the economy, and promoting trade integration.

4
Ecuador: Selected Economic Indicators
Proj.
2010 2011 2012 2013 2014 2015 2016
Social Indicators
Life expectancy at birth (years) 75.6 75.9 76.2 76.5 … … …
Infant mortality (per thousand live births) 20.9 20.3 19.7 19.1 … … …
Adult literacy rate 91.9 91.6 … 93.3 … … …
Poverty rate (total) 32.8 28.6 27.3 25.6 22.5 … …
Unemployment rate 5.0 4.2 4.1 4.2 3.8 ... ...
(Percent change, unless otherwise indicated)
Production and prices
Real GDP 3.5 7.9 5.2 4.6 3.8 -0.6 0.1
Real domestic demand 8.0 7.5 4.2 6.1 3.8 -3.1 0.3
Consumer price index period average 3.6 4.5 5.1 2.7 3.6 4.1 2.9
Consumer price index end-of-period 3.3 5.4 4.2 2.7 3.7 3.7 2.5
External sector
Exports 25.8 27.3 6.4 4.5 3.6 -26.9 -1.3
Imports 37.7 18.3 5.5 6.8 1.9 -19.8 -1.1
Terms of trade, national accounts data (deterioration -) 19.0 21.8 0.2 1.1 -5.4 -14.6 1.0
Real effective exchange rate (depreciation -) -2.2 -1.6 4.1 2.2 3.0 … …
Money and credit
Broad money 20.6 20.5 16.0 13.0 11.4 0.1 1.0
Credit to the private sector 24.4 22.6 14.7 10.5 8.7 1.4 2.0
(In percent of GDP)
Public sector
Revenue 33.3 39.3 39.5 39.4 38.8 35.4 33.7
Primary expenditure 34.1 38.7 39.6 43.0 43.2 39.1 35.3
Primary balance -0.8 0.6 -0.2 -3.6 -4.3 -3.7 -1.6
Overall balance (deficit -) -1.3 0.0 -0.9 -4.6 -5.4 -5.1 -3.7
External Sector
External current account balance -2.3 -0.3 -0.2 -1.0 -0.6 -2.6 -2.8
Net international reserves (US$ millions) 2,622 2,958 2,483 4,361 3,949 3,522 3,397
Debt
Total external debt 20.6 20.4 18.7 21.5 25.4 31.9 35.9
Total public debt 19.7 19.4 21.7 26.0 31.3 37.4 40.4
Domestic 6.7 5.7 8.9 10.5 12.5 12.9 12.2
External 13.0 13.7 12.8 15.5 18.8 24.5 28.3
Total public debt, official definition 1/ 19.2 18.4 21.3 24.2 29.9 34.7 38.3
Saving investment balance
Gross investment 28.0 28.1 27.8 28.8 28.1 24.7 23.9
National saving 25.8 27.8 27.6 27.7 27.5 22.1 21.1
Memorandum items:
Nominal GDP (US$ millions) 69,555 79,277 87,623 94,473 100,543 98,925 101,698
GDP per capita (US$) 4,633 5,193 5,645 5,989 … … …
Sources: Central Bank of Ecuador; Ministry of Finance; and IMF staff estimates and projections.
1/ The official public debt definition does not include the outstanding balance for advance oil sales, which was about 1.5 percent of
GDP at end-2014.

ECUADOR STAFF REPORT FOR THE 2015 ARTICLE IV CONSULTATION
KEY ISSUES
Context: Article IV discussions with Ecuador were conducted on-site for the first time
since 2007 (Annex I). After growing at an average of about 4½ percent over the past
decade—on the wave of high oil prices, a strong public investment agenda, and the
anchor of full dollarization—the economy has been hit by significant external shocks
since late 2014. The sharp decline in oil prices and significant real exchange rate
appreciation have undercut exports and fiscal revenues. The authorities responded
rapidly with a large fiscal adjustment, introduction of temporary import surcharges,
and moderation of minimum wage growth. The economy is projected to contract in
2015 and growth to remain subdued in 2016, while medium-term potential has been
revised down given prospects of lower investment and employment growth.
Risks: Risks to the outlook are tilted to the downside. The main external risks are
additional softness in oil prices, persistence of dollar appreciation, and global
financial instability. Ecuador-specific risks center on limits to the availability of
external financing, potential domestic financial system pressure associated with the
economic adjustment and uncertainty about the policy response, and delays in
strengthening Ecuador’s energy balance, as well as possible natural disasters. On the
upside, future oil production could be higher, especially if oil prices rise again
facilitating the financing of larger investment plans.
Policy issues: The authorities’ significant adjustment measures should fully offset the
fiscal implications of the shocks, but—given limited policy alternatives in a dollarized
economy—any shortfall in financing would have to be addressed through further
spending retrenchment. To regain competitiveness in the face of overvaluation and
prevent protracted slow growth, substantial real wage and price adjustments are
called for. Diminishing liquidity in the banking system warrants close monitoring and
rapid reaction if pressures continue, while eliminating restrictions and distortions in
the banking system as well as enhancing supervision would make the system more
resilient to systemic shocks. Import surcharges should be removed as soon as
possible, and within the announced timeframe. Restoring private sector confidence
by improving the business environment will be key both to stemming deposit
declines and preserving dollarization, as well as to sustaining healthy medium-term
growth and reducing oil dependence. A broad structural reform agenda will be
essential to foster productivity, crowd-in the private sector, and attract FDI.
September 10, 2015

ECUADOR
2 INTERNATIONAL MONETARY FUND
Approved By Adrienne Cheasty and
Bob Traa
Discussions took place in Quito during July 1−10, 2015 and the
concluding meeting was held via a video-conference on July 15,
2015. The team comprised: Luca Antonio Ricci (Head),
Pablo Druck, Melesse Tashu, Svetlana Vtyurina (all WHD), Phil
de Imus (SPR), Ricardo Fenochietto (FAD), and Martin Saldias
(MCM). Francisco Rivadeneira (OED) participated in the
discussions. Adrienne Cheasty (WHD) joined the mission for the
final meetings with Minister of Coordination of Economic Policy
Patricio Rivera.
CONTENTS
CONTEXT_________________________________________________________________________________________ 4
RISKS AND OUTLOOK ___________________________________________________________________________ 7
POLICY DISCUSSIONS ___________________________________________________________________________ 9
A. Fiscal Adjustment to External Shocks ___________________________________________________________ 9
B. Ensuring Financial Stability and System Liquidity ______________________________________________ 12
C. Restoring Competitiveness and Promoting Private Sector Participation _______________________ 15
STAFF APPRAISAL _____________________________________________________________________________ 18
BOXES
1. Revisiting Potential Output Growth ___________________________________________________________ 20
2. Recent Proposals and Tax Reforms ____________________________________________________________ 21
FIGURES
1. Real Sector Developments, 2008−14 __________________________________________________________ 22
2. Fiscal Sector Developments, 2008–14 _________________________________________________________ 23
3. External Sector Developments, 2008–15 _______________________________________________________ 24
4. Selected Banking and Financial System, 2002–15 ______________________________________________ 25
5. Social and Structural Indicators, 2003–14 ______________________________________________________ 26

ECUADOR
INTERNATIONAL MONETARY FUND 3
TABLES
1. Selected Economic and Financial Indicators ___________________________________________________ 27
2. Operations of the Nonfinancial Public Sector, Net Accounting ________________________________ 28
3. Operations of the Nonfinancial Public Sector, Net Accounting ________________________________ 29
4. Nonfinancial Public Sector Financing __________________________________________________________ 30
5. Balance of Payments __________________________________________________________________________ 31
6. Monetary Survey ______________________________________________________________________________ 32
7. Financial Soundness Indicators ________________________________________________________________ 33
8. Financial and External Vulnerability Indicators ________________________________________________ 34
9. Medium-Term Macroeconomic Framework ___________________________________________________ 35
ANNEXES
I. Implementation of Advice in Previous Article IV Consultations _________________________________ 36
II. External Sector Assessment ___________________________________________________________________ 37
III. Debt Sustainability Analysis ___________________________________________________________________ 45
IV. Financial Stability Assessment ________________________________________________________________ 55

ECUADOR
4 INTERNATIONAL MONETARY FUND
CONTEXT
1. Ecuador pursued a strategy of public sector-led growth during the oil boom, which
yielded important social benefits. It was spearheaded by President Correa, since his election in
2007. His Patria Altiva y Soberana (PAIS) coalition holds a majority in congress; however,
government poll ratings have been declining in 2015, until recently. President Correa can run in the
2017 presidential election only if the constitution is changed to allow reelection for a third term.
2. Growth averaged 4½ percent over the past decade—contributing to a solid
improvement in social indicators—supported by the positive terms of trade and large public
investments. Reflecting Ecuador’s goals of diversifying energy production and improving
infrastructure and social equity, the overall
fiscal position of the non-financial public
sector (NFPS) widened from a balance in 2011
to a deficit of 3½ percent of GDP in
2012−14—despite high oil prices—mainly
driven by high capital spending. During the
same period public debt rose about
9½ percentage points to 31.3 percent of GDP.
Between 2006 and 2014, the poverty rate
declined from 38 percent to 22.5 percent and
the GINI coefficient from 0.54 to 0.47 in 2014,
while the unemployment rate fell significantly.
In 2014, the reference household income
exceeded for the first time the cost of the basic consumption basket. Social convergence was in part
achieved through growth in real wages in excess of productivity, which contributed to maintaining
inflation at about 4 percent over the decade. Financial stability was preserved, supported by
dollarization. In 2014, growth moderated to 3.8 percent, but remained higher than in the rest of the
region—as in the past 7 years.
3. Since the third quarter of 2014, the
economy has suffered external shocks. The
sharp decline in the international oil price
(from US$97.5/barrel in 2014Q2 to below
US$40/barrel in August 2015, for Ecuadorian
mix) significantly undercut oil exports. The
net oil balance declined by almost
US$2.4 billion, yoy, for the January–June 2015
period. In addition, the real exchange rate
(REER) appreciated by about 16 percent in
June 2015, yoy, and there is now evidence of
overvaluation (see Annex II). 1995 1997 1999 2001 2003 2005 2007 2009 2011 2013 2015
40
50
60
70
80
90
100
110
120
130
Source: IMF's International Financial Statistics.
Ecuador: Real Effective Exchange Rate
(Average 1995–2015 = 100)
0
50
100
150
200
250
-2
0
2
4
6
8
10
2005 2006 2007 2008 2009 2010 2011 2012 2013 2014
Real GDP growth LAC Average
Unemployment Real price index of oil (2005=100), rhs
Ecuador: Oil Prices and Economic Performance
Sources: National Authorities; IMF (WEO); and Fund staff calculations.
In p
erc
en
t

ECUADOR
INTERNATIONAL MONETARY FUND 5
4. The authorities responded to the shocks by implementing a strong fiscal adjustment
plan, introducing balance of payment safeguards, and containing minimum wage growth.
Spending was cut significantly and tax measures enacted, aiming at containing the fiscal deficit to
the level envisaged in the original budget (see below). A freeze in public sector wages was
announced for 2015 and the increase of the private minimum wage limited to 4.1 percent (from an
average of 9 percent over the previous 7 years). On March 6, 2015, tariff surcharges were introduced
on about 30 percent of imports for 15 months, which contributed to the decline in non-oil imports
by 15 percent, yoy, in June, with durables and transport equipment taking the largest hit (of around
32 percent each).1, 2
5. Access to international credit has tightened substantially. The spread paid by the
government over U.S. Treasuries rose from 530 bps in June 2014 to 900 bps in March 2015 when a
US$750 million 5-year bond was issued.3
The spread declined in May, when the
bond was reopened (for another
US$750 million), but has subsequently
risen again, to above 1,300 at end-
August. The movements in spreads
broadly reflect the movements in oil
prices, but are much larger than those
experienced by other countries with
similar oil dependence or similar spreads
in the first half of 2014. In recent
months, the increase in spreads is also
due to concerns about natural disasters
and internal debates on policy reforms.
Net International Reserves (NIR) were about US$4.8 billion at end-July, around 2½ months of
imports (Annex II).
1 A 5 percent tariff on non-essential capital and primary capital goods imports, 15 percent on imports of “medium
need”, 25 percent on ceramics, tires, motorbikes, and electronic appliances (TVs), and 45 percent on final consumer
goods were imposed, while the following goods remain exempt: raw material and capital goods, medicine and
medical equipment, car parts, lubricants and fuels. A similar action was taken during the 2008–09. WTO members
consulted with Ecuador on its import surcharges during a meeting of the Committee on Balance-of-Payments
Restrictions in June 2015 and will resume consultations in September (see
https://www.wto.org/english/news_e/news15_e/bop_29jun15_e.htm).
2 Temporarily, in January–February 2015, Ecuador placed surcharges on imports from Colombia (21 percent on
8 percent of total imports) and Peru (7 percent on 4 percent of total imports) following the depreciation of their
currencies against the dollar.
3 A US$2 billion 10-year global bond issued in June 2014 was oversubscribed. On 19 December, 2014, Moody’s
upgraded Ecuador's rating to B3 from Caa1 and maintained the stable outlook, reaffirming it also in August 2015.
40
60
80
100
120
140
160
180
200
0
200
400
600
800
1000
1200
1400
1600
1800
2000EMBIG Ecuador
2015 bond yield
2020 bond yield
2024 bond yield
Oil prices, in USD, rhs
Ecuador: Sovereign Yields and Country Risk (In basis points)
Source: Bloomberg.

ECUADOR
6 INTERNATIONAL MONETARY FUND
6. Economic growth is slowing and financial system’s liquidity is declining. Activity and
consumer confidence declined sharply in the first half of 2015, and real GDP growth moderated to
3 percent (yoy) in Q1 2015. Inflation remains elevated, at 4.2 percent (yoy) in August 2015, reflecting
changes in transport tariffs as well as in food and utilities prices. While the financial system remained
well capitalized and liquid in 2014, private sector deposits declined by about US$2 billion from
December 2014 to July 2015 (after growing by 11 percent in 2014), reflecting both an adjustment to
the shocks and weakening confidence, and creating pockets of weaknesses in the financial system.4
Banks’ liquidity has declined (by about US$1.7 billion, by end-July), and banks have started to ration
credit, which is affecting even the highest-quality customers. Over the same period, total non-
performing loans have risen from 2.9 to 3.8 percent, especially in consumer, microfinance, and
education loans. Nonetheless, main soundness indicators did not show signs of strain (Annex IV) and
the authorities noted that the system remained sound and solvent.
4 In part the decline is large as the December figure for deposits reflects sizable positive seasonal effects.
Nonetheless, when comparing deposits in July 2015 versus a linear trend since 2008 the gap is also about
US$2 billion, similar to the decline since December.
0
200
400
600
800
1000
1200
Jan-14 Jul-14 Jan-15 Jul-15
Average (Pakistan, Jamaica, and Lebanon)
Ecuador
LA5
Colombia
Selected Comparator Countries: Sovereign Spread(In basis points)
Source: Bloomberg
300
350
400
450
500
550
600
30
35
40
45
50
55
60
Jun-10 Mar-11 Dec-11 Sep-12 Jun-13 Mar-14 Dec-14
Consumer confidence index
Economic activity index, rhs
Ecuador: Economic Activity and Consumer Confidence
(Three-Month Moving Average )
Sources: Central Bank of Ecuador and Fund staff calculations.
-5
0
5
10
15
20
25
30
35
40
Jul-08 Jul-09 Jul-10 Jul-11 Jul-12 Jul-13 Jul-14 Jul-15
Deposits Credit
Ecuador: Deposits and Credit at Private Banks(In percent, year-on-year change)
Sources: Superintendency of Banks.
BLR
ECU
JAM
KAZ
RUS
ARG
BRA
CHL
COLCRC
DR
ELS
GUA
MEX
PNMPER
URU
-200
-100
0
100
200
300
400
500
600
-15 -5 5 15 25
Changes in EMBI Spread and Oil Exports
Source: Fund staff estimates.
Net Oil Exports, 2014
(in percent of GDP)
Ch
an
ge in
EM
BI Sp
read
July
20
14
-Ju
ly 2
01
5 (in
basi
s p
oin
ts)

ECUADOR
INTERNATIONAL MONETARY FUND 7
RISKS AND OUTLOOK
7. Due to shocks and expected adjustments, the economy is projected to contract slightly
in 2015, while the external position deteriorates. Growth is expected to slow to about negative
½percent in 2015, and to remain around zero in 2016. Accordingly, unemployment is likely to edge
up. Inflation is expected to stay elevated,
about 3½ percent at end-2015, before
moderating to about 1½ percent in the
medium term. The 2015 current account
deficit is projected to worsen to about
2½ percent of GDP, with a deterioration of
the oil balance by about 4 percent of GDP
being partly compensated by a decline in
non-oil imports (following the imposition
of tariff surcharges, scaled-back public
investment, and consumption slowdown,
which—combined—more than offset the
effect of the real exchange rate
appreciation).
8. The persistent effect of the shocks is expected to imply lower growth and a weaker
financial system into the medium term. Ecuador’s medium-term potential growth has been
revised down to about 3 percent, due to the effect of lower oil prices on investment and production
as well as more limited scope for employment growth (Box 1). Growth is projected to remain below
potential, until competitiveness is restored and the real exchange rate overvaluation eliminated.
Inflation is expected to decline, after a temporary upward impact from the surcharges. The less
favorable growth outlook and weaker confidence, as well as the U.S. monetary policy normalization,
can be expected to put additional pressure on financial sector stability (by deteriorating the quality
of bank assets and raising credit risk) and increase funding costs, thus setting the stage for
unfavorable macro-financial dynamics. The authorities agreed that the adjustment is going to be
difficult but considered the economy to be more resilient than in the staff’s scenario. At the time of
the mission, they projected growth at 1.9 percent in 2015 and 3.9 percent in 2016, driven by private
consumption and investment.
0
5
10
15
20
25
30
35
40
45
0
1
2
3
4
5
6
7
Jan-08 Jan-09 Jan-10 Jan-11 Jan-12 Jan-13 Jan-14 Jan-15
Liquidity ratio 1/ (RHS)
Ecuador: Liquidity of Private Banks
(Billions of U.S. dollars)
Source: Superintendency of Banks.
1/Liquid Assets to Short-Term Liabilities.
Deposits at BCE
Cash
External Liquidity
Domestic liquidity
(interbank)
0
2
4
6
8
10
12
Jan
-05
Mar-
06
May-0
7
Jul-
08
Sep
-09
No
v-1
0
Jan
-12
Mar-
13
May-1
4
Jul-
15
Food and beverages
Utilities and transportation
Furniture and clothing
Restaurants and hotels
Healthcare, education and other services
Ecuador: Inflation Decomposition
(contribution to year-on-year inflation)
Source: Central Bank of Ecuador.
2007
2008
2009
2010
2011 2012 2013
2014
y = -0.3529x + 5.1184
R² = 0.2159
2
3
4
5
6
7
8
2
3
4
5
6
7
8
-3 -2 -1 0 1 2
Un
em
plo
ym
en
t ra
te
Output gap
Ecuador: Unemployment and Output Gap
(In percent)
Sources: Ecuador National Authorities and Fund staff calculations.

ECUADOR
8 INTERNATIONAL MONETARY FUND
9. Moreover, risks to the outlook are tilted to the downside. Main external risks are
additional weakness in oil prices, global financial instability, persistent dollar appreciation, and weak
growth of trading partners. Ecuador-specific risks center on limits to the availability of external
financing, potential domestic financial system pressure associated with the economic adjustment
and uncertainty about the policy response, delays in enhancing the country’s energy balance, as well
as possible natural disasters (including from El Niño and volcanic activity). On the upside, future oil
production could be higher, especially if oil prices rise again facilitating the financing of larger
investment plans.
Risk Assessment Matrix1
Likelihood Impact Policy Advice
Difficulties in operating oil
fields; delays in hydro projects,
oil exploration, and reopening of
Esmeraldas refinery
M H (↓). Negative impact on growth,
exports, fiscal accounts.
Ensure full funding and completion of
hydro projects; promote private sector
participation in oil exploration.
External financing shortfalls due
to Ecuador-specific events
H H (↓). Negative impact on country
ratings, growth, future financing.
Take timely and appropriate spending
cuts.
Erosion of confidence due to
uncertainty about the policy
response; pressure on the
financial system
H H (↓). Negative impact on
investment and growth, as well as
on deposits and capital outflows.
Clearly communicate the need for, and
expected impact of, policy reforms;
ensure adequate liquidity for the
banking system, ease controls on
interest rates, and strengthen
macroprudential tools.
Potential natural disasters
(eruption of the Cotopaxi
volcano and/or worse-than-
expected El Niño effect)
M H (↓). Negative impact on
investment, exports, and growth, as
well as positive impact on inflation;
negative impact on deposits.
Rationalize public spending,
emphasizing priority relief and
infrastructure investments; ensure
adequate liquidity for the banking
system; build fiscal buffers in the
medium term.
Persistent dollar strength H M (↓). Pressure on the current
account.
Undertake structural measures to
improve productivity, competitiveness,
and investment climate; facilitate wage
and price adjustment.
Risks to energy prices: increased
volatility/persistently low prices
M H (↓). Pressure on fiscal and
external accounts.
Rationalize public spending and build
buffers; undertake structural measures
to improve productivity and diversify
the economy to reduce oil dependence.
Sharp asset price adjustment and
decompression of credit spreads
as investors respond to changes
in growth prospects, Fed policy
rate path, etc.
H H (↓). External sovereign financing
could shrink substantially and costs
become prohibitive.
Build buffers; plan government
spending contingent on financing;
improve access to financing.
Structurally weak growth in key
advanced economies/emerging
markets/China
H/M/L M/M/H (↓). Worsening of the
current account deficit and weaker
growth, especially through lower
exports; lower access to financing
from China.
Ensure the stability of the domestic
financial sector; implement
countercyclical fiscal policy if financing
is available; improve access to financing.
1 The Risk Assessment Matrix (RAM) shows events that could materially alter the baseline path (the scenario most likely to materialize in the
view of IMF staff). The relative likelihood is the staff’s subjective assessment of the risks surrounding the baseline (“low” is meant to indicate a
probability below 10 percent, “medium” a probability between 10 and 30 percent, and “high” a probability between 30 and 50 percent). The
RAM reflects staff views on the source of risks and overall level of concern as of the time of discussions with the authorities. Non-mutually
exclusive risks may interact and materialize jointly.
Country-specific risks
External risks

ECUADOR
INTERNATIONAL MONETARY FUND 9
POLICY DISCUSSIONS
The current fiscal adjustment plan can be expected to absorb the fiscal consequences of
the external shocks, but a broader strategy is called for to preserve macro and financial
stability, bolster confidence, and restore competitiveness. A fiscal contingency plan should
be in place to offset any financing shortfalls. The retention of adequate liquidity in the
financial sector must be an over-arching objective, while financial sector regulation and
supervision need to be upgraded. Regaining competitiveness and reviving growth will
require further wage containment and improvements in the business environment, while
policy buffers should be rebuilt as insurance against downside risks.
A. Fiscal Adjustment to External Shocks
Near-term outlook
10. The current fiscal adjustment plan
should offset the fiscal impact from the oil
shock in the near term, while balancing the need
to contain the contractionary effect of fiscal
policy. The revision to the 2015 budget (originally
published in October 2014) envisages that the
decline in the net oil export revenue due to the
shock will be mostly offset by expenditure cuts,
leaving the overall fiscal balance broadly
unchanged. Capital spending is planned to be cut
by about 1.8 percent of GDP compared to the
original budget (mainly with postponement of new
projects in infrastructure and schools), while current
expenditure will be trimmed by about 1.7 percent
of GDP (mostly on goods and services and social
transfers).5 Compared to 2014, however, current
expenditure is expected to increase while the adjustment
falls entirely on capital expenditure. In the revision to the
2015 budget, higher tax revenue (than originally
anticipated) from recently introduced changes to the tax
system, a tax amnesty, and the import surcharges, will be
partially offset by a reduction in non-tax revenue
associated with the downturn and a downward revision
in the social security contribution. Indeed, tax revenue
5Central government budgetary cuts of about 2¼ percent of GDP were announced in January and August 2015; the
remaining cuts relate to the budget of state-owned enterprises.
Disbursed Expected Total
Gross financing needs 10.3 … … 10.3
Deficit 5.4 … … 5.1
Amortization 1/ 4.9 … … 5.2
Identified financing 10.3 5.6 4.7 10.3
External 8.0 5.6 3.7 9.2
Multilaterals 1.5 1.3 0.4 1.7
Bilateral 1/ 2.8 2.5 2.8 5.3
Private 3.7 1.7 0.4 2.2
Domestic 2/ 1.4 0.0 1.5 1.5
Accounts payable 1.0 0.0 -0.5 -0.5
Source: Ministry of Finance.
1/ Includes financing through advance sales of oil.
2/ Domestic financing includes change in government deposits.
2015
2014
Ecuador: Non-Financial Public Sector Financing
(In percent of GDP)
Budget (Init.) Budget (Rev.) IMF
Current oil balance 6.8 6.3 2.2 2.5
Gross revenue 17.2 17.1 11.4 11.6
Exports 2/ 13.2 12.7 7.1 7.3
Domestic sales 4.0 4.4 4.3 4.3
Current expenditure 10.4 10.9 9.2 9.1
o/w cost of imports of refined oil 6.3 5.8 4.9 4.9
Non-oil balance -12.2 -11.6 -7.4 -7.6
Non-oil revenue 24.0 26.8 27.5 26.6
Taxes 14.4 15.6 16.9 16.4
Non-taxes 9.6 11.1 10.5 10.2
Capital expenditure 15.3 15.0 13.2 12.4
Non-oil current expenditure 20.9 23.3 21.7 21.7
Overall balances -5.4 -5.3 -5.1 -5.1
Memo items:
Exports of oil (millions of barrels) 157 160 160 160
Oil price assumption (US$/barrel) 84.0 79.7 45.2 45.1
Net oil export revenue 6.8 6.9 2.3 2.4
GDP (US$ millions) 100,543 … … 98,925
Sources: Ministry of Finance and Fund staff projections.
2014
2015 Projections 1/
2/ Estimated from the BOP export revenues. The actual fiscal revenues may differ
slightly from these amounts due to differences in recording time between the BOP
and Fiscal accounts.
(In percent of GDP, unless otherwise indicated)
1/ In percent of GDP pojected by IMF. The initial budget, approved in October 2014,
was revised in August 2015.
Ecuador: The Impact of the Oil Price Shock and Fiscal Adjustment, 2015

ECUADOR
10 INTERNATIONAL MONETARY FUND
collection in the first half of the year was better than anticipated. The authorities have for now
withdrawn recent proposals to increase inheritance and real estate capital gains taxes, given strong
public opposition. Staff projections are similar to the revised budget, with some differences in non-
oil revenues—mainly reflecting differences in GDP growth assumptions—and capital spending.
11. Despite the fiscal adjustment, financing needs remain large and heavily dependent on
external borrowing. Including the expected amortizations of US$650 million of the 2015 global
bond and about US$1.7 billion of advance oil sales, total amortization will reach about US$5.1 billion
(5.2 percent of GDP). Gross financing needs will be about 10.3 percent of GDP in 2015, of which
5.6 percent of GDP was secured in the first half of the year. Full execution of the budget will depend
especially on the remaining external financing plans (about 3.7 percent of GDP), of which about
1 percent of GDP is fully committed so far from China, CAF and IDB.
12. Any shortfall in financing or a significant deterioration in market access will have to be
addressed through further spending retrenchments. The need to preserve full backing for
dollarization and assure private sector confidence in the monetary regime implies that central bank
financing and government arrears will have to be avoided. Staff underscored that a fiscal
contingency plan should be in place to address potential financing shortfalls through further cuts of
lower-priority capital or current spending—while preserving high-priority ongoing hydroelectric and
infrastructure projects—thus avoiding a liquidity decline in the financial system or delays in
payments. Moreover, the authorities will need to make every effort to improve market access and
lower spreads—also in light of the impending increase in U.S. interest rates—as well as deter capital
outflows, particularly by strengthening private sector confidence in growth and policy prospects.
13. The authorities are confident that the expected financing will be secured and the
revised budget will be fully executed. They agreed that financing shortfalls will need to be
matched by cuts in lower-priority capital projects. They reiterated that financing from the central
bank was done on a short-term basis to give the budget execution some flexibility while awaiting
external disbursements, and will be discontinued by end-year.
14. The 2016 draft budget, which is not finalized yet, envisages further fiscal
consolidations with the overall deficit declining to 3.7 percent of GDP. Oil revenue is expected
to decline further based on an oil price assumption of US$40/barrel. However, this would be more
than offset by corresponding expenditure retrenchments, with an improvement in the overall
balance of about 1½ percent of GDP.
Medium-Term Fiscal Challenges
15. The authorities plan to reduce the fiscal deficit to 0.5 percent of GDP by 2018. In the
medium term, the authorities plan to anchor the public sector wage bill to inflation and to contain
growth in spending on goods and services and social transfers below GDP growth. They view the
ongoing investment in hydroelectricity at the core of their plan to rationalize fuel subsidies—
through, notably, switching from gas to electricity for domestic cooking, with annual savings of
about US$0.9 billion starting in 2017 when the process is completed. At the same time, they plan to

ECUADOR
INTERNATIONAL MONETARY FUND 11
invest about US$4.3 billion over the medium term to develop the Ishpingo-Tambococha-Tiputini
(ITT) oil fields and increase oil production by about 52 million barrels a year by 2020 from the
current level of about 200 million. The public oil company, Petroamazonas, is expected to undertake
the investment in cooperation with private sector service providers, with financing from international
banks covered by sovereign guarantees.
16. Reflecting more cautious assumptions about oil investment, staff’s baseline scenario
envisages progressive fiscal consolidation to reach a deficit of about ½ percent of GDP in
2020. At current oil prices and given Petroamazonas’ limited financial and technical capabilities, the
scenario assumes an increase in oil investment sufficient to ensure that new production offsets
declining production from ageing fields, so that oil production remains flat. Under staff’s baseline
scenario, gross public debt excluding advance oil sales, which is the official definition, reaches the
legal limit of 40 percent of GDP in 2018 before declining to 39 percent of GDP in 2020, leaving
virtually no space for countercyclical policy in the face of potential shocks.6 The medium-term
primary surplus of about 2.3 percent of GDP—to be reached progressively by 2020—is consistent
with debt sustainability, and the medium-term non-oil primary deficit of about 0.7 percent of GDP is
consistent with the long-term Fiscal Sustainability Framework (Annex III). Given the high financing
needs and rapid accumulation of public debt, the envisaged fiscal adjustment will be required. If
market conditions remain adverse and financing shortfalls materialize over the medium term, fiscal
adjustment will need to become more front-loaded and rely not only on additional investment cuts,
but also on a more comprehensive expenditure rationalization.
17. It will be important to rebuild fiscal buffers once the fiscal position strengthens and
financing conditions improve. The recent external shocks have underscored the need to be able to
mobilize timely financing, highlighting the importance of fiscal buffers in the form, for example, of
stabilization funds to cope with downside risks (including natural disasters like those potentially
arising from the Cotopaxi and el Niño). Also, to enhance transparency of public asset and liability
positions, it would be valuable to publish detailed information on advance oil sales, delayed
payments of the Secretaría de Hidrocarburos, debt issued to the BCE, short-term debt, and
contingent liabilities.
18. Staff advised additional complementary fiscal measures going forward. These include:
Maintaining this year’s freeze on public sector wage rates into the medium term. This would also
help to restore competitiveness, given the effect on private sector wage determination in an
integrated labor market (more on this below); any alternative measure of fiscal consolidation
could also contribute to the needed relative price adjustment.
6 Staff’s definition of gross public debt, which includes advance oil sales, peaks at about 41 percent of GDP in 2017
before declining to about 39½ percent of GDP by 2020 (Annex III).

ECUADOR
12 INTERNATIONAL MONETARY FUND
In line with the authorities’ intentions, overhauling the fuel subsidy system, not only through
ongoing projects to enhance hydro energy, but also through better targeting subsidies to the
poor and allowing domestic fuel prices to reflect international conditions.
Improving tax collection, through further enhancing administrative efficiency and enforcement
(closing tax loopholes and addressing tax evasion), while reducing tax expenditures and
deductions from personal income tax. Tax amnesties should be avoided, given their effect on
expectations of further amnesties.
Start addressing the expected shortfall in the pension system—which is expected to contribute
negatively to the budget in the 2030s—by gradually increasing retirement age and anchoring
pension benefits to lifetime contributions, while increasing efforts to reduce labor market
informality.
Developing communication on the medium-term fiscal framework and strategy. Timely
announcements on revisions to medium-term plans will be instrumental to enhancing
confidence.
19. The authorities broadly agreed with staff suggestions—and indicated they are already
undertaking some of the mentioned reforms—but underscored the need to balance political
sensitivities in pursuing these objectives. They indicated that their current plans to anchor public
sector wage growth to inflation, together with productivity gains arising from the improvement in
human capital, infrastructure, the energy balance, and the interaction with the private sector are
sufficient to address competitiveness issues (more below). The authorities’ plans for fuel subsidy
rationalization envisage inducing consumers to switch from gas to electricity for domestic cooking.
While highlighting their past advances, the authorities agreed that additional efforts are needed to
improve the efficiency of tax collection. They clarified that they have no intention of repeating the
tax amnesty. Finally, the authorities continue to believe that public savings should be deployed
towards high-return projects related to the economic and social development of Ecuador rather
than set aside in low-return fiscal funds.
B. Ensuring Financial Stability and System Liquidity
20. For a dollarized economy, preservation of liquidity at the central bank (BCE) and
private banks must always take priority. This is especially important now, to limit systemic effects
on the financial system from the recent shocks and subsequent slowdown, deterioration in
confidence, and possible vicious cycle through macro-financial linkages (see Annex IV). The
authorities should continue their frequent monitoring of liquidity—and if pressures persist, promptly
adjust reserve requirements at the BCE. Current policies that affect liquidity need to be reversed:
The BCE has been providing direct financing to the government since October 2014. Even if
temporary, this raises concerns about ensuring central bank liquidity, in light of uncertainty of

ECUADOR
INTERNATIONAL MONETARY FUND 13
external disbursements, as well as about monetization of public spending. The authorities’ plan
to discontinue such financing within a few months is highly welcome.7
The BCE has also been providing credit to public corporations. Such credit—about US$1.8 billion
in July 2015—affects the BCE balance sheet. Its provision should therefore be closely linked to
conservative scenarios of potential liquidity needs for the BCE, to ensure that BCE obligations
with both banks and the public sector can be fulfilled on demand. The authorities explained that
they carefully program the liquidity position of the BCE on a quarterly basis to ensure adequate
liquidity.
A countercyclical measure announced in March 2015 envisages the provision of directed mortgage
lending through private banks. This requires banks to extend credit at a time when they need to
maintain liquidity and contain credit growth in order to cope with the ongoing deposit
withdrawal. Moreover, the associated mortgage securitization scheme backed by the BCE could
also create liquidity pressure for the BCE itself (and contingent liabilities to the government),
given default risks. The authorities stated that the liquidity levels and credit growth of the
financial system are being carefully monitored and assessed quarterly, and any undue pressure
on the system would lead to adjusting the lending targets.
The long-standing domestic liquidity requirements on banks were tightened further in 2012. These
affect the quality of banks’ liquidity: coupled with the 3 percent tax on banks’ external liquid
assets, they force banks to hold substantial liquidity domestically, either at the central bank
(which can be then lent to public banks) or in domestic debt instruments (for which there is not
an active secondary market), thus impairing banks’ optimal liquidity management (by limiting
how liquid, diversifiable, and safe is the liquidity portfolio), especially for small banks.
21. The public’s concerns about the proliferation of possible alternative money
arrangements need to be dispelled. In particular, it would be important to allay any fears of
monetization of public spending.
The electronic money system introduced by the BCE in December 2014 is backed by liquid assets
(activos liquidos). However, to maintain credibility, accounts should be explicitly backed by
international highly-rated dollar-denominated liquid assets, and the authorities are planning to
issue a regulation clarifying that this is indeed the intention. The funds fully remain the property
of the account holder and there is no co-mingling of accounts, but they are fungible for the
purpose of NIR management. The participation in such a scheme should remain voluntary, as
originally planned. The authorities see this scheme as a way to reduce currency in circulation, as
wear and tear of the bills implies a replacement cost for the BCE (about US$3 million per year),
7 Financing averaged US$0.8 billion (0.8 percent of GDP) between October 2014 and July 2015, out of which
US$0.4 billion related to central government bonds (5 year maturity) purchased from the National Finance
Corporation (CFN), and the rest to short-term bills.

ECUADOR
14 INTERNATIONAL MONETARY FUND
and argue that carrying the funds on the BCE balance sheet (rather than as an escrow account)
bodes well for transparency.
A recent resolution authorizes the government to pay for services with BCE securities, and
taxpayers may use such securities for tax amnesty payments. This should be discontinued once
the tax amnesty expires and issuance of bonds should be capped at the current legal limit of
US$50 million. The authorities indicated that this scheme is very effective and functions purely as
a clearing house between the government and the private sector, since these securities can only
be used for tax payment purposes and cannot be traded or transferred.
22. Crisis management arrangements should be improved.
The speed and confidentiality of access to the Liquidity Fund should be explicitly outlined in
financial regulations in order to enhance confidence.8 Also, the authorities should clarify that the
assets of the Liquidity Fund, set up with the contributions of banks to provide liquidity at the
time of pressure, will continue to be invested only in highly rated international securities, as is
the case at present, dispelling public concerns resulting from overlapping regulations on the
matter. The authorities stated that they were reviewing regulations for consistency and would
clarify any confusing points if necessary.
The deposit insurance fund is overexposed to public debt and other domestic assets for which there
is not an active secondary market. Best international practices suggest investing these funds in
high quality securities, to ensure their liquidity and safety. Staff also advised against the cross-
borrowing arrangements between the two deposit insurance funds (for private banks and
cooperatives). The authorities aim to achieve a well diversified and liquid portfolio gradually,
while at the same time their intention has always been to invest the deposit insurance funds in
productive domestic assets rather than in low-yielding liquid securities abroad. They also do not
see any liquidity pressures arising from selling the assets when paying out depositors, given the
gradual timeframe associated with bank resolution.
23. Reducing administrative controls on banks would enhance financial efficiency and
stability.
The caps on lending interest rates distort banks’ business decisions and risk assessments, and price
some customers out of the market. Gradually lifting these caps would allow banks some margin
to increase deposit rates in the context both of declining deposits and the expected U.S.
monetary policy normalization. To mitigate any risks associated with the liberalization of interest
rates, the authorities should consider introducing risk management tools such as tailoring
concentration limits, adjusting sectoral risk weighted capital requirements, and monitoring loan-
to-value ratios and credit gaps. The authorities are concerned about the adverse selection bias
8 As of June 2015, fund’s assets constituted US$2.3 billion, or 8 percent of banks’ deposits, in line with the
requirement.

ECUADOR
INTERNATIONAL MONETARY FUND 15
as the system is historically highly concentrated, but are open to learning in greater detail about
possible policy tools that could mitigate this concern.
An unlevel playing field in the mortgage market distorts competition. The authorities should
assess the implications of the special advantage of the bank of the pension fund (BIESS) in
providing extensive mortgage lending (US$7 billion), in terms of cheaper access to credit and
unique ability to collateralize payments with salaries.
24. Efforts to enhance broader financial sector supervision and regulation need to
continue, together with strengthening the anti-money laundering and combating the
financing of terrorism (AML/CFT) framework. Over the past several years, the authorities have
taken steps to strengthen the financial system and safeguard liquidity. Since the 2004 FSAP, the
Superintendency of Banks (SBS) implemented intense training programs for supervisors. Progress
has been made in complying with Basel criteria, improving supervision of off-shore banks, and
eliminating regulatory forbearance on bank loan classification. The authorities expressed interest in
enhancing their stress-testing toolkit and more broadly on monitoring systemic risk, including
through network analysis. Over the medium-term, the frameworks focusing on creditor rights, bank
liquidation procedures, indebtedness assessments, and collateral resolution should be strengthened.
Making sure that new regulations regarding the credit bureau continue to meet best international
practice would also be essential to improve risk assessment and financial sector efficiency. Staff
strongly suggested undertaking a new FSAP, and the authorities are currently reviewing the 2004
FSAP’s conclusions to determine the necessity of a new one. Although significant progress has been
made to improve the AML/CFT framework, continued political commitment and sustained
implementation of AML/CFT measures are needed to exit the Financial Action Task Force
monitoring, so as to safeguard financial stability from reputational risks.
C. Restoring Competitiveness and Promoting Private Sector Participation
25. Significant efforts to regain competitiveness are crucial to preserve external balance
and dollarization, and to sustain healthy medium-term growth. While the country’s external
position was assessed to be broadly consistent with the medium-term outlook as of 2014, the steep
fall in oil prices and the REER appreciation will require not only a significant improvement in the
fiscal position but also a substantial real wage and price adjustment to reverse overvaluation, while
achieving an improvement in access to market financing (Annex II). To safeguard external balance,
the authorities have applied various measures over the past several years, such as a tax on transfers
abroad (5 percent) since 2007,9 a tax on liquid assets held abroad by financial institutions since 2008,
and quality controls on imports since 2013. In 2015, import surcharges have been imposed.
26. Staff underscored that the recent import surcharges should be removed as soon as
possible, and within the announced timeframe, given the distortionary nature of such
9 This measure gives rise to an unapproved exchange restriction under Article VIII, Section 2(a).

ECUADOR
16 INTERNATIONAL MONETARY FUND
measures. The authorities stated that they are committed to a gradual elimination of the surcharges
as well as to continuing the consultation with the WTO Balance of Payment Committee. They also
indicated that the cuts in investment spending planned for the medium term fall heavily on imports,
which would help cushion the impact of the elimination of the tariffs. Staff reiterated also the need
to gradually dismantle the tax on transfers, as conditions permit, along with a gradual lifting of caps
on lending interest rates. The authorities see this tax as a successful tool to prevent short-term
capital outflows that create financial instability. In order to facilitate long-term capital inflows, they
recently decided to eliminate the tax on transfers associated with bank loans of more than one year
for lending to the sectors specified in the Production code (e.g. housing and micro lending). Staff
recommended that such exemption be extended to all transfers associated with long-term inflows,
and to eliminate the discretion of the Monetary and Financial Policy Board on the terms and
conditions for qualifying long-term inflows, while improving financial regulation and supervision.10
27. To regain competitiveness, substantial
real wage and price adjustments are called for.
The loss in competitiveness will be felt in full upon
the removal of import surcharges. As real wages
have increased faster than labor productivity over
the past decade and the minimum wage is one of
the highest in the region, restoring competitiveness
in the face of the recent real exchange rate
appreciation will require containing wage growth
substantially below inflation for a few years. Hence
the correction in wage dynamics needs to go
beyond the authorities’ current plan envisaging
public wages to rise with inflation and private
wages to rise with inflation plus productivity. The
wage adjustment should also be complemented
with gains in productivity and improvements in the
business environment.
28. The authorities have taken important
steps to promote private sector participation
and improve prospects for medium-term
growth. They are of the opinion that the
substantial reforms of the past few years aimed at
improving infrastructure, human capital, and the
10
Private sector flows in the balance of payments reflect also transactions between the domestic public and private
sector affecting BCE reserves (based on Ecuador compiling practices, given dollarization) which do not necessarily
mean inflows/outflows.
0
50
100
150
200
250
300
350
400
450
2000 2002 2004 2006 2008 2010 2012 2014
Ecuador Brazil
Chile Colombia
Mexico Peru
Ecuador and LA-5: Minimum Wage (2000-2014)
(In current U.S. dollars)
Source: Haver Analytics.
90
100
110
120
130
140
150
160
170
2004 2005 2006 2007 2008 2009 2010 2011 2012 2013 2014
Real wages
Labor productivity 1/
Ecuador: Labor Productivity and Real Wages 1/(2004=100)
Source: Haver Analytics.
1/ Labor productivity refers to output per employed person.

ECUADOR
INTERNATIONAL MONETARY FUND 17
energy balance will have persistent effects on enhancing productivity and competitiveness. In
addition, recent efforts have been devoted to promoting private sector investment in agriculture,
industry, and social services (with an expected impact of about US$10 billion over the next decade),
including through private-public partnerships, a reduced corporate tax rate for companies investing
within the productive matrix, and a tax refund for exporters on imported intermediate inputs. In
their view, such productivity gains, coupled with the new wage determination strategy, will be
sufficient to regain competitiveness over the medium term.
29. Broader efforts towards improving the business environment via structural reforms
would greatly contribute to the restoration of competitiveness and promote the development
of a well-functioning non-oil economy. International surveys cite shortcomings in the functioning
of institutions, and of goods, labor, and financial markets (mainly because of insufficient
competition). Thus, a wide-ranging structural reform agenda should be adopted to foster
productivity, crowd-in the private sector, and attract FDI. For example, labor market rigidities should
be addressed through reducing the overall cost of dismissal, promoting the availability of short-term
employment contracts, and facilitating labor force participation (for example by expanding child
care access). Frequent changes in the tax and regulatory systems need to be limited as they
increased business uncertainty. Promoting greater trade integration, including via the finalization of
the Free Trade Area with the European Union, will greatly help exporters to compete in international
markets.
119 116
21
121
26
135
120
112
127
119
133
118
31 34
113
29
53
Co
sts
of
crim
e a
nd
vio
len
ce
Str
en
gh
of
invest
or
pro
tect
ion
Gen
era
l g
overn
men
t d
eb
t
Co
un
try c
red
it r
ati
ng
Pri
mary
ed
uca
tio
n e
nro
llm
en
t
Pro
ced
ure
s to
sta
rt a
bu
sin
ess
Pre
vale
nce
of
trad
e b
arr
iers
Inte
nsi
ty o
f lo
cal
com
peti
tio
n
Bu
sin
ess
im
pact
of
rule
s o
n F
DI
Fle
xib
ilit
y o
f w
ag
e d
ete
rmin
ati
on
Red
un
dan
cy c
ost
s
Leg
al ri
gh
ts i
nd
ex
Ease
of
acc
ess
of
loan
s
Ven
ture
cap
ital
avail
ab
le
FD
I an
d t
ech
no
log
y t
ran
sfer
Gvt.
pro
cure
men
t o
f ad
v.
tech
pro
du
cts
Co
mp
an
y s
pen
din
g i
n R
&D
Ecuador: Global Competitiveness Indicators, 2014(Rank out of 148; 1 = best)
Source: World Economic Forum. Note: Categories listed are those in which Ecuador ranks in the top or bottom quartile of world distribution. Some
categories were omitted due to space constrains, namely: (1) Organized crime [129]; (2) Costs of terrorism [122]; (3) Degree of customer orientation
[115]; (4) Country capacity to attract talent [35]; (5) Days to start a business [130]; and (6) GG budget balance [35].
Overallranking: 71
InstitutionsMacro
economy Goods MarketLabor
Market Financial MarketTechnology &
InnovationEduc.

ECUADOR
18 INTERNATIONAL MONETARY FUND
STAFF APPRAISAL
30. After a decade of growth averaging 4½ percent, supported by favorable terms of
trade and large public investments, the economy is expected to contract in 2015 and growth
to remain around zero in 2016. Since the third quarter of 2014, a sharp oil price drop and sizable
REER appreciation affected growth and the external balance. Constrained by limited policy buffers
and options, the authorities moved rapidly to announce a large fiscal adjustment to keep the deficit
at the budgeted level. However, some external financing remains to be committed, while market
access has become more expensive. Despite the recently imposed tariff surcharges, the current
account deficit is expected to increase to about 2½ percent in 2015, while the loss of
competitiveness is clouding the outlook for growth and external balance.
31. Risks are tilted to the downside. Main external risks are additional softness in oil prices
which would threaten the external and fiscal positions, global financial instability which would affect
access to external financing, and persistent dollar appreciation which would further erode
competiveness. Domestic risks center on the availability of external financing and absence of buffers,
delays in expanding energy production, natural disasters, as well as further pressure on the financial
sector due to the economic and financial adjustment, existing distortions, and uncertainties about
the policy response.
32. The authorities’ initial fiscal policy response to the shocks is expected to offset the
fiscal implications of the external shocks, but full financing of the remaining fiscal gap is yet
to be secured. The planned expenditure cuts, together with tax measures, should broadly offset the
impacts of revenue shortfalls and contain the fiscal deficit within the budget level. However, the final
fiscal outcome will depend on the availability of financing and a fiscal contingency plan should be in
place for additional measures if needed. Financing shortfalls should be dealt with further cuts in
non-priority expenditure, while short-term financing by the central bank or arrears should be
avoided in the future. The import surcharges are distortionary and should be removed as soon as
possible and within the announced timeline. The adjustment to the minimum wage policy and new
plans to promote private sector investments—jointly with further efforts towards enhancement in
human capital and infrastructure—are welcome steps, although not sufficient to handle
competitiveness concerns.
33. In the near term, challenges will also center on securing adequate liquidity in the
financial sector, while improving financial sector regulation. Preserving financial stability will
require that the financial system remains liquid and well supervised, with financial buffers invested in
highly rated securities abroad. Improving the clarity of financial regulation, stregthening crisis
management and supervision are key for ensuring stability and rapid response. If pressure on the
system persists, relaxing banks’ reserve requirements should be considered. Regulatory restrictions
on bank activities, especially the interest rate caps and penalties on investing aboad should be lifted,
and the practice of directed lending should be discontinued to allow banks to optimize thier
portfolio allocation and appropriately assess risk. The system of electronic money will need to be
fully backed by dollars to dispell any public preoccupation with the arrangement. The tax on

ECUADOR
INTERNATIONAL MONETARY FUND 19
transfers should be eliminated for all transactions associated with long-term inflows—as has been
recently announced for such inflows when lent to specific sectors—in order to stimulate capital
inflows.
34. Looking forward, it will be essential to restore competitiveness, improve the fiscal
position, and enhance the business environment. Restoring competitiveness is essential to
safeguard external balance and sustain healthy medium-term growth—which in turn will help
preserve dollarization and financial stability. In this respect, it will be key to achieve a real wage
adjustment by containing wage growth substantially below inflation for a few years, and address
labor market rigidities through reducing the overall cost of employment. More broadly, reforms
should be targeted at improving productivity, crowding-in the private sector, attracting FDI, and
promoting trade integration. Medium-term fiscal consolidation should rely not only on spending
cuts, but also on improving tax collection, overhauling the fuel subsidy system (while preserving
subsidies to the poor), and adjusting the pension system, reforms which would help build fiscal
buffers. Frequent changes in the tax regime and further tax amnesties should be avoided.
35. It is expected that the next Article IV consultation will take place on the standard
12month cycle.

ECUADOR
20 INTERNATIONAL MONETARY FUND
Box 1. Ecuador: Revisiting Medium-Term Potential Output Growth1
Potential medium-term output growth has been revised down by 1½ percentage points to about 3 percent
in light of the drop in the international oil prices, the associated expected decline in public investment, as
well as a more limited scope for employment growth (which was associated with a large decline in
unemployment in recent years). The analysis is based on a growth accounting exercise, corroborated with an
empirical relationship between the price of oil and growth.
Economic activity in oil-dependent economies relies heavily on developments in the oil price. Positive
commodity price shocks raise expected real income, boosting private sector confidence and investment.
Moreover, in countries where the commodity sector is under the government control, such as in Ecuador,
the positive price shock raises government revenue, allowing governments to invest in infrastructure and
human capital. In Ecuador, public investment was raised from about 4 percent of GDP in mid-2000s to about
15 percent of GDP in recent years. As a result, the price of oil is positively correlated with capital formation
and economic growth. A simple empirical estimation of just the long-run relationship between the real price
of oil and economic growth shows that a 40 percent decline in the price of oil, from about US$100/barrel a
year earlier to about US$60/barrel in the medium term, could lead to a decline in the growth rate of GDP by
about ½ to 1½ percentage points.2
A more detailed growth accounting exercise using capital
accumulation assumed in the baseline scenario, employment
projection based on Okun’s law, and an empirical relationship
between TFP and the real price of oil suggests that potential
growth could decline by about 1½ percentage points with
respect to the average growth over the past decade (see
chart).
In this calculation, the effect of the decline in oil prices on
investment is estimated to reduce the growth contribution of
capital from 1.9 percentage points (ppts) over the past decade
to about 1.4ppts in the medium term. Similarly, the contribution of labor to growth is estimated to fall from
1.4ppts in the past decade to about 1ppt in the medium term due to a slowdown in employment growth
(given the more limited scope for a further reduction in unemployment from an already low level), while the
contribution of human capital is assumed to remain the same. Growth of TFP is expected to slowdown from
0.9 ppts in the past decade to about 0.3ppts in the medium term, reflecting the impacts of terms of trade
deterioration (based on an econometric estimate of the impact of the oil price decline on TFP growth for
Ecuador).
1 Prepared by M. Tashu (WHD). 2 The estimated long-run semi-elasticity of growth to the real price of oil is about 2, implying that a 40 percent decline in
the price of oil (equivalent to a 0.5 units decline in natural log terms) entails a one percentage point decline in growth,
with a confidence interval of about 1 percentage point.
2.7
4.4
2.9
-1.0
0.0
1.0
2.0
3.0
4.0
5.0
1995-2004 2005-2014 2015-2020
CapitalEmploymentHuman capitalTFPTotal
Ecuador: Contributions to Growth (In percent)

ECUADOR
INTERNATIONAL MONETARY FUND 21
Box 2. Ecuador: Recent Proposals and Tax Reforms1
The government has recently introduced two tax reforms with the aim of improving tax control and
increasing revenue. First, in December 2014 the National Assembly enacted the “Organic Law to Promote
Production and to Prevent Tax Fraud” (Ley Orgánica de Incentivos a la Producción y Prevención del Fraude
Fiscal) introducing changes to the corporate income tax (CIT) and excise laws and regulating the tax stability
contracts. Second, a Tax Amnesty Law (Ley Orgánica de Remisión de Intereses, Multas y Recargos) took effect
in May 2015. The government plans to raise about US$0.5 billion from each measure in 2015.
Main changes to the Tax Code and the CIT law focus on improving tax control and reducing avoidance. They
include: (i) introducing in the CIT base income derived from the sale of shares or any other instruments that
represent the capital of a company or a permanent establishment in Ecuador, (ii) increasing the CIT rate from
22 to 25 percent for Ecuadorian company whose owners are residents of tax havens and own more than
50 percent of the company, (iii) exempting companies for a period of 10 years for profits related to “new”
and productive investments, (iv) phasing-out the exemption for interest income, unless paid by banks,
(v) eliminating the deduction of expenses on junk food advertisements, (vi) introducing anti-avoidance rules
(accounting and bookkeeping rules), and (vii) introducing a 35 percent withholding tax on payments to tax
heaven residents. An additional measure includes increasing the excise rates on cigarettes and alcoholic
beverages. Staff cautions against exempting companies for long periods.
The Tax Amnesty Law grants total relief of interest, penalties, and surcharges provided that full payment of
the tax debt is made within 60 working days after May 5. The relief is reduced to 50 percent, if the full
payment of the tax is made between 61 to 90 working days. Staff view is that tax amnesties are unfair for
taxpayers with good compliance and weaken future compliance by raising expectations of future tax relief.
Moreover, the Internal Revenue Service needs to divert resources to administer amnesties that could have
been used for audits and other essential functions.
In addition, in June 2015, the government submitted two draft laws to the National Assembly to modify the
inheritance tax and introduce a capital gain tax on immovable property sales. The main changes on the
inheritance tax system include reducing the exempt threshold from US$77,000 to US$35,400, and
significantly increasing the tax rates, placing the top marginal rates at 77.5 percent, among the highest in the
world. The proposal for the tax on capital gains envisaged establishing a base as the difference between the
value of the transfer and the original property cost value adjusted for inflation, and a rate of 75 percent on
this base for sales’ profits over the exemption threshold of US$8,500. The government withdrew these
proposals shortly after due to public opposition.
1 Prepared by R. Fenochietto (FAD).
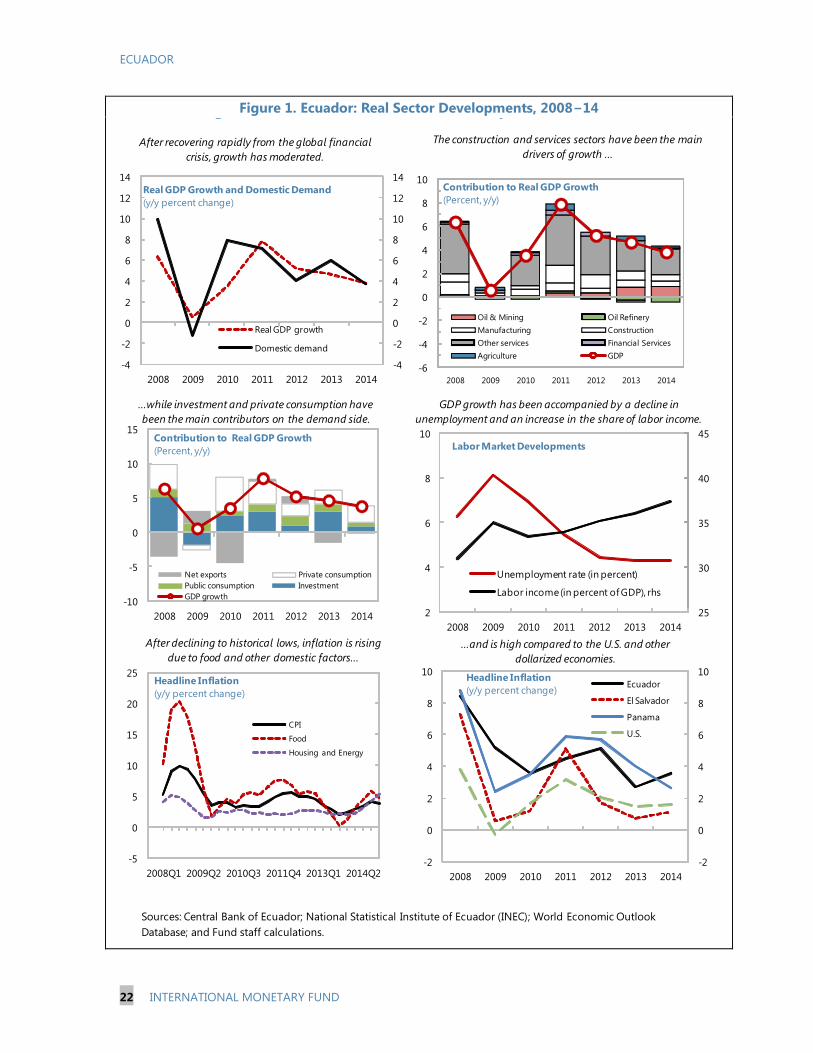
ECUADOR
22 INTERNATIONAL MONETARY FUND
Figure 1. Ecuador: Real Sector Developments, 2008−14
Figure 1. Ecuador: Real Sector Developments, 2008–14
Sources: Central Bank of Ecuador; National Statistical Institute of Ecuador (INEC); World Economic Outlook
Database; and Fund staff calculations.
-4
-2
0
2
4
6
8
10
12
14
-4
-2
0
2
4
6
8
10
12
14
2008 2009 2010 2011 2012 2013 2014
Real GDP growth
Domestic demand
Real GDP Growth and Domestic Demand
(y/y percent change)
-6
-4
-2
0
2
4
6
8
10
2008 2009 2010 2011 2012 2013 2014
Oil & Mining Oil Refinery
Manufacturing Construction
Other services Financial Services
Agriculture GDP
Contribution to Real GDP Growth
(Percent, y/y)
-5
0
5
10
15
20
25
2008Q1 2009Q2 2010Q3 2011Q4 2013Q1 2014Q2
CPI
Food
Housing and Energy
Headline Inflation
(y/y percent change)
-2
0
2
4
6
8
10
-2
0
2
4
6
8
10
2008 2009 2010 2011 2012 2013 2014
Ecuador
El Salvador
Panama
U.S.
Headline Inflation
(y/y percent change)
After recovering rapidly from the global financial
crisis, growth has moderated.
The construction and services sectors have been the main
drivers of growth ...
After declining to historical lows, inflation is rising
due to food and other domestic factors...
...and is high compared to the U.S. and other
dollarized economies.
25
30
35
40
45
2
4
6
8
10
2008 2009 2010 2011 2012 2013 2014
Unemployment rate (in percent)
Labor income (in percent of GDP), rhs
Labor Market Developments
-10
-5
0
5
10
15
2008 2009 2010 2011 2012 2013 2014
Net exports Private consumption
Public consumption Investment
GDP growth
Contribution to Real GDP Growth
(Percent, y/y)
...while investment and private consumption have
been the main contributors on the demand side.
GDP growth has been accompanied by a decline in
unemployment and an increase in the share of labor income.

ECUADOR
INTERNATIONAL MONETARY FUND 23
Figure 2. Ecuador: Fiscal Sector Developments, 2008–14
Figure 2. Ecuador: Fiscal Sector Developments, 2008–14
Sources: Haver Analytics; Ministry of Economy and Finance;and Fund staff calculations.
1/ LA5 stands for the five largest market economies in Latin America including Brazil, Chile, Colombia,
Mexico and Peru.
0
5
10
15
20
0
5
10
15
20
2008 2009 2010 2011 2012 2013 2014
Ecuador LA5 average 1/
Public Sector Capital Expenditures
(Percent of GDP)
-10
-8
-6
-4
-2
0
2
4
6
8
10
-10
-8
-6
-4
-2
0
2
4
6
8
10
2008 2009 2010 2011 2012 2013 2014
Primary Balance
Non-oil Primary Balance
Primary NFPS Balance
(Percent of GDP)
0
10
20
30
40
50
0
10
20
30
40
50
2008 2009 2010 2011 2012 2013 2014
Capital expenditure
Current expenditure
Primary Expenditures
(In percent of GDP)
0
10
20
30
40
0
10
20
30
40
2008 2009 2010 2011 2012 2013 2014
External
Domestic
NFPS Debt
(Percent of GDP)
Revenues from oil have been declining since
2011 while taxes and other revenues held up
well.
This has been associated with large primary
deficits, particularly for the non-oil balance.
Public sector debt has risen rapidly in recent
years... ... leading to an increase in debt service.
0
10
20
30
40
50
0
10
20
30
40
50
2008 2009 2010 2011 2012 2013 2014
Oil export revenue
Tax revenue
Other
Revenues
(In percent of GDP)
Capital expenditure has risen...
...and has been much higher than the LA5 average.
0
1
2
3
4
5
6
7
0
1
2
3
4
5
6
7
2008 2009 2010 2011 2012 2013 2014
Amortization
Interest
NFPS Debt Service
(Percent of GDP)

ECUADOR
24 INTERNATIONAL MONETARY FUND
Figure 3. Ecuador: External Sector Developments, 2008–15
0
1
2
3
4
5
6
2008 2009 2010 2011 2012 2013 2014
Net International Reserves
(Billions of U.S. Dollars)
...and net international reserves fell as banks reduced
their excess liquidity holdings at the central bank.
0
5
10
15
20
25
30
2008 2009 2010 2011 2012 2013 2014
Private
Public
External Debt
(Percent of GDP)
External debt levels remain low but have been
increasing....
Sources: Central Bank of Ecuador; and Fund staff calculations.
-20
-15
-10
-5
0
5
10
15
2008Q
1
2009Q
1
2010Q
1
2011Q
1
2012Q
1
2013Q
1
2014Q
1
2015Q
1
Current account
Financial account
Overall balance
Balance of Payments
(Percent of GDP)
-10
-8
-6
-4
-2
0
2
4
6
8
2008 2009 2010 2011 2012 2013 2014
Public sector flows
Foreign direct investment
Other flows
Financial account
Financial Account
(Percent of GDP)
High public sector borrowing has been offset by
sharp increases in other outflows.
-50
-30
-10
10
30
50
70
-4
-2
0
2
4
6
8
10
2008 2009 2010 2011 2013 2014
Capital Goods
Fuel and Primary Products
Consumer goods
Import Growth (y/y, RHS)
Imports
(Billions of U.S. Dollars)
...despite lower imports.
The current account deteriorated
since Q4 2014......mainly as a result of lower oil exports...
-80
-30
20
70
120
0
2
4
6
8
10
2008Q
1
2009Q
1
2010Q
1
2011Q
1
2012Q
1
2013Q
1
2014Q
1
2015Q
1
Non oil exports
Oil Exports
Terms of trade, yoy pct change (RHS)
Exports
(Billions of U.S. dollars)

ECUADOR
INTERNATIONAL MONETARY FUND 25
Figure 4. Ecuador: Selected Banking and Financial System, 2002–15
Sources: Central Bank of Ecuador; Superintendency of Banks; and Fund staff calculations.
120
140
160
180
200
0
4
8
12
16
20
24
Jan-08 Apr-09 Jul-10 Oct-11 Jan-13 Apr-14 Jul-15
CAR
NPLs
Provisions to NPL (RHS)
Capital Adequacy
(Percent)
Credit and deposit growth has been declining.
0
2
4
6
8
10
12
14
Jan-08 Apr-09 Jul-10 Oct-11 Jan-13 Apr-14 Jul-15
Margin
Lending rate (base rate on commercial loans)
Deposit rate
Interest rates
(Percent)
0
10
20
30
40
50
0
5
10
15
Jan-08 Apr-09 Jul-10 Oct-11 Jan-13 Apr-14 Jul-15
Bank reserves at BCE as percent of deposits
NFA as percent of deposits (RHS)
Liquid assets as percent of short-term obligations
Selected Liquidity Indicators
Liquidity coverage has been declining.
NPLs are low, and banks' provisioning and
capital remain adequate...
Bank interest rates have been capped since
2010, and margins are being compressed.
-10
0
10
20
30
40
50
60
60
65
70
75
80
85
90
95
100
105
110
Jan-08 Apr-09 Jul-10 Oct-11 Jan-13 Apr-14 Jul-15
Loan to deposit ratio
Deposit growth (RHS)
Credit growth (RHS)
Deposit and Credit
(Percent, y/y; unless otherwise indicated)
0
20
40
60
80
100
2002 2004 2006 2008 2010 2012 2014
Credit by Category
(Percent of total)
Commercial Consumer Housing
Microenterprise Education Public investment
Over the last decade credit shifted towards consumption
and microenterprises.
65
70
75
80
85
90
95
0
2
4
6
Jan
-08
Jan
-09
Jan
-10
Jan
-11
Jan
-12
Jan
-13
Jan
-14
Jan
-15
Intermediation
margin to total
assets
Operating cost to
net financial
margin (RHS)
Private Banks' Operating Costs and Margins
(Percent)
...but profitability has been declining while
operating costs remain high.

ECUADOR
26 INTERNATIONAL MONETARY FUND
Figure 5. Ecuador: Social and Structural Indicators, 2003–14 1/
National authorities, Manpower, World Development Indicators, and IMF staff calculations.
ARMBRA
COL
CRIDOM
ECU
GEO
PAN
PER
PRY
ROU
SLV
URY0
10
20
0 10 20
Po
vert
y ra
tio
(2003)
Poverty ratio (2012)
Poverty Headcount Ratio, 2003-12
(percent of population living under
1.25 constant 2005 U.S. dollars)
... and poverty
USAGBR
AUT
BEL
FRA
DEUITA
NLD
NORSWE
CHECAN
FIN
IRL
PRTESP AUS
NZL
BRA
CHL
COLMEX
PAN
PER
ISR
HKG IDN
KOR
SGP
THA
TUN
AZEKAZ
KGZ
BGRCZE
SVK
ESTLVA
SRBHUN
LTU
HRV
SVN
POL
ROM
ECU
2
4
6
8
0 20,000 40,000 60,000 80,000
Ed
uca
tio
n S
pendin
g, 2
008-2
012 a
vera
ge
(perc
ent o
f GD
P)
GDP per Capita, PPP (2008-12 average)
Education Spending and GDP per Capita
USAGBR
BEL
DNK
FRA
ITA
NOR
CHE
CAN
FIN
IRL
ESP
NZL
BRA
CHLCOL
MEX
PER
HKG
IDN
KOR
SGP
THABOL
KAZ
KGZ
CZE
SVK
ECU
2
3
5
6
7
0 20,000 40,000 60,000 80,000
WEF
Quality
of E
duca
tio
n, 2
013 (7
= b
est
)
GDP per Capita, PPP (2008-12 average)
WEF Quality of Education and GDP per
Capita
Sources: National Authorities; World Development Indicators; Global Competitiveness Report
and IMF staff estimates and calculations.
1/ Green dots correspond to LAC countries.
ARG
BRA
CHLCOL
PER
KGZ
BGR
EST
HUN
LTU
SVN
ROM
ECU
20
25
30
35
40
45
50
55
60
20 25 30 35 40 45 50 55 60
Gin
i co
effic
ient (2
003)
Gini coefficient (2011)
Gini Coefficient , 2003-11
Strong growth and social policies have reduced
income inequality...
Education spending is in line with the level of
development...
...delivering good results in terms of quality of
education, especially compared to the LA5
AUSAUT
AZE
BEL
BGRBRA
CAN
CHE
CHL
COL
CZE[CELLRE
F]
ESP
EST
FIN
FRAGBR
HKG
HRV
HUN
IDN
ISR
KAZKGZ
LTULVA
MEX
NORNZL
PAN
PER
POL
PRT
SGP
SRBSVK
SVN
THATUN
USA
65
70
75
80
85
90
0 20,000 40,000 60,000 80,000
Life
exp
ect
ancy
at b
irth
, in y
ears
(2008
-2012 a
vera
ge)
GDP per Capita, PPP (2008-2012 average)
Life Expectancy
and GDP per Capita
... again with good results in terms of life expectancy
AUS
AUT
AZE
BEL
BGR
BRA
CAN CHE
CHLCOL
CZE
DEUDNK
ECU
ESP
EST
FRA
HRV
IDN
ITA
KAZ
KGZLVAMEX
NLD
NORNZL
PER
PRT
SGP
SRB
SVNSWE
THA
TUN
USA
0
2
4
6
8
10
12
14
16
18
20
0 20,000 40,000 60,000 80,000
To
tal H
ealth E
xpen
diture
, in p
ct o
f GD
P
(2008
-2012 a
vera
ge)
GDP per Capita, PPP (2008-2012 average)
Health Expenditure
and GDP per Capita
Health expenditure has been commensurate
with income per capita...

ECUADOR
INTERNATIONAL MONETARY FUND 27
Table 1. Ecuador: Selected Economic and Financial Indicators
2008 2009 2010 2011 2012 2013 2014 2015 2016 2017 2018 2019 2020
Social Indicators
Life expectancy at birth (years) 75.2 75.4 75.6 75.9 76.2 76.5 … … … … … … …
Infant mortality (per thousand live births) 22.1 21.5 20.9 20.3 19.7 19.1 … … … … … … …
Adult literacy rate … 84.2 91.9 91.6 … 93.3 … … … … … … …
Poverty rate (total) 35.1 36.0 32.8 28.6 27.3 25.6 22.5 … … … … … …
Unemployment rate 6.0 6.5 5.0 4.2 4.1 4.2 3.8 ... ... ... ... ... ...
Population (millions) 14.5 14.7 15.0 15.3 15.5 15.8 ... ... ... ... ... ... ...
National income and prices
Real GDP 6.4 0.6 3.5 7.9 5.2 4.6 3.8 -0.6 0.1 0.6 1.2 1.5 1.8
Domestic demand (contribution to growth) 9.8 -1.2 8.0 7.5 4.2 6.1 3.8 -3.1 0.3 0.1 1.4 1.4 1.8
External Demand (contribution to growth) 1/ -3.5 1.8 -4.4 0.4 1.0 -1.5 0.0 2.4 -0.2 0.5 -0.2 0.1 0.1
Consumer price index period average 8.4 5.2 3.6 4.5 5.1 2.7 3.6 4.1 2.9 2.0 1.8 1.6 1.5
Consumer price index end-of-period 8.8 4.3 3.3 5.4 4.2 2.7 3.7 3.7 2.5 1.9 1.7 1.5 1.5
Banking system
Net domestic assets 40.3 28.6 57.6 28.9 26.3 16.3 19.7 1.8 1.7 2.9 2.7 3.9 2.7
Liabilities 23.7 8.1 20.6 20.5 16.0 13.0 11.4 0.1 1.0 2.8 3.3 3.4 3.1
Credit to the private sector 27.6 2.2 24.4 22.6 14.7 10.5 8.7 1.4 2.0 3.0 3.5 3.6 3.3
External sector
Exports 30.9 -25.9 25.8 27.3 6.4 4.5 3.6 -26.9 -1.3 6.5 4.6 4.9 2.6
Oil 40.7 -40.6 38.9 33.8 6.5 2.3 -5.7 -45.8 -6.5 9.6 5.1 6.9 1.3
Non-oil 18.3 -3.8 13.6 19.8 6.3 7.4 14.9 -8.0 1.7 4.8 4.4 3.7 3.4
Imports 37.3 -20.3 37.7 18.3 5.5 6.8 1.9 -19.8 -1.1 4.4 3.7 1.7 2.2
Terms of trade, nat. acct data (deterioration -) 20.0 -22.3 19.0 21.8 0.2 1.1 -5.4 -14.6 1.0 0.9 2.0 2.7 -0.1
Real effective exchange rate (depreciation -) -1.0 7.8 -2.2 -1.6 4.1 2.2 3.0 … … … … …
Public finances
Revenue 35.7 29.4 33.3 39.3 39.5 39.4 38.8 35.4 33.7 33.4 33.4 33.6 33.5
Primary expenditure 34.1 32.4 34.1 38.7 39.6 43.0 43.2 39.1 35.3 33.0 32.4 31.7 31.2
Overall balance (deficit -) 0.5 -3.6 -1.3 0.0 -0.9 -4.6 -5.4 -5.1 -3.7 -1.9 -1.4 -0.7 -0.4
Total public debt 22.2 17.7 19.7 19.4 21.7 26.0 31.3 37.4 40.4 41.2 41.2 40.5 39.6
Domestic 5.9 4.5 6.7 5.7 8.9 10.5 12.5 12.9 12.2 11.9 11.1 10.1 9.1
External 16.3 13.2 13.0 13.7 12.8 15.5 18.8 24.5 28.3 29.3 30.2 30.3 30.5
Total public debt , official definition 2/ 22.2 16.4 19.2 18.4 21.3 24.2 29.9 34.7 38.3 39.7 40.0 39.6 39.0
External current account balance 2.9 0.5 -2.3 -0.3 -0.2 -1.0 -0.6 -2.6 -2.8 -2.6 -2.4 -1.9 -1.8
Saving investment balance
National saving 29.2 26.1 25.8 27.8 27.6 27.7 27.5 22.1 21.1 19.8 19.6 20.0 19.8
Gross investment 26.4 25.6 28.0 28.1 27.8 28.8 28.1 24.7 23.9 22.4 22.0 21.9 21.6
Private 3/ 19.2 14.8 17.1 17.1 15.2 14.1 14.3 13.6 13.7 13.9 14.0 14.0 14.0
Public 7.2 10.9 10.9 11.0 12.6 14.7 13.7 11.1 10.2 8.5 8.0 7.9 7.7
Memorandum items:
Nominal GDP (US$ millions) 61,763 62,520 69,555 79,277 87,623 94,473 100,543 98,925 101,698 104,773 108,468 112,418 116,105
GDP per capita (US$) 4,267 4,242 4,633 5,193 5,645 5,989 … … … ... ... ... ...
Foreign direct investment (US$ millions) 1,058 308 165 644 585 728 774 660 785 800 850 900 950
Net international reserves (US$ millions) 4,473 3,792 2,622 2,958 2,483 4,361 3,949 3,522 3,397 3,486 3,759 3,777 3,992
Oil price Ecuador mix (US$ per barrel) 82.1 53.2 71.9 96.7 98.6 95.7 84.0 45.1 43.9 48.3 52.2 54.2 54.9
Oil production (millions of barrels) 184.6 177.2 177.4 182.3 184.3 192.1 203.1 197.2 198.2 198.2 198.2 198.2 198.2
Sources: Central Bank of Ecuador; Ministry of Finance; Haver; World Bank (WDI); and Fund staff estimates and projections.
3/ Includes inventories.
Proj.
2/ The official public debt definition does not include the outstanding balance for advance oil sales, which was about 1.5 percent of GDP at end-2014.
1/ The negative contribution in 2018 reflects the planned closure of the main oil refinery for maintenance, and the associated fall (increase) in refined oil exports (imports). The
refinery is expected to reopen in 2019.
(In percent of GDP)
(Percent change, unless otherwise indicated)

ECUADOR
28 INTERNATIONAL MONETARY FUND
Table 2. Ecuador: Operations of the Nonfinancial Public Sector, Net Accounting
Prel.
2008 2009 2010 2011 2012 2013 2014 2015 2016 2017 2018 2019 2020
Revenue 22,062 18,378 23,186 31,190 34,570 37,260 39,016 35,066 34,267 35,005 36,273 37,801 38,880
Oil revenue, net 1/ 8,675 5,212 7,845 12,935 12,220 11,433 10,906 7,968 7,053 7,162 7,519 8,011 8,103
Revenue from oil exports 7,354 3,763 6,061 11,214 9,895 9,153 8,857 5,628 4,775 4,966 5,410 5,858 5,883
Domestic sales of oil derivatives (CFDD) 1,321 1,448 1,784 1,721 2,325 2,280 2,049 2,340 2,278 2,196 2,109 2,153 2,220
Non-oil revenue 12,494 12,373 13,994 16,489 19,783 22,630 23,944 26,310 25,837 26,271 27,126 28,104 29,036
Taxes 6,919 7,553 8,667 9,765 12,255 13,668 14,460 16,176 15,693 15,820 16,307 16,890 17,454
Social security contributions 2/ 2,097 2,061 2,549 3,971 4,756 4,547 4,723 5,137 5,329 5,490 5,683 5,890 6,084
Other 3,478 2,759 2,778 2,753 2,772 4,416 4,761 4,996 4,816 4,961 5,136 5,323 5,498
Operating surplus of public enterprises 893 794 1,346 1,766 2,567 3,196 4,166 789 1,376 1,572 1,627 1,686 1,742
O/w profits of oil companies withheld for investment 582 517 877 1,151 1,818 2,593 3,987 815 1,017 1,572 1,627 1,686 1,742
Primary expenditure 21,058 20,261 23,710 30,693 34,741 40,637 43,388 38,692 35,927 34,572 35,142 35,632 36,219
Current 14,057 13,581 16,492 21,468 23,779 26,006 28,022 26,367 24,146 24,195 25,044 25,271 25,732
Wages and salaries 4,869 5,929 6,786 7,265 8,345 8,896 9,479 9,869 9,571 9,450 9,566 9,719 9,864
Purchases of goods and services 2,086 1,924 2,090 2,543 3,473 4,435 5,325 4,710 4,645 4,627 4,746 4,919 5,080
Social Security Benefits 2/ 1,563 1,875 2,245 3,225 3,338 3,410 3,640 4,003 4,181 4,329 4,471 4,610 4,748
Other 5,538 3,853 5,371 8,436 8,623 9,265 9,578 7,784 5,749 5,789 6,261 6,023 6,039
Cost of imports of oil derivatives 3,042 1,966 3,466 4,850 5,363 5,735 6,363 4,798 3,141 3,180 3,777 3,568 3,613
Payments to private oil companies (SH) 3/ … … … 1,765 1,788 1,674 1,683 1,526 1,227 1,200 1,150 1,100 1,050
Other 2,495.9 1,887.2 1,904.7 1,820.3 1,471.4 1,855.5 1,531.4 1,460.5 1,381.0 1,409.2 1,334.3 1,355.6 1,376.0
Capital 7,001 6,680 7,218 9,224 10,963 14,631 15,366 12,326 11,780 10,377 10,098 10,361 10,487
Fixed capital spending 6,930 6,310 6,571 8,891 10,312 14,039 13,991 11,113 10,508 9,066 8,741 8,955 9,035
Net-lending 71 370 647 334 650 592 1,375 1,213 1,272 1,311 1,357 1,406 1,453
Primary balance 1,004 -1,883 -524 497 -172 -3,377 -4,372 -3,626 -1,660 433 1,131 2,169 2,661
Interest 705 349 413 502 652 971 1,024 1,436 2,072 2,465 2,697 2,949 3,158
O/w external 660 323 377 452 533 714 829 1,188 1,630 2,032 2,253 2,507 2,719
Current balance 7,300 4,448 6,281 9,219 10,139 10,283 9,970 7,263 8,048 8,345 8,532 9,582 9,990
Overall balance 300 -2,232 -937 -5 -824 -4,348 -5,395 -5,062 -3,732 -2,032 -1,567 -780 -497
Memorandum items:
Real growth in primary spending (percent change) 36.1 -8.5 13.0 16.8 7.7 13.9 2.9 -14.8 -6.9 1.7 2.5 3.2 3.1
Current oil balance 4/ 6,215 3,763 5,256 7,470 6,886 6,617 6,846 2,459 3,702 4,353 4,220 5,030 5,181
Nonoil primary balance 5/ -4,629 -5,129 -4,903 -5,822 -5,240 -7,401 -7,231 -5,270 -4,345 -2,349 -1,462 -1,174 -779
Nominal GDP (US$ millions) 61,763 62,520 69,555 79,277 87,623 94,473 100,543 98,925 101,698 104,773 108,468 112,418 116,105
Sources: Ministry of Finance; Central Bank of Ecuador; and Fund staff estimates and projections.
1/ Net of operational cost.
2/ From 2011 on, includes additional public pension sytems which previously had not been consolidated into the NFPS accounts.
3/ Reflects service contract payments to private oil companies beginning in 2011.
5/ The primary balance plus current oil balance, less profits of state-owned oil companies, which is offset by a corresponding oil investment under capital expenditure.
4/ Oil revenue plus profits of state-owned oil companies, which is retained for investment in the oil sector, less oil-related current expenditure (the costs of imports of oil derivatives
and payments to private oil companies).
Proj.
(In millions of U.S. dollars, unless otherwise indicated)

ECUADOR
INTERNATIONAL MONETARY FUND 29
Table 3. Ecuador: Operations of the Nonfinancial Public Sector, Net Accounting
Prel.
2008 2009 2010 2011 2012 2013 2014 2015 2016 2017 2018 2019 2020
Revenue 35.7 29.4 33.3 39.3 39.5 39.4 38.8 35.4 33.7 33.4 33.4 33.6 33.5
Oil revenue, net 1/ 14.0 8.3 11.3 16.3 13.9 12.1 10.8 8.1 6.9 6.8 6.9 7.1 7.0
Revenue from oil exports 11.9 6.0 8.7 14.1 11.3 9.7 8.8 5.7 4.7 4.7 5.0 5.2 5.1
Domestic sales of oil derivatives (CADID) 2.1 2.3 2.6 2.2 2.7 2.4 2.0 2.4 2.2 2.1 1.9 1.9 1.9
Nonpetroleum revenue 20.2 19.8 20.1 20.8 22.6 24.0 23.8 26.6 25.4 25.1 25.0 25.0 25.0
Taxes 11.2 12.1 12.5 12.3 14.0 14.5 14.4 16.4 15.4 15.1 15.0 15.0 15.0
Social security contributions 2/ 3.4 3.3 3.7 5.0 5.4 4.8 4.7 5.2 5.2 5.2 5.2 5.2 5.2
Other 5.6 4.4 4.0 3.5 3.2 4.7 4.7 5.1 4.7 4.7 4.7 4.7 4.7
Operating surplus of public enterprises 1.4 1.3 1.9 2.2 2.9 3.4 4.1 0.8 1.4 1.5 1.5 1.5 1.5
O/w profits of oil companies withheld for investment 0.9 0.8 1.3 1.5 2.1 2.7 4.0 0.8 1.0 1.5 1.5 1.5 1.5
Primary expenditure 34.1 32.4 34.1 38.7 39.6 43.0 43.2 39.1 35.3 33.0 32.4 31.7 31.2
Current 22.8 21.7 23.7 27.1 27.1 27.5 27.9 26.7 23.7 23.1 23.1 22.5 22.2
Wages and salaries 7.9 9.5 9.8 9.2 9.5 9.4 9.4 10.0 9.4 9.0 8.8 8.6 8.5
Purchases of goods and services 3.4 3.1 3.0 3.2 4.0 4.7 5.3 4.8 4.6 4.4 4.4 4.4 4.4
Social security benefits 2/ 2.5 3.0 3.2 4.1 3.8 3.6 3.6 4.0 4.1 4.1 4.1 4.1 4.1
Other current expenditure 9.0 6.2 7.7 10.6 9.8 9.8 9.5 7.9 5.7 5.5 5.8 5.4 5.2
Cost of imports of oil derivatives 4.9 3.1 5.0 6.1 6.1 6.1 6.3 4.9 3.1 3.0 3.5 3.2 3.1
Payments to private oil companies (SH) 3/ … … … 2.2 2.0 1.8 1.7 1.5 1.2 1.1 1.1 1.0 0.9
Other 4.0 3.0 2.7 2.3 1.7 2.0 1.5 1.5 1.4 1.3 1.2 1.2 1.2
Capital 11.3 10.7 10.4 11.6 12.5 15.5 15.3 12.5 11.6 9.9 9.3 9.2 9.0
Fixed capital spending 11.2 10.1 9.4 11.2 11.8 14.9 13.9 11.2 10.3 8.7 8.1 8.0 7.8
Net-lending 0.1 0.6 0.9 0.4 0.7 0.6 1.4 1.2 1.3 1.3 1.3 1.3 1.3
Primary balance 1.6 -3.0 -0.8 0.6 -0.2 -3.6 -4.3 -3.7 -1.6 0.4 1.0 1.9 2.3
Interest 1.1 0.6 0.6 0.6 0.7 1.0 1.0 1.5 2.0 2.4 2.5 2.6 2.7
O/w external 1.1 0.5 0.5 0.6 0.6 0.8 0.8 1.2 1.6 1.9 2.1 2.2 2.3
Current balance 11.8 7.1 9.0 11.6 11.6 10.9 9.9 7.3 7.9 8.0 7.9 8.5 8.6
Overall balance 0.5 -3.6 -1.3 0.0 -0.9 -4.6 -5.4 -5.1 -3.7 -1.9 -1.4 -0.7 -0.4
Memorandum items:
Current oil balance 4/ 10.1 6.0 7.6 9.4 7.9 7.0 6.8 2.5 3.6 4.2 3.9 4.5 4.5
Nonoil primary balance 5/ -7.5 -8.2 -7.0 -7.3 -6.0 -7.8 -7.2 -5.3 -4.3 -2.2 -1.3 -1.0 -0.7
Output gap (in percent) 1.7 -1.8 -2.6 0.4 0.8 1.4 1.5 -1.5 -2.9 -3.0 -2.5 -2.0 -1.5
Structural nonoil primary balance -7.8 -7.8 -6.4 -7.3 -6.2 -8.2 -7.6 -4.8 -3.4 -1.2 -0.3 0.0 0.3
Fiscal impulse (- = expansionary) 6/ -4.9 0.0 1.4 -1.0 1.2 -2.0 0.6 2.8 1.5 2.2 0.9 0.2 0.3
Sources: Ministry of Finance; Central Bank of Ecuador; and Fund staff estimates and projections.
1/ Net of operational cost.
2/ From 2011 on, includes additional public pension sytems which previously had not been consolidated into the NFPS accounts.
3/ Reflects service contract payments to private oil companies beginning in 2011.
6/ Change in structural nonoil primary balance.
5/ The primary balance plus current oil balance, less profits of state-owned oil companies, which is offset by a corresponding oil investment under capital expenditure.
4/ Oil revenue plus profits of state-owned oil companies, which is retained for investment in the oil sector, less oil-related current expenditure (the costs of imports of oil derivatives and
payments to private oil companies).
Proj.
(In percent of GDP, unless otherwise indicated)

ECUADOR
30 INTERNATIONAL MONETARY FUND
Table 4. Ecuador: Nonfinancial Public Sector Financing
Prel.
2008 2009 2010 2011 2012 2013 2014 2015 2016 2017 2018 2019 2020
Gross financing needs 1,048 3,654 2,077 1,653 2,742 6,454 10,371 10,167 8,669 6,758 6,650 6,145 8,239
Nonfinancial public sector deficit -300 2,232 937 5 824 4,348 5,395 5,062 3,732 2,032 1,567 780 497
Amortization 1,347 1,422 1,140 1,648 1,918 2,107 4,976 5,105 4,937 4,726 5,083 5,366 7,742
External 1,338 1,422 1,104 1,549 1,611 1,706 3,556 3,762 3,308 3,486 3,328 3,455 5,665
Domestic 10 0 36 99 307 401 1,420 1,343 1,629 1,240 1,756 1,911 2,076
Gross financing 1,048 3,693 2,080 1,653 2,742 6,454 10,371 10,167 8,669 6,758 6,650 6,145 8,239
External 1,462 2,390 1,531 3,222 1,919 5,172 8,013 9,114 7,811 5,407 5,357 4,852 6,946
Domestic -789 1,338 1,320 -26 762 1,672 1,367 1,506 1,274 1,351 1,293 1,293 1,293
O/w deposit build up(-) -794 962 1,000 -623 -293 240 -120 0 0 0 0 0 0
Other financing 374 -35 -771 -1,542 60 -389 992 -453 -416 0 0 0 0
External arrears 61 24 23 32 31 21 7 0 0 0 0 0 0
Other items 1/ 313 -59 -794 -1,574 29 -410 984 -453 -416 0 0 0 0
Gross financing needs 1.7 5.8 3.0 2.1 3.1 6.8 10.3 10.3 8.5 6.5 6.1 5.5 7.1
Nonfinancial public sector deficit -0.5 3.6 1.3 0.0 0.9 4.6 5.4 5.1 3.7 1.9 1.4 0.7 0.4
Amortization 2.2 2.3 1.6 2.1 2.2 2.2 4.9 5.2 4.9 4.5 4.7 4.8 6.7
External 2.2 2.3 1.6 2.0 1.8 1.8 3.5 3.8 3.3 3.3 3.1 3.1 4.9
Domestic 0.0 0.0 0.1 0.1 0.4 0.4 1.4 1.4 1.6 1.2 1.6 1.7 1.8
Gross financing 1.7 5.9 3.0 2.1 3.1 6.8 10.3 10.3 8.5 6.5 6.1 5.5 7.1
External 2.4 3.8 2.2 4.1 2.2 5.5 8.0 9.2 7.7 5.2 4.9 4.3 6.0
Domestic -1.3 2.1 1.9 0.0 0.9 1.8 1.4 1.5 1.3 1.3 1.2 1.2 1.1
O/w deposit build up(-) -1.3 1.5 1.4 -0.8 -0.3 0.3 -0.1 0.0 0.0 0.0 0.0 0.0 0.0
Other financing 0.6 -0.1 -1.1 -1.9 0.1 -0.4 1.0 -0.5 -0.4 0.0 0.0 0.0 0.0
External arrears 0.1 0.0 0.0 0.0 0.0 0.0 0.0 0.0 0.0 0.0 0.0 0.0 0.0
Other items 1/ 0.5 -0.1 -1.1 -2.0 0.0 -0.4 1.0 -0.5 -0.4 0.0 0.0 0.0 0.0
Memorandum Items:
NFPS deposits (US$ millions) 2/ 5,690 4,728 3,729 4,352 4,645 4,405 4,525 … … … … … …
Total debt (in percent of GDP) 22.2 17.7 19.7 19.4 21.7 26.0 31.3 37.4 40.4 41.2 41.2 40.5 39.6
External 16.3 13.2 13.0 13.7 12.8 15.5 18.8 24.5 28.3 29.3 30.2 30.3 30.5
Domestic 3/ 5.9 4.5 6.7 5.7 8.9 10.5 12.5 12.9 12.2 11.9 11.1 10.1 9.1
Sources: Ministry of Finance; Central Bank of Ecuador; and Fund staff estimates
1/ Includes domestic floating debt and statistical discrepancy.
2/ Includes deposits of pension funds, which are reported as nonfinancial public sector.
3/ Does not include outstanding treasury certificates or arrears.
Proj.
(In percent of GDP)
(In millions of U.S. dollars, unless otherwise indicated)

ECUADOR
INTERNATIONAL MONETARY FUND 31
Table 5. Ecuador: Balance of Payments
Prel.
2008 2009 2010 2011 2012 2013 2014 2015 2016 2017 2018 2019 2020
Current account 1,767 309 -1,586 -261 -165 -983 -601 -2,529 -2,853 -2,724 -2,579 -2,081 -2,131
Trade account 1,549 144 -1,504 -160 50 -493 -67 -1,948 -1,969 -1,648 -1,521 -868 -798
Exports, f.o.b. 19,461 14,412 18,137 23,082 24,569 25,686 26,604 19,441 19,185 20,432 21,379 22,416 23,005
Oil 11,721 6,965 9,673 12,945 13,792 14,108 13,302 7,207 6,739 7,386 7,763 8,298 8,403
Non-Oil 7,740 7,447 8,464 10,137 10,777 11,578 13,302 12,234 12,445 13,047 13,616 14,119 14,602
Imports (f.o.b.) -17,912 -14,268 -19,641 -23,243 -24,519 -26,178 -26,672 -21,389 -21,154 -22,081 -22,900 -23,284 -23,803
Oil -3,358 -2,338 -4,043 -5,087 -5,441 -5,927 -6,417 -4,494 -2,942 -2,979 -3,538 -3,342 -3,384
Non-Oil -14,554 -11,930 -15,598 -18,156 -19,078 -20,251 -20,254 -16,894 -18,212 -19,102 -19,362 -19,942 -20,419
Services (net) -3,003 -2,556 -2,564 -2,823 -2,695 -2,890 -2,798 -2,964 -3,405 -3,746 -3,884 -4,101 -4,346
Transfers (net) 3,221 2,722 2,481 2,722 2,480 2,399 2,264 2,383 2,522 2,670 2,826 2,888 3,013
Capital and Financial account -653 -2,712 479 453 -516 2,959 394 2,102 2,728 2,814 2,852 2,099 2,346
NFPS sector flows, net 124 969 426 1,673 309 3,466 4,457 5,352 4,503 1,921 2,029 1,397 1,280
Disbursements 1,462 2,390 1,531 3,222 1,919 5,172 8,013 9,114 7,811 5,407 5,357 4,852 6,946o/w Multilateral 5 1,004 1,074 2,713 751 4,391 2,780 5,274 5,311 2,907 2,857 2,352 4,446
o/w Bilateral 340 1,259 797 721 1,219 732 1,497 1,670 1,500 1,500 1,500 1,500 1,500
o/w Advance oil sales, net 0 1,000 0 1,000 0 1,900 1,600 2,900 905 400 695 695 695
Amortization 1,338 1,422 1,104 1,549 1,611 1,706 3,556 3,762 3,308 3,486 3,328 3,455 5,665
Private sector flows, net 1/ -1,835 -3,989 -113 -1,863 -1,409 -1,235 -4,837 -3,910 -2,560 92 -27 -198 116
Banking system 46 -91 82 -85 37 -32 20 -30 -30 -80 -50 -60 -59
Other flows 2/ -1,881 -3,898 -194 -1,779 -1,446 -1,204 -4,857 -3,880 -2,530 172 23 -138 175
Foreign direct investment 1,058 308 165 644 585 728 774 660 785 800 850 900 950
Errors and Omissions -180 -244 -105 79 97 -130 -217 0 0 0 0 0 0
Overall balance 934 -2,647 -1,212 272 -582 1,846 -424 -427 -125 89 273 17 216
Financing -934 2,647 1,212 -272 582 -1,846 424 427 125 -89 -273 -17 -216
Net int'l reserves (- = accum.) -952 681 1,170 -336 475 -1,878 411 427 125 -89 -273 -17 -216
Net exceptional financing 3/ 18 1,966 42 64 107 32 13 0 0 0 0 0 1
Current account 2.9 0.5 -2.3 -0.3 -0.2 -1.0 -0.6 -2.6 -2.8 -2.6 -2.4 -1.9 -1.8
Trade account 2.5 0.2 -2.2 -0.2 0.1 -0.5 -0.1 -2.0 -1.9 -1.6 -1.4 -0.8 -0.7
Exports, f.o.b. 31.5 23.1 26.1 29.1 28.0 27.2 26.5 19.7 18.9 19.5 19.7 19.9 19.8
Oil 19.0 11.1 13.9 16.3 15.7 14.9 13.2 7.3 6.6 7.0 7.2 7.4 7.2
Non-Oil 12.5 11.9 12.2 12.8 12.3 12.3 13.2 12.4 12.2 12.5 12.6 12.6 12.6
Imports (f.o.b.) -29.0 -22.8 -28.2 -29.3 -28.0 -27.7 -26.5 -21.6 -20.8 -21.1 -21.1 -20.7 -20.5
Oil -5.4 -3.7 -5.8 -6.4 -6.2 -6.3 -6.4 -4.5 -2.9 -2.8 -3.3 -3.0 -2.9
Non-Oil -23.6 -19.1 -22.4 -22.9 -21.8 -21.4 -20.1 -17.1 -17.9 -18.2 -17.9 -17.7 -17.6
Services (net) -4.9 -4.1 -3.7 -3.6 -3.1 -3.1 -2.8 -3.0 -3.3 -3.6 -3.6 -3.6 -3.7
Transfers (net) 5.2 4.4 3.6 3.4 2.8 2.5 2.3 2.4 2.5 2.5 2.6 2.6 2.6
Capital and Financial account -1.1 -4.3 0.7 0.6 -0.6 3.1 0.4 2.1 2.7 2.7 2.6 1.9 2.0
Public sector flows, net 0.2 1.5 0.6 2.1 0.4 3.7 4.4 5.4 4.4 1.8 1.9 1.2 1.1
Private sector flows, net 1/ -3.0 -6.4 -0.2 -2.4 -1.6 -1.3 -4.8 -4.0 -2.5 0.1 0.0 -0.2 0.1
Foreign direct investment 1.7 0.5 0.2 0.8 0.7 0.8 0.8 0.7 0.8 0.8 0.8 0.8 0.8
Errors and Omissions -0.3 -0.4 -0.2 0.1 0.1 -0.1 -0.2 0.0 0.0 0.0 0.0 0.0 0.0
Overall balance 1.5 -4.2 -1.7 0.3 -0.7 2.0 -0.4 -0.4 -0.1 0.1 0.3 0.0 0.2
Memorandum item:
Oil trade balance 13.5 7.4 8.1 9.9 9.5 8.7 6.8 2.7 3.7 4.2 3.9 4.4 4.3
Non-oil trade balance: -11.0 -7.2 -10.3 -10.1 -9.5 -9.2 -6.9 -4.7 -5.7 -5.8 -5.3 -5.2 -5.0
Sources: Central Bank of Ecuador; and Fund staff estimates and projections.
2/ Includes public financial sector and monetary authority.
3/ Includes foreign arrears and net flows from oil funds held abroad and flows associated with debt default and restructuring.
Proj.
(In percent of GDP)
1/ Private sector flows in the balance of payments reflect also transactions between the domestic public and private sector affecting BCE reserves (based on
Ecuador compiling practices, given dollarization) which do not necessarily mean inflows/outflows.
(In millions of U.S. dollars, unless otherwise indicated)

ECUADOR
32 INTERNATIONAL MONETARY FUND
Table 6. Ecuador: Monetary Survey
2008 2009 2010 2011 2012 2013 2014 2015 2016
Net Foreign Assets 5,872 4,982 3,856 4,584 4,659 5,216 4,536 4,108 3,984
o/w NIR 4,473 3,792 2,622 2,958 2,483 4,361 3,949 3,522 3,397
Net Domestic Assets -3,300 -2,072 -1,175 -1,733 -735 500 1,321 1,040 1,045
Public sector -2,616 -2,052 -1,260 -1,873 -1,768 -1,488 -552 -552 -552
Banking system 106 625 1,012 1,433 2,108 2,736 2,530 2,650 2,677
Other -789 -645 -927 -1,293 -1,075 -748 -658 -1,058 -1,080
Liabilities 1/ 2,572 2,910 2,681 2,851 3,924 5,716 5,857 5,149 5,028
Net Foreign Assets 3,585 4,234 4,934 5,164 5,323 5,534 5,891 5,950 6,010
Net Domestic Assets 9,430 10,063 12,693 16,106 19,237 22,163 24,643 24,894 25,143
Net assets held in the BCE 1,250 1,049 740 739 804 532 229 318 299
Net credit to the public sector -1,352 -1,028 -647 -550 236 976 1,675 1,368 1,393
Net credit to the private sector 13,539 13,829 17,220 21,120 24,223 26,785 29,131 29,520 30,122
Other -4,007 -3,786 -4,620 -5,203 -6,026 -7,141 -7,075 -6,352 -6,710
Liabilities 2/ 13,015 14,297 17,628 21,270 24,560 27,697 30,534 30,845 31,153
Net Foreign Assets 9,457 9,216 8,790 9,748 9,982 10,750 10,426 10,059 9,994
Net Domestic Assets 4,892 6,289 9,911 12,779 16,141 18,765 22,458 22,855 23,234
Net credit to the public sector -3,968 -3,081 -1,906 -2,423 -1,532 -511 1,123 816 841
Net credit to the private sector 13,576 13,869 17,255 21,153 24,259 26,812 29,156 29,561 30,165
Other -4,716 -4,500 -5,437 -5,951 -6,585 -7,536 -7,822 -7,522 -7,773
Liabilities 2/ 14,348 15,505 18,702 22,527 26,123 29,515 32,884 32,914 33,227
Consolidated banking system
Net foreign assets 11.6 -1.7 -2.7 5.1 1.0 2.9 -1.1 -1.1 -0.2
Net domestic assets 12.1 9.7 23.4 15.3 14.9 10.0 12.5 1.2 1.1
Net credit public sector -14.5 6.2 7.6 -2.8 4.0 3.9 5.5 -0.9 0.1
Net credit private sector 25.3 2.0 21.8 20.8 13.8 9.8 7.9 1.2 1.8
Other 1.3 1.5 -6.0 -2.7 -2.8 -3.6 -1.0 0.9 -0.8
Liabilities 2/ 23.7 8.1 20.6 20.5 16.0 13.0 11.4 0.1 1.0
Memorandum items:
Liabilities (percent of GDP) 23.2 24.8 26.9 28.4 29.8 31.2 32.7 33.3 32.7
Net credit to the private sector (percent of GDP) 22.0 22.2 24.8 26.7 27.7 28.4 29.0 29.9 29.7
Sources: Central Bank of Ecuador and Fund staff estimates.
1/ Includes deposits by local and regional governments and public enterprises.
2/ Includes private banks, cooperatives and other financial institutions. Does not include BIESS.
(Change in respect to liabilities of the previous year)
Proj.
II. Depository Institutions 2/
I. Central Bank
III. Consolidated Banking System
(In millions of U.S. dollars, unless otherwise indicated)
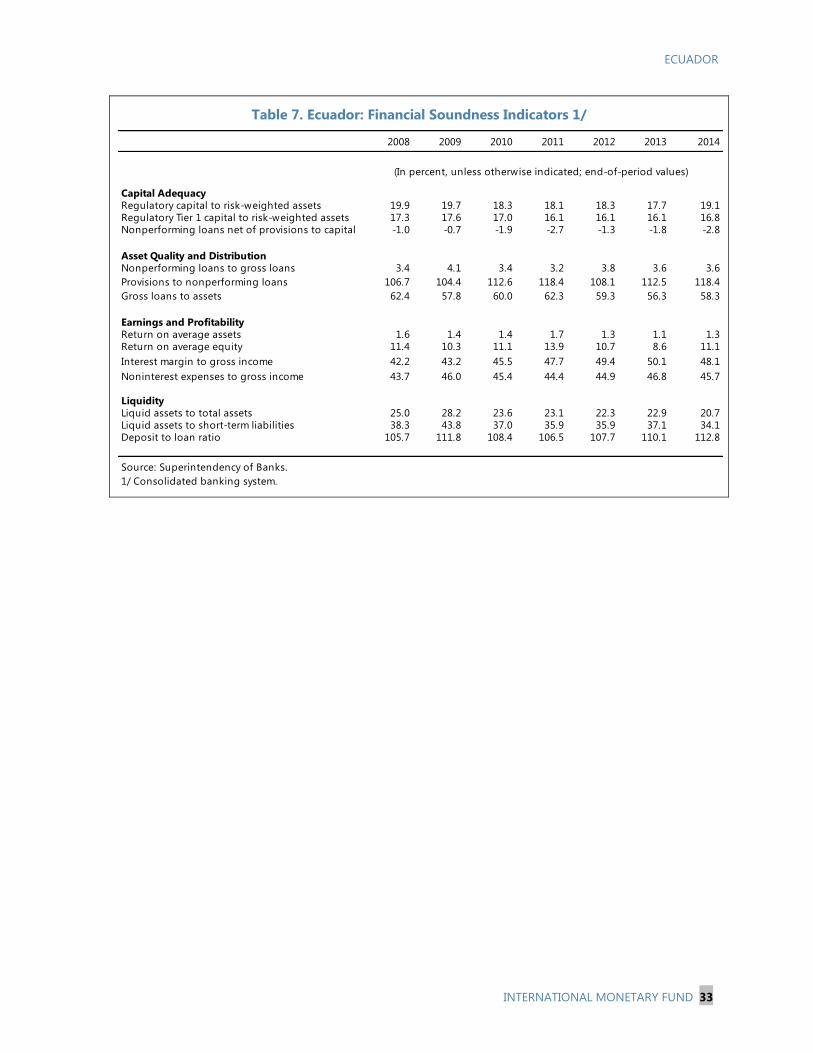
ECUADOR
INTERNATIONAL MONETARY FUND 33
Table 7. Ecuador: Financial Soundness Indicators 1/
2008 2009 2010 2011 2012 2013 2014
Capital Adequacy
Regulatory capital to risk-weighted assets 19.9 19.7 18.3 18.1 18.3 17.7 19.1
Regulatory Tier 1 capital to risk-weighted assets 17.3 17.6 17.0 16.1 16.1 16.1 16.8
Nonperforming loans net of provisions to capital -1.0 -0.7 -1.9 -2.7 -1.3 -1.8 -2.8
Asset Quality and Distribution
Nonperforming loans to gross loans 3.4 4.1 3.4 3.2 3.8 3.6 3.6
Provisions to nonperforming loans 106.7 104.4 112.6 118.4 108.1 112.5 118.4
Gross loans to assets 62.4 57.8 60.0 62.3 59.3 56.3 58.3
Earnings and Profitability
Return on average assets 1.6 1.4 1.4 1.7 1.3 1.1 1.3
Return on average equity 11.4 10.3 11.1 13.9 10.7 8.6 11.1
Interest margin to gross income 42.2 43.2 45.5 47.7 49.4 50.1 48.1
Noninterest expenses to gross income 43.7 46.0 45.4 44.4 44.9 46.8 45.7
Liquidity
Liquid assets to total assets 25.0 28.2 23.6 23.1 22.3 22.9 20.7
Liquid assets to short-term liabilities 38.3 43.8 37.0 35.9 35.9 37.1 34.1
Deposit to loan ratio 105.7 111.8 108.4 106.5 107.7 110.1 112.8
Source: Superintendency of Banks.
1/ Consolidated banking system.
(In percent, unless otherwise indicated; end-of-period values)

ECUADOR
34 INTERNATIONAL MONETARY FUND
2008 2009 2010 2011 2012 2013 2014
Financial indicators
Public sector debt/GDP 22.2 17.7 19.7 19.4 21.7 26.0 31.3
Velocity of money 1/ 4.3 4.0 3.7 3.5 3.4 3.2 3.1
Net credit to the private sector/GDP 2/ 22.0 22.2 24.8 26.7 27.7 28.4 29.0
External indicators
Exports, U.S. dollars (percent change) 30.9 -25.9 25.8 27.3 6.4 4.5 3.6
Imports, U.S. dollars (percent change) 37.3 -20.3 37.7 18.3 5.5 6.8 1.9
Terms of trade (percent change) (deterioration -) 20.0 -22.3 19.0 21.8 0.2 1.1 -5.4
Real effective exchange rate, (end of period, percent change) 3/ -1.0 7.8 -2.2 -1.6 4.1 2.2 3.0
Current account balance (percent of GDP) 2.9 0.5 -2.3 -0.3 -0.2 -1.0 -0.6
Capital and financial account balance (percent of GDP) -1.1 -4.3 0.7 0.6 -0.6 3.1 0.4
Total external debt (percent of GDP) 27.5 23.0 20.6 20.4 18.7 21.5 25.4
Medium- and long-term public debt (in percent of GDP) 16.3 13.2 13.0 13.7 12.8 15.5 18.8
Medium- and long-term private debt (in percent of GDP) 8.5 7.7 6.5 5.7 5.2 5.4 6.0
Short-term public and private debt (in percent of GDP) 2.6 2.1 1.1 0.9 0.7 0.6 0.6
Total external debt (in percent of exports of goods and services) 87.2 94.0 73.1 65.5 62.0 73.3 88.4
Total debt service (in percent of exports of goods and services) 16.2 19.8 12.7 12.8 12.2 13.2 22.1
Net international reserves
In millions of U.S. dollars 4,473 3,792 2,622 2,958 2,483 4,361 3,949
In percent of broad money 31.2 24.5 14.0 13.1 9.5 14.8 12.0
In months of imports of goods and services 2.6 2.7 1.4 1.3 1.1 1.8 1.6
Sources: Central Bank of Ecuador; IMF Information Notice System (INS); and Fund staff estimates/projections.
1/ Defined as the inverse of the ratio of end-period broad money to annual GDP.
2/ Corresponds to the consolidated banking system.
3/ End of period; data from INS.
Table 8. Ecuador: Financial and External Vulnerability Indicators

ECUADOR
INTERNATIONAL MONETARY FUND 35
Table 9. Ecuador: Medium-Term Macroeconomic Framework
2008 2009 2010 2011 2012 2013 2014 2015 2016 2017 2018 2019 2020
Production
GDP at constant prices 6.4 0.6 3.5 7.9 5.2 4.6 3.8 -0.6 0.1 0.6 1.2 1.5 1.8
Consumer prices (end of period) 8.8 4.3 3.3 5.4 4.2 2.7 3.7 3.7 2.5 1.9 1.7 1.5 1.5
GDP deflator 13.8 0.7 7.5 5.7 5.0 3.0 2.5 -1.0 2.7 2.4 2.3 2.1 1.4
Trade
Merchandise trade
Exports, f.o.b. 30.9 -25.9 25.8 27.3 6.4 4.5 3.6 -26.9 -1.3 6.5 4.6 4.9 2.6
Imports, f.o.b. 37.3 -20.3 37.7 18.3 5.5 6.8 1.9 -19.8 -1.1 4.4 3.7 1.7 2.2
Terms of trade (deterioration -) 20.0 -22.3 19.0 21.8 0.2 1.1 -5.4 -14.6 1.0 0.9 2.0 2.7 -0.1
Total external debt service 5.1 4.8 3.6 4.0 3.7 3.9 6.4 7.4 7.5 8.0 8.0 8.1 9.9
Medium- and long-term 5.0 4.7 3.5 3.9 3.6 3.9 5.5 7.4 7.5 8.0 7.9 8.0 9.9
Nonfinancial public sector 3.2 2.8 2.1 2.5 2.4 2.6 3.5 5.0 4.9 5.3 5.1 5.3 7.2
Private sector 1.7 1.9 1.4 1.4 1.2 1.3 2.0 2.4 2.6 2.7 2.8 2.7 2.6
Public sector
NFPS primary balance 1.6 -3.0 -0.8 0.6 -0.2 -3.6 -4.3 -3.7 -1.6 0.4 1.0 1.9 2.3
Gen. govt. revenue 35.7 29.4 33.3 39.3 39.5 39.4 38.8 35.4 33.7 33.4 33.4 33.6 33.5
Gen. govt. non-interest exp. 34.1 32.4 34.1 38.7 39.6 43.0 43.2 39.1 35.3 33.0 32.4 31.7 31.2
NFPS interest due 1.1 0.6 0.6 0.6 0.7 1.0 1.0 1.5 2.0 2.4 2.5 2.6 2.7
NFPS overall balance 0.5 -3.6 -1.3 0.0 -0.9 -4.6 -5.4 -5.1 -3.7 -1.9 -1.4 -0.7 -0.4
Public sector debt 22.2 17.7 19.7 19.4 21.7 26.0 31.3 37.4 40.4 41.2 41.2 40.5 39.6
Total public debt , official definition 1/ 22.2 16.4 19.2 18.4 21.3 24.2 29.9 34.7 38.3 39.7 40.0 39.6 39.0
Savings and investment
Gross domestic investment 26.4 25.6 28.0 28.1 27.8 28.8 28.1 24.7 23.9 22.4 22.0 21.9 21.6
National savings 29.2 26.1 25.8 27.8 27.6 27.7 27.5 22.1 21.1 19.8 19.6 20.0 19.8
External current account 2.9 0.5 -2.3 -0.3 -0.2 -1.0 -0.6 -2.6 -2.8 -2.6 -2.4 -1.9 -1.8
Memorandum items:Nominal GDP (billions of U.S. dollars) 61.8 62.5 69.6 79.3 87.6 94.5 100.5 98.9 101.7 104.8 108.5 112.4 116.1
Total external debt service (percent
of exports of GNFS)15.1 19.1 12.7 12.8 12.2 13.2 22.1 33.8 35.5 36.8 35.8 36.0 44.5
Public external debt service (percent
of exports of GNFS)10.3 12.1 8.2 8.7 8.7 9.4 16.5 25.5 25.7 27.0 26.1 26.6 36.4
Sources: Central Bank of Ecuador; and Fund staff estimates and projections.
1/ The official public debt definition does not include the outstanding balance for advance oil sales, which was about 1.5 percent of GDP at end-2014.
Projections
(Percent change, unless otherwise indicated)
(In percent of GDP; unless otherwise indicated)

ECUADOR
36 INTERNATIONAL MONETARY FUND
Annex I. Implementation of Advice in
Previous Article IV Consultations
1. Ecuador re-engaged with the Fund in 2014, with the first (off-site) Article IV
consultation since 2008. Discussions focused on rebuilding fiscal space and preserving financial
system stability.
2. Fiscal policy: Staff supported the authorities’ strategy to reduce oil dependency through
scaled-up investment in energy within a multi-year framework of gradual fiscal consolidation.
Going forward, staff advised rebuilding fiscal space through spending restraint and eventually a
fiscal stabilization fund. The authorities continued to hold the view that investment in
infrastructure and social areas generates a greater return than a savings mechanism, especially in
the current environment of low global interest rates, and helps to increase growth potential.
However, their planned fiscal adjustment for 2015 demonstrates a strategy of adjusting spending
depending on the availability of oil revenues. Staff also called for raising non-oil related
revenues, focusing on achieving better enforcement of tax laws and greater efficiency in tax
administration. Progress has been made in enhancing tax collection.
3. Energy reform: Staff supported the authorities’ plans for a broad overhaul of fuel
subsidies. In the event, the authorities have pursued a more contained subsidy reform: the key
strategy is to safeguard the welfare of the poor while reducing the drain on the budget, not least
through mandatory usage of electric stoves as electricity becomes cheaper due to completion of
hydro projects.
4. Financial system: With respect to safeguarding financial system’s stability, the
authorities continued to enhance supervision and asked banks to increase their contribution to
the Liquidity Fund. However, directed credit and interest rate caps have continued, and
legislation was introduced that could inhibit the system’s liquidity. A tax on transfers for
amortization and interest payments on certain loans with a maturity of more than one year has
been eliminated, in line with staff advice, but the authorities still consider it a prudential measure
necessary to deal with volatile cross border capital movements.
5. Structural reforms: Staff emphasized the importance of deeper structural reforms to
enhance productivity, competitiveness, and the role of the private sector. The authorities are
following an economic development plan (Productive Matrix) aimed at addressing these issues,
but details have not been fully delineated. They have also reduced the pace of increase in
minimum wages as part of the response to external shocks.

ECUADOR
INTERNATIONAL MONETARY FUND 37
Annex II. External Sector Assessment1
The country’s real exchange rate is assessed to be stronger than warranted by
medium-term fundamentals and desirable policies, as of developments so far in 2015.
The drop in oil prices since late last year and the dollar’s sharp appreciation have
weakened Ecuador’s external position. The current account deficit is projected to
worsen, although the deterioration is mitigated by the authorities’ response in scaling
back public spending and by the imposition of temporary import surcharges. Prices
relative to the U.S. are now substantially above benchmark, while wages have grown
faster than productivity over the past decade and are now higher than in neighbors.
Also, access to international markets has worsened. Ecuador will need to regain
competitiveness—including by facilitating further relative wage and price adjustments
and enhancing productivity—while creating fiscal space and improving access to
credit.
1. Fund metrics indicate a current account imbalance in 2015, and over the medium-
term the current account deficit (CAD) is expected to remain above the historical average
since 2000 (which was about 0) due to weaker competitiveness. The CAD was small over the
last few years and in 2014 it was at 0.6 percent of GDP. The sharp decline in oil prices since late
last year, coupled with a sizable real exchange rate appreciation, is placing significant pressure on
Ecuador’s current account. Even when offset by the compression of imports following the
imposition of surcharges, scaled back public spending, and economic slowdown, the CAD is
projected to widen to 2.6 percent of GDP in 2015.
2. Two standard Fund methodologies (the EBA-lite current account and external
sustainability approaches) suggest that the CAD is somewhat wider than warranted by
fundamentals. Two other methodologies, the CGER-inspired macro balance (MB) and one that
uses a small open economy model with frictions in private and public investment (OEM), point to
smaller gaps (see Table 1 and Figure 1).2The OEM is based on the short-term adjustment of the
current account consistent with the inter-temporally optimal response of the economy to the oil
shock. 3 However, none of these methodologies takes into account that the 2015 current account
would be larger (probably by more than 1 percent of GDP) in the absence of import surcharges.
Hence the current account is substantively worse than warranted by fundamentals and desirable
policies (notably, without surcharges)—in a range of 1 percent to 4 percent of GDP. Staff
1 Prepared by P. de Imus (SPR) and Carlos Goes. See the companion Selected Issues paper for further analysis.
2 These estimates are sensitive to key parameter assumptions. In particular the EBA-lite current account model
estimates a large constant which contributes by about -4 percent of GDP to the current account norm. The large
constant suggests the model cannot explain the average excess of investment needs over saving needs across
the significant number of emerging and developing countries present in the estimation. Since it is unclear the
extent to which such “ignorance” of the model applies to Ecuador, the constant was not included in the
calculation of the norm.
3 Araujo, J., G. Bin Li, M. Poplawski-Ribeiro, and L-F. Zanna, 2013, "Current Account Norms in Natural Resource
Rich and Capital Scarce Economies," IMF Working Paper No. 13/80. Also see Box 1 in the Selected Issues paper.

ECUADOR
38 INTERNATIONAL MONETARY FUND
projections indicate that in the absence of a recovery in competitiveness, the current account
deficit will remain well above historical standards over the medium term.
3. The real effective exchange rate (REER) appreciated strongly since mid-2014 and is
now stronger than warranted by medium-term fundamentals and desirable policies, by
10 to 30 percent. The REER appreciated by about 16 percent from June 2014 to June 2015 as
the currencies of trading partners weakened against the US dollar. The three Fund metrics relying
on CPI-based-REER indices (CGER-inspired real equilibrium real exchange rate, purchasing power
parity, and EBA-lite real exchange rate; ELER, PPP, ELRER, respectively) offer evidence of
substantial overvaluation as of the latest REER data in 2015 (see Table 1). A separate approach
(GDPR) based on a panel regression of PPP GDP price levels on PPP GDP per capita (both World
Bank series) offer consistent evidence: the level of Ecuadorean prices relative to the U.S. was not
out of line with model predictions in 20144; however, using the 2015 projection for GDP per
capita (see Figure 1) and assuming relative prices rise in the same fashion as the REER
appreciation from 2014 to mid-2015, the price level would be much higher than predicted by the
model.
Table 1. Ecuador: Real Exchange Rate Assessments for 2015 (in percent) 1/
4. Wages have risen significantly over the last 15 years, raising concerns about cost
competitiveness. Since the mid-2000’s real wages have grown faster than labor productivity,
and more recently unit labor costs have grown more rapidly than in trading partners (see
Figure 2). In 2014, Ecuador’s nominal minimum wage (roughly US$400 a month) was about
30 percent higher than US$288 average of Brazil, Chile, and Colombia (which have the next
highest minimum wages among the LA5 countries). As of 2015 Q1, it is 50 percent higher, in part
owing to relative exchange rate movements. In terms of minimum wage relative to GDP per
4 The model uses a panel of the World Bank’s internationally-consistent PPP GDP price level data regressed
against per capita GDP; five regression specifications are adopted (pooled, random effects, fixed effects, pooled
with time effects, and fixed as well as time effects). The results are not very different across specifications. The
absence of fixed effects allows a full price level comparison across countries, something not feasible with CPI-
based REERs; introducing the fixed effects shows whether results would change substantially when considering a
possible omitted variable bias.
CA Norm NFA NFA-
stabilizing CA
Underlying
CAGap Elasticity Misalignment
Macroeconomic Balance Approach (MB) -1.9 -2.6 -0.6 -18.0 3.6
EBA-lite Current Account (ECA) 1.0 -2.6 -3.6 -18.0 19.8
Open economy CA model (OEM) -1.9 -2.6 -0.7 -18.0 3.7
EBA-lite External Sustainability (EES) -18.9 -0.2 -2.6 -2.4 -18.0 13.1
Equilibrium Real Exchange Rate (ERER) 29.1
EBA-lite Real Exchange Rate (ELRER) 18.2
Purchasing Power Parity (PPP) 12.3
GDP price level regression (GDPR) 25.3
Source: Fund staff calculations.
1/ The MB, ECA, and OEM approaches calculate the difference between the CA balance and an estimated CA "norm".
The EES approach calculates the difference between the actual CA balance and the NFA-stabilizing CA balance.
The ERER, ELRER, and PPP approaches calculate the difference between the RER and an estimated RER "norm".
The GDPR gap/misalignment is the difference between the projected log relative GDP price level in PPP terms and a model-based estimate.

ECUADOR
INTERNATIONAL MONETARY FUND 39
Figure 1. Ecuador: External Sector Assessment
Source: IMF World Economic Outlook database, Haver Analytics, IMF staff estimates.
-5.0
-4.0
-3.0
-2.0
-1.0
0.0
1.0
2.0
3.0
4.0
5.0Current Account: Actual vs. Model
(In percent of GDP)
Actual/projected
MB (CGER inspired)
EBA-lite ES
EBA-lite CA
OEM
50
75
100
125
150
175
200
19
80
19
82
19
84
19
86
19
88
19
90
19
92
19
94
19
96
19
98
20
00
20
02
20
04
20
06
20
08
20
10
20
12
20
14
Real Exchange Rate: Actual vs. Model
(REER index)
Actual/projected
EBA-lite (ELRER)
ERER (CGER inspired)
PPP
20
25
30
35
40
45
50
55
60
65
GDP Price Level: Actual vs. Model
(Index)
Actual
Pooled OLS
Panel fixed effects
Panel random effects
Panel fixed and time
Pooled time effects0.02
0.03
0.04
0.05
0.06
0.07
0.08
0.09
0.10
19
90
19
92
19
94
19
96
19
98
20
00
20
02
20
04
20
06
20
08
20
10
20
12
20
14
Non-oil Export Market share: Actual vs. Model
(In percent)
Actual non-oil export share
Model random effects
Model fixed effects

ECUADOR
40 INTERNATIONAL MONETARY FUND
Figure 2. Ecuador: Relative Wages
1/ Output per employed person
Source: IMF World Economic Outlook database, Haver Analytics, IMF staff estimates
0
50
100
150
200
250
300
350
400
450
2000 2001 2002 2003 2004 2005 2006 2007 2008 2009 2010 2011 2012 2013 2014
Brazil Chile Colombia
Mexico Peru Ecuador
Minimum wage
(In US$)
0.0
1.0
2.0
3.0
4.0
5.0
6.0
7.0
Ecuador Peru Colombia Brazil Chile Mexico
Minimum wage, 2014
(In percent of per capita GDP)
50
70
90
110
130
150
170
1990
1991
1992
1993
1994
1995
1996
1997
1998
1999
2000
2001
2002
2003
2004
2005
2006
2007
2008
2009
2010
2011
2012
2013
2014
Real wages Productivity
Ecuador: Labor Productivity1/ and Real Wages
(2004=100)

ECUADOR
INTERNATIONAL MONETARY FUND 41
capita, Ecuador’s ratio in 2014 was more than twice the average of the same three countries and
60 percent higher than the ratio for Peru (the next highest among the LA5).
5. Ecuador’s global market share in non-oil exports is below a simple GDP-based
benchmark, which also hints at competitiveness issues. Standard trade theory suggests that
the global trade market share of a country should depend on its world GDP share, among other
factors. However, Ecuador’s market share in 2014 fell short of its predicted value by 4 to
13 percent (of the actual share), depending on the empirical specification.5 Non-oil exports have
been rising in recent years as Ecuador entered new markets, such as flowers in Russia and shrimp
in Asia. However, the downturn in Russia and the end of a shrimp disease in Asia have made
those markets more challenging, affecting non-oil exports this year. Starting in 2016, if Ecuador
meets the necessary requirements, a trade agreement with the European Union will come into
effect and would help non-oil exports to Europe.
6. After large external borrowing by the public sector in 2013 and 2014, financing
conditions have tightened for Ecuador, mainly because of the expected effect of the fall in
oil prices on public balances. Inflows were coming in from bilateral loans and advance oil sales,
notably from China, and loans from multilateral agencies. The sovereign returned to the global
bond markets in 2014 with an issuance of US$2 billion in a 10-year bond with a spread over U.S.
Treasuries of about 500bps. However, in March and May 2015 the sovereign issued a total of
US$1.5 billion in a 5-year bond at an average spread of about 800bps. Going forward, the cost of
financing should also increase, ceteris paribus, because of the anticipated tightening of U.S.
monetary policy.
7. Ecuador’s Net International Reserves are low.6 NIR were about US$4.8 billion at end-
July 2015 or about 4.8 percent of projected 2015 GDP. This level is below those recommended by
a number of standard reserve adequacy metrics. As of July-2015, reserves covered about
45 percent of the IMF’s reserve adequacy metric (2.7 months of imports, and 13 percent of broad
money). However, for fully dollarized economies like Ecuador it is difficult to precisely calibrate
the need for a foreign exchange liquidity buffer. This need differs from other countries since
dollarized economies do not face the risk of exchange rate fluctuations and currency mismatches
affecting domestic balance sheets. Nonetheless, a fully dollarized economy may need liquidity for
two reasons: to protect the financial system from a liquidity shock and as a fiscal buffer against
potential government financing gaps. Additionally, commodity intensive economies may have
higher precautionary reserve needs since they have more volatile terms of trade and have greater
difficulty in adjusting to commodity price shocks due to lower trade elasticities.7 Hence, even if
Ecuador’s balance of payments would eventually adjust automatically to an external financing
5 A simple panel regression of non-oil export market share on the respective share of world GDP (encompassing
175 countries) has very large explanatory power (the R2 is 0.71 with random effects and 0.97 with fixed effects).
6 NIR are mainly counterparts of government’s and banks’ deposits (including reserve requirements) held at the
central bank (BCE).
7 IMF, Assessing Reserve Adequacy—Specific Proposals, December 2014. Adjusting the IMF metric for petroleum
price risk as suggested by the paper, would imply a slightly lower reserve adequacy.

ECUADOR
42 INTERNATIONAL MONETARY FUND
shock via a reduction in liquidity and lower domestic demand, the costly adjustment would take
time and buffers remain essential to smooth such adjustment.
8. The analysis of international investment position (IIP) does not reveal major
vulnerabilities at present. Since 2005, Ecuador has experienced an improving IIP from
38 percent of GDP to about -11 percent in 2014, despite recent government borrowing, due to
the large current account surpluses in mid-2000s and strong GDP growth. Indeed, the past
decade witnessed a rapid accumulation of foreign assets (deposits) and lower growth of
investment and debt stocks. The stock of portfolio liabilities has increased as the sovereign
regained international market access after defaulting in 2008. The stock of FDI liabilities has been
falling consistently since 2005 and was at 14.5 percent of GDP at end-2014. The stock of loan
liabilities has increased in each year in 2013 and 2014. It is now at about 19 percent of GDP, the
largest position since 2007. There has been a coinciding rise in currency and deposit assets to
about 25 percent of GDP.
9. Ecuador’s international survey-based competitiveness rankings remain low. Broad
survey-based competitiveness indicators (such as those of the World Economic Forum’s Global
Competitiveness Report) improved in most categories over the last decade, and were in 2014
roughly in line with Latin American peers. However, rankings are still poor: the 2013−14 report
highlighted inefficiencies in the functioning of institutions, and in goods, labor, and financial
markets, mainly because of insufficient competition. In the 2015 World Bank Ease of Doing
Business rankings, Ecuador scored 115th
out of 189 countries, similar to the previous year
(although under a new methodology). Relative to its regional peers, it ranks worse than the
average, but better than Venezuela, Bolivia, Argentina, and Brazil. Ecuador’s rank was relatively
worse in the areas of business regulation, paying taxes, getting access to credit and electricity.
0
2
4
6
Institutions
Infrastructure
Macroeconomy
Health and
primary
education 1/
Higher education
and trainingMarket efficiency
Technological
readiness
Business
sophistication
Innovation
Ecuador, 2006
Ecuador, 2014
LA5, 2015
Ecuador and LA5: Global Competitiveness Indicators
(Index; 7 = best)
Source: World Economic Forum.
1/ There was a methodological change in the calculation health and primary education score
between the two vintages.
ECUADOR
INTERNATIONAL MONETARY FUND 43
10. Recent research by the Fund also points to a poor ranking in economic
diversification and complexity, which have been found to matter for long-term growth.8
These indicators relate to the range and sophistication of products a country produces. In this
regard, Ecuador ranks low relative to its regional neighbors, which is not surprising in light of its
high product concentration. The study shows that bringing the country’s complexity score to the
average of Latin American and the Caribbean countries would increase growth by approximately
0.4 percentage points. Recent studies indicate that infrastructure, education, and market
openness are keys to inducing greater sophistication. Ecuador’s efforts to lower energy costs via
hydroelectric projects and improve tertiary education could have a positive effect on this front.
However, foreign direct investment has been relatively low, which, with trade openness, has long
been highlighted as a source of knowledge spillovers crucial to enhance complexity in
developing countries.
8 IMF, Regional Economic Outlook: Western Hemisphere, Chapter 5, April 2015.
119 116
21
121
26
135
120
112
127
119
133
118
31 34
113
29
53
Co
sts
of
crim
e a
nd
vio
len
ce
Str
en
gh
of
invest
or
pro
tect
ion
Gen
era
l g
overn
men
t d
eb
t
Co
un
try c
red
it r
ati
ng
Pri
mary
ed
uca
tio
n e
nro
llm
en
t
Pro
ced
ure
s to
sta
rt a
bu
sin
ess
Pre
vale
nce
of
trad
e b
arr
iers
Inte
nsi
ty o
f lo
cal
com
peti
tio
n
Bu
sin
ess
im
pact
of
rule
s o
n F
DI
Fle
xib
ilit
y o
f w
ag
e d
ete
rmin
ati
on
Red
un
dan
cy c
ost
s
Leg
al ri
gh
ts i
nd
ex
Ease
of
acc
ess
of
loan
s
Ven
ture
cap
ital
avail
ab
le
FD
I an
d t
ech
no
log
y t
ran
sfer
Gvt.
pro
cure
men
t o
f ad
v.
tech
pro
du
cts
Co
mp
an
y s
pen
din
g i
n R
&D
Ecuador: Global Competitiveness Indicators, 2014(Rank out of 148; 1 = best)
Source: World Economic Forum. Note: Categories listed are those in which Ecuador ranks in the top or bottom quartile of world distribution. Some
categories were omitted due to space constrains, namely: (1) Organized crime [129]; (2) Costs of terrorism [122]; (3) Degree of customer orientation
[115]; (4) Country capacity to attract talent [35]; (5) Days to start a business [130]; and (6) GG budget balance [35].
Overallranking: 71
InstitutionsMacro
economy Goods MarketLabor
Market Financial MarketTechnology &
InnovationEduc.
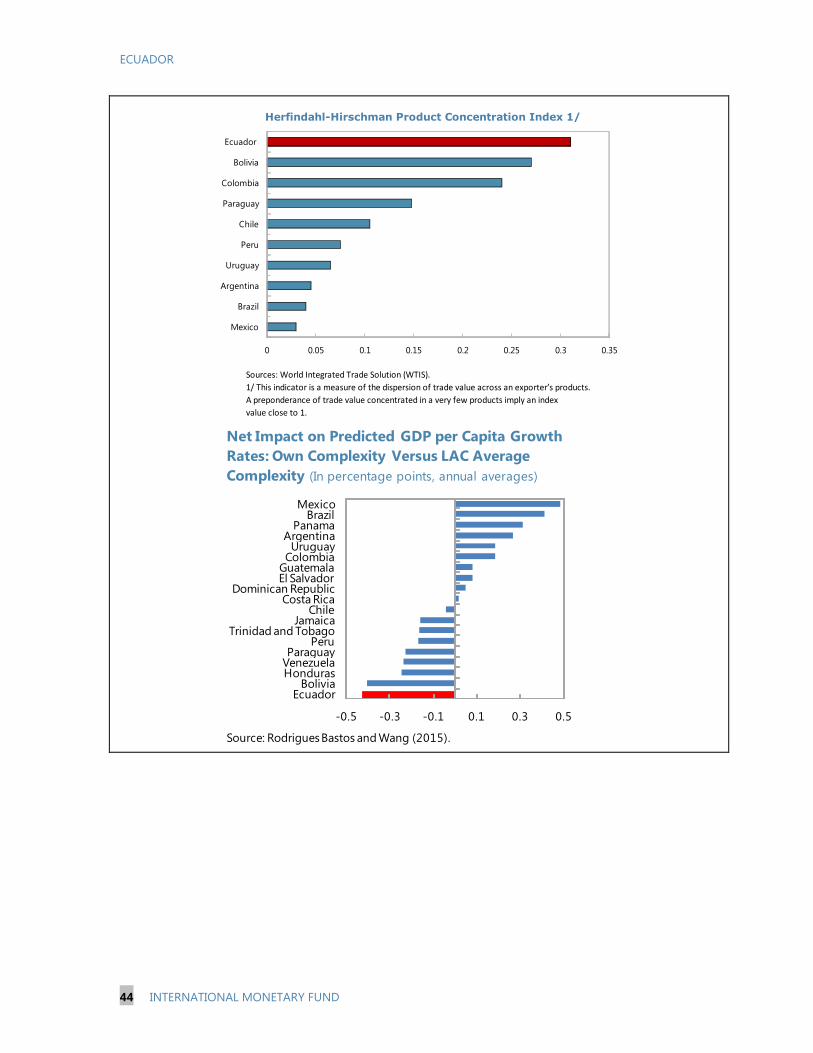
ECUADOR
44 INTERNATIONAL MONETARY FUND
Herfindahl-Hirschman Product Concentration Index 1/
Sources: World Integrated Trade Solution (WTIS).
1/ This indicator is a measure of the dispersion of trade value across an exporter’s products.
A preponderance of trade value concentrated in a very few products imply an index
value close to 1.
0 0.05 0.1 0.15 0.2 0.25 0.3 0.35
Mexico
Brazil
Argentina
Uruguay
Peru
Chile
Paraguay
Colombia
Bolivia
Ecuador
Net Impact on Predicted GDP per Capita Growth
Rates: Own Complexity Versus LAC Average
Complexity (In percentage points, annual averages)
-0.5 -0.3 -0.1 0.1 0.3 0.5
EcuadorBolivia
HondurasVenezuelaParaguay
PeruTrinidad and Tobago
JamaicaChile
Costa RicaDominican Republic
El SalvadorGuatemalaColombiaUruguay
ArgentinaPanama
BrazilMexico
Source: Rodrigues Bastos and Wang (2015).

ECUADOR
INTERNATIONAL MONETARY FUND 45
Annex III. Debt Sustainability Analysis
While Ecuador’s current level of public debt—at 31.3 percent of GDP in 2014—is low
by international standards, it has grown rapidly in recent years and is projected to
reach about 41 percent of GDP in 20171. The gross financing need is projected to
reach about 10.3 percent of GDP in 2015. Medium-term risks remain manageable, in
part because the fiscal position is projected to improve after the completion of
ongoing large public investment projects. Both the public debt and financing needs
will remain below the respective benchmarks even under standard macroeconomic
shocks. Assessment of the realism of baseline assumptions for major macroeconomic
variables does not point to significant one-sided error, particularly in recent years.
1. Definition and debt profile: The public sector debt in this debt sustainability analysis
(DSA) includes the obligations of the non-financial public sector (central government and
non-financial sector state-owned enterprises), as reported by the authorities, as well as liabilities
under advance oil sales. After declining to 17.7 of GDP in 2009, following the 2008 default, the
public debt increased to 31.3 percent of GDP in 2014. External debt accounted for about
60 percent of total debt at end-2014, of which about 75 percent was owed to official creditors.
Medium- and long-term loans constitute 100 percent of the total public debt stock.
2. Baseline macroeconomic and fiscal assumptions: Under staff’s baseline scenario,
which underpins the DSA, growth is projected at about 1¾ percent and inflation (GDP deflator)
at about 1½ percent in the medium term. The fiscal position is projected to improve with a
primary surplus of about 2⅓ percent of GDP in 2020 on the back of significant expenditure
retrenchment (in part due to the completion of ongoing large public investment projects). Under
these assumptions, the gross financing need of the public sector is projected to fall to about
7 percent of GDP in 2020. After peaking at about 41 percent of GDP in 2017, the public-debt-to
GDP ratio is projected to decline to about 39½ percent in 2020. The DSA tool that assesses the
realism of projections for real GDP growth, primary balance, and inflation does not indicate
significant systematic biases.
3. Stress tests: Both the gross financing needs and the public debt-to-GDP ratio remain
within the corresponding low-risk thresholds under the standard macroeconomic shocks (i.e.,
shocks in real GDP growth, primary balance, real interest rate, and exchange rate). The
public-debt-to GDP ratio remains below 50 percent and the gross financing need below
15 percent of GDP even under the combined macro-fiscal shock. Note that the as long as the
1 Staff’s definition of public debt figures include liabilities under advance oil sales, which are not considered as
public debt in the official (authorities’) definition. Public debt excluding liabilities under advance oil sales—which
is the relevant official definition for the legal ceiling of 40 percent—was about 30 percent of GDP in 2014 and will
reach about 40 percent of GDP in 2018.

ECUADOR
46 INTERNATIONAL MONETARY FUND
legal limit of 40 percent is binding, corrective fiscal actions are likely to be triggered when debt
approaches 40 percent.
4. Risks and vulnerabilities: The public DSA risk assessment identifies market perception
and the ratio of public debt held by non-residents as high risks for Ecuador. At 60 percent of the
total debt, non-residents’ holding of Ecuador’s public debt gives the appearance of being a
source of vulnerability, but about 75 percent of the external debt is owed to official creditors and
there is limited vulnerability. The high market perception risk is a reflection of both high
sovereign spreads in part associated with the 2008 default and the recent hike in spreads
following the recent decline in oil prices.2 However, near-term rollover risks are limited to the
US$650 million 2015 bond, the only sovereign bond maturing before 2020.
5. Fiscal Sustainability Frameworks: The analysis from the Fund’s Fiscal Sustainability
Frameworks for resource dependent economies suggest that the strong fiscal consolidation
planned over the next few years—imposed by the decline in oil prices—implies that the medium-
term non-oil primary deficit (about ¾ percent of GDP) is consistent with long-term fiscal
sustainability (associated with a non-oil primary deficit ranging from about 3½ to 6 percent of
GDP, depending on the methodology; see Figure 5).
6. External DSA: The current account deficit is projected to widen to about 2¾ percent of
GDP in 2016, from about ½ a percentage point in 2014, due to lower oil exports (Ecuador’s main
export commodity) and continuing large fiscal deficits. The expected improvement in the fiscal
position will, however, help reduce the current account deficit in the medium term to about
1¾ percent of GDP. The current account deficit is expected to be financed mostly by public
external borrowing. Consequently, the external debt-to-GDP ratio is projected to increase to
about 37½ percent of GDP in 2018, from 25.4 percent in 2014, before stabilizing at about
37⅓ percent of GDP in 2020. The external debt trajectory is sensitive to the non-interest current
account shock (e.g. terms of trade shock) and a large (30 percent) real exchange rate
depreciation. But such a large real depreciation is unlikely to materialize due to dollarization.
2 Ecuador’s EMBIG Sovereign spread has increased significantly to 1315 bps as of August 26, 2015, from 475 bps
a year a go.

ECUADOR
INTERNATIONAL MONETARY FUND 47
As of August 26, 20152/
2013 2014 2015 2016 2017 2018 2019 2020 Sovereign Spreads
Nominal gross public debt 25.7 26.0 31.3 37.4 40.4 41.2 41.2 40.5 39.6 EMBIG (bp) 3/ 1315
Public gross financing needs 2.8 6.8 10.3 10.3 8.5 6.5 6.1 5.5 7.1 5Y CDS (bp) n.a.
Real GDP growth (in percent) 4.8 4.6 3.8 -0.6 0.1 0.6 1.2 1.5 1.8 Ratings Foreign Local
Inflation (GDP deflator, in percent) 6.6 3.0 2.5 -1.0 2.7 2.4 2.3 2.1 1.4 Moody's B3 B3
Nominal GDP growth (in percent) 11.8 7.8 6.4 -1.6 2.8 3.0 3.5 3.6 3.3 S&Ps B B
Effective interest rate (in percent) 4/ 4.8 5.1 4.2 4.6 5.6 6.0 6.2 6.6 6.9 Fitch B B
2013 2014 2015 2016 2017 2018 2019 2020 cumulative
Change in gross public sector debt -2.6 4.3 5.3 6.1 3.1 0.8 0.0 -0.8 -0.9 8.3
Identified debt-creating flows -2.7 2.8 3.9 5.6 2.7 0.8 0.0 -0.8 -0.9 7.5
Primary deficit -1.5 3.6 4.3 3.7 1.6 -0.4 -1.0 -1.9 -2.3 -0.4
Primary (noninterest) revenue and grants 30.2 39.4 38.8 35.4 33.7 33.4 33.4 33.6 33.5 203.1
Primary (noninterest) expenditure 28.8 43.0 43.2 39.1 35.3 33.0 32.4 31.7 31.2 202.7
Automatic debt dynamics 5/
-1.8 -0.5 -0.6 2.0 1.0 1.2 1.1 1.2 1.4 7.8
Interest rate/growth differential 6/
-1.8 -0.5 -0.6 2.0 1.0 1.2 1.1 1.2 1.4 7.8
Of which: real interest rate -0.5 0.4 0.4 1.8 1.0 1.4 1.6 1.8 2.2 9.7
Of which: real GDP growth -1.3 -0.9 -0.9 0.2 0.0 -0.2 -0.5 -0.6 -0.7 -1.9
Exchange rate depreciation 7/
0.0 0.0 0.0 … … … … … … …
Other identified debt-creating flows 0.6 -0.3 0.1 0.0 0.0 0.0 0.0 0.0 0.0 0.0
Residual, including asset changes 8/
0.1 1.5 1.4 0.5 0.4 0.0 0.0 0.0 0.0 0.9
Source: Fund staff.
1/ Public sector is defined as non-financial public sector.
2/ Based on available data.
3/ Long-term bond spread over U.S. bonds.
4/ Defined as interest payments divided by debt stock (excluding guarantees) at the end of previous year.
5/ Derived as [(r - π(1+g) - g + ae(1+r)]/(1+g+π+gπ)) times previous period debt ratio, with r = interest rate; π = growth rate of GDP deflator; g = real GDP growth rate;
a = share of foreign-currency denominated debt; and e = nominal exchange rate depreciation (measured by increase in local currency value of U.S. dollar).
6/ The real interest rate contribution is derived from the numerator in footnote 5 as r - π (1+g) and the real growth contribution as -g.
7/ The exchange rate contribution is derived from the numerator in footnote 5 as ae(1+r).
8/ Includes asset changes and interest revenues (if any). For projections, includes exchange rate changes during the projection period.
9/ Assumes that key variables (real GDP growth, real interest rate, and other identified debt-creating flows) remain at the level of the last projection year.
Table 1. Ecuador: Public Sector Debt Sustainability Analysis (DSA) - Baseline Scenario
1.4
balance 9/
primary
(In percent of GDP unless otherwise indicated)
Debt, Economic and Market Indicators 1/
2004-2012
Actual
Projections
Contribution to Changes in Public Debt
Projections
2004-2012
Actual
debt-stabilizing
-10
-8
-6
-4
-2
0
2
4
6
8
2004 2005 2006 2007 2008 2009 2010 2011 2012 2013 2014 2015 2016 2017 2018 2019 2020
Debt-Creating Flows
Primary deficit Real GDP growth Real interest rate
Exchange rate depreciation Other debt-creating flows Residual
Change in gross public sector debt
projection
(in percent of GDP)
-4
-2
0
2
4
6
8
10
12
cumulative
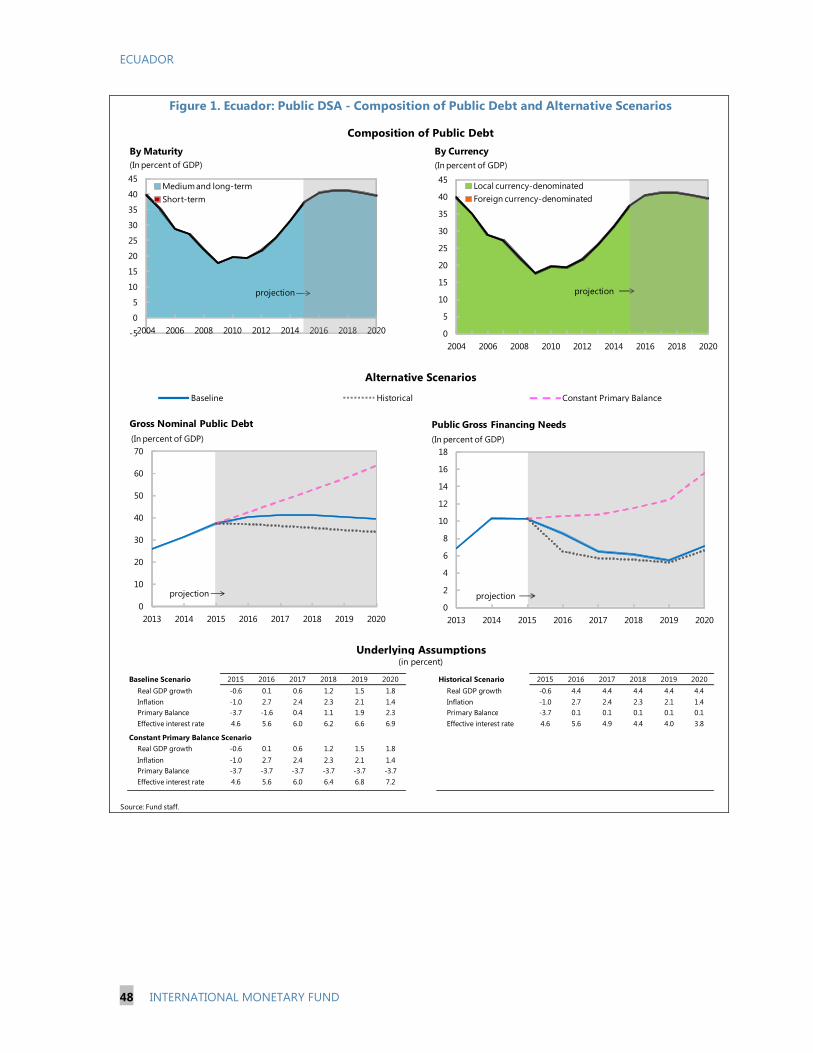
ECUADOR
48 INTERNATIONAL MONETARY FUND
Baseline Scenario 2015 2016 2017 2018 2019 2020 Historical Scenario 2015 2016 2017 2018 2019 2020
Real GDP growth -0.6 0.1 0.6 1.2 1.5 1.8 Real GDP growth -0.6 4.4 4.4 4.4 4.4 4.4
Inflation -1.0 2.7 2.4 2.3 2.1 1.4 Inflation -1.0 2.7 2.4 2.3 2.1 1.4
Primary Balance -3.7 -1.6 0.4 1.1 1.9 2.3 Primary Balance -3.7 0.1 0.1 0.1 0.1 0.1
Effective interest rate 4.6 5.6 6.0 6.2 6.6 6.9 Effective interest rate 4.6 5.6 4.9 4.4 4.0 3.8
Constant Primary Balance Scenario
Real GDP growth -0.6 0.1 0.6 1.2 1.5 1.8
Inflation -1.0 2.7 2.4 2.3 2.1 1.4
Primary Balance -3.7 -3.7 -3.7 -3.7 -3.7 -3.7
Effective interest rate 4.6 5.6 6.0 6.4 6.8 7.2
Source: Fund staff.
Underlying Assumptions(in percent)
Figure 1. Ecuador: Public DSA - Composition of Public Debt and Alternative Scenarios
Alternative Scenarios
Composition of Public Debt
Baseline Historical Constant Primary Balance
0
10
20
30
40
50
60
70
2013 2014 2015 2016 2017 2018 2019 2020
Gross Nominal Public Debt
(In percent of GDP)
projection
0
2
4
6
8
10
12
14
16
18
2013 2014 2015 2016 2017 2018 2019 2020
Public Gross Financing Needs
(In percent of GDP)
projection
-5
0
5
10
15
20
25
30
35
40
45
2004 2006 2008 2010 2012 2014 2016 2018 2020
By Maturity
Medium and long-term
Short-term
projection
(In percent of GDP)
0
5
10
15
20
25
30
35
40
45
2004 2006 2008 2010 2012 2014 2016 2018 2020
By Currency
Local currency-denominated
Foreign currency-denominated
projection
(In percent of GDP)

ECUADOR
INTERNATIONAL MONETARY FUND 49
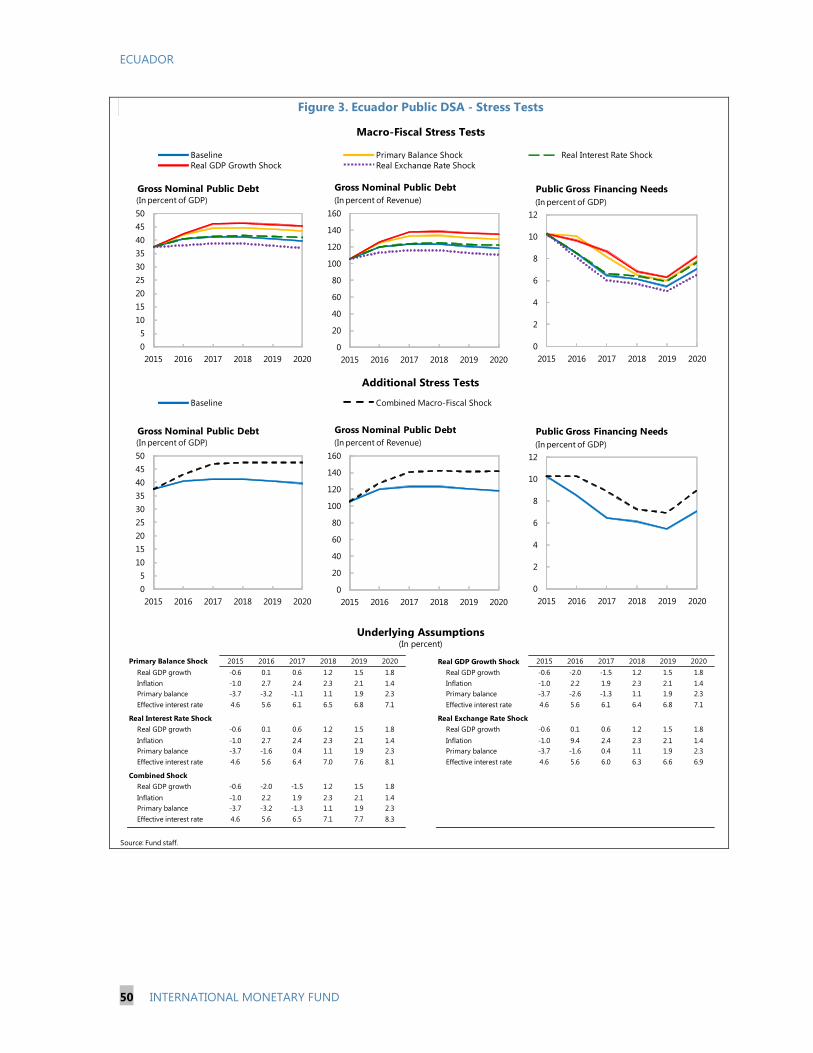
ECUADOR
50 INTERNATIONAL MONETARY FUND
Primary Balance Shock 2015 2016 2017 2018 2019 2020 Real GDP Growth Shock 2015 2016 2017 2018 2019 2020
Real GDP growth -0.6 0.1 0.6 1.2 1.5 1.8 Real GDP growth -0.6 -2.0 -1.5 1.2 1.5 1.8
Inflation -1.0 2.7 2.4 2.3 2.1 1.4 Inflation -1.0 2.2 1.9 2.3 2.1 1.4
Primary balance -3.7 -3.2 -1.1 1.1 1.9 2.3 Primary balance -3.7 -2.6 -1.3 1.1 1.9 2.3
Effective interest rate 4.6 5.6 6.1 6.5 6.8 7.1 Effective interest rate 4.6 5.6 6.1 6.4 6.8 7.1
Real Interest Rate Shock Real Exchange Rate Shock
Real GDP growth -0.6 0.1 0.6 1.2 1.5 1.8 Real GDP growth -0.6 0.1 0.6 1.2 1.5 1.8
Inflation -1.0 2.7 2.4 2.3 2.1 1.4 Inflation -1.0 9.4 2.4 2.3 2.1 1.4
Primary balance -3.7 -1.6 0.4 1.1 1.9 2.3 Primary balance -3.7 -1.6 0.4 1.1 1.9 2.3
Effective interest rate 4.6 5.6 6.4 7.0 7.6 8.1 Effective interest rate 4.6 5.6 6.0 6.3 6.6 6.9
Combined Shock
Real GDP growth -0.6 -2.0 -1.5 1.2 1.5 1.8
Inflation -1.0 2.2 1.9 2.3 2.1 1.4
Primary balance -3.7 -3.2 -1.3 1.1 1.9 2.3
Effective interest rate 4.6 5.6 6.5 7.1 7.7 8.3
Source: Fund staff.
(In percent)
Real Exchange Rate Shock
Combined Macro-Fiscal Shock
Additional Stress Tests
Baseline
Underlying Assumptions
Figure 3. Ecuador Public DSA - Stress Tests
Macro-Fiscal Stress Tests
Baseline Primary Balance Shock
Real GDP Growth Shock
Real Interest Rate Shock
0
5
10
15
20
25
30
35
40
45
50
2015 2016 2017 2018 2019 2020
Gross Nominal Public Debt(In percent of GDP)
0
20
40
60
80
100
120
140
160
2015 2016 2017 2018 2019 2020
Gross Nominal Public Debt
(In percent of Revenue)
0
2
4
6
8
10
12
2015 2016 2017 2018 2019 2020
Public Gross Financing Needs
(In percent of GDP)
0
5
10
15
20
25
30
35
40
45
50
2015 2016 2017 2018 2019 2020
Gross Nominal Public Debt(In percent of GDP)
0
20
40
60
80
100
120
140
160
2015 2016 2017 2018 2019 2020
Gross Nominal Public Debt
(In percent of Revenue)
0
2
4
6
8
10
12
2015 2016 2017 2018 2019 2020
Public Gross Financing Needs
(In percent of GDP)
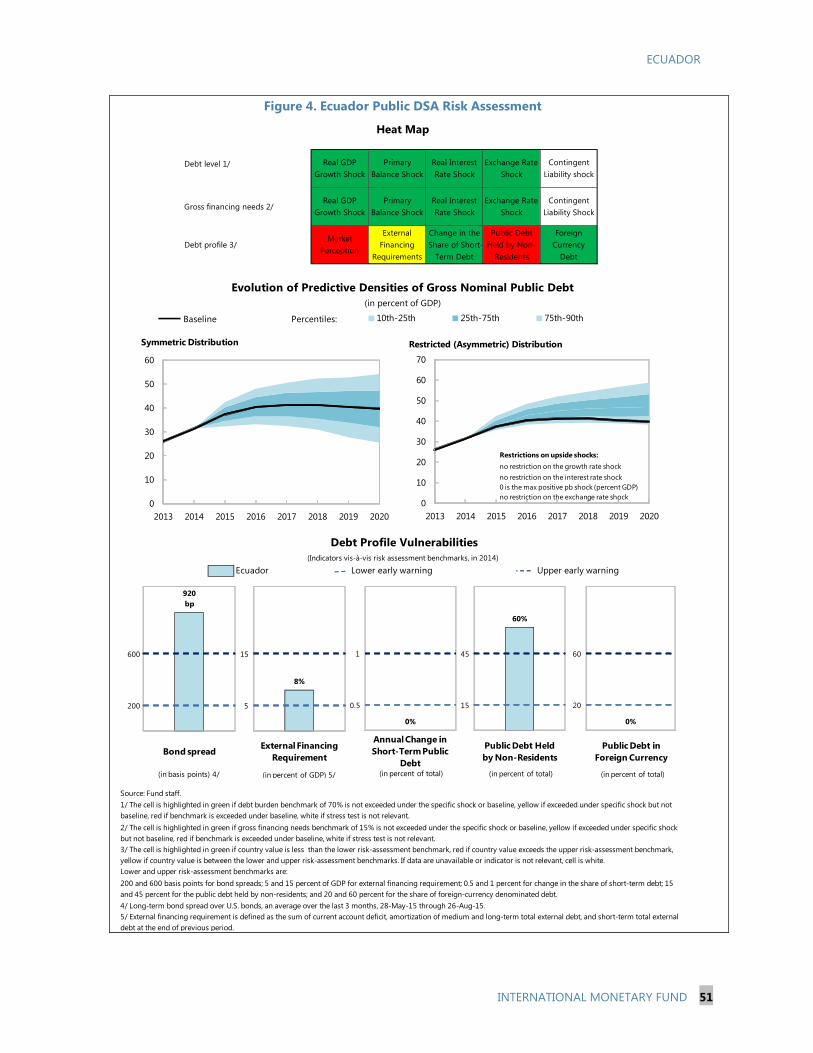
ECUADOR
INTERNATIONAL MONETARY FUND 51
Ecuador
Source: Fund staff.
5/ External financing requirement is defined as the sum of current account deficit, amortization of medium and long-term total external debt, and short-term total external
debt at the end of previous period.
4/ Long-term bond spread over U.S. bonds, an average over the last 3 months, 28-May-15 through 26-Aug-15.
2/ The cell is highlighted in green if gross financing needs benchmark of 15% is not exceeded under the specific shock or baseline, yellow if exceeded under specific shock
but not baseline, red if benchmark is exceeded under baseline, white if stress test is not relevant.
200 and 600 basis points for bond spreads; 5 and 15 percent of GDP for external financing requirement; 0.5 and 1 percent for change in the share of short-term debt; 15
and 45 percent for the public debt held by non-residents; and 20 and 60 percent for the share of foreign-currency denominated debt.
Market
Perception
Debt level 1/ Real GDP
Growth Shock
Primary
Balance Shock
3/ The cell is highlighted in green if country value is less than the lower risk-assessment benchmark, red if country value exceeds the upper risk-assessment benchmark,
yellow if country value is between the lower and upper risk-assessment benchmarks. If data are unavailable or indicator is not relevant, cell is white.
Lower and upper risk-assessment benchmarks are:
Change in the
Share of Short-
Term Debt
Foreign
Currency
Debt
Public Debt
Held by Non-
Residents
Primary
Balance Shock
Real Interest
Rate Shock
Exchange Rate
Shock
Contingent
Liability Shock
Exchange Rate
Shock
Contingent
Liability shock
Figure 4. Ecuador Public DSA Risk Assessment
1/ The cell is highlighted in green if debt burden benchmark of 70% is not exceeded under the specific shock or baseline, yellow if exceeded under specific shock but not
baseline, red if benchmark is exceeded under baseline, white if stress test is not relevant.
Real Interest
Rate Shock
External
Financing
Requirements
Real GDP
Growth Shock
Heat Map
Upper early warning
Evolution of Predictive Densities of Gross Nominal Public Debt
(in percent of GDP)
Debt profile 3/
Lower early warning
(Indicators vis-à-vis risk assessment benchmarks, in 2014)
Debt Profile Vulnerabilities
Gross financing needs 2/
20
60
0%
1 2
200
600
920
bp
1 2
5
15
8%
1 2
0.5
1
0%
1 2
Bond spreadExternal Financing
Requirement
Annual Change in
Short-Term Public
Debt
Public Debt in
Foreign Currency
(in basis points) 4/ (in percent of GDP) 5/ (in percent of total) (in percent of total)
0
10
20
30
40
50
60
2013 2014 2015 2016 2017 2018 2019 2020
10th-25th 25th-75th 75th-90thPercentiles:Baseline
Symmetric Distribution
0
10
20
30
40
50
60
70
2013 2014 2015 2016 2017 2018 2019 2020
Restricted (Asymmetric) Distribution
no restriction on the growth rate shock
no restriction on the interest rate shock
0 is the max positive pb shock (percent GDP)
no restriction on the exchange rate shock
Restrictions on upside shocks:
15
45
60%
1 2
Public Debt Held
by Non-Residents
(in percent of total)
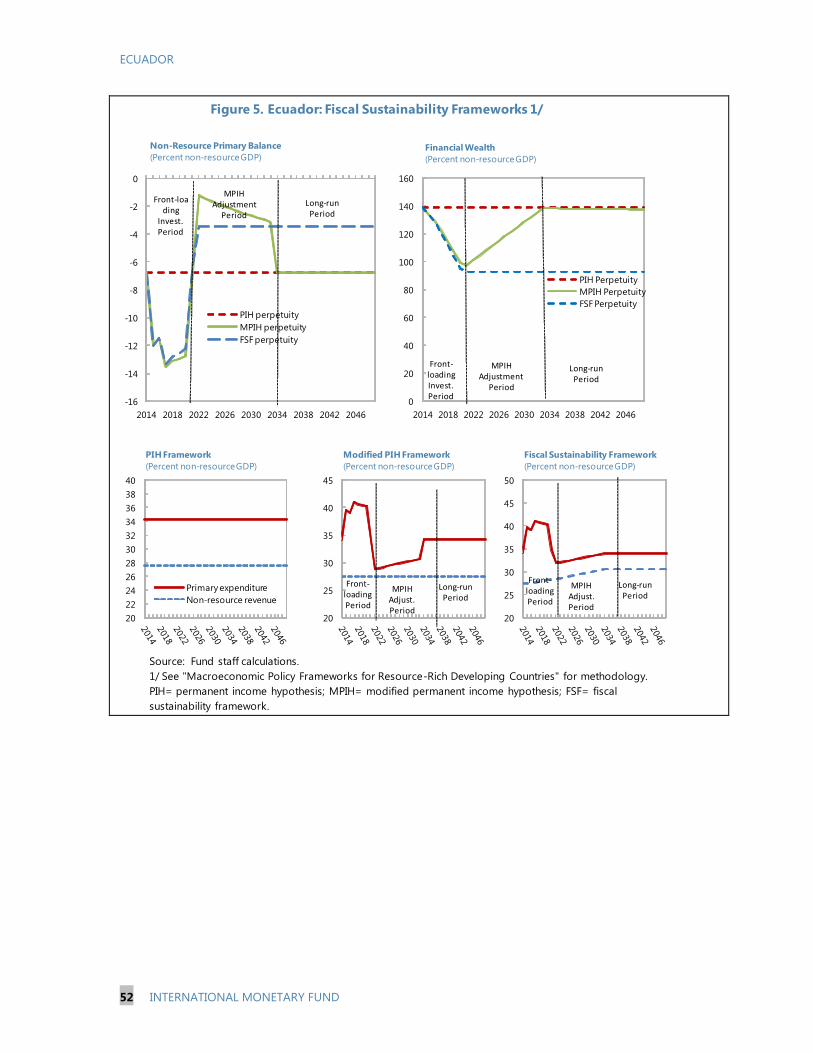
ECUADOR
52 INTERNATIONAL MONETARY FUND
Figure 5. Ecuador: Fiscal Sustainability Frameworks 1/
Source: Fund staff calculations.
1/ See "Macroeconomic Policy Frameworks for Resource-Rich Developing Countries" for methodology.
PIH= permanent income hypothesis; MPIH= modified permanent income hypothesis; FSF= fiscal
sustainability framework.
-16
-14
-12
-10
-8
-6
-4
-2
0
2014 2018 2022 2026 2030 2034 2038 2042 2046
PIH perpetuity
MPIH perpetuity
FSF perpetuity
Non-Resource Primary Balance
(Percent non-resource GDP)
Front-loading
Invest.Period
MPIHAdjustment
Period
Long-runPeriod
20
22
24
26
28
30
32
34
36
38
40
Primary expenditure
Non-resource revenue
PIH Framework
(Percent non-resource GDP)
20
25
30
35
40
45
Modified PIH Framework
(Percent non-resource GDP)
Front-loadingPeriod
Long-runPeriod
MPIHAdjust. Period
20
25
30
35
40
45
50
Fiscal Sustainability Framework
(Percent non-resource GDP)
Front-loadingPeriod
Long-runPeriod
MPIHAdjust.Period
0
20
40
60
80
100
120
140
160
2014 2018 2022 2026 2030 2034 2038 2042 2046
PIH Perpetuity
MPIH Perpetuity
FSF Perpetuity
Financial Wealth
(Percent non-resource GDP)
Front-loadingInvest.Period
MPIHAdjustment
Period
Long-runPeriod

Projections
2010 2011 2012 2013 2014 2015 2016 2017 2018 2019 2020 Debt-stabilizing
non-interest
current account 6/
Baseline: External debt 20.6 20.4 18.7 21.5 25.4 31.9 35.9 36.9 37.6 37.5 37.3 2.4
Change in external debt -2.4 -0.2 -1.7 2.8 3.9 6.5 4.0 1.0 0.7 -0.1 -0.2
Identified external debt-creating flows (4+8+9) 0.2 -1.4 -1.1 0.5 0.1 3.0 2.9 2.5 2.5 1.8 1.7
Current account deficit, excluding interest payments 1.4 -0.5 -0.7 0.1 -0.5 0.7 0.3 -0.4 -0.4 -1.1 -1.2
Deficit in balance of goods and services 4.4 2.2 1.5 2.1 1.3 2.4 2.0 1.5 1.6 0.8 0.8
Exports 28.2 31.1 30.1 29.3 28.8 22.7 22.8 23.5 23.6 23.7 23.6
Imports 32.5 33.3 31.6 31.4 30.1 25.2 24.8 25.0 25.2 24.6 24.3
Net non-debt creating capital inflows (negative) 0.2 0.8 0.7 0.8 0.8 0.7 0.8 0.8 0.8 0.8 0.8
Automatic debt dynamics 1/ -1.4 -1.7 -1.1 -0.4 -0.2 1.6 1.9 2.1 2.1 2.2 2.1
Contribution from nominal interest rate 0.9 0.9 0.9 1.0 1.1 1.5 1.9 2.3 2.5 2.7 2.8
Contribution from real GDP growth -0.7 -1.4 -1.0 -0.8 -0.8 0.2 0.0 -0.2 -0.4 -0.5 -0.7
Contribution from price and exchange rate changes 2/ -1.6 -1.1 -1.0 -0.5 -0.5 ... ... ... ... ... ...
Residual, incl. change in gross foreign assets (2-3) 3/ -2.6 1.2 -0.6 2.4 3.9 3.5 1.0 -1.5 -1.8 -1.9 -1.9
External debt-to-exports ratio (in percent) 73.1 65.5 62.0 73.3 88.4 140.5 157.5 157.3 159.4 157.8 158.1
Gross external financing need (in billions of U.S. dollars) 4/ 4.8 3.5 3.3 4.4 6.5 8.6 8.5 8.6 8.8 8.4 10.7
in percent of GDP 6.9 4.4 3.8 4.6 6.5 10-Year 10-Year 8.7 8.4 8.2 8.1 7.5 9.2
Scenario with key variables at their historical averages 5/ 31.9 30.7 27.2 23.6 20.1 16.6 0.0
Historical Standard
Key Macroeconomic Assumptions Underlying Baseline Average Deviation
Real GDP growth (in percent) 3.5 7.9 5.2 4.6 3.8 4.4 2.1 -0.6 0.1 0.6 1.2 1.5 1.8
GDP deflator in U.S. dollars (change in percent) 7.5 5.7 5.0 3.0 2.5 6.1 3.7 -1.0 2.7 2.4 2.3 2.1 1.4
Nominal external interest rate (in percent) 4.3 4.8 4.7 5.7 5.2 5.7 1.4 5.6 6.2 6.7 7.1 7.4 7.7
Growth of exports (U.S. dollar terms, in percent) 24.5 25.8 6.9 5.1 4.4 13.7 16.7 -22.3 3.0 6.0 4.0 4.4 2.6
Growth of imports (U.S. dollar terms, in percent) 34.0 16.6 5.0 7.2 1.8 13.2 15.9 -17.7 1.4 3.6 4.4 1.1 2.4
Current account balance, excluding interest payments -1.4 0.5 0.7 -0.1 0.5 2.3 2.8 -0.7 -0.3 0.4 0.4 1.1 1.2
Net non-debt creating capital inflows -0.2 -0.8 -0.7 -0.8 -0.8 -0.8 0.4 -0.7 -0.8 -0.8 -0.8 -0.8 -0.8
Source: Fund staff.
1/ Derived as [r - g - r(1+g) + ea(1+r)]/(1+g+r+gr) times previous period debt stock, with r = nominal effective interest rate on external debt; r = change in domestic GDP deflator in US dollar terms, g = real GDP growth rate,
e = nominal appreciation (increase in dollar value of domestic currency), and a = share of domestic-currency denominated debt in total external debt.
2/ The contribution from price and exchange rate changes is defined as [-r(1+g) + ea(1+r)]/(1+g+r+gr) times previous period debt stock. r increases with an appreciating domestic currency (e > 0) and rising inflation (based on GDP deflator).
3/ For projection, line includes the impact of price and exchange rate changes.
4/ Defined as current account deficit, plus amortization on medium- and long-term debt, plus short-term debt at end of previous period.
5/ The key variables include real GDP growth; nominal interest rate; dollar deflator growth; and both non-interest current account and non-debt inflows in percent of GDP.
6/ Long-run, constant balance that stabilizes the debt ratio assuming that key variables (real GDP growth, nominal interest rate, dollar deflator growth, and non-debt inflows in percent of GDP) remain at their levels
of the last projection year.
Actual
Table 2. Ecuador: External Debt Sustainability Framework, 2010-2020
(In percent of GDP, unless otherwise indicated)
EC
UA
DO
R
EC
UA
DO
R
EC
UA
DO
R
INTER
NA
TIO
NA
L MO
NETA
RY F
UN
D
53
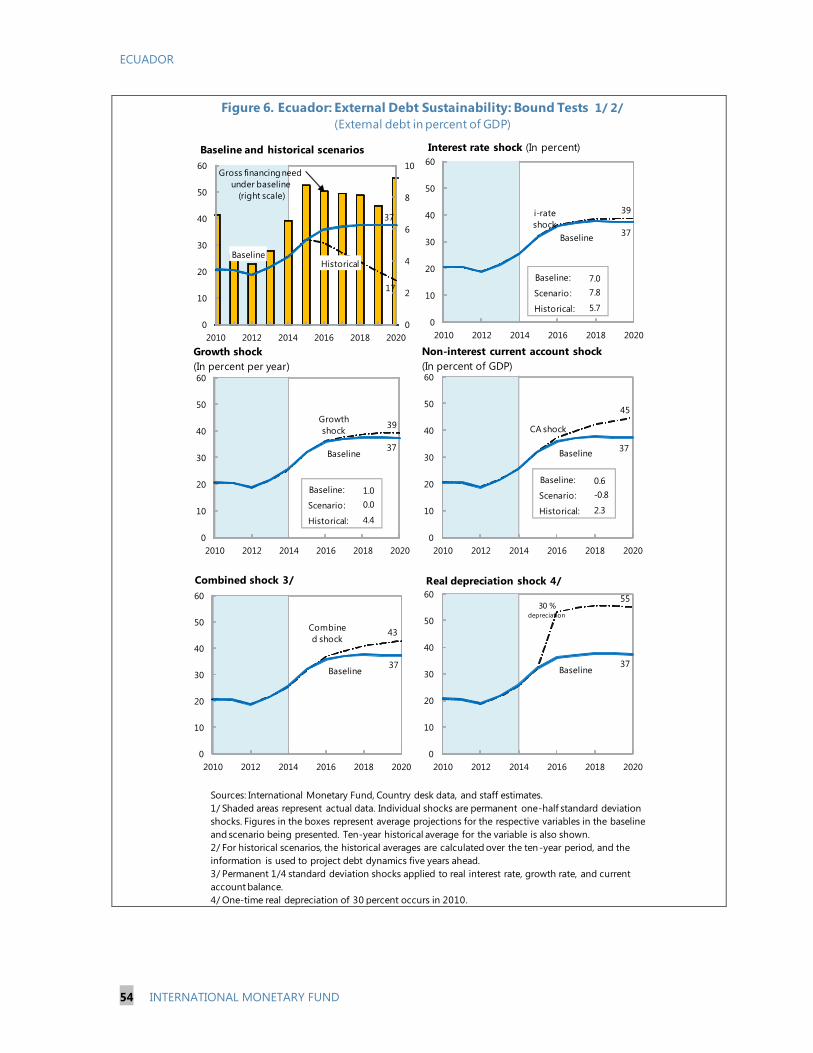
ECUADOR
54 INTERNATIONAL MONETARY FUND
i-rate
shock
39
Baseline37
0
10
20
30
40
50
60
2010 2012 2014 2016 2018 2020
Interest rate shock (In percent)
Figure 6. Ecuador: External Debt Sustainability: Bound Tests 1/ 2/
(External debt in percent of GDP)
Sources: International Monetary Fund, Country desk data, and staff estimates.
1/ Shaded areas represent actual data. Individual shocks are permanent one-half standard deviation
shocks. Figures in the boxes represent average projections for the respective variables in the baseline
and scenario being presented. Ten-year historical average for the variable is also shown.
2/ For historical scenarios, the historical averages are calculated over the ten-year period, and the
information is used to project debt dynamics five years ahead.
3/ Permanent 1/4 standard deviation shocks applied to real interest rate, growth rate, and current
account balance.
4/ One-time real depreciation of 30 percent occurs in 2010.
Historical
17
Baseline
37
0
2
4
6
8
10
0
10
20
30
40
50
60
2010 2012 2014 2016 2018 2020
Baseline and historical scenarios
CA shock
45
Baseline37
0
10
20
30
40
50
60
2010 2012 2014 2016 2018 2020
Combine
d shock 43
Baseline37
0
10
20
30
40
50
60
2010 2012 2014 2016 2018 2020
Combined shock 3/
30 % depreciation
55
Baseline37
0
10
20
30
40
50
60
2010 2012 2014 2016 2018 2020
Real depreciation shock 4/
Gross financing need
under baseline
(right scale)
Non-interest current account shock
(In percent of GDP)
Growth
shock 39
Baseline37
0
10
20
30
40
50
60
2010 2012 2014 2016 2018 2020
Baseline:
Scenario:
Historical:
7.0
7.8
5.7
Baseline:
Scenario:
Historical:
1.0
0.0
4.4
Baseline:
Scenario:
Historical:
0.6
-0.8
2.3
Growth shock
(In percent per year)
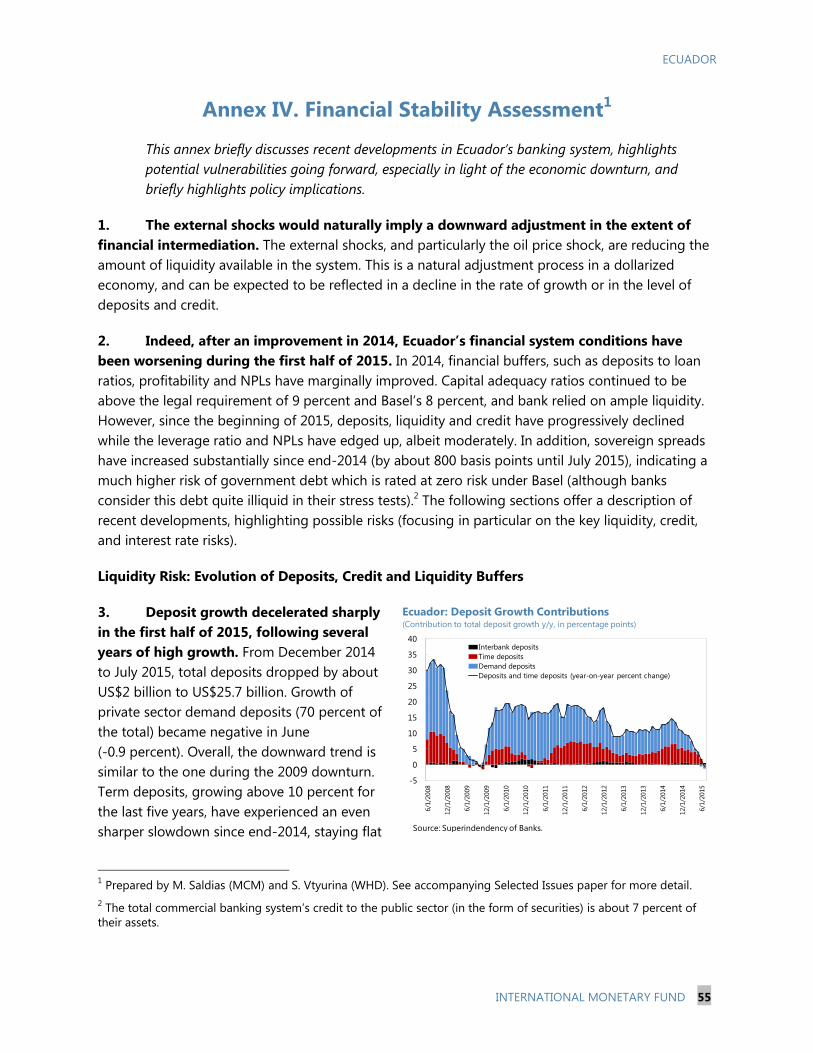
ECUADOR
INTERNATIONAL MONETARY FUND 55
Annex IV. Financial Stability Assessment1
This annex briefly discusses recent developments in Ecuador’s banking system, highlights
potential vulnerabilities going forward, especially in light of the economic downturn, and
briefly highlights policy implications.
1. The external shocks would naturally imply a downward adjustment in the extent of
financial intermediation. The external shocks, and particularly the oil price shock, are reducing the
amount of liquidity available in the system. This is a natural adjustment process in a dollarized
economy, and can be expected to be reflected in a decline in the rate of growth or in the level of
deposits and credit.
2. Indeed, after an improvement in 2014, Ecuador’s financial system conditions have
been worsening during the first half of 2015. In 2014, financial buffers, such as deposits to loan
ratios, profitability and NPLs have marginally improved. Capital adequacy ratios continued to be
above the legal requirement of 9 percent and Basel’s 8 percent, and bank relied on ample liquidity.
However, since the beginning of 2015, deposits, liquidity and credit have progressively declined
while the leverage ratio and NPLs have edged up, albeit moderately. In addition, sovereign spreads
have increased substantially since end-2014 (by about 800 basis points until July 2015), indicating a
much higher risk of government debt which is rated at zero risk under Basel (although banks
consider this debt quite illiquid in their stress tests).2 The following sections offer a description of
recent developments, highlighting possible risks (focusing in particular on the key liquidity, credit,
and interest rate risks).
Liquidity Risk: Evolution of Deposits, Credit and Liquidity Buffers
3. Deposit growth decelerated sharply
in the first half of 2015, following several
years of high growth. From December 2014
to July 2015, total deposits dropped by about
US$2 billion to US$25.7 billion. Growth of
private sector demand deposits (70 percent of
the total) became negative in June
(0.9 percent). Overall, the downward trend is
similar to the one during the 2009 downturn.
Term deposits, growing above 10 percent for
the last five years, have experienced an even
sharper slowdown since end-2014, staying flat
1 Prepared by M. Saldias (MCM) and S. Vtyurina (WHD). See accompanying Selected Issues paper for more detail.
2 The total commercial banking system’s credit to the public sector (in the form of securities) is about 7 percent of
their assets.
-5
0
5
10
15
20
25
30
35
40
6/1
/2008
12/1
/2008
6/1
/2009
12/1
/2009
6/1
/2010
12/1
/2010
6/1
/2011
12/1
/2011
6/1
/2012
12/1
/2012
6/1
/2013
12/1
/2013
6/1
/2014
12/1
/2014
6/1
/2015
Interbank deposits
Time deposits
Demand deposits
Deposits and time deposits (year-on-year percent change)
Ecuador: Deposit Growth Contributions(Contribution to total deposit growth y/y, in percentage points)
Source: Superindendency of Banks.

ECUADOR
56 INTERNATIONAL MONETARY FUND
in July. The deposit decline reflects mainly the adjustment to the economic downturn, but also
confidence-driven shocks seem responsible.
4. Banks have responded quickly to deposit decline. They allowed liquid assets to decline by
US$1.8 billion between December 2014 and April 2015. Since April, banks have also been rationing
credit, which declined by almost $0.5 billion between April and July, affecting even the highest
quality customers. Given the higher contraction of deposit growth than credit growth, the loan-to-
deposit ratio of the private banking sector started to increase, reversing the 2014 trend. It increased
on average from 73.5 percent in 2014 to a historical maximum at 81.7 percent in July 2015, pointing
to potential funding pressures in spite of the corresponding slower credit growth and to the
emergence of pockets of weaknesses in the financial sector.
5. In addition, short-term liquidity in
private banks has been declining, in fact,
continuously since 2008. Short-term liquidity
represents around 70 percent of liquid assets,
hence short-term liquidity ratios deserve close
monitoring. The key ratio (defined as short-term
liquid assets to short-term liabilities) reached
historically low levels in April 2015 (20.9 percent),
before slightly recovering (to 23.3 percent) in
July 2015.
6. Due to the liquidity cushions accumulated by banks in cash and in deposits at the
central bank, the current pace of deposit withdrawal should not cause significant liquidity
stress in 2015. A baseline liquidity decline scenario performed by Fund staff over a six-month
horizon shows that if deposits continue to decline at the pace of the first seven months of 2015,
and banks can access their liquid assets, no bank would need to access external sources of
15
20
25
30
35
40
45
50
55
60
Dec-2
006
Jun
-2007
Dec-2
007
Jun
-2008
Dec-2
008
Jun
-2009
Dec-2
009
Jun
-2010
Dec-2
010
Jun
-2011
Dec-2
011
Jun
-2012
Dec-2
012
Jun
-2013
Dec-2
013
Jun
-2014
Dec-2
014
Jun
-2015
25th and 75th-percentiles
Median short-term liquidity ratio
Weighted average
Ecuador: Short-term Liquidity Ratio Distribution (In percentage points)
Source: Superintendency of Banks.
-5
0
5
10
15
20
25
30
35
40
Jul-
08
Jan
-09
Jul-
09
Jan
-10
Jul-
10
Jan
-11
Jul-
11
Jan
-12
Jul-
12
Jan
-13
Jul-
13
Jan
-14
Jul-
14
Jan
-15
Jul-
15
Deposits Credit
Ecuador: Deposits and Credit at Private Banks
(In percent, year-on-year change)
Sources: Superintendency of Banks.
-10
-5
0
5
10
15
20
25
30
35
6/1
/2008
12/1
/2008
6/1
/2009
12/1
/2009
6/1
/2010
12/1
/2010
6/1
/2011
12/1
/2011
6/1
/2012
12/1
/2012
6/1
/2013
12/1
/2013
6/1
/2014
12/1
/2014
6/1
/2015
Consumer loans Mortgage
Commercial loans Microcredit
Student loans Total (year-on-year percent change)
Ecuador: Credit Growth Contribution(Contribution to total credit growth y/y, in percentage points)
Source: Superindendency of Banks.

ECUADOR
INTERNATIONAL MONETARY FUND 57
liquidity—including the Liquidity Fund—this year.3 Obviously, if deposits decline at a significantly
faster pace, banks’ external liquidity needs are more likely to arise. In addition, the liquidity analysis
shows that assumptions about liquidity recovery from deposits held in other domestic banks, and
especially in government paper, play a very important role for potential stress. The latter is directly
linked to the liquidity of government debt in secondary markets.
Credit risk: Evolution of Non-Performing Loans and Banks’ Profitability
7. Correlation of NPL with real GDP growth point out to potential credit risk during a
downturn.4 While correlation was high between banks’ overall NPL and real GDP over the period
1993−2003 in Ecuador, it is much less so since 2008. However, consumer and microcredit loans are
still highly correlated with real GDP growth, and both their share in the banks’ portfolio and their
corresponding NPLs are increasing. This suggests that credit risk would rise if the economic
downturn remains persistent.
3 The baseline scenario assumes a monthly decline of 1.5 percent in demand deposits and 0.4 percent in term
deposits, to reflect the average decline registered between December 2014 and July 2015. Based on the following
assumptions, the monthly implied liquid assets availability is calculated as the sum of: 100 percent of cash,
95 percent of deposits at the BCE, 80 percent of deposits in foreign and domestic banks as well as interbank
positions, 50 percent of debt holdings, and 1 percent of illiquid assets (and it corresponds to about 89 percent of
total liquid assets). The faster decline scenario refers to a persistent decline equal to the maximum month-on-month
deposits decline recorded in 2015 for each bank.
4 For empirical evidence on this link see: Mwanza N (2011) “Nonperforming Loans and Macrofinancial Vulnerabilities
in Advanced Economies” IMF Working Papers 11/161, International Monetary Fund. and Espinoza, R. and Prasad, A.
(2010) “Nonperforming Loans in the GCC Banking System and their Macroeconomic Effects,” IMF Working Papers
10/224, International Monetary Fund. Di Bella (2011) “The Impact of the Global Financial Crisis on Microfinance and
Policy Implications” IMF Working Papers 11/175, International Monetary Fund provides specific evidence for
microfinance loans NPL over the cycle.
Source: Superindendency of Banks. July 2015.
0
5
10
15
20
25
30
Commercial loans Consumer credit Mortgages
Microfinance Student loans Total loans
Average
Ecuador: NPLs by Loan Type and BankEcuador: NPLs by Loan Type¹ and Real GDP Growth(In percent, y/y)
-4
-2
0
2
4
6
8
10
0
1
2
3
4
5
6
7
8
2008Q1 2009Q1 2010Q1 2011Q1 2012Q1 2013Q1 2014Q1 2015Q1
Total portfolio Commercial loans
Consumer loans Mortgage
Microcredit Real GDP Growth (yoy, rhs)
Source: , Superintendency of Banks, Haver Analitycs and IMF staff calculations.
¹NPLs by loan type in percent of total loans.

ECUADOR
58 INTERNATIONAL MONETARY FUND
8. NPL have edged up in 2015, but they remain reasonably low by international
standards in aggregate terms. NPL in private banks increased from 2.9 in December 2014 to 3.8 in
July 2015 and are higher in consumer, microfinance, and education loans. Moreover, their
distribution by bank and by loan type now shows that potential losses are unevenly distributed,
suggesting that potential credit risks could be more severe in banks with concentrated exposures to
specific sectors. Although the general pattern is that smaller banks tend to have larger NPL, several
large and medium sized banks also show high values in some segments.
9. Bank profitability has been on a declining trend for a few years, and is lower than in
other countries of the region. Profitability of private banks has declined over the past few years—
with return on assets declining from above 2 percent in 2006-2007 to about 1 percent in 2014—as
the government eliminated fees and charges on provision of basic financial services and introduced
new tax in 2012 (to finance social spending). Profitability edged up briefly in 2014, due to higher
provisioning by some banks and new service fees introduced by banks (e.g. additional ATM fees,
fees for air miles accumulation on credit cards, etc.) as banks tried to make up for lost income. 5
However, profitability remained the lowest among large countries in the region, and it declined
again in 2015 (to below 1 percent in July 2015). Gross financial margins as well as operating costs
remain high, reflecting high liquidity needs, a high cost of holding liquidity abroad due to high
taxes, and high provisions due to rigidities in the bankruptcy framework. As measured by ROA, the
profitability dispersion has decreased over the years, with some banks presenting very low
profitability ratios relative to the system.
5 A maximum ATM fee was set at 50 cents when a customer did not use his own bank’s machine and was eliminated
if the bank’s machine was used. Charges for maintaining checking and savings accounts were eliminated. Maximum
fees were established for other financial transactions (issuing credit cards, transfers between banks, etc.). New
financial products are now required to be approved by the authorities.
0
0.5
1
1.5
2
2.5
3
3.5
4
Dec-2
006
Jun
-2007
Dec-2
007
Jun
-2008
Dec-2
008
Jun
-2009
Dec-2
009
Jun
-2010
Dec-2
010
Jun
-2011
Dec-2
011
Jun
-2012
Dec-2
012
Jun
-2013
Dec-2
013
Jun
-2014
Dec-2
014
Jun
-2015
Median ROA 25th-and 75-th percentiles
Ecuador: Return on Assets (In percentage points)
Source: Superintendency of Banks.
0
1
2
3
4
5
6
Dec-2
006
Jun
-2007
Dec-2
007
Jun
-2008
Dec-2
008
Jun
-2009
Dec-2
009
Jun
-2010
Dec-2
010
Jun
-2011
Dec-2
011
Jun
-2012
Dec-2
012
Jun
-2013
Dec-2
013
Jun
-2014
Dec-2
014
Brazil Ecuador Mexico Chile Colombia Peru
Selected Countries: Return on Assets (In percentage points)
Source: Financial Soundness Indicators.

ECUADOR
INTERNATIONAL MONETARY FUND 59
Return on Assets Return on Equity Gross Financial Margin 1/ Operating Costs 1/
(Percent) (Percent) (Percent of total assets) (Percent of total assets)
Source: Bankscope.
1/ Operating costs exclude interest; gross financial margin is the net interest revenue.
Latin America: Selected Financial Indicators, 2014
(Asset weighted average)
0 2 4
Ecuador
Uruguay
Brazil
Panama
Mexico
Chile
El Salvador
Colombia
Peru
Paraguay
Argentina
0 20 40
Ecuador
Uruguay
El Salvador
Mexico
Colombia
Panama
Chile
Peru
Brazil
Paraguay
Argentina
0 5 10
Panama
Chile
Brazil
Uruguay
Colombia
Mexico
Ecuador
Argentina
Paraguay
El Salvador
Peru
0 5 10
Panama
Chile
Paraguay
Brazil
El Salvador
Uruguay
Colombia
Peru
Mexico
Ecuador
Argentina
Source: Superindendency of Banks.
Ecuador: Selected Liquidity and Solvency Indicators (July 2015)
0
3
6
9
12
15
18
21
5 10 15 20 25 30 35 40 45 50
NP
L
Short-term Liquidity Ratio
Short-term Liquidity Ratio and NPL
(in percent)
Private banks
Large banks
Medium-sized banks
Small banks
-3.5
-3.0
-2.5
-2.0
-1.5
-1.0
-0.5
0.0
0.5
1.0
1.5
2.0
5 10 15 20 25 30 35 40 45 50
RO
A
Short-term Liquidity Ratio
Short-term Liquidity Ratio and ROA
(in percent)
Private banks
Large banks
Medium-sized banks
Small banks
0
3
6
9
12
15
18
21
15 25 35 45 55 65 75 85 95 105 115 125 135
NP
L
Loans-to-Deposits Ratio
Loans-to-Deposits Ratio and NPL
(in percent)
Private banks
Large banks
Medium-sized banks
Small banks
-3.5
-3.0
-2.5
-2.0
-1.5
-1.0
-0.5
0.0
0.5
1.0
1.5
2.0
15 25 35 45 55 65 75 85 95 105 115 125 135
RO
A
Loans-to-Deposits Ratio
Loans-to-Deposits and ROA
(in percent)
Private banks
Large banks
Medium-sized banks
Small banks
10. Some banks with larger losses and lower profitability also have a weaker liquidity
position. The figures in the panel show that several banks (totaling a non-trivial aggregate asset
size) that are experiencing relatively larger non-performing loans and lower return on assets,
relative to the system, also face weaker liquidity indicators.
ECUADOR
60 INTERNATIONAL MONETARY FUND
Interest rate risk: uneven between private and public sector
11. Interest rate risk is likely to be more limited for the private domestic financial sector
and more prominent for the public sector. Interest rate risk within the banking sector has
traditionally been limited, given the regulatory controls on lending rates. As U.S. monetary policy
normalization is expected to raise the international reference interest rates, there may be a pressure
to adjust interest rates domestically. However, such pass-through has generally been limited, and
interest rate risk should rise mainly to the extent regulated interest rates will be adjusted to reflect
international conditions. Nonetheless, the effect of international rates on the terms at which the
government and the private sector can access international funding will certainly be present. Within
this context, it is important to note that the sovereign spread has been increasing extensively, as
clearly documented in the main test of the Staff Report.
Conclusions
12. In light of recent developments, supervision of liquidity and credit risks needs to be
heightened, and policies should be particularly targeted to ensuring liquidity in the system.
The authorities should remain vigilant and continue to monitor carefully financial and liquidity
trends, particularly if heterogenous developments across banks arise. If pressures persist, the
authorities should promptly adjust banks’ reserve requirements at the BCE and stand ready to
provide prompt support with the Liquidity Fund (holding US$2.3 billion as of end-July). Other
current policies that affect liquidity—such as lending by the BCE to the government and state
corporations, and directing private credit towards mortgages—need to be reversed. Going forward,
financial buffers should be built further; policies that affect banks liquidity management such as the
domestic liquidity requirement should be modified, to allow larger holding of liquid assets abroad if
necessary; and the distortionary regulation (interest rate ceilings, directed credit) need to be lifted.

ECUADOR STAFF REPORT FOR THE 2015 ARTICLE IV CONSULTATION—
INFORMATIONAL ANNEX
Prepared By
The Western Hemisphere Department
(In Consultation with Other Departments)
FUND RELATIONS _______________________________________________________________________ 2
RELATIONS WITH THE WORLD BANK __________________________________________________ 4
RELATIONS WITH THE INTER-AMERICAN DEVELOPMENT BANK ____________________ 6
STATISTICAL ISSUES ____________________________________________________________________ 8
CONTENTS
September 10, 2015

ECUADOR
2 INTERNATIONAL MONETARY FUND
FUND RELATIONS
A. Financial Relations
(As of July 31, 2015)
Membership status: Joined: December 28, 1945
General Resources Account:
SDR million Percent Quota
Quota 347.80 100
Fund holding of currency (Exchange Rate) 319.27 91.80
Reserve Position 28.53 8.20
SDR Department:
Outstanding Purchases and Loans: None.
Latest Financial Arrangements:
Overdue Obligations and Projected Payments to the Fund (in SDR million; based on existing
use of resources and present holdings of SDRs):
Implementation of HIPC Initiative: Not Applicable
Implementation of Multilateral Debt Relief Initiative (MDRI): Not Applicable
Implementation of Post-Catastrophe Debt Relief (PCDR): Not Applicable
SDR million Percent Quota
New cumulative holdings 288.36 100
Holdings 17.81 6.18
In million of SDR
Type Data of Arrangement Expiration Date Amount Approved Amount Drawn
Stand-By Mar 21, 2003 Apr 20, 2004 151.00 60.40
Stand-By Apr 19, 2000 Dec 31, 2001 226.73 226.73
Stand-By May 11, 1994 Dec 11, 1995 173.90 98.90
forthcoming
2015 2016 2017 2018 2019
Principal
Charges/Interest 0.07 0.14 0.14 0.14 0.14
Total 0.07 0.14 0.14 0.14 0.14

ECUADOR
INTERNATIONAL MONETARY FUND 3
Safeguards Assessment:
An on-site safeguard assessment was conducted in March 2003 and the safeguards assessment
report was approved by management on June 23, 2003. The assessment identified a need to
strengthen the audit oversight and reporting frameworks at the BCE. At that time, the BCE
committed to the implementation of the safeguards recommendations, including the timely
publication of its annual audited financial statements, which are yet to be published.
B. Nonfinancial Relations
Exchange Rate Arrangement:
On February 12, 1999 the central bank abandoned the exchange rate band and floated the sucre.
On March 9, 2000 the economy was dollarized at 25,000 sucres per US dollar. The de jure and de
facto exchange rate arrangement is an arrangement with no separate legal tender; there are local
coins (small denomination) in circulation in the amount of about US$80 million. Ecuador has
accepted the obligations of Article VIII, Sections 2, 3, and 4 but maintains an exchange restriction
subject to Fund approval arising from a 5 percent tax on transfers for the making of payments and
transfers on current international transactions. The tax has recently been waived for the outflows
relating to bank loans of over one year for specific sectors identified in the Productive code (e.g.
housing and microfinance).
FSAP: FSAP took place in 2004.
Last Article IV Consultation:
On July 31, 2014, the Executive Board concluded the 2014 Article IV consultation.
Technical Assistance:
STA Monetary and Financial Statistics, December 2013
FAD Single Treasury Account, October 2007
LEG Workshop to supervisors on ML/CFT, July 2007

ECUADOR
4 INTERNATIONAL MONETARY FUND
RELATIONS WITH THE WORLD BANK
A. Country Strategy
The current World Bank Group’s support to Ecuador was defined in the Interim Strategy Note (ISN)
FY 14−15 discussed with local authorities and approved by the Board in April 2013. As a result of
extensive consultations with the Government of Ecuador, the ISN identifies three main areas of
support: (i) Sustainable and Inclusive Growth; (ii) Access to Social Protection and Quality Basic
Services for All; and (iii) Strengthening Public Sector Capacity to Provide Access to Quality Services.
Based on the ISN, the lending program focuses on building of the subnational capacity in the short
term, implementing key national strategies, and improving service delivery at the local level.
In addition, the Bank is undertaking an extensive program of analytical and advisory activities for
FY 14–15, including both economic and sector work and technical assistance. The economic and
sector work covers but is not limited to areas such as labor markets, safety nets, housing,
environmental management, and poverty analysis.
Finally, the Trust Fund (TF) portfolio complements Bank-funded operations in core engagement
areas identified in the ISN, such as transport, disaster risk management, and nutrition to support
knowledge, advisory services and technical assistance.
As of July 21, 2015, there are four approved projects in Ecuador (see Table 1). The Manta Public
Services Improvement Project is under implementation, while three other investment projects are
pending effectiveness: (i) Sustainable Family Farming Modernization project; (ii) Guayaquil
Wastewater Management project; and (iii) the Quito Metro Line One project. Total net commitment
on these projects is US$487.5 million. There are two projects currently under preparation for
presentation to the Board in FY 16: Supporting Education Reform in Targeted Circuits for
US$175 million; and Transport Infrastructure Improvement in Ibarra for US$52 million.
B. Lending
(As of July 21, 2015, and in millions of US$)
Ecuador: IBRD Portfolio Status
Project Name Lending
Instrument
Net
Commitment
Amount
Total
Disbursement
Total
Undisbursed
Total
Disbursed
in Fiscal
Year 15
Sustainable Family Farming Modernization IPF 80.00 0.00 80.00 0.00
Guayaquil Wastewater Management Project IPF 102.5 0.00 102.5 0.00
Quito Metro Line One IPF 205.00 0.00 205.00 0.00
Manta Public Services Improvement Project IPF 100.00 5.00 95.00 5.00
Total
487.5 5.00 482.5 5.00
EC
UA
DO
R

Ecuador: IBRD/IDA Operations
(As of June 2015
Status IBRD IDA Credits IDA Grants TOTAL
Net Commitments 3,660,980,000.00 39,037,527.58 0.00 3,700,017,527.58
Disbursed 2,427,694,367.50 37,535,688.46 0.00 2,465,230,055.96
Undisbursed 1,233,285,632.51 1,501,569.12 0.00 1,234,787,201.63
Repaid 2,275,728,100.85 32,742,866.57 0.00 2,308,470,967.42
Outstanding 151,966,266.65 4,792,821.89 0.00 156,759,088.54
Commitment
Fiscal Year
Institution
Short Name
LN
Cmtd-IFC
LN
Repayment-
IFC
ET
Cmtd-IFC
QL + QE
Cmtd - IFC
GT
Cmtd-IFC
RM
Cmtd-IFC
ALL
Cmtd-IFC
ALL
Cmtd-Part
LN
Out-IFC
ET
Out-IFC
QL+QE
Out-IFC
GT
Out-IFC
RM
Out-IFC
ALL
Out-IFC
ALL
Out-Part
2007/2008/2009/
2014/2015 Banco Guayaquil 0.00 0.00 0.00 0.00 0.47 0.00 0.47 0.00 0.00 0.00 0.00 0.47 0.00 0.47 0.00
2008/2009/2014/
2015 Banco Internacional 40.00 0.00 0.00 0.00 0.00 0.00 40.00 0.00 40.00 0.00 0.00 0.00 0.00 40.00 0.00
2015 Banco Pichincha 30.00 0.00 0.00 0.00 0.00 0.00 30.00 0.00 30.00 0.00 0.00 0.00 0.00 30.00 0.00
2007/2008/2015 Bolivariano 30.00 0.00 0.00 0.00 1.10 0.00 31.10 0.00 30.00 0.00 0.00 1.10 0.00 31.10 0.00
2004/2007/2009 Cartones America 0.00 0.00 0.00 0.00 0.00 0.01 0.01 0.00 0.00 0.00 0.00 0.00 0.00 0.00 0.00
1999/2003/2008/
2011 Favorita Fruit 10.06 39.11 0.00 7.00 0.00 0.00 17.06 2.74 10.06 0.00 7.00 0.00 0.00 17.06 2.74
2010 Moderna 2.91 5.09 0.00 0.00 0.00 0.00 2.91 0.00 2.91 0.00 0.00 0.00 0.00 2.91 0.00
2005/2009/2013 PRONACA 23.96 21.04 0.00 10.00 0.00 0.00 33.96 0.00 23.96 0.00 10.00 0.00 0.00 33.96 0.00
2007/2008/2009/
2015 Produbanco 0.00 0.00 0.00 0.00 0.15 0.00 0.15 0.00 0.00 0.00 0.00 0.15 0.00 0.15 0.00
2012 Tonicorp Holding 26.78 3.22 0.00 0.00 0.00 0.00 26.78 0.00 16.78 0.00 0.00 0.00 0.00 16.78 0.00
Total Portfolio 163.71 68.46 0.00 17.00 1.72 0.01 182.44 2.74 153.71 0.00 17.00 1.72 0.00 172.43 2.74
Ecuador: IFC Committed and Disbursed Outstanding Investment Portfolio
EC
UA
DO
R
EC
UA
DO
R
INTER
NA
TIO
NA
L MO
NETA
RY F
UN
D
5
EC
UA
DO
R
EC
UA
DO
R

ECUADOR
6 INTERNATIONAL MONETARY FUND
RELATIONS WITH THE INTER-AMERICAN
DEVELOPMENT BANK
A. Country Strategy
Ecuador’s current Country Strategy covers the period 2012–17. The strategy focuses on three main
lines of action: (i) infrastructure, to foster the development of domestic and external markets and
boost productivity; (ii) human capital, to ensure greater opportunities for income generation and to
stimulate total factor productivity; and (iii) public management, to adapt the new legal mandates to
the needs of the productive sector and to social demands.
IDB’s strategic engagement with Ecuador prioritizes eight sectors: (i) energy; (ii) transportation and
logistics; (iii) social development (education, health and social protection); (iv) access to finance;
(v) fiscal management; (vi) urban sustainability (urban planning, housing, water and sanitation, public
transit); (vii) rural development; and (viii) natural risk management. In addition, the Country Strategy
prioritizes two cross-sector areas of intervention: (i) diversity; and (ii) climate change and
environmental sustainability.
The lending scenario contemplated in the current Strategy for Ecuador foresaw average approvals of
US$350 million and an average net positive cash flow of US$124 million for the period 2012–17.
Approvals so far, have exceeded these projections, reaching US$450 million in 2012, US$495 million
in 2013, and 1,246 million in 2014 (this last figure includes two contingent credit lines for an amount
of US$300 million each). As a result, the IDB is currently Ecuador’s largest multilateral creditor.1
B. Lending
As of May 31, 2015, the Bank’s portfolio of active public sector operations consisted of 33 loans for
a total amount of US$2,799.2 million, of which US$1,523.5 million (54 percent) have been disbursed.
In addition, the Bank is currently executing 37 technical operations in Ecuador for a total amount of
US$44.6 million, of which US$18.8 million have already been disbursed. The public sector lending
program for 2015 comprises two operations for a total amount of US$580 million, both of which
concentrate on the electricity sector. The first of these two operations (support for the
transformation of the energy matrix) has already been approved and fully disbursed in the amount
of US$500 million. In addition, in February 2015 the Bank disbursed US$300 million from one of the
two contingent credit facilities that were approved in 2014.
As of April 2015, the Bank’s portfolio of active private sector operations included the following: the
Structured Corporate Finance Department’s (SCF) portfolio in execution consists of seven operations
1 As of March 2015, Ecuador’s sovereign debt with IDB of US$3,822.4 million amounted to 52.5 percent of the
country’s total multilateral financial obligations.

ECUADOR
INTERNATIONAL MONETARY FUND 7
amounting to US$175.6 million mostly in the financial services industry; the IIC portfolio comprises
13 operations for US$61.9 million, and the Opportunities for the Majority (OMJ) department
portfolio consists of two operations amounting US$41.3 million that focus on access to finance. This
portfolio is expected to continue growing: the private sector lending Pipeline for 2015 includes two
SCF projects (US$59 million) in financial markets and Infrastructure sector, one OMJ operation for
(US$5 million) in financial markets, five MIF projects (US$3.6 million), and eight IIC operations for an
amount of US$81 million.
Ecuador: IDB SG Active Loan Portfolio by Sector (Sovereign Guarantee)
As of May, 31, 2015
(In millions of U.S. dollars)
Sector Commitments Disbursements
Percent
Disbursed
Institutional Capacity of State 658.0 522.06 84
Transportation 610.0 320.49 53
Fiscal and Municipal Management 248.84 131.83 53
Energy 522.7 293.92 56
Water and Sanitation 341.25 72.68 21
Social Protection and Health 220.0 34.12 16
Environment and Rural Development 105 67.91 65
Education 75 48 64
Capital Markets and Financial Institutions 2.45 2.45 100
Trade and Investment 16 0 0
Total 2799.24 1523.46 54

ECUADOR
8 INTERNATIONAL MONETARY FUND
STATISTICAL ISSUES
ECUADOR—STATISTICAL ISSUES APPENDIX
As of June 30, 2015
I. Assessment of Data Adequacy for Surveillance
General: In spite of some shortcomings, macroeconomic data are adequate for surveillance
purposes.
National Accounts: The authorities published the new GDP series in 2012 with the 2007 as the base
year. Currently, quarterly and annual National Accounts data are published based on the
expenditure and production approaches, both in current and constant 2007 prices. Quarterly figures
are available up to 2015Q1, while annual series up to 2014.The income-based National Accounts are
published on an annual basis, up to 2013 (data for 2012 and 2013 are provisional). Similarly, the
supply and use tables (at current and constant prices), and the integrated economic accounts are
disseminated only for the period 2007–13. Although annual gross fixed capital formation is
disseminated by product under the expenditure based GDP, sectoral breakdown is available up to
2013 only. In national accounts at constant prices, private investment is not disaggregated from the
total capital formation.
Price Statistics: The CPI has national coverage of urban cities and is based on 2003/2004 weights.
Since January 2015, the CPI base year has been changed to 2014. The PPI is a fixed base
Laspeyres-type index with weights based on the 1995 figures of the national accounts. International
good practices recommend updating prices weights every five years.
Government Finance Statistics: The authorities publish central government and nonfinancial public
sector operation statistics based on the 1986 GFS Manual. It would be advisable for the authorities
to switch to the GFS 2001 method, and to improve the classification of expenditures and revenues.
In particular, it would be useful to report oil revenues and expenditures on gross bases and explicitly
show gross revenue from exports and domestic sales separately.
Monetary and Financial Statistics: Responding to a request from the Central Bank of Ecuador
(CBE), STA provided technical assistance in monetary and financial statistics (MFS) in December
2013. The main purpose of the mission was to re-establish the regular reporting of monetary data to
STA in compliance with international standards and using the standardized report forms (SRFs), for
publication in International Financial Statistics (IFS). As a result of this mission, in early 2014
Ecuador’s country page in IFS was reinstated with data for the central bank and other depository
corporations (ODCs). In the meantime, with remote support from STA, the CBE made progress in the
compilation of the other financial corporation’s (OFC) survey and is close to start reporting OFC data
to STA on a regular basis. Further technical assistance is foreseen to support the authorities in
achieving a comprehensive coverage of the OFC survey, and developing a balance sheet approach
matrix and macro-prudential indicators, both based on the information generated by the SRFs.

ECUADOR
INTERNATIONAL MONETARY FUND 9
External sector statistics: Balance of payment and international investment position (IIP) statistics
are compiled and disseminated by the CBE. As a SDDS subscriber, Ecuador also disseminates
monthly data on the Template on International Reserves and Foreign Currency Liquidity and
quarterly data on the SDDS prescribed external debt category. It was recommended to compile and
submit IIP data on a quarterly basis, but the authorities have no short-term plans of doing so
because of the lack of key source data. It is also recommended to improve the compilation of
private and public flows with nonresidents in the BOP, which at present are not fully distinguished
from transactions between residents affecting net international reserves (given the accounting
difficulties imposed by full dollarization).
II. Data Standards and Quality
The country is a GDDS participant since 1998.
However, most of its metadata, with the
exception of the real sector and
socio-demographic metadata, have not been
updated since October 2002. At the authorities’
request, STA has conducted an SDDS
assessment, providing a draft action plan that
could lead to SDDS subscription.
A data ROSC module was completed in
March 2003.
Reporting to Fund for Publication:
No high frequency data are reported for publication in International Financial Statistics (IFS). Ecuador
reports to STA quarterly balance of payments statistics as well as annual IIP data for publication in
IFS and the Balance of Payments Statistics Yearbook, although with delays.

ECUADOR
10 INTERNATIONAL MONETARY FUND
Ecuador: Table of Common Indicators Required for Surveillance
(As of August 31, 2015)
1 Any reserve assets that are pledged or otherwise encumbered should be specified separately. Also, data should comprise short-
term liabilities linked to a foreign currency but settled by other means as well as the notional values of financial derivatives to pay
and to receive foreign currency, including those linked to a foreign currency but settled by other means. 2 Both market-based and officially-determined, including discount rates, money market rates, rates on treasury bills, notes and
bonds. 3 Foreign, domestic bank, and domestic nonbank financing.
4 The general government consists of the central government (budgetary funds, extra budgetary funds, and social security funds)
and state and local governments. 5 Including currency and maturity composition.
6 Includes external gross financial asset and liability positions vis-à-vis nonresidents.
7 Daily (D); weekly (W); monthly (M); quarterly (Q); annually (A); irregular (I); and not available (NA).
8 This reflects the assessment provided in the data ROSC (published in March 2003, and based on the findings of the mission that
took place during April 2002). for the dataset corresponding to the variable in each row. The assessment indicates whether
international standards concerning concepts and definitions, scope, classification/sectorization, and basis for recording are fully
observed (O); largely observed (LO); largely not observed (LNO); not observed (NO); and not available (NA). 9
Same as footnote 8, except referring to international standards concerning (respectively) source data, assessment of sourcedata,
statistical techniques, assessment and validation of intermediate data and statistical outputs, and revision studies.
Date of
Latest
Observation
Date
Received
Frequenc
y of Data7
Frequency of
Reporting7
Frequency
of
Publication7
Memo Items:
Data Quality –
Methodologic
al Soundness8
Data Quality –
Accuracy and
Reliability9
International Reserve Assets
and Reserve Liabilities of the
Monetary Authorities1 7/30/15 8/5/15 W M M
Interest Rates2 7/30/15 8/5/15 M M M
Consumer Price Index 7/30/15 8/20/15 M M M
O, LO, O, LO LO, O, O, O, O
Revenue, Expenditure,
Balance and Composition of
Financing3 – General
Government4 June 2015 8/22/15 M M M
LO, LO, LO, O
LNO, LO, LO,
O, NO
Revenue, Expenditure,
Balance and Composition of
Financing3– Central
Government June 2015 8/22/15 M M M
Stocks of Central
Government and Central
Government-Guaranteed
Debt5 June 2015 8/22/15 M M M
External Current Account
Balance Q1 2015 6/31/15 Q Q Q
LO, LO, LO, LO
LO, LO, O, LO,
NO
Exports and Imports of
Goods and Services Q1 2015 6/31/15 M M M
GDP/GNP Q1 2015 6/31/15 Q Q Q
O, O, LO, LO
LO, O, O, O,
LO
Gross External Debt Q4 2014 3/31/15 Q Q Q
International Investment
Position6
Q4 2014 3/31/15 A A A

Statement by Otaviano Canuto, Executive Director for Ecuador, Pedro Fachada, Alternate Executive Director, and
Francisco Rivadeneira, Advisor to Executive Director September 25, 2015
1. On behalf of our Ecuadorian authorities, we thank staff for the productive dialogue during this year’s Article IV consultation and for the high-quality documents on the Ecuadorian economic and financial outlook. The authorities would like to convey in particular their appreciation for the engagement and effort of the mission chief. 2. Following last year’s off-site consultation, the mission team was able this year to meet in situ with all the relevant actors from the public and private sectors, as well as the academia. The authorities value the renewed partnership with staff and will continue to work with the Fund in a technical and mutually respectful manner. Economic Outlook 3. As the staff report highlights, the Ecuadorian economy has been hit in recent quarters by a series of unexpected, exogenous shocks. Some of those shocks were common to commodity exporters, but others were idiosyncratic in nature. Specifically, Ecuador has been strongly affected by the collapse in oil prices, which accounted in 2014 for roughly half of its export revenues, as well as by the reduction in international prices of most of its other relevant commodity exports. Some of the country’s main import markets have slowed down quite abruptly, as is the case of Russia and China. Finally, Ecuador is a dollarized economy and has therefore been impacted by the sharp appreciation of the dollar against most currencies, including the currencies of its two neighbors. 4. More recently, two country-specific events that have received far less attention in the staff report have further contributed to the deterioration of Ecuador’s economic outlook: (i) the entry into activity of the Cotopaxi volcano; and (ii) the El Niño phenomenon. Both occurrences are likely to have considerable negative effects on the domestic economy and on Ecuador’s exports. 5. The Cotopaxi volcano is located close to the capital in the Central Andean Region, an area that produces dairy and flowers, among other primary goods (Ecuador is the third largest flower exporter in the world). Among other major effects, the volcano’s activity has the potential to affect the water supply of Quito. 6. The El Niño threatens the coastal area with massive floods, where fishery and tropical agriculture are notable economic activities. Meteorologists are predicting that this El Niño season may be the worst on record. As staff highlights in Box 1 of the

2
Selected Issues Paper “Comparing Economic Effects of External Shocks, 2008-09 and 2014-15”, the rains and flooding caused by El Niño are expected to affect agriculture output and damage infrastructure. Although the authorities do not have an estimate of the potential costs, staff informs that, in 1997-98 (worst occurrence in the last two decades), it had a net negative effect on GDP in the 0.6-1.2 percentage point range and provoked losses above 2 percent of GDP. 7. The authorities have been working intensively since the beginning of the year to increase the resilience of the economy to these adverse shocks and mitigate their effects. In light of the circumstances, they are mindful that the economy will decelerate substantially in 2015, but they expect some pickup during 2016. They see staff’s forecasts for GDP growth next year (0.1 percent) as somewhat on the pessimistic side. Fiscal Policy 8. In recent years, Ecuador has maintained a prudent fiscal stance, as attested by the fact that total public debt closed 2014 at around 30 percent of GDP, one of the lowest in the world. It is true that, between 2011 and 2014, available fiscal space was used and the fiscal deficit widened as a result of social and capital spending. However, the authorities are fully aware that the new international scenario requires significant narrowing of the public deficit. Partly, this will be accomplished through a reduction in capital spending, as most of the ongoing investment projects will be over next year. 9. The 2015 budget has already included measures to reduce current spending (for instance, suspension of the wage increases previously planned and diminution of the highest salaries in the civil service). The 2016 budget, currently in elaboration, will propose additional cuts in current spending and rationalization of certain subsidies. The budget, however, will need to take into account potential spending pressures stemming from the Cotopaxi volcano and the El Niño. In any case, the authorities are committed to do whatever is necessary to ensure a more balanced fiscal position. 10. The authorities are convinced that financing the 2015 and 2016 public deficits will not be difficult. Ecuador intends to continue to access international capital markets as a source of financing, complementing the support already received from multilateral financial institutions. A cornerstone in Ecuador’s relation with the international community will be reached in December, with the payment of the maturing 2015 bond. The authorities are confident that this payment will lead to a very significant reduction of the country’s sovereign risk.
3
Dollarization and Financial System 11. The authorities want to emphasize that they are committed to and will maintain the current monetary regime. They are cognizant of the extremely negative impact that a de-dollarization process would have on the domestic economy, on the stability of the financial system, and especially on the Ecuadorian population. 12. In a dollarized economy, safeguarding the liquidity of the banking system is a permanent challenge. As mentioned in the staff report, the banking system has faced a liquidity crunch in recent months and the Central Bank of Ecuador is closely monitoring the situation. Nonetheless, the banking system is essentially sound, well-capitalized and profitable. Non-performing loans (NPL) are low for international standards and there is no risk whatsoever of a systemic crisis. Additionally, banking regulation and supervision have been substantially strengthened in recent years. 13. As the staff report mentions, the government has taken several measures to facilitate capital inflows. For instance, by eliminating the tax on transfers associated with certain bank loans with maturity above one year. The authorities stand ready to adopt new initiatives if global risk aversion escalates and international financial conditions worsen. 14. The authorities reaffirm their commitment to fighting money laundering and the financing of terrorism. Progress in this area has been substantial, especially in criminalizing money laundering and terrorist financing, establishing procedures to identify and freeze terrorist assets and confiscate funds related to money laundering, and improving coordination among financial sector supervisors, as recognized by the Financial Action Task Force (FATF) earlier this year. Competitiveness, Infrastructure and Private Investment 15. The recent appreciation of the dollar has affected the competitiveness of the Ecuadorian economy. Given the lack of exchange rate flexibility, the government has been working to boost the country’s competiveness through structural reforms and infrastructure investment. As mentioned in the report, the government has invested heavily to eliminate infrastructure bottlenecks, particularly in the areas of transportation (highways, maritime ports, airports, multimodal logistics, among others), technology (fiber optics, cellular communication) and energy (renewable – hydroelectric, solar and wind – as well as nonrenewable – oil and gas). 16. The authorities continue to promote Public-Private Partnerships (PPP) as a mechanism to boost investment. Local and foreign private investors are actively participating in the development of projects in strategic sectors.

4
17. The Ecuadorian government does not accept the notion that competitiveness can be gained by paying lower salaries to the work force. This is the main reason why the authorities have strived to increase the salary level up to a point where a household can acquire the basic basket of goods. Needless to say, the authorities are mindful that salary increases must essentially reflect productivity gains. The wage policy going forward will take into account productivity and inflation developments.
18. For the longer term, the government has developed a strategy to change the country’s productive matrix. The objective is to move towards higher value-added products and develop the services sector. If in the short term the authorities aim to develop sectors that have comparative advantage such as the agro-industrial sector, in the long term there is a clear strategy to move to knowledge-intensive sectors such as biotechnology.
19. It is worth emphasizing that, independently of the current commodity prices cycle, Ecuador has a huge potential in the mining sector. This is particularly true for copper, gold and silver. The increase in output of these metals will provide new significant resources to the state and reduce the relative importance of oil in the Ecuadorian economy.
20. Foreign markets access is a priority in the government’s strategic vision. There are several ongoing negotiations of trade agreements. This is the case of the trade agreement with the European Union, which is expected to come into force in the second half of 2016. Ecuador has also begun negotiations with South Korea and with European Free Trade Association (EFTA) countries. Finally, the government is strengthening its ties with Central America, having concluded a trade agreement with Guatemala and started negotiations with El Salvador, Nicaragua and Honduras.