illness related to metam-sodium in arvin, california, 2002 · illnesses related to shank...
TRANSCRIPT
This electronic prepublication version may contain typographical errors and may be missing artwork such as charts, photographs, etc. Pagination in later versions may differ from this copy; citation references to this material may be incorrect when this prepublication edition is replaced at a later date with the finalized version.
REVIEWS, CASE HISTORIES
Illnesses Related to Shank Application of Metam-Sodium, Arvin, California, July, 2002
Michael O' Malley, MD, MPH Terrell Barry, PhD Mario Ibarra, BS
Marylou Verder-Carlos, DVM, MPVM Louise Mehler, MD, PhD
ABSTRACT. Objectives: To evaluate the health effects of methyl isothiocyanate (MITC) and other byproducts resulting from the soil-incorporated (shank) application of 25,000 pounds of metam-sodium on July 8, 2002, near the community of Arvin, California.
Methods: Residents in a four-block area were interviewed regarding eye and upper respiratory irritation, non-specific systemic symptoms, and lower respiratory complaints. The distribution of cases was compared to results of Industrial Source Complex (ISC3) air dispersion modeling for the metam-sodium byproduct, methyl isothiocyanate (MITC). The 1-hour 200 ppb no-observed-ef-fect-level (NOEL) and 800 ppb lowest-observed-effect level (LOEL) from a previous human eye irritation study were used to interpret the results of the air modeling estimates. Peak concentrations were compared to the 4-minute NOEL of 600 ppb and the LOEL of 1.9 ppm.
Results: Two-hundred-fifty-two cases of irritant, non-specific systemic, and respiratory symptoms were associated with the metam-sodium application. These included 178 community residents or visitors and 74 employees of a carrot packing operation located in the affected neighborhood of Arvin. The most severe reported illness occurred in a community visitor with a history of pre-existing pulmonary disease, who was hospitalized for a week with respiratory distress. ISC3 Modeling indicated
_________________________________________________________________________________________ Michael O'Malley is affiliated with the University of California Davis, Employee Health Services and Worker
Health and Safety Branch, California Department of Pesticide Regulation. Mario Ibarra is affiliated with the Pesticide Use Enforcement Branch, California Department of Pesticide Regu-
lation. Terrell Barry is affiliated with the Environmental Monitoring Branch, California Department of Pesticide Regulation. Marylou Verder-Carlos and Louise Mehler are affiliated with the Worker Health and Safety Branch, California
Department of Pesticide Regulation. Address correspondence to: Michael O'Malley, MD, MPH, University of California Davis, Employee Health
Services, 501 Oak Avenue, Davis, CA 95616 (E-mail: [email protected]). This work funded in part under a consulting contract between the California Department of Pesticide Regulation
and the University of California, Davis. The authors gratefully recognize the assistance and expertise of Dave Kim in preparing the map graphics for this article.
Journal of Agromedicine, Vol. 10(4) 2005 Available online at http://www.haworthpress.com/web/JA
© 2005 by The Haworth Press, Inc. All rights reserved. doi:10.1300/J096v10n04 06 27

28 JOURNAL OF AGROMEDICINE
1-hour MITC concentrations in the affected community ranged from 0.8-1.0 ppm, in the range of the LOEL, with peak concentrations between 2.4 and 3.2 ppm.
Conclusion: Estimated MITC concentrations during the episode exceeded both the 4-minute NOEL and 1-hour NOEL by approximately four fold. The high concentrations of MITC present in the affected neighborhood may have been partially attributable to failure to immediately complete a required post-application water-treatment on 15 of the 100 treated acres. However, because of the limited area involved, the violation was unlikely to have accounted for the entire incident. Similar episodes may oc- cur when metam-sodium fumigants are used adjacent to other rural communities. [Article copies avail-able for a fee from The Haworth Document Delivery Service: 1-800-HA WORTH. E-mail address: <docdelivery@ haworthpress.com> Website: <http://www.HaworthPress.com> © 2005 by The Haworth Press, Inc. All rights reserved.]
KEYWORDS. MITC, fumigant, metam-sodium, eye irritation, respiratory illness
INTRODUCTION
Degradation products of metam-sodium have been demonstrated to cause repeated ill-ness episodes following applications near rural communities. Between 1987 and 2000, the California pesticide illness registry identified eight episodes following sprinkler applications of metam-sodium and six episodes involving soil incorporated (shank) applications.1 A sprinkler application of metam-potassium was also associated with a cluster of 17 probable cases of eye, and respiratory irritation in 2003 in the inland Southern California agricultural community of Coachella.2 A cluster of off-site occupational exposures also occurred in June 2002 involving 138 Kern County field workers scheduled to girdle vines, pull leaves, and tip bunches in a vineyard adjacent to a sprinkler application of metam-sodium.3
For the principal degradation product, methyl isothiocyanate (MITC), experimental human data demonstrate an 800 ppb 1-hour lowest-ob- served-effect-level (LOEL) and 200 ppb no-observed-effect-level (NOEL) for eye irrita-tion. The geometric mean odor threshold is 1700 ppb and the 4-minute LOEL for eye irrita- tion is 1900 ppb. Because the experimental study excluded breathing zone exposure, no data on MITC respiratory irritation thresholds are available.4 A similar study evaluated irrita-tion thresholds for the fumigant chloropicrin, but included both respiratory and ocular end-points. Ocular irritation occurred at chloropicrin concentrations that did not cause nasal irrita-tion or changes in pulmonary function mea-sured by forced expiratory volume in 1 second
(FEV1).5 Both studies specifically excluded individuals with possible sensitivity to envi-ronmental irritants, including subjects with asthma or upper respiratory allergies.
In illness episodes associated with metam-sodium, ocular and respiratory effects have typically occurred simultaneously.1 Although the ocular irritation typically has a short dura-tion, respiratory irritation may cause persistent reactive airways.6
This report describes a cluster of commu-nity ocular and respiratory illness following a soil incorporated (shank) application of metam-sodium that occurred in July 2002 near the Kern County community of Arvin, California. Relevant background on the community, initial information on the outbreak and emergency response are discussed along with case classification and modeling methods. The relationship between ocular irritation and respiratory effects in subjects with pre-existing pulmonary problems is also discussed based upon case information from this episode.
METHODS Community Background
Arvin is located in the southeastern corner of the San Joaquin Valley. With an elevation of 445 feet, it is adjacent to the Tehachapi foot-hills, but part of the valley floor. Bakersfield is approximately 21 miles north and west.
Edmundson Acres lies approximately 1/2 mile north of the eastern end of the community of Arvin (Figure 1). The Edmundson neighbor-hood is primarily residential, but there is a

Reviews, Case Histories 29 FIGURE 1. Edmundson acres neighborhood shown in relationship to other areas of Arvin.
packing shed in the neighborhood, located on Barbara street operated by a farming company that grows carrots in a field just to the east of the Judith, the other main street in the neighbor-hood.
The Edmundson population is not specified in the 2000 census information, but the neigh-borhood represents approximately 5% of the populated area of Arvin, proportionately repre-senting an estimated 650 residents. No data are
available on the neighborhood ethnic composi-tion, but the Arvin community as a whole is 87.5% Hispanic. Approximately 47% are em-ployed in agriculture.7 Employment is seasonal and annual unemployment runs as high as 27%.8 The median household income for Arvin is $23,674, compared to $47,493 for California as a whole and $41,994 for the entire U.S.9
No specific information was located regard- ing health insurance coverage for the commu-

30 JOURNAL OF AGROMEDICINE nity. Statewide and regional data indicate that between 12% and 25% of California farmworkers have employer provided health insurance, with some additional coverage provided to family members by publicly funded insurance.10 There is a community clinic in Arvin, with three family doctors, open 8 a.m. to 7 p.m., a branch of a larger community clinic located in Lamont, eight miles north and west of Arvin, open six days a week. According to clinic staff, the average wait time for a scheduled appoint-ment at the clinics is approximately two weeks. For the uninsured, a sliding fee scale is used, based on family size and family income. The nearest 24-hour emergency services are in Bakersfield, approximately 23 miles from the center of Arvin.
Incident Background and Emergency Response
A timeline detailing the sequence of events during the incident and the subsequent investi-gation is shown in Table 1.
During the afternoon and early evening of July 8, 2005, a few residents of the Edmundson began experiencing eye and throat irritation (noted at subsequent interview). At 9:16 p.m., a resident on Judith Street called 911, reporting that her four children were vomiting, crying and experiencing eye irritation. She was unable to identify a reason for their symptoms. A tow truck driver called at 9:23 p.m. regarding a pos-sible chemical spill at the packing shed and an additional resident of Judith called at 9:3 l p.m.
TABLE 1. Investigation timeline
July 8, 2002-metam sodium application, index case hospitalized, initial Kern County investigation August-September, 2002-additional complaints received
September 10, 2002-community meeting and interviews
Sept 10-12, 2002-community interviews
September 2002-February 2004-collection and review of incident medical records, community complaints; modeling of MITC exposure from incident using ISC3 model, correlation of MITC iso-concentration map with case incident data and preparation of graphics.
to report a chemical odor that was causing his eyes to water. Statements from packing shed crew supervisors indicated that evening shift workers began experiencing eye irritation shortly after 9 p.m. Some went into the neighborhood to look for the source of the problem.
Emergency response records indicate that fire department paramedics arrived in the neighborhood at 9:21 p.m., finding 30-40 resi-dents in the streets complaining of odor, and ir-ritation of the eyes and throat. Because of the number of people affected, the paramedics re-quested assistance from a local ambulance company. Two persons were examined and one transported to Mercy Hospital in Bakersfield because of difficulty breathing.
Investigation of the neighborhood environ-ment did not identify a roadway spill or a leak of hazardous material that could have caused the residents complaints. Fire Department emer-gency crews and maintenance staff from the carrot shed reported that there was no leaking of the chlorine used on the site. Contact was made with the Kern Department of Environ-ment Health and the Kern Department Agricul-ture. Agricultural sites evaluated included an almond orchard northwest of the neighborhood (treated with Omite and Lorsban on July 6, 2002) and a vineyard located west of the neigh-borhood (treated with Omite and Sulfur on July 5, 2002).
Metam-Sodium Application
The possible cause of the symptoms in the
community residents was identified in review-ing the application history of the field immedi-ately east of Edmundson Acres. One hundred fallow acres (30 acres of potatoes in the north section of the field and 70 acres of carrots in the south section of the field) located directly east of Judith Street were treated for weeds and nematodes July 8, the day of the incident, be-tween 7:45 a.m. and 3:20 p.m., with 60 gallons per acre of Vapam HL (4.26 pounds of metam sodium/gallon). The total amount of active in-gredient applied was 25,560 pounds. The ap-plicator reported that 20 acres along the west-ern edge of the field were not treated in order to comply with the 500-foot buffer zone required between the edge of the treated area and the

Reviews, Case Histories 31 nearest homes on Judith. Additional safety measures included an irrigator certified in the performance of post-application water treat-ments (February 2002) and a crew member cer-tified on the same date to do post-application odor monitoring. Near residential areas, permit conditions specified at least 12 hours of post-application monitoring.
The application was made from a plastic tank mounted on the front a tractor and dis-persed below the surface through a triple row of shanks mounted behind (Figure 2). A bar at-tached to the last row of shanks covered the shank lines with soil to form a cap. The product technical bulletin requires application of a 1/2" layer of water immediately following metam-sodium treatment to reduce the rate of flux (rate of off-gassing or off-site movement) of MITC and other metam-sodium byproducts. On July 8, for the southernmost 15 acres of the carrot field, the grower's sprinkler irrigation crew was unable to keep up with the metam-sodium application crew. The shank application was completed at approximately 3:20 p.m.; the required watering-in process was not completed until 6:30 p.m.
Weather station records indicate that the wind was from the southwest between 7 a.m. (8) and 7 p.m. (6) when it shifted to blow from the east. At midnight, the wind direction shifted again, blowing from north-northeast. Wind speed was less than 10 mph through out the day, and dropped from 4.3 mph at 7 pm to 1.3 mph at
FIGURE 2. Shank application equipment used for making the July 8, 2002, application at Edmundson Acres. Typical application depth is 6-16 inches be- low the soil surface.
midnight. A plot of wind direction versus time is shown in Figure 3a.
The fumigation summary for the metam-so-dium application indicated no off-site odor monitoring was noted during the application (7:45 a.m-3 p.m.). At 5 p.m., 7 p.m., and 8 p.m. on July 8 and at 12:30 a.m. on July 9, post-ap-plication monitoring records indicated the ab-sence of odor. No odor monitoring was re-corded between 8 p.m. and 12:30 a.m. when most of the community residents reported experiencing symptoms. Fumigant Applications to the Field During 2001
For reference, pesticide use records indi-cated that 40 acres of the field east of Judith were treated on April 20, 2001, with metam-so-dium between 9 a.m. and 3 p.m. at a rate of 58 gallons/acre. During the application, the wind was predominantly from the west and from the northwest, but began blowing from the south and southwest after 9 p.m. (Figure 3b). On April 23, 2001, 10 acres were treated between 8 a.m. and 10 a.m. with metam-sodium, at a rate of 40 gallons/acre. During the application, the wind came from the south, southwest and north, but came from the southeast and south after 9 p.m (Figure 3c). On July 9, 2001, 67.5 acres of the field were treated with 12 gallons (114 pounds of active ingredient)/acre of dichloropropene (TeloneTM); 36.5 acres were treated July 16 with a similar application of dichloropropene. FIGURE 3a. Source of wind direction versus time, Edmundson Acres, July 8, 2002, based upon data from Arvin-Edison California Irrigation Management Information System (CIMIS) station (Station #125). The application occurred between 7:45 a.m. and 3:20 p.m. ; Kern County Fire Department responded to calls from community residents between 9 p.m. and 10 p.m.
Ho,& Pacific daylight time
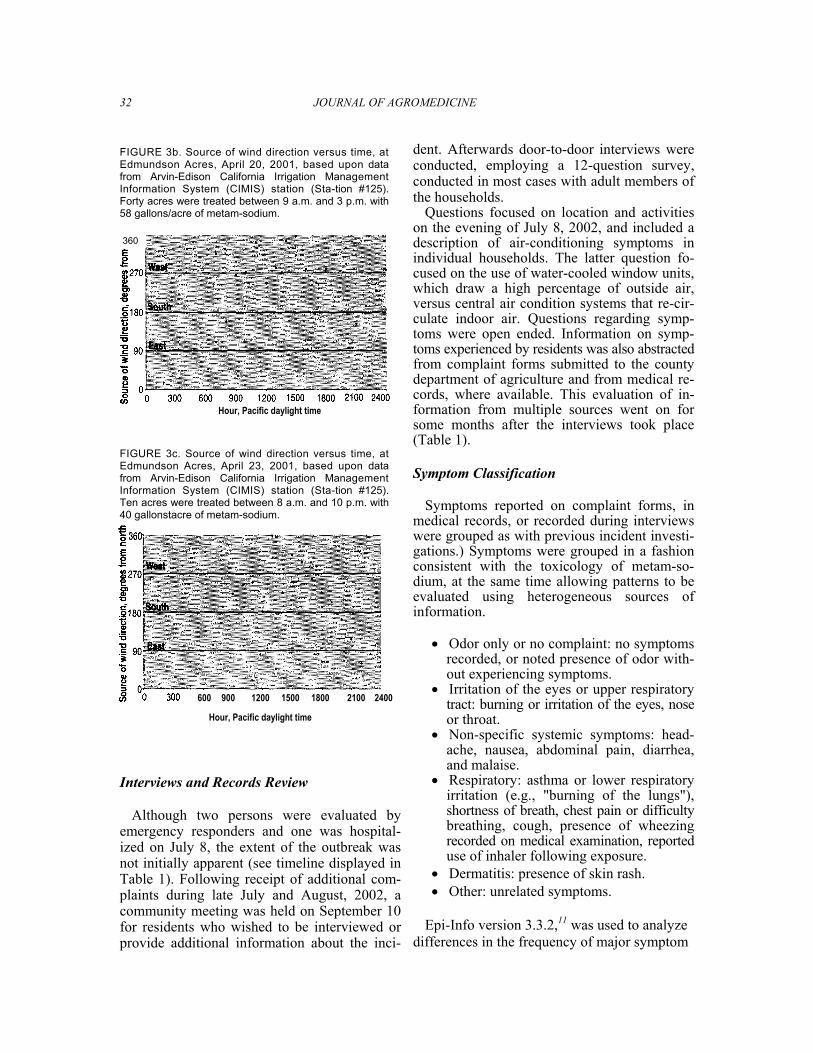
32 JOURNAL OF AGROMEDICINE FIGURE 3b. Source of wind direction versus time, at Edmundson Acres, April 20, 2001, based upon data from Arvin-Edison California Irrigation Management Information System (CIMIS) station (Sta-tion #125). Forty acres were treated between 9 a.m. and 3 p.m. with 58 gallons/acre of metam-sodium.
360
Hour, Pacific daylight time
FIGURE 3c. Source of wind direction versus time, at Edmundson Acres, April 23, 2001, based upon data from Arvin-Edison California Irrigation Management Information System (CIMIS) station (Sta-tion #125). Ten acres were treated between 8 a.m. and 10 p.m. with 40 gallonstacre of metam-sodium.
600 900 1200 1500 1800 2100 2400
Hour, Pacific daylight time Interviews and Records Review
Although two persons were evaluated by emergency responders and one was hospital-ized on July 8, the extent of the outbreak was not initially apparent (see timeline displayed in Table 1). Following receipt of additional com-plaints during late July and August, 2002, a community meeting was held on September 10 for residents who wished to be interviewed or provide additional information about the inci-
dent. Afterwards door-to-door interviews were conducted, employing a 12-question survey, conducted in most cases with adult members of the households.
Questions focused on location and activities on the evening of July 8, 2002, and included a description of air-conditioning symptoms in individual households. The latter question fo-cused on the use of water-cooled window units, which draw a high percentage of outside air, versus central air condition systems that re-cir-culate indoor air. Questions regarding symp-toms were open ended. Information on symp-toms experienced by residents was also abstracted from complaint forms submitted to the county department of agriculture and from medical re-cords, where available. This evaluation of in-formation from multiple sources went on for some months after the interviews took place (Table 1). Symptom Classification
Symptoms reported on complaint forms, in medical records, or recorded during interviews were grouped as with previous incident investi-gations.) Symptoms were grouped in a fashion consistent with the toxicology of metam-so-dium, at the same time allowing patterns to be evaluated using heterogeneous sources of information.
• Odor only or no complaint: no symptoms recorded, or noted presence of odor with-out experiencing symptoms.
• Irritation of the eyes or upper respiratory tract: burning or irritation of the eyes, nose or throat.
• Non-specific systemic symptoms: head-ache, nausea, abdominal pain, diarrhea, and malaise.
• Respiratory: asthma or lower respiratory irritation (e.g., "burning of the lungs"), shortness of breath, chest pain or difficulty breathing, cough, presence of wheezing recorded on medical examination, reported use of inhaler following exposure.
• Dermatitis: presence of skin rash. • Other: unrelated symptoms.
Epi-Info version 3.3.2,11 was used to analyze
differences in the frequency of major symptom

Reviews, Case Histories 33
patterns (described below) for subjects inter-viewed directly and those for whom only proxy information was available. Possible risk fac-tors or factors that appeared to prevent illness identified from descriptive information, in-cluding the presence or absence of outdoor ac-tivities on the afternoon and evening of July 8, 2002, and residence in a home with central air conditioning. Both were coded from informa-tion on questionnaires and complaints. De-scriptive analyses and crude odds ratios were presented for both outdoor activities and for use of central air conditioning. Interactions be-tween risk factors were evaluated using both stratified analysis and logistic modeling. Air Modeling Methods
We estimated MITC concentrations during the incident using the Industrial Source Com-plex Short Term Version 3 (ISC3) dispersion model. 1² ISC3 inputs include the dimensions and orientation of the treated field and the sur-rounding area, the MITC emission rate (flux), and the weather during the incident. Atmo-spheric stability, categorized based upon the wind speed, solar radiation, and amount of cloud of cover,13 affects the degree of vertical contaminant diffusion. The ISC model uses the six Pasquill-Gifford stability classes, A through F. Stability class A represents the greatest de-gree of vertical mixing while stability class F represents the least. In descriptive terms, class F, which occurs at night under clear skies and low wind speeds, is characterized by limited horizontal dispersion of air contaminants and an atmospheric inversion layer limiting verti-cal dispersion.
The section below details data used in mod-eling the Arvin episode.
Field dimensions: For purposes of the mod-eling the Arvin incident, the treated area (30 acres of the north field, 70 acre of the south field) was simplified to a rectangle. Because of the large size of the treated area relative to the area of deviation, the approximation of the shape of the field did not significantly alter the results.
Flux: Flux is the rate of transfer of MITC across the soil surface into the air. The 34 µg MITC/m²/sec flux occurring between 6:30 p.m. and 11 p.m. associated with an 80-acre
shank application (described by Merrick14) was used to estimate flux for the Arvin incident, adjusted for the difference in rates of the two applications. At Arvin the 256 lbs Metam so-dium/acre rate was 1.6 times the 160 lbs/acre application rate used in the Merrick study. The flux used for the Arvin simulations was there-fore 54 µg/m2/sec.
Weather data: Information from the Arvin-Edison California Irrigation Management In-formation System (CIMIS) station (Station # 125), approximately three miles from the treated field, was used to represent the weather conditions during the incident (Table 3). Be-cause the terrain between the treated field and station is flat and open, it is reasonable to as-sume that the weather conditions differed very little between the two sites.
Stability class information: On July 8, 2002, sunset was at 8:13 p.m. Until 8 p.m. the wind di-rection was away from the residential area. Be-tween 8:01 p.m. and 9 p.m., the wind direction TABLE 3. Hourly weather data for July 8, 2002, from the Arvin-Edison California Irrigation Management Information System (CIMIS) station (Station #125)
Pacific Daylight Time (end of hour)
Air Temp °F
Wind Speed MPH
Wind Direction -° clockwise from north
Stability Class
7:00 AM 67 2.1 54.1 D 8:00 AM 72.9 3 298.4 C 9:00 AM 75.1 2.7 284.1 B 10:00 AM 77.4 5.8 245.2 B 11:00 AM 78.9 8.7 233.5 B 12:00 PM 80.6 7.5 236 B 1:00 PM 83 6.6 244.8 B 2:00 PM 85.2 5.6 248.4 A 3:00 PM 873 5.3 246.3 A 4:00 PM 89.3 4.4 225.2 A 5:00 PM 90.4 5.1 241.6 B 6:00 PM 91 4.7 233.6 B 7:00 PM 90.4 5.3 228.1 C 8:00 PM 88.5 4.3 213.5 D 9:00 PM 816 2.8 120.3 E 10:00 PM 79.8 2.9 99.3 F 11:00 PM 77.2 3.4 84.4 F 12:00 AM 77.4 3.6 88.1 F
1:00 AM 72.9 1.3 19.7

34 JOURNAL OF AGROMEDICINE
shifted, becoming southeasterly, blowing across the treated field directly towards the residential areas on Judith and Barbara streets. In addition, both the temperature and wind speed dropped, indicating the potential presence an inversion layer (the layer of air near the surface is cooler than the air above, leading to little or no vertical mixing) as the sun set over the next two hours. By 9 p.m. hrs the Pasquill stability class was F, highly stable. An easterly wind persisted to-wards Judith and Barbara streets until mid-night.
Peak-to-mean estimation techniques de-scribed by Hino15 were used to obtain estimates of air concentrations over shorter averaging pe-riods (e.g., 3-minutes and 1-minute) than those available from the ISC3 model. Application of the technique to estimation of MITC air con-centrations is described more fully elsewhere.1
Data on Other Air Pollutants
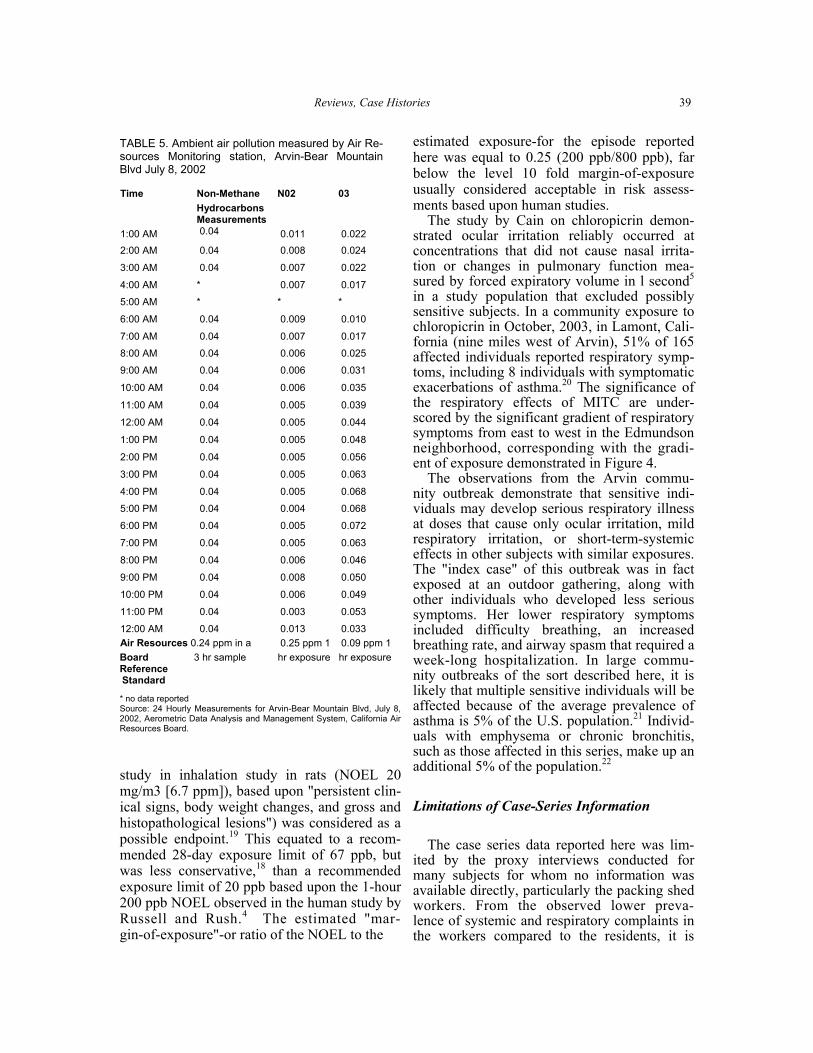
Information on hourly measurements of am-bient air pollution made at the Arvin-Bear Mountain Boulevard monitoring station for July 8, 2002, were obtained from the Aerometric Data Analysis and Management System of the California Air Resources Board (ARB). Avail-able information included measurements of ozone, nitrogen oxides, and non-methane hy-drocarbons.16 These were compared to ambient air quality standards published by the ARB.17
RESULTS Illness Reports and Sources of Information
Information was available on a total of 199 Edmundson Acres residents and visitors (re-ferred to as Edmundson residents in discussion below): 114 (95%) were interviewed, filed complaints or had hospital records, and 85 (57.3%) had symptoms reported only through a proxy interview or proxy complaint (Table 2). In the 157 individual residents (78.9%) for whom age information was reported, ages ranged from 4 months to 94 years of age. The mean age was 27.6 years and the median age 20 years. In the group for whom ages were re-ported, 61 (73.5%) of the 83 subjects under 20 years of age had only proxy information avail-
TABLE 2. Record sources used for categorizing cases Information source Packing Community Total
shed residents workers
Complaint 6 22 28 Interview 0 34 34 Interview + complaint 0 48 48 Interview + proxy complaint 0 8 8 Medical record, proxy 0 1 1 complaint Medical record + 0 1 1 Interview + complaint Total direct interview, 6 114 120 complaint or medical record
68 55 123 Proxy interview 0 6 6 Proxy interview + proxy 0 26 26 complaint Total proxy interview/ 68 87 155 proxy complaint
Total 74 201 275 able, compared to 20 (27.0%) of the 74 subjects 21 years or older. Specific age information was missing in 38 (33.3%) of those directly inter-viewed or filing complaints, but only on 4 (4.7%) of the subjects with only proxy information available.
With probable ethnicity based upon sur-name, 146 (73.4%) were Hispanic and the re-maining subjects were identified as white, non-Hispanic, black; or Filipino; 99 (49.7%) were male and 100 (50.3%) female. Symptom Patterns
Of the entire group, 178 (89.4%) had symp-toms beginning on July 8, 2002, compatible with the effects of MITC. Twenty-one resi-dents reported no symptoms. Two additional residents were members of households where others were ill, but it could not be ascertained from the proxy information whether or not they had symptoms.
Of the 178 subjects with compatible symp-toms, 173 subjects (97.2%) had either ocular or upper respiratory irritation (burning/tearing

Reviews, Case Histories 35 eyes, sore throats). There was no significant difference in the prevalence of these symptoms in the 73 subjects (100%) interviewed directly and the 105 subjects (95.2%) whose symptoms were recorded by proxy interview or proxy complaint.
Non-specific systemic complaints (e.g., headaches, vomiting, and nausea) were re-corded in 73 (40.2%) of all 179 subjects with compatible symptoms. These symptoms were reported in 43 (43.9%) of the 98 subjects who filed complaints or were directly interviewed, compared with 30 (37.5%) of the 80 subjects with symptoms recorded only from proxy in-terviews or proxy complaints, a difference that was not significant statistically.
Symptoms potentially representing asthma or lower respiratory irritation (e.g., cough, shortness of breath, wheezing or chest pain) were reported by 33 subjects (18.5% of all symptomatic subjects). These included 17 (21.9%) of the 98 subjects interviewed directly and 16 (20.0%) of the 80 subjects with only proxy information. Specific symptoms in the subjects with respiratory complaints included dyspnea (coded as positive for patients report-ing difficulty breathing, chest pain, or noting "burning" in the lungs or chest distinct from burning in the nose or throat) in 28 subjects (84.8%), cough in 7 subjects (21.2%), and ex-acerbations of asthma or smoking-related sub-jects (chronic obstructive pulmonary disease or COPD) in 5 subjects (15.1%).
The available details on the asthma/COPD cases are given below. Limited information is available on three cases:
• A 9-year-old child, with pre-existing asthma, developed a cough at the time of the inci-dent, but did not receive any formal medi-cal evaluation.
• A 41-year-old asthmatic reported that she required additional doses of her inhaler and sought treatment at a community clinic located in a nearby town several days after the incident.
• A 94-year-old woman with emphysema experienced eye irritation along with some shortness of breath that required more than her usual amount of supplemental ox-ygen.
The two cases for which medical records
were available for review, the most serious documented illnesses associated with the out-break, both involved significant exacerbation of pre-existing lung disease:
A 63-year-old woman with a history of asthma and diabetes, also sought treatment four days after the incident for a persistent aggrava-tion of her respiratory problems, requiring use of supplemental oxygen. She had a respiratory rate of 20 (normal < 16) but did not require use of her accessory respiratory muscles. Auscultation of the lungs demonstrated poor air entry and she had wheezing in all lung fields. Her pulmo-nary function tests demonstrated reduction in air flow FEV 1 (34% of predicted) and vital ca-pacity (54% of predicted). She was improved at a follow-up visit 2 weeks later, although she still required treatments with a fluticasone/ salmeterol inhaler twice daily.
A 68-year-old woman with a history of em-physema that required no supplemental oxygen and only intermittent use of inhaled albuterol attended an evening family gathering outdoors on Judith Street on July 8. About 9 p.m., she and others at gathering began to suffer eye irrita-tion. She also developed nausea and marked trouble breathing. At the time paramedics ar-rived a little after 9 p.m., she was in sufficient distress to be transported to a Bakersfield hos-pital. On arrival in the hospital emergency de-partment on 2 L of supplemental oxygen, her O2 saturation was 92%, she had tachycardia, a respiratory rate of 22 breaths/minute, and she had diffuse wheezing. The wheezing re-sponded initially to nebulized albuterol and a dose of intravenous solumedrol. However, be-cause she was unable to ambulate without marked respiratory distress, she was admitted to the hospital for additional treatment. She re-mained in the hospital for a week receiving bronchodilators and steroids. She still required treatment with supplemental oxygen at the time of her discharge on July 16, 2002. This respira-tory illness was the "index case" of the out-break that prompted the initial limited investi-gation by the local department of agriculture.
Ten additional persons reporting illnesses from the same address had less severe symp-toms. These included eye and upper respiratory irritation, as well as headache, nausea and vom-iting. Four of the 10 reported either chest pain

36 JOURNAL OF AGROMEDICINE or "raspy breathing" the day of the incident, but did not have any reported medical treatment. Treatment
Although details were available only for the two subjects describe above with the most seri-ous respiratory symptoms, 11 of the ill Edmundson residents or visitors reported re-ceiving medical treatment. These included 6 (18.2%) of the 33 subjects with respiratory symptoms and 7 (9.6%) of the 73 subjects with systemic symptoms. No subjects reported seeking treatment among the 87 community residents or visitors with isolated irritant symp-toms. A multivariate analysis confirmed that treatment appeared very significantly related to respiratory symptoms (odds ratio for seeking treatment = 6.1, p = 0.005) but not systemic symptoms (odds ratio for seeking treatment = 2.6, p = 0.15). Air Conditioning and Outdoor Activities
Suggestive anecdotal information regarding possible risk factors was found in several cases. These included for example, a 48-year-old resi-dent of Judith Street, who experienced burning and tearing of her eyes while she was inside her home. The symptoms became worse after turn-ing on the window air conditioner unit and still worse after going outside. Other residents as-cribed a possible protective effect to central air conditioning.
Among the 199 Edmundson residents whose illness status was known, there were 71 (35.7%) who reported at least brief outdoor ac-tivities on July 8 and 38 (19.1%) residing in homes reported to have central air conditioning rather than window air condition units.
Of the subjects with air conditioning, 28 (73.7%) had symptoms compatible with expo-sure to metam-sodium byproducts compared to 150 (93.2%) of the subjects without central air conditioning (Risk ratio 0.79, risk difference - 19.5%, odds ratio 0.21, p = 0.0015 by Fisher's exact test). For those with at least some reported outdoor activity on July 8, 66 (93%) had compatible symptoms, compared with 112 (87.5%) of those who did not (risk ratio, 1.06, odds ratio 1.9, risk difference 5.5%, p = 0.17 by Fishers' exact test).
When both factors were evaluated in a strati-fied analysis, the air conditioning effect was not significant for the 71 residents who reported outdoor activity (risk ratio = 0.89, risk difference = -10.3 %, odds ratio 0.25, p = 0.15, by Fisher's exact test). However, central air conditioning appeared significantly protective among the 128 who did not report outdoor ac-tivities (risk ratio = 0.64, risk difference = -33.1 %, odds ratio 0. 13, p = 0.0012 by Fisher's exact test). When both factors were evaluated together in a logistic regression model, the ad-justed odds ratio for central air conditioning was 0.15 (p = 0.0003). The adjusted odds ratio for outdoor activity was 3.07, but was still of only borderline significance (p = 0.0552). Symptom Patterns by Distance from Treated Field
The frequency of irritant symptoms did not differ significantly between the 108 residents of Judith (n =97, 89.5%) and the 91 residents of Barbara (n = 76, 83.5%). There was a greater, although non-significant, difference in the fre-quency of systemic symptoms: n = 44, 40.7% for Judith residents and n = 29, 31.9% for Barbara residents (odds ratio= 1.47, risk ratio= 1.3, risk difference = 8.9%, p = 0.13, by Fisher's exact test). Respiratory symptoms showed a significant difference between the two streets: n = 25, 23.1% for residents of Ju-dith, and n = 8, 8.8% for residents of Barbara (odds ratio = 3.1, risk ratio = 2.6, risk difference = 14.4%, p = 0.005 by Fisher's exact test). Illnesses in Packing Shed Workers
In addition to the illnesses in community res-idents on July 8, there were reports of 74 cases of MITC-compatible illness in employees of a carrot packing shed located on Barbara Street. These included six direct complaints filed by plant supervisors and 68 reported by proxy. Al-though the workers were adults, no information on individual ages was available. The group re-sembled community residents in probable eth-nicity based on surname: 77.7% were Hispanic. One packing shed worker resided in Edmundson Acres, on Judith Street. The re-maining workers lived in other sections of
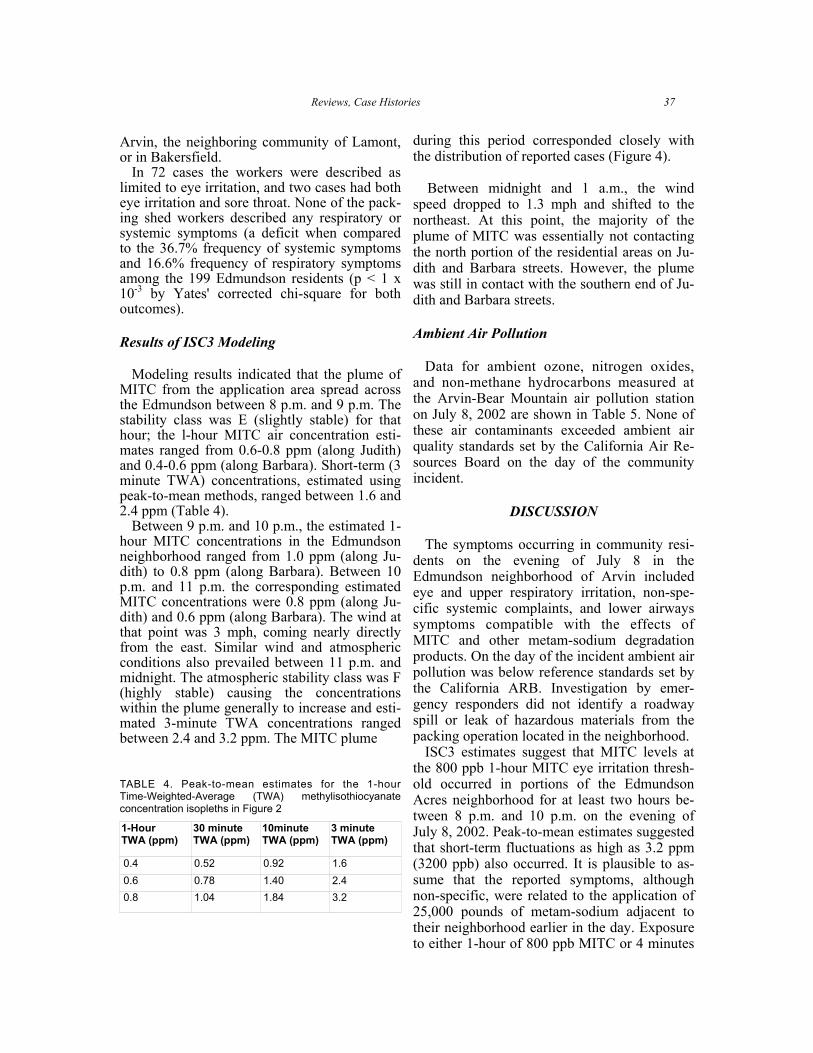
Reviews, Case Histories 37 Arvin, the neighboring community of Lamont, or in Bakersfield.
In 72 cases the workers were described as limited to eye irritation, and two cases had both eye irritation and sore throat. None of the pack-ing shed workers described any respiratory or systemic symptoms (a deficit when compared to the 36.7% frequency of systemic symptoms and 16.6% frequency of respiratory symptoms among the 199 Edmundson residents (p < 1 x 10⁻³ by Yates' corrected chi-square for both outcomes). Results of ISC3 Modeling
Modeling results indicated that the plume of MITC from the application area spread across the Edmundson between 8 p.m. and 9 p.m. The stability class was E (slightly stable) for that hour; the l-hour MITC air concentration esti-mates ranged from 0.6-0.8 ppm (along Judith) and 0.4-0.6 ppm (along Barbara). Short-term (3 minute TWA) concentrations, estimated using peak-to-mean methods, ranged between 1.6 and 2.4 ppm (Table 4).
Between 9 p.m. and 10 p.m., the estimated 1-hour MITC concentrations in the Edmundson neighborhood ranged from 1.0 ppm (along Ju-dith) to 0.8 ppm (along Barbara). Between 10 p.m. and 11 p.m. the corresponding estimated MITC concentrations were 0.8 ppm (along Ju-dith) and 0.6 ppm (along Barbara). The wind at that point was 3 mph, coming nearly directly from the east. Similar wind and atmospheric conditions also prevailed between 11 p.m. and midnight. The atmospheric stability class was F (highly stable) causing the concentrations within the plume generally to increase and esti-mated 3-minute TWA concentrations ranged between 2.4 and 3.2 ppm. The MITC plume
TABLE 4. Peak-to-mean estimates for the 1-hour Time-Weighted-Average (TWA) methylisothiocyanate concentration isopleths in Figure 2
1-Hour TWA (ppm)
30 minute TWA (ppm)
10minute TWA (ppm)
3 minute TWA (ppm)
0.4 0.52 0.92 1.6 0.6 0.78 1.40 2.4 0.8 1.04 1.84 3.2
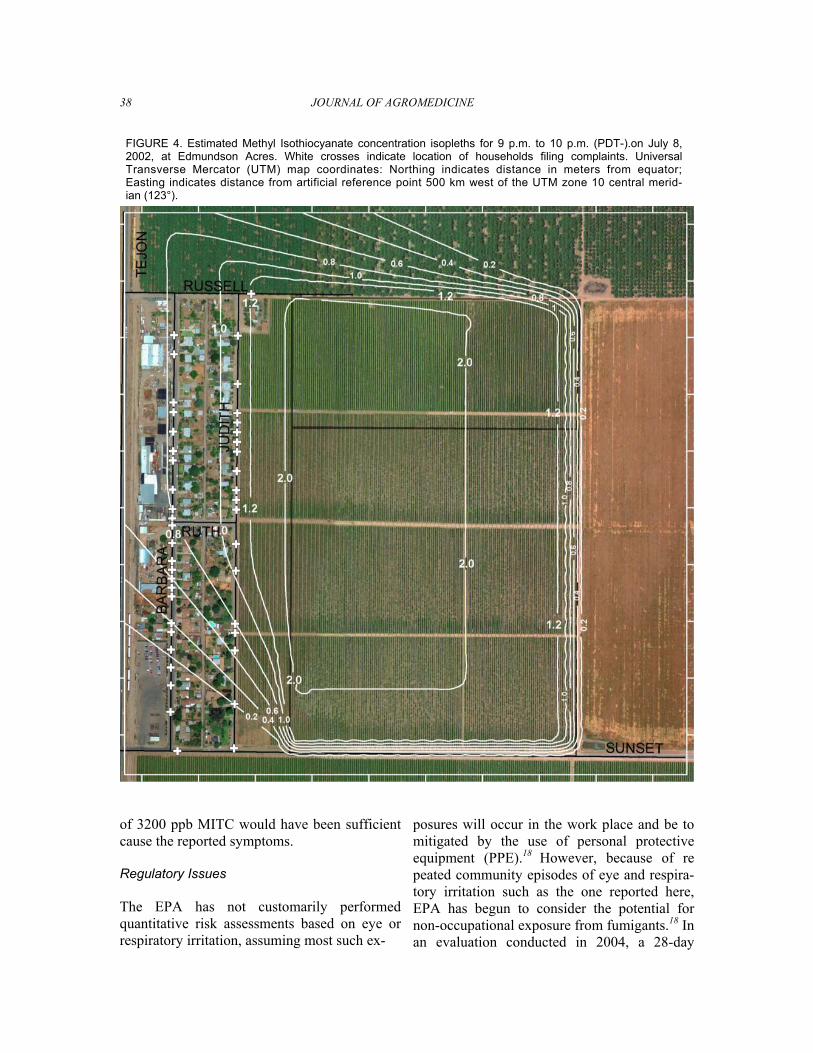
during this period corresponded closely with the distribution of reported cases (Figure 4).
Between midnight and 1 a.m., the wind
speed dropped to 1.3 mph and shifted to the northeast. At this point, the majority of the plume of MITC was essentially not contacting the north portion of the residential areas on Ju-dith and Barbara streets. However, the plume was still in contact with the southern end of Ju-dith and Barbara streets. Ambient Air Pollution
Data for ambient ozone, nitrogen oxides, and non-methane hydrocarbons measured at the Arvin-Bear Mountain air pollution station on July 8, 2002 are shown in Table 5. None of these air contaminants exceeded ambient air quality standards set by the California Air Re-sources Board on the day of the community incident.
DISCUSSION
The symptoms occurring in community resi-dents on the evening of July 8 in the Edmundson neighborhood of Arvin included eye and upper respiratory irritation, non-spe-cific systemic complaints, and lower airways symptoms compatible with the effects of MITC and other metam-sodium degradation products. On the day of the incident ambient air pollution was below reference standards set by the California ARB. Investigation by emer-gency responders did not identify a roadway spill or leak of hazardous materials from the packing operation located in the neighborhood.
ISC3 estimates suggest that MITC levels at the 800 ppb 1-hour MITC eye irritation thresh-old occurred in portions of the Edmundson Acres neighborhood for at least two hours be-tween 8 p.m. and 10 p.m. on the evening of July 8, 2002. Peak-to-mean estimates suggested that short-term fluctuations as high as 3.2 ppm (3200 ppb) also occurred. It is plausible to as-sume that the reported symptoms, although non-specific, were related to the application of 25,000 pounds of metam-sodium adjacent to their neighborhood earlier in the day. Exposure to either 1-hour of 800 ppb MITC or 4 minutes
38 JOURNAL OF AGROMEDICINE
FIGURE 4. Estimated Methyl Isothiocyanate concentration isopleths for 9 p.m. to 10 p.m. (PDT-).on July 8, 2002, at Edmundson Acres. White crosses indicate location of households filing complaints. Universal Transverse Mercator (UTM) map coordinates: Northing indicates distance in meters from equator; Easting indicates distance from artificial reference point 500 km west of the UTM zone 10 central merid-ian (123°).
of 3200 ppb MITC would have been sufficient cause the reported symptoms.
Regulatory Issues
The EPA has not customarily performed quantitative risk assessments based on eye or respiratory irritation, assuming most such ex-
posures will occur in the work place and be to mitigated by the use of personal protective equipment (PPE).18 However, because of re peated community episodes of eye and respira-tory irritation such as the one reported here, EPA has begun to consider the potential for non-occupational exposure from fumigants.18 In an evaluation conducted in 2004, a 28-day
Reviews, Case Histories 39
TABLE 5. Ambient air pollution measured by Air Re-sources Monitoring station, Arvin-Bear Mountain Blvd July 8, 2002
Time Non-Methane N02 03
1:00 AM
Hydrocarbons Measurements 0.04 0.011 0.022
2:00 AM 0.04 0.008 0.024
3:00 AM 0.04 0.007 0.022
4:00 AM * 0.007 0.017
5:00 AM * * *
6:00 AM 0.04 0.009 0.010
7:00 AM 0.04 0.007 0.017
8:00 AM 0.04 0.006 0.025
9:00 AM 0.04 0.006 0.031
10:00 AM 0.04 0.006 0.035
11:00 AM 0.04 0.005 0.039
12:00 AM 0.04 0.005 0.044
1:00 PM 0.04 0.005 0.048
2:00 PM 0.04 0.005 0.056
3:00 PM 0.04 0.005 0.063
4:00 PM 0.04 0.005 0.068
5:00 PM 0.04 0.004 0.068
6:00 PM 0.04 0.005 0.072
7:00 PM 0.04 0.005 0.063
8:00 PM 0.04 0.006 0.046
9:00 PM 0.04 0.008 0.050
10:00 PM 0.04 0.006 0.049
11:00 PM 0.04 0.003 0.053
12:00 AM 0.04 0.013 0.033 Air Resources 0.24 ppm in a 0.25 ppm 1 0.09 ppm 1Board 3 hr sample hr exposure hr exposure Reference Standard
* no data reported Source: 24 Hourly Measurements for Arvin-Bear Mountain Blvd, July 8, 2002, Aerometric Data Analysis and Management System, California Air Resources Board.
study in inhalation study in rats (NOEL 20 mg/m3 [6.7 ppm]), based upon "persistent clin-ical signs, body weight changes, and gross and histopathological lesions") was considered as a possible endpoint.19 This equated to a recom-mended 28-day exposure limit of 67 ppb, but was less conservative,18 than a recommended exposure limit of 20 ppb based upon the 1-hour 200 ppb NOEL observed in the human study by Russell and Rush.4 The estimated "mar-gin-of-exposure"-or ratio of the NOEL to the
estimated exposure-for the episode reported here was equal to 0.25 (200 ppb/800 ppb), far below the level 10 fold margin-of-exposure usually considered acceptable in risk assess-ments based upon human studies.
The study by Cain on chloropicrin demon-strated ocular irritation reliably occurred at concentrations that did not cause nasal irrita-tion or changes in pulmonary function mea-sured by forced expiratory volume in l second5
in a study population that excluded possibly sensitive subjects. In a community exposure to chloropicrin in October, 2003, in Lamont, Cali-fornia (nine miles west of Arvin), 51% of 165 affected individuals reported respiratory symp-toms, including 8 individuals with symptomatic exacerbations of asthma.20 The significance of the respiratory effects of MITC are under-scored by the significant gradient of respiratory symptoms from east to west in the Edmundson neighborhood, corresponding with the gradi-ent of exposure demonstrated in Figure 4.
The observations from the Arvin commu-nity outbreak demonstrate that sensitive indi-viduals may develop serious respiratory illness at doses that cause only ocular irritation, mild respiratory irritation, or short-term-systemic effects in other subjects with similar exposures. The "index case" of this outbreak was in fact exposed at an outdoor gathering, along with other individuals who developed less serious symptoms. Her lower respiratory symptoms included difficulty breathing, an increased breathing rate, and airway spasm that required a week-long hospitalization. In large commu-nity outbreaks of the sort described here, it is likely that multiple sensitive individuals will be affected because of the average prevalence of asthma is 5% of the U.S. population.21 Individ-uals with emphysema or chronic bronchitis, such as those affected in this series, make up an additional 5% of the population.22
Limitations of Case-Series Information
The case series data reported here was lim-ited by the proxy interviews conducted for many subjects for whom no information was available directly, particularly the packing shed workers. From the observed lower preva-lence of systemic and respiratory complaints in the workers compared to the residents, it is

40 JOURNAL OF AGROMEDICINE likely that proxy interviews had the effect of under-estimating the occurrence of the more serious adverse effects of MITC and other metam-sodium degradation products. It is also uncertain whether all affected residents and visitors were identified. If the actual neighbor-hood population approached the admittedly crude estimate of 650 residents, it is likely that some illnesses went unreported.
Medical evaluations were performed in only 11 of the 178 community residents with pa-tients with reported symptoms. Lack of routine access to medical care appears particularly striking for those with respiratory symptoms. Had this incident occurred in a community with greater medical resources, it seems probable that the majority of those affected (especially those with respiratory and systemic symptoms) would have received medical attention. This deficiency may be lessened in any future simi-lar episodes by a new California law requiring application companies to pay the initial medical expenses of those affected by pesticide drift.23
Risk factors identified in the analysis of questionnaire data were based upon limited data. Nevertheless, it does not appear from the available information that the standard recom-mendation to turn off air conditioning units was effectively communicated to all Edmundson residents. Those who had central air condition-ing appeared relatively protected compared to those with evaporative cooling units as long as they did not venture outdoors.
The emergency responders' decision to "shelter-in-place" instead of evacuating to an unaffected area was therefore only partially protective.
Limitations of Modeling Data
The location of the plume in Figure 4 repre-sents a 1-hour time-weighted-average and as such should not be interpreted as the exact loca-tion of the plumes at any particular moment during the incident. It is probable that the cen-terline shifted back and forth over the affected area over time periods ranging from a few a minutes to one hour. The 2400-3200 ppb peak concentrations exceeded the 1-hour TWA LOEL concentration of 800 ppb for a time-weighted-average by 3-4 fold and exceeded the
4-minute TWA LOEL concentration of 1900 ppb by 26-68%.
Crucial assumptions upon which the modeling was based appear reasonably justified, including:
1. The weather data employed were repre-sentative of the weather conditions dur-ing the incident because of the proximity of the weather station (CIMIS # 125, 0.3 miles southeast) and the intervening open, flat terrain;
2. The flux estimate obtained from analysis of the Merricks (1999) field study rea-sonably approximates the flux associ-ated with the Arvin incident. While there is some question about the effect on the flux of the delay of watering-in on the last 15 acres of the application, the remainder of the Arvin application is similar to the Merricks (1999) study application. The watering-in was com-pleted before the majority of neighbor-hood complaints occurred.
The wind direction is another important con-
sideration. During the period of the highest number of complaints, 9 p.m. to 10 p.m., the plume of MITC from the field was moving al-most due west (Figure 3a and Table 3). There-fore, during those hours a plume emanating only from the 15 acres with the delayed post-application water treatment is not likely to have been sufficient to cause the observed symptoms in the entire Edmundson neighborhood.
Prevention of Future Episodes
To prevent future respiratory and irritant ill-nesses due to MITC, it is necessary to evaluate to what extent exposure can be minimized by better enforcement of existing regulatory con-trols on metam-sodium and to what extent ad-ditional regulatory controls are necessary. The post incident enforcement investigation24 dem-onstrated administrative violations including failing to complete the fumigation summary re-quired under county permit conditions, and failing to post signs at access points to the treated field. Other violations included failure to monitor the application and failure to apply

Reviews, Case Histories 41 water immediately after treatment. Common usage in the fumigation industry describes this post-application treatment as a "water-seal" but limited data are available to document its quantitative effect on MITC flux rates.
Factors related to the flux that did not repre-sent violations of the label or permit conditions included the application rate (60 gallons/acre versus maximum label rate-75 gallons/acre) or the amount applied (in excess of 25,000 lbs). There is no evidence that the 500-foot buffer zone was violated, but some question whether the buffer zone was sufficient. Given the quan-tity applied so close to a populated area, it is un-surprising that small changes in wind direction and in atmospheric stability, or sub-standard application technique might generate levels of MITC exceeding the average 800 ppb irritation low-effect-level. Metam-sodium applications to the field east of Judith during 2001 differed from the application responsible for the July, 2002 episode in two important respects. Both 2001 applications involved a fraction of the ac-tive ingredient applied in 2002 and both bene-fited from favorable pattern of wind, blowing away from the Edmunson neighborhood (see figure 3a, compared to figure 3b, and figure 3c).
New application requirements currently un-der consideration include limitation of treated acreage, reduction of maximum allowable ap-plication rates, prohibition of night-time appli-cations, increased post-application water treat-ments, and extending buffer zones based on modeling and exposure data. Newer applica-tion techniques, such as subsurface (30 cm be-low the soil) drip irrigation, also show promise in reducing flux from MITC, dichloropropene and other fumigants.25 However, given current application volumes, implementation of ade-quate measures to prevent illnesses related to offsite movement of MITC, chloropicrin and other fumigants remains a formidable chal-lenge. Additional challenges may also arise as investigational products such as methyl io-dide26 and propargyl bromide25 become regis-tered for active use in agricultural production.
As demonstrated by the lengthy delay in re-sponding to the episode in Arvin, adequate post-incident response also remains a chal-lenge given the resources available in typically affected communities. In the Arvin episode, as in related incidents,20,27 the fire department
team, was largely unprepared to evaluate the degree of hazard presented by an unknown air contaminant. Unsurprisingly, a crew trained to respond to roadway spills of hazardous materi-als did not recognize a hazard emanating from an apparently vacant plot of agricultural ground. The nature of the principal metam-so-dium byproduct, MITC, with an average odor threshold twice the average irritation thresh-old,4 further complicated the process of hazard identification by emergency responders. The responding hazardous materials crews de-cided, based upon the perception that no odor was present, that no evacuation was necessary.
Whether off-site fumigant episodes will be-come a common issue in jurisdictions outside of California remains uncertain. According to U.S. Environmental Protection Agency esti-mates, California accounts for approximately 36% of the 51-55 million pounds of metam-so-dium used in U.S. agriculture in 2002. The northwestern states of Idaho, Oregon, and Washington accounted for 50%, the states of Michigan and Wisconsin accounted for most of the 9% used in the midwestern U.S.; just over 1% was used in Florida.²8 The agricultural ar-eas of California have large populations rela-tive to the other states that use large volumes of metam-sodium. The four Oregon counties ac-counting for most of that state's potato produc-tion,29 for example, had a reported 2003 popu-lation of 164,779 residents in a 14,262 square mile area (11.5 residents/square mile).9 In 2003, Kern County, the site of the outbreak re-ported here, had a population of 680,804 resi-dents in an area of 8,141 square miles (83.6 res-idents/square mile).9 Other jurisdictions with the mix of rural housing and agricultural pro-duction illustrated in this outbreak (Figure 1) (and the similar episodes in Earlimart1 and Lamont20) may be at risk for problems related to off-site movement of air contaminants following soil fumigations.
REFERENCES
1: O'Malley M, Barry T, Verder-Carlos M, Rubin A. Modeling of methyl isothiocyanate air concentrations as-sociated with community illnesses following a metam-sodium sprinkler application. Am J Ind Med. 2004 Jul;46 (l):p.1-15.

42 JOURNAL OF AGROMEDICINE
2. California Department of Pesticide Regulation. Sum-mary of results from the California Pesticide Illness Surveil-lance program, 2003-2005 [cited 2005 Feb 27]. Available from: http://www.cdpr.ca.gov/docs/whs/2002 pisp.htm.
3. California Department of Pesticide Regulation. Summary of results from the California Pesticide Illness Surveillance program, 2002-2004 [cited 2005 Feb 27]. Available from: http://www.cdpr.ca.gov/docs/whs/2002 pisp.htm.
4. Russell MJ and Rush TI. Methyl isothiocyanate: determination of human olfactory detection threshold and human no observable effect level for eye irritation. 1996, Metam Sodium Task Force: Sacramento, Calif.
5. Cain WS. Human sensory irritation testing for chloropicrin. San Diego (CA):University of California; 2004. p. 378.
6. Cone JE, Wugofski L, B almes JR, Das R, Bowler R, Alexeeff G, Shusterman D. Persistent respiratory health effects after a metam sodium pesticide spill. Chest. 1994 Aug; 106(2):p.500-8.
7. Migration dialogue. California Rural Communi-ties (CARUCOM); 2004 [cited 2005 Sep 16]. Available from: http://migration.ucdavis.edu/rtnn/rural_data/carucom/ ca_counties/kern/arvin.html.
8. Venturi Staffing. Arvin city, California Unem-ployment Rate: 2005 [cited 2005 October 13] Available from: http://www.venturi-stgfng.com/ui/arvin_city.shtml.
9. U.S. Census Bureau, F.F. State & County Quick Facts; 2000 [cited 2003 Aug 11 ]. Available from: http:// factfinder.census.gov.
10. California Institute for Rural Studies. In their own words: farmworker access to health care in four California regions; 2005 [cited 2005 Sep 16]. Available from: www.cirsinc.org/CPAC.pdf.
11. Division of Public Health Surveillance and Infor-matics, E.P.O., Epi-Info, version 3.3.2. 2005. Atlanta (GA):Centers for Disease Control [cited 2005 Oct 14]. Available from: http://www.cdc.gov/epiinfolepiinfo.htm.
12. U.S. Environmental Protection Agency. User's guide for the Industrial source complex (isc3) dispersion models Volume II-description of model algorithms; 1995 [cited 2005 Sep 16]. Available from: http://www.epa. gov/scram001/tt22.htm - isc.
13. Turner, DB. Workbook of atmospheric dispersion estimates: an introduction to dispersion modeling. 2nd ed. Boca Raton (FL): Lewis Publishers; 1994.
14. Merrick, DL. Determination of Methyl Isothio-cyanate offsite air movement from the application of Metam-Sodium through injection and sprinkler irriga-tion. Frederick (MD):Agrisearch Incorporated; 1999:.
15. Hino M. Maximum ground level concentration and sampling time. Atmos. Environ. 1968. 2: p.149-65.
16. Aerometric Data Analysis and Management Sys-tem, California Air Resources Board Hourly Listing: 24 Hourly Measurements for Arvin-Bear Mountain Blvd, July 8, 2002; [cited 2005 Sep 16]. Available from:
http://www.arb.ca.gov/adam/cgi-in/db2www/adamhourly. d2w/start.
17. California Air Resources Board. Ambient Air Quality Standards; 2005 [cited 2005 May 5]. Available from: http://www.arb.ca.gov/aqs/aaqs2.pdf.
18. Lowit A. Human eye and nasal irritation resulting from air exposure to MITC, in Office of Pesticide Pro-grams Docket OPP-2004-0159. U.S. Environmental Pro-tection Agency; 2004.
19. Christensen. METAM SODIUM/METAM PO-TASSIUM: The HED Chapter of the Reregistration Eligibility Decision Document (RED), in Office of Pest-icide Programs Docket OPP-2004-0159. U.S. Environ-mental Protection Agency; 2004.
20. O'Malley M, Edmiston S, Richmond D, Ibarra M, Barry T, Smith M. Illness associated with drift of chloro-picrin soil fumigant into a residential area-Kern County, California, 2003. MMWR. 2004 Aug 20;53(32):740-43.
21. Middleton E Jr, Ellis EF, Yunginger JW, Reed CE, Adkinson NF Jr, Busse WW, editors. Allergy: Principles and Practice, 5th ed. St. Louis(MO): Mosby; 1998.
22. Halbert RJ, Isonaka S, George D, Iqbal A. Inter-preting COPD prevalence estimates: what is the true bur-den of disease? Chest., 2003 May. 123(5):1684-92.
23. Florez D. Pesticide Drift Exposure Response Act. 2004.
24. Ibarra M. Priority investigation 45-KER-02 sup-plemental report. Sacramento (CA):California Depart-ment of Pesticide Regulation; 2002.
25. Papiernik SK, Dungan RS, Zheng W, Guo M, Lesch SM, Yates SR. Effect of application variables on emissions and distribution of fumigants applied via sub-surface drip irrigation. Environ Sci Technol. 2004 Nov 1;38(21):5489-96.
26. Becker J, Ohr H, Grech N, McGiffen M Jr, Sims J. Evaluation of methyl iodide as a soil fumigant in con-tainer and small field plot studies. Pestic Sci. 1998; 52(l):58-62.
27. O'Malley M, Verder-Carlos M. Illness Related to Exposure to Metam-Sodium Byproducts in Earlimart, California in November 1999. Sacramento (CA): Cali-fornia Environmental Protection Agency; 2001 [cited 2005 Sep 16]. Available from: http://www.cdpr.ca.gov/docs/ whs/pdf/hs1808.pdf.
28. U.S. Environmental Protection Agency. Over-view of the Metam Sodium Risk Assessments, in Office of Pesticide Programs, Docket #OPP-2004-0159-0003. Arlington (VA): U.S. Environmental Protection Agency; 2004. p. 57.
29. Oregon State University. Potato Information Ex-change, Oregon Production. 2005 [cited 2005 Sep 161. Available from: http://oregonstate.edu/potatoes/orprod.htm.
RECEIVED: 10/19/2004 REVISED: 05/06/2005
ACCEPTED: 07/19/2005