ilkka paaso the effects of contingency factors on ... · the effects of contingency factors on...
TRANSCRIPT
ILKKA PAASO
THE EFFECTS OF CONTINGENCY FACTORS ON MANAGEMENT CONTROL SYSTEMS: AN EMPIRICAL STUDY AT CERN
Master of Science Thesis
Prof. Petri Suomala has been appointed as the examiner at the Council Meeting of the Faculty of Business and Tech-nology Management on October 3rd 2012.
i
ABSTRACT
TAMPERE UNIVERSITY OF TECHNOLOGY Master’s Degree Programme in Industrial Engineering and Management PAASO, ILKKA: The Effects of Contingency Factors on Management Control Systems: An Empirical Study at CERN Master of Science Thesis, 86 pages, 10 appendices (16 pages) August 2013 Major: Industrial Management Examiner: Professor Petri Suomala Keywords: Management Control Systems, Contingency Theory, Services, Interdependence, Scope, Standardization, Variation, Performance Consciousness Contingency theory and management control systems research offer avenues for inves-tigating how contextual factors in organizations affect performance. This quantitative case study investigates how the context of CERN internal services influences the per-formance consciousness of functional service managers. A literature review recognized four contingency factors relevant for performance consciousness: interdependence, scope, standardization and variation. Data from these factors was measured empirically using a cross-sectional electronic survey and supplemented by data gathered from CERN internal documentation. A quantitative analysis of the data was performed using structural equation modelling.
The main findings were congruent with existing literature indicating that a.) high inter-dependence between work units is associated with decreased variation, increased stand-ardization and increased performance consciousness. b.) high scope is related to in-creased variation and decreased standardization. Overall, a better understanding of the effects of organizational structure and work processes on performance consciousness was gained, proving valuable for academics and practitioners alike. Some recommenda-tions for possible courses of action to improve performance consciousness were given, based on the findings in this study and existing theory.
The results contribute to the knowledge base of contingency-based management control systems research by further validating the behavior of the chosen contingency factors in new circumstances. The practical insights given by this study offer opportunities for improvements by recognizing the implications of the relationships between context and performance consciousness. This study exhibits novelty by combining archival and em-pirical data in order to make strong arguments about causality while increasing the va-lidity of the findings. In light of these findings some directions for future research are suggested.
ii
TIIVISTELMÄ
TAMPEREEN TEKNILLINEN YLIOPISTO Tuotantotalouden koulutusohjelma PAASO, ILKKA: Kontingenssitekijöiden Vaikutus Johdon Hallintajärjestelmiin: Empiirinen Tutkielma CERN:ssä Diplomityö, 86 sivua, 10 liitettä (16 sivua) Elokuu 2013 Pääaine: Teollisuustalous Tarkastaja: Professori Petri Suomala Avainsanat: Johdon Hallintajärjestelmät, Kontingenssi Teoria, Palvelut, Keskinäinen Riippuvuus, Laajuus, Standardisointi, Vaihtelevuus, Suorituskykytietoisuus Kontingenssiteoria ja johdon hallintajärjestelmien tutkimukset tarjoavat näkökulman tarkastella organisaatioiden kontekstin vaikutusta suorituskyvyn hallintaan. Tämän lop-putyön tarkoituksena on tarkastella kuinka organisaatioympäristö CERN:ssä vaikuttaa palvelujen toteuttamisesta vastuussa olevan henkilökunnan käsitykseen suorituskyvystä. Aiheeseen liittyvä kirjallisuuskatsaus paljasti neljä suorituskykytietoisuudelle oleellista kontingenssitekijää: Keskinäinen riippuvuus, laajuus, standardisointi ja vaihtelevuus. Näitä kontingenssitekijöitä mitattiin käyttämällä sähköistä kyselyä ja näihin tuloksiin yhdisteltiin organisaation rakennetta koskevaa dataa CERN:n sisäisestä dokumentaati-osta. Tämä data analysoitiin käyttäen rakenneyhtälömallintamista.
Tutkimuksen päähuomiot ovat yhteneväisiä Johdon hallintajärjestelmien kirjallisuuden kanssa ja osoittavat että: a.) Korkea keskinäinen riippuvaisuus liittyy alhaiseen vaihtele-vuuteen, lisääntyneeseen standardisointiin ja kohonneeseen suorituskykytietoisuuteen. b.) Korkea laajuus liittyy kohonneeseen vaihtelevaisuuteen ja alhaiseen standardisoin-tiin. Tässä työssä saavutetulla ymmärryksellä siitä kuinka organisaatiorakenne ja työ-prosessit vaikuttavat suorituskykytietoisuuteen on apua niin tulevassa tutkimuksessa kuin käytännön ratkaisuissa. Muutamia käytännön suosituksia siitä kuinka suoritusky-kytietoisuutta voitaisiin mahdollisesti parantaa tehtiin tässä tutkimuksessa saavutettujen tulosten ja aikaisemman teorian pohjalta.
Tämän tutkimukset tulokset voidaan yhdistää kontingenssipohjaisen johdon hallintajär-jestelmien kirjallisuuden löytöihin, sillä ne lisäävät valittujen kontingenssitekijöiden validiteettia uusissa olosuhteissa. Tutkimus tarjoaa myös käytännön sovelluksia, sillä kontekstin ja suorituskyvyn seurausten parempi ymmärtäminen mahdollistaa parannus-toimenpiteitä. Uusi lähestymistapa on empiirisen ja dokumentaatiodatan yhdistelemi-nen, joka mahdollistaa kausaliteettia koskevat olettamukset ja lisää validiteettia. Näiden löytöjen perusteella tehdään muutamia suosituksia koskien tulevaa tutkimusta.

iii
PREFACE
This master’s thesis was done as a part of my placement at CERN in the department of resource control and planning. I was offered the opportunity of deciding on my own in-vestigation and this proved to be an exciting and challenging experience. I thoroughly enjoyed the process of creating my own research problem, designing the subsequent methodology, collecting the data and making inferences. Looking back at this I am proud to have completed the whole process of carrying out an empirical quantitative research project.
Life at CERN and in Geneva was an exhilarating time, which I will remember fondly. The atmosphere at CERN was inspiring, especially with the looming advent of discov-ering the Higgs boson. I have been very lucky to meet many driven and intelligent peo-ple from all over the world who gathered in Geneva to work on many important issues ranging from physics to humanitarian challenges.
I would like to acknowledge the following people: Kasia Pokorska was my adviser at CERN and I am ever grateful for her guidance. I would also like to thank Petri Suomala, the examiner of this thesis, for his constructive feedback. Frank Selto and Andrew Van de Ven were most helpful by agreeing to share their survey instruments for use in my study. I am thankful for these people for their contribution and, of course, any possible errors contained herein are my own. Finally, I would like to thank my wife, family and friends for their continuing support.
Barcelona, August 5th 2013 Ilkka Paaso
iv
TABLE OF CONTENTS
ABSTRACT ....................................................................................... i!
TIIVISTELMÄ ................................................................................... ii!
PREFACE ........................................................................................ iii!
TABLE OF CONTENTS .................................................................. iv!
LIST OF FIGURES ......................................................................... vii!
LIST OF TABLES .......................................................................... viii!
ABBREVIATIONS AND NOTATION .............................................. ix!
1.! CONTROLLING SERVICE PERFORMANCE AT CERN .......... 1!
1.1.!Background ........................................................................................... 1!
1.2.!Case CERN .......................................................................................... 3!
1.3.!Focus on the context of performance consciousness ........................... 5!
1.4.!Scope and structure of the study .......................................................... 7!
2.! MANAGEMENT CONTROL SYSTEMS IN CONTEXT ............ 10!
2.1.!Contingency theory ............................................................................. 10!
2.1.1.! Description and overview ....................................................... 10!
2.1.2.! Contextual factors .................................................................. 13!
2.1.3.! Contingency fit ....................................................................... 15!

v
2.1.4.! Context and services .............................................................. 19!
2.1.5.! Critical review and contemporary directions .......................... 20!
2.2.!Management control systems ............................................................. 22!
2.2.1.! Description and overview ....................................................... 22!
2.2.2.! Management accounting as an important element of MCS ... 24!
2.2.3.! Levers of control framework ................................................... 25!
2.2.4.! MCS as a package ................................................................. 27!
2.2.5.! Roles of MA ............................................................................ 30!
2.2.6.! Critical review and contemporary directions .......................... 32!
3.! RESEARCH DESIGN AND METHODOLOGY ........................ 35!
3.1.!Conceptualizing the study ................................................................... 35!
3.1.1.! Variables ................................................................................ 36!
3.1.2.! Relationships between the variables ...................................... 41!
3.1.3.! Causality, role of antecedents and the mediating effect ........ 44!
3.1.4.! Hypotheses and criteria for acceptance ................................. 46!
3.2.!Research methods .............................................................................. 48!
3.2.1.! Survey .................................................................................... 48!
3.2.2.! Interventionist research .......................................................... 51!
3.3.!Sample ................................................................................................ 53!
3.4.!Validity, reliability and epistemic considerations ................................. 55!
vi
4.! EMPIRICAL RESULTS ............................................................ 59!
4.1.!Data collection .................................................................................... 59!
4.2.!Descriptive statistics and factor analysis ............................................ 60!
4.3.! Inferential statistics ............................................................................. 62!
5.! INTERPLAY OF CONTINGENCY FACTORS AND PERFORMANCE CONSCIOUSNESS AT CERN .......................... 67!
5.1.!Critical assessment of the results ....................................................... 67!
5.2.!Hypotheses tests ................................................................................ 71!
5.3.!Theoretical reflections on the findings ................................................ 72!
6.! CONCLUSIONS ....................................................................... 76!
BIBLIOGRAPHY ............................................................................ 80!
APPENDICES (10 PIECES)!!
vii
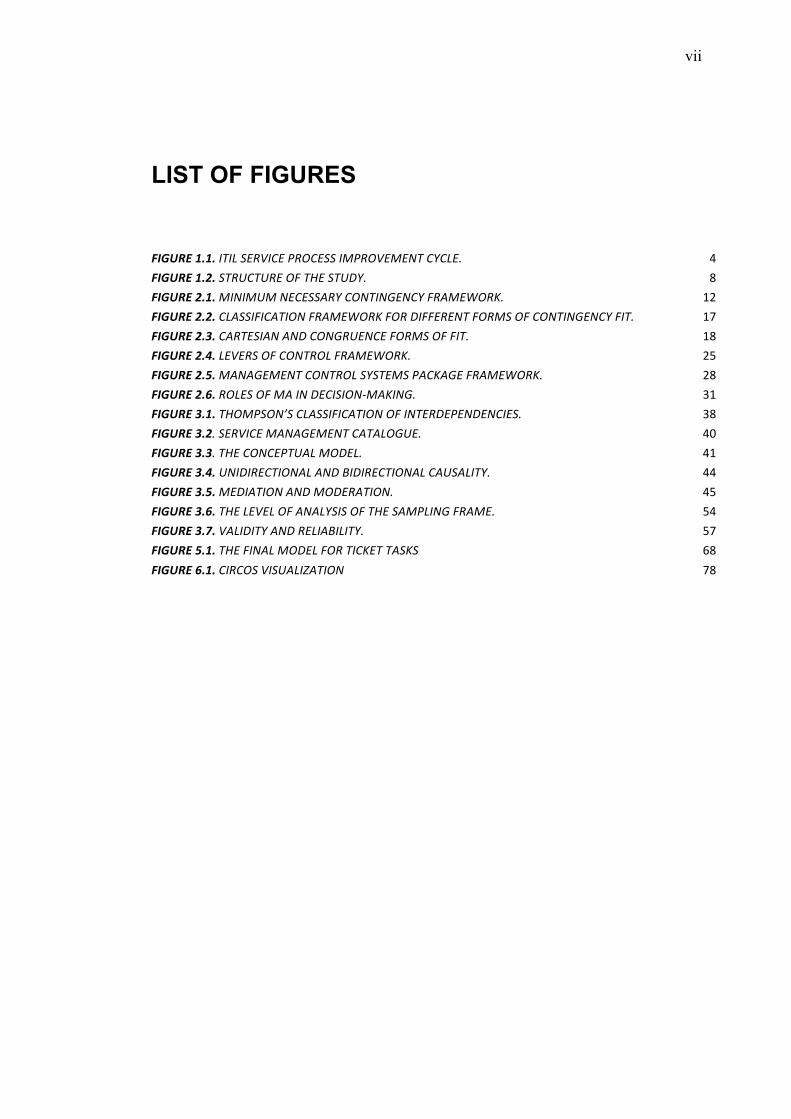
LIST OF FIGURES
!"#$%&'()()!"#"$!%&'(")&!*'+)&%%!",*'+(&,&-#!).)$&/! "!!"#$%&'()*)!%#'0)#0'&!+1!#2&!%#03./! #!!"#$%&'*)()!,"-",0,!-&)&%%4'.!)+-#"-5&-).!1'4,&6+'7/! $%!!"#$%&'*)*)!)$4%%"1")4#"+-!1'4,&6+'7!1+'!3"11&'&-#!1+',%!+1!)+-#"-5&-).!1"#/! $&!!"#$%&'*)+)!)4'#&%"4-!4-3!)+-5'0&-)&!1+',%!+1!1"#/! $#!!"#$%&'*),)!$&(&'%!+1!)+-#'+$!1'4,&6+'7/! %'!!"#$%&'*)-)!,4-45&,&-#!)+-#'+$!%.%#&,%!*4)745&!1'4,&6+'7/! %#!!"#$%&'*).)!'+$&%!+1!,4!"-!3&)"%"+-8,47"-5/! ($!!"#$%&'+)()!#2+,*%+-9%!)$4%%"1")4#"+-!+1!"-#&'3&*&-3&-)"&%/! (#!!"#$%&'+)*/!%&'(")&!,4-45&,&-#!)4#4$+50&/! ")!!"#$%&'+)+/!#2&!)+-)&*#04$!,+3&$/! "$!!"#$%&'+),)'0-"3"'&)#"+-4$!4-3!:"3"'&)#"+-4$!)40%4$"#./! ""!!"#$%&'+)-)!,&3"4#"+-!4-3!,+3&'4#"+-/! "'!!"#$%&'+).)!#2&!$&(&$!+1!4-4$.%"%!+1!#2&!%4,*$"-5!1'4,&/! '"!!"#$%&'+)/)!(4$"3"#.!4-3!'&$"4:"$"#./! '&!!"#$%&'-)()!#2&!1"-4$!,+3&$!1+'!#")7&#!#4%7%! *#!!"#$%&'.)()')"')+%!("%04$";4#"+-! &#!

viii
LIST OF TABLES
0123&'+)()!(4'"4:$&%!0%&3!"-!#2"%!%#03.!4-3!#2&"'!#.*&%/! "*!0123&'+)*)!$"%#!+1!2.*+#2&%&%/! "&!0123&'+)+)!)0#+11!(4$0&%!1+'!4))&*#"-5!#2&!%&,!,+3&$/! "&!0123&'+),)!"#&,%!"-!#2&!%0'(&./! "+!0123&',)()!3&%)'"*#"(&!%#4#"%#")%/! *)!0123&',)*)!"-"#"4$!14)#+'!4-4$.%"%/! *%!0123&',)+)!)24-5&%!,43&!#+!#2&!,+3&$/! *(!0123&',),)!5++3-&%%8+181"#!"-3")&%!30'"-5!,+3&$!%*&)"1")4#"+-/! *(!0123&',)-)!'&$"4:"$"#.!4-3!(4$"3"#.!%#4#"%#")%!30'"-5!,+3&$!%*&)"1")4#"+-/! *"!0123&',).)!%<04'&3!,0$#"*$&!)+''&$4#"+-%!1+'!#2&!1"-4$!,+3&$/! *'!0123&',)/)!%#4-34'3";&3!4-3!0-%#4-34'3";&3!&%#",4#&%!1+'!*4#2!)+&11")"&-#/! **!0123&'-)()!2.*+#2&%&%!#&%#%/! &$!0123&'-)*)!*4#2!)+&11")"&-#%/!3"'&)#=!"-3"'&)#!4-3!#+#4$!&11&)#%!:&&-!#2&!)+-%#'0)#%/! &(!
ix
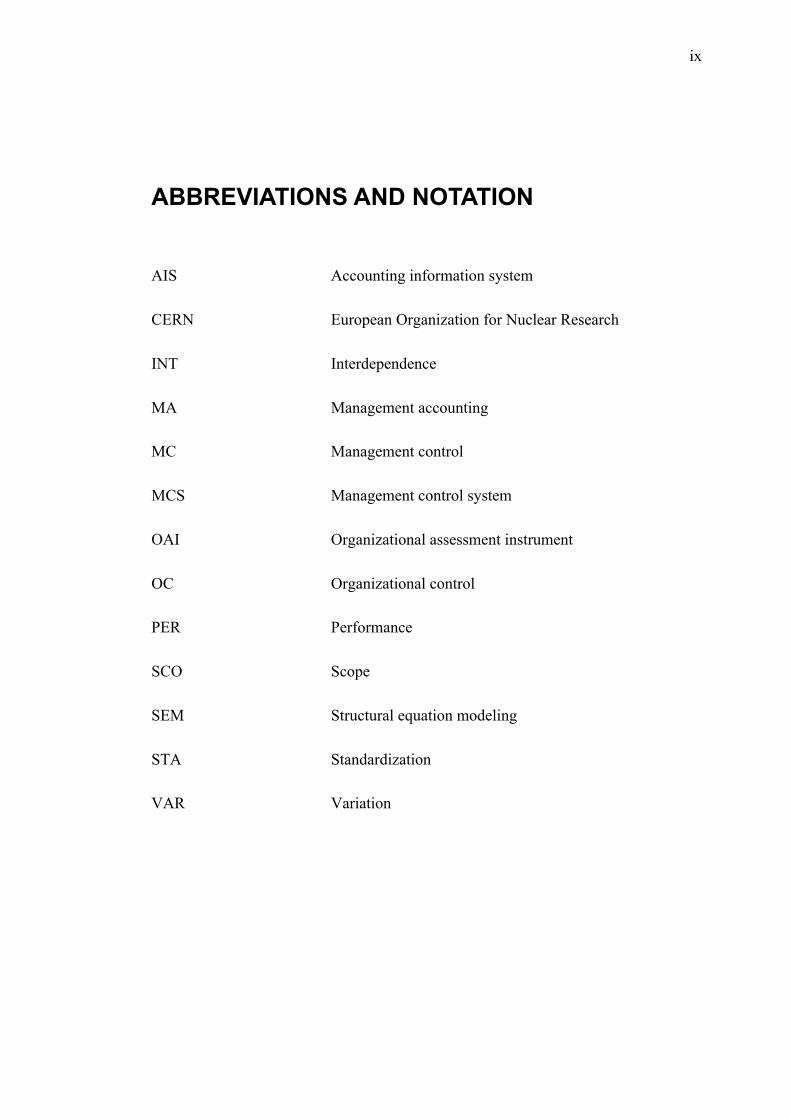
ABBREVIATIONS AND NOTATION
AIS Accounting information system
CERN European Organization for Nuclear Research
INT Interdependence
MA Management accounting
MC Management control
MCS Management control system
OAI Organizational assessment instrument
OC Organizational control
PER Performance
SCO Scope
SEM Structural equation modeling
STA Standardization
VAR Variation
1
1. CONTROLLING SERVICE PERFORMANCE AT CERN
This introductory chapter presents the grounding and justification for the study. A brief background preceding the research problem presents management control systems re-search and explains the changes in society leading to the current context affecting or-ganizational control. Academic development of the disciplines of contingency theory and management control studies are briefly revisited. The premises of the study at CERN are described. A precise research problem is justified and the subsequent re-search question is developed. Finally the structure of the study is detailed for each chap-ter.
1.1. Background
Increasing expectations of efficiency and competition force public and private organiza-tions to constantly seek new ways to improve their performance and management con-trol is situated at the epicenter of these efforts (Otley 1999, p. 363). Management con-trol (MC) is essential since without oversight organizations cannot systematically achieve their goals and hence face increased and unnecessary risks. Random control re-sults in random outcomes (Merchant and Van der Stede 2007, p. 8). Choosing new stra-tegic directions or managing and improving existing modes of operation requires rigor-ous control.
Management control system (MCS) research is a discipline that studies how manage-ment influences the behavior of people in an organization to achieve individual goal congruence with organizational objectives (Fisher 1995, p. 25). MCS include formal and informal methods of control, where formal methods typically refer to management accounting tools (Chenhall 2007, p. 165). Informal methods of control on the other hand are more social and subjective and are typically a part of the corporate culture (Flam-holtz 1983, p. 162). MCS are more than accounting measurement tools and Simons (1994, p. 186) summarizes how management combines four levers of control with man-agement accounting information for implementing control.
Organizations have different needs for control since they have varying goals, technolo-gies, sizes, cultures and resources among many other differences. Contingency theory posits that there is no single best way to organize and control activities, but rather per-formance is contingent on the premises of the organization and its external environment
2
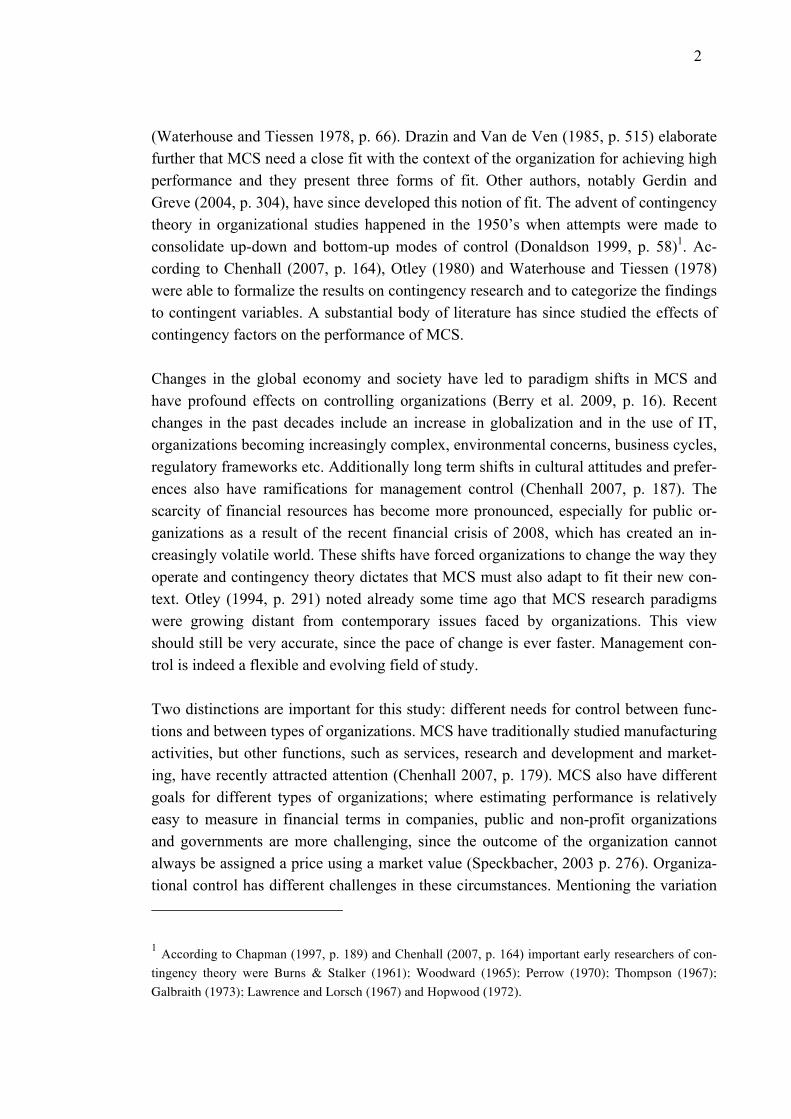
(Waterhouse and Tiessen 1978, p. 66). Drazin and Van de Ven (1985, p. 515) elaborate further that MCS need a close fit with the context of the organization for achieving high performance and they present three forms of fit. Other authors, notably Gerdin and Greve (2004, p. 304), have since developed this notion of fit. The advent of contingency theory in organizational studies happened in the 1950’s when attempts were made to consolidate up-down and bottom-up modes of control (Donaldson 1999, p. 58)1. Ac-cording to Chenhall (2007, p. 164), Otley (1980) and Waterhouse and Tiessen (1978) were able to formalize the results on contingency research and to categorize the findings to contingent variables. A substantial body of literature has since studied the effects of contingency factors on the performance of MCS.
Changes in the global economy and society have led to paradigm shifts in MCS and have profound effects on controlling organizations (Berry et al. 2009, p. 16). Recent changes in the past decades include an increase in globalization and in the use of IT, organizations becoming increasingly complex, environmental concerns, business cycles, regulatory frameworks etc. Additionally long term shifts in cultural attitudes and prefer-ences also have ramifications for management control (Chenhall 2007, p. 187). The scarcity of financial resources has become more pronounced, especially for public or-ganizations as a result of the recent financial crisis of 2008, which has created an in-creasingly volatile world. These shifts have forced organizations to change the way they operate and contingency theory dictates that MCS must also adapt to fit their new con-text. Otley (1994, p. 291) noted already some time ago that MCS research paradigms were growing distant from contemporary issues faced by organizations. This view should still be very accurate, since the pace of change is ever faster. Management con-trol is indeed a flexible and evolving field of study.
Two distinctions are important for this study: different needs for control between func-tions and between types of organizations. MCS have traditionally studied manufacturing activities, but other functions, such as services, research and development and market-ing, have recently attracted attention (Chenhall 2007, p. 179). MCS also have different goals for different types of organizations; where estimating performance is relatively easy to measure in financial terms in companies, public and non-profit organizations and governments are more challenging, since the outcome of the organization cannot always be assigned a price using a market value (Speckbacher, 2003 p. 276). Organiza-tional control has different challenges in these circumstances. Mentioning the variation
1 According to Chapman (1997, p. 189) and Chenhall (2007, p. 164) important early researchers of con-tingency theory were Burns & Stalker (1961); Woodward (1965); Perrow (1970); Thompson (1967); Galbraith (1973); Lawrence and Lorsch (1967) and Hopwood (1972).

3
that exists within sectors and functions is relevant as this study will concentrate on in-vestigating internal services at CERN, a publicly funded particle physics research insti-tution. The pivot to services is seen as a relevant approach since Laine, Paranko and Su-omala (2012, p. 227) have pointed out that management control has different roles and implications for service activities.
This study purports to describe management control at CERN using existing findings on the field of contingency-based management control systems research and empirical da-ta. Theory is applied to assess the situation of management control and to prescribe pos-sibilities for improvements. The premises of this study, the research problem and the resulting research question are described in further detail in the following chapters. The findings of this study will update previous findings in the premises of this study and evaluate their validity in contemporary settings. These updated results will add to the body of knowledge concerning contingency theory and management control systems and give a more contemporary perspective on these subjects.
1.2. Case CERN
Organisation européenne pour la recherche nucléaire (CERN) is a particle physics re-search institute situated in Geneva, Switzerland. CERN is a scientific joint collaboration of member states and other countries and entities, which fund it. CERN offers infra-structure for operating various scientific research experiments, some of which are built around the famous large hadron collider (LHC), which is one part of the particle accel-erator complex. The aim of CERN is to produce new discoveries in particle physics and an important milestone was reached in 2012 with the discovery of a new elementary particle, the Higgs boson.
This study was done as a part of the authors placement in a project at CERN in the re-source planning and control department. The project involved developing principles and recommendations for future intentions of developing a cost management system for measuring the cost efficiency of internally provided services. The suggestions from the project were intended for the next director general when the next five-year mandate be-gins. Participating in the project offered access inside the organization and provided an excellent vantage point for the study.
While offering infrastructure for scientific experiments is the core activity of CERN many other operations, such as engineering also take place. Computing power has al-ways been a strong point at CERN and the world wide web was notably invented at CERN by Tim Berners-Lee. The experiments are run by CERN but designed elsewhere at universities in member states. Maintaining the infrastructure for operating the accel-erators is a large-scale task and requires a lot of support, which are partly provided by

4
the internal services. The IT and general services department, which are the focus of this study, together directly represent a substantial part, nearly 15%, of CERN’s total annual budget.
The services at CERN have recently been reorganized under the new service manage-ment services (SMS) authority and categorized into a service catalogue. At the time of the study IT and GS departments were sufficiently integrated to the new service catalog to be included. The reorganization aims at streamlining the services and improving effi-ciency. The services are managed as incidents which are dealt accordingly using a tick-eting system. All the tasks undertaken by the functions in the service management sys-tem are not ticketed service tasks, but a substantial amount of work is done on long term projects aimed at developing new services and improving existing ones. Not enough data was available at the time of the study to merit an analysis of the service operations.
The services are managed using Information Technology Infrastructure Library (ITIL) V3 framework, which is a widely used management standard for IT service systems (Office of Government Commerce 2007). ITIL provides general guidelines and princi-ples for measuring and designing cost effective IT services. ITIL can be used as a source of best practices and it is not necessary to adopt it fully. ITIL is based on three parts, service design, service transition and service operation. These processes are un-dergoing continual improvement, which aims at achieving the strategic goals. This makes ITIL very similar to the Deming cycle or, indeed, the scientific method. The ITIL service strategy is illustrated in figure 1.1.
Figure 1.1. ITIL service process improvement cycle. Adapted from source: Office of Government Commerce (2007, p. 8).
!"#$%&"'
(")%*+'
!"#$%&"',#-+)%./+'
!"#$%&"'
/0"#-./+'
5
The service management system has been instated because the facilities at CERN face increasing demand from users. For example, visiting researchers must be able to access the services easily and instantly and some of the services are necessary 24 hours a day during the whole year. Also the expansion of scientific operations requires new and more complex services. The service management system, which has been set up to meet these challenges has created various prospects for improvements: One customer facing service help desk; Standard operating procedures; Services designed from users view-point; Accessible to outsiders with no knowledge of CERN structure; Measurability; Increased collaboration between functions; Eliminating redundancies; Task automation and continuous improvement. Overall the new service management system aims at en-suring quality and long-term reductions in costs of providing the services.
The main motive for improving the cost efficiency of internally provided services and providing robust measurements on the effects of these improvements has been the fi-nancial and economic crisis. The crisis has put a lot of pressure on the economies of the funding member states and resulted in painful austerity measures. Funding basic re-search has been considered to be one of the most politically acceptable line items to cut in national budgets, due to their low impact on public services. Furthermore basic re-search is not easily understandable and relatable due to its intangible outcomes. CERN wishes to counter these threats to its funding through a variety of measures such as ex-tensive use of public relations. Publicly funded programs, such as CERN are sometimes viewed cynically as inherently wasteful and this is why CERN wishes to showcase the results of its efforts to improve the cost efficiency of its operations. Efficient and trans-parent operations are one of the arguments CERN uses to convince its financial sup-porters to continue funding its operations. This intent to move towards explicitly demonstrating efficiency also serves as the justification for this study
1.3. Focus on the context of performance consciousness
Many authors have mentioned the principle pioneered by Lord Kelvin, which essentially states what is not measured cannot be managed. This is why measuring performance is an essential part of management control systems, as it is of any systematic development efforts. Measuring the inputs and outputs of internal services is one of the objectives of the service management system. However, at the time of the study enough data was not available to merit a valid analysis of performance and this poses a challenge for finding alternative, indirect, ways of observing how performance behaves at CERN.
During discussions, a manager at CERN stated ”CERN is a large organization with over 50 years of history. It would be interesting to open it up and see what is happening in-side” (paraphrased). This statement reveals how one of the goals of measuring perfor-mance is to gain further insight into the activities at CERN service management. The

6
statement is adopted as the raison d'être for this study. As actually measuring perfor-mance is not feasible in the scope of the project, the primary objective of this study is thus to investigate what kind of knowledge already exists about the performance of ser-vices within CERN.
The internal services are subject to budgets and thus the material and personnel costs incurred the departments are known. Costs are however difficult to assign to specific activities and they are even more challenging to assign to specific services, as the ser-vices are produced in cooperation by multiple functions and departments. A further re-straint in measuring the performance of the service management system is that there is not enough operational data on the output. Despite the lack of data the service functions are well established and the personnel working on the services has an excellent under-standing of their functions. Thus a lot of knowledge about performance exists in CERN and it is embedded in the personnel as implicit knowledge. This results in the following research problem: The implicit understanding of the performance of internal services at CERN is not known. This research problem is formulated into the following research question:
Research question: How is the implicit performance consciousness constructed for personnel working
with internal services at CERN?
Further elaboration of the research question reveals that it is tied to concerns about the development of the field management control research as expressed in previous studies. Otley (1994, p. 291) mentioned almost two decades ago, that ”the reality of MCS para-digm has grown distant from the reality of current issues” to illustrate that knowledge about MCS and its context decays over time. Also Berry et al. (2009, p. 15) proclaim that management control practices are developing dynamically to meet new control challenges and that for this reason contingency theory cannot be specific and exactly generalizable. These views reflect that many aspects of contextual factors are not still well understood and under constant change, requiring expansion and updating of theory. Such concerns justify the revisiting of previous contingency-based management control studies in the context of CERN service management. This study takes the previous find-ings to be the most reasonable starting point for examining CERN and also for re-testing the validity of the theories themselves. As it is established that performance con-sciousness is critically dependent on the context of the premises, this study concentrates on examining how performance consciousness is constructed and affected by contingent variables. This perspective conforms to research traditions within contingency theory and management control studies.
7
The research question is primarily related to theory testing, but it does have real impli-cations for CERN management as well. The practical applicability of the findings of this study for CERN service management are based on a common assumption that better understanding leads to more efficient decisions at work, increasing actual objective per-formance (Chapman 1997, p. 200). By finding out which factors affect the implicit un-derstanding of services by the managers, the services can be designed and improved the to increase implicit understanding. The answer to the “So What?” question and the rele-vance to CERN is that this study can be used to drive informed decisions concerning the development of organizational structure and premises to facilitate better performance consciousness.
1.4. Scope and structure of the study
The research question will be developed into testable hypotheses. The scope of this study is to concentrate on a handful of contingent variables picked from research litera-ture, which are deemed to be the most relevant for performance consciousness. The study will approach the construction of performance consciousness through the analysis of these variables, since a more comprehensive study is not feasible due to restraints in disturbing the operations. The level of analysis, where the contextual variables will be examined, will be where most of the tacit organizational knowledge is assumed to re-side. This study is cross-sectional, so it only represents the relationships of the contex-tual variables only at the time of the study. The scope of the study covers service man-agement at CERN exclusively and any findings presented in this study should not be generalized to apply to other organizations. Also, this study does not apply to any other operations within CERN. This being said, the conclusions of this study can be compared with the findings of other studies to make informed assumptions and the findings add to the body of knowledge of contingency-based management research.
A quantitative research method is selected as the main approach for making claims in this study. The quantitative study is carried using a survey instrument. The findings are then analyzed using structural equation modeling (SEM). A quantitative method simpli-fies the evaluation of validity and reliability, since the results it provides adhere to commonly agreed criteria that are typically required by studies using SEM. Also, further inferences based on the statistical findings are more transparent due to the undisclosed methodology and measurement instrument. The reasons for adopting a quantitative ap-proach are also based on a research tradition within MCS studies, which typically use questionnaire instruments (Chapman 1997 p. 189). By using a quantitative method the findings are easily comparable to other studies examining similar contingent variables because of the wealth of knowledge gained using similar methods. Finally a quantitative survey can be used as an unambiguous tool for assessing the relationships of the contin-gent variables at CERN, because this approach has been tried and tested by previous
8
researchers. Since this study is produced in situ and as a part of placement at CERN it is only natural that it includes some elements of interventionist research as recommended by Chenhall (2007, p. 194). While the interventionist research approach is not used for producing observations considered in the results, it still produces insight used in analyz-ing and giving meaning to the findings produced by the quantitative measurements.
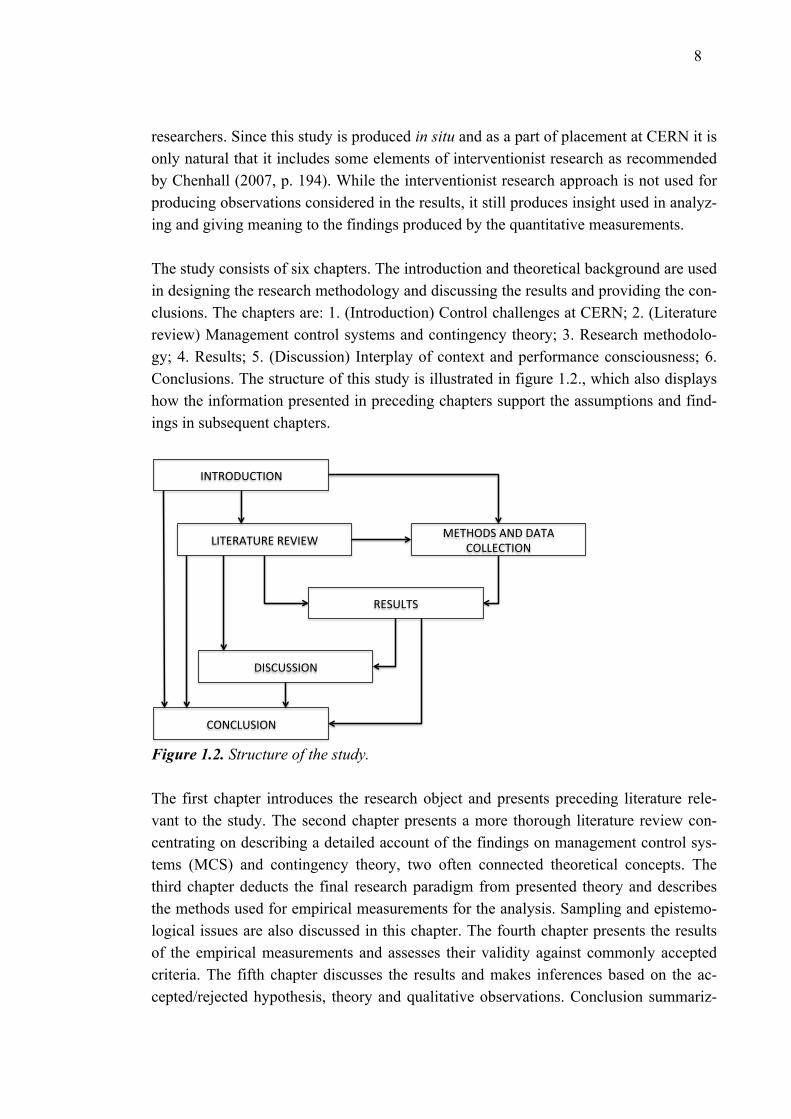
The study consists of six chapters. The introduction and theoretical background are used in designing the research methodology and discussing the results and providing the con-clusions. The chapters are: 1. (Introduction) Control challenges at CERN; 2. (Literature review) Management control systems and contingency theory; 3. Research methodolo-gy; 4. Results; 5. (Discussion) Interplay of context and performance consciousness; 6. Conclusions. The structure of this study is illustrated in figure 1.2., which also displays how the information presented in preceding chapters support the assumptions and find-ings in subsequent chapters.
Figure 1.2. Structure of the study.
The first chapter introduces the research object and presents preceding literature rele-vant to the study. The second chapter presents a more thorough literature review con-centrating on describing a detailed account of the findings on management control sys-tems (MCS) and contingency theory, two often connected theoretical concepts. The third chapter deducts the final research paradigm from presented theory and describes the methods used for empirical measurements for the analysis. Sampling and epistemo-logical issues are also discussed in this chapter. The fourth chapter presents the results of the empirical measurements and assesses their validity against commonly accepted criteria. The fifth chapter discusses the results and makes inferences based on the ac-cepted/rejected hypothesis, theory and qualitative observations. Conclusion summariz-
!"#$%&'(#!%")
*!#+$,#'$+)$+-!+.) /+#0%&1),"&)&,#,)(%**+(#!%")
$+1'*#1)
&!1('11!%")
(%"(*'1!%")

9
ing the theoretical contributions and management implications are provided in the final chapter. The limitations of the study are assessed and reported and recommended direc-tions for future studies are outlined.
10
2. MANAGEMENT CONTROL SYSTEMS IN CONTEXT
In this chapter an in-depth look is provided on the theoretical underpinnings of this study and a literature review of past research on contingency theory and management control systems (MCS) is presented. The literature review is meant to give a compre-hensive view of the empirical findings and theory development preceding this study, thus providing the necessary context to justify and to position this investigation in the body of literature to which this study adds. Some sections of this literature review are further elaborated in the research design chapter where they are used for developing a research paradigm for this study.
2.1. Contingency theory
Here an overview of contingency theory within management accounting and control literature. A historical theory development of contingency theory is given dating from 1907’s. The most commonly researched contextual factors are briefly presented. Studies concerning contingencies in the service sector are examined due to their relevance to the research problem. The concept of how the contextual factors fit with each other and the performance of MCS are presented. Finally competing research strains and suggestion made by previous authors for contemporary directions of contingency research are pre-sented.
The purpose of this review of literature on contingency theory is to form an idea of how context affects operations and results in contingent outcomes in organizational perfor-mance. Being familiar with the different types of control challenges organizational con-text can impose is also important when considering the responses by management to exert control over various activities. This information will be further refined when de-signing the study and the measurement instrument.
2.1.1. Description and overview
Contingency theory states that there is no single best way to control organizations which would universally apply to all organizations at all times and in all circumstances (Chen-hall 2006, p. 93). Contingency theory posits that the internal and external premises of the organization affect the way it operates and thus result in different outcomes. Since the contexts in which organizations operate are never the same for two different organi-

11
zations, it is of interest to see how the various types of contexts generally affect the way organizations are operated and controlled. Contingency theory usually provides the framework for analyzing control within organization (Dent 1990, p. 9), since the differ-ent manifestations of MCS are seen as efforts to organize and control corporate efforts, which are subject to various contingent variables.
Fisher (1995, p. 29) presents three philosophies, originally developed by Hambrick and Lei (1985), which can be used for considering how MCS affect performance. The three approaches of considering the effects of context are situation-specific, contingency and universalism. Situation-specific way of thinking about context assumes that context is always particular to the situation and the organization and observations made in one or-ganization will not yield meaningful theoretical generalizations. Each organization should be examined separately since variety in the contingency base is seen as prohibi-tive of induction. Universalistic view on context assumes that the effects of contextual factors on performance follow natural law-like rules and are thus applicable to all or-ganizations everywhere and at all times. Taking into consideration that empirical find-ings are at times contradictory (Donaldson 1999, p. 64), it is safe to consider that a uni-versalistic approach is not good for modeling the dynamics of context and performance. Contingency theory is hence situated between the situation specific and universalistic approach and it assumes that generalizations can be made within classes of context.
According to Reid and Smith (2000, p. 429) the history of contingency theory, as it is understood today, begins in the 60’s when Burns and Stalker (1961) examined the ef-fects of the external environment on firm structure. Similar studies followed, for exam-ple according to Donaldson (1999, p. 59) Woodward investigated technology and oper-ating procedures. Reid and Smith (2000, p. 429) remark that market environment and strategy were introduced as constructs by Lawrence and Lorch (1967) and Chandler (1962) respectively. The origins of contingency theory thus lie in organizational studies, when the classical management school was challenged by theorists arguing that control-ling organizations would be better served by more decentralized approaches (Donaldson 1999, p. 58).
The findings in these early works have since been expanded on and, for example, na-tional culture has been included as a contingent variable (Chenhall 2007, p. 186). Some authors have advanced the field by collecting and categorizing various findings on con-textual variables and thus building common categories and frameworks. Notably Chen-hall (2007) has synthesized the findings on contingent variables since the 1980’s. The minimum necessary contingency framework by Otley (1980, p. 421), illustrated in Fig-ure 2.1., is an important example of a conceptualization of how context can be studied.
12
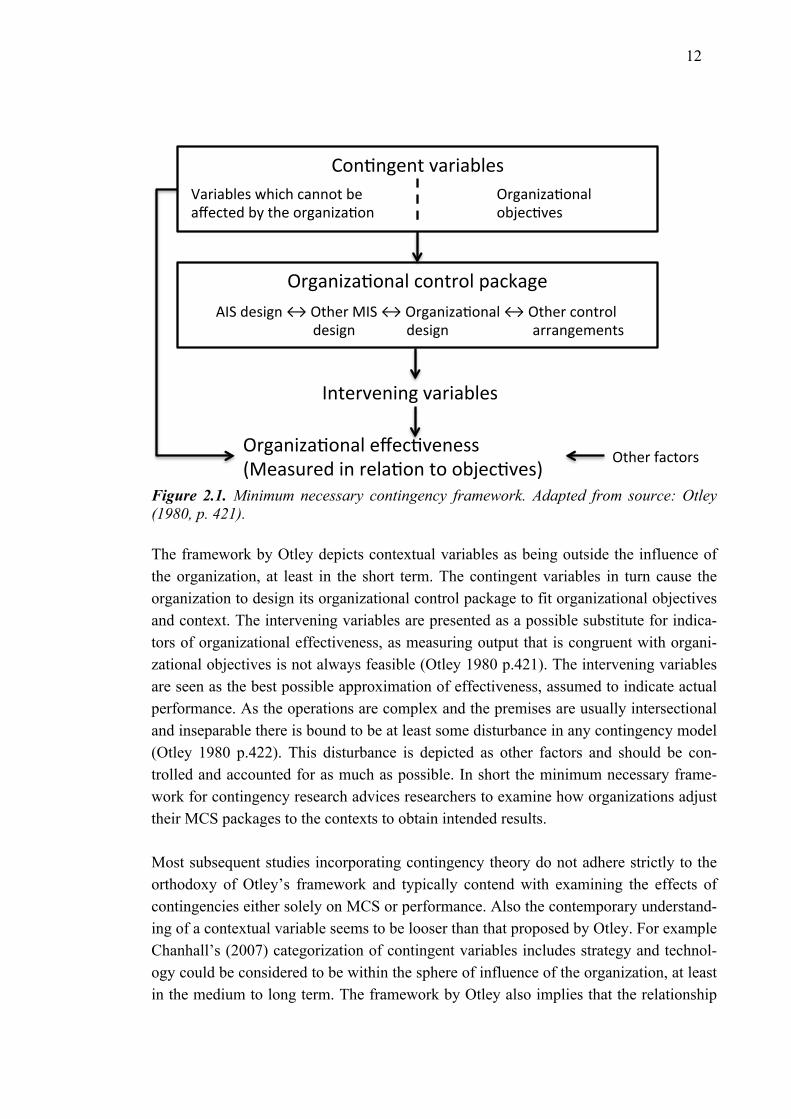
Figure 2.1. Minimum necessary contingency framework. Adapted from source: Otley (1980, p. 421).
The framework by Otley depicts contextual variables as being outside the influence of the organization, at least in the short term. The contingent variables in turn cause the organization to design its organizational control package to fit organizational objectives and context. The intervening variables are presented as a possible substitute for indica-tors of organizational effectiveness, as measuring output that is congruent with organi-zational objectives is not always feasible (Otley 1980 p.421). The intervening variables are seen as the best possible approximation of effectiveness, assumed to indicate actual performance. As the operations are complex and the premises are usually intersectional and inseparable there is bound to be at least some disturbance in any contingency model (Otley 1980 p.422). This disturbance is depicted as other factors and should be con-trolled and accounted for as much as possible. In short the minimum necessary frame-work for contingency research advices researchers to examine how organizations adjust their MCS packages to the contexts to obtain intended results.
Most subsequent studies incorporating contingency theory do not adhere strictly to the orthodoxy of Otley’s framework and typically contend with examining the effects of contingencies either solely on MCS or performance. Also the contemporary understand-ing of a contextual variable seems to be looser than that proposed by Otley. For example Chanhall’s (2007) categorization of contingent variables includes strategy and technol-ogy could be considered to be within the sphere of influence of the organization, at least in the medium to long term. The framework by Otley also implies that the relationship
!"#$#%&#'()*+,*-.&/(0*+,*-.&/(12,32(3*##"'(-&((*4&3'&5(-6('2&("+%*#,7*$"#(
8+%*#,7*$"#*.(("-9&3$)&/(
8+%*#,7*$"#*.(3"#'+".(:*3;*%&(<=>(5&/,%#(?(8'2&+(@=>(?(8+%*#,7*$"#*.(?(8'2&+(3"#'+".((
(((((5&/,%#( ((((((((5&/,%# ((((((((((((((((((((*++*#%&A&#'/(
=#'&+)&#,#%()*+,*-.&/(
8+%*#,7*$"#*.(&4&3$)&#&//((B@&*/C+&5(,#(+&.*$"#('"("-9&3$)&/D(
8'2&+(E*3'"+/(

13
of context and performance is mediated by management control systems, and this is not always the case. Indeed many studies consider MCS and contextual variables to have a moderating relationship which affects performance, as for example in a study by Bisbe and Otley (2004, p. 730).
2.1.2. Contextual factors
Contextual variables affecting performance of the organization have been grouped and classified by Robert Chenhall (2007, pp. 172-188). This categorization is reviewed here to give a comprehensive picture of the most common aspects of organizational context that have been studied in connection with MCS. The categories by Chenhall are external environment, technology, size, organizational structure, strategy and culture. The cate-gorization of the contingent variables is essential for enabling generalizations and ad-vancement of theory. The categories however are non-exhaustive and may overlap. The contingent variables that are included in the empirical part of this study are reviewed in more detail in chapter 3.1.1.
External environment is an important early contingent variable. Khandwalla (1977, cit-ed in Chenhall 2007, p. 172) has characterized external environment as consisting of turbulence, hostility, diversity and complexity. Gordon and miller (1976, p. 60) define the main dimensions of external environment to be dynamism, heterogeneity and hos-tility. Other proposed aspects of external environment include ambiguity, equivocality and controllability (Chenhall 2007, p. 172). Uncertainty has been perhaps the most commonly considered aspect of external environment (Chenhall 2007, p. 172). Uncer-tainty as a category of contingency theory however should not be confused with risk, since they are conceptually different; probabilities can be assigned for risky assump-tions on how events play out, whereas with uncertainties in contingency theory do not have a likelihood. Chenhall (2007, p. 173) concludes on one hand that uncertainty im-posed by the external environment requires more open and non-financial responses by MCS. On the other hand a hostile and competitive external environment seems to re-quire a more formal responses from MCS, for example in the form of strict budget con-trol.
Technology is a category of context that has been under scrutiny since the beginnings of contingency theory. Technology as a contingent variable is not exclusively restricted to technology as an object and means of production, but it also encompasses processes, people and knowledge. Technology in contingency theory refers to techniques and modes of activities, i.e. processes within the organization that turn inputs into outputs. Technology can also refer to a holistic production philosophy such as just-in-time man-ufacturing. Technologies of organizations vary greatly; some organizations deploy complex assembly lines, while others produce highly modular products in batches.
14
Some companies operate entirely based on knowledge and their products are intangible, and their operations require an entirely different setup of activities. These differences in the way organizations operate using a combination of machines, tools, energy, people and knowledge create very distinct challenges for control. The three most important as-pects of technology are standardization, task uncertainty and interdependences. Stand-ardization refers to the degree of task-uniformity and highly standardized technologies are associated with more formal, accountancy-based, control. Task uncertainty refers to the analyzability and predictability of incoming work requests and high task uncertainty increases tension with formal performance measures and is thus associated with infor-mal, more social, forms of control (Hirst 1983, p. 601). Interdependencies refer to the network of dependencies between organizational units. Higher interdependencies are associated with more informal forms of control (MacIntosh and Daft 1987, p. 58).
Strategy is not a subject of interest in this study, but it is briefly presented here as it is a central part of the overall literature review of contingency theory. Strategy is classified as a contextual variable by many researchers even though it is not necessarily a contex-tual element, but can rather be though to provide the context (Hambrick 1980, p. 573). Thus strategy predicts other organizational factors and it is taken that MCS are typically designed to support the strategy (Widener 2004, p. 394). Strategy has been character-ized in many different ways, including conceptualizations such as three strategy typolo-gies (Miles and Snow 1978), build-hold-harvest strategies (Govindarajan and Gupta, 1985), cost-differentiation (Porter 1980), entrepreneurial-conservative (Miller & Frie-sen, 1982). Most contingency-based MCS studies, which include strategy as a contin-gent variable, consider how different strategic positions are associated with different MCS. Chenhall (2007, p. 185) recognized from strategy contingency literature that more diligent strategies, such as defender, or cost leader positions are associated with more traditional and formal control systems.
Size, like strategy, is an important contextual variable due to the way it affects other contingent variables (Chenhall 2006, p. 98). Large organizations have more available options to affect their environment and large-scale operations enable specialization thus reducing uncertainty. The need for information for decision-making for large organiza-tions can become difficult to manage, thus requiring a more decentralized hierarchy and corresponding adjustments to MCS for achieving cohesion. According to Chenhall (2007, p. 183) large organizations are associated with divisionalized organizational structures and specialized operations. Divisonalized organizations require high partici-pation in budget control, which is one the formal aspects of MCS.
Organizational structure is the formal division of roles and relationships, specifically referring to differentiation and decentralization, between the members and units of the
15
organization, which aim at achieving organizational objectives (Otley 1980, p. 419). Differentiation refers to the degree of specialization that different tasks have and decen-tralization is a measure of authority each individual or unit has over its functions. There are many findings concerning the effects of decentralization on various aspects of MCS, but it can be said that larger organizations with more varied functions rely more on for-mal control methods (Merchant 1981, pp. 825-826).
The main premise in including culture as a contingent variable is that as organizations are located in a national context, their workers possess the behavior traits typical for their culture (Chenhall 2007, p. 186). Because of their cultural baggage, they will re-spond in different ways to the chosen control methods. Culture in contingency-based MCS studies is usually observed using the typology by Hofstede (1984), which includes power distance, individualism-collectivism, uncertainty avoidance, masculinity-femininity and long-term orientation. Culture will not be included in the empirical part of this study and the most important and unambiguous finding on the effects of culture on the design of MCS is that it does have an effect. Due to the plurality of different cul-tures, no consensus exists on a deterministic way of assessing how culture affects MCS (Chenhall 2007, p. 187).
2.1.3. Contingency fit
Contingency theory is based on the assumption that organizational performance is a re-sult of how the MCS respond to the contingent variables. This means that for every condition created by a contextual factor there is a MCS response, which will maximize performance in that situation. Some authors have elaborated the nature of this assump-tion in more detail with the notion of fit (Donaldson 1999, p. 69). Drazin and Van de Ven (1985) have presented three prevalent views of how contextual factors affect MCS and performance. These three ways of considering contingency fit are selection, interac-tion and systems approaches. Gerdin and Greve (2004) have further expanded from the-se categories of contingency fit with their mapping of different approaches taken to-wards contingency fit. Contingency fit should not be confused with model fit, which is a method of adjusting the empirical model to fit the data.
The main idea of selection fit is that under the given context only the organizations which are able to adjust their MCS will perform efficiently enough to survive in the marketplace (Drazin and van de Ven 1985, p. 516). This Darwinist perspective on the fit between context and MCS thus states that existing companies must have a good contin-gency fit by the virtue of their mere existence. Thus only the dynamics of context and MCS is interesting and there is no need for examining the link between context and per-formance, because good performance is assumed. However there are many underper-
16
forming companies and the idea of selection fit assumes perfect markets. Selection fit is discouraged by Chenhall and Langfield-Smith (1998, p. 251) because they consider it does not take into account the effects of individual contextual factors or MCS responses, but rather considers each MCS choice has a good fit when in fact the MCS might be just partially optimized. Selection fit is usually analyzed as correlation between variables.
Interaction fit considers that performance is the result of both context and organizational control. This perspective seeks to explain the differences in performance with the com-bined effects of context and MCS working together rather than to answer questions about the causality of these variables. Since interaction basically examines combina-tions of factors it lacks the rigor to produce a coherent body of knowledge, since only particular aspects of context and control are examined at one time (Chenhall 2007, p. 189). Interaction fit does implicitly suppose that some combinations of context and con-trol result in better performance than others. Hartman and Moers (1999, p. 309) recom-mend that some other forms of fit should be used instead of interaction fit.
Systems approach to fit examines the how multiple contextual factors and management control efforts affect each other and performance (Drazin and van de Ven 1985, p. 519). Systems fit is the newest form of contingency fit and its use has spread, enabled by software such as SPSS AMOS, EQS, LISREL and PLS (Chenhall 2007, p. 190). Inter-action fit examines contingencies holistically and the effects and relationship of multi-ple contingencies can be researched together, instead of examining them separately, such as in selection and interaction fit approaches. Systems fit addresses fit of the whole set of chosen variables simultaneously and thus avoids restrictions posed by observing only a limited set of variables. According to Drazin and Van de Ven (1985, p. 520) two approaches are taken concerning systems fit: equifinality and pattern analysis. Pattern analysis assumes the opposite of selection fit, namely that an optimal fit between con-text and control exists and any other type of configuration leads to suboptimal perfor-mance. Equifinality posits that there are multiple equally good configurations of context and control for reaching good performance. Equifinality is thus different from other forms of fit, which state that there is only one best way. Systems approach seems to be the best way to examine contingency frameworks, such as the one proposed by Otley (1980, p. 421).
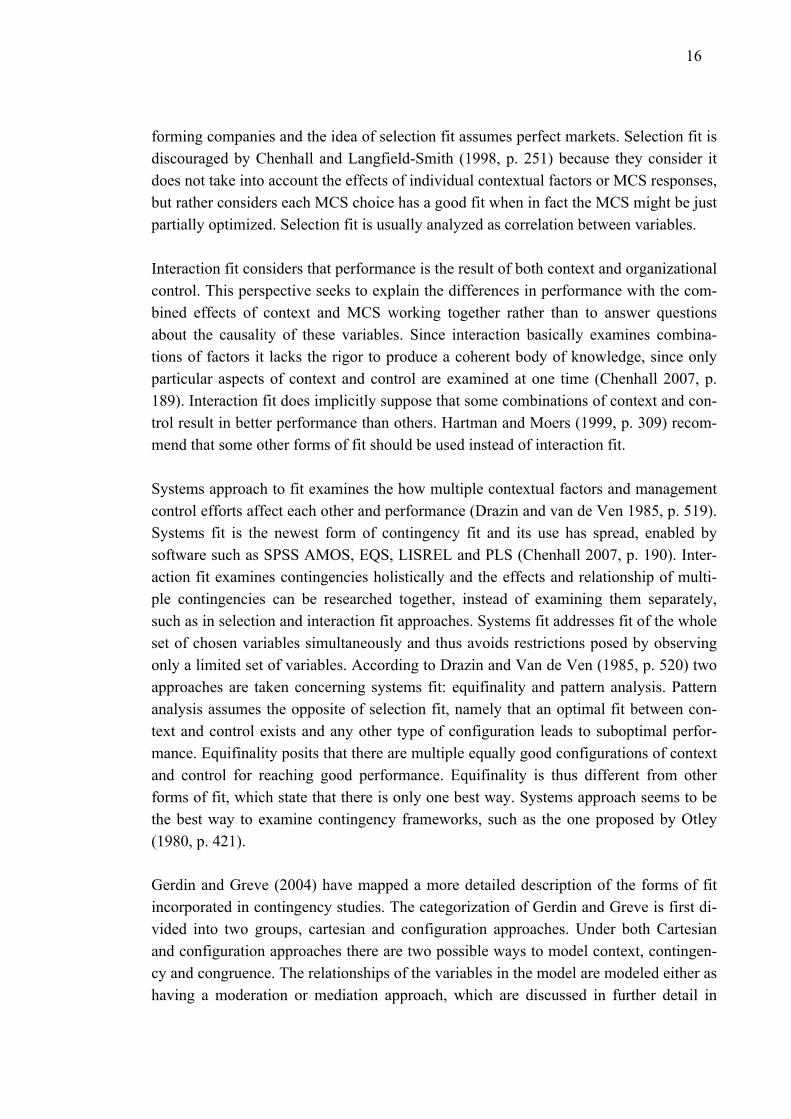
Gerdin and Greve (2004) have mapped a more detailed description of the forms of fit incorporated in contingency studies. The categorization of Gerdin and Greve is first di-vided into two groups, cartesian and configuration approaches. Under both Cartesian and configuration approaches there are two possible ways to model context, contingen-cy and congruence. The relationships of the variables in the model are modeled either as having a moderation or mediation approach, which are discussed in further detail in
17
chapter 3.1.3. If a moderation approach is chosen, either the strength or the form of the relationship can be investigated. Altogether eight approaches are recognized for investi-gating the influence of context. The categorization Gerdin and Greve on the forms of contingency fit is hierarchical and it is presented in figure 2.2.
Figure 2.2. Classification framework for different forms of contingency fit. Adapted from source: Gerdin and Greve (2004, p. 304).
Gerdin and Greve (2004, p. 307) distinguished two forms of analyzing the relationship between context and structure within their classification framework of contingency fit, congruence and contingency. Congruence is conceptually the same as the definition of selection fit by Drazin and Van de Ven (1985, p. 516). Congruence approach for analyz-ing context necessitates a view that existing firms display good performance, because they have been able to survive in the marketplace. This why congruence approach con-siders only the relationship between context and control, but does not concern itself with analyzing the effects of contingency factors on performance. The alternative to congru-ence according to the classification of Gerdin and Greve is called the contingency ap-proach, a nomenclature that might invite some confusion because both approaches rely on contingency theory. Contingency approach as per Gerdin and Greve (2004, p. 307) is characterized as combinations of context and structure, which leads to improved per-formance. The contingency approach of Gerdin and Greve can be considered to include systems fit and interaction fit approaches of Drazin and Van de Ven as described earlier.
Cartesian and configuration approaches for contingency fit are different from each other according to Meyer et al. (1993, p. 1177), who are proponents of configuration ap-proach. A cartesian view deconstructs and reduces context into distinct components and assumes linear relationships between these operationalized variables. The Cartesian
18
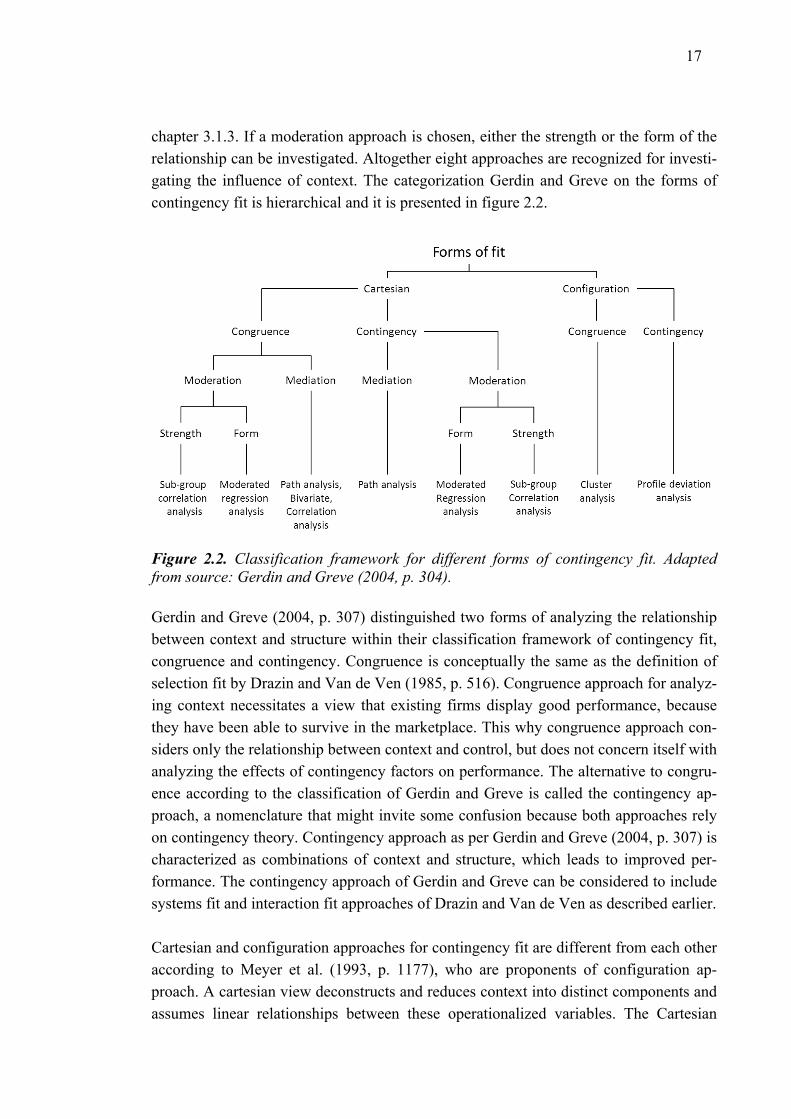
school allows for generalizations as their fit are assumed to be linear and applicable to other organizations (Gerdin and greve 2004, p. 305). As opposed to the cartesian per-spective configuration school dictates that contextual factors cannot be separated and examined in isolation from each other. Some limits have to be set to the possible com-binations of context and control as they otherwise become too numerous and make re-search unfeasible. This is why it is suggested that a finite amount of congruent states where performance is optimal exist (Gerdin and greve 2004, p. 305). Both approaches face the problem recognized by Gresov (1989, p. 431) that every single effect of context cannot be captured by the models. The context of Cartesian and configuration ap-proaches to contingency fit are illustrated in figure 2.3.
Figure 2.3. Cartesian and congruence forms of fit. Adapted from source: Gerdin and Greve (2004, p. 306).
Moderation and mediation are two different statistical methods used for relating varia-bles and Gerdin and Greve (2004, p. 309) have included these as methodological choic-es in their framework of contingency fit classification. Moderation dictates that the moderating variable sets the conditions under which the independent variable has an effect on performance, where the moderating and independent variable are context and control structures in contingency-based MCS studies. The moderating variable should not have a theorized causal effect on the dependent variable. Moderation is conducted in statistical analysis by simply multiplying the concerned variables. The strength and form of the relationship between the variable can be measured in moderation models (Gerdin and Greve 2004, p. 310). Mediation explains the mechanism by which the con-text leads to a response in MCS and which in turn has an effect of organizational per-formance. Moderation and mediation are discussed in further detail in chapter 3.1.3.
!"#$%&$'()*+'
()*+'
,"-',"-'
()*+'.%/0"/12#3%'
()*+'.%/0"/12#3%'
()*+'.%/0"/12#3%'
4$/53$5/%'
!"#$%&$'()*+'
()*+'
,"-',"-'
4$/53$5/%'
()*+'.%/0"/12#3%'
!"#$%&'#(')*++%"*(,)-")("#.#$'#(/)0-) !*%-'12*#)*++%"*(,)-")("#.#$'#(/)0-)
19
2.1.4. Context and services
Services are the focus of this study, and thus contingency literature related to services is reviewed separately here. Services are challenging to measure and this causes problems for control (Jääskeläinen et al. 2012, p. 43). Services can also be very heterogeneous (Sherwood 1994, p. 12), ranging from commercial services and professional services to even more intangible computing services. This diversity demonstrates that services can incorporate very different operations and findings in one service sector could be com-pletely inapplicable to other situations. This is to say that considering all services to be similar is not reasonable and the applicability of generalizations concerning services is to be assessed critically.
Even though providing services can be a very varied task between different sectors, some properties of services remain similar. These qualities of services are what cause the difficulties for measuring service performance. The four categories of service prop-erties, which differentiate services from other transactions, are referred to as IHIP: in-tangibility, heterogeneity, inseparability and perishability (Edvardsson 2006, p. 108). Intangibility refers to the lack physical essence of services, which makes it impossible to verify them before purchase. Heterogeneity in this context refers to the variation which occurs in the provision of the same service transaction due to the participation of the customer. It is important to note that heterogeneity in this case is not the same as heterogeneity between different types of services, as mentioned in the previous para-graph. Services are perishable in the sense that they are temporal and exist only in the moment of transaction. After a service is consumed, the services do not exist anymore and leave only a memory. Services are inseparable in the sense that they are produced and consumed together at the same instance. Inseparability has been criticized by Love-lock and Gummeson (2004, p. 29) because they maintain that many services can in fact be separated.
Inseparability and perishability as properties of services that might not be completely applicable to modern IT services (Edvardsson 2005, p. 116). This is because they can be offered at many locations at all times. Concepts of high-touch and high-tech services can shed light to the removal of the restrictions of inseparability and perishability for IT services. Services can be described into high-touch and high-tech services, where high-touch necessitates human contact for mediating the service provision and the distribu-tion of high-tech services is done using IT and other technological resources (Salomann et al. 2007, p. 312). In addition to the IHIP categories Grönroos and Ojasalo (2004, p. 417-418) note that customer participation and the relationship between the customer and the service provider are important characteristics of services. Customer input and cus-tomer relationship could potentially be valid contingency factors for services, even though this has not been studied (Jääskeläinen et al. 2012, p. 47).
20
Measuring services is difficult due to the aforementioned IHIP properties, but two tech-nical aspects related to measuring service performance must also be considered; service quality and the choice of the unit of analysis (Sherwood, p. 12 and p. 15). Service out-puts are difficult to quantify and the intangible nature of services makes establishing a single transaction unit. This is why alternative interpretations may challenge the rele-vance of units of analysis. It is also common that a quantifiable and measurable service output does not fully capture the quality of the service as perceived by the customer. Maintaining consistent and high quality service operations is imperative for organiza-tions, since this is a customer-facing activity and has a direct impact on organizational image, which provides strategic competitive advantage in the long run (Bhimani 2006, p. 78).
It is a logical conclusion that contextual factors affecting service operations would dis-play different emphasis with the interaction of control systems and performance. Thus, Jääskeläinen et al. (2012, pp. 46-47) have recognized from contingency literature some contextual factors, which seem to especially affect the measurement of services. These contingent variables are customer involvement; role of intangible inputs; variation in the levels of demand; output complexity; focus on impacts and process repetitiveness. Jääskeläinen et al. (2012, pp. 48-49) also present a framework for analyzing and design-ing performance measurements for service operations, which takes into account service-specific contextual factors. They outline three main tasks, which are choosing factors for measurement, designing measures and the technical and social aspects of implemen-tation. Their framework is presented in the form of a checklist and includes issues that are relevant for each of the three main tasks. This framework has practical and theoreti-cal value when designing measurements, since it considers the unique nature of service activities.
2.1.5. Critical review and contemporary directions
Contingency theory within management control studies means that certain forms of MCS manifest under given conditions but there are many other theories which also seek to explain the relationship between context and structure from different assumptions. Chenhall (2007, pp. 191-194) and Baxter and Chua (2003) present a review of theories that have been applied by some researchers to offer alternative explanations to contin-gency theory. These alternative theories are a potential source of new perspectives on the dynamics of control and context.
An economics perspective on context and control typically approaches this dynamic with agency theory. Agency theory assumes that organizational actors are self-serving and this is why agents who are contracted by the principal to carry out tasks to fulfill organizational objectives do so more efficiently as long organizational targets align with

21
their own goals (Kunz and Pfaff 2002, pp. 276-277). Consequently the effects of em-ployee incentives have typically been the subject of these studies (Baiman 1990, p. 350). Agency theory could be considered insufficient in explaining how MCS form, since the principle-agent relationship itself is subject to the influence of contingent fac-tors.
According to Chenhall (2007, p. 192) another theory seeking to explain the emergence of certain forms of control is the population ecology theory, which asserts that within the population of organizations only the successful and adaptive ones survive. Popula-tion-ecology theory is thus very similar to the selection approach of contingency fit. As opposed to the macro view of organizational ecology, Chenhall notes that psychological studies have also been used to examined how individuals react to different forms of con-trol. For example he notes that Brownell (1981) researches how budgetary participation is affected by perceived satisfaction for supervision. The psychological approach to con-trol could explain how people react in different contexts and what implications this has for control.
Behavioral economics takes a different approach towards the relationship of context and structure by examining how people behave in given contexts from the viewpoint of be-havioral science, psychology and economic theory. Some findings from behavioral eco-nomics suggest for example that managers have a set of template responses (Cohen et al. 1972, p. 16), a view that would suggests a disconnect between context and MCS. Chenhall (2007, p. 193) says that behavioral economics does not usually go beyond de-scribing a manufactured and artificial situation and does not provide a way forward through generalizations.
Chenhall (2007, p. 193) criticizes MCS studies for relying on a functionalist paradigms and disregarding underlying socially constructed power structures and motives. Baxter and Chua (2003, pp. 112) provide an overview of studies that have approached studying MCS mainly from a sociological perspective and find that sociological studies concern-ing MCS have uncovered the different rationales and meanings underlying control asso-ciated with MCS. Chenhall (2007, p. 194) ponders whether findings stemming from these alternative social studies of MCS can be combined within the functionalist para-digm to produce more profound insight, but notes that this approach is unlikely to result in generalizable knowledge, which has long been the goal of contingency-based MCS studies.
Kihn (2010, pp. 484) has summarized some of the new directions taken by research in performance outcomes, which is closely linked to research in contingency-based MCS. She lists among positive developments the use of triangulation and comparison of find-
22
ings to previous studies (Kihn 2010, p. 480). This consolidation of observations from case studies combined with more statistical analyses rents more validity to generaliza-tions. Another notion by Kihn is the use of multiple variables and inclusion of mediat-ing variables, enabled by the use of advanced statistical methods such as SEM.
Kihn has also recognizes some under-researched gaps which might hinder development of management accounting and control theory (Kihn 2010, p. 484). One aspect left with little attention was the problem of assigning non-financial variables, such as quality, as dependent measures (Perera et al. 1997, p. 570), an issue important especially for ser-vices. Kihn also laments the lack of combining non-financial performance measures with other empirical data in simultaneous analyses. Longitudinal studies of contextual factors and MCS, such as the study by Davila and Forrester (2007), should also prove useful in the future in tracking historical path dependence of MCS development. Finally Kihn (2010, p. 481) states that the nature of causality usually remains to be rigorously determined.
2.2. Management control systems
A review of literature related to management control systems within organizations is presented in this chapter. First a brief overview and a definition of MCS is given. Dif-ferent approaches by different authors as to the formal/informal aspects of MCS are dis-cussed. Management accounting is presented separately, because it is typically a very integral part of MCS. Levers of control framework is introduced as it is perhaps the most typical approach towards organizational control. A review is made of how MCS are applied usually as a package and have different roles in organizations. Finally some critique and contemporary directions for MCS studies are given. The purpose of this chapter is to give an actionable perspective to the results of the empirical investigation. In other words, the empirical results can be reflected with the theory presented here to suggest management control system responses suitable under the measured context at CERN.
2.2.1. Description and overview
Management control was given its current definition first by Robert Anthony in 1965 as a “…process by which managers assure that resources are obtained and used effectively and efficiently in the accomplishment of the organization’s objectives.”. This portrayal led subsequent studies to concentrate mainly on formal accounting practices used for influencing the behavior of people in organizations (Otley 1994, p. 289). A more en-compassing definition for management control is given by Flamholtz (1983, p. 154) who describes management control as activities that intend to affect the behavior of people so that they result in the attainment of organizational objectives. This broader
23
concept includes culture and other non-accounting based mechanisms for attaining goal congruence with organizational objectives.
Other concepts similar to management control systems have been introduced by other authors (Chenhall 2007, p. 164). Management accounting (MA) is a group of quantita-tive practices, which can be based in financial and non-financial units, that are used for gathering, analyzing and reporting information on organizational effectiveness. Man-agement accounting system (MAS) and Management accounting and control systems (MACS) refer to the broader use of information provided by MA (Bouwens and Aber-nathy 2000, p. 222), but they are still considered to be more narrowly defined than MCS (Kennedy and Widener 2008, p. 305). Accounting information systems (AIS) studies observe the role of information technologies in realizing management control (Granlund 2011, p. 9). Kennedy and Widener (2008, p. 305) characterize organizational control (OC) as a more encompassing concept than MCS. The categorizations described here are conceptually intersectional with MCS and they are sometimes used with the same meaning, or with slightly different emphasis.
Measurement is a central part of management control justified by an old adage, originat-ing from Lord Kelvin, which says that what is not measured, cannot be controlled (Pav-lov and Bourne 2011, p. 102). Management accounting and other formal and quantifia-ble control instruments are used for measuring organizational performance. The perfor-mance measurements can be done using monetary units of analysis or some other opera-tional proxy. Measurement instruments also function as a medium for discourse within organizations for decision-making, since they provide a commonly agreed terminology and agenda (Otley 1999, p. 364).
Management accounting and management control systems are sometimes mistakenly understood to be the same concept and, in addition to accurate and relevant measure-ments, exercising control in organization requires non-accounting based forms of con-trol. While essential for control, performance measurement is not the be-all and end-all of MCS (Merchant and Van der Stede 2007, p. 76). MA assists in aligning the organiza-tional activities with the intended goals, but these decisions have to be implemented us-ing non-accounting based methods. These non-accounting based forms of control are defined in the object-of-control framework by Merchant and Van der Stede (2007, p. 76, p. 83 and p. 85) as action controls, personnel controls and cultural controls. Another, and the most widely accepted, categorization of these controls is the levers of control framework by Simons (1995, p. 67).
Simons (1995, p. 5) defines management control systems as “the formal, information-based routines and procedures managers use to maintain or alter patterns in organiza-
24
tional activities”. Management control systems are however typically described to have formal and informal aspects (Modell 1996, p. 76). Informal, social ways of control, such as clan controls and organizational culture, are an integral part of any intentions to im-plement organizational objectives into the tasks of the employees (Chenhall 2007, pp. 167-168). Many authors express the different facets of MCS in different ways than the formal-informal dichotomy presented above. Simons (1995, p. 161) presents loose-tight controls to describe the dichotomy, whereas Chenhall (2007, pp. 168-169) discusses similar phenomena using organic-mechanistic separation for the different forms of con-trol. Similarly, Otley (1994, p. 298) states the different forms of control as restricted ac-counting controls and flexibility and Whitley (1999, p. 520) uses personal and imper-sonal as the distinction. It is important to note that non-accounting forms of control are not the same as informal forms of control. Informal control refers exclusively to latent forms of control, which are not explicitly stated and communicated in the organization using established protocol, whereas formal forms of control are systematically imple-mented (Widener 2007, p. 759).
2.2.2. Management accounting as an important element of MCS
Management accounting (MA) and management accounting systems (MAS) are a part of formal MCS and enable better decision-making by providing quantitative data. MA is an integral part of MCS so it will be reviewed here separately. In addition to gathering analyzing and communicating information for decision-making, MA can also affect be-havior by directing the locus of attention to certain core activities in the organization and by imposing constraints. MA information functions as a way of sanctioning incen-tives and social control within organizations, making it safe to say “you get what you measure”.
The effects of contingencies on MA are measured in quantitative studies in relation to the type of information it provides. Four characteristics of accounting information have been categorized; timeliness, aggregation, scope and integration (Chenhall and Morris 1986, p. 19). Timeliness is defined as the ability of the MA system to provide infor-mation on request and as the frequency of the reporting. Timely and up to date MA in-formation increases management’s ability to respond to changes quickly. Scope of MA refers to the focus, quantification and time horizon of MA information, where broad scope MA gathers operational information also from the external environment. A tradi-tional, narrow scope MA concentrates mostly in internal cost accounting. Aggregation of MA information is the extent to which the data is summarized either temporally or by function. MA integration is the extent to which MA information coordinates activities within organizations, for example through the setting of targets and objectives for coop-eration. Other aspects of MA have been studied, such as sophistication and reliance on accounting performance measures (RAPM) (Chenhall 2007, p. 165) These strains of
25
research on MA are not seen as relevant to this study, as they are not typically con-cerned with contingency theory.
Some findings from MA characteristics within contingency studies are summarized here. Bouwens and Abernathy (2000, p. 234) find that customization affects MAS char-acteristics through interdependence, which links interdependence to the use of MA sys-tems in non-standard circumstances. Chenhall and Morris (1986, pp. 30-31) discovered that decentralization was related to the propensity for choosing aggregated and integrat-ed information and that environmental uncertainty led to a preference for timely and broad scope MA information. Chenhall and Morris further noted that high interdepend-ence was association with broad scope, aggregated and integrated MA information. Chang et al (2003, p. 701) indicate that performance is improved when broad scope in-formation is associated with task uncertainty. Soobaroyen, and Poorundersing (2008, p. 205) do not find the relationship between task uncertainty and MA design, but discover that decentralization is related to all of the four dimensions of MA information.
2.2.3. Levers of control framework
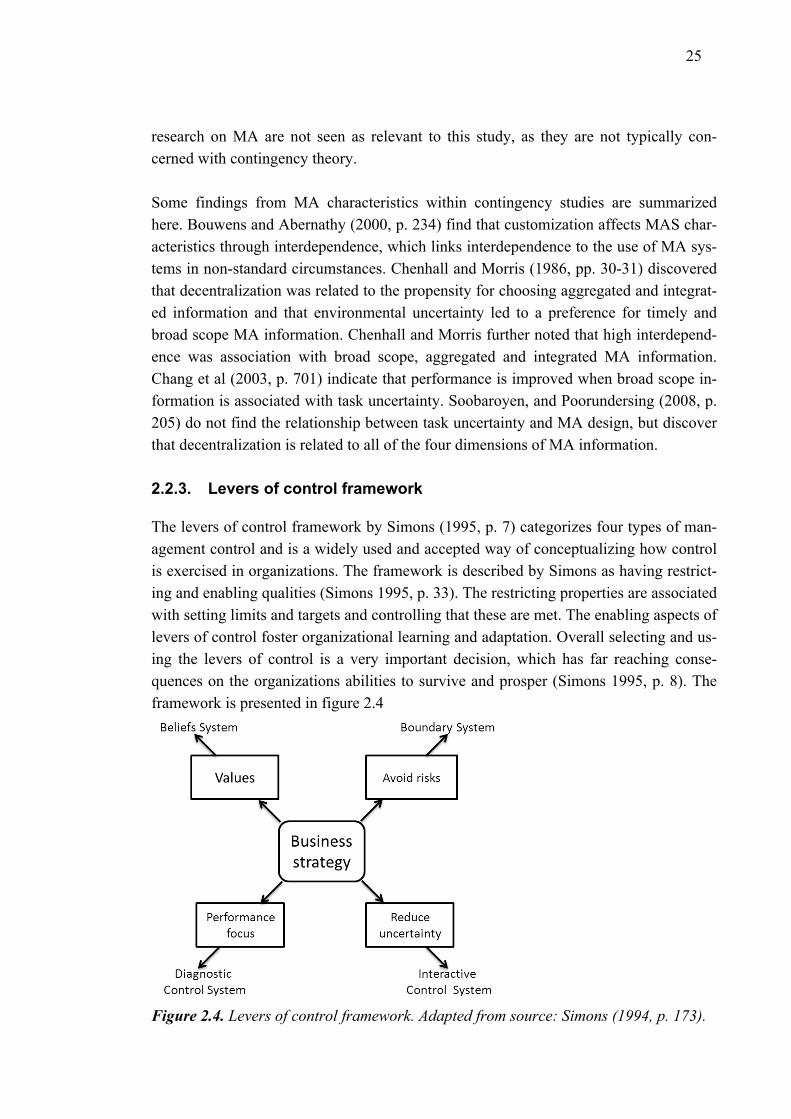
The levers of control framework by Simons (1995, p. 7) categorizes four types of man-agement control and is a widely used and accepted way of conceptualizing how control is exercised in organizations. The framework is described by Simons as having restrict-ing and enabling qualities (Simons 1995, p. 33). The restricting properties are associated with setting limits and targets and controlling that these are met. The enabling aspects of levers of control foster organizational learning and adaptation. Overall selecting and us-ing the levers of control is a very important decision, which has far reaching conse-quences on the organizations abilities to survive and prosper (Simons 1995, p. 8). The framework is presented in figure 2.4
Figure 2.4. Levers of control framework. Adapted from source: Simons (1994, p. 173).
26
Simons’ framework consists of four types of control, or levers, which are each one way of addressing the needs of the organization to manage and produce goal congruence among activities. The levers are diagnostic control systems, boundary control systems, interactive control systems and belief control systems. All of the four levers of control are types of formal control in organizations and each lever addresses a different type of control exercised by the management. Widener (2007, p. 760) states that it is commonly agreed that the levers are not separate and individual types of control, but that they are rather complementary and must used in combination to produce effective results.
Beliefs system is defined by Simons as the explicit rules designed and promoted by the top management with the intention of nurturing organizational behavior and culture which assists in achieving organizational objectives and in seeking opportunities (Wid-ener 2007, p. 761). These ideas and beliefs are communicated and reinforced consistent-ly and this makes them a control system lever. It would be easy to say that organization-al culture and beliefs would be situated strictly in the informal control domain, but when these are implemented systematically they form a control lever which the management can use to affect behavior. Simons (1995, p. 36) states that beliefs systems are formal and based on information allowing management to influence them directly. Beliefs sys-tems are implemented in organizations through the symbolic use of information (Feld-man and March 1981, p. 180), or by designing and enforcing formal mission and vision statements.
The environments in which organizations operate are often volatile and this is why it is sometimes desirable to limit risk taking by asserting boundaries as a form of control (Widener 2007, p. 759). Boundary systems seek to impose limits, defined by business risks, that discourage behavior that does not lead to the attainment of strategic objec-tives (Simons 1995, p. 39). These boundary limits restrict creative activities and oppor-tunity seeking, but also eliminate wasteful and counterproductive endeavors and allow for more decentralization within organizations (Simons 1995, p. 41). Boundary systems are often implemented through the use of rules and codes of conduct (Widener 2007, p. 759).
Diagnostic control systems are intended for goal achievement and they do this by gath-ering information on important success factors, such as key performance indicators (KPI), and providing feedback on current progress (Widener 2007, p. 759). By inform-ing employees about their current performance diagnostic control systems are able to manage and direct behavior predictably and consistently towards desirable goals. An-other benefit of diagnostic control systems is that they enable the setting of baselines to which future actions can be benchmarked. This way, by establishing explicit targets, diagnostic control systems can also work as a way of setting formal incentives for fur-
27
ther encouraging desired behavior (Simons 1995, p. 79). Measures needed for diagnos-tic control systems are basically provided by MA activities, but they can also be subjec-tive and rely on the discretion of the management (Simons 1995, p. 76).
Interactive control system is based on measurements and coordination, but it is more forward looking than diagnostic control systems (Widener 2007, p. 760). While diag-nostic control systems and interactive control systems are very similar and both are based on feedback loops, the essential difference between them is in how managers choose to use them (Simons 1995, p. 96). What makes a control system interactive or diagnostic depends on whether the management uses them in an interactive or passive way. A control system is interactive when it necessitates the continual attention of the management either by choice or by the nature of the measure (Simons 1995, pp. 96-97). When managers engage in control systems, they amplify the feedback loops resulting in more responsive and effective control. This in turn will result in better sharing of infor-mation, learning and emergent new ways of reaching the strategic goals (Simons 1995, p. 99). As opposed to interactive control systems diagnostic control systems are a way of confirming that the organization is simply on the right way.
Simons adds a fifth element, internal controls, which purports to assure the quality of the reported data in the diagnostic control lever (Simons 1995, p. 84). Internal controls function as the checks and balances within the organization, which seek to ensure the integrity of the information from a technical as well as from a moral viewpoint. Internal controls are built around structural safeguards, staff safeguards and system safeguards. Structural safeguards include audits and the definition of duties and authority. Staff safeguards consist training, provision of resources and job rotation. System safeguards deal with documentation, reporting and data quality.
Beliefs system and interactive control system are seen as enablers of innovation and forces driving adaptability to strategic uncertainties by encouraging intrinsic motivation and learning (Simons 1995, p. 158). Contrary to this boundary system and diagnostic control system are characterized by Simons as constraining because they direct the fo-cus of attention and seek to eliminate unwanted behavior by imposing extrinsic re-strictions. Boundary and beliefs system are not cybernetic, as they are not designed around feedback loops, but are instead superimposed rules of behavior (Simons 1995, p. 33). Diagnostic control system and interactive control system on the other hand are cy-bernetic since they are designed to increase cooperation.
2.2.4. MCS as a package
As stated by Widener (2007, p. 760) in the previous chapter, the levers of control func-tion in combination, forming system that can be characterized as a package. The idea of
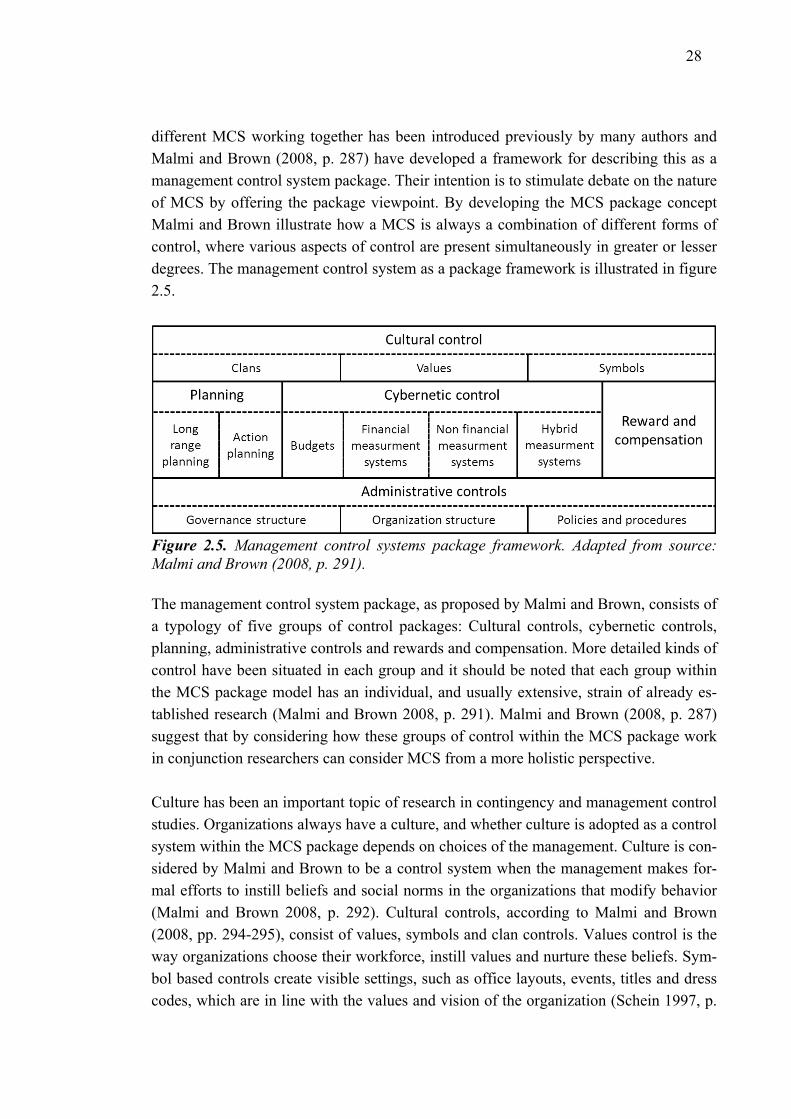
28
different MCS working together has been introduced previously by many authors and Malmi and Brown (2008, p. 287) have developed a framework for describing this as a management control system package. Their intention is to stimulate debate on the nature of MCS by offering the package viewpoint. By developing the MCS package concept Malmi and Brown illustrate how a MCS is always a combination of different forms of control, where various aspects of control are present simultaneously in greater or lesser degrees. The management control system as a package framework is illustrated in figure 2.5.
Figure 2.5. Management control systems package framework. Adapted from source: Malmi and Brown (2008, p. 291).
The management control system package, as proposed by Malmi and Brown, consists of a typology of five groups of control packages: Cultural controls, cybernetic controls, planning, administrative controls and rewards and compensation. More detailed kinds of control have been situated in each group and it should be noted that each group within the MCS package model has an individual, and usually extensive, strain of already es-tablished research (Malmi and Brown 2008, p. 291). Malmi and Brown (2008, p. 287) suggest that by considering how these groups of control within the MCS package work in conjunction researchers can consider MCS from a more holistic perspective.
Culture has been an important topic of research in contingency and management control studies. Organizations always have a culture, and whether culture is adopted as a control system within the MCS package depends on choices of the management. Culture is con-sidered by Malmi and Brown to be a control system when the management makes for-mal efforts to instill beliefs and social norms in the organizations that modify behavior (Malmi and Brown 2008, p. 292). Cultural controls, according to Malmi and Brown (2008, pp. 294-295), consist of values, symbols and clan controls. Values control is the way organizations choose their workforce, instill values and nurture these beliefs. Sym-bol based controls create visible settings, such as office layouts, events, titles and dress codes, which are in line with the values and vision of the organization (Schein 1997, p.
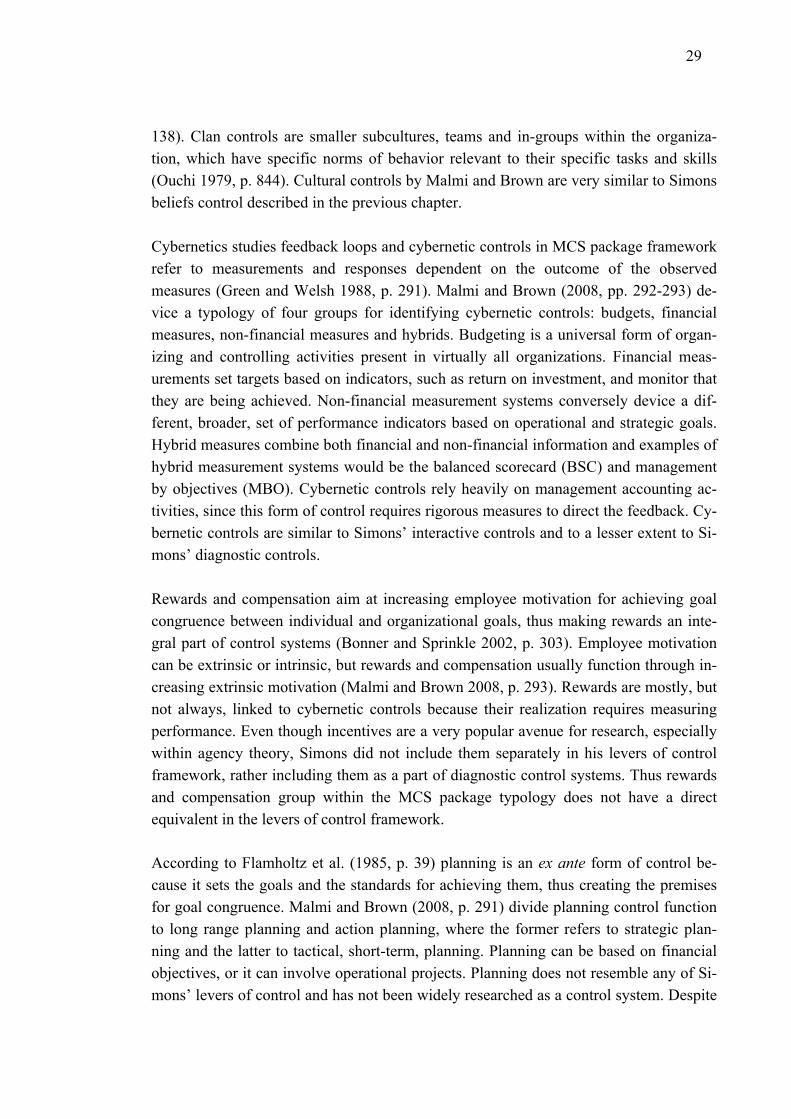
29
138). Clan controls are smaller subcultures, teams and in-groups within the organiza-tion, which have specific norms of behavior relevant to their specific tasks and skills (Ouchi 1979, p. 844). Cultural controls by Malmi and Brown are very similar to Simons beliefs control described in the previous chapter.
Cybernetics studies feedback loops and cybernetic controls in MCS package framework refer to measurements and responses dependent on the outcome of the observed measures (Green and Welsh 1988, p. 291). Malmi and Brown (2008, pp. 292-293) de-vice a typology of four groups for identifying cybernetic controls: budgets, financial measures, non-financial measures and hybrids. Budgeting is a universal form of organ-izing and controlling activities present in virtually all organizations. Financial meas-urements set targets based on indicators, such as return on investment, and monitor that they are being achieved. Non-financial measurement systems conversely device a dif-ferent, broader, set of performance indicators based on operational and strategic goals. Hybrid measures combine both financial and non-financial information and examples of hybrid measurement systems would be the balanced scorecard (BSC) and management by objectives (MBO). Cybernetic controls rely heavily on management accounting ac-tivities, since this form of control requires rigorous measures to direct the feedback. Cy-bernetic controls are similar to Simons’ interactive controls and to a lesser extent to Si-mons’ diagnostic controls.
Rewards and compensation aim at increasing employee motivation for achieving goal congruence between individual and organizational goals, thus making rewards an inte-gral part of control systems (Bonner and Sprinkle 2002, p. 303). Employee motivation can be extrinsic or intrinsic, but rewards and compensation usually function through in-creasing extrinsic motivation (Malmi and Brown 2008, p. 293). Rewards are mostly, but not always, linked to cybernetic controls because their realization requires measuring performance. Even though incentives are a very popular avenue for research, especially within agency theory, Simons did not include them separately in his levers of control framework, rather including them as a part of diagnostic control systems. Thus rewards and compensation group within the MCS package typology does not have a direct equivalent in the levers of control framework.
According to Flamholtz et al. (1985, p. 39) planning is an ex ante form of control be-cause it sets the goals and the standards for achieving them, thus creating the premises for goal congruence. Malmi and Brown (2008, p. 291) divide planning control function to long range planning and action planning, where the former refers to strategic plan-ning and the latter to tactical, short-term, planning. Planning can be based on financial objectives, or it can involve operational projects. Planning does not resemble any of Si-mons’ levers of control and has not been widely researched as a control system. Despite
30
this Malmi and Brown include it in their typology because they see it as a major influ-ence to employee behavior. They further note that the role of planning as a control sys-tem depends on the degree of including employee commitment to the planning process.
Administrative controls affect behavior in the organization through the design of the structure of activities, assignment of roles and hierarchies, definition of tasks and as-signment of authority and accountability. According to the MCS package typology by Malmi and Brown (2008, pp. 293-294) administrative controls include three main groups: organizational design, governance structure and procedures and policies. Organ-izational design is how the activities in the organization are structured and is a form of control in the sense that function specialization and relationships within the organization decrease the variability of behavior, enabling an accurately responsive and controllable system (Flamholtz 1983, p. 158). Governance structure refers to the degree of centrali-zation and decentralization and the formal protocol for communications and coopera-tion. Procedures and policies address the requirement for proper behavior in organiza-tions through bureaucratic rules and policies, such as standard operating procedures. Administrative controls resemble boundary controls and internal controls in Simons’ levers of control framework.
The management control system package is assembled from the five different groups in the MCS package framework in an a la carte fashion. Effective control requires an ap-propriate configuration of the management control systems package, according to the needs of the organization and the contingency factors affecting it (Malmi and Brown 2008, p. 288). Malmi and Brown note further that another aspect of importance in de-ciding the implementation and emphasis of the MCS package is how the different groups affect each other and work together (Malmi and Brown 2008, p. 297).
2.2.5. Roles of MA
Burchell et al. (1980, p. 13) have introduced a framework for conceptualizing how man-agement accounting systems function and what roles they have in practice. Their find-ings indicate that MA is used in different ways in decision-making under certain and uncertain conditions. Laine, Paranko and Suomala (2012, pp. 219-227) have later elabo-rated on the idea of the roles of MA and applied the framework into servitization pro-cesses. While the framework is originally designed for management accounting it is deemed in this study that it can also be used to describe the roles of management control systems because MA is an essential part of cybernetic controls and interac-tive/diagnostic control systems. The roles of MA framework is presented in figure 2.6.
31
Figure 2.6. Roles of MA in decision-making. Adapted from source: Laine, Paranko and Suomala (2012, p. 220).
The roles of MA framework examines how managers use MA information in decision-making in situations where varying levels of certainty exist over the objectives and the cause and effect of actions. Two types of uncertainty affecting the roles of MA exist: uncertainty over the objective of action and over the cause and effect of action (Burchell 1980, pp. 13-14). The roles MA categorization includes four generic uses: answer ma-chine, ammunition machine, learning machine and rationalization and inspiration ma-chine (Laine, Paranko and Suomala 2012, p. 220).
Under uncertain conditions concerning both the objective and the consequences of ac-tion MA usually assumes the role of a rationalization and inspiration machine. This means that information gathered and communicated through MA can have a significant effect on behavior even in the absence of goals, because MA information can be used for justifying already done decisions (Burchell 1980, p. 15). Rationalization and inspira-tion machine role occurs often when new activities are introduced to the MA function, since the behavior of these measurements is not yet well known.
MA takes the role of an ammunition machine when uncertainty about objectives is high and the consequences of actions are well known. As an ammunition machine MA serves as the rationale for deciding trade-offs between conflicting goals. With the absence of comparable and unambiguous outcomes, competing actors within the organization can use MA in innovative ways to demonstrate how their activity will have a positive effect on the goals of the organization (Laine, Paranko and Suomala 2012, p. 220). In this way different groups and individuals can use MA as an ammunition machine to win political power over the priorities of the organization.
When the outcomes of the activities are well known, but the cause and effect of the ac-tivities are shrouded in uncertainty MA can be used as a learning machine. In these situ-ations MA systems are used for gathering information about the cause and effect of the activities, thus facilitating learning (Chapman 1997, p. 202). This learning happens be-
32
cause understanding about the mechanics of an activity and its role in the organization is achieved through MA.
In situations where both the objective and the consequences of action are known MA takes the role of an answer machine. In these cases the optimal outcome of activities can be modeled and resources can be allocated accordingly, providing an obvious solution and removing doubt over the variability in the achievement of desirable results from decision-making (Burchell et al. 1980, p. 14). These answers include typical manage-ment accounting and financial accounting processes such as investment appraisals.
The roles of MA framework shows that accounting and control can also drive social be-havior in a powerful way through shaping the power and politics in an organization (Burchell 1980, p. 22). Laine, Paranko and Suomala (2012, p. 219) illustrate this by positing that MA takes several roles in the process of servitization and, as the uncertain-ty over the objective and the consequences of actions decrease, the role of MA changes to better support service activities. MA is used in different roles depending on whether the services need to be justified, defined and, ultimately, controlled.
2.2.6. Critical review and contemporary directions
The frameworks presented in this chapter are overlapping and share many similarities. The commonalities between the levers of control and MCS as a package frameworks were discussed in chapter 2.2.4, but they also share some resembling features with the roles of MA typology. In addition to the frameworks featured in this chapter, there are other approaches for classifying control, such as the object of control framework by Merchant and Van der Stede (2007, p. 16) and the viable system model (VSM) by O’Grady, Rouse and Gunn (2010, p. 100). These frameworks build on the same body of research featured before, offering different perspectives on conceptualizing control in organizations, making it likely that many similarities are bound to exist between the models.
An example of the commonalities between the levers of control, MCS package and MA roles frameworks would be that the answer machine role of MA somewhat corresponds to the diagnostic control lever within Simons’ levers of control and to the financial measurement system within the MCS as a package framework. The learning machine role of MA on the other hand resembles Simons’ interactive control systems. The simi-larities are intersectional but a one to one correspondence between categories in differ-ent frameworks does not exist, as some categories do not have an equivalency in other frameworks. An example of this would be the role of MA as a rationalization and inspi-ration machine or planning within the MCS package, which do not have a comparable conceptualization in other typologies.

33
An important issue concerning management accounting and control studies is the role of theory. Malmi and Granlund (2009, p. 598) argue that as an applied field management accounting should produce theoretical results useful for the object of the studies, in this case for the personnel accountable for organizational control. MAS and control studies should thus give advice on selecting the type of MAS as well as for guiding implemen-tation, development and adaptation to the context. Malmi and Granlund (2009, p. 602) further claim that MAS research does not have a theoretical base, which distinguishes theory used in MA studies from other theories. This is due to the fact that MAS and control studies as an applied field often incorporate theoretical frameworks from psy-chology, organizational science, sociology etc. To address this neglect Malmi and Granlund (2009, p. 615) suggest that researchers develop indigenous theories concern-ing MAS by doing interventionist research or by using normative and scientific theories as a starting point for discovering MA specific phenomena. Berry, Coad, Harris and Ot-ley (2009, pp. 14-15) also agree that overarching general theories dominating MCS re-search are not helpful for advancing understanding and call for more focus and collabo-rative theory development.
Tessier and Otley (2012, p. 182) have reviewed recent research which employs Simons’ levers of control to address the ambiguities arising from the loose definition of the framework. They find that managerial intentions and employee perceptions of control can be decoupled (Tessier and Otley 2012, p. 175). Managerial intentions include con-trol types, choices of use and objectives of control. Employee perceptions refer to how the personnel views the manifest control and is thus not a control design factor since individuals opine about control in different ways.
Berry, Coad, Harris and Otley (2009, p. 15) have studied recent developments in man-agement control research. They find eight emerging interests of research which are de-cision-making for strategic control, performance management for strategic control; con-trol models for performance management and measurement; management control and new forms of organization; control and risk; culture and control; and practice and theo-ry. On the other hand they find that there has been relatively little research into how sus-tainability and gender affect control in organizations.
Berry et al. (2009, p. 12-13) find that MCS research has given surprisingly little atten-tion to the role of new information technologies, which have practically revolutionized how control can be implemented in organizations. Technologies and associated man-agement practices that come with new innovations such as ERP, databases, intranet, CRM and various other corporate applications will undoubtedly bring the MCS research discipline into uncharted waters. Berry et al. conclude that some tentative findings indi-cate that the relationship of control and IT enabled methods is complicated. Granlund

34
(2011, p. 16) has evaluated the role of constant change in IT and accounting information systems (AIS) as a game changer that affects modern management control and he con-cludes that studies researching behavioral and social responses to these changes are opening up new interesting avenues of investigation.

35
3. RESEARCH DESIGN AND METHODOLOGY
The tool used for measuring the effects of contingencies on performance consciousness at CERN service management is constructed in this chapter. The variables used in the theoretical framework and their relationships are presented and discussed. A study by Chenhall (2007, pp. 163-205) lays out a theoretical and methodological paradigm, which is used by this study for building a conceptual model. Subsequently a list of hy-potheses and criteria are extracted from the presented framework. The role of the ante-cedent variables as determinants of causality between the variables is evaluated. The methods used for collecting the data and additional observations from an interventionist research standpoint are presented and discussed. Finally the sampling technique and ep-istemic considerations of the study are evaluated to establish how validity and reliability have been designed into the measurement tool.
3.1. Conceptualizing the study
The research question stated in the introduction sets out a task to study how perfor-mance consciousness at CERN is manifested in functional service managers and how this understanding is affected by the organizational context. A tool for measuring this effect is developed in this chapter for answering this research question. The measure-ment tool is built based on a theoretical framework and subsequent hypotheses, which are founded on theoretical findings deducted from existing contingency literature. The purpose of the tool is to find out how interdependence, scope, standardization and varia-tion affect performance consciousness.
This study follows a research paradigm contrived by Chenhall (2007) in contingency-based management control systems literature. The Oxford English dictionary defines a paradigm as ”A typical example or pattern of something; a model” and especially as ”a worldview underlying the theories and methodology of a particular scientific subject”. A well-defined research paradigm improves the robustness of the study by enabling the comparison of results with work laid out by earlier researchers on the field (Lindsay 1995, p. 43, Jääskeläinen 2012, p. 44). Using widely accepted views and methods is es-sential for this study to be able to reliably achieve its purpose and to relate the findings to a broader body of knowledge in contingency-based management control research. This study is not designed to develop new theoretical aspects or observations of contin-gencies and can be considered as an application of theoretical constructs for testing their
36
validity. In essence, the theory works as a tool for measuring the configuration of con-tingency effects in the case settings.
Universally agreed paradigms rarely exist and there is a lack of clear consensus on theo-ry and methods in contingency studies, which has resulted in some contradicting find-ings (Chenhall 2007, p. 194). This is why this study will use the summary conclusions reached by Chenhall as the point of reference in designing the study. This study intends to increase the validity of the findings and to add further insight to the knowledge base of management control research by conforming to the paradigm presented by Chenn-hall. Some authors (Lindsay 1995, p. 48; Chenhall 2007, p. 166-167; Otley and Pol-lanen 2000, p. 484) have also called for replication studies using same variables and methods, because of the lack of methodological rigidity. This study has some replicating aspects because it utilizes and extends on previous findings by using similar variables and most importantly by using previous measurement instruments as a basis for opera-tionalizing observations in the empirical part of the study.
An important distinction must be made between the types of work carried out within the functions of service management activities at CERN. The tasks at service management at CERN can be broadly divided to two categories: ticket tasks and non-ticket tasks. As most of the services are IT or IT related, a ticketing system to mechanize the tasks is usual. Ticket tasks are service requests initiated by the customer and they represent tasks, which needs to be fulfilled within a reasonable timeframe. The ticket tasks are numerous, separate and different from each other. Non-ticket tasks are all the other tasks, typically dealing with longer development projects. Since the nature of these dif-ferent types of tasks differs hugely, they are tested separately, albeit using the same measurement instrument, so that possible differences can be spotted.
3.1.1. Variables
The contextual variables selected for this study are acquired from contingency-based management control research literature. The contextual variables are standardization of work tasks, variation of incoming work requests, interdependence of activities and the scope of activities. Three of the contextual variables, standardization of work tasks, var-iation of incoming work requests and interdependence of activities are classified under the category of generic technological contingencies by Chenhall (2007, p. 174). These contextual variables, have been used frequently in previous research, and will be the focus of this study. The use of the contextual variables has been summarized in an ex-cellent review of contingency-based literature by Chenhall (2007, pp. 172-188).
The contextual variables presented here are deemed to be relevant for the research ques-tion based on the literature review and participation in the daily activities at CERN.
37
Some commonly studied contextual variables are excluded from this study, because they are evaluated in chapter 2.1.2, observations and, ultimately, by the researchers judgment not to significantly affect the cost awareness of services at CERN. The ex-cluded contextual variables are strategy, external environment, contemporary technolo-gies, company size and culture according to the typology of Chenhall (2007, p. 172, p. 176, p. 182, p. 183). The effects of strategy and culture on performance consciousness are not considered here because they are not realistic options for improving performance consciousness, at least in the timeframe of the next director general’s mandate. External environment is not considered because the internal services have been organized so that they will not be exchanged in the marketplace. Size and contemporary technologies are not included as this is single case study and thus does not allow for comparisons be-tween these variables. On the other hand structure of activities, scope, interdependence, the definition of tasks, standardization and task variation are seen as aspects which are relevant for the current needs of CERN since they are actionable in the short term. Jä-äskeläinen et al (2012, p. 46) recommend including service–specific contingency varia-bles such as repetitiveness and varying levels of demand, which respectively correspond to standardization and variation. Task scope and interdependence between the units arise from the formal and explicit organization of activities and are thus obvious varia-bles of interest. This study will concentrate on measuring the selected variables, with-out making assumptions about the effects originating from outside of the selected theo-retical framework.
The dependent variable, performance consciousness, is very similar to performance measures presented in previous studies, but it has been slightly adapted to fit the pur-pose of this study. Measuring performance consciousness is adopted because conven-tional performance measures are deemed to be unsuitable for the new and yet unestab-lished service management operations, which have not yet collected sufficient data on performance. Performance consciousness, from now on referred to as performance, is used as the dependent variable for which the effects of contingencies are measured. In quantitative management control research the dependent variable has typically been re-lated to the performance or usefulness of the management control system or to the use-fulness for the company in general (Chenhall 2007, pp. 168-170).
In the absence of suitable data on performance the developed measure is taken to be the best approximation of actual performance. The underlying assumption behind this measure is that improved performance consciousness is desirable, since it would likely lead to improved control and increase actual firm level performance. Instead of measur-ing how well the function is performing, the dependent variable in this study measures how well the respondents perceive their access to information concerning outputs and inputs. This means that what is measured is the perception of how the respondents feel
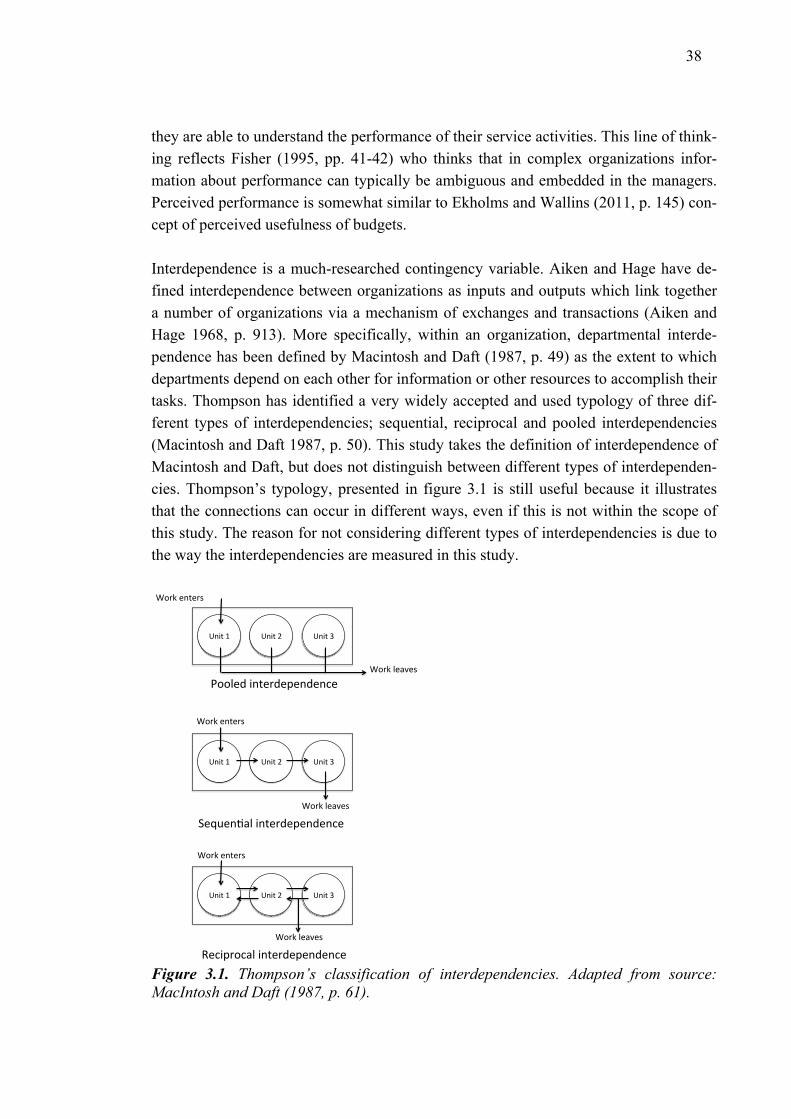
38
they are able to understand the performance of their service activities. This line of think-ing reflects Fisher (1995, pp. 41-42) who thinks that in complex organizations infor-mation about performance can typically be ambiguous and embedded in the managers. Perceived performance is somewhat similar to Ekholms and Wallins (2011, p. 145) con-cept of perceived usefulness of budgets.
Interdependence is a much-researched contingency variable. Aiken and Hage have de-fined interdependence between organizations as inputs and outputs which link together a number of organizations via a mechanism of exchanges and transactions (Aiken and Hage 1968, p. 913). More specifically, within an organization, departmental interde-pendence has been defined by Macintosh and Daft (1987, p. 49) as the extent to which departments depend on each other for information or other resources to accomplish their tasks. Thompson has identified a very widely accepted and used typology of three dif-ferent types of interdependencies; sequential, reciprocal and pooled interdependencies (Macintosh and Daft 1987, p. 50). This study takes the definition of interdependence of Macintosh and Daft, but does not distinguish between different types of interdependen-cies. Thompson’s typology, presented in figure 3.1 is still useful because it illustrates that the connections can occur in different ways, even if this is not within the scope of this study. The reason for not considering different types of interdependencies is due to the way the interdependencies are measured in this study.
Figure 3.1. Thompson’s classification of interdependencies. Adapted from source: MacIntosh and Daft (1987, p. 61).
!"#$%&% !"#$%'% !"#$%(%
!"#$%&% !"#$%'% !"#$%(%
!"#$%&% !"#$%'% !"#$%(%
)*+,%-"$-+.%
)*+,%/-01-.%
2**/-3%#"$-+3-4-"3-"5-%
)*+,%-"$-+.%
)*+,%/-01-.%
)*+,%-"$-+.%
)*+,%/-01-.%
6-78-"90/%#"$-+3-4-"3-"5-%
:-5#4+*50/%#"$-+3-4-"3-"5-%
39
Typically quantitative studies have used survey instruments to ask respondents to rate their perception of the level and type of interdependence. This study however gets an absolute numeric value for interdependence from CERN’s internal documentation, which reveals the count of connections between departments. This measure indicates the extent of connectedness but does not reveal the types of interdependence. The approach is similar to Aiken and Hage (1968, p. 919) who measured the number of joint programs to determine the extent of organizational interdependence. Interdependence in this study is a numeric value and yields more rigorous data since it is not dependent on perception but a designed, agreed and documented part of organizational structure. This also means that the antecedents and other variables are measured separately, which improves the validity of the findings. The count of interdependencies is taken to be an accurate and objective fact, reflecting the organization of activities, that is separate from the percep-tions of the respondents in the sampling frame.
Scope of activities, which is referred to simply as scope from now on, represents how many different services does a department create either alone or in cooperation with other service elements. Scope of activities is not to be confused with the definitions of scope of MAS (Chenhall and Morris, 1986 pp. 19-20), which is defined as the extent and variety of the accounting information the MAS gathers. Scope of activities, as it is defined in this study, has not been a separate independent contextual variable in MCS contingency research, but usually an element of other measures and it resembles closely other variables seen in previous contingency research such as size, complexity and or-ganizational structure. Size is usually simply measured as employee headcount (Reid and Smith 2000, p. 441), but in this study scope refers to the count of separate services provided by the department. Scope could also be seen as a dimension of complexity, since a wider base of activities is likely to require more diverse knowhow. Like interde-pendence, scope is calculated from the service management catalogue and is thus an ob-served numeric quantity that does not depend on perception.
Scope and interdependence might seem very similar, but the essential difference is that scope measures the count of different activities performed and interdependence measures the count of collaborating departments. Furthermore scope is closely related to the concept of interdependence since activities which have a wider scope are prone to be more interconnected by the measures used here. Measurements of the numeric values for the departments for both scope and interdependence are calculated from the service management catalogue in the internal documentation and a mock-up of the matrix is presented in figure 3.2.
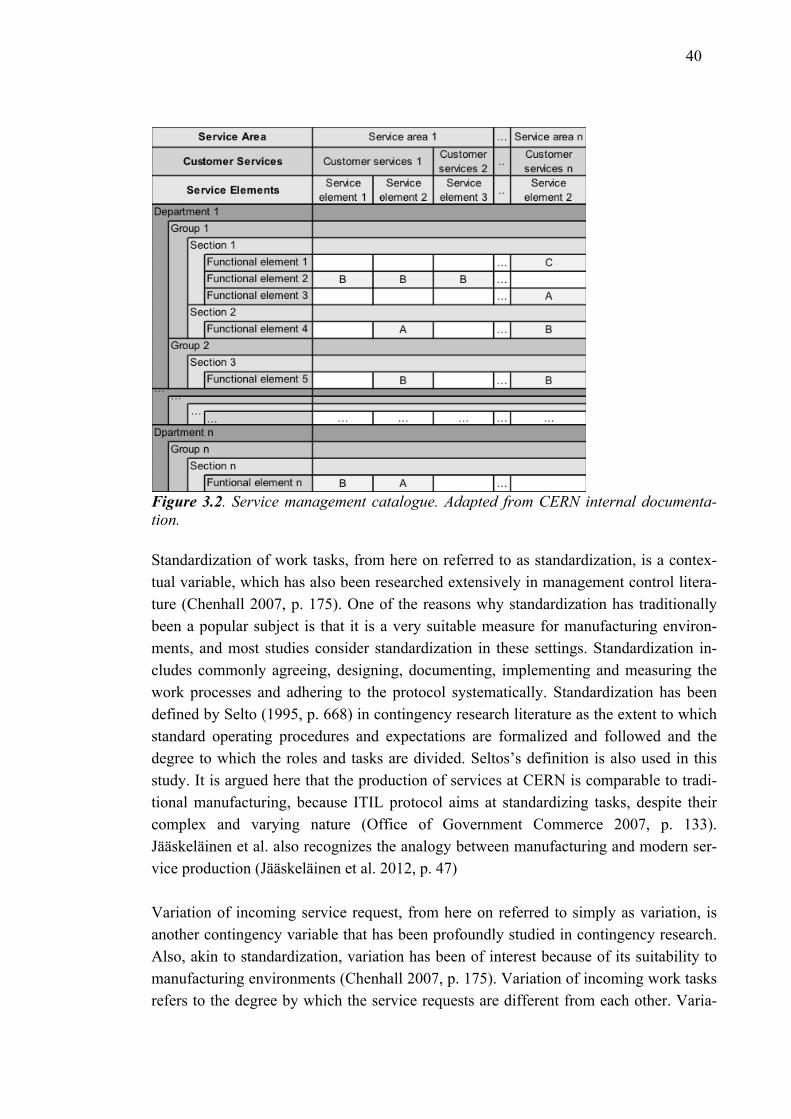
40
Figure 3.2. Service management catalogue. Adapted from CERN internal documenta-tion.
Standardization of work tasks, from here on referred to as standardization, is a contex-tual variable, which has also been researched extensively in management control litera-ture (Chenhall 2007, p. 175). One of the reasons why standardization has traditionally been a popular subject is that it is a very suitable measure for manufacturing environ-ments, and most studies consider standardization in these settings. Standardization in-cludes commonly agreeing, designing, documenting, implementing and measuring the work processes and adhering to the protocol systematically. Standardization has been defined by Selto (1995, p. 668) in contingency research literature as the extent to which standard operating procedures and expectations are formalized and followed and the degree to which the roles and tasks are divided. Seltos’s definition is also used in this study. It is argued here that the production of services at CERN is comparable to tradi-tional manufacturing, because ITIL protocol aims at standardizing tasks, despite their complex and varying nature (Office of Government Commerce 2007, p. 133). Jääskeläinen et al. also recognizes the analogy between manufacturing and modern ser-vice production (Jääskeläinen et al. 2012, p. 47)
Variation of incoming service request, from here on referred to simply as variation, is another contingency variable that has been profoundly studied in contingency research. Also, akin to standardization, variation has been of interest because of its suitability to manufacturing environments (Chenhall 2007, p. 175). Variation of incoming work tasks refers to the degree by which the service requests are different from each other. Varia-
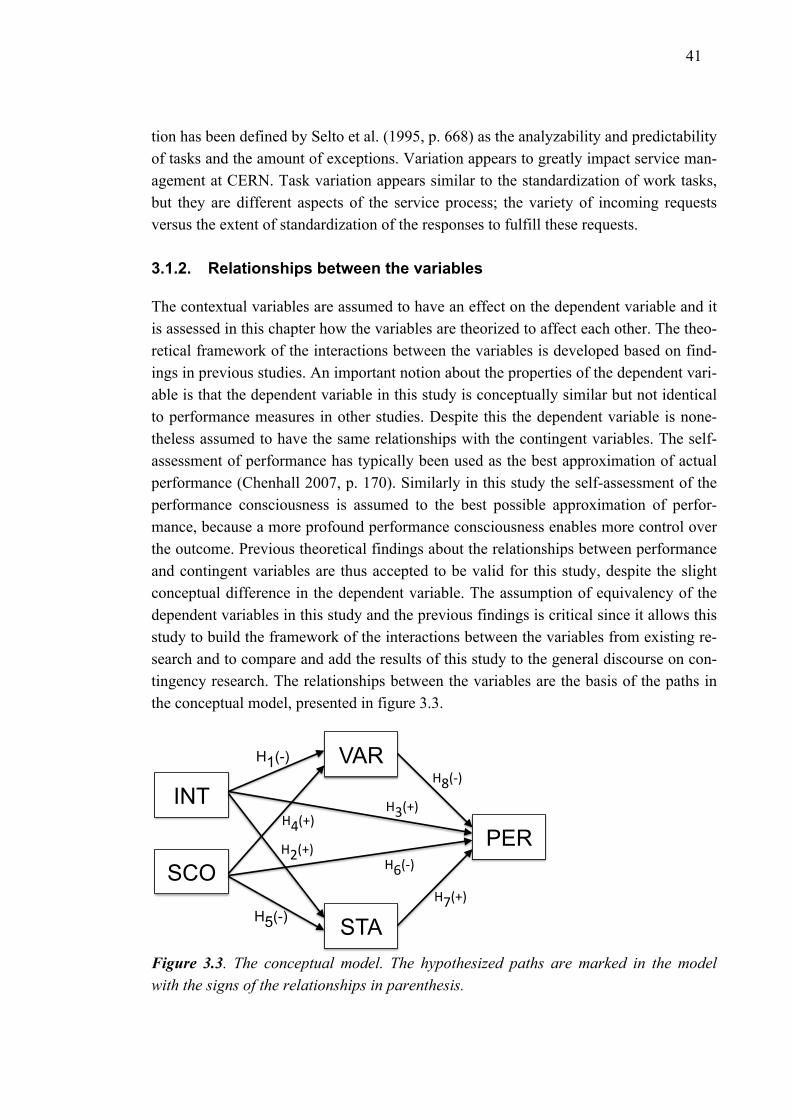
41
tion has been defined by Selto et al. (1995, p. 668) as the analyzability and predictability of tasks and the amount of exceptions. Variation appears to greatly impact service man-agement at CERN. Task variation appears similar to the standardization of work tasks, but they are different aspects of the service process; the variety of incoming requests versus the extent of standardization of the responses to fulfill these requests.
3.1.2. Relationships between the variables
The contextual variables are assumed to have an effect on the dependent variable and it is assessed in this chapter how the variables are theorized to affect each other. The theo-retical framework of the interactions between the variables is developed based on find-ings in previous studies. An important notion about the properties of the dependent vari-able is that the dependent variable in this study is conceptually similar but not identical to performance measures in other studies. Despite this the dependent variable is none-theless assumed to have the same relationships with the contingent variables. The self-assessment of performance has typically been used as the best approximation of actual performance (Chenhall 2007, p. 170). Similarly in this study the self-assessment of the performance consciousness is assumed to the best possible approximation of perfor-mance, because a more profound performance consciousness enables more control over the outcome. Previous theoretical findings about the relationships between performance and contingent variables are thus accepted to be valid for this study, despite the slight conceptual difference in the dependent variable. The assumption of equivalency of the dependent variables in this study and the previous findings is critical since it allows this study to build the framework of the interactions between the variables from existing re-search and to compare and add the results of this study to the general discourse on con-tingency research. The relationships between the variables are the basis of the paths in the conceptual model, presented in figure 3.3.
Figure 3.3. The conceptual model. The hypothesized paths are marked in the model with the signs of the relationships in parenthesis.
INT
STA
VAR
SCO PER
H1(-)
H5(-)
!"#$%&
!'#$%&!(#$%&
!)#*%&
!+#$%&
!,#*%&
42
The dependent variable is similar to Management Accounting System (MAS) perfor-mance and Management Control System (MCS) performance, as measured in some pre-vious studies (Chenhall 2007, pp. 168-169). MAS performance refers to the adequacy of the formal accounting tools in providing the organization with the information required for efficient decision-making. Elements of MAS performance are included in this study by inquiring whether formal information on operations improves performance con-sciousness of the respondents. MCS performance means the complete set of tools avail-able for management for evaluating and controlling operations. MCS and MAS were discussed in further detail in chapter 2.
Interdependence is a well understood contextual variable and it is taken to have a posi-tive effect on performance by enabling closer coordination and holistic understanding of operations. Positive effects of interdependencies on performance are mediated by aug-mented standardization and reduced variation. Interdependence has a positive impact on learning, innovation and performance (Bhimani 2006, pp. 320-321) through the enrich-ment of information as a result of more in-depth communication and coordination. Ger-din (2005b, p. 105) finds how companies adapt their MAS design to the context of their operations in search of better performance and finds that increased interdependence is related with the higher use of MAS as better decision-making information is sought. Since it is assumed here that the higher use of MAS corresponds with performance con-sciousness, a conclusion is made that higher interdependence leads to improved perfor-mance consciousness. Gerdin also notes in an earlier study that with high levels of in-terdependence subunit performance is significantly improved and attributes this to the increased awareness of performance through the use of MAS (Gerdin 2005a, pp. 318-319).
Macintosh and Daft argue that higher interdependence leads to more informal sharing of information (Macintosh and Daft 1987, p. 57). At the moment, when exact measures of costs and performance at CERN within the service management are not available, it can be assumed that the best estimation of performance is acquired through high interde-pendencies and the associated flow of communication. Increased knowledge of the op-erations of the other departments and the needs of service users naturally translates to improved standardization processes and better pre-emption of variation in tasks. Gerdin also notes that previous authors have contributed part of the effects of interdependence to coordination by mutual adjustments between the units (Gerdin 2005b, p. 119), which would also increase the standardization of activities and reduce the variation of tasks. It is concluded that interdependence has a positive effect on the performance and stand-ardization and a negative effect on variation.
43
An alternative view to the effects of interdependence exists; interdependence can also be seen as a source of complexity, which makes Bouwens and Abernathy (2004, p. 562) consider that interdependencies are something to be managed because they create new information flows which do not provide insight but rather make performance measures “noisier”. The view that interdependencies complicate decision-making by offering in-formation clutter is however debatable. Chenhall (2007, p. 175) concludes that interde-pendencies affect different types of activities in a different way, depending on their technological complexity. It could certainly be that too interdependent units get over-loaded with information and interaction, leading to a worse understanding of their own or overall performance. In this study, the idea of distorting information is rejected and it is assumed that social actors disseminate, select and improve relevant information through interdependent interactions and interdependencies thus have a linear positive effect on performance.
Scope is a variable that has an effect on performance. The larger the scope of a function is, the more tasks that are different from each other need to be done by the department. This makes for larger variation in required work tasks and for a more difficult standard-ization. As scope increases, so does complexity. Gerdin (2005b, p. 102) notes that com-plexity, size, decentralization and formalization affect MAS performance in a way that low complexity is associated more with informal controls. A similar conclusion con-cerning size and complexity was made by Moores and Chenhall (1991, p. 12). It is as-sumed in this study that higher scope leads to higher complexity and thus to a more var-iation in work requests and subsequently less efficient standardization. Thus scope is assumed to be negatively associated with performance and standardization and positive-ly associated with variation.
The conventional wisdom is that standardization improves performance at least in situa-tions where the similar or identical work tasks are repeated. Chenhall presents that pre-vious studies have concentrated on finding out the interaction standardization has on management control levers such as formal or informal MCS systems, budget use and budgetary control (Chenhall 2007, p. 175). It is argued here that Standardization has a positive correlation with performance, because the service tasks at CERN are large vol-ume and they are managed with a ticketing system.
Adler (1995, p. 158) notes that in manufacturing settings low task analyzability, which is the equivalent of variation in this study, leads to uncertainty and is typically associat-ed with lower performance. Task variation, especially in high task volume settings is thus taken to mean that the increasing of variation decreases performance conscious-ness. Otley and Pollanen also find in their replication study of Brownell and Dunk (Ot-

44
ley and Pollanen 2000, pp. 491-492) that variation is negatively associated with perfor-mance.
3.1.3. Causality, role of antecedents and the mediating effect
Causality is the relationship between two events, where an outcome of an event is de-pendent on another event. Causality is usually difficult to establish with certainty, espe-cially if the measurements are not from a controlled experiment. Correlations between the variables imply the existence of causality, but do not necessitate it. Correlation is not causation, but it is a requirement for causation and gives circumstantial evidence. The direction of causality is also difficult to determine, as causality can be unidirectional, where A ! B or bidirectional, where A ! B and B ! A. Figure 3.4 shows how unidi-rectional and bidirectional causalities are marked in a model.
Figure 3.4. Unidirectional and bidirectional causality.
Antecedents are independent variables that are causally considered to precede all other variables and strongly imply direction of causality away from antecedents towards the mediating and dependent variables. Antecedents are defined by Shields and Shields (1998, p. 51) as the cause of the dependent and mediating variables. Scope and interde-pendence are used as antecedents in this study, since it can be argued that they are the basis of the service management structure at CERN. Scope and interdependence are ob-tained from documentation and, whether they are designed or emergent, they reflect the formal organizational structure of service activities. The staff at service management is accountable for upholding and operating through this formal structure. Since the struc-ture of operations is documented, rigid and does not change dynamically, at least in the short term, in relation to performance and other contingencies it can be argued that scope and interdependence truly are antecedents. The unchanging nature of these ante-cedents also gives justification for making claims about the direction of causality. Cau-sality is determined to be unidirectional from the antecedents to the mediating variables and the dependent variable.
Scope and Interdependence are documented connections between the activities and do not change over time and adapt immediately to changes in the service management sys-tem. Of course the service management catalogue can be redesigned and developed over time, but this is in the medium to long term. The organization of the activities has been designed, agreed and communicated before any activities have begun. Considering these
!"#$"%&'()( !"#$"%&'(*( !"#$"%&'(*(!"#$"%&'()(
+,$-$#'./0,"&( *$-$#'./0,"&(
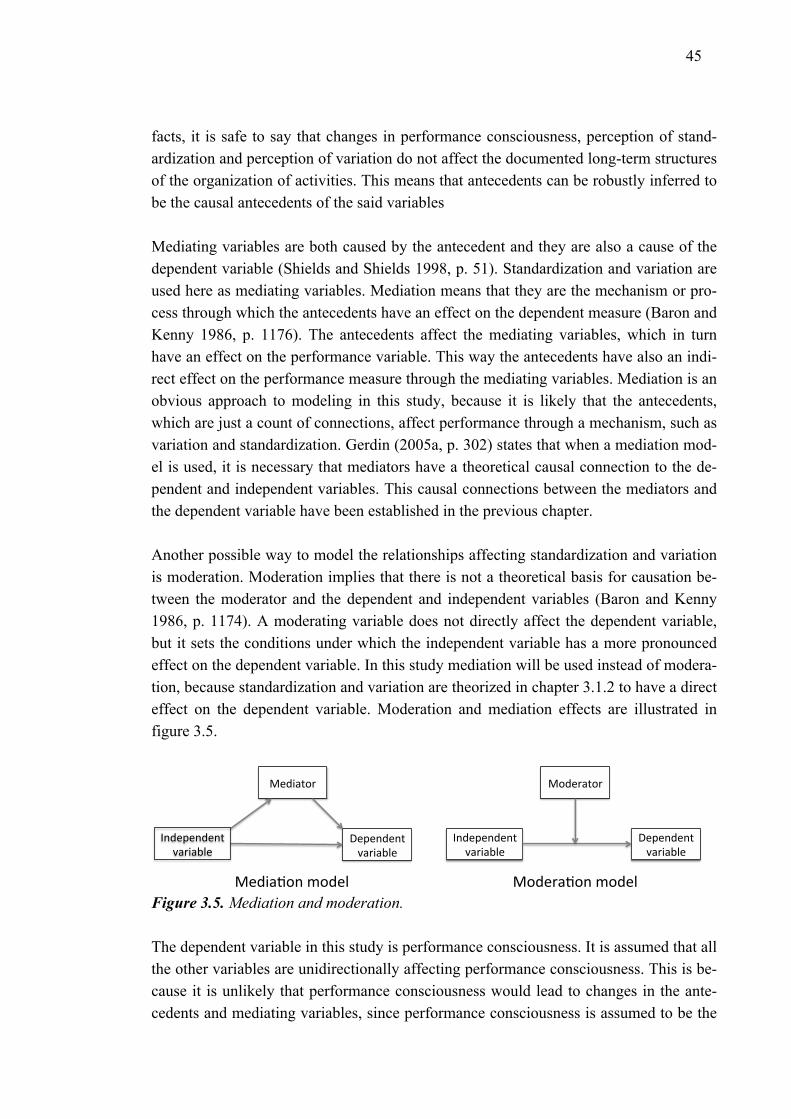
45
facts, it is safe to say that changes in performance consciousness, perception of stand-ardization and perception of variation do not affect the documented long-term structures of the organization of activities. This means that antecedents can be robustly inferred to be the causal antecedents of the said variables
Mediating variables are both caused by the antecedent and they are also a cause of the dependent variable (Shields and Shields 1998, p. 51). Standardization and variation are used here as mediating variables. Mediation means that they are the mechanism or pro-cess through which the antecedents have an effect on the dependent measure (Baron and Kenny 1986, p. 1176). The antecedents affect the mediating variables, which in turn have an effect on the performance variable. This way the antecedents have also an indi-rect effect on the performance measure through the mediating variables. Mediation is an obvious approach to modeling in this study, because it is likely that the antecedents, which are just a count of connections, affect performance through a mechanism, such as variation and standardization. Gerdin (2005a, p. 302) states that when a mediation mod-el is used, it is necessary that mediators have a theoretical causal connection to the de-pendent and independent variables. This causal connections between the mediators and the dependent variable have been established in the previous chapter.
Another possible way to model the relationships affecting standardization and variation is moderation. Moderation implies that there is not a theoretical basis for causation be-tween the moderator and the dependent and independent variables (Baron and Kenny 1986, p. 1174). A moderating variable does not directly affect the dependent variable, but it sets the conditions under which the independent variable has a more pronounced effect on the dependent variable. In this study mediation will be used instead of modera-tion, because standardization and variation are theorized in chapter 3.1.2 to have a direct effect on the dependent variable. Moderation and mediation effects are illustrated in figure 3.5.
Figure 3.5. Mediation and moderation.
The dependent variable in this study is performance consciousness. It is assumed that all the other variables are unidirectionally affecting performance consciousness. This is be-cause it is unlikely that performance consciousness would lead to changes in the ante-cedents and mediating variables, since performance consciousness is assumed to be the
!"#$%&'()
*"+",#",&)-%($%./")
0,#"+",#",&)-%($%./")
!'#"(%&'()
*"+",#",&)-%($%./")
!"#$%1',)2'#"/) !'#"(%1',)2'#"/)
0,#"+",#",&)-%($%./")
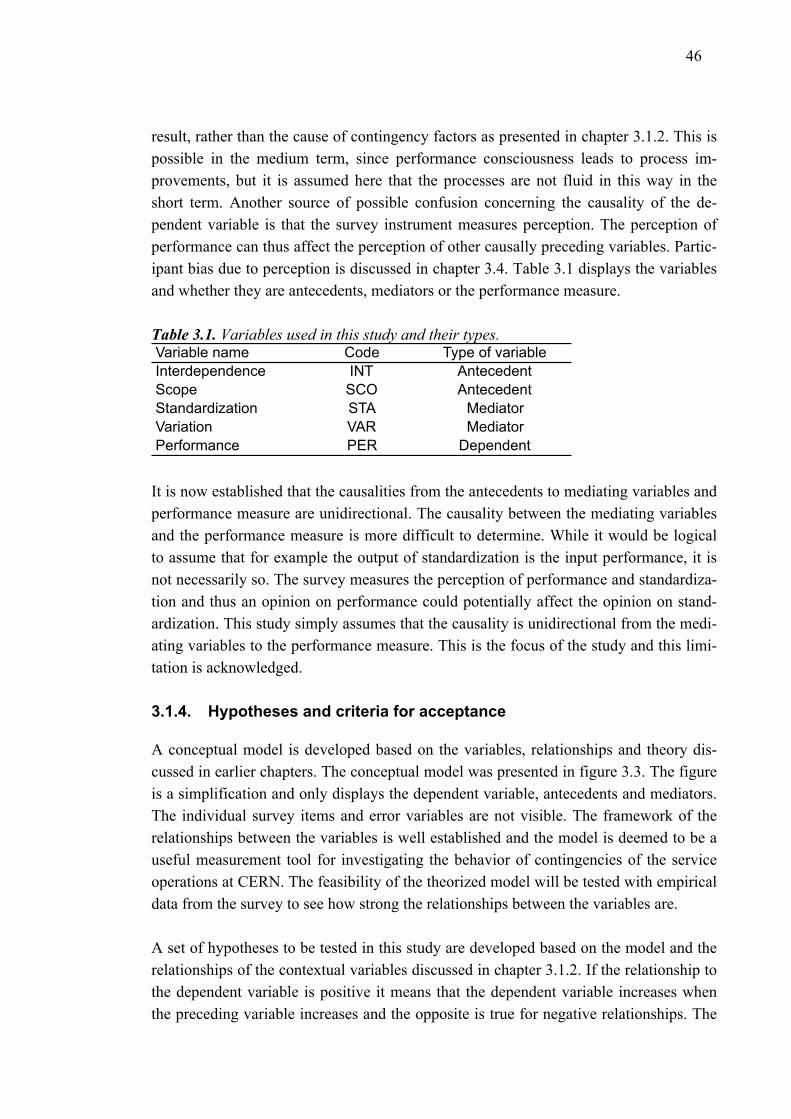
46
result, rather than the cause of contingency factors as presented in chapter 3.1.2. This is possible in the medium term, since performance consciousness leads to process im-provements, but it is assumed here that the processes are not fluid in this way in the short term. Another source of possible confusion concerning the causality of the de-pendent variable is that the survey instrument measures perception. The perception of performance can thus affect the perception of other causally preceding variables. Partic-ipant bias due to perception is discussed in chapter 3.4. Table 3.1 displays the variables and whether they are antecedents, mediators or the performance measure.
Table 3.1. Variables used in this study and their types.
It is now established that the causalities from the antecedents to mediating variables and performance measure are unidirectional. The causality between the mediating variables and the performance measure is more difficult to determine. While it would be logical to assume that for example the output of standardization is the input performance, it is not necessarily so. The survey measures the perception of performance and standardiza-tion and thus an opinion on performance could potentially affect the opinion on stand-ardization. This study simply assumes that the causality is unidirectional from the medi-ating variables to the performance measure. This is the focus of the study and this limi-tation is acknowledged.
3.1.4. Hypotheses and criteria for acceptance
A conceptual model is developed based on the variables, relationships and theory dis-cussed in earlier chapters. The conceptual model was presented in figure 3.3. The figure is a simplification and only displays the dependent variable, antecedents and mediators. The individual survey items and error variables are not visible. The framework of the relationships between the variables is well established and the model is deemed to be a useful measurement tool for investigating the behavior of contingencies of the service operations at CERN. The feasibility of the theorized model will be tested with empirical data from the survey to see how strong the relationships between the variables are.
A set of hypotheses to be tested in this study are developed based on the model and the relationships of the contextual variables discussed in chapter 3.1.2. If the relationship to the dependent variable is positive it means that the dependent variable increases when the preceding variable increases and the opposite is true for negative relationships. The
Variable name Code Type of variableInterdependence INT AntecedentScope SCO AntecedentStandardization STA MediatorVariation VAR MediatorPerformance PER Dependent
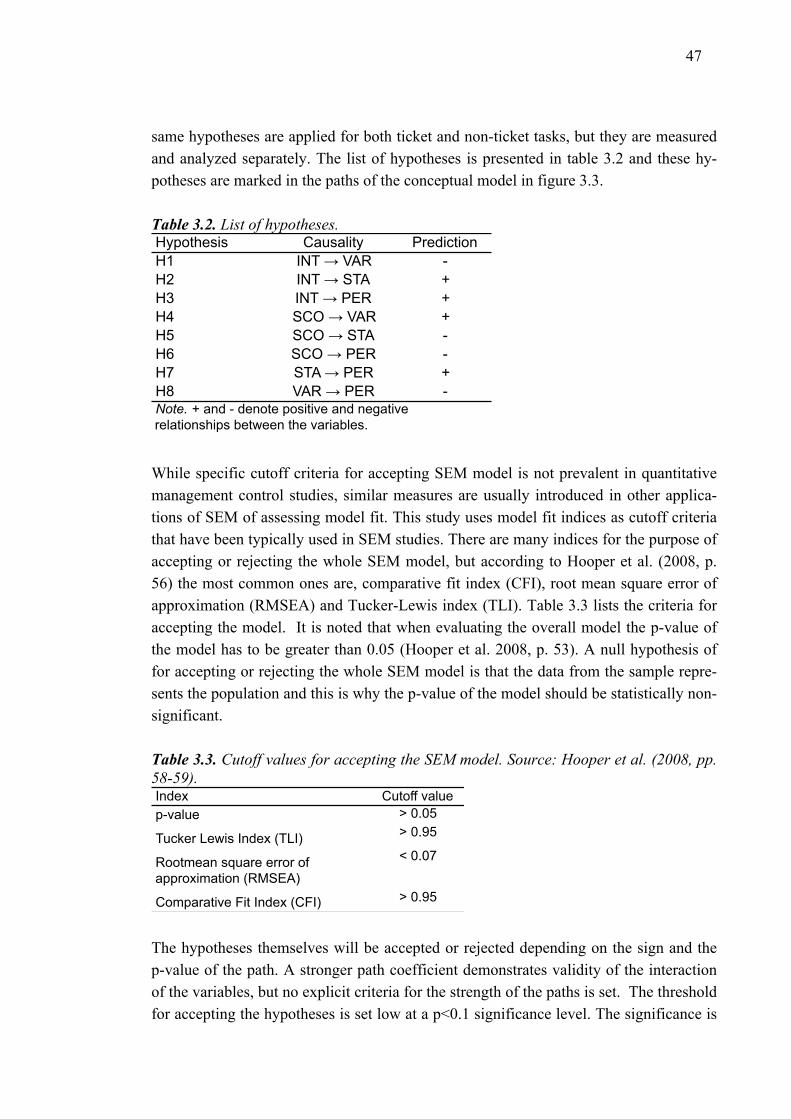
47
same hypotheses are applied for both ticket and non-ticket tasks, but they are measured and analyzed separately. The list of hypotheses is presented in table 3.2 and these hy-potheses are marked in the paths of the conceptual model in figure 3.3.
Table 3.2. List of hypotheses.
While specific cutoff criteria for accepting SEM model is not prevalent in quantitative management control studies, similar measures are usually introduced in other applica-tions of SEM of assessing model fit. This study uses model fit indices as cutoff criteria that have been typically used in SEM studies. There are many indices for the purpose of accepting or rejecting the whole SEM model, but according to Hooper et al. (2008, p. 56) the most common ones are, comparative fit index (CFI), root mean square error of approximation (RMSEA) and Tucker-Lewis index (TLI). Table 3.3 lists the criteria for accepting the model. It is noted that when evaluating the overall model the p-value of the model has to be greater than 0.05 (Hooper et al. 2008, p. 53). A null hypothesis of for accepting or rejecting the whole SEM model is that the data from the sample repre-sents the population and this is why the p-value of the model should be statistically non-significant.
Table 3.3. Cutoff values for accepting the SEM model. Source: Hooper et al. (2008, pp. 58-59).
The hypotheses themselves will be accepted or rejected depending on the sign and the p-value of the path. A stronger path coefficient demonstrates validity of the interaction of the variables, but no explicit criteria for the strength of the paths is set. The threshold for accepting the hypotheses is set low at a p<0.1 significance level. The significance is
Hypothesis Causality PredictionH1 INT ! VAR -H2 INT ! STA +H3 INT ! PER +H4 SCO ! VAR +H5 SCO ! STA -H6 SCO ! PER -H7 STA ! PER +H8 VAR ! PER -Note. + and - denote positive and negative relationships between the variables.
Index Cutoff valuep-value > 0.05
Tucker Lewis Index (TLI) > 0.95
Rootmean square error of approximation (RMSEA)
< 0.07
Comparative Fit Index (CFI) > 0.95
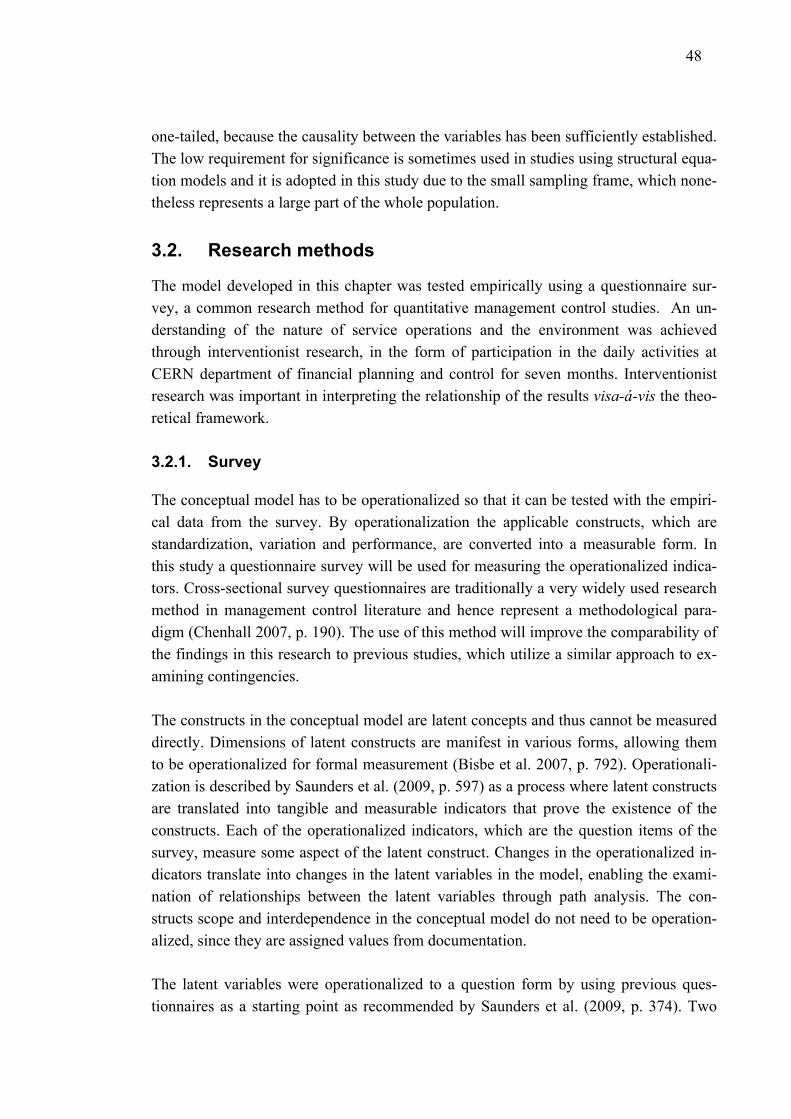
48
one-tailed, because the causality between the variables has been sufficiently established. The low requirement for significance is sometimes used in studies using structural equa-tion models and it is adopted in this study due to the small sampling frame, which none-theless represents a large part of the whole population.
3.2. Research methods
The model developed in this chapter was tested empirically using a questionnaire sur-vey, a common research method for quantitative management control studies. An un-derstanding of the nature of service operations and the environment was achieved through interventionist research, in the form of participation in the daily activities at CERN department of financial planning and control for seven months. Interventionist research was important in interpreting the relationship of the results visa-á-vis the theo-retical framework.
3.2.1. Survey
The conceptual model has to be operationalized so that it can be tested with the empiri-cal data from the survey. By operationalization the applicable constructs, which are standardization, variation and performance, are converted into a measurable form. In this study a questionnaire survey will be used for measuring the operationalized indica-tors. Cross-sectional survey questionnaires are traditionally a very widely used research method in management control literature and hence represent a methodological para-digm (Chenhall 2007, p. 190). The use of this method will improve the comparability of the findings in this research to previous studies, which utilize a similar approach to ex-amining contingencies.
The constructs in the conceptual model are latent concepts and thus cannot be measured directly. Dimensions of latent constructs are manifest in various forms, allowing them to be operationalized for formal measurement (Bisbe et al. 2007, p. 792). Operationali-zation is described by Saunders et al. (2009, p. 597) as a process where latent constructs are translated into tangible and measurable indicators that prove the existence of the constructs. Each of the operationalized indicators, which are the question items of the survey, measure some aspect of the latent construct. Changes in the operationalized in-dicators translate into changes in the latent variables in the model, enabling the exami-nation of relationships between the latent variables through path analysis. The con-structs scope and interdependence in the conceptual model do not need to be operation-alized, since they are assigned values from documentation.
The latent variables were operationalized to a question form by using previous ques-tionnaires as a starting point as recommended by Saunders et al. (2009, p. 374). Two
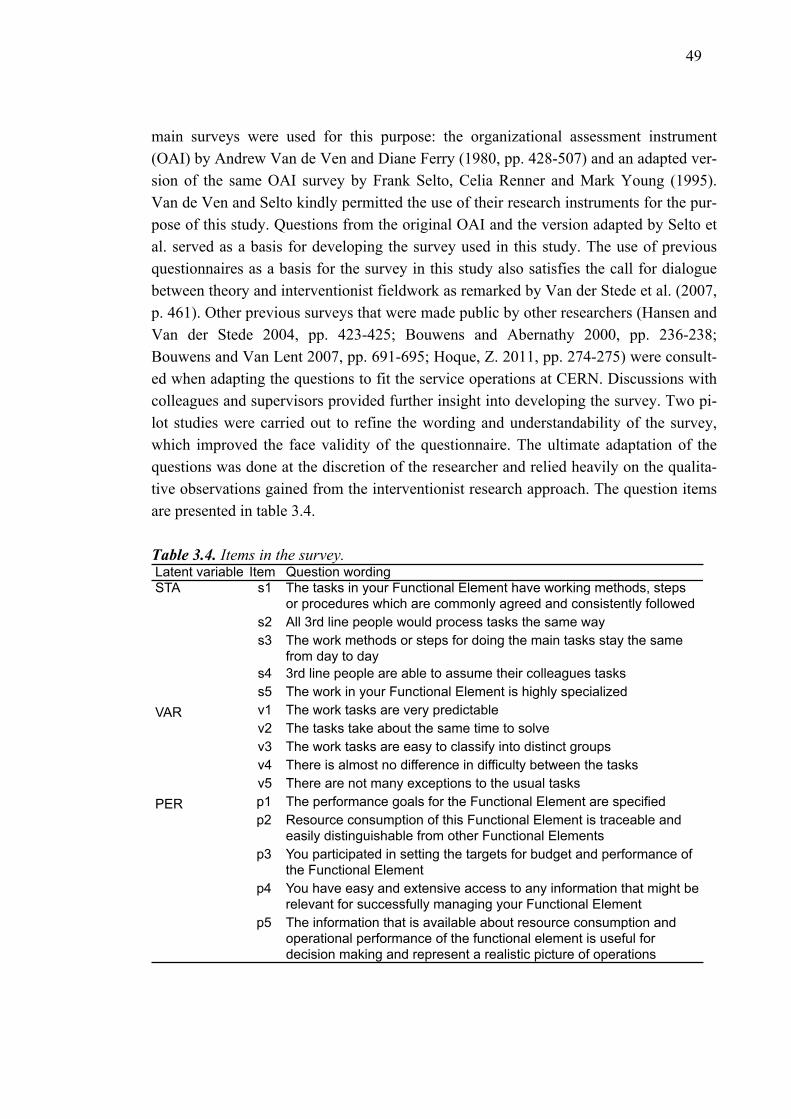
49
main surveys were used for this purpose: the organizational assessment instrument (OAI) by Andrew Van de Ven and Diane Ferry (1980, pp. 428-507) and an adapted ver-sion of the same OAI survey by Frank Selto, Celia Renner and Mark Young (1995). Van de Ven and Selto kindly permitted the use of their research instruments for the pur-pose of this study. Questions from the original OAI and the version adapted by Selto et al. served as a basis for developing the survey used in this study. The use of previous questionnaires as a basis for the survey in this study also satisfies the call for dialogue between theory and interventionist fieldwork as remarked by Van der Stede et al. (2007, p. 461). Other previous surveys that were made public by other researchers (Hansen and Van der Stede 2004, pp. 423-425; Bouwens and Abernathy 2000, pp. 236-238; Bouwens and Van Lent 2007, pp. 691-695; Hoque, Z. 2011, pp. 274-275) were consult-ed when adapting the questions to fit the service operations at CERN. Discussions with colleagues and supervisors provided further insight into developing the survey. Two pi-lot studies were carried out to refine the wording and understandability of the survey, which improved the face validity of the questionnaire. The ultimate adaptation of the questions was done at the discretion of the researcher and relied heavily on the qualita-tive observations gained from the interventionist research approach. The question items are presented in table 3.4.
Table 3.4. Items in the survey.
Latent variable Item Question wordingSTA s1 The tasks in your Functional Element have working methods, steps
or procedures which are commonly agreed and consistently followed s2 All 3rd line people would process tasks the same way s3 The work methods or steps for doing the main tasks stay the same
from day to day s4 3rd line people are able to assume their colleagues tasks s5 The work in your Functional Element is highly specialized
VAR v1 The work tasks are very predictable v2 The tasks take about the same time to solve v3 The work tasks are easy to classify into distinct groups v4 There is almost no difference in difficulty between the tasks v5 There are not many exceptions to the usual tasks
PER p1 The performance goals for the Functional Element are specified p2 Resource consumption of this Functional Element is traceable and
easily distinguishable from other Functional Elements p3 You participated in setting the targets for budget and performance of
the Functional Element p4 You have easy and extensive access to any information that might be
relevant for successfully managing your Functional Element p5 The information that is available about resource consumption and
operational performance of the functional element is useful for decision making and represent a realistic picture of operations
50
An important notion, which arose during the interviews and pilot studies, was that there were fundamentally two different types of tasks at CERN service management depart-ments: ticket tasks and non-ticket tasks. Ticket tasks were concerned with fulfilling the service needs of the customers, whereas non-ticket tasks involved further developing of the service management system. The distinction between these tasks was big enough to require a change in the survey. The respondents were asked to answer to each of the questions twice while considering the different characteristic of the type of task in ques-tion.
The final survey consisted of three parts: Questions about the standardization of work tasks, questions about the variation of incoming work requests and questions about the perceived availability of performance information to the surveyed. Each of the latent constructs included five question items. All of the items in the survey were made in the form of statements and used a 7-point Likert scale, where the respondents were asked to rate if they strongly agreed or strongly disagreed with the statements. Section 2 which concerned the variation of work tasks was reverse scored in the sense that the questions were worded to emphasize lower variation, an approach recommended by Kline (2010, p. 114). Scope and interdependence were not included in the survey, since they were obtained separately from the documentation.
The introduction to the survey presented a description of the structure of the survey and gave a glossary of the used concepts. A statement of purpose was also included in the welcoming message at the beginning of the survey as recommended by Saunders et al. (2009, pp. 389-391). Additionally, each section in the survey included a brief descrip-tion of the section. The survey can be seen in its entirety in appendix 1. At the end of the survey the respondents were thanked for their participation and were presented with an open-ended questions to capture any arising notions or to receive feedback concern-ing the survey itself.
The survey could have been interpreted as threatening and this posed a risk to the whole research. The new organization of service management was not established and the re-spondents could have felt that they were being superimposed accountability unfairly. This was not the purpose of this study and great care was placed in assuring the re-spondents that the results of the survey would be not used to drive decisions concerning accountability or allocation of resources. Selto et al. (1995, p. 672) give an example of a similar situation where the controversy of their study put the integrity of their results at risk. Anonymity was guaranteed due to the sensitive nature of the survey and the intent of the survey was communicated transparently in the letter inviting to the survey (Ap-pendix 2). These measures give the research a sound ethical standing.
51
The department of the respondent was asked in the survey so that their responses could be combined with the interdependencies and scope accordingly. This was perhaps the most sensitive information required and the respondents were assured that this infor-mation would be handled anonymously and grouped in the statistics so that individuals or departments could not be identified.
The survey was distributed using Microsoft Sharepoint. This method of delivering the survey was the most practical way because the program was readily available, fit the busy schedules of the respondents, and instilled trust due to its widespread use. An invi-tation email was sent to the respondents, which explained the purpose and confidentiali-ty of the survey. The results of this study were promised to the respondents as an incen-tive to participate in the survey. The length of the survey was kept at a minimum and it was designed to last around 10 minutes. The relatively short length of the survey in-tended to improve the response rate and to avoid response fatigue.
3.2.2. Interventionist research
This study was done as a part of a work placement at CERN and it is only natural that it contains elements of interventionist research. The work of the researcher at CERN was conducted at the resource planning and control department and concerned a project aimed at making the cost structure of the service management organization explicit. The project showed potential also from an academic perspective and the interests of the re-searcher were compatible with the goals of the organization. While the chosen method of research is quantitative, the insight on activities gained from participation in the daily activities are also invaluable. This echoes the views of Anderson and Widener. (2007, p. 322) who note that it is difficult to imagine that quantitative field research could be de-void of qualitative observations. In fact the final subject of this thesis emerged and de-veloped over time as a part of the daily work responsibilities.
Research methods similar to interventionist research exist with different names in other scientific disciplines. Another term for interventionist research methodology used in management accounting research literature is action research (Jönsson and Lukka 2007, p. 376). Interventionist research in management accounting research is defined by Jöns-son and Lukka (2007, pp. 373-374) as a form of case studies, where the researcher is embedded in the organization as an active member, while carrying out academic re-search. When working in the organization the researcher can use active participant ob-servation to advance his or her understanding of the nature of the studied phenomena. While the interventionist research methodology allows intervention and can include el-ements of experimentation the researcher should not be in control of the object of the study (Jönsson and Lukka 2007, p. 374). Different levels of influence can be exercised in interventionist research and Suomala and Lyly-Yrjänäinen (2010, pp. 3-5) have clas-
52
sified distinct categories according to the strength of the intervention and the focal point of the intervention. As the degree of intervention decreases to minimal levels the term interventionist research might no longer be suitable as this type of stance has the re-searcher assume the role of a complete observer as defined by Saunders et al. (2009, p. 294).
A substantial benefit of the interventionist research method is that when this research approach is agreed on with the sponsoring organization it provides an excellent entry to examine the organization in natural settings. Once unhindered access to the premises at the organization has been gained the researcher should strive to be seen as a competent and trustworthy insider (Jönsson and Lukka 2007, p. 373). After a successful socializa-tion within the organization the researcher can gain rich data and insights on the inner workings of the organization. According to Saunders et al. (2009, p. 148) interventionist researcher has two foci; to fulfill the practical needs of the sponsoring organization with a sound theoretical motivation. Suomala and Lyly-Yrjänäinen (2010, p. 5) mention that these foci should not be disconnected; rather the host and the researcher should share mutual goals.
Interventionist research is a qualitative research method that usually, but not always, examines one organization at a time. While qualitative observations from the interven-tions in this study give insight in evaluating the results, the primary research method remains quantitative. Anderson and Widener (2007, p. 325) discuss quantitative field research, where the quantitative data is produced in situ, and explain how quantitative research and fieldwork have qualities which complement each other. They stress that the dynamic elements of qualitative field research augment and explain the theory be-hind quantitative research. According to Anderson and Widener (2007, p. 321) it is im-portant to note, that the mere refining of a quantitative research instrument, such as a survey, in itself is not sufficient to merit the term field research, since it does not in-crease understanding about the organization.
Participant bias requires special attention in interventionist research. As the researcher is immersed in the research settings, the connection between practice and theory might be disconnected, resulting in limited and opinionated findings. However, even though subjectivity is an acknowledged threat, it is also considered to be a strength. Participant bias is typically evaluated in interventionist research literature as a discourse between the emic versus etic dichotomy (Jönsson and Lukka 2007, p. 374). Emic perspective on the observations is the insider’s point of view which yields detailed, but potentially sub-jective, observations. The etic perspective treats these observations from the outsider view and utilizes theory to fuse them in the wider knowledge base. Saunders et al. (2009, p. 147) points that the nature of this discourse between emic and etic considera-
53
tions should be iterative so that theory informs practice and vice versa. Jönsson and Lukka have recognized three approaches to the role of theory in interventionist research: indifference, hostility and favoring (Jönsson and Lukka 2007, p. 391).
As mentioned before, interventionist research is used in this study to provide the re-searcher a detailed understanding of the premises at CERN. This understanding in turn is used for designing a suitable quantitative measurement instrument, the survey, and for evaluating the findings and the potential implications of these findings at CERN. This study aims at making contributions to the knowledge base of management control re-search and interventionist research is mainly used as guidance in applying theory to de-velop the empirical model. Gerdin (2005b, pp. 100-101) advocates this approach by highlighting that the fit of the theoretical variables to the case must always be assessed thoroughly. The interventionist approach is not the primary research method and obser-vations arising from it are thus intended for increasing the validity of the conclusions arising from the quantitative findings.
The level of intervention in this study was rather modest. The research was a part of a project, which intended to draft suggestions for improving the cost management system and the survey, that is the measurement instrument of this study, was circulated as a part of this project. The interests of the researcher and CERN were thus very closely aligned. The nature of the project meant that there were no operational changes and the interven-tion element was mostly associated with the social interaction between the researcher and people at the resource planning and control department. Participant bias arising from the immersion in the research settings was reduced in this study by constant and concurrent referring to theory and by discussions on the topics with the colleagues and instructors.
3.3. Sample
The sample was gathered from within the new CERN service management system. CERN is organized in the following hierarchy: departments, groups and sections. The service teams, which are called functional elements in the service management cata-logue (figure 3.2), produce the actual services. The functional elements are organized within the CERN groups and collaborate with other functional elements in different groups. Currently two departments, both of which contain many groups, are sufficiently engaged with the service management system and the sample was gathered from these departments.
There was not enough data at the time of this study to have estimations of performance based on a concrete cost management system tool. This is why performance conscious-ness was assumed to be best at the level of analysis where the service transaction hap-
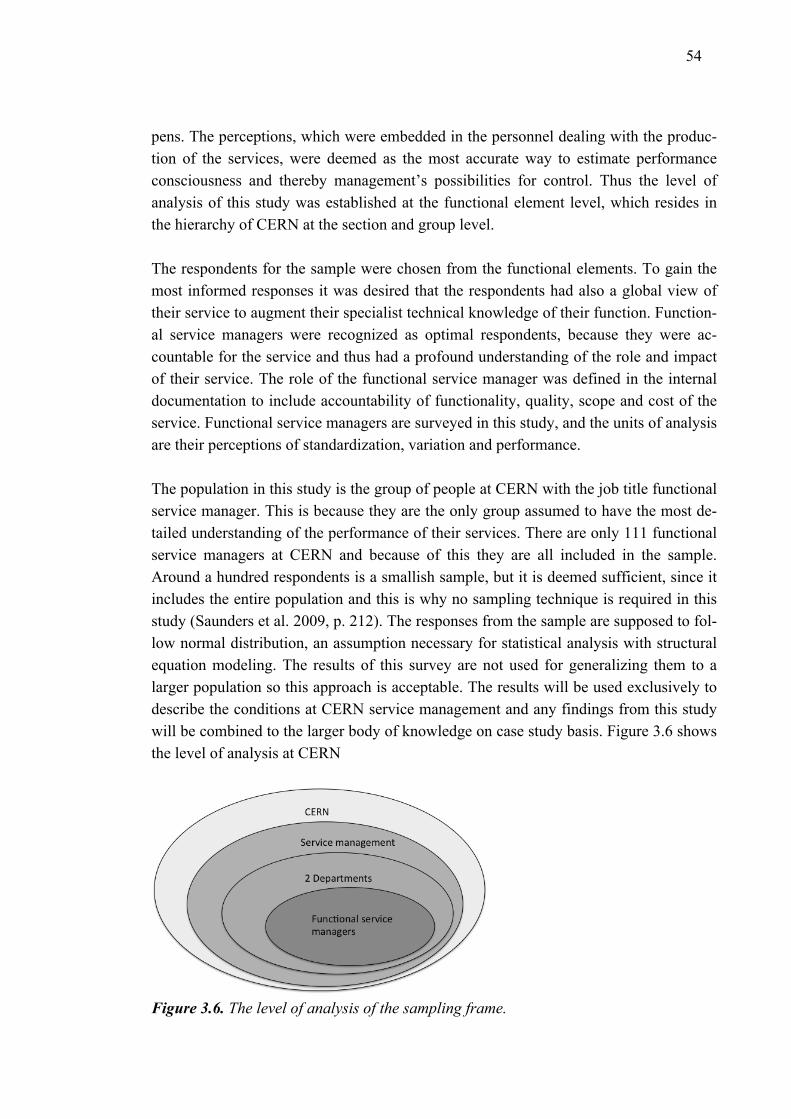
54
pens. The perceptions, which were embedded in the personnel dealing with the produc-tion of the services, were deemed as the most accurate way to estimate performance consciousness and thereby management’s possibilities for control. Thus the level of analysis of this study was established at the functional element level, which resides in the hierarchy of CERN at the section and group level.
The respondents for the sample were chosen from the functional elements. To gain the most informed responses it was desired that the respondents had also a global view of their service to augment their specialist technical knowledge of their function. Function-al service managers were recognized as optimal respondents, because they were ac-countable for the service and thus had a profound understanding of the role and impact of their service. The role of the functional service manager was defined in the internal documentation to include accountability of functionality, quality, scope and cost of the service. Functional service managers are surveyed in this study, and the units of analysis are their perceptions of standardization, variation and performance.
The population in this study is the group of people at CERN with the job title functional service manager. This is because they are the only group assumed to have the most de-tailed understanding of the performance of their services. There are only 111 functional service managers at CERN and because of this they are all included in the sample. Around a hundred respondents is a smallish sample, but it is deemed sufficient, since it includes the entire population and this is why no sampling technique is required in this study (Saunders et al. 2009, p. 212). The responses from the sample are supposed to fol-low normal distribution, an assumption necessary for statistical analysis with structural equation modeling. The results of this survey are not used for generalizing them to a larger population so this approach is acceptable. The results will be used exclusively to describe the conditions at CERN service management and any findings from this study will be combined to the larger body of knowledge on case study basis. Figure 3.6 shows the level of analysis at CERN
Figure 3.6. The level of analysis of the sampling frame.
55
The functional service managers were easy to contact since the service management system had documented a list of the service managers and their responsible functional elements. Van der Stede et al. (2007, pp. 462-463) mention that a typical deficiency in management accounting and related studies is the absence of explicit sampling process. This study has the advantage of obtaining a list of all the service managers and this list of the entire population is taken as the sampling frame. All of the functional service managers were invited to participate in the survey. Some functional service managers were responsible for two or more functional elements. This was potentially a problem, since each of the responses was paired with data from documentation for each specific functional element. This problem was averted by prompting the respondents provide a specific example and to answer the questions keeping this example in mind.
3.4. Validity, reliability and epistemic considerations
Some notions on ontology and epistemology are made here to help assess the validity and reliability of the findings in this study. The position taken in this study is that when drawing any conclusion from the data it must be considered that the results represent only the answers that were given to the survey questions, but do not necessarily describe anything else accurately. This view is amended by considering that the answers given to the survey are a reflection of the phenomena happening in the background behind the veil of human understanding. Thus the position of subjectivism is assumed in this study and it is argued that the socially constructed reality can only be viewed through subjec-tive perceptions. Social constructionism states that as far as the actions of social beings are concerned there is no absolute measure other than the opinions and beliefs of each individual (Saunders et al. 2009, p. 111). The key to understanding socially constructed phenomena is to understand the subjective perceptions of the participating individuals and in this study this is carried out quantitatively using a survey. A quantitative research method using a survey is an adequate approach in social constructionism (Burr 2003, p. 112), which can be seen as a way of reducing rich social information for statistical dis-covery by empirical and quantitative scientific methods.
The adoption of social constructionism also guides this study in choosing the epistemo-logical position in what types of information can be considered suitable for making con-clusions. Critical realism is considered to be the best epistemological approach in this case to evaluate the nature of the data from the survey, since it can be used for valuing the opinions of the respondents on the measured phenomena at CERN. Critical realism considers evidence in dual manner; as being the phenomena itself, or at least a represen-tation of the phenomena, and as the human interpretation of the phenomena laid with motives and values. Miller and Chang also argue that a critical realist standpoint on epistemology is suitable for investigating contingencies in management control research (Miller and Tsang 2010, p. 153). The survey method yields appropriate data that can be
56
accepted with a critical realism standpoint, since the perceptions of the participants are the unit of analysis.
The ontological and epistemological positions of social constructionism and critical re-alism are best exemplified with the form that the questions take in the survey; respond-ents are asked to indicate whether they agree or disagree with a series of statements. This places emphasis on the perception and subjective opinion of the respondents. The collection of these opinions is taken as the best possible approximation of the contingent factors affecting performance consciousness at CERN. This thinking reflects the views of George E. P. Box in his widely cited quote “Essentially, all models are wrong, but some are useful.”.
This study will utilize a model that includes only four contingent constructs. It would thus appear that a reductionist view is taken on how to explain the effects of contingent factors on performance consciousness. A reductionist approach is however discarded and it is accepted that the conceptual model is inherently non-exhaustive. The narrow scope of the model is not a problem, since this study does not seek to explain all the contingencies affecting performance consciousness. Instead, the goal is to focus on ex-plaining the effects of the selected contingencies. This is why generalizability, or in oth-er words, external validity, which measures the applicability of the findings in other set-tings, is also not required by this study. This is a case study, and any comparisons with other studies are to be made on case by case basis.
A concern arising from the restrictive nature of the survey is that correlation between the variables does not necessarily require causation. Causation is partly asserted from the variables scope and interdependence, which are derived from internal documenta-tion at CERN. Otherwise causation is assumed based on previous studies, observations and logic. Causation was discussed in further detail in chapter 3.1.3.
The validity and reliability of the findings in this study are evaluated. Validity refers to the extent that the findings represent the phenomena they were intended to measure. In-corporating theory and observations from the interventionist participation, discussions and interviews as well as the two pilot studies aim at maximizing the face validity of the findings in this study. Saunders et al. (2009, pp. 372-373) mention four types of validity that are important to consider when carrying out survey studies: Internal validity, con-tent validity, predictive validity and construct validity. Reliability assesses how con-sistent results the survey instrument yields. Reliability measures for surveys according to Saunders et al. (2009, pp. 373-374) include test re-test, internal consistency and alter-native form. Figure 3.7 visualizes how validity and reliability refer to the efficacy and efficiency of whether the correct phenomenon was adequately observer.

57
Figure 3.7. Validity and reliability.
Internal validity estimates whether the findings of the survey measure what they intend to measure, i.e. in the case of this study, are standardization, variation and performance consciousness really being studied by the measurement instrument? This study is con-sidered to be internally valid, because the constructs being measured are well estab-lished in previous theoretical discussions. Content validity and construct validity gener-ally speaking refer to the adequacy of the instrument intended for measuring the object of the study. Requirements for content and construct validity are met through the use of OAI instrument, because the measures have already been proven in previous studies. Each latent variable is well represented in the survey with the operationalization of five question items, which is plenty and even allows for discarding items if deemed neces-sary. Predictive validity is the ability of the findings to be used for making predictions and it is usually evaluated by the strength of the correlation between variables (Saunders et al. 2009, p. 373). The final validity of the results is determined by how they compare to previous studies measuring similar variables.
Reliability of the results can be asserted through test re-test, in which the instrument is administered twice to the same respondents under similar circumstances and the con-sistency of the results is then compared. The survey was administered only once in or-der to avoid respondent fatigue and thus test re-test reliability is not asserted in this study. Internal consistency is a statistical measure, which measures the intercorrelations of the items of a latent variable. Measures of internal consistency used in this study are Cronbach’s alpha and composite reliability (Shook et al. 2004, p. 400). Average vari-ance extracted is also used to assess whether the findings surface clearly from the vari-ance in the responses. Alternative form is method of confirming reliability by measuring the survey item twice using different wording. Any significant differences between the answers to the similar questions would reveal underlying problems in the instrument and possibly prove it unreliable. Alternative form was not used in this study because the brevity of the survey was considered more important.
58
The impacts of participant bias and error as well observer bias and error were consid-ered. Participant bias could possibly arise from the doubts of teleology of the survey (Anderson and Widener 2007, p. 335). Participant bias is reduced by addressing teleo-logical doubts in the invitation letter of the survey. Participant error is thought to be negligible in this study because the administration of the electronic survey creates very similar circumstances for the respondents and because the sample was very homoge-nous. Different perceptions with regard to the hermeneutics of the question items are not considered here to be a source of participant error, which would threaten reliability be-cause the unit of analysis is the perception of the respondent. Bommer et al. (1995, pp. 601-602) found in their study that subjective self-reports of performance, which are based on perception, do not correlate as strongly as expected with objective perfor-mance measures. Despite this Bommer et al. recommend that more emphasis should be given to examining the structures affecting performance, instead of concentrating dis-proportionately on the distinction between subjective and objective nature of measures. Observer error and observer bias are not considered to be threats to reliability because the results are collected through a questionnaire survey and thus provide sufficient transparency for the collection method and analysis.
59
4. EMPIRICAL RESULTS
In this chapter the data from the survey is inspected and the validity and reliability of the results are analyzed. Descriptive statistics are performed using SPSS programming package. The screened data is then fitted to the conceptual model using structural equa-tion modeling using AMOS program. A confirmatory factor analysis is done which in-volves some modifications done to the initial model using the SEM program. The valid-ity and reliability of the model is evaluated and the results are documented.
The model for non-ticket tasks was not specified according to the criteria presented in chapter 3.1.4. Since the data concerning non-ticket tasks received from the survey does not fit the conceptual model, it is rejected for non-ticket tasks. Nevertheless, the Pearson correlation matrix for the rejected model for non-ticket tasks is reported in appendix 3. In this chapter model fit is performed only for the ticket tasks and the subsequent dis-cussion will also concentrate exclusively on ticket tasks.
Non-ticket tasks did not fit the conceptual model most likely because the instrument was designed for ticket tasks and the inclusion of non-ticket tasks was more of an after-thought. In hindsight it can be said that the scope should have been in the first place so that non-ticket tasks would have not been included in the first place. However, some useful data was acquired from non-ticket tasks. The descriptive statistics reveal how the respondents view non-ticket tasks in relation to ticket tasks.
4.1. Data collection
45 respondents answered the survey. When the respondents were approached, it ap-peared that the list of functional service managers was outdated and some of the re-spondents had either left the organization or moved on to other responsibilities. When the people who were not part of the sample are accounted for, the actual size of the sampling frame is 111 respondents and in this case the response rate of the survey is 41%. It is remembered that the corrected sampling frame of 111 respondents is also the whole population of functional service managers as discussed in chapter 3.3. The raw data for ticket tasks and non-ticket tasks are presented in appendices four and five re-spectively.
The invitations to the survey were sent via email, which included an invitation letter and a link to the electronic survey. The initial responses accounted for around half of the
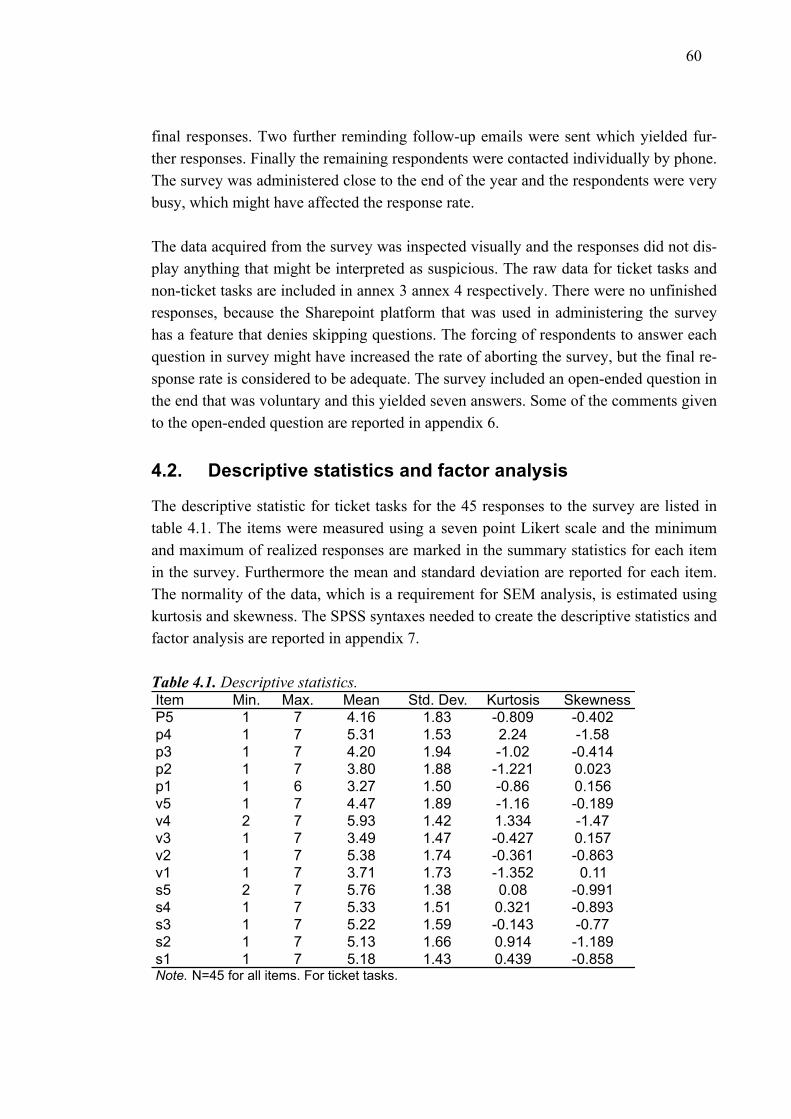
60
final responses. Two further reminding follow-up emails were sent which yielded fur-ther responses. Finally the remaining respondents were contacted individually by phone. The survey was administered close to the end of the year and the respondents were very busy, which might have affected the response rate.
The data acquired from the survey was inspected visually and the responses did not dis-play anything that might be interpreted as suspicious. The raw data for ticket tasks and non-ticket tasks are included in annex 3 annex 4 respectively. There were no unfinished responses, because the Sharepoint platform that was used in administering the survey has a feature that denies skipping questions. The forcing of respondents to answer each question in survey might have increased the rate of aborting the survey, but the final re-sponse rate is considered to be adequate. The survey included an open-ended question in the end that was voluntary and this yielded seven answers. Some of the comments given to the open-ended question are reported in appendix 6.
4.2. Descriptive statistics and factor analysis
The descriptive statistic for ticket tasks for the 45 responses to the survey are listed in table 4.1. The items were measured using a seven point Likert scale and the minimum and maximum of realized responses are marked in the summary statistics for each item in the survey. Furthermore the mean and standard deviation are reported for each item. The normality of the data, which is a requirement for SEM analysis, is estimated using kurtosis and skewness. The SPSS syntaxes needed to create the descriptive statistics and factor analysis are reported in appendix 7.
Table 4.1. Descriptive statistics.
Item Min. Max. Mean Std. Dev. Kurtosis SkewnessP5 1 7 4.16 1.83 -0.809 -0.402p4 1 7 5.31 1.53 2.24 -1.58p3 1 7 4.20 1.94 -1.02 -0.414p2 1 7 3.80 1.88 -1.221 0.023p1 1 6 3.27 1.50 -0.86 0.156v5 1 7 4.47 1.89 -1.16 -0.189v4 2 7 5.93 1.42 1.334 -1.47v3 1 7 3.49 1.47 -0.427 0.157v2 1 7 5.38 1.74 -0.361 -0.863v1 1 7 3.71 1.73 -1.352 0.11s5 2 7 5.76 1.38 0.08 -0.991s4 1 7 5.33 1.51 0.321 -0.893s3 1 7 5.22 1.59 -0.143 -0.77s2 1 7 5.13 1.66 0.914 -1.189s1 1 7 5.18 1.43 0.439 -0.858Note. N=45 for all items. For ticket tasks.
61
The respondents used the whole scale available, except for items v4, s5 for which no respondent marked the lowest score. Concerning performance consciousness, no re-spondent indicated the highest mark for the item p1. The means of the responses for each item were in the 50th percentile, and items measuring standardization had very high means. Items v4, v2 and p4 also had high means. The standard deviations of the responses appear to be quite similar among the question items and do not display very big differences in the spread of the perception.
The descriptive statistics for non-ticket tasks is reported in appendix 8 and it is com-pared with the descriptive statistics of ticket tasks. The items pertaining to the construct PER have received lower ratings on average for non-ticket tasks, with the exception of item p2 and s5 which received a slightly lower rating. This indicates that the respond-ents do not have as much certainty over the performance of longer-term project type tasks and that non-ticket tasks have lower levels of standardization. The items belonging to the construct VAR received much higher scores on average for non-ticket tasks, apart from item v4. This indicates that the work requirements for non-ticket tasks are more uncertain. However the wording of the questionnaire for non-ticket tasks concerning the construct VAR was perhaps not suitable.
For data to be considered normally distributed in SEM studies kurtosis should be within the range of ±7 and skewness should be within the range of ±2 (Curran et al. 1996, p. 26). All the items are within the recommended range of kurtosis and skewness and thus the data is assumed to be normally distributed. Other authors recommend more stringent criteria for skewness and kurtosis, but this study assumes normality of the data because the values of skewness and kurtosis are not very large and that the population is small. The sampling frame is the entire population, so the sample size was also considered to be adequate. The data was determined to be adequately normal which is a requirement for SEM.
Pearson correlation for ticket tasks was performed and the results are attached in appen-dix 9. The Pearson correlation for ticket tasks shows that items s4 and s5 are negatively internally correlated with the other items from the construct STA and this could be a potential problem for the construct. The items in the constructs VAR and PER are all internally positively correlated, but the items between these two constructs are all nega-tively correlated. It can be seen that the item from the VAR construct are negatively cor-related between the items from the STA construct, with the exception of s5 and the cor-relation between v3 and s4. Items in the STA and PER constructs have mixed correla-tions between each other.
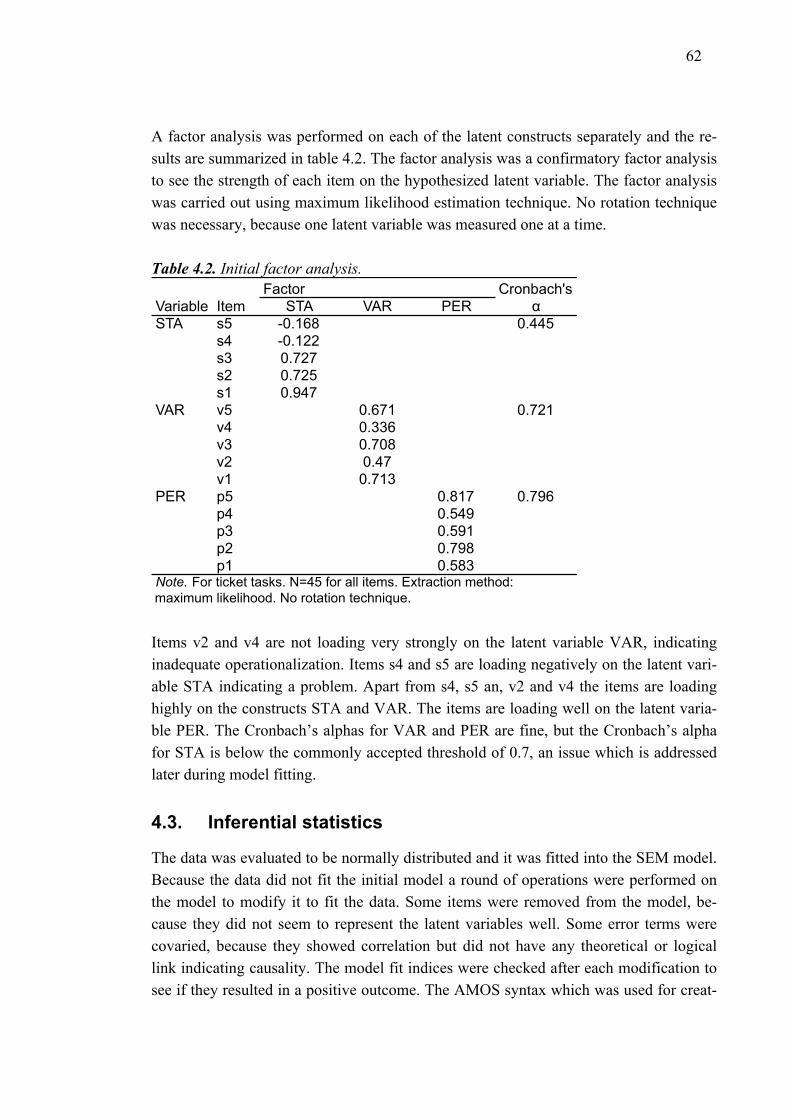
62
A factor analysis was performed on each of the latent constructs separately and the re-sults are summarized in table 4.2. The factor analysis was a confirmatory factor analysis to see the strength of each item on the hypothesized latent variable. The factor analysis was carried out using maximum likelihood estimation technique. No rotation technique was necessary, because one latent variable was measured one at a time.
Table 4.2. Initial factor analysis.
Items v2 and v4 are not loading very strongly on the latent variable VAR, indicating inadequate operationalization. Items s4 and s5 are loading negatively on the latent vari-able STA indicating a problem. Apart from s4, s5 an, v2 and v4 the items are loading highly on the constructs STA and VAR. The items are loading well on the latent varia-ble PER. The Cronbach’s alphas for VAR and PER are fine, but the Cronbach’s alpha for STA is below the commonly accepted threshold of 0.7, an issue which is addressed later during model fitting.
4.3. Inferential statistics
The data was evaluated to be normally distributed and it was fitted into the SEM model. Because the data did not fit the initial model a round of operations were performed on the model to modify it to fit the data. Some items were removed from the model, be-cause they did not seem to represent the latent variables well. Some error terms were covaried, because they showed correlation but did not have any theoretical or logical link indicating causality. The model fit indices were checked after each modification to see if they resulted in a positive outcome. The AMOS syntax which was used for creat-
FactorVariable Item STA VAR PERSTA s5 -0.168 0.445
s4 -0.122s3 0.727s2 0.725s1 0.947
VAR v5 0.671 0.721v4 0.336v3 0.708v2 0.47v1 0.713
PER p5 0.817 0.796p4 0.549p3 0.591p2 0.798p1 0.583
Note. For ticket tasks. N=45 for all items. Extraction method: maximum likelihood. No rotation technique.
Cronbach's !
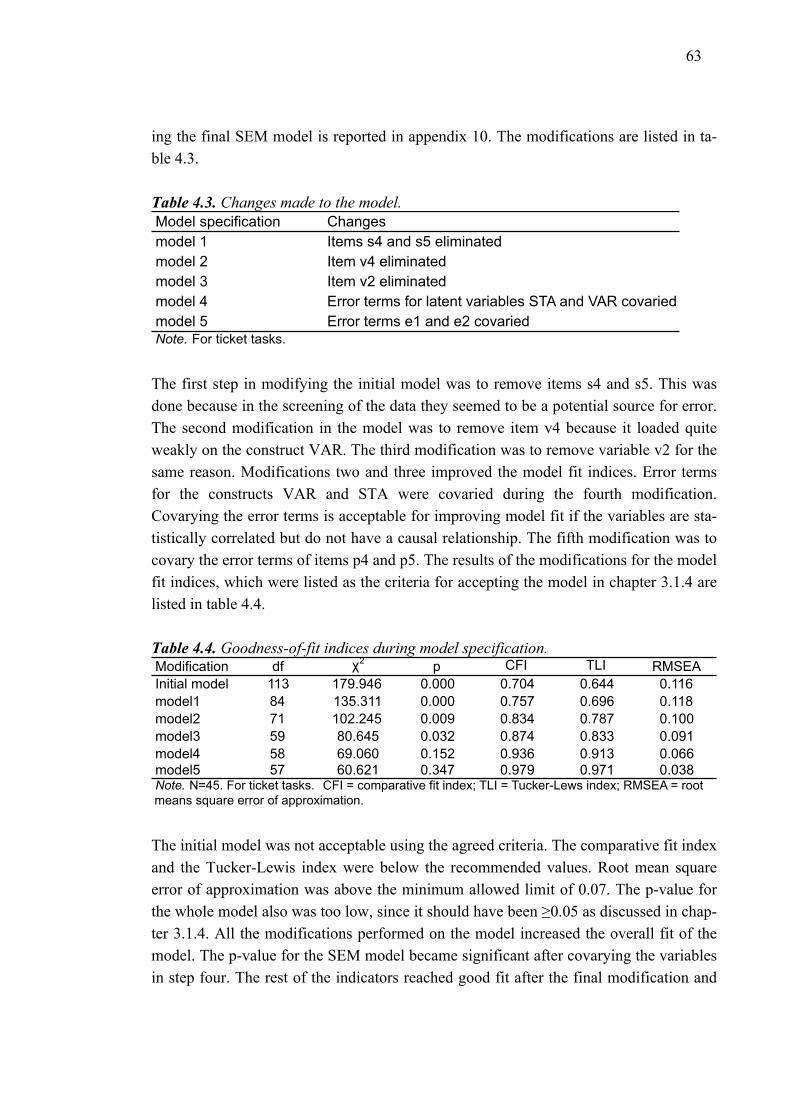
63
ing the final SEM model is reported in appendix 10. The modifications are listed in ta-ble 4.3.
Table 4.3. Changes made to the model.
The first step in modifying the initial model was to remove items s4 and s5. This was done because in the screening of the data they seemed to be a potential source for error. The second modification in the model was to remove item v4 because it loaded quite weakly on the construct VAR. The third modification was to remove variable v2 for the same reason. Modifications two and three improved the model fit indices. Error terms for the constructs VAR and STA were covaried during the fourth modification. Covarying the error terms is acceptable for improving model fit if the variables are sta-tistically correlated but do not have a causal relationship. The fifth modification was to covary the error terms of items p4 and p5. The results of the modifications for the model fit indices, which were listed as the criteria for accepting the model in chapter 3.1.4 are listed in table 4.4.
Table 4.4. Goodness-of-fit indices during model specification.
The initial model was not acceptable using the agreed criteria. The comparative fit index and the Tucker-Lewis index were below the recommended values. Root mean square error of approximation was above the minimum allowed limit of 0.07. The p-value for the whole model also was too low, since it should have been !0.05 as discussed in chap-ter 3.1.4. All the modifications performed on the model increased the overall fit of the model. The p-value for the SEM model became significant after covarying the variables in step four. The rest of the indicators reached good fit after the final modification and
Model specification Changesmodel 1 Items s4 and s5 eliminatedmodel 2 Item v4 eliminatedmodel 3 Item v2 eliminatedmodel 4 Error terms for latent variables STA and VAR covariedmodel 5 Error terms e1 and e2 covariedNote. For ticket tasks.
Modification df !2 p CFI TLI RMSEAInitial model 113 179.946 0.000 0.704 0.644 0.116model1 84 135.311 0.000 0.757 0.696 0.118model2 71 102.245 0.009 0.834 0.787 0.100model3 59 80.645 0.032 0.874 0.833 0.091model4 58 69.060 0.152 0.936 0.913 0.066model5 57 60.621 0.347 0.979 0.971 0.038Note. N=45. For ticket tasks. CFI = comparative fit index; TLI = Tucker-Lews index; RMSEA = root means square error of approximation.
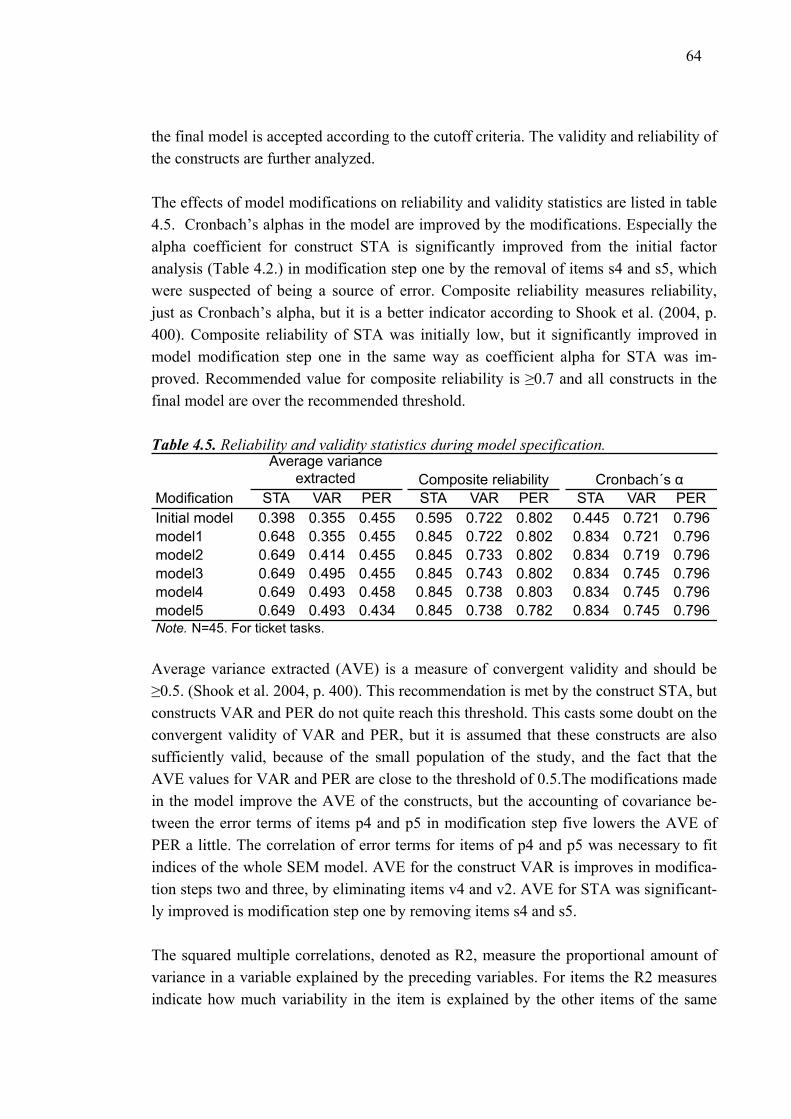
64
the final model is accepted according to the cutoff criteria. The validity and reliability of the constructs are further analyzed.
The effects of model modifications on reliability and validity statistics are listed in table 4.5. Cronbach’s alphas in the model are improved by the modifications. Especially the alpha coefficient for construct STA is significantly improved from the initial factor analysis (Table 4.2.) in modification step one by the removal of items s4 and s5, which were suspected of being a source of error. Composite reliability measures reliability, just as Cronbach’s alpha, but it is a better indicator according to Shook et al. (2004, p. 400). Composite reliability of STA was initially low, but it significantly improved in model modification step one in the same way as coefficient alpha for STA was im-proved. Recommended value for composite reliability is !0.7 and all constructs in the final model are over the recommended threshold.
Table 4.5. Reliability and validity statistics during model specification.
Average variance extracted (AVE) is a measure of convergent validity and should be !0.5. (Shook et al. 2004, p. 400). This recommendation is met by the construct STA, but constructs VAR and PER do not quite reach this threshold. This casts some doubt on the convergent validity of VAR and PER, but it is assumed that these constructs are also sufficiently valid, because of the small population of the study, and the fact that the AVE values for VAR and PER are close to the threshold of 0.5.The modifications made in the model improve the AVE of the constructs, but the accounting of covariance be-tween the error terms of items p4 and p5 in modification step five lowers the AVE of PER a little. The correlation of error terms for items of p4 and p5 was necessary to fit indices of the whole SEM model. AVE for the construct VAR is improves in modifica-tion steps two and three, by eliminating items v4 and v2. AVE for STA was significant-ly improved is modification step one by removing items s4 and s5.
The squared multiple correlations, denoted as R2, measure the proportional amount of variance in a variable explained by the preceding variables. For items the R2 measures indicate how much variability in the item is explained by the other items of the same
Modification STA VAR PER STA VAR PER STA VAR PERInitial model 0.398 0.355 0.455 0.595 0.722 0.802 0.445 0.721 0.796model1 0.648 0.355 0.455 0.845 0.722 0.802 0.834 0.721 0.796model2 0.649 0.414 0.455 0.845 0.733 0.802 0.834 0.719 0.796model3 0.649 0.495 0.455 0.845 0.743 0.802 0.834 0.745 0.796model4 0.649 0.493 0.458 0.845 0.738 0.803 0.834 0.745 0.796model5 0.649 0.493 0.434 0.845 0.738 0.782 0.834 0.745 0.796Note. N=45. For ticket tasks.
Average variance extracted Composite reliability Cronbach´s !

65
latent variable. Hooper et al. (2008, p. 56) say that items with a R2 less than 0.2 should be removed as these items could possibly be operationalized incorrectly and introduce error. The items have very good R2 values and fulfill this requirement with the excep-tion of item p4. Item p4 has an R2 of 0.15 and it is deemed passable to ensure overall model fit. Items s1 and v3 have a very high R2. The latent variables display moderately low R2 values, as is typical for latent variables. Lower values for squared multiple cor-relations are commonly used, for example by Vickery et al. (1999, p. 386). The r-squared values for the latent variables are deemed suitable. R2 for VAR means that the preceding variables INT and SCO explain 20.2% of the variance in VAR and the same applies for STA. In the case of PER all the other variables INT, SCO, STA and VAR explain 13.2% of the variance in PER. The squared multiple correlations for the latent variables and items are shown in table 4.6.
Table 4.6. Squared multiple correlations for the final model.
The final SEM model is accepted and considered here to be reasonably valid and relia-ble and the model can thus be used for testing the hypotheses. The hypotheses are tested by analyzing the causal paths between the constructs through path analysis. For a hy-pothesis to be accepted it needs to display the correct sign and statistical significance at p<0.1. Also a high path coefficient is desirable for demonstrating a clear relationship between the constructs, but this is not a requirement. The directions of the causality have been determined beforehand in chapter 3.1.2. The Path coefficients and their sig-nificances are shown in table 4.7.
Variable R2V 0.202S 0.138P 0.132p1 0.359p2 0.78p3 0.375p4 0.15p5 0.504v1 0.347v3 0.752v5 0.379s1 0.882s2 0.532s3 0.534

66
Table 4.7. Standardized and unstandardized estimates for path coefficient.
Variables s1, v5 and p5 do not have significance because the SEM analysis requires to manually set one unstandardized path coefficients for each latent variable as one. The significances were given as two-tailed significances by the AMOS program and they are converted here to one-tailed significances. All the loadings of the items on the latent variables are significant. The strengths of the standardized paths from the items to the constructs indicate good validity of the selected items in the instrument. The paths be-tween the latent constructs are mixed. Four of the paths are significant at the p<0.05 level and the path from INT to PER is significant at the p<0.1 level. These paths also indicate moderately strong interaction between the constructs. Three of the paths demonstrate a weak link between the constructs and they are not statistically significant.
Path EstimateStandard
errorStandardized
estimateINT ! STA 0.162 0.096 0,252**SCO ! STA -0.165 0.09 -0,273**SCO ! VAR 0.176 0.086 0,337**INT ! VAR -0.166 0.092 -0,298**INT ! PER 0.166 0.107 0.267*SCO ! PER 0.023 0.102 0.04VAR ! PER -0.108 0.304 -0.097STA ! PER 0.104 0.234 0.108STA ! s3 0.865 0.16 0,73***STA ! s2 0.9 0.166 0,729***STA ! s1 1 † 0,939VAR ! v5 1 † 0,616VAR ! v3 1.094 0.308 0,867***VAR ! v1 0.874 0.27 0,589**PER ! p5 1 † 0,71PER ! p4 0.456 0.162 0,387**PER ! p3 0.912 0.248 0,612***PER ! p2 1.274 0.292 0,883***PER ! p1 0.69 0.191 0,599***Note. *,** and *** denote one-tailed signifigance at 0.1, 0.05 and 0.001 respectively. †=Not available.
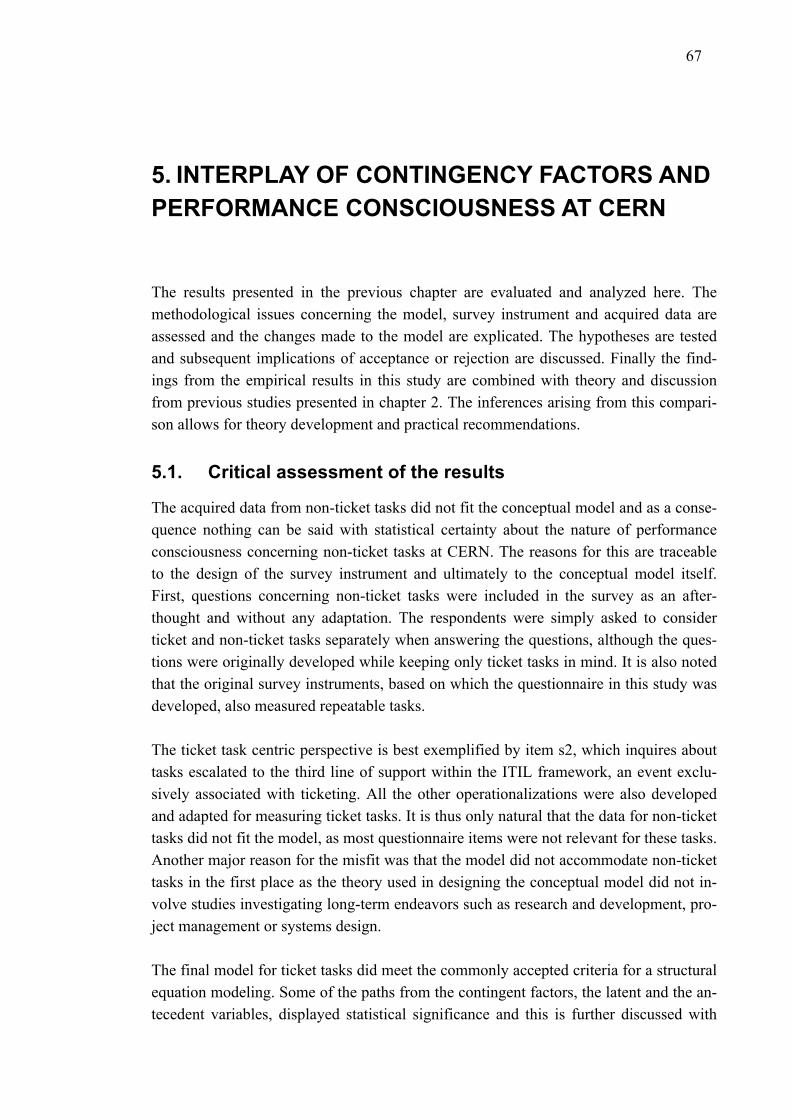
67
5. INTERPLAY OF CONTINGENCY FACTORS AND PERFORMANCE CONSCIOUSNESS AT CERN
The results presented in the previous chapter are evaluated and analyzed here. The methodological issues concerning the model, survey instrument and acquired data are assessed and the changes made to the model are explicated. The hypotheses are tested and subsequent implications of acceptance or rejection are discussed. Finally the find-ings from the empirical results in this study are combined with theory and discussion from previous studies presented in chapter 2. The inferences arising from this compari-son allows for theory development and practical recommendations.
5.1. Critical assessment of the results
The acquired data from non-ticket tasks did not fit the conceptual model and as a conse-quence nothing can be said with statistical certainty about the nature of performance consciousness concerning non-ticket tasks at CERN. The reasons for this are traceable to the design of the survey instrument and ultimately to the conceptual model itself. First, questions concerning non-ticket tasks were included in the survey as an after-thought and without any adaptation. The respondents were simply asked to consider ticket and non-ticket tasks separately when answering the questions, although the ques-tions were originally developed while keeping only ticket tasks in mind. It is also noted that the original survey instruments, based on which the questionnaire in this study was developed, also measured repeatable tasks.
The ticket task centric perspective is best exemplified by item s2, which inquires about tasks escalated to the third line of support within the ITIL framework, an event exclu-sively associated with ticketing. All the other operationalizations were also developed and adapted for measuring ticket tasks. It is thus only natural that the data for non-ticket tasks did not fit the model, as most questionnaire items were not relevant for these tasks. Another major reason for the misfit was that the model did not accommodate non-ticket tasks in the first place as the theory used in designing the conceptual model did not in-volve studies investigating long-term endeavors such as research and development, pro-ject management or systems design.
The final model for ticket tasks did meet the commonly accepted criteria for a structural equation modeling. Some of the paths from the contingent factors, the latent and the an-tecedent variables, displayed statistical significance and this is further discussed with
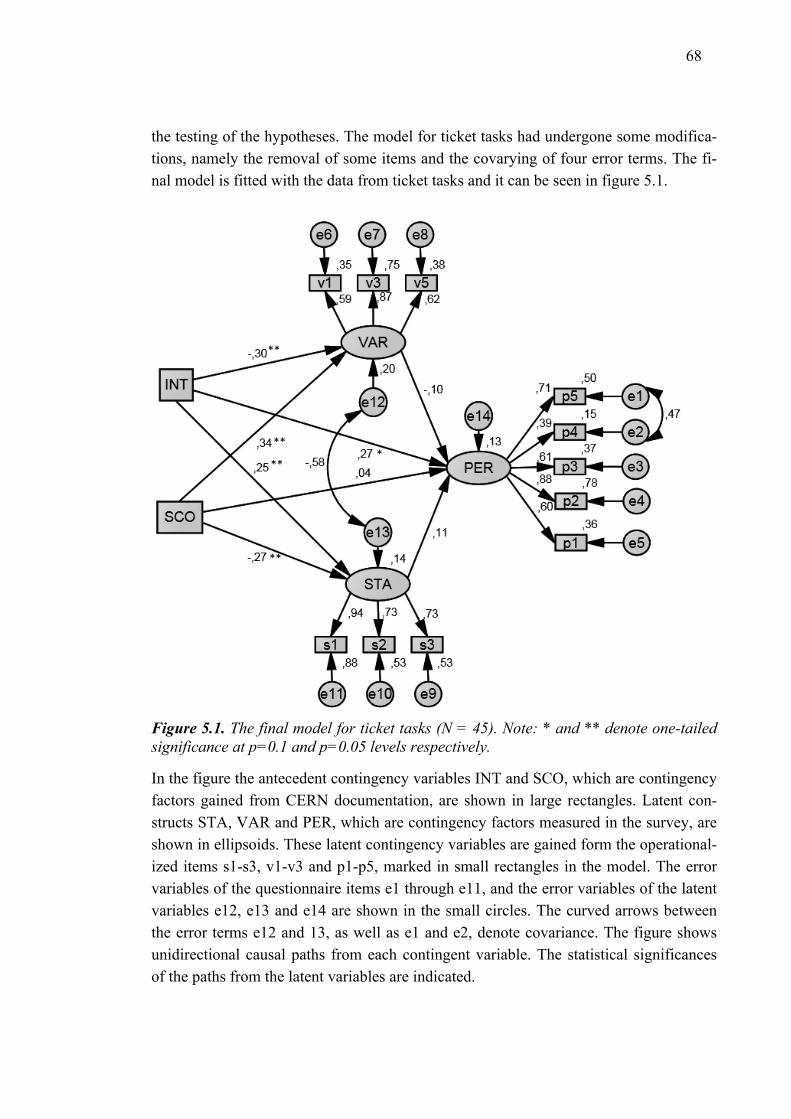
68
the testing of the hypotheses. The model for ticket tasks had undergone some modifica-tions, namely the removal of some items and the covarying of four error terms. The fi-nal model is fitted with the data from ticket tasks and it can be seen in figure 5.1.
Figure 5.1. The final model for ticket tasks (N = 45). Note: * and ** denote one-tailed significance at p=0.1 and p=0.05 levels respectively.
In the figure the antecedent contingency variables INT and SCO, which are contingency factors gained from CERN documentation, are shown in large rectangles. Latent con-structs STA, VAR and PER, which are contingency factors measured in the survey, are shown in ellipsoids. These latent contingency variables are gained form the operational-ized items s1-s3, v1-v3 and p1-p5, marked in small rectangles in the model. The error variables of the questionnaire items e1 through e11, and the error variables of the latent variables e12, e13 and e14 are shown in the small circles. The curved arrows between the error terms e12 and 13, as well as e1 and e2, denote covariance. The figure shows unidirectional causal paths from each contingent variable. The statistical significances of the paths from the latent variables are indicated.
!
!!"
!!"
!!"
!!"!"
69
The reasons and possible implications for changes made in the model are discussed here. The first change made to the model was that items s4 and s5 were removed. This was done based on their small, and negative, loading on the latent construct STA when the preliminary factor analysis was performed. The removed items investigated whether the work was highly specialized and if personnel could assume the duties of their col-leagues when necessary. A higher level of standardization was given by the answers to these questions than to the other items in construct STA. It can be interpreted that the answers to these items reflect the high skills of the staff and their ability to respond to events rather than the degree of standardization in the processes themselves.
Similarly to the removed items in latent variable STA v2 and v4, which concern the contingent variable task variation, were removed. The items were deleted because they did not load very highly on the latent construct VAR. Answers to items v2 and v4 seem to imply that there is very little variation in terms of difficulty and time requirements in solving the ticket tasks, which is somewhat contrary to v1, v3 and v5, which indicate higher levels of variation overall. As before, v2 and v4 could be taken to imply the ad-vanced professional skills of the personnel, rather than the systemic variation within the incoming requests.
The error terms were covaried because an examination of the model fit indices recom-mended that the overall fit of the model would improve upon this. Covarying error terms in SEM means including the unanalyzed association between the variables in question (Kline 2010, p. 65). No explanation or assumption is made on the relationship or causality of these variables, albeit the association is included in the computer analy-sis. In the case of STA and VAR, it can be seen based on their definitions in chapter 3.1.1 that they are conceptually different. Despite this it is possible to think that a strict-ly defined and standardized task regime produces an effect where the appearance of task variation seems reduced. Conversely, a relatively homogenous set of tasks could very well result in a perception of high levels of standardization, even when no standard op-erating procedures are in place.
The covariance between e1 and e2 can be explained through examining the operational-ized questions themselves. E1 is the error term for item p5, which asks about the access to management accounting information. E2, the error term of p4, on the other hand in-quires about the usefulness of the performance and cost data in making decisions. As both of these items are indicators for the latent variable PER it is not surprising that they covary. The questions are similar and they have only a slight conceptual difference. It can be said with relative certainty that they do not conceptually cause each other, so they are covaried.
70
Aside from the statistical data, the survey also offered the option for the respondents to express their opinions through an open-ended question. A total of seven open-ended re-sponses were given and some of them are reported in appendix 6. One feedback in par-ticular brought attention to an idea that the functional elements, which provide in coop-eration the actual services experienced by the user, should not be decoupled and treated in an atomistic way. Personnel in the service management system work in multiple functional elements at the same time, and this creates problems for focusing perfor-mance consciousness for each functional element individually. This is to say that the functional service managers perceive the performance of their activities more holistical-ly and do not necessarily make a big distinction between different functional elements. This holistic nature of performance consciousness is a challenge for measuring the per-formance of services. This same sentiment was expressed in another comment, which mentioned that the service management system purported to have the same structure for the creators and users of services, which in his opinion was not a useful approach.
It can be argued that the chosen quantitative method was unsuitable for the more loosely defined non-ticket tasks and maybe a more qualitative approach would have garnered meaningful insights into the project tasks. The objective of the research was however to find how contingency factors affect performance consciousness, and this research ques-tion directed attention towards ticketed tasks. Also the previous findings and theory concentrated in researching routine tasks using quantitative research methods and the same approach was chosen here to facilitate comparison with these studies.
Overall it is seen that the chosen method is seen as suitable for the purpose because it is used as a tool for investigating CERN and comparing the findings with previous re-search. A qualitative research method, such as ethnography, might have been more suit-able for finding rich information on how the tasks are carried out exactly, but this was not the focus of this study. Especially concerning non-ticket tasks, qualitative methods could reveal a lot of new insights. The relatively small population, which also wholly comprised the sampling frame, also implies that a qualitative method might have been more useful. If the focus on non-ticket tasks had been increased, the sampling frame would have had to be changed, as some of the personnel work either in projects, ticket-ing or both.
This research describes how selected contingencies affect performance consciousness of service managers at CERN, but other contingency factors are surely relevant as the cur-rent ones explain 13% of the variance in performance consciousness. In addition to this the present latent contingency factors were modeled with three indicators each, which does not necessarily fully capture the dynamics of these factors. The combination of ar-chival data with the measurement instrument raises the reliability of the findings. The
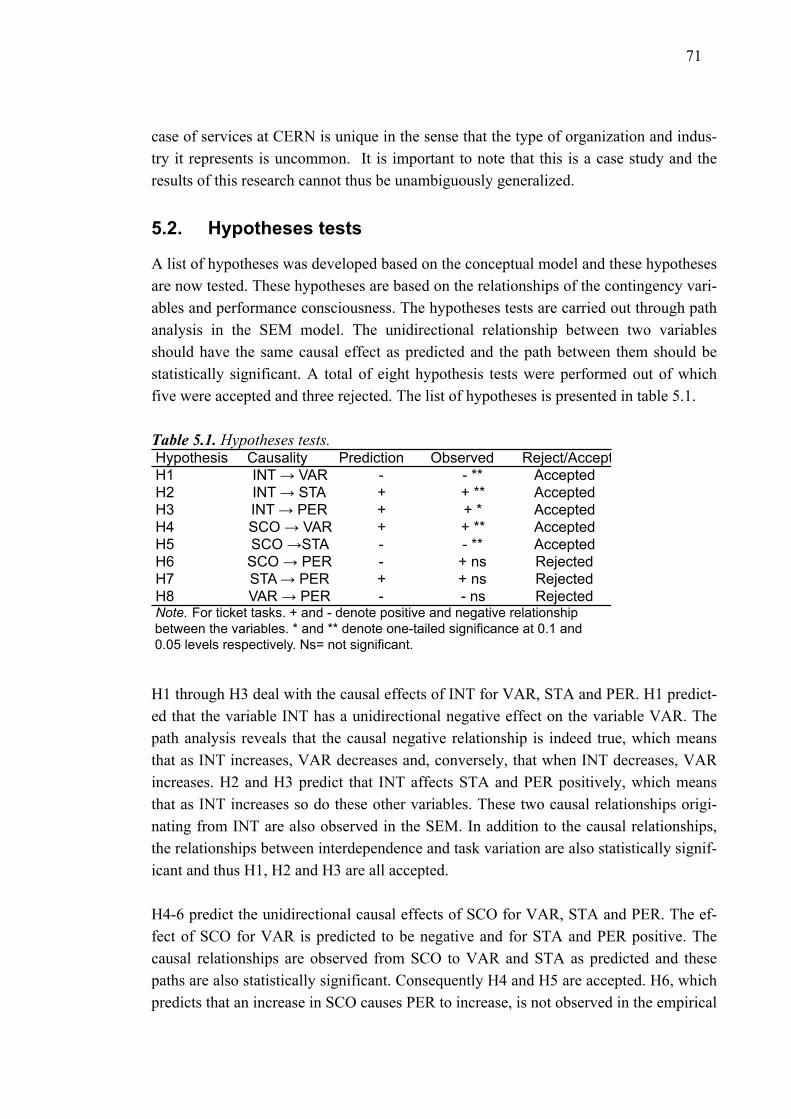
71
case of services at CERN is unique in the sense that the type of organization and indus-try it represents is uncommon. It is important to note that this is a case study and the results of this research cannot thus be unambiguously generalized.
5.2. Hypotheses tests
A list of hypotheses was developed based on the conceptual model and these hypotheses are now tested. These hypotheses are based on the relationships of the contingency vari-ables and performance consciousness. The hypotheses tests are carried out through path analysis in the SEM model. The unidirectional relationship between two variables should have the same causal effect as predicted and the path between them should be statistically significant. A total of eight hypothesis tests were performed out of which five were accepted and three rejected. The list of hypotheses is presented in table 5.1.
Table 5.1. Hypotheses tests.
H1 through H3 deal with the causal effects of INT for VAR, STA and PER. H1 predict-ed that the variable INT has a unidirectional negative effect on the variable VAR. The path analysis reveals that the causal negative relationship is indeed true, which means that as INT increases, VAR decreases and, conversely, that when INT decreases, VAR increases. H2 and H3 predict that INT affects STA and PER positively, which means that as INT increases so do these other variables. These two causal relationships origi-nating from INT are also observed in the SEM. In addition to the causal relationships, the relationships between interdependence and task variation are also statistically signif-icant and thus H1, H2 and H3 are all accepted.
H4-6 predict the unidirectional causal effects of SCO for VAR, STA and PER. The ef-fect of SCO for VAR is predicted to be negative and for STA and PER positive. The causal relationships are observed from SCO to VAR and STA as predicted and these paths are also statistically significant. Consequently H4 and H5 are accepted. H6, which predicts that an increase in SCO causes PER to increase, is not observed in the empirical
Hypothesis Causality Prediction Observed Reject/AcceptH1 INT ! VAR - - ** AcceptedH2 INT ! STA + + ** AcceptedH3 INT ! PER + + * AcceptedH4 SCO ! VAR + + ** AcceptedH5 SCO !STA - - ** AcceptedH6 SCO ! PER - + ns RejectedH7 STA ! PER + + ns RejectedH8 VAR ! PER - - ns RejectedNote. For ticket tasks. + and - denote positive and negative relationship between the variables. * and ** denote one-tailed significance at 0.1 and 0.05 levels respectively. Ns= not significant.
72
model. The path in question is also not statistically significant and as a result H6 is re-jected. It is worth noting that the INT and SCO are obtained from archival data and this justifies the assumption of unidirectionality. H7 and H8 represent the paths from STA and VAR to performance consciousness. These latent variables were measured exclu-sively in the survey instrument. These paths were not statistically significant and H7 and H8 are rejected.
The rejection of some of the hypotheses does not necessitate that the opposite is true, rather it states that the null hypothesis cannot be rejected with confidence. The most im-portant takeaway from the hypotheses testing is that the performance consciousness at CERN has a makeup that is suggested by previous studies of contingency factors. The results are similar with theoretical predictions of the behavior of contingency factors extracted from previous cases and quantitative studies. This is an important finding since it allows the present understanding of the effects of contingency factors to be con-fidently extended to new circumstances and to gain more validity, even in such untypi-cal environments as CERN. This contrasting increases the generalizability of the claims concerning the effects of the contingency factors and increases the knowledge base.
5.3. Theoretical reflections on the findings
The empirical survey revealed some of the effects the contingency factors had on per-formance consciousness at CERN. These findings are useful in themselves as they in-crease the understanding of how organizational structure and the design of activities in-fluence the basis of control, which in turn helps decision-making. The findings can function as one additional source of information, which aids in making informed deci-sion with the discretion of experienced professionals. Here some general suggestions for courses of action are made from a theoretical point of view based on the MCS literature presented in chapter 2.
Before the existing literature on MCS is applied to the findings, it is noted that that the contingency factors have direct and indirect effects. The hypotheses are tested based on the direct effects of the contingency factors, but they also have indirect effects. As the empirical model is based on mediation this causes the antecedents to have an indirect effect on the endogenous variable via the mediating variables. These indirect paths do not have statistical significance. A list of direct, indirect and total effects of the contin-gency variables is presented in table 5.2.
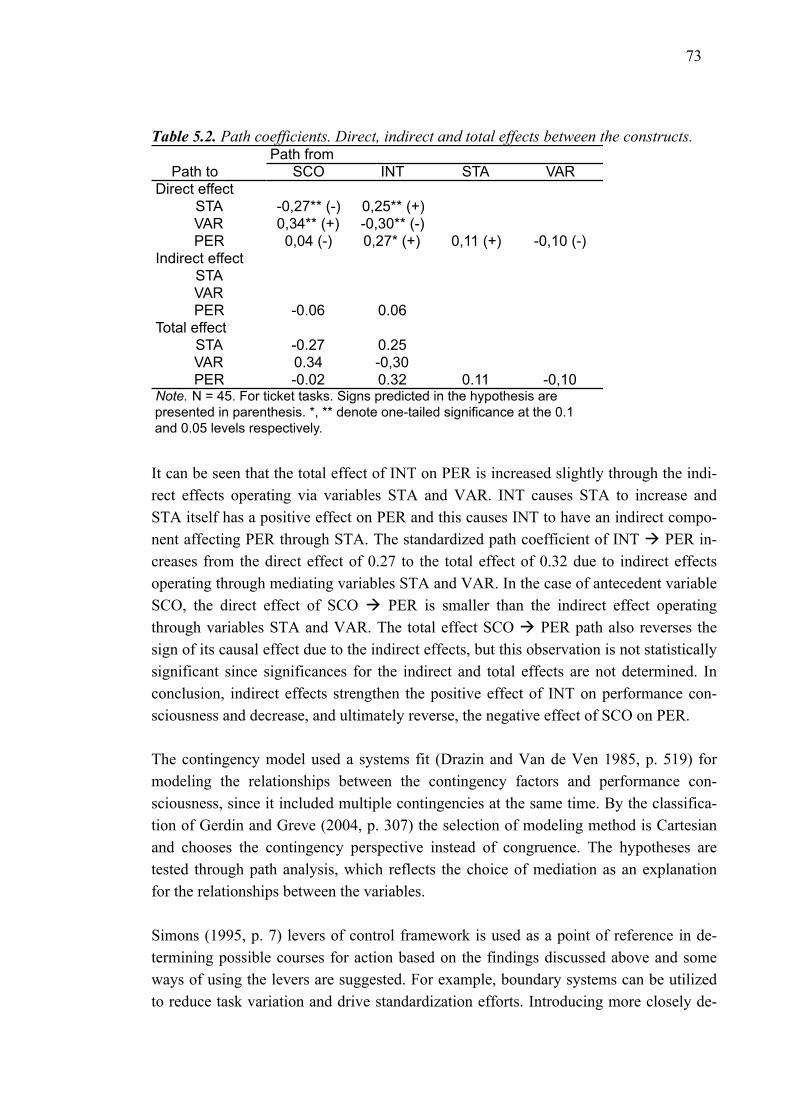
73
Table 5.2. Path coefficients. Direct, indirect and total effects between the constructs.
It can be seen that the total effect of INT on PER is increased slightly through the indi-rect effects operating via variables STA and VAR. INT causes STA to increase and STA itself has a positive effect on PER and this causes INT to have an indirect compo-nent affecting PER through STA. The standardized path coefficient of INT ! PER in-creases from the direct effect of 0.27 to the total effect of 0.32 due to indirect effects operating through mediating variables STA and VAR. In the case of antecedent variable SCO, the direct effect of SCO ! PER is smaller than the indirect effect operating through variables STA and VAR. The total effect SCO ! PER path also reverses the sign of its causal effect due to the indirect effects, but this observation is not statistically significant since significances for the indirect and total effects are not determined. In conclusion, indirect effects strengthen the positive effect of INT on performance con-sciousness and decrease, and ultimately reverse, the negative effect of SCO on PER.
The contingency model used a systems fit (Drazin and Van de Ven 1985, p. 519) for modeling the relationships between the contingency factors and performance con-sciousness, since it included multiple contingencies at the same time. By the classifica-tion of Gerdin and Greve (2004, p. 307) the selection of modeling method is Cartesian and chooses the contingency perspective instead of congruence. The hypotheses are tested through path analysis, which reflects the choice of mediation as an explanation for the relationships between the variables.
Simons (1995, p. 7) levers of control framework is used as a point of reference in de-termining possible courses for action based on the findings discussed above and some ways of using the levers are suggested. For example, boundary systems can be utilized to reduce task variation and drive standardization efforts. Introducing more closely de-
Path fromPath to SCO INT STA VAR
Direct effectSTA -0,27** (-) 0,25** (+)VAR 0,34** (+) -0,30** (-)PER 0,04 (-) 0,27* (+) 0,11 (+) -0,10 (-)
Indirect effectSTAVARPER -0.06 0.06
Total effectSTA -0.27 0.25VAR 0.34 -0,30PER -0.02 0.32 0.11 -0,10
Note. N = 45. For ticket tasks. Signs predicted in the hypothesis are presented in parenthesis. *, ** denote one-tailed significance at the 0.1 and 0.05 levels respectively.
74
fined standard operating procedures can be used in driving standardization efforts. As tightly defined processes reduce the flexibility of operations, they also need to be con-stantly developed and extended to cover new scenarios in requests, and this widening allows for specialization which in turn can be used for reducing the perceived variation in incoming task requests.
The nature of the ticketed tasks in service operations is repetitive and processual, mak-ing diagnostic control systems a natural lever of control. At the time of the study enough reliable performance data on the service operations was not yet available, but diagnostic control systems are bound to have a central role in the future in assuring and monitoring the efficiency of operations. Items p4 ands p5 in the survey already indicate the satisfac-tion of functional service managers for the information available to them. Management can also drill into the core issues by concentrating on certain key tasks and transforming diagnostic controls into interactive control systems for these tasks. As the service opera-tions have their new organization, interactive control systems are integral in developing the processes. For example interactive control systems can be used to draw attention to the introduction of new boundary controls.
A beliefs system is present in all organizations, and CERN personnel certainly identify with the values and mission of the organization. Concerning the services at CERN the organizational culture encourages cooperation and finding novel solutions to problems. This is very important especially at the beginning stages of the present organization of services. A beliefs system as a lever of control is taken to be a method of control that aims at encouraging exploration and innovation, but when the provision of services be-comes more established and routine, beliefs system control might be more useful in pro-jects, other non-ticket tasks and problem solving.
MCS as a package typology classifies control into distinct groups and considers how they function in combination to address different aspects of the organization to provide control holistically (Malmi and Brown 2008, p. 287). The MCS package includes Cul-tural, Planning, cybernetic, reward, administrative control groups. The findings of this study do not reveal how the selected contingencies affect performance consciousness through the planning process in the MCS package framework. If some other indicators would have been included, such as budget use, inferences concerning the effects of the planning process could have been included. Short- and long-term plans definitely have a very strong influence in personnel behavior at CERN as they set the limits for resource consumption and targets for achieving operational goals. The implications of this study for the cultural controls group within the MCS package framework were already dis-cussed in the context of the beliefs system control lever.
75
The administrative control group within the MCS package framework, which includes governance, organizational structure and internal policies, offers protocols for manage-ment control. The antecedent variables interdependence and scope are direct manifesta-tions of the organizational structure. Interdependence itself has a positive impact on per-formance consciousness, while the effects of scope of activities did not have statistical significance. Increasing the connections between different functional elements can in-crease performance consciousness and this should be considered as one factor when de-veloping the service activities. The policies and procedures control in the administrative control group is similar to the boundary controls as discussed above and it used for de-fining the service processes thus influencing the degree of standardization. Policies and procedures can this way be used to improve performance consciousness by increasing standardization and decreasing variation.
Rewards and compensation group within the MCS package typology was not directly included in the survey instrument, but it can be said that some elements relevant for in-centives were captured. The performance consciousness construct included items p1 and p3, which inquired about the specification of operational targets, and these are essential when designing incentive schemes. Furthermore cybernetic controls are necessary in providing key performance indicators and benchmarks on which performance bound compensation relies. Bonuses are awarded in relation to various metrics, which are pro-vided typically either through financial or management accounting. Organizations can improve reward schemes through designing incentives and making the progression of achieving these goals more visible. Generally speaking, it is suggested here based on the results that increasing standardization and interdependence while reducing task varia-tion produces better premises for meaningful rewarding systems and for better cybernet-ic control systems.
The roles of MA framework (Burchell et al. 1980, p. 13) can be used for introducing possible purposes for MCS in the light of the findings from the survey. First, it is very likely that MA information can be used as an ammunition machine for deciding respon-sibilities between functional units, because they are interconnected through cooperation requirements. Second, MA can also be used for learning more about the inputs and out-puts of the service process and can thus be a powerful motivator for improvements. As Laine, Paranko and Suomala (2012, p. 219) suggest, the roles of MA change as the ser-vitization process advances. With less established service processes the MA may best function as a learning machine, but as the service system improves MA can increasingly assume the role of an answer machine.
76
6. CONCLUSIONS
The most important findings and contributions that surfaced in this study are summa-rized in this chapter. This study investigated how contingency factors affect perceived performance consciousness of functional service managers at CERN. The study was de-signed based on management control literature and the empirical part of the study was carried out using a quantitative survey instrument. The empirical findings in this study were very much in line with interactions suggested by previous literature. The findings strengthen the theoretical knowledge base of management control systems literature and contingency research, while also offering practical insights into the service operations that were studied. Avenues for future research, which address the limitations and re-quirements for further insights, are proposed. Withstanding limitations, it can be said that this study successfully answers the research question.
The main contributions of this study are the observed relationships between the selected contingency factors and performance consciousness. The way these variables affect each other sheds light into how performance consciousness is constructed in the context of the organization of activities at CERN. The inferences with significance are as fol-lows: a.) High interdependence between functional units decreases the variation of in-coming work requests, leads to increased standardization of work tasks and improves performance consciousness. b.) High scope of activities is associated with an increase in variation of work requests and with a decrease in standardization.
This study answers the calls of Otley (1994, pp. 298-299), who proposes further testing of contingency factors in new situations. Further testing is desired because some find-ings on contingency factors have been inconclusive and the way organizations behave can change rapidly due to advances in technologies and work practices. By testing how previously known contingency factors behave in the unorthodox settings at CERN, pre-vious claims concerning the behavior of the contingency factors can be further extend-ed. Cross-study comparison of the contingency factors was incorporated in this study through the development of the research design, where theory from existing publica-tions was used for developing the hypotheses concerning the behavior of context and performance consciousness. The findings in this study are largely consistent with the hypotheses derived from the works of other researchers. This congruence increases the validity and reliability of the knowledge concerning the contingency variables featured here and enforces the argument for further generalizability of these variables.
77
This study also adds to the fields of contingency theory and Management control sys-tems studies by introducing two slightly modified contingency factors, performance consciousness and scope. Scope of activities was measured as the count of different tasks the teams were formally supposed to provide and this factor thereby measured how wide the responsibilities of the work units are. Even though scope is measured in a different way, it is similar to previous contingency factors, such as size and interde-pendence, and it includes elements from other concepts, like complexity and technolo-gy. Performance consciousness is a new approach to analyzing performance and it was adopted because of the lack of a better and more feasible measure. Performance con-sciousness reflects the epistemological property of the survey that the answers were the respondents’ perceptions. These two new contingency factors may be of interest in fu-ture research, as they offer alternative perspectives on traditional contingency factors and might offer easier and more direct ways of measurement.
A novel approach, representing a methodological contribution, is the use of archival da-ta in this study. Archival data revealed the formal design of the organization of service activities, which was subsequently codified to quantitative indicators for the statistical model. This way the archival data was combined with the responses from the survey instrument. The archival data was used for helping to determine the causality of some of the contingency factors and it made a strong argument for causality, since it was formal-ly given and did not involve feedback loops. Combining different sources of data also improves validity and reduces respondent bias. The combination of archival data with measured observations is nearly non-existent in contingency and MCS studies, but, de-spite this, the approach is advocated by Andersson and Widener (2007, p. 336) and Kihn (2010, p. 480). The use of archival data demonstrates how organizational structure can be operationalized from internal documentation to explicitly quantifiable form. In this study the data from documentation was used for determining the antecedent varia-bles, but archival data can also be used for mediating and moderating variables, as well as for performance measures.
This study offers practical application and an additional outcome of this study is that the theoretical knowledge base of MCS, contingency theory and measurement instruments can be used as valid measurement tools for assessing how contingency factors affect performance in individual organizations. This notion bridges the gap between theory and practice by allowing theoretical notions to be implemented in practice in a way that produces actionable information in particular circumstances. The consistency of the findings indicate that contingency theory, MCS studies and measurement instruments, such as the OAI instrument by Van de Ven and Ferry (1980), can be applied to map ex-plicitly the effects of contingency factors in organizations.
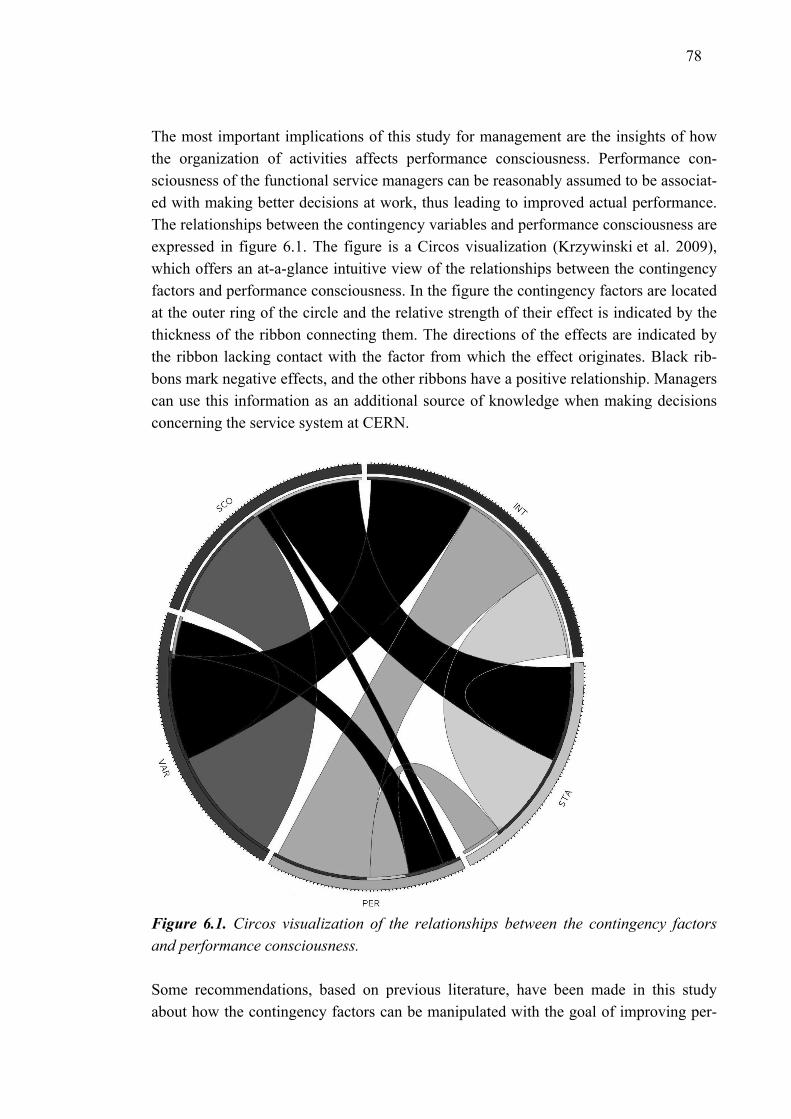
78
The most important implications of this study for management are the insights of how the organization of activities affects performance consciousness. Performance con-sciousness of the functional service managers can be reasonably assumed to be associat-ed with making better decisions at work, thus leading to improved actual performance. The relationships between the contingency variables and performance consciousness are expressed in figure 6.1. The figure is a Circos visualization (Krzywinski et al. 2009), which offers an at-a-glance intuitive view of the relationships between the contingency factors and performance consciousness. In the figure the contingency factors are located at the outer ring of the circle and the relative strength of their effect is indicated by the thickness of the ribbon connecting them. The directions of the effects are indicated by the ribbon lacking contact with the factor from which the effect originates. Black rib-bons mark negative effects, and the other ribbons have a positive relationship. Managers can use this information as an additional source of knowledge when making decisions concerning the service system at CERN.
Figure 6.1. Circos visualization of the relationships between the contingency factors and performance consciousness.
Some recommendations, based on previous literature, have been made in this study about how the contingency factors can be manipulated with the goal of improving per-
79
formance consciousness. The antecedent variables can be further optimized by changing the organization of the activities. Methods for increasing standardization and reducing variation have also been laid out. It is also noted that the antecedents have an additional indirect effect on performance consciousness through the mediating variables. Finally, any such decisions have to be made with the discretion of the management while ac-counting for other impacts on any and all aspects of the organization.
Limitations affecting this study are recognized. First, the grouping of ticket and non-ticket tasks together was not justified because of the conceptual difference between the functions, but this has no effect on the validity of the findings concerning ticket tasks. As a result the data for non-ticket tasks was rejected. Second, this investigation was a single case study and thus the results cannot be generalized without positioning them with findings from other studies. Having a single quantitative case also led to a problem of having a small sampling frame, which resulted in a low response count despite a good response rate. Third, the subject of the study was sensitive due to the transforma-tional phase of the service organization and this could have caused respondent bias. Fourth, Additional studies concerning variation and performance consciousness are nec-essary, as the average variance extracted was slightly low for these factors. Finally, four variables were chosen as contingency factors for the study, while other important un-measured factors potentially correlating with performance consciousness could possibly remain ignored.
Suggestions for future research are made in the light of this study. Most importantly the methodological approach of combining archival data is recommended, as using different sources of data simultaneously improves the validity of findings and gives grounds to claims of causality. Future studies should also concentrate on the role of IT technology in exercising management control, since this aspect is left with relatively little attention. Large-scale studies involving various organizations should be conducted to verify and generalize the findings in this study. It is also recommended here that the effects of con-tingency factors on project tasks should also be studied, as they are fundamentally dif-ferent. The correlation of performance consciousness with actual operational perfor-mance should also be studied, because it is an essential assumption in this and many other studies. Also, the causality of standardization and variation in relation to perfor-mance consciousness should be further bolstered in the future, preferably by controlled experiments. Finally, qualitative studies should prove useful in examining individual tasks and explaining in rich detail the social processes associated with the interplay of contingency factors and performance consciousness.
80
BIBLIOGRAPHY
Abernathy, M.A., Bouwens, J. and Van Lent, L. 2004. Determinants of Control System Design in Divisionalized Firms. The Accounting Review 79, 3, pp. 545-570.
Adler, P.S. 1995. Interdepartmental Interdependence and Coordination: The Case of the Design/Manufacturing Interface. Organization Science 6, 2, pp. 147-167.
Aiken, M. and Hage, J. 1968. Organizational Interdependence and Intra-Organizational Structure. American Sociological Review 33, 6, pp. 912-930.
Anderson, S.W. and Widener, S.K. 2007. Doing Quantitative Field Research in Man-agement Accounting. In: Handbooks of Management Accounting Research 1, Edited by Chapman, C.S., Hopwood, A.G., Shields, M.D. Elsevier Great Brit-ain. pp. 319-341.
Anthony, R.N. 1965. Planning and Control Systems: A Framework for Analysis. Har-vard Business School. 180 p.
Baiman, S. 1990. Agency Research in Managerial Accounting: A Second Look. Ac-counting, Organizations and Society 15, 4, pp. 341-371.
Baron, R.M. and Kenny, D.A. 1986. The Moderator–Mediator Variable Distinction in Social Psychological Research: Conceptual, Strategic, and Statistical Considera-tions. Journal of personality and social psychology 51, 6, pp. 1173-1182.
Baxter, J. And Chua, W.F. 2003. Alternative Management Accounting Research—Whence And Whither. Accounting, Organizations and Society 28, 2, pp. 97-126.
Berry, A.J., Coad, A.F., Harris, E.P., Otley, D.T. and Stringer, C. 2009. Emerging Themes in Management Control: A Review Of Recent Literature. The British Accounting Review, 41, 1, pp. 2-20.
Bhimani, A. (editor). 2006. Contemporary Issues in Management Accounting. Oxford University Press. Oxford, UK. 464 p.
Bisbe, J. and Otley, D. 2004. The Effects of the Interactive Use of Management Control Systems on Product Innovation. Accounting, Organizations and Society, 29, 8, pp. 709-737.
Bisbe, J., Batista-Foguet, J-M. and Chenhall R. 2007. Defining Management Account-ing Constructs: A Methodological Note on the Risks of Conceptual Misspecifi-cation. Accounting, Organizations and Society 32, pp. 789-820.
Bommer, W., Johnson, J., Rich, G., Podsakoff, P. And Mackenzie, S. 1995. On the In-terchangeability of Objective and Subjective Measures of Employee Perfor-mance: A Meta-Analysis. Personnel Psychology 48. pp. 587–605.
Bonner, S.E. and Sprinkle, G.B. 2002. The Effects of Monetary Incentives on Effort and Task Performance: Theories, Evidence, and a Framework for Research. Ac-counting, Organizations and Society 27, 4, pp. 303-345.
Bouwens, J. and Abernathy, M. A. 2000. The Consequences of Customization on Man-agement Accounting System Design. Accounting, Organizations and Society 25, 3. pp. 221-241.
Bouwens, J., and Van Lent, L. 2007. Assessing the performance of business unit man-agers. Journal of Accounting Research 45, 4, pp. 667-697.
81
Brownell, P. 1981. Participation in Budgeting, Locus of Control and Organizational Ef-fectiveness. Accounting Review 56, 4, pp. 844-860.
Burchell, S., Clubb, C., Hopwood, A., Hughes, J. and Nahapiet, J. 1980. The Roles of Accounting in Organizations and Society. Accounting, Organizations and Socie-ty 5, 1, pp. 5-27.
Burns, T. and Stalker, G. 1961. The Management of Innovation. London, UK: Tavistock. 312 p.
Burr, V. 2003. Social Constructionism. 2nd edition. New York. Routledge. 240 p. Chandler, A. 1962. Strategy and structure. Cambridge: MIT Press. 463 p. Chang, R.D., Chang, Y.W. and Paper, D. 2003. The Effect of Task Uncertainty, Decen-
tralization and AIS Characteristics on the Performance of AIS: An Empirical Case in Taiwan. Information & Management, 40, 7, pp. 691-703.
Chapman, C.S. 1997. Reflections on a Contingent View of Accounting. Accounting Organizations and Society 22, 2, pp.189-205.
Chenhall, R. H. 2007. Theorizing Contingencies in Management Control Systems Re-search. In: Handbooks of Management Accounting Research 1. Edited by Chapman, C.S., Hopwood, A.G., Shields, M.D. Elsevier Great Britain. pp. 163-205.
Chenhall, R.H. 2006. The Contingent Design of Performance Measures. In: Bhimani A. (Editor). 2006. Contemporary Issues in Management Accounting. Oxford Uni-versity Press. pp .92-116.
Chenhall, R.H. and Langfield-Smith, K. 1998. The Relationship Between Strategic Pri-orities, Management Techniques and Management Accounting: An Empirical Investigation Using a Systems Approach. Accounting, Organizations and Socie-ty 23, 3, pp. 243–264.
Chenhall, R.H. and Morris, D. 1986. The Impact of Structure, Environment and Inter-dependencies on the Perceived Usefulness of Management Accounting Systems. Accounting Review 61, pp. 16–35.
Cohen, M. D., March, J. G. and Olsen, J. P. 1972. A Garbage Can Model of Organiza-tional Choice. Administrative Science Quarterly 17, 1, pp. 1-25.
Curran, P.J., West, S.G. and Finch, J.F. 1996. The Robustness of Test Statistics to Nonnormality and Specification Error in Confirmatory Factor Analysis. Psycho-logical Methods 1, 1, pp. 16-29.
Davila, A. and Foster, G. 2007. Management Control Systems in Early-stage Startup Companies. The Accounting Review 82, 4, pp. 907-937.
Dent, J.F. 1990. Strategy, Organization and Control - Some Possibilities for Accounting Research. Accounting Organizations and Society 15, 1-2, PP. 3-25.
Donaldson, L. 1999. The Normal Science of Structural Contingency Theory. In: Clegg, S.R., Hardy, C. 1999. Studying Organization: Theory and Method, SAGE Pub-lications Limited, pp. 51-70.
Drazin, R. and Van de Ven, A.H. 1985. Alternative Forms of Fit in Contingency Theo-ry. Administrative Science Quarterly 30, 4, pp. 514-539.
Edvardsson, B., Gustafsson, A. and Roos, I. 2005. Service Portraits in Service Re-search: A Critical Review. International Journal of Service Industry Manage-ment 16, 1, pp. 107-121.
Ekholm, B.G. and Wallin, J. 2011. The Impact of Uncertainty and Strategy on the Per-ceived Usefulness of Fixed and Flexible Budgets. Journal of Business Finance & Accounting 38 ,1-2, pp. 145-164.
82
Feldman, M.S. and March, J.G. 1981. Information in Organizations as Signal and Sym-bol. Administrative Science Quarterly 26, 2, pp. 171-186.
Fisher, J. 1995. Contingency-Based Research on Management Control Systems: Cate-gorization by Level of Complexity. Journal of Accounting Literature 14, pp. 24-53.
Flamholtz, E.G. 1983. Accounting, Budgeting and Control Systems in Their Organiza-tional Context: Theoretical and Empirical Perspectives, Accounting, Organiza-tions and Society 8, 2–3, pp. 153-169.
Flamholtz, E.G., Das, T.K. and Tsui, A.S. 1985. Toward an Integrative Framework of Organizational Control. Accounting, Organizations and Society 10, 1, pp. 35-50.
Galbraith, J. 1973. Designing complex organizations. USA. Addison Wesley Publishing Company, 224 p.
Gerdin, J. 2005a. The Impact of Departmental Interdependencies and Management Ac-counting System Use on Subunit Performance. European Accounting Review 14, 2, pp. 297–327.
Gerdin, J. 2005b. Management Accounting System Design in Manufacturing Depart-ments: An Empirical Investigation Using a Multiple Contingencies Approach. Accounting, Organizations and Society 30, pp. 99–126.
Gerdin, J. and Greve, J. 2004. Forms of Contingency Fit in Management Accounting Research — A Critical Review. Accounting, Organizations and Society 29, 3, pp. 303-326.
Gordon, L.A. and Miller, D. 1976. A Contingency Framework for the Design of Ac-counting Information Systems. Accounting, Organizations and Society 1, 1, pp. 59-69.
Govindarajan, V. and A.K. Gupta. 1985. Linking Control-Systems to Business Unit Strategy - Impact on Performance. Accounting Organizations and Society 10 ,1, pp. 51-66.
Granlund, M. 2011. Extending AIS Research to Management Accounting and Control Issues: A Research Note. International Journal of Accounting Information Sys-tems 12, 1, pp. 3-19.
Green, S.G. and Welsh, M.A. 1988. Cybernetics and Dependence: Reframing the Con-trol Concept. Academy of Management Review 13, 2, pp. 287-301.
Gresov, C. 1989. Exploring Fit and Misfit with Multiple Contingencies. Administrative Science Quarterly 34, 3, pp. 431-453.
Grönroos, C. and Ojasalo, K. 2004. Service Productivity: Towards a Conceptualization of the Transformation of Inputs into Economic Results in Services. Journal of Business Research 57, 4, pp. 414-423.
Hambrick D.C. 1980. Operationalizing the Concept of Business-Level Strategy in Re-search. Academy of Management Review 5, 4, pp. 567-575.
Hambrick, D.C. and Lei, D. 1985. Toward an Empirical Prioritization of Contingency Variables for Business Strategy. Academy of Management Journal 28, 4, pp. 763-788.
Hansen, S.C. and Van der Stede W.A. 2004. Multiple Facets of Budgeting: An Explora-tory Analysis. Management Accounting Research 15, 4, pp. 415-439.
Hirst, M.K. 1983. Reliance on Accounting Performance Measures, Task Uncertainty, and Dysfunctional Behavior: Some Extensions. Journal of Accounting Re-search 21, 2, pp. 596-605.
83
Hofstede, G.H. 1984. The Cultural Relativity of the Quality of Life Concept. Academy of Management Review 27, pp. 389–398.
Hooper, D., Coughlan, J. and Mullen, M.R. 2008. Structural Equation Modelling: Guidelines for Determining Model Fit. The Electronic Journal of Business Re-search Methods 6, 1, pp. 53 - 60.
Hopwood, A. 1972. An Empirical Study of the Role of Accounting Data in Perfor-mance Evaluation. Journal of Accounting Research 10, 3, pp. 156–182.
Hoque, Z. 2011. The Relations Among Competition, Delegation, Management Ac-counting Systems Change and Performance: A Path Model. Advances in Ac-counting 27, 2, pp. 266-277.
Jääskeläinen, A., Laihonen, H., Lönnqvist, A., Palvalin, M., Sillanpää, V., Pekkola, S. and Ukko, J. 2012. A Contingency Approach to Performance Measurement in Service Operations. Measuring Business Excellence 16, 1, pp. 43-52.
Jönsson, S. and Lukka, K. 2007. There and Back Again: Doing Interventionist Research in Management Accounting. In: Handbooks of Management Accounting Re-search 1, Edited by Chapman, C.S., Hopwood, A.G., Shields, M.D. Elsevier Great Britain. pp. 373-397.
Kennedy, F.A. and Widener, S.K. 2008. A Control Framework: Insights from Evidence on Lean Accounting. Management Accounting Research 19, 4, pp. 301-323.
Khandwalla, P.N. 1977. The design of organizations. New York, Harcourt Brace Jo-vanovich. 730 p.
Kihn, L.A. 2010. Performance Outcomes in Empirical Management Accounting Re-search: Recent Developments and Implications for Future Research. Interna-tional Journal of Productivity and Performance Management 59, 5, pp. 468-492.
Kline, R.B. 2010. Principles and Practice of Structural Equation Modeling. 3rd Edition. New York. The Guilford Press. 427 p.
Krzywinski, M., Schein, J., Birol, I., Connors, J., Gascoyne, R., Horsman, D., Jones, S. and Marra, M. 2009. Circos: An Information Aesthetic for Comparative Ge-nomics. Genome Research 19. pp.1639-1645.
Kunz, A.H. and Pfaff, D. 2002. Agency theory, Performance Evaluation, and the Hypo-thetical Construct of Intrinsic Motivation. Accounting, Organizations, and Soci-ety 27, pp. 275–295.
Laine, T., Paranko, J. and Suomala, P. 2012. Management Accounting roles in Support-ing Servitisation: Implications for Decision making at Multiple Levels. Manag-ing Service Quality 22, 3, pp. 212-232.
Lawrence, P. and Lorsch, J. 1967. Organization and Environment. Homewood, IL. Ir-win. 279 p.
Lindsay, R.M. 1995. Reconsider the Status of Tests of Significance: An Alternative Criterion of Adequacy. Accounting, Organizations and Society 20, 1, pp. 35–53.
Lovelock, C. and Gummesson, E. 2004. Whither Services Marketing? In Search of a New Paradigm and Fresh Perspectives. Journal of Service Research 7, 1, pp. 20-41.
Macintosh, N. and Daft, R.L. 1987. Management Control Systems and Departmental Interdependencies: An Empirical Study. Accounting, Organizations and Society 12, 1, pp. 49-61.
Malmi, T. and Brown, D.A. 2008. Management Control Systems as a Package — Op-portunities, Challenges and Research Directions. Management Accounting Re-search 19, 4, pp. 287-300.
84
Malmi, T. and Granlund, M. 2009. In Search of Management Accounting Theo-ry. European Accounting Review 18, 3, pp. 597-620.
Merchant, K.A. 1981. The Design of the Corporate Budgeting System: Influences on Managerial Behavior and Performance. The Accounting Review 4, pp. 813–829.
Merchant, K.A. and Van der Stede, W.A. 2007. Management Control Systems: Perfor-mance Measurement, Evaluation and Incentives. Essex. Prentice Hall. 855 p.
Meyer, A.D., Tsui, A.S. and Hinings, C.R. 1993. Configurational Approaches to Ogan-izational Analysis. Academy of Management Journal 36, 6, pp. 1175-1195.
Miles, R.E., and C. C.Snow. 1978. Organizational Strategy, Structure and Process. New York: McGraw-Hill. 274 p.
Miller, D. and Friesen, P. H. 1982. Innovation in Conservative and Entrepreneurial Firms: Two Models of Strategic Momentum. Strategic Management Journal 3, 1, pp. 1–25.
Miller, K.D. and Tsang, E.W.K. 2010. Testing Management Theories: Critical Realist Philosophy and Research Methods. Strategic Management Journal 32, pp. 139–158.
Modell, S. 1996. Management Accounting and Control in Services: Structural and Be-havioural Perspectives. International Journal of Service Industry Management 7, 2, pp. 57-80.
Moores, K. and Chenhall, R. 1991. Organizational Contexts and Management Account-ing Systems: An Evaluation of Contingency Frameworks. School of Business Discussion Papers. Paper 22, 55 p. URL: [http://epublications.bond.edu.au/discussion_papers/22] Viewed 14.02.2013
O'grady, W., Rouse, P. and Gunn, C. 2010. Synthesizing Management Control Frame-works. Measuring Business Excellence 14, 1, pp. 96-108.
Office of Government Commerce. 2007. ITIL Service Strategy. TSO. London. 264 p. Otley, D.T. 1980. The Contingency Theory of Management Accounting: Achievement
and Prognosis. Accounting, Organizations and Society 5, 4, pp. 413-428. Otley, D.T. 1994. Management Control in Contemporary Organizations: Towards a
Wider Framework. Management Accounting Research 5, 3, pp. 289-299. Otley, D.T. 1999. Performance Management: A Framework for Management Control
Systems Research. Management Accounting Research 10, 4, pp. 363-382. Otley, D.T. And Pollanen, R. 2000. Budgetary Criteria in Performance Evaluation: A
Critical Appraisal using New Evidence. Accounting, Organizations and Society 25, 4/5, pp. 483–96.
Ouchi, W.G. 1979. A Conceptual Framework for the Design of Organizational Control Mechanisms. Management Science 25, 9, pp. 833-848.
Pavlov, A. and Bourne, M. 2011. Explaining the Effects of Performance Measurement on Performance: An Organizational Routines Perspective. International Journal of Operations & Production Management 31, 1, pp. 101-122.
Perera, S., Harrison, G. and Poole, M. 1997. Customer-focused Manufacturing Strategy and the Use of Operations-based Non-financial Performance Measures: A Re-search Note. Accounting, Organizations and Society 22, 6, pp. 557-572.
Perrow, C. 1970. Organizational analysis: a sociological view. Belmont, CA, Wadsworth Publishing Company. 208 p.
Porter, M. 1980. Competitive Strategy: Techniques for Analysing Industries and Com-petitors. New York: The Free Press. 397 p.

85
Reid, G.C. and Smith, J.S. 2000. The Impact of Contingencies on Management Ac-counting System Development. Management Accounting Research 11, pp. 427–450.
Salomann, H., Dous, M., Kolbe, L. and Brenner, W. 2007. Self-service Revisited: How to Balance High-tech and High-touch in Customer Relationships. European Management Journal 25, 4, pp. 310-319.
Saunders, M., Lewis, P. and Thornhill, A. 2009. Research Methods for Business Stu-dents. Fifth Edition. Pearson Education. Essex. 614 p.
Schein, E. 1997. Organizational Culture and Leadership. 2nd Edition. Jossey-Bass, San Francisco. 448 p.
Selto, F.H., Renner C.J. and Young M.S. 1995. Assessing The Organizational Fit of a Just-In-Time Manufacturing System: Testing Selection, Interaction and Systems Models of Contingency Theory. Accounting, Organizations and Society 20, 7–8, pp. 665-684.
Sherwood, M.K. 1994. Difficulties in the Measurement of Service Outputs. Monthly Labor Review 117, 3, pp. 11-19.
Shields, J.F. and Shields, M.D. 1998. Antecedents of Participative Budgeting. Account-ing, Organizations and Society 23, 1, pp. 49-76.
Shook, C.L., Ketchen, D.J., Hult, G.T.M. and Kacmar, K.M. 2004. An Assessment of the Use of Structural Equation Modeling in Strategic Management Research. Strategic Management Journal. 25, pp. 397–404.
Simons, R. 1994. How New Top Managers Use Control Systems as Levers of Strategic Renewal. Strategic Management Journal 15, 3, pp. 169-189.
Simons, R. 1995. Levers of Control: How Managers Use Innovative Control Systems to Drive Strategic Renewal. USA. Harvard Business Press. 232 p.
Soobaroyen, T. and Poorundersing, B. 2008. The Effectiveness of Management Ac-counting Systems: Evidence From Functional Managers in a Developing Coun-try. Managerial Auditing Journal 23, 2, pp. 187-219.
Speckbacher, G. 2003. The Economics of Performance Management in Nonprofit Or-ganizations. Nonprofit Management and Leadership 13, 3, pp. 267-281.
Storey, C. and Hull, F.M. 2010. Service Development Success: A Contingent Approach by Knowledge Strategy. Journal of Service Management, 21, 2, pp. 140-161.
Suomala, P. and Lyly-Yrjänäinen, J. 2010. Interventionist Management Accounting Re-search: Lessons Learned. CIMA, Research Executive Summaries Series 6, 1, 9 p.
Tessier, S. and Otley, D. 2012. A Conceptual Development of Simons’ Levers of Con-trol framework. Management Accounting Research 23, 3, pp.171-185.
Thompson, J.D. 1967. Organizations in Action. New York, McGraw Hill. 192 p. Van de Ven, A. and Ferry, D. 1980. Measuring and Assessing Organizations. New
York, Wiley, 552 p. Van der Stede, W.A., Young, M.S., and Chen, X.C. 2007. Doing management account-
ing survey research. In: Handbooks of Management Accounting Research 1. Ed-ited by Chapman, C.S., Hopwood, A.G., Shields, M.D. Elsevier Great Britain. pp. 445-478.
Vickery, S., Dröge, C. and Germain, R. 1999. The Relationship Between Product Cus-tomization and Organizational Structure. Journal of Operations Management 17, 4, pp. 377-391.

86
Waterhouse, J. H. and Tiessen, P. 1978. A Contingency Framework for Management Accounting Systems Research. Accounting, Organizations and Society 3, 1, pp. 65-76.
Whitley, R. 1999. Firms, Institutions and Management Control: The Comparative Analysis of Coordination and Control Systems. Accounting, Organizations and Society 24, 5, pp. 507-524.
Widener, S.K. 2004. An Empirical Investigation of the Relation Between the use of Strategic Human Capital and the Design of the Management Control Sys-tem. Accounting, Organizations and Society 29, 3, pp. 377-399.
Widener, S.K. 2007. An Empirical Analysis of the Levers of Control Framework. Ac-counting, Organizations and Society, 32, 7, pp. 757-788.
Woodward, J. 1965. Industrial Organization: Theory and Practice. London, Oxford University Press. 281 p.
APPENDICES (10 PIECES)
APPENDIX 1: THE SURVEY
APPENDIX 2: INVITATION TO THE SURVEY
APPENDIX 3: PEARSON CORRELATIONS FOR NON-TICKET TASKS
APPENDIX 4: SURVEY RESPONSES FOR TICKET TASKS
APPENDIX 5: SURVEY RESPONSES FOR NON-TICKET TASKS
APPENDIX 6: SOME RESPONSES TO THE OPEN ENDED QUESTION
APPENDIX 7: SPSS SYNTAXES FOR TICKET TASKS
APPENDIX 8: DESCRIPTIVE STATISTICS FOR NON-TICKET TASKS
APPENDIX 9: PEARSON CORRELATIONS FOR TICKET TASKS
APPENDIX 10: AMOS SYNTAX FOR SEM (TICKET TASKS)
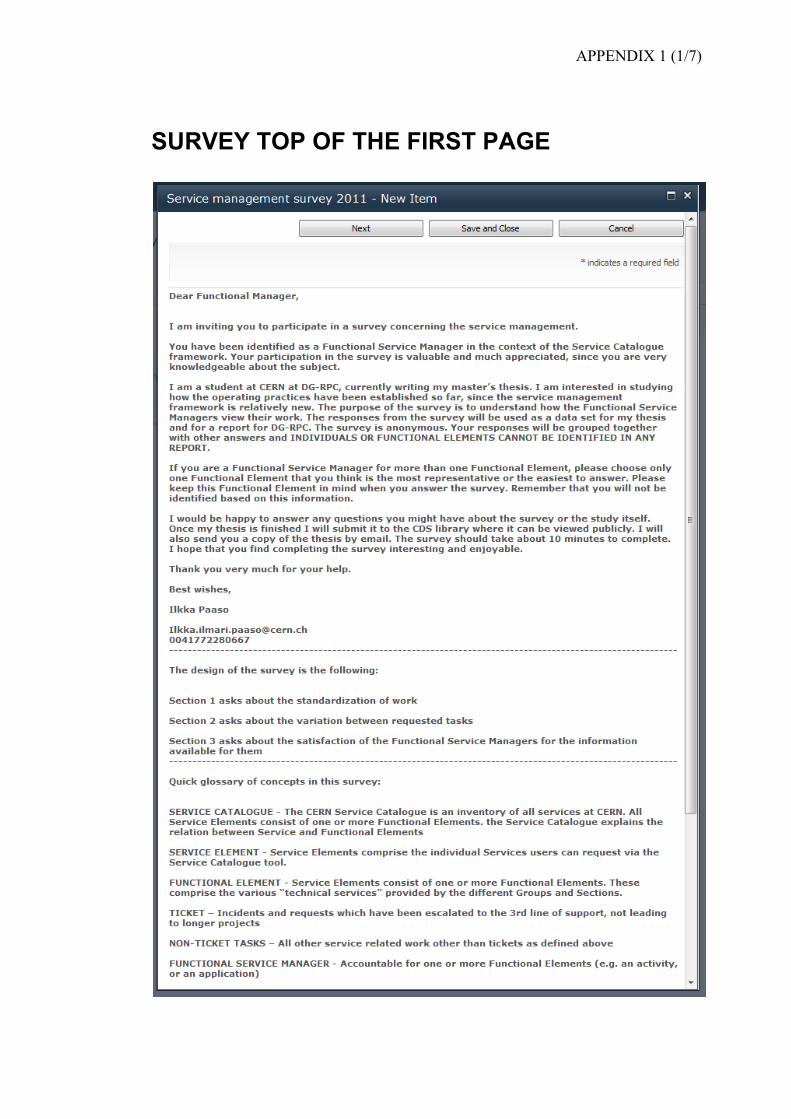
APPENDIX 1 (1/7)
SURVEY TOP OF THE FIRST PAGE
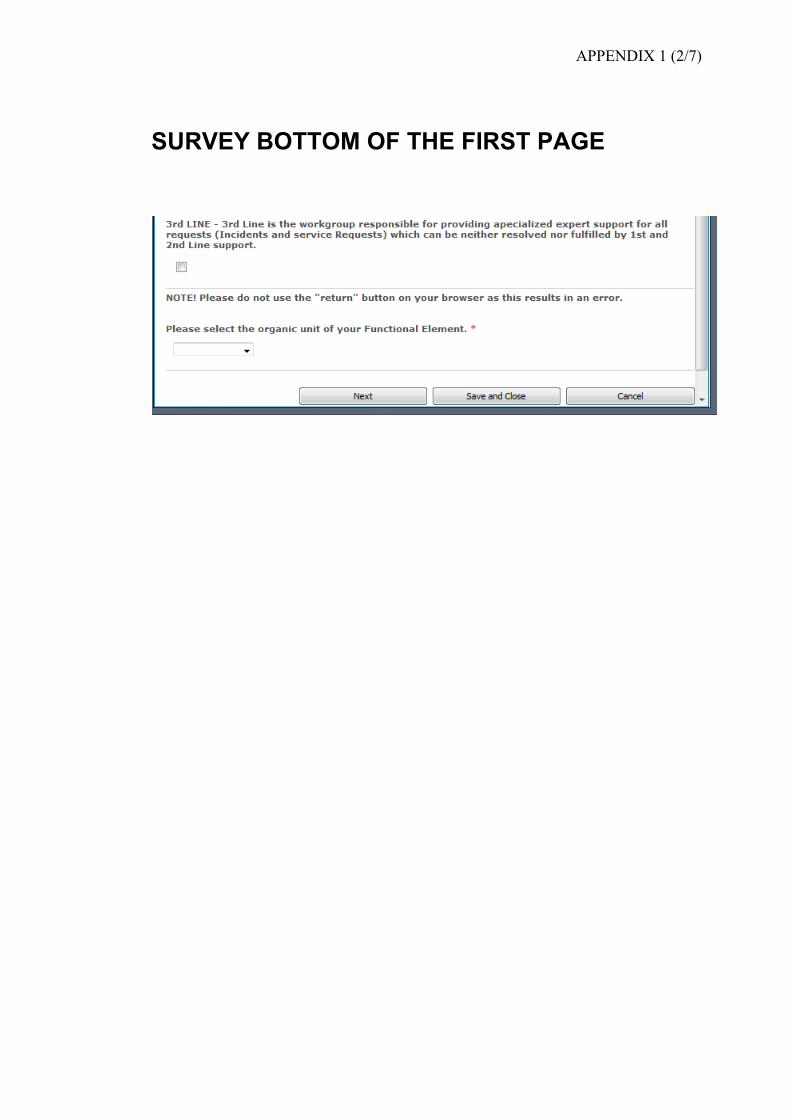
APPENDIX 1 (2/7)
SURVEY BOTTOM OF THE FIRST PAGE

APPENDIX 1 (3/7)
SURVEY SECOND PAGE
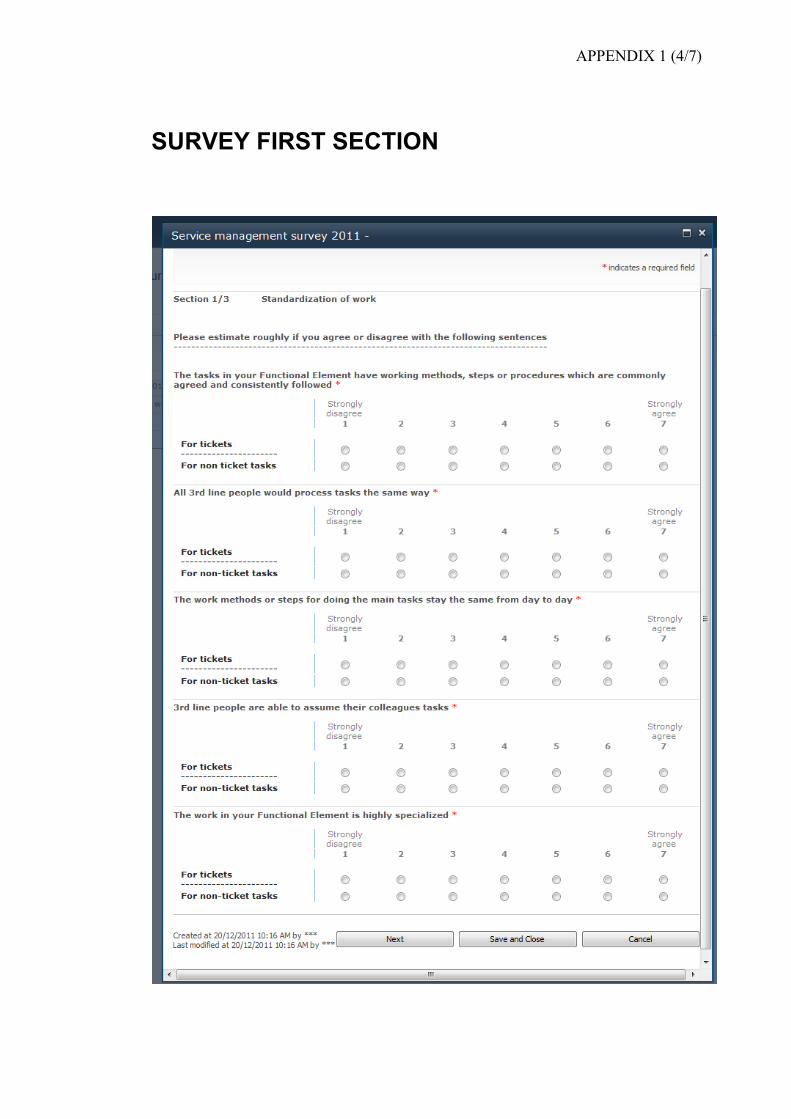
APPENDIX 1 (4/7)
SURVEY FIRST SECTION
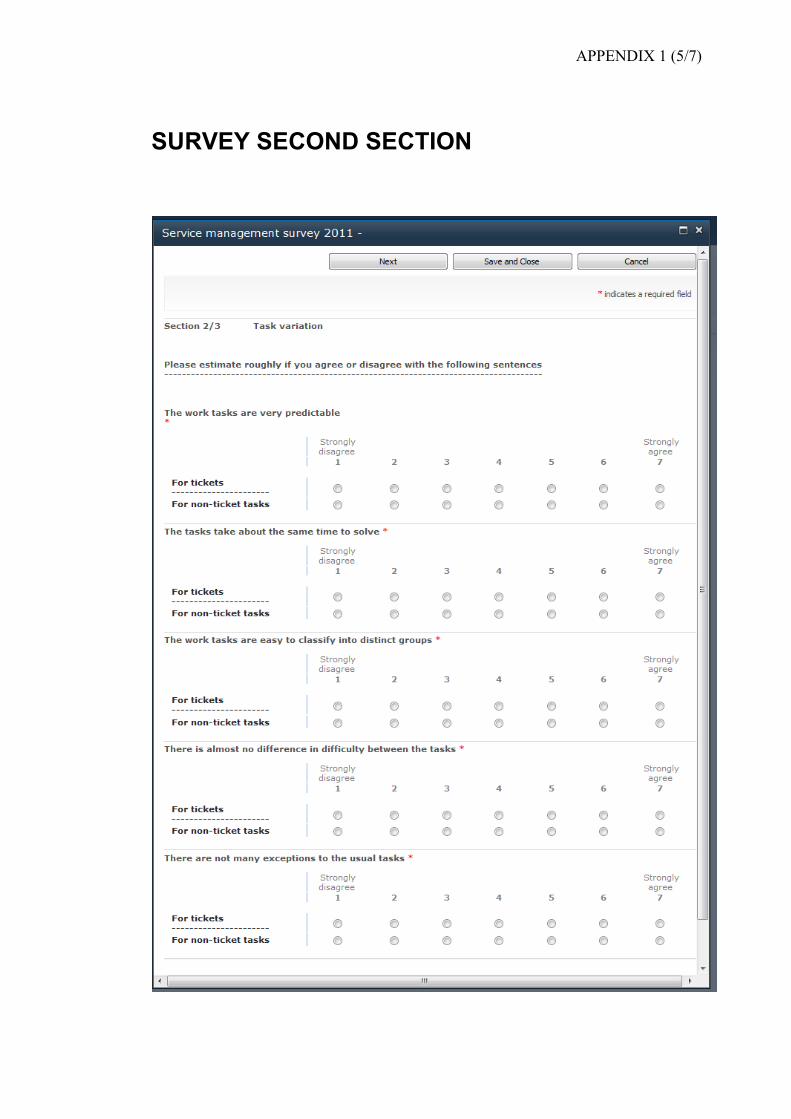
APPENDIX 1 (5/7)
SURVEY SECOND SECTION
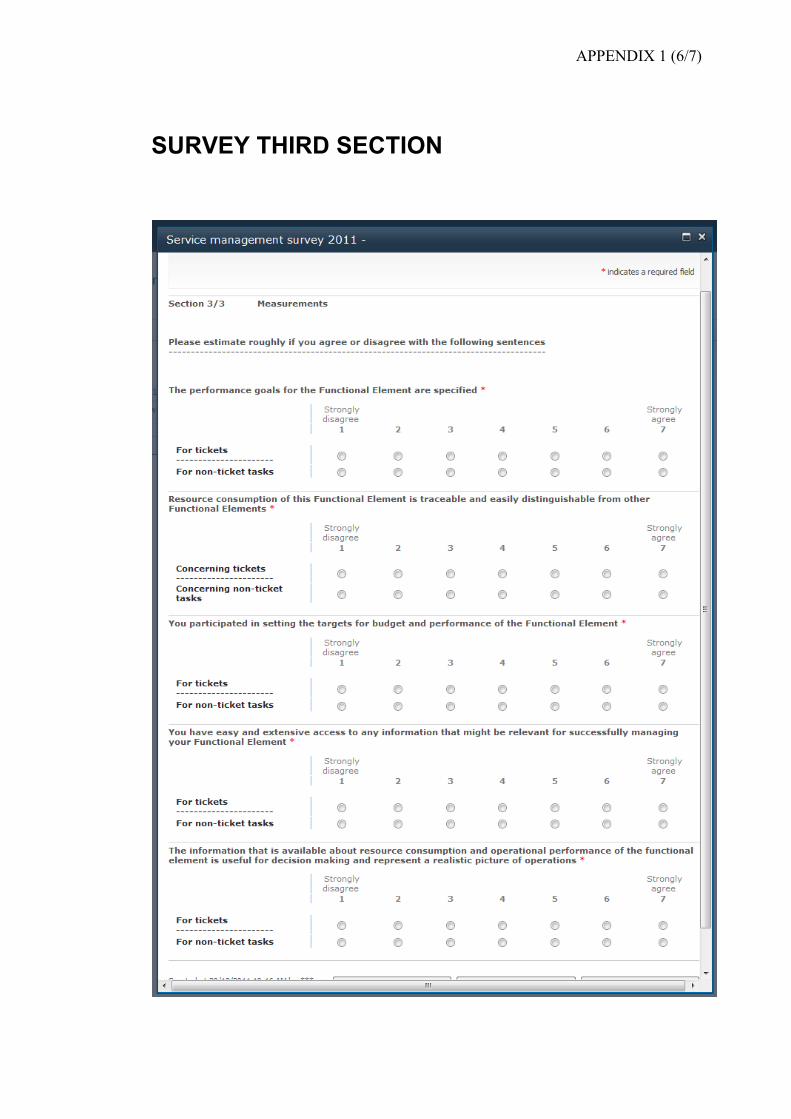
APPENDIX 1 (6/7)
SURVEY THIRD SECTION

APPENDIX 1 (7/7)
SURVEY FINAL PAGE
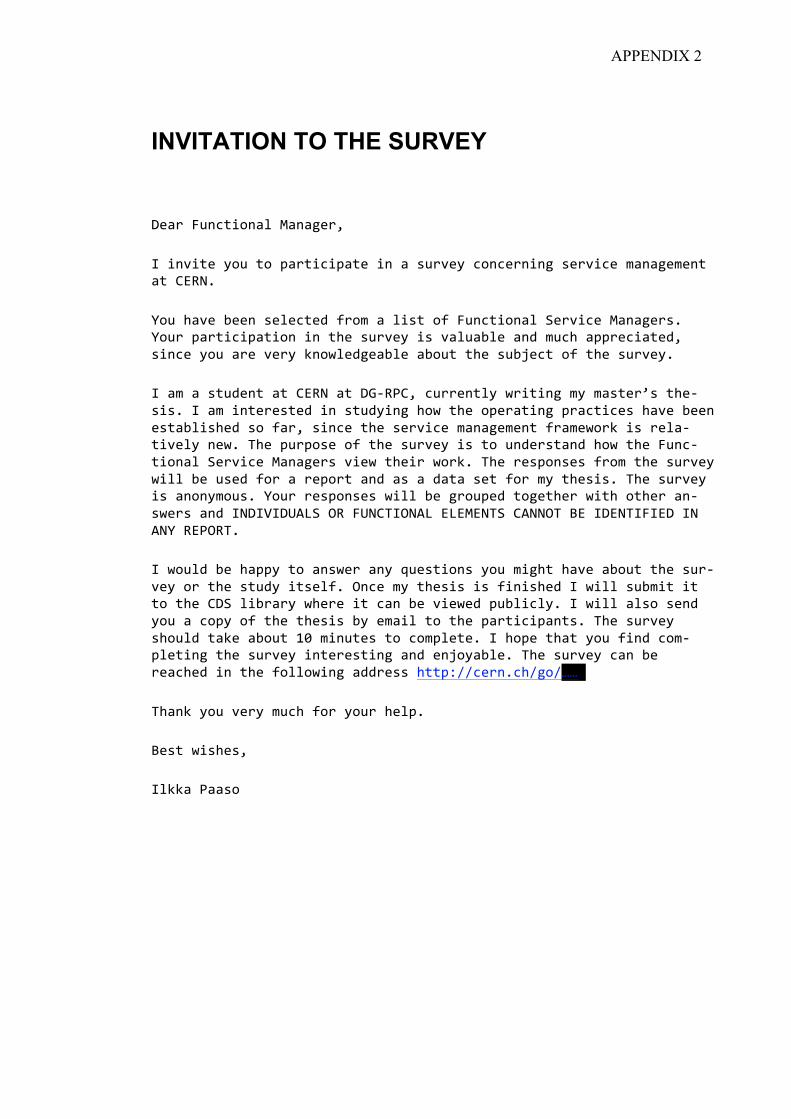
APPENDIX 2
INVITATION TO THE SURVEY
!"#$%&'()*+,(#-%.#(#/"$0%
1%+(2+*"%3,'%*,%4#$*+)+4#*"%+(%#%5'$2"3%),()"$(+(/%5"$2+)"%6#(#/"6"(*%#*%789:;%
<,'%=#2"%>""(%5"-")*"?%@$,6%#%-+5*%,@%&'()*+,(#-%A"$2+)"%.#(#/"$5;%<,'$%4#$*+)+4#*+,(%+(%*="%5'$2"3%+5%2#-'#>-"%#(?%6')=%#44$")+#*"?0%5+()"%3,'%#$"%2"$3%B(,C-"?/"#>-"%#>,'*%*="%5'>D")*%,@%*="%5'$2"3;%
1%#6%#%5*'?"(*%#*%789:%#*%!EF9G70%)'$$"(*-3%C$+*+(/%63%6#5*"$H5%*="F5+5;%1%#6%+(*"$"5*"?%+(%5*'?3+(/%=,C%*="%,4"$#*+(/%4$#)*+)"5%=#2"%>""(%"5*#>-+5="?%5,%@#$0%5+()"%*="%5"$2+)"%6#(#/"6"(*%@$#6"C,$B%+5%$"-#F*+2"-3%("C;%I="%4'$4,5"%,@%*="%5'$2"3%+5%*,%'(?"$5*#(?%=,C%*="%&'()F*+,(#-%A"$2+)"%.#(#/"$5%2+"C%*="+$%C,$B;%I="%$"54,(5"5%@$,6%*="%5'$2"3%C+--%>"%'5"?%@,$%#%$"4,$*%#(?%#5%#%?#*#%5"*%@,$%63%*="5+5;%I="%5'$2"3%+5%#(,(36,'5;%<,'$%$"54,(5"5%C+--%>"%/$,'4"?%*,/"*="$%C+*=%,*="$%#(F5C"$5%#(?%1:!1J1!KLMA%N9%&K:7I1N:LM%8M8.8:IA%7L::NI%O8%1!8:I1&18!%1:%L:<%98GN9I;%
1%C,'-?%>"%=#443%*,%#(5C"$%#(3%P'"5*+,(5%3,'%6+/=*%=#2"%#>,'*%*="%5'$F2"3%,$%*="%5*'?3%+*5"-@;%N()"%63%*="5+5%+5%@+(+5="?%1%C+--%5'>6+*%+*%*,%*="%7!A%-+>$#$3%C="$"%+*%)#(%>"%2+"C"?%4'>-+)-3;%1%C+--%#-5,%5"(?%3,'%#%),43%,@%*="%*="5+5%>3%"6#+-%*,%*="%4#$*+)+4#(*5;%I="%5'$2"3%5=,'-?%*#B"%#>,'*%QR%6+('*"5%*,%),64-"*";%1%=,4"%*=#*%3,'%@+(?%),6F4-"*+(/%*="%5'$2"3%+(*"$"5*+(/%#(?%"(D,3#>-";%I="%5'$2"3%)#(%>"%$"#)="?%+(%*="%@,--,C+(/%#??$"55%=**4STT)"$(;)=T/,TUUU%
I=#(B%3,'%2"$3%6')=%@,$%3,'$%="-4;%
O"5*%C+5="50%
1-BB#%G##5,%
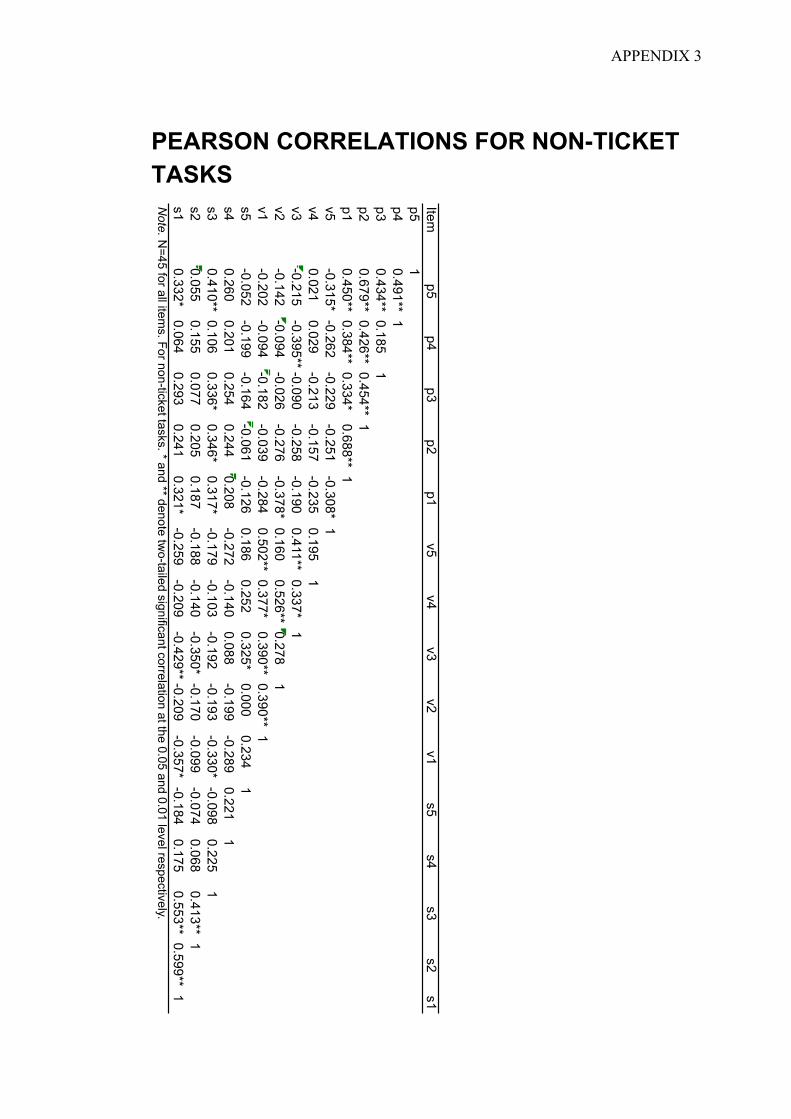
APPENDIX 3
PEARSON CORRELATIONS FOR NON-TICKET TASKS
Itemp5
p4p3
p2p1
v5v4
v3v2
v1s5
s4s3
s2s1
p51
p40.491**
1p3
0.434**0.185
1p2
0.679**0.426**
0.454**1
p10.450**
0.384**0.334*
0.688**1
v5-0.315*
-0.262-0.229
-0.251-0.308*
1v4
0.0210.029
-0.213-0.157
-0.2350.195
1v3
-0.215-0.395**
-0.090-0.258
-0.1900.411**
0.337*1
v2-0.142
-0.094-0.026
-0.276-0.378*
0.1600.526**
0.2781
v1-0.202
-0.094-0.182
-0.039-0.284
0.502**0.377*
0.390**0.390**
1s5
-0.052-0.199
-0.164-0.061
-0.1260.186
0.2520.325*
0.0000.234
1s4
0.2600.201
0.2540.244
0.208-0.272
-0.1400.088
-0.199-0.289
0.2211
s30.410**
0.1060.336*
0.346*0.317*
-0.179-0.103
-0.192-0.193
-0.330*-0.098
0.2251
s20.055
0.1550.077
0.2050.187
-0.188-0.140
-0.350*-0.170
-0.099-0.074
0.0680.413**
1s1
0.332*0.064
0.2930.241
0.321*-0.259
-0.209-0.429**
-0.209-0.357*
-0.1840.175
0.553**0.599**
1Note. N
=45 for all items. For non-ticket tasks. * and ** denote tw
o-tailed significant correlation at the 0.05 and 0.01 level respectively.
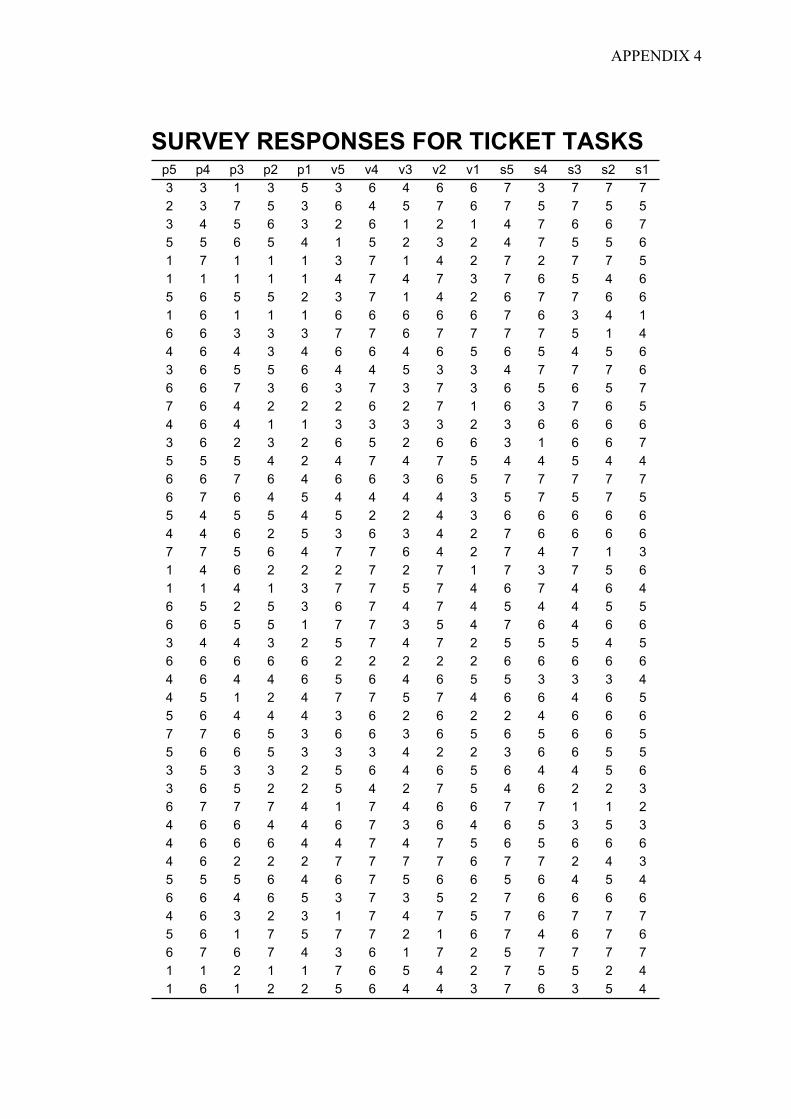
APPENDIX 4
SURVEY RESPONSES FOR TICKET TASKSp5 p4 p3 p2 p1 v5 v4 v3 v2 v1 s5 s4 s3 s2 s13 3 1 3 5 3 6 4 6 6 7 3 7 7 72 3 7 5 3 6 4 5 7 6 7 5 7 5 53 4 5 6 3 2 6 1 2 1 4 7 6 6 75 5 6 5 4 1 5 2 3 2 4 7 5 5 61 7 1 1 1 3 7 1 4 2 7 2 7 7 51 1 1 1 1 4 7 4 7 3 7 6 5 4 65 6 5 5 2 3 7 1 4 2 6 7 7 6 61 6 1 1 1 6 6 6 6 6 7 6 3 4 16 6 3 3 3 7 7 6 7 7 7 7 5 1 44 6 4 3 4 6 6 4 6 5 6 5 4 5 63 6 5 5 6 4 4 5 3 3 4 7 7 7 66 6 7 3 6 3 7 3 7 3 6 5 6 5 77 6 4 2 2 2 6 2 7 1 6 3 7 6 54 6 4 1 1 3 3 3 3 2 3 6 6 6 63 6 2 3 2 6 5 2 6 6 3 1 6 6 75 5 5 4 2 4 7 4 7 5 4 4 5 4 46 6 7 6 4 6 6 3 6 5 7 7 7 7 76 7 6 4 5 4 4 4 4 3 5 7 5 7 55 4 5 5 4 5 2 2 4 3 6 6 6 6 64 4 6 2 5 3 6 3 4 2 7 6 6 6 67 7 5 6 4 7 7 6 4 2 7 4 7 1 31 4 6 2 2 2 7 2 7 1 7 3 7 5 61 1 4 1 3 7 7 5 7 4 6 7 4 6 46 5 2 5 3 6 7 4 7 4 5 4 4 5 56 6 5 5 1 7 7 3 5 4 7 6 4 6 63 4 4 3 2 5 7 4 7 2 5 5 5 4 56 6 6 6 6 2 2 2 2 2 6 6 6 6 64 6 4 4 6 5 6 4 6 5 5 3 3 3 44 5 1 2 4 7 7 5 7 4 6 6 4 6 55 6 4 4 4 3 6 2 6 2 2 4 6 6 67 7 6 5 3 6 6 3 6 5 6 5 6 6 55 6 6 5 3 3 3 4 2 2 3 6 6 5 53 5 3 3 2 5 6 4 6 5 6 4 4 5 63 6 5 2 2 5 4 2 7 5 4 6 2 2 36 7 7 7 4 1 7 4 6 6 7 7 1 1 24 6 6 4 4 6 7 3 6 4 6 5 3 5 34 6 6 6 4 4 7 4 7 5 6 5 6 6 64 6 2 2 2 7 7 7 7 6 7 7 2 4 35 5 5 6 4 6 7 5 6 6 5 6 4 5 46 6 4 6 5 3 7 3 5 2 7 6 6 6 64 6 3 2 3 1 7 4 7 5 7 6 7 7 75 6 1 7 5 7 7 2 1 6 7 4 6 7 66 7 6 7 4 3 6 1 7 2 5 7 7 7 71 1 2 1 1 7 6 5 4 2 7 5 5 2 41 6 1 2 2 5 6 4 4 3 7 6 3 5 4
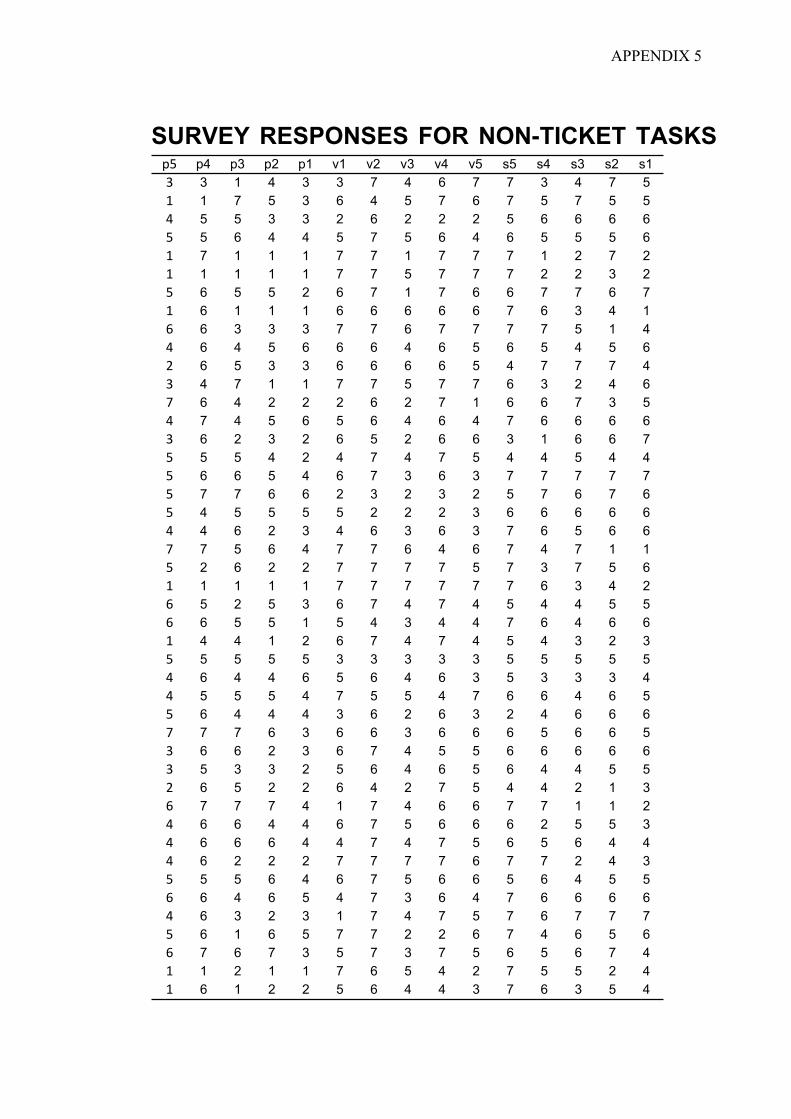
APPENDIX 5
SURVEY RESPONSES FOR NON-TICKET TASKS
!" p4 p3 p2 p1 v1 v2 v3 v4 v5 s5 s4 s3 s2 s1# 3 1 4 3 3 7 4 6 7 7 3 4 7 5$ 1 7 5 3 6 4 5 7 6 7 5 7 5 5% 5 5 3 3 2 6 2 2 2 5 6 6 6 6" 5 6 4 4 5 7 5 6 4 6 5 5 5 6$ 7 1 1 1 7 7 1 7 7 7 1 2 7 2$ 1 1 1 1 7 7 5 7 7 7 2 2 3 2" 6 5 5 2 6 7 1 7 6 6 7 7 6 7$ 6 1 1 1 6 6 6 6 6 7 6 3 4 1& 6 3 3 3 7 7 6 7 7 7 7 5 1 4% 6 4 5 6 6 6 4 6 5 6 5 4 5 6' 6 5 3 3 6 6 6 6 5 4 7 7 7 4# 4 7 1 1 7 7 5 7 7 6 3 2 4 6( 6 4 2 2 2 6 2 7 1 6 6 7 3 5% 7 4 5 6 5 6 4 6 4 7 6 6 6 6# 6 2 3 2 6 5 2 6 6 3 1 6 6 7" 5 5 4 2 4 7 4 7 5 4 4 5 4 4" 6 6 5 4 6 7 3 6 3 7 7 7 7 7" 7 7 6 6 2 3 2 3 2 5 7 6 7 6" 4 5 5 5 5 2 2 2 3 6 6 6 6 6% 4 6 2 3 4 6 3 6 3 7 6 5 6 6( 7 5 6 4 7 7 6 4 6 7 4 7 1 1" 2 6 2 2 7 7 7 7 5 7 3 7 5 6$ 1 1 1 1 7 7 7 7 7 7 6 3 4 2& 5 2 5 3 6 7 4 7 4 5 4 4 5 5& 6 5 5 1 5 4 3 4 4 7 6 4 6 6$ 4 4 1 2 6 7 4 7 4 5 4 3 2 3" 5 5 5 5 3 3 3 3 3 5 5 5 5 5% 6 4 4 6 5 6 4 6 3 5 3 3 3 4% 5 5 5 4 7 5 5 4 7 6 6 4 6 5" 6 4 4 4 3 6 2 6 3 2 4 6 6 6( 7 7 6 3 6 6 3 6 6 6 5 6 6 5# 6 6 2 3 6 7 4 5 5 6 6 6 6 6# 5 3 3 2 5 6 4 6 5 6 4 4 5 5' 6 5 2 2 6 4 2 7 5 4 4 2 1 3& 7 7 7 4 1 7 4 6 6 7 7 1 1 2% 6 6 4 4 6 7 5 6 6 6 2 5 5 3% 6 6 6 4 4 7 4 7 5 6 5 6 4 4% 6 2 2 2 7 7 7 7 6 7 7 2 4 3" 5 5 6 4 6 7 5 6 6 5 6 4 5 5& 6 4 6 5 4 7 3 6 4 7 6 6 6 6% 6 3 2 3 1 7 4 7 5 7 6 7 7 7" 6 1 6 5 7 7 2 2 6 7 4 6 5 6& 7 6 7 3 5 7 3 7 5 6 5 6 7 4$ 1 2 1 1 7 6 5 4 2 7 5 5 2 4$ 6 1 2 2 5 6 4 4 3 7 6 3 5 4
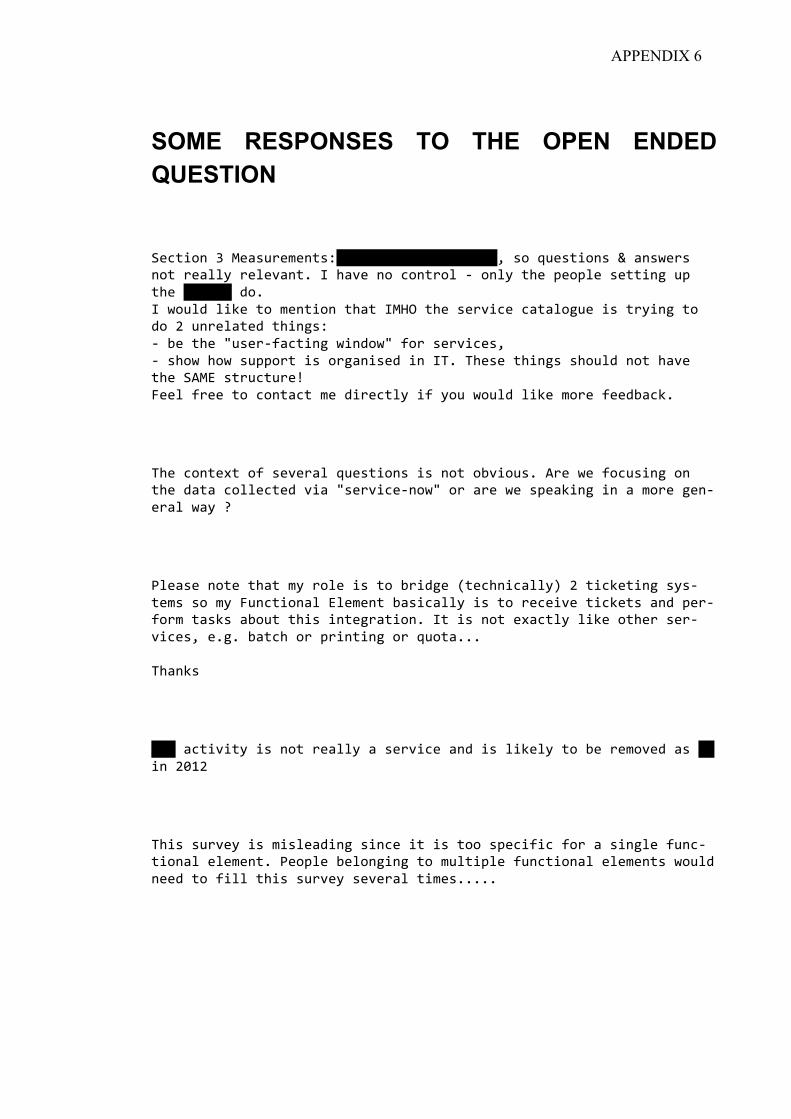
APPENDIX 6
SOME RESPONSES TO THE OPEN ENDED QUESTION
A")*+,(%V%."#5'$"6"(*5SUUUUUUUUUUUUUUUUUU;;0%5,%P'"5*+,(5%W%#(5C"$5%(,*%$"#--3%$"-"2#(*;%1%=#2"%(,%),(*$,-%F%,(-3%*="%4",4-"%5"**+(/%'4%*="%UUUUUU%?,;%1%C,'-?%-+B"%*,%6"(*+,(%*=#*%1.XN%*="%5"$2+)"%)#*#-,/'"%+5%*$3+(/%*,%?,%Y%'($"-#*"?%*=+(/5S%%F%>"%*="%Z'5"$F@#)*+(/%C+(?,CZ%@,$%5"$2+)"50%%F%5=,C%=,C%5'44,$*%+5%,$/#(+5"?%+(%1I;%I="5"%*=+(/5%5=,'-?%(,*%=#2"%*="%AL.8%5*$')*'$"[%&""-%@$""%*,%),(*#)*%6"%?+$")*-3%+@%3,'%C,'-?%-+B"%6,$"%@""?>#)B;%
%
I="%),(*"\*%,@%5"2"$#-%P'"5*+,(5%+5%(,*%,>2+,'5;%L$"%C"%@,)'5+(/%,(%*="%?#*#%),--")*"?%2+#%Z5"$2+)"F(,CZ%,$%#$"%C"%54"#B+(/%+(%#%6,$"%/"(F"$#-%C#3%]%
%
G-"#5"%(,*"%*=#*%63%$,-"%+5%*,%>$+?/"%^*")=(+)#--3_%Y%*+)B"*+(/%535F*"65%5,%63%&'()*+,(#-%8-"6"(*%>#5+)#--3%+5%*,%$")"+2"%*+)B"*5%#(?%4"$F@,$6%*#5B5%#>,'*%*=+5%+(*"/$#*+,(;%1*%+5%(,*%"\#)*-3%-+B"%,*="$%5"$F2+)"50%";/;%>#*)=%,$%4$+(*+(/%,$%P',*#;;;%%I=#(B5%
%
U;;%#)*+2+*3%+5%(,*%$"#--3%#%5"$2+)"%#(?%+5%-+B"-3%*,%>"%$"6,2"?%#5%U;%+(%YRQY%
%
I=+5%5'$2"3%+5%6+5-"#?+(/%5+()"%+*%+5%*,,%54")+@+)%@,$%#%5+(/-"%@'()F*+,(#-%"-"6"(*;%G",4-"%>"-,(/+(/%*,%6'-*+4-"%@'()*+,(#-%"-"6"(*5%C,'-?%(""?%*,%@+--%*=+5%5'$2"3%5"2"$#-%*+6"5;;;;;%
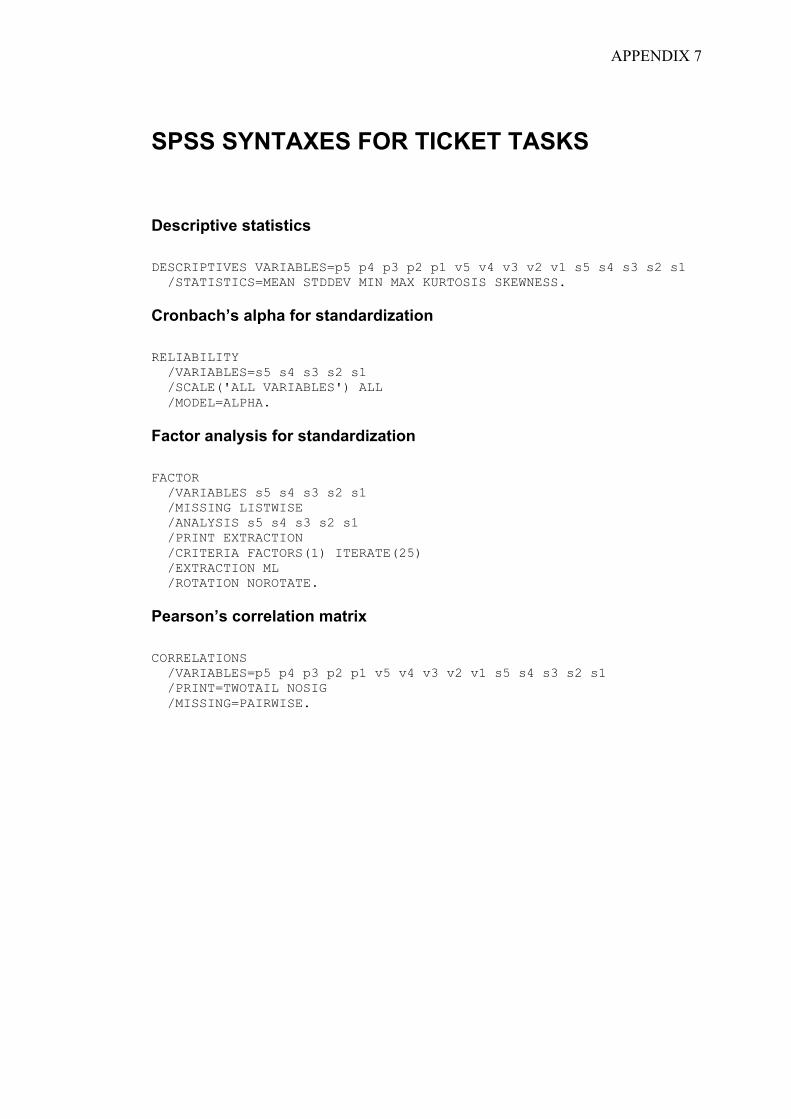
APPENDIX 7
SPSS SYNTAXES FOR TICKET TASKS
Descriptive statistics
DESCRIPTIVES VARIABLES=p5 p4 p3 p2 p1 v5 v4 v3 v2 v1 s5 s4 s3 s2 s1 /STATISTICS=MEAN STDDEV MIN MAX KURTOSIS SKEWNESS.
Cronbach’s alpha for standardization
RELIABILITY /VARIABLES=s5 s4 s3 s2 s1 /SCALE('ALL VARIABLES') ALL /MODEL=ALPHA.
Factor analysis for standardization
FACTOR /VARIABLES s5 s4 s3 s2 s1 /MISSING LISTWISE /ANALYSIS s5 s4 s3 s2 s1 /PRINT EXTRACTION /CRITERIA FACTORS(1) ITERATE(25) /EXTRACTION ML /ROTATION NOROTATE.
Pearson’s correlation matrix
CORRELATIONS /VARIABLES=p5 p4 p3 p2 p1 v5 v4 v3 v2 v1 s5 s4 s3 s2 s1 /PRINT=TWOTAIL NOSIG /MISSING=PAIRWISE.
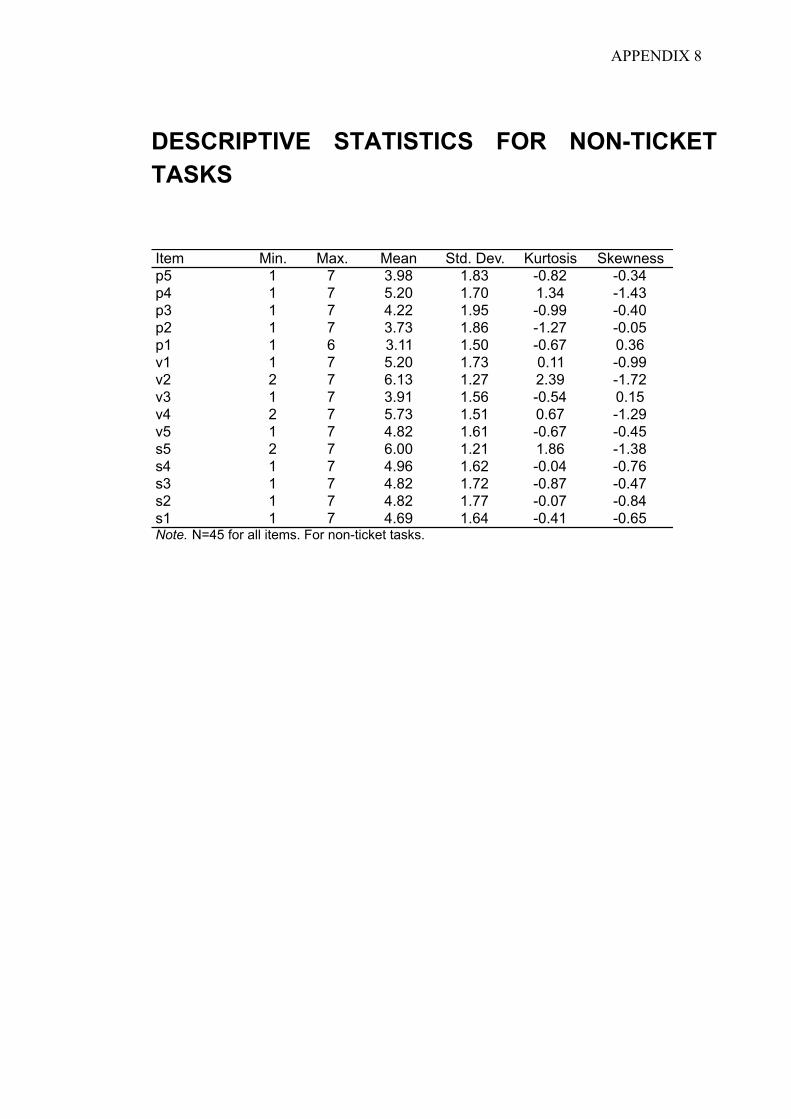
APPENDIX 8
DESCRIPTIVE STATISTICS FOR NON-TICKET TASKS
Item Min. Max. Mean Std. Dev. Kurtosis Skewnessp5 1 7 3.98 1.83 -0.82 -0.34p4 1 7 5.20 1.70 1.34 -1.43p3 1 7 4.22 1.95 -0.99 -0.40p2 1 7 3.73 1.86 -1.27 -0.05p1 1 6 3.11 1.50 -0.67 0.36v1 1 7 5.20 1.73 0.11 -0.99v2 2 7 6.13 1.27 2.39 -1.72v3 1 7 3.91 1.56 -0.54 0.15v4 2 7 5.73 1.51 0.67 -1.29v5 1 7 4.82 1.61 -0.67 -0.45s5 2 7 6.00 1.21 1.86 -1.38s4 1 7 4.96 1.62 -0.04 -0.76s3 1 7 4.82 1.72 -0.87 -0.47s2 1 7 4.82 1.77 -0.07 -0.84s1 1 7 4.69 1.64 -0.41 -0.65Note. N=45 for all items. For non-ticket tasks.
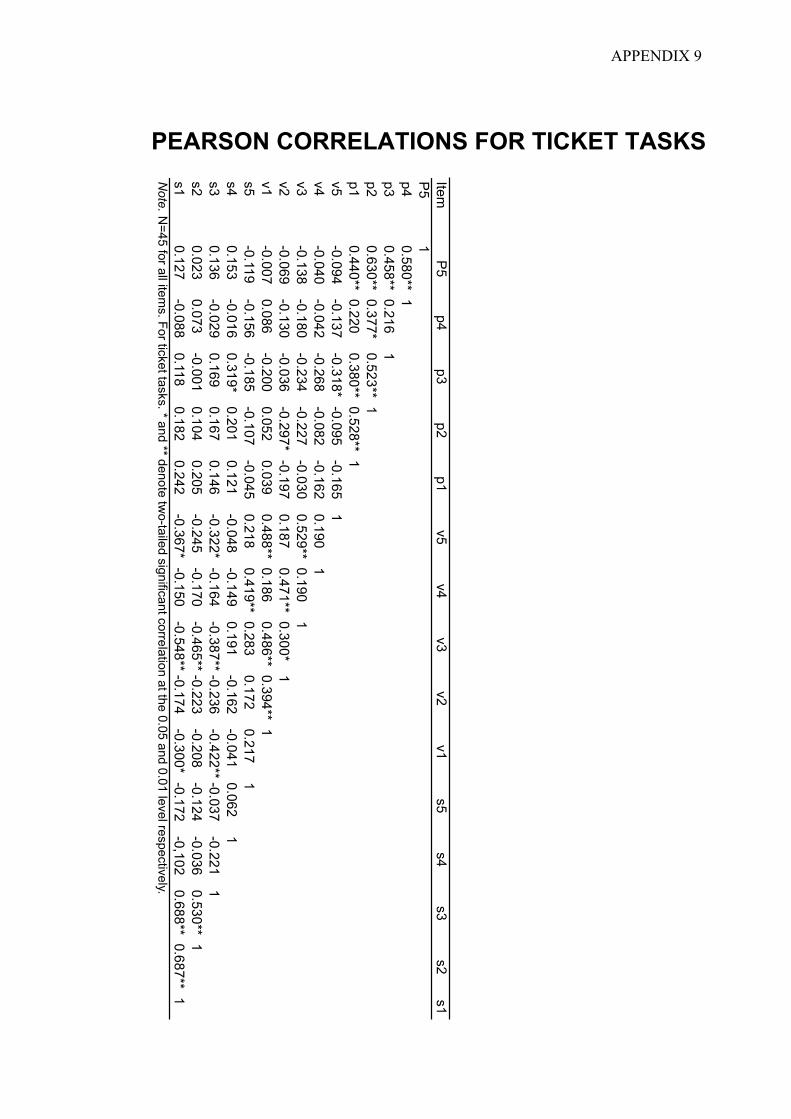
APPENDIX 9
PEARSON CORRELATIONS FOR TICKET TASKS
ItemP
5p4
p3p2
p1v5
v4v3
v2v1
s5s4
s3s2
s1P
51
p40.580**
1p3
0.458**0.216
1p2
0.630**0.377*
0.523**1
p10.440**
0.2200.380**
0.528**1
v5-0.094
-0.137-0.318*
-0.095-0.165
1v4
-0.040-0.042
-0.268-0.082
-0.1620.190
1v3
-0.138-0.180
-0.234-0.227
-0.0300.529**
0.1901
v2-0.069
-0.130-0.036
-0.297*-0.197
0.1870.471**
0.300*1
v1-0.007
0.086-0.200
0.0520.039
0.488**0.186
0.486**0.394**
1s5
-0.119-0.156
-0.185-0.107
-0.0450.218
0.419**0.283
0.1720.217
1s4
0.153-0.016
0.319*0.201
0.121-0.048
-0.1490.191
-0.162-0.041
0.0621
s30.136
-0.0290.169
0.1670.146
-0.322*-0.164
-0.387**-0.236
-0.422**-0.037
-0.2211
s20.023
0.073-0.001
0.1040.205
-0.245-0.170
-0.465**-0.223
-0.208-0.124
-0.0360.530**
1s1
0.127-0.088
0.1180.182
0.242-0.367*
-0.150-0.548**
-0.174-0.300*
-0.172-0,102
0.688**0.687**
1N
ote. N=45 for all item
s. For ticket tasks. * and ** denote two-tailed significant correlation at the 0.05 and 0.01 level respectively.
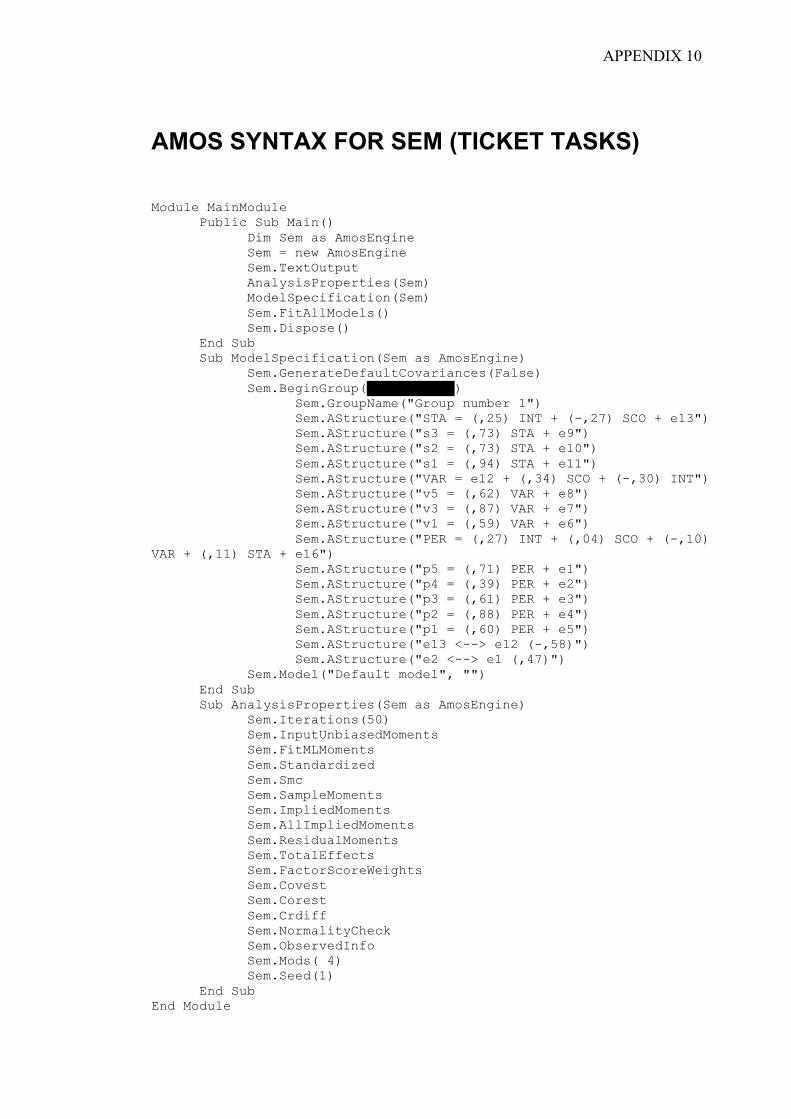
APPENDIX 10
AMOS SYNTAX FOR SEM (TICKET TASKS)
Module MainModule Public Sub Main() Dim Sem as AmosEngine Sem = new AmosEngine Sem.TextOutput AnalysisProperties(Sem) ModelSpecification(Sem) Sem.FitAllModels() Sem.Dispose() End Sub Sub ModelSpecification(Sem as AmosEngine) Sem.GenerateDefaultCovariances(False) Sem.BeginGroup(………………………….) Sem.GroupName("Group number 1") Sem.AStructure("STA = (,25) INT + (-,27) SCO + e13") Sem.AStructure("s3 = (,73) STA + e9") Sem.AStructure("s2 = (,73) STA + e10") Sem.AStructure("s1 = (,94) STA + e11") Sem.AStructure("VAR = e12 + (,34) SCO + (-,30) INT") Sem.AStructure("v5 = (,62) VAR + e8") Sem.AStructure("v3 = (,87) VAR + e7") Sem.AStructure("v1 = (,59) VAR + e6") Sem.AStructure("PER = (,27) INT + (,04) SCO + (-,10) VAR + (,11) STA + e16") Sem.AStructure("p5 = (,71) PER + e1") Sem.AStructure("p4 = (,39) PER + e2") Sem.AStructure("p3 = (,61) PER + e3") Sem.AStructure("p2 = (,88) PER + e4") Sem.AStructure("p1 = (,60) PER + e5")
Sem.AStructure("e13 <--> e12 (-,58)") Sem.AStructure("e2 <--> e1 (,47)") Sem.Model("Default model", "") End Sub Sub AnalysisProperties(Sem as AmosEngine) Sem.Iterations(50) Sem.InputUnbiasedMoments Sem.FitMLMoments Sem.Standardized Sem.Smc Sem.SampleMoments Sem.ImpliedMoments Sem.AllImpliedMoments Sem.ResidualMoments Sem.TotalEffects Sem.FactorScoreWeights Sem.Covest Sem.Corest Sem.Crdiff Sem.NormalityCheck Sem.ObservedInfo Sem.Mods( 4) Sem.Seed(1) End Sub End Module