ieee transactions on education, vol. x, no. x,...
TRANSCRIPT
IEEE TRANSACTIONS ON EDUCATION, VOL. X, NO. X, JANUARY 20XX 1
MASTERS: A Virtual Lab on Multimedia Systemsfor Telecommunications, Medical and Remote
Sensing ApplicationsDimitrios S. Alexiadis and Nikolaos Mitianoudis, Senior Member, IEEE,
Abstract—Digital Signal Processing (DSP) has been an integralpart of most Electrical, Electronic and Computer Engineeringcurricula. The applications of DSP in multimedia (audio, image,video) storage, transmission and analysis are also widely taughtat both the undergraduate and postgraduate levels, as digitalmultimedia can be encountered in most human daily activities.In this paper, a virtual lab on multimedia systems for telecommu-nications, medical and remote sensing applications is presented;consisting of 20 graphical user interfaces, it can support teachingactivities for various DSP concepts. The virtual lab developedwas used as a teaching companion for a postgraduate course onmultimedia content management, to enhancing student compre-hension of the material taught; it has been made freely availablefor similar educational or research purposes.
Index Terms—Demonstration, digital signal and image pro-cessing, interactive education, multimedia, visualization
I. INTRODUCTION
D IGITAL Signal Processing (DSP) describes a wide rangeof activities that can be performed for the efficient
manipulation of signals (audio, static images, video and soon) in a discrete representation, using a personal computeror any other processing or embedded system [1]. EfficientDSP techniques have numerous applications in fields suchas telecommunications, medicine, remote sensing and finance.Hence DSP, along with several derivative modules, includingaudio and image processing, has become an integral part ofmost Electrical, Electronic or Computer Engineering curriculaworldwide [2]. Simultaneously, the advancement of severalprogramming platforms, such as MATLAB, LabView, C++and JAVA, has offered new powerful tools and libraries thatcan be used either for research or educational purposes [3],[4] in the field of DSP. The use of Graphical User Interfaces(GUI) to demonstrate the basic principles of DSP has beenhighlighted before, [3].
The School of Science and Technology1 at the InternationalHellenic University (IHU) was founded in 2010 and offers
Manuscript received January 30, 2012; revised xx xx. This project wasfunded by the Operational Program Education and Lifelong Learning, OPS200056 (International Hellenic University, Thessaloniki, Greece).
Both authors were with the School of Science and Technology, InternationalHellenic University, Greece.
Dimitrios Alexiadis is currently with the Informatics and Telematics Insti-tute, CERTH, Greece. (e-mail: [email protected], tel: +30 2310 464160.)
Nikolaos Mitianoudis is currently with the Department of Electrical andComputer Engineering, Democritus University of Thrace, 67100 Xanthi,Greece (e-mail: [email protected], tel: +30 25410 79572, fax: +30 2541079569.)
1http://www.tech.ihu.edu.gr/
two postgraduate programs, one being an M.Sc. in Informationand Communication Technology (ICT) Systems. The VirtualLabs project prepared interactive supporting material for theseprograms, providing essential infrastructure for the Schoolsteaching and research activities. The virtual labs implement anumber of GUI-based experiments on several key topics whosetheory is covered in postgraduate-level modules. This paperpresents the virtual laboratory (VLab) known as MASTERS(MultimediA Systems in Telecommunications, mEdical andRemote Sensing applications). The MASTERS VLab usesGUIs to implement several interactive exercises, giving stu-dents practical experience of important theoretical aspectsof multimedia processing. The main objective of this VLabis to immerse the student in the related theoretical topics,starting with very fundamental concepts and progressively andhierarchically building up his/her knowledge to the level ofcurrent state-of-the-art approaches.
The MASTERS VLab is intended to be of use both to tutorsgiving in-class demonstrations and to students studying at-home and performing laboratory practicals. In-class demon-strations using the interactive MASTERS GUIs can comple-ment lectures, offering an immediate visual interpretation ofthe concepts discussed. The MASTERS VLab is accompaniedby a detailed manual that provides an essential summary ofthe theoretical concepts behind each experiment, describesthe structure and functionality of each GUI, and provides aset of unworked exercises which can be used as homeworkassignments. Since the MASTERS VLab is modular, it can beeasily complemented with additional modules to cover moretopics.
The rest of the paper is organized as follows: Section I-Abriefly explains the aims of the modules taught. Section IIoutlines the structure of the virtual lab exercises developed.Sections III, IV and V describe a selection of these virtualexperiments. Section VI gives the results of the student assess-ment of these virtual experiments. Finally, Section VII drawsconclusions.
A. Modules TaughtThe following three elective modules in the M.Sc. in ICT
Systems are allocated 30 teaching hours over a 10-13 weekterm. As the subject matter content of these modules is ratherlarge, covering both fundamental background knowledge andcurrent state-of-the-art technology, virtual experiments andGUI demonstrations can assist in the educational process byhelping students assimilate the concepts.
IEEE TRANSACTIONS ON EDUCATION, VOL. X, NO. X, JANUARY 20XX 2
1) Multimedia Content Management: This course intro-duces students to the basic properties of multimedia, which isthe principal content transmitted over modern communicationnetworks. Among other issues, the main topics discussed arethe coding and transmission of multimedia content, alongwith their principal applications in modern communicationnetworks and personal appliances. The VLab GUIs and ex-ercises created to facilitate the teaching of these concepts aresummarized in Sections III and IV.
2) Medical Imaging: This course aims to provide a thor-ough understanding of the various imaging representations inmodern medicine, introducing the basic concepts of medicalimaging and image processing tools, and guiding studentsthrough the exploitation of modern medical imaging tech-nology in radiotherapy and surgery. The associated VLabexperiments, summarized in Section V, cover a variety ofimage processing tools essential in the medical imaging field,including image equalization, image noise reduction and imageregistration and fusion.
3) Geographical Information Systems and Remote Sensing:This course provides a basic introduction to GeographicalInformation Systems (GIS) and to mapping, and their usein sustainable growth applications. Although mainly focusedon GIS applications, this module also features two three-hourlectures on remote sensing imaging and applications, such aspansharpening, which are addressed by a specialized VLabexercise.
II. THE MASTERS VIRTUAL LABORATORY
The MASTERS VLab consists of 20 GUIs with rich-interaction features, developed in Mathworks MATLAB 2 andSIMULINK 3. It is divided into four sections or packages: Ato D. The software is accompanied by an extensive tutorial,which can be plugged into MATLABs help environment andwhich contains user instructions, some theory, and exercisesets. Starting with fundamental concepts and then progres-sively and hierarchically building the students knowledge, thefollowing topics are addressed:A. Audio, Image and Video Encoding and Compression
A1. Entropy CodingA2. Scalar and Vector QuantizationA3. Transform Coding
A4-5. “Psychoacoustic masking” and the MP3 (MPEG AudioLayer III) audio-coding standard
A6-7. The JPEG and JPEG-2000 compression standardsA8-10. MPEG1 and MPEG2 video coding
A11. MPEG4 video codingB. Video and Audio Streaming over Noisy ChannelsB1-2. Digital Video Broadcasting - Terrestrial (DVB-T)
B3. Internet Low Bit-rate audio Codec (iLBC)C. Processing, Registration and Fusion of Medical Images
C1. Image EqualizationC2. Image Noise Reduction
C3-5. Image Registration and Fusion
2http://www.mathworks.com/products/matlab/3http://www.mathworks.com/products/simulink/
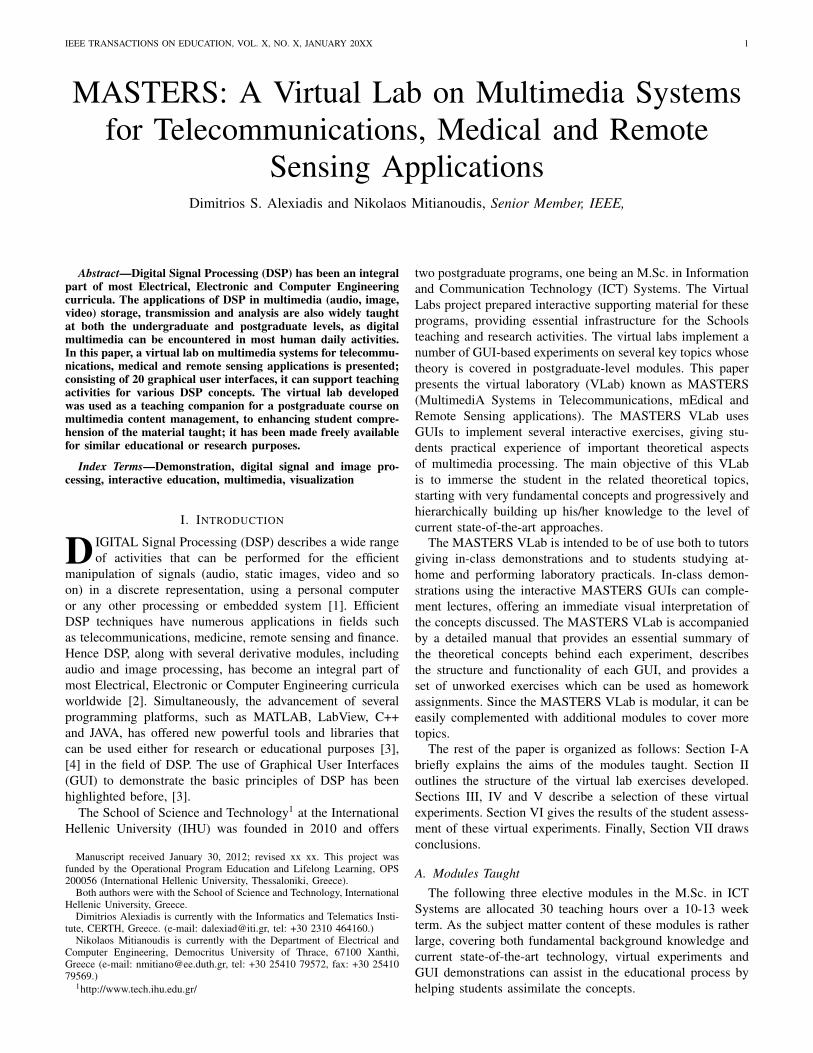
Fig. 1. The Transform Coding GUI.
D. Fusion of Remote-Sensing ImagesD1. Pansharpening.The MATLAB programming environment was selected for
the MASTERS software development, since MATLAB ishighly optimized for vectorized code and therefore suitable forDSP algorithms, it includes rich and well-validated toolboxesfor signal and image processing and it provides excellentcross-platform portability. Appropriate wrappers can be devel-oped for importing code written in other languages. Thereforea small portion of the MASTERS VLab code was writtenin C to accelerate performance, and many optimized open-source C++ libraries were also used [5]. Using the MATLABcompiler4, stand-alone executable applications can be com-piled and distributed to users without a MATLAB installation.Furthermore, Mathworks’ SIMULINK was used to developthe simulation modules of package B. A number of publicly-available libraries [5] were also employed to complement thoseavailable in MATLAB.
A significant criterion while developing the VLabs softwareplatforms was adaptability and extendability, so that additionalfeatures can be added easily, according to the tutors needs. Thefollowing sections present only a portion of the MASTERSVLab GUIs, due to space limitations. The reader is invited todownload and explore the whole MASTERS VLab from [5].
III. AUDIO-IMAGE-VIDEO ENCODING AND COMPRESSION
A. Transform Coding
The compression problem can be divided into a sequenceof three relatively simple steps: a) computation of a lineartransformation of the data, designed primarily to produce un-correlated coefficients, such as the Discrete Cosine Transform(DCT) [6], b) quantization of transform coefficients, and c)entropy coding. This process is called transform coding [7] andits principles apply equally well to audio and images in moststate-of-the-art compression schemes. The most importantconcepts of transform coding can be studied and effectivelydemonstrated using the graphical interface of Fig. 1. Due to its
4http://www.mathworks.com/products/distriben/
IEEE TRANSACTIONS ON EDUCATION, VOL. X, NO. X, JANUARY 20XX 3
simplicity and its application in many image and video codingstandards, the 2D DCT was selected for this interface.
The basic interfaces operations can be summarized as: asource image file is selected by the user. Then, the 2D DCTtransform is applied, with the block size specifiable by theuser. The user can observe that for natural images the energy isconcentrated in low-frequency coefficients. Next, the transformcoefficients are quantized using a quantization matrix designedby the user. The applied ”quantization mask” can be modifiedusing a rich set of related controls. The quantized transformcoefficients are shown. Additionally, the histogram of thecoefficients can be displayed (this is not shown in Fig. 1). Theuser will observe that the histogram is concentrated around thezero-value, which results in low entropy. The entropy of thequantized coefficients is also presented (0.7091 bits/coefficientin the example shown). Then the inverse DCT is applied to thequantized transform coefficients, and the resulting compressedimage (without using entropy coding) is displayed. For theexample shown in Fig. 1, the result was obtained using 1.8305bits per coefficient; in order to demonstrate the effectiveness ofTransform Coding versus direct quantization of the intensitypixel values, the initial image is quantized using ⌈1.8305⌉ = 2bits/pixel and the resulting image is shown. Uniform quantiza-tion applied directly to the initial image produces far inferiorresults to those obtained by DCT quantization. Furthermore,the entropy of the quantized DCT coefficients is much lower (0.7091 vs 1.6426 bits/pixels in the shown example), implyingthat the use of an entropy-coding algorithm would lead toincreased compression ratios.
B. Psychoacoustic Analysis and MP3 Audio Coding
The main modules of the MP3 (MPEG Audio Layer III)coder are the 32-channel polyphase filterbank, the Modified-DCT transformation that allows short-time processing of theinput waveform, the psychoacoustic analysis and the quantizerand entropy coder [8]. The most important feature of theMP3’s lossy compression algorithm is that it reduces theaccuracy of certain parts of the audio spectrum beyond mostpeoples ability to resolve.
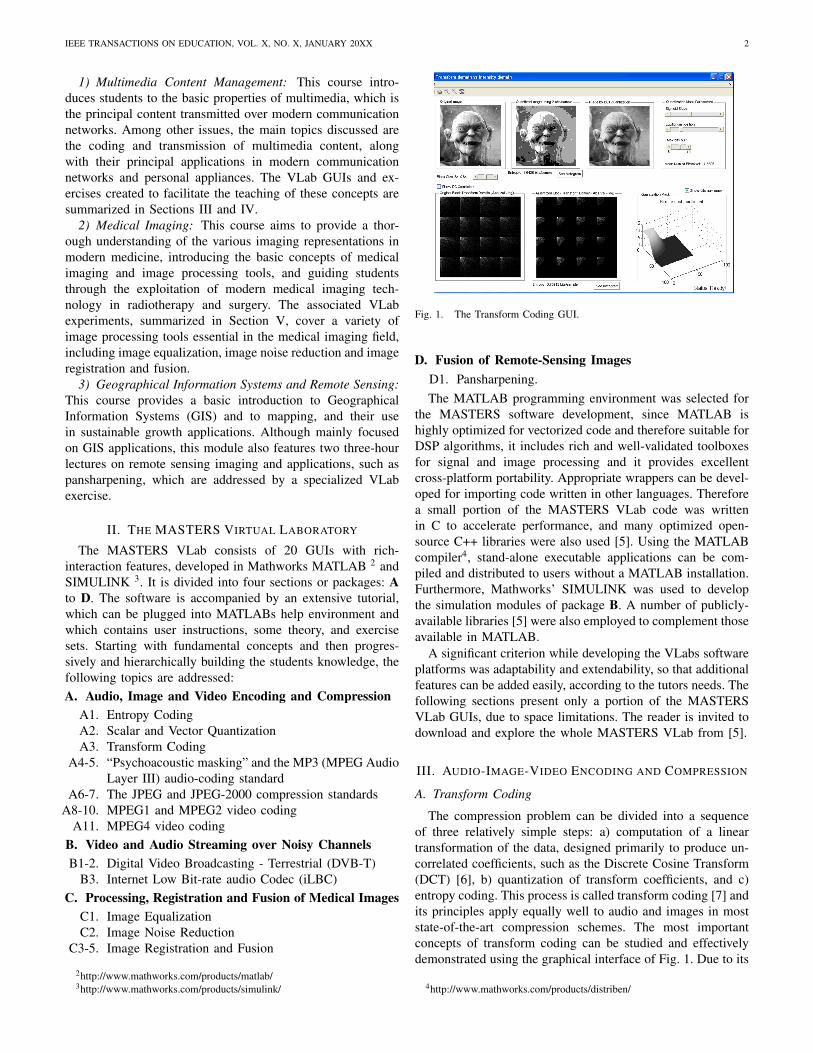
Two of the MASTERS VLab GUIs can be used to demon-strate the psychoacoustic analysis and the MP3 encodingprocedure. In the psychoacoustics GUI, the student can loada particular audio waveform, select an audio segment tobe analysed and then study all the individual steps for thecomputation of global masking thresholds for each audioframe (global peaks, tonal peaks, non-tonal peaks and absolutethreshold). With the second GUI (Fig. 2), the student can studythe MP3 encoding process by opening an audio file of choice,setting the target MP3 compression bit rate and applyingcompression. Each (selected) audio frame is displayed inthe time domain for the original and the compressed signalrespectively. Additionally, the Fourier transform of the originaland compressed frames, and their difference, are plotted. Theuser can thus identify the frequency components discarded bythe encoder. For the example of Fig. 2, it can be seen that,based on psychoacoustic analysis and in order to achieve thewanted bit-rate, the encoder eliminated almost all of the high
Fig. 2. The MPEG Layer III (MP3) Audio Coding GUI.
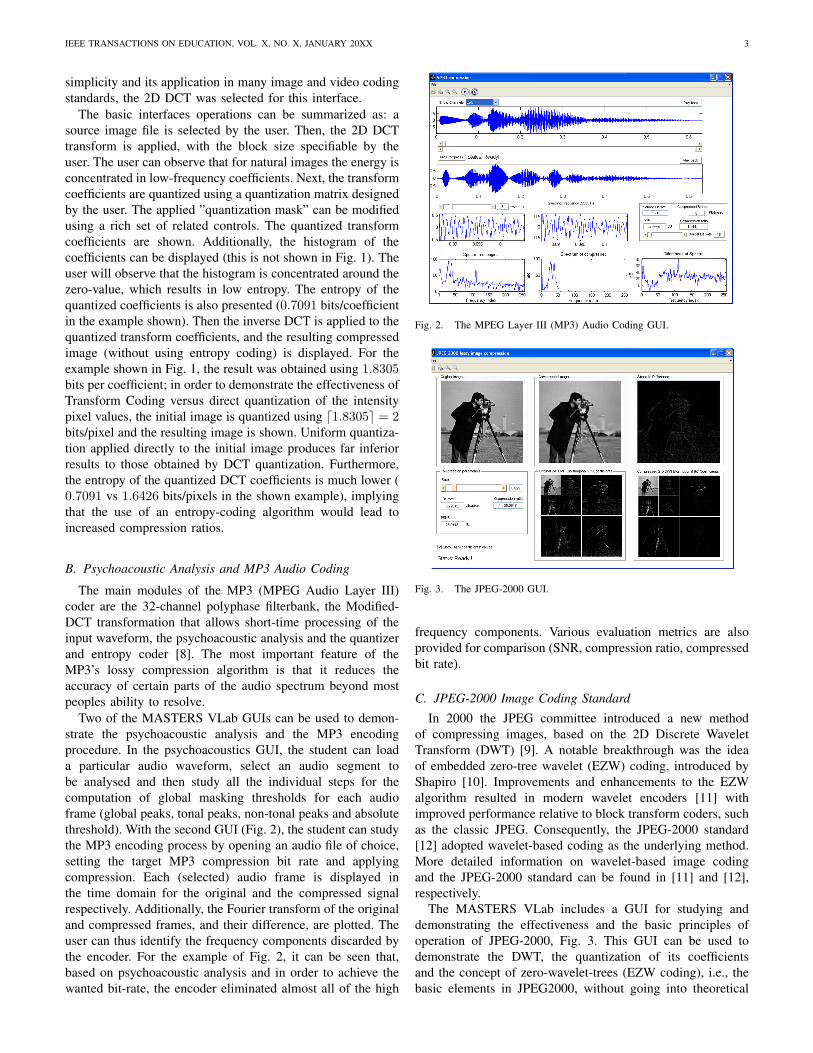
Fig. 3. The JPEG-2000 GUI.
frequency components. Various evaluation metrics are alsoprovided for comparison (SNR, compression ratio, compressedbit rate).
C. JPEG-2000 Image Coding Standard
In 2000 the JPEG committee introduced a new methodof compressing images, based on the 2D Discrete WaveletTransform (DWT) [9]. A notable breakthrough was the ideaof embedded zero-tree wavelet (EZW) coding, introduced byShapiro [10]. Improvements and enhancements to the EZWalgorithm resulted in modern wavelet encoders [11] withimproved performance relative to block transform coders, suchas the classic JPEG. Consequently, the JPEG-2000 standard[12] adopted wavelet-based coding as the underlying method.More detailed information on wavelet-based image codingand the JPEG-2000 standard can be found in [11] and [12],respectively.
The MASTERS VLab includes a GUI for studying anddemonstrating the effectiveness and the basic principles ofoperation of JPEG-2000, Fig. 3. This GUI can be used todemonstrate the DWT, the quantization of its coefficientsand the concept of zero-wavelet-trees (EZW coding), i.e., thebasic elements in JPEG2000, without going into theoretical
IEEE TRANSACTIONS ON EDUCATION, VOL. X, NO. X, JANUARY 20XX 4
details. The GUI’s basic operations can be summarized asfollows: the source image is selected; the desired JPEG-2000compression parameters are specified by the user, with thebit-rate and the corresponding compression-factor being given;finally, the compressed image is displayed in conjunction withthe original one. Their difference image is also given, togetherwith the corresponding PSNR (Peak Signal to Noise Ratio).Given that the student has already studied the JPEG standard,this means that he/she can observe the advantages of JPEG-2000, and the differences between JPEG-2000 and the classicJPEG, which include the improvement of the compressionperformance, especially at low bit-rates and reduced visualartifacts: JPEG-2000 produces ringing artifacts near the edges,while classic JPEG produces both ringing artifacts and “block”artifacts, due to its block-based nature. More importantly,the 2D DWT coefficients of the original and the compressedimages are shown, illustrating that the DWT coefficients ofthe compressed image were obtained by quantizing the DWTcoefficients of the original image, and showing the waveletzero-trees, i.e., when a DWT coefficient in a coarse scale iszero (insignificant), the corresponding coefficients in the detailscales are also zero.
D. MPEG1-2 Video Coding
The MPEG (Moving Picture Experts Group) coding stan-dard [6], [13] exploits perceptual compression methods toreduce the data-rate. It reduces information in the spatialfrequencies of the images for which the human eye haslimited perception, and exploits temporal redundancy, i.e., thesimilarity between consecutive frames. Within the MASTERSVLab framework, three interactive GUIs were developed todemonstrate the main MPEG concepts. The first targets theunderstanding of the concepts of motion estimation and inter-frame coding. The second examines the notion of the Group OfPictures (GOP), i.e., the sequence of I-, P- and B-frames andthe step-by-step compression approach in an MPEG coder. Thethird demonstrates the compression capabilities of an MPEGcoder. Due to space limitation, only two of these are described.
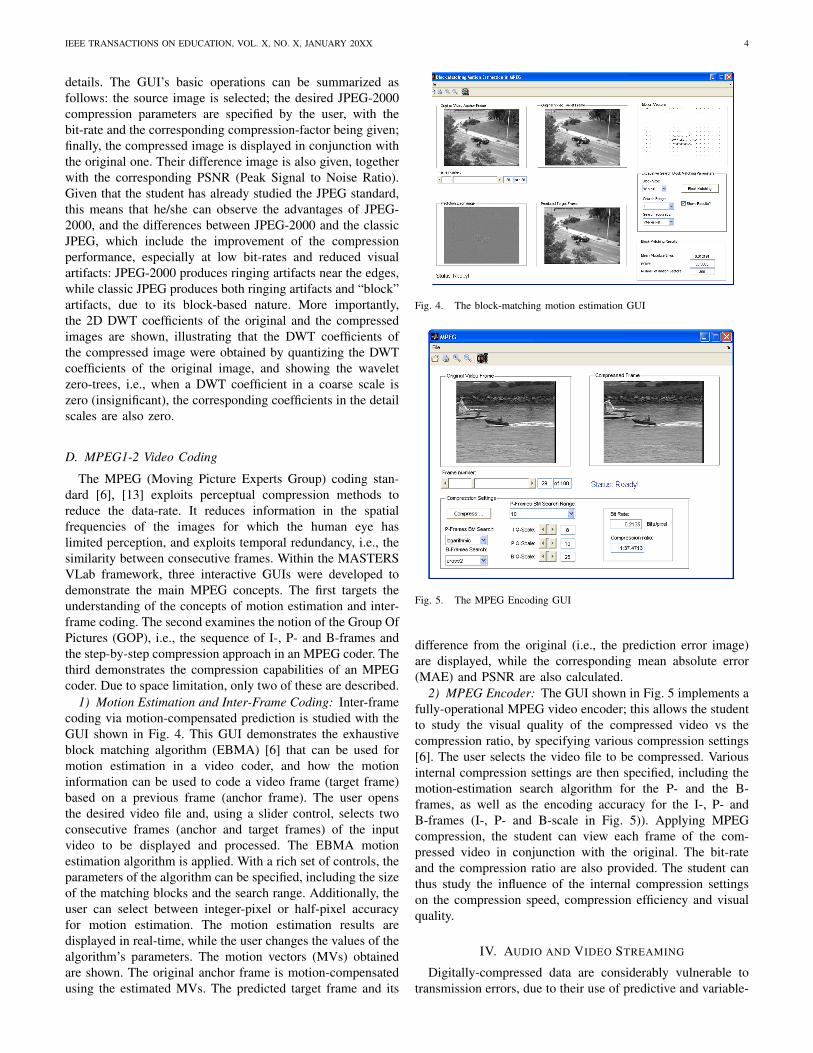
1) Motion Estimation and Inter-Frame Coding: Inter-framecoding via motion-compensated prediction is studied with theGUI shown in Fig. 4. This GUI demonstrates the exhaustiveblock matching algorithm (EBMA) [6] that can be used formotion estimation in a video coder, and how the motioninformation can be used to code a video frame (target frame)based on a previous frame (anchor frame). The user opensthe desired video file and, using a slider control, selects twoconsecutive frames (anchor and target frames) of the inputvideo to be displayed and processed. The EBMA motionestimation algorithm is applied. With a rich set of controls, theparameters of the algorithm can be specified, including the sizeof the matching blocks and the search range. Additionally, theuser can select between integer-pixel or half-pixel accuracyfor motion estimation. The motion estimation results aredisplayed in real-time, while the user changes the values of thealgorithm’s parameters. The motion vectors (MVs) obtainedare shown. The original anchor frame is motion-compensatedusing the estimated MVs. The predicted target frame and its
Fig. 4. The block-matching motion estimation GUI
Fig. 5. The MPEG Encoding GUI
difference from the original (i.e., the prediction error image)are displayed, while the corresponding mean absolute error(MAE) and PSNR are also calculated.
2) MPEG Encoder: The GUI shown in Fig. 5 implements afully-operational MPEG video encoder; this allows the studentto study the visual quality of the compressed video vs thecompression ratio, by specifying various compression settings[6]. The user selects the video file to be compressed. Variousinternal compression settings are then specified, including themotion-estimation search algorithm for the P- and the B-frames, as well as the encoding accuracy for the I-, P- andB-frames (I-, P- and B-scale in Fig. 5)). Applying MPEGcompression, the student can view each frame of the com-pressed video in conjunction with the original. The bit-rateand the compression ratio are also provided. The student canthus study the influence of the internal compression settingson the compression speed, compression efficiency and visualquality.
IV. AUDIO AND VIDEO STREAMING
Digitally-compressed data are considerably vulnerable totransmission errors, due to their use of predictive and variable-
IEEE TRANSACTIONS ON EDUCATION, VOL. X, NO. X, JANUARY 20XX 5
length (entropy) coding. Therefore, in real-time audio-visualcommunications, the compressed bit stream has to undergo achannel coding stage using forward error correction (FEC)techniques and interleaving [6], [14], [15]. Digital VideoBroadcasting - Terrestrial (DVB-T) transmits MPEG digitalvideo, using coded orthogonal frequency-division multiplexing(OFDM) modulation. The most important modules of theDVB-T transmitter are: the MPEG encoder; an external FECencoder, using a Reed-Solomon RS (204, 188) code; an exter-nal convolutional interleaver; an internal FEC encoder, usinga punctuated convolutional code; an internal block interleaver,intended to reduce the influence of burst errors; a digitalmodulation mapper (QPSK, 16-QAM, or 64-QAM); and anOFDM modulator, using 2-K, 4-K, or 8-K OFDM subcarriers.
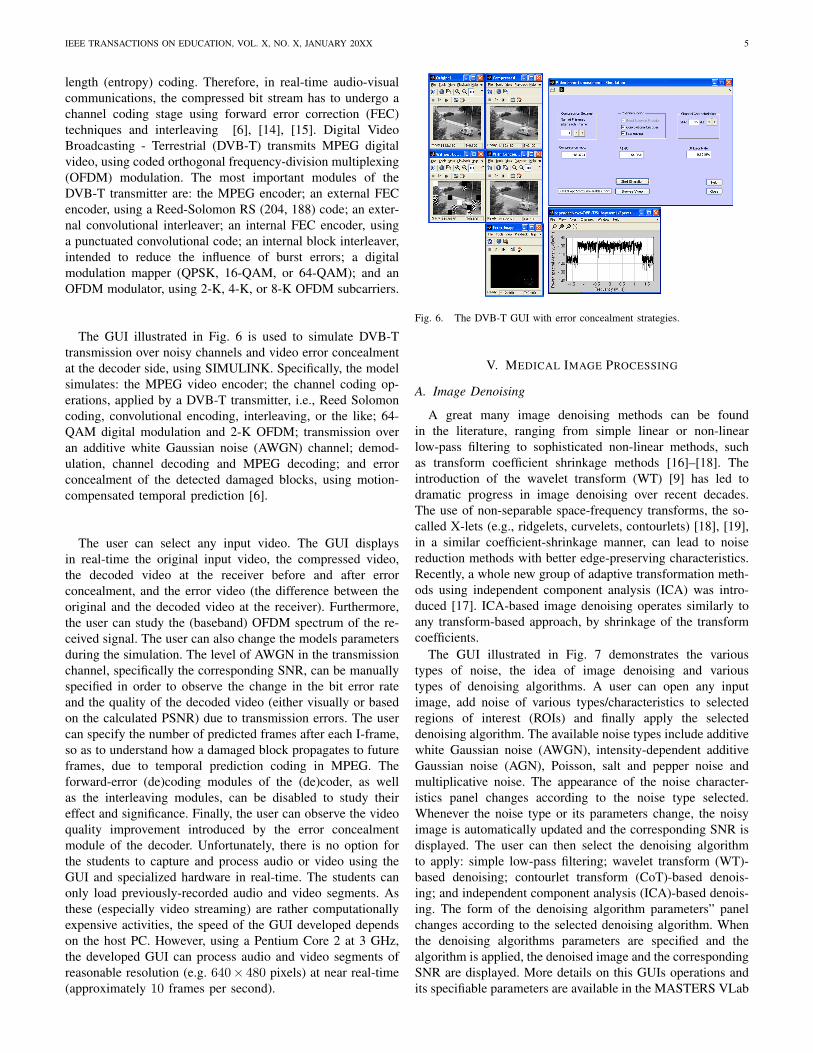
The GUI illustrated in Fig. 6 is used to simulate DVB-Ttransmission over noisy channels and video error concealmentat the decoder side, using SIMULINK. Specifically, the modelsimulates: the MPEG video encoder; the channel coding op-erations, applied by a DVB-T transmitter, i.e., Reed Solomoncoding, convolutional encoding, interleaving, or the like; 64-QAM digital modulation and 2-K OFDM; transmission overan additive white Gaussian noise (AWGN) channel; demod-ulation, channel decoding and MPEG decoding; and errorconcealment of the detected damaged blocks, using motion-compensated temporal prediction [6].
The user can select any input video. The GUI displaysin real-time the original input video, the compressed video,the decoded video at the receiver before and after errorconcealment, and the error video (the difference between theoriginal and the decoded video at the receiver). Furthermore,the user can study the (baseband) OFDM spectrum of the re-ceived signal. The user can also change the models parametersduring the simulation. The level of AWGN in the transmissionchannel, specifically the corresponding SNR, can be manuallyspecified in order to observe the change in the bit error rateand the quality of the decoded video (either visually or basedon the calculated PSNR) due to transmission errors. The usercan specify the number of predicted frames after each I-frame,so as to understand how a damaged block propagates to futureframes, due to temporal prediction coding in MPEG. Theforward-error (de)coding modules of the (de)coder, as wellas the interleaving modules, can be disabled to study theireffect and significance. Finally, the user can observe the videoquality improvement introduced by the error concealmentmodule of the decoder. Unfortunately, there is no option forthe students to capture and process audio or video using theGUI and specialized hardware in real-time. The students canonly load previously-recorded audio and video segments. Asthese (especially video streaming) are rather computationallyexpensive activities, the speed of the GUI developed dependson the host PC. However, using a Pentium Core 2 at 3 GHz,the developed GUI can process audio and video segments ofreasonable resolution (e.g. 640× 480 pixels) at near real-time(approximately 10 frames per second).
Fig. 6. The DVB-T GUI with error concealment strategies.
V. MEDICAL IMAGE PROCESSING
A. Image Denoising
A great many image denoising methods can be foundin the literature, ranging from simple linear or non-linearlow-pass filtering to sophisticated non-linear methods, suchas transform coefficient shrinkage methods [16]–[18]. Theintroduction of the wavelet transform (WT) [9] has led todramatic progress in image denoising over recent decades.The use of non-separable space-frequency transforms, the so-called X-lets (e.g., ridgelets, curvelets, contourlets) [18], [19],in a similar coefficient-shrinkage manner, can lead to noisereduction methods with better edge-preserving characteristics.Recently, a whole new group of adaptive transformation meth-ods using independent component analysis (ICA) was intro-duced [17]. ICA-based image denoising operates similarly toany transform-based approach, by shrinkage of the transformcoefficients.
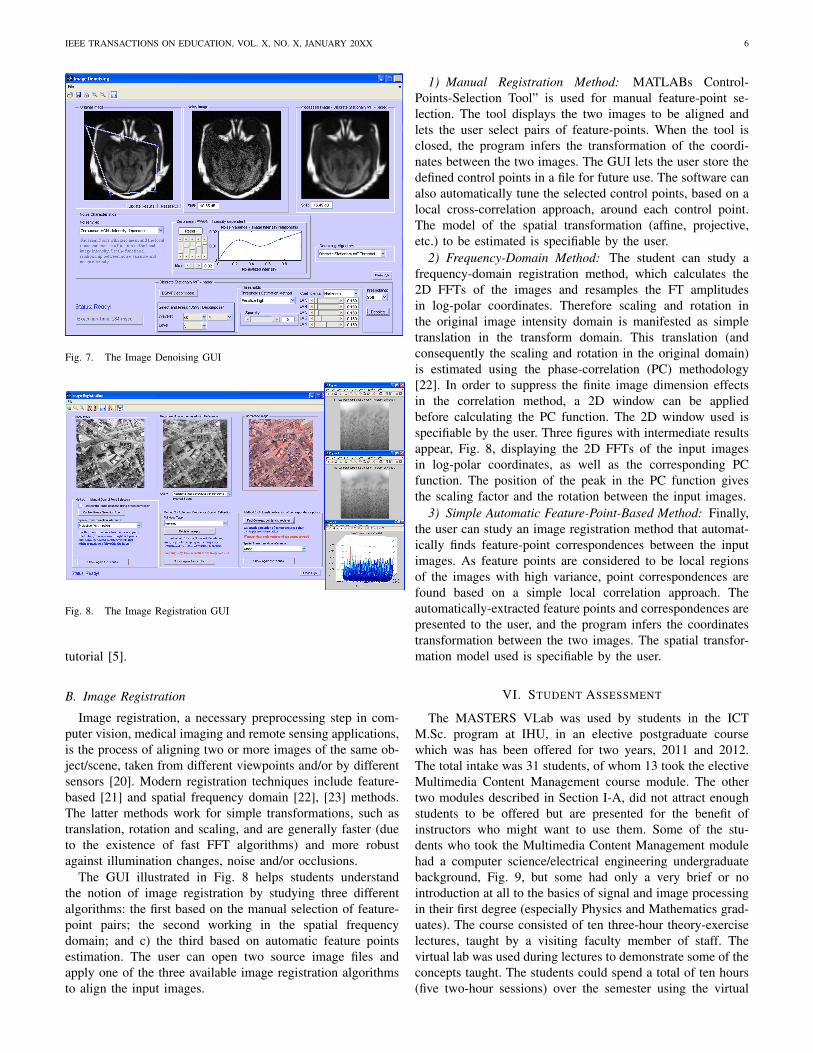
The GUI illustrated in Fig. 7 demonstrates the varioustypes of noise, the idea of image denoising and varioustypes of denoising algorithms. A user can open any inputimage, add noise of various types/characteristics to selectedregions of interest (ROIs) and finally apply the selecteddenoising algorithm. The available noise types include additivewhite Gaussian noise (AWGN), intensity-dependent additiveGaussian noise (AGN), Poisson, salt and pepper noise andmultiplicative noise. The appearance of the noise character-istics panel changes according to the noise type selected.Whenever the noise type or its parameters change, the noisyimage is automatically updated and the corresponding SNR isdisplayed. The user can then select the denoising algorithmto apply: simple low-pass filtering; wavelet transform (WT)-based denoising; contourlet transform (CoT)-based denois-ing; and independent component analysis (ICA)-based denois-ing. The form of the denoising algorithm parameters” panelchanges according to the selected denoising algorithm. Whenthe denoising algorithms parameters are specified and thealgorithm is applied, the denoised image and the correspondingSNR are displayed. More details on this GUIs operations andits specifiable parameters are available in the MASTERS VLab
IEEE TRANSACTIONS ON EDUCATION, VOL. X, NO. X, JANUARY 20XX 6
Fig. 7. The Image Denoising GUI
Fig. 8. The Image Registration GUI
tutorial [5].
B. Image Registration
Image registration, a necessary preprocessing step in com-puter vision, medical imaging and remote sensing applications,is the process of aligning two or more images of the same ob-ject/scene, taken from different viewpoints and/or by differentsensors [20]. Modern registration techniques include feature-based [21] and spatial frequency domain [22], [23] methods.The latter methods work for simple transformations, such astranslation, rotation and scaling, and are generally faster (dueto the existence of fast FFT algorithms) and more robustagainst illumination changes, noise and/or occlusions.
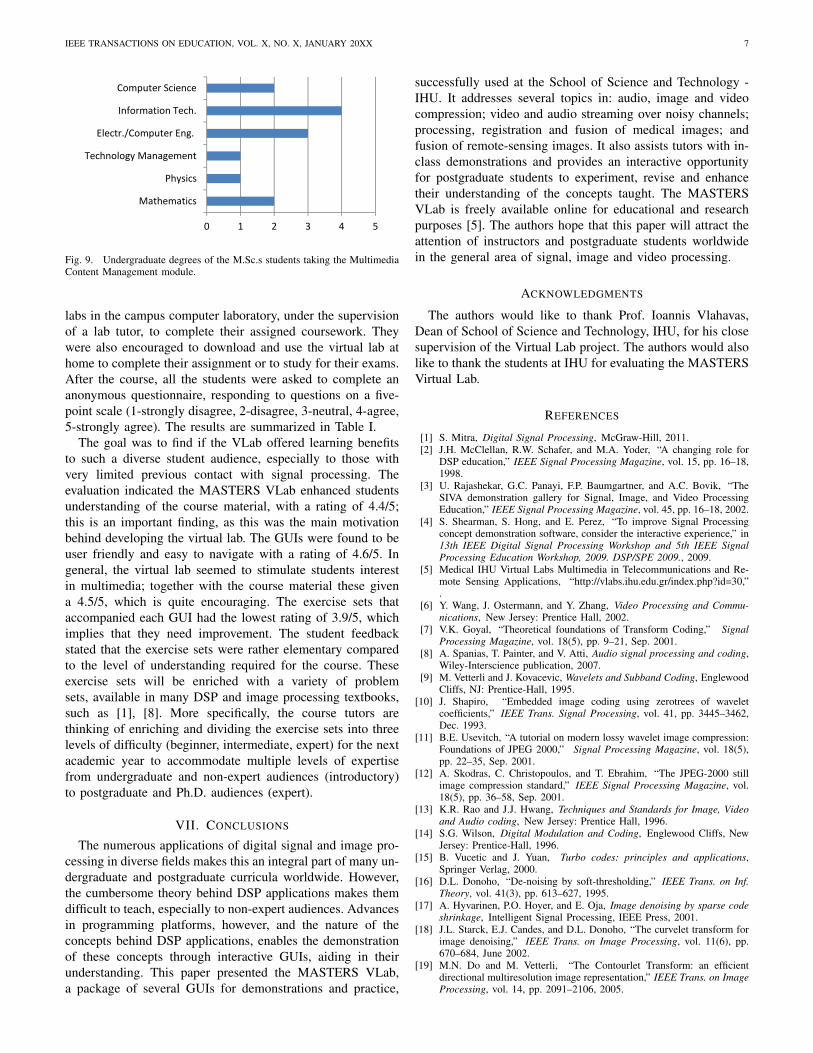
The GUI illustrated in Fig. 8 helps students understandthe notion of image registration by studying three differentalgorithms: the first based on the manual selection of feature-point pairs; the second working in the spatial frequencydomain; and c) the third based on automatic feature pointsestimation. The user can open two source image files andapply one of the three available image registration algorithmsto align the input images.
1) Manual Registration Method: MATLABs Control-Points-Selection Tool” is used for manual feature-point se-lection. The tool displays the two images to be aligned andlets the user select pairs of feature-points. When the tool isclosed, the program infers the transformation of the coordi-nates between the two images. The GUI lets the user store thedefined control points in a file for future use. The software canalso automatically tune the selected control points, based on alocal cross-correlation approach, around each control point.The model of the spatial transformation (affine, projective,etc.) to be estimated is specifiable by the user.
2) Frequency-Domain Method: The student can study afrequency-domain registration method, which calculates the2D FFTs of the images and resamples the FT amplitudesin log-polar coordinates. Therefore scaling and rotation inthe original image intensity domain is manifested as simpletranslation in the transform domain. This translation (andconsequently the scaling and rotation in the original domain)is estimated using the phase-correlation (PC) methodology[22]. In order to suppress the finite image dimension effectsin the correlation method, a 2D window can be appliedbefore calculating the PC function. The 2D window used isspecifiable by the user. Three figures with intermediate resultsappear, Fig. 8, displaying the 2D FFTs of the input imagesin log-polar coordinates, as well as the corresponding PCfunction. The position of the peak in the PC function givesthe scaling factor and the rotation between the input images.
3) Simple Automatic Feature-Point-Based Method: Finally,the user can study an image registration method that automat-ically finds feature-point correspondences between the inputimages. As feature points are considered to be local regionsof the images with high variance, point correspondences arefound based on a simple local correlation approach. Theautomatically-extracted feature points and correspondences arepresented to the user, and the program infers the coordinatestransformation between the two images. The spatial transfor-mation model used is specifiable by the user.
VI. STUDENT ASSESSMENT
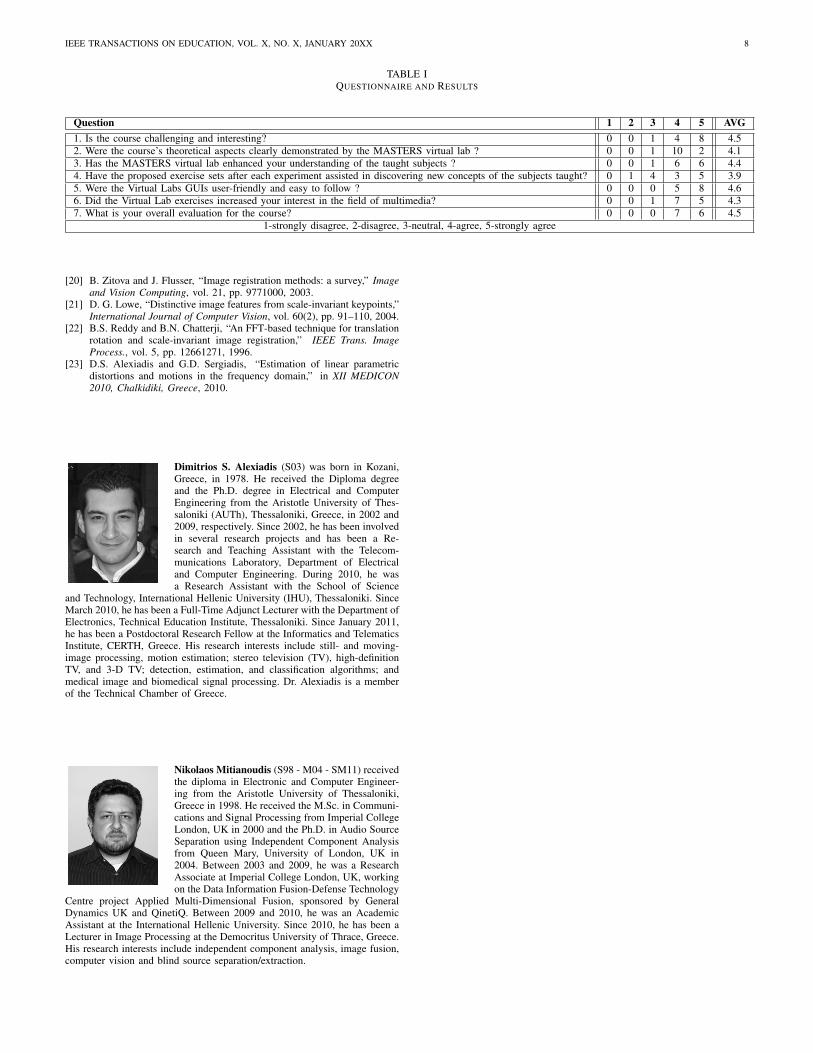
The MASTERS VLab was used by students in the ICTM.Sc. program at IHU, in an elective postgraduate coursewhich was has been offered for two years, 2011 and 2012.The total intake was 31 students, of whom 13 took the electiveMultimedia Content Management course module. The othertwo modules described in Section I-A, did not attract enoughstudents to be offered but are presented for the benefit ofinstructors who might want to use them. Some of the stu-dents who took the Multimedia Content Management modulehad a computer science/electrical engineering undergraduatebackground, Fig. 9, but some had only a very brief or nointroduction at all to the basics of signal and image processingin their first degree (especially Physics and Mathematics grad-uates). The course consisted of ten three-hour theory-exerciselectures, taught by a visiting faculty member of staff. Thevirtual lab was used during lectures to demonstrate some of theconcepts taught. The students could spend a total of ten hours(five two-hour sessions) over the semester using the virtual
IEEE TRANSACTIONS ON EDUCATION, VOL. X, NO. X, JANUARY 20XX 7
0 1 2 3 4 5
Mathematics
Physics
Technology Management
Electr./Computer Eng.
Information Tech.
Computer Science
Fig. 9. Undergraduate degrees of the M.Sc.s students taking the MultimediaContent Management module.
labs in the campus computer laboratory, under the supervisionof a lab tutor, to complete their assigned coursework. Theywere also encouraged to download and use the virtual lab athome to complete their assignment or to study for their exams.After the course, all the students were asked to complete ananonymous questionnaire, responding to questions on a five-point scale (1-strongly disagree, 2-disagree, 3-neutral, 4-agree,5-strongly agree). The results are summarized in Table I.
The goal was to find if the VLab offered learning benefitsto such a diverse student audience, especially to those withvery limited previous contact with signal processing. Theevaluation indicated the MASTERS VLab enhanced studentsunderstanding of the course material, with a rating of 4.4/5;this is an important finding, as this was the main motivationbehind developing the virtual lab. The GUIs were found to beuser friendly and easy to navigate with a rating of 4.6/5. Ingeneral, the virtual lab seemed to stimulate students interestin multimedia; together with the course material these givena 4.5/5, which is quite encouraging. The exercise sets thataccompanied each GUI had the lowest rating of 3.9/5, whichimplies that they need improvement. The student feedbackstated that the exercise sets were rather elementary comparedto the level of understanding required for the course. Theseexercise sets will be enriched with a variety of problemsets, available in many DSP and image processing textbooks,such as [1], [8]. More specifically, the course tutors arethinking of enriching and dividing the exercise sets into threelevels of difficulty (beginner, intermediate, expert) for the nextacademic year to accommodate multiple levels of expertisefrom undergraduate and non-expert audiences (introductory)to postgraduate and Ph.D. audiences (expert).
VII. CONCLUSIONS
The numerous applications of digital signal and image pro-cessing in diverse fields makes this an integral part of many un-dergraduate and postgraduate curricula worldwide. However,the cumbersome theory behind DSP applications makes themdifficult to teach, especially to non-expert audiences. Advancesin programming platforms, however, and the nature of theconcepts behind DSP applications, enables the demonstrationof these concepts through interactive GUIs, aiding in theirunderstanding. This paper presented the MASTERS VLab,a package of several GUIs for demonstrations and practice,
successfully used at the School of Science and Technology -IHU. It addresses several topics in: audio, image and videocompression; video and audio streaming over noisy channels;processing, registration and fusion of medical images; andfusion of remote-sensing images. It also assists tutors with in-class demonstrations and provides an interactive opportunityfor postgraduate students to experiment, revise and enhancetheir understanding of the concepts taught. The MASTERSVLab is freely available online for educational and researchpurposes [5]. The authors hope that this paper will attract theattention of instructors and postgraduate students worldwidein the general area of signal, image and video processing.
ACKNOWLEDGMENTS
The authors would like to thank Prof. Ioannis Vlahavas,Dean of School of Science and Technology, IHU, for his closesupervision of the Virtual Lab project. The authors would alsolike to thank the students at IHU for evaluating the MASTERSVirtual Lab.
REFERENCES
[1] S. Mitra, Digital Signal Processing, McGraw-Hill, 2011.[2] J.H. McClellan, R.W. Schafer, and M.A. Yoder, “A changing role for
DSP education,” IEEE Signal Processing Magazine, vol. 15, pp. 16–18,1998.
[3] U. Rajashekar, G.C. Panayi, F.P. Baumgartner, and A.C. Bovik, “TheSIVA demonstration gallery for Signal, Image, and Video ProcessingEducation,” IEEE Signal Processing Magazine, vol. 45, pp. 16–18, 2002.
[4] S. Shearman, S. Hong, and E. Perez, “To improve Signal Processingconcept demonstration software, consider the interactive experience,” in13th IEEE Digital Signal Processing Workshop and 5th IEEE SignalProcessing Education Workshop, 2009. DSP/SPE 2009., 2009.
[5] Medical IHU Virtual Labs Multimedia in Telecommunications and Re-mote Sensing Applications, “http://vlabs.ihu.edu.gr/index.php?id=30,”.
[6] Y. Wang, J. Ostermann, and Y. Zhang, Video Processing and Commu-nications, New Jersey: Prentice Hall, 2002.
[7] V.K. Goyal, “Theoretical foundations of Transform Coding,” SignalProcessing Magazine, vol. 18(5), pp. 9–21, Sep. 2001.
[8] A. Spanias, T. Painter, and V. Atti, Audio signal processing and coding,Wiley-Interscience publication, 2007.
[9] M. Vetterli and J. Kovacevic, Wavelets and Subband Coding, EnglewoodCliffs, NJ: Prentice-Hall, 1995.
[10] J. Shapiro, “Embedded image coding using zerotrees of waveletcoefficients,” IEEE Trans. Signal Processing, vol. 41, pp. 3445–3462,Dec. 1993.
[11] B.E. Usevitch, “A tutorial on modern lossy wavelet image compression:Foundations of JPEG 2000,” Signal Processing Magazine, vol. 18(5),pp. 22–35, Sep. 2001.
[12] A. Skodras, C. Christopoulos, and T. Ebrahim, “The JPEG-2000 stillimage compression standard,” IEEE Signal Processing Magazine, vol.18(5), pp. 36–58, Sep. 2001.
[13] K.R. Rao and J.J. Hwang, Techniques and Standards for Image, Videoand Audio coding, New Jersey: Prentice Hall, 1996.
[14] S.G. Wilson, Digital Modulation and Coding, Englewood Cliffs, NewJersey: Prentice-Hall, 1996.
[15] B. Vucetic and J. Yuan, Turbo codes: principles and applications,Springer Verlag, 2000.
[16] D.L. Donoho, “De-noising by soft-thresholding,” IEEE Trans. on Inf.Theory, vol. 41(3), pp. 613–627, 1995.
[17] A. Hyvarinen, P.O. Hoyer, and E. Oja, Image denoising by sparse codeshrinkage, Intelligent Signal Processing, IEEE Press, 2001.
[18] J.L. Starck, E.J. Candes, and D.L. Donoho, “The curvelet transform forimage denoising,” IEEE Trans. on Image Processing, vol. 11(6), pp.670–684, June 2002.
[19] M.N. Do and M. Vetterli, “The Contourlet Transform: an efficientdirectional multiresolution image representation,” IEEE Trans. on ImageProcessing, vol. 14, pp. 2091–2106, 2005.
IEEE TRANSACTIONS ON EDUCATION, VOL. X, NO. X, JANUARY 20XX 8
TABLE IQUESTIONNAIRE AND RESULTS
Question 1 2 3 4 5 AVG1. Is the course challenging and interesting? 0 0 1 4 8 4.52. Were the course’s theoretical aspects clearly demonstrated by the MASTERS virtual lab ? 0 0 1 10 2 4.13. Has the MASTERS virtual lab enhanced your understanding of the taught subjects ? 0 0 1 6 6 4.44. Have the proposed exercise sets after each experiment assisted in discovering new concepts of the subjects taught? 0 1 4 3 5 3.95. Were the Virtual Labs GUIs user-friendly and easy to follow ? 0 0 0 5 8 4.66. Did the Virtual Lab exercises increased your interest in the field of multimedia? 0 0 1 7 5 4.37. What is your overall evaluation for the course? 0 0 0 7 6 4.5
1-strongly disagree, 2-disagree, 3-neutral, 4-agree, 5-strongly agree
[20] B. Zitova and J. Flusser, “Image registration methods: a survey,” Imageand Vision Computing, vol. 21, pp. 9771000, 2003.
[21] D. G. Lowe, “Distinctive image features from scale-invariant keypoints,”International Journal of Computer Vision, vol. 60(2), pp. 91–110, 2004.
[22] B.S. Reddy and B.N. Chatterji, “An FFT-based technique for translationrotation and scale-invariant image registration,” IEEE Trans. ImageProcess., vol. 5, pp. 12661271, 1996.
[23] D.S. Alexiadis and G.D. Sergiadis, “Estimation of linear parametricdistortions and motions in the frequency domain,” in XII MEDICON2010, Chalkidiki, Greece, 2010.
Dimitrios S. Alexiadis (S03) was born in Kozani,Greece, in 1978. He received the Diploma degreeand the Ph.D. degree in Electrical and ComputerEngineering from the Aristotle University of Thes-saloniki (AUTh), Thessaloniki, Greece, in 2002 and2009, respectively. Since 2002, he has been involvedin several research projects and has been a Re-search and Teaching Assistant with the Telecom-munications Laboratory, Department of Electricaland Computer Engineering. During 2010, he wasa Research Assistant with the School of Science
and Technology, International Hellenic University (IHU), Thessaloniki. SinceMarch 2010, he has been a Full-Time Adjunct Lecturer with the Department ofElectronics, Technical Education Institute, Thessaloniki. Since January 2011,he has been a Postdoctoral Research Fellow at the Informatics and TelematicsInstitute, CERTH, Greece. His research interests include still- and moving-image processing, motion estimation; stereo television (TV), high-definitionTV, and 3-D TV; detection, estimation, and classification algorithms; andmedical image and biomedical signal processing. Dr. Alexiadis is a memberof the Technical Chamber of Greece.
Nikolaos Mitianoudis (S98 - M04 - SM11) receivedthe diploma in Electronic and Computer Engineer-ing from the Aristotle University of Thessaloniki,Greece in 1998. He received the M.Sc. in Communi-cations and Signal Processing from Imperial CollegeLondon, UK in 2000 and the Ph.D. in Audio SourceSeparation using Independent Component Analysisfrom Queen Mary, University of London, UK in2004. Between 2003 and 2009, he was a ResearchAssociate at Imperial College London, UK, workingon the Data Information Fusion-Defense Technology
Centre project Applied Multi-Dimensional Fusion, sponsored by GeneralDynamics UK and QinetiQ. Between 2009 and 2010, he was an AcademicAssistant at the International Hellenic University. Since 2010, he has been aLecturer in Image Processing at the Democritus University of Thrace, Greece.His research interests include independent component analysis, image fusion,computer vision and blind source separation/extraction.