ieee aerospace conference eo-1 hyperion imaging spectrometer ieee aerospace conference jay pearlman,...
TRANSCRIPT

The EO-1 Hyperion Imaging SpectrometerIEEE Aerospace Conference
Jay Pearlman, Carol Segal, Pamela Clancy, Neil Nelson,Peter Jarecke, Momi Ono, Debra Beiso, Lushalan Liao,Karen Yokoyama, and Steve Carman, TRWAndBill Browne, Lawrence Ong and Stephen Ungar, GSFC

2
Hyperion Hyperspectral Imager

3
Earth Orbiter - 1 Mission
Three revolutionary land imaginginstruments on EO-1 will collectmultispectral and hyperspectralscenes over the course of theEO-1 mission in coordinationwith the Enhanced ThematicMapper (ETM+) on Landsat-7.Detailed comparisons of theEO-1 and ETM+ images will becarried out to validate theseinstruments for follow-on missions.
Breakthrough technologies in lightweight materials, high performanceintegrated detector arrays and precision spectrometers will bedemonstrated in these instruments.

4
Hyperion Imaging Spectrometer
Convex Gratingspectrometers with CCDVNIR and HgCdTe SWIRdetectors (60µm pixels)
Multiple calibration options:lamps, lunar, solar, groundimaging and laboratory
Hyperspectral ImagingCapability to addresstechnology and EarthObservation applications

5
Advanced Land Imager (ALI)
•Objective is to validatepushbroom technologies forLandsat applications•Pushbroom MultispectralSensor - 9 multispectral (MS)channels and a pan channel•Spectral coverage enhancesLandsat ETM+ but excludesLWIR channel•Swath width is 37km and MSground resolution is 30m.•S/N is 100 or better

6
LEISA Atmospheric Corrector
Correction of multispectral surfaceimagery for atmospheric variability(water and aerosols).
High spectral, moderate spatialresolution (250m), large swath(180km) hyperspectral imager usingwedge filter technology
Spectral coverage of 0.89 - 1.6mm,bands selected for optimalcorrection of high spatial resolutionimages.

7
EO-1 Instrument Overviews
Parameters ALI HYPERION AC
Spectral Range 0.4 - 2.4 µm 0.4 - 2.5 µm 0.9 - 1.6 µm
Spatial Resolution 30 m 30 m 250 m
Swath Width 36 Km 7.5 Km 185 Km
Spectral Resolution Variable 10 nm 6 nm
Spectral Coverage Discrete Continuous Continuous
Pan Band Resolution 10 m N/A N/A
Total Number of Bands 10 220 256
EO-1

8
HSA, HEA and CEA locations on the EO-1 nadir deck
Hyperion Spacecraft Accommodation
HyperionElectronicsAssembly
(HEA)
Hyperion Sensor Assembly(HSA)
CryocoolerElectronicsAssembly
(CEA)

9
EO-1 Spacecraft Prepared for Launch

10
Hyperion Swath
N
Landsat 7ETM+
EO-1ALI
EO-1Atmospheric
CorrectorEO-1
Hyperion
Swath is 7.5km wide; standard “image cube” is 20km long by 7.5km wide

Hyperspectral and Multispectral SceneCharacterization
Wavelength
Mea
sure
d R
efle
ctan
ce
Band 3
Band 4
Band 2
Band 1
Wavelength
Mea
sure
d R
efle
ctan
ce
Wavelength
Ref
lect
ance
Spectral characteristic of scene
Hyperspectral ImagingHundreds of bands
Multispectral ImagingFew bands

Hyperspectral Imaging Applications & Benefits
Existing SatelliteCapabilities (SPOT,
Application LandSat) Potential for HSI Perceived Benefits
Mining/Geology Land cover classification More Detailed mineral More Accurate remotemineral mapping exploration
Forestry Land cover classification Species ID Forest health/infestationsDetail stand mapping Forest productivity/yieldFoliar chemistry analysisTree stress Forest inventory/harvest
planning
Agriculture Land cover classification Crop differentiation Yield prediction/commoditiesLimited crop mapping Crop stress crop health/vigorSoil mapping
Environmental Resource meeting Chemical/mineral Contaminant MappingManagement Land use monitoring mapping & analysis Vegetation Stress

13
Hyperion12 months from order to delivery
Hyperion Hyperspectral Imager
The Hyperion is a push-broom imagerwith:
• 220 10nm bands covering thespectrum from 400nm - 2500nm
• 6% absolute radiometric accuracy• Image swath width of 7.5 km• IFOV of 42.4 microradian• GSD of 30 m at 705 km altitude• 12-bit image data• Power: 51W orbit avg.,
126W peak• Mass: 49kg• On year Life (2 year Goal)

14
Hyperion Subassemblies
HyperionElectronicsAssembly (HEA)
CryocoolerElectronicsAssembly(CEA) Hyperion Sensor Assembly (HSA)

15
Parameter HyperionVolume (L x W x H, cm) 39x75x66Weight (Kg) 49Avg Power (W) 51Peak Power (W) 126Aperture (cm) 12IFOV (mrad) 0.043Crosstrack FOV (deg) 0.63Wavelength Range (nm) 400 - 2500Spectral Resolution (nm) 10No. Spectral Bands 220Digitization 12Frame Rate (Hz) 225Typical SNR 65 - 130
Hyperion Characteristics

Performance Characterization –Pre-Launch

17
Properties Characterized
Radiometric CalibrationFPA Rectilinearity
• Spatial Co-Registration of Spectral Channels• Cross-Track Spectral Alignment
Image Quality• Cross-track and Along-track MTF• Spectral Slit Profile
Spectral ResponseSpectral CalibrationScene SimulationVNIR Noise BifurcationSWIR FPA Dark Field StabilityEcho CorrectionPolarization

18
Hyperion Specifications (1)
Specification Item Performance MeasurementsGSD 29.88 mSwath 7.5 km (0.61 degrees TFOV)Spectral coverage VNIR: 400 - 1000nm
SWIR: 900 - 2500nmImaging aperture 12.4968 cm (4.92 in.)VNIR SNR 550 - 700nm 144 - 161SWIR SNR 1000 - 1050nm 90SWIR SNR 1200 - 1250nm 110SWIR SNR 1550 - 1600nm 89SWIR SNR 2100 - 2150nm 40On-Orbit lifeIFOV 42.4 µrad
1 year

19
Specification Item Performance MeasurementsVNIR MTF @ 450nm 0.27 - 0.30VNIR MTF @ 630nm 0.27 - 0.31VNIR MTF @ 900nm 0.25 - 0.27SWIR MTF @ 1050nm 0.25 - 0.29SWIR MTF @ 1250nm 0.24 - 0.29SWIR MTF @ 1650nm 0.23 - 0.27SWIR MTF @ 2200nm 0.24 - 0.27Number of spectral channels 220SWIR spectral bandwidth 10.08 -10.09 nmVNIR spectral bandwidth 10.11 - 10.13 nmVNIR Cross-track spectral error 2.8 nm @ 655nm
Hyperion Specifications (2)

20
Hyperion Specifications (3)
Specification Item Performance MeasurementsSWIR Cross-track spectralerror (typical)
0.6 nm @ 1700nm
Spatial co-registration of pixel (typical)
VNIR18% pix @ FOV Pix #126
SWIR21% pix @ FOV Pix #131
Absolute radiometricaccuracy (1 sigma) <6%.
12-bitData Quantization

21
Hyperion Radiometric Characterization
Lamp Image Relay (Light Pipe)
Monochrometer
SteeringMirror
Off-AxisParabola
FoldMirror
Detector
Off AxisParabolaPrecision
Aperture
Transfer Radiometer or Hyperion
PrecisionPinhole
SpectralonPanel
Two modes of Operation:
1) Pinhole, slit and/or KnifeEdge at end of light pipe putat focus of Off-axis Parabola(OAP)
2) End of light pipe is re-imaged onto Spectralonpanel. Both are shownsimultaneously in chartwithout re-imagingoptics
• Transfer radiometer is removable box for calibration ofsource
• Radiometer uses chopped pyroelectric detector
• Accurate AΩ is calculated from precision apertures andOAP focal length
Steering mirror is a twoaxis, fine pointing mirror( ± 1-2 mrad) for sub-pixelscanning in spatialdimensions

22
Spectralon Panel Calibration
0.25 meterSpectrometer Panel
FEL Lamp
VacuumChamber Wall
HyperionInstrument
TransferRadiometer
SiO2 Vacuum Window
Removed for HyperionIllumination

23
Spectralon Panel AssemblyInstalled

24
Spectralon Panel AssemblyInstalled
Black Panel OverWhite ChamberWall
FEL 1000Watt Lamp
ChamberWindowCovered
Back ofSpectralonPanel
Gold PlatedBaffle

25
Calibration Flowchart
Lamp Spectralon
AΩPyroelectricReferenceDetector
Silicon PhotodiodeTrap Detector
ComponentMeasurement Data Analytical Model
Hyperion Instrument Instrument SpectralResponsivity
In-flightCalibration
Source
NIST GoldStandard
Black Body
SolidState
SiliconDiode
Physics
1
23
Calibration StandardsTransfers are:1. Silicon Photodiode Trap Detector to
Pyroelectric Reference Detector (PRD) inWatts
2. PRD to Lamp in Irradiance
3. PRD/ AΩ Ω Ω Ω to Spectralon plate in Radiance

26
Hyperion SNR
550 nm 650 nm 700 nm 1025 nm 1225 nm 1575 nm 2125 nm161 144 147 90 110 89 40
Hyperion Measured SNR
SNR
0
50
100
150
200
400 700 1000 1300 1600 1900 2200 2500Wavelength (nm)
SNR
MeasuredVNIR ModelSWIR Model
Radiometric performance model basedon 60o Solar zenith angle, 30% albedo,standard scene
27
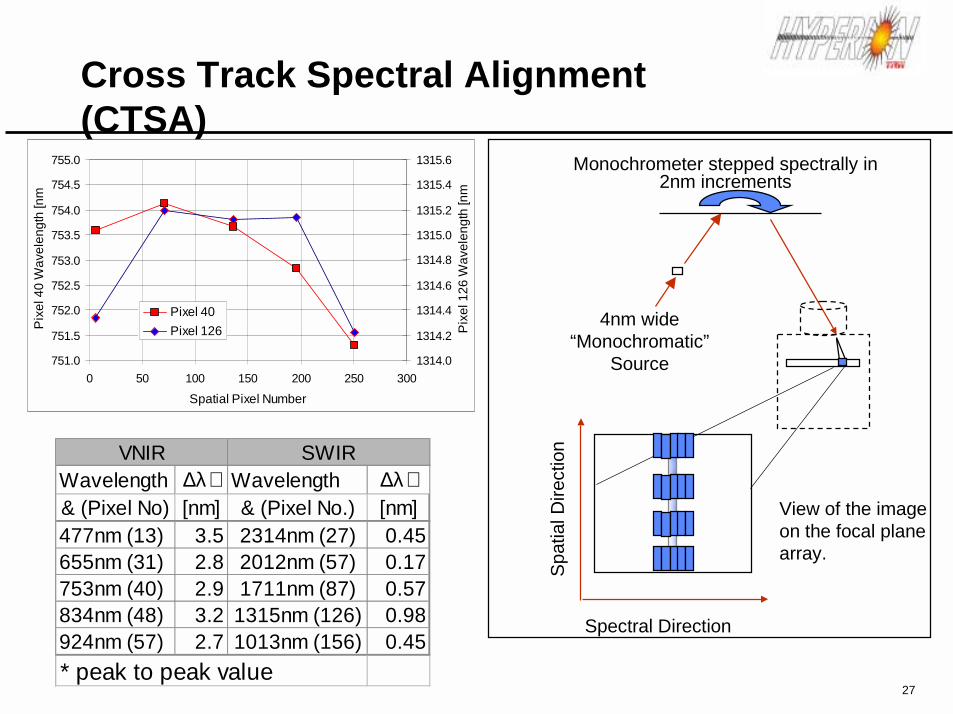
Cross Track Spectral Alignment(CTSA)
4nm wide“Monochromatic”
Source
Monochrometer stepped spectrally in2nm increments
Spat
ial D
irect
ion
Spectral Direction
View of the imageon the focal plane array.
751.0
751.5
752.0
752.5
753.0
753.5
754.0
754.5
755.0
0 50 100 150 200 250 300
Spatial Pixel Number
Pix
el 4
0 W
avel
engt
h [n
m
1314.0
1314.2
1314.4
1314.6
1314.8
1315.0
1315.2
1315.4
1315.6
Pix
el 1
26 W
avel
engt
h [n
m
Pixel 40Pixel 126
Wavelength ∆λ∗ Wavelength ∆λ∗& (Pixel No) [nm] & (Pixel No.) [nm]477nm (13) 3.5 2314nm (27) 0.45655nm (31) 2.8 2012nm (57) 0.17753nm (40) 2.9 1711nm (87) 0.57834nm (48) 3.2 1315nm (126) 0.98924nm (57) 2.7 1013nm (156) 0.45* peak to peak value
VNIR SWIR

28
Image Quality - MTFKnife Edge Data
0.000.200.400.600.801.00
-4 -2 0 2 4 6Crosstrack Pixel Location
Nor
mal
ized
Inte
nsity
Point Spread Function (PSF)
0.0
0.20.4
0.60.8
1.0
-6 -4 -2 0 2 4 6
Crosstra ck Pix e l Num be r
System MT F (Fourier Transform of PSF)
0.000.200.400.600.801.001.20
0.0 0.5 1.0 1.5 2.0 2.5 3.0
Spatia l Frequency (1/pixe l)
Nyquist frequency at 1/2
Measured using knife-edge MTFtechnique:
• Knife-edge positioned at imagerelay focus with edgeperpendicular to the slit ofspectrometer
• Knife-edge illuminated withbroadband light source
• Over-sampling by tilting steeringmirror in fractional-pixel steps
• Fourier transform of the PointSpread Function (PSF) producesCross-track MTF (CT-MTF)
• Along-track direction MTFequals of the cross trackvalue π
2

29
0.0000.100
0.2000.3000.400
0.5000.600
300 500 700 900 1100
VNIR MeasurementModel calculation (LLS fit with 4 parameters)
Rel
ativ
e S
enso
r Res
pons
e
Spectral Wavelength Calibration
Reflectance Spectra of Doped Spectralon
Spec
tralo
n R
efle
ctiv
ity
0.4
0.6
0.8
1.0
1.2
1.4
1.6
200 400 600 800 1000 1200 1400 1600 1800 2000Wavelength (nm)
Erbium (offset by 0.5)
Holmium
Wavelength (nm)
Process:1. Two data frames taken:
• Doped Spectralon• Un-doped Spectralon
2. Ratio of frames removeslamp source wavelength andsensor response variations
3. High resolution scans areconvolved with sensorspectral response function
4. Linear least squaresregression using secondorder fit in λ versus pixelnumber determines sensorwavelength calibration(accuracy ~ 0.02 pixels)
High resolution scans of Holmium and Erbium Oxide doped Spectralon

30
VNIR Spectral Response
VNIR Channel Center Wavelengths (nm, accuracy +/- 0.5 nm)Spectral Channel
FOV #13 31 40 48 57
6 477.4 656.5 753.6 834.3 925.471 478.5 657.5 754.1 834.9 925.1
136 478.0 656.8 753.7 834.4 925.3196 476.8 655.7 752.8 833.4 924.4251 475.2 654.6 751.3 831.9 922.8
VNIR FWHM of Spectral Response Functions (nm)Spectral Channel
FOV #13 31 40 48 57
6 11.2 10.5 10.6 11.1 11.171 11.6 10.4 10.9 11.3 11.3
136 11.3 10.3 10.7 11.3 11.3196 11.4 10.2 10.7 11.4 11.3251 11.3 10.2 10.6 11.3 11.2

31
SWIR Spectral Response
SWIR channel Center Wavelengths (nm +/- 0.5 nm)Specral Channel
FOV #27 57 87 126 156
6 2314.1 2012.2 1711.2 1314.3 1013.371 2314.2 2012.1 1711.4 1315.2 1013.2
136 2314.0 2012.2 1711.6 1315.1 1013.2196 2313.9 2012.1 1711.6 1315.1 1013.2251 2313.7 1711.1 1314.2 1012.9
SWIR FWHM of Spectral Response Function (nm)Special Channel
FOV #27 57 87 126 156
6 10.4 10.6 11.6 10.6 10.771 10.5 10.8 11.4 10.6 11.1
136 10.4 10.9 11.8 10.8 11.2196 10.5 11.1 11.6 10.8 11.2251 10.2 11.3 10.6 11.1

32
Polarization
Polarizer located justoutside of the vacuumwindow
Data taken at 15 degreesteps in polarization angle
Scene response averagedover spatial channels 171-256 for each spectralchannel
Results are in PercentPolarization
Wav
elen
gth
(nm
)
SWIR Response
0 50 100 150 200 250 300
2200
1800
1400
1000-5-4-3-2-1012345
VNIR Response W
avel
engt
h [n
m]
0 50 100 150 200 250 300 350
500
600
700
800
900
1000-5-4-3-2-1012345
Polarizer Angle [degrees]
%Polarization
%Polarization

33
Starburst Image (from End to End Test)
Radiometricallycorrected
Uncorrected Data
Image is created bytranslating a“starburst” patternacross the Hyperionslit simulating satellitemotion.
Starburst pattern usedas an alternativetechnique to assessMTF characteristics

Performance Characterization –On-Orbit -- Preliminary Results

35
Spectral Calibration using Internal Calibration System
Examples of absorptionlines of the white paint

36
Hyperion Image of Fairfax, VA December2000
Golf Course Turf
Athletic Field
Dormant Trees
Image taken by Hyperion shows the relativechlorophyll content of vegetation in Fairfax County.The spectral profiles indicate healthy grass in theathletic field and golf course. The spectral profile ofthe trees indicates dormant vegetation.
Oxygen in the atmosphere is detected by the spectralprofiles in the near infrared wavelength.
Vegetation
0
0.2
0.4
0.6
0.8
1
500 550 600 650 700 750 800
Wavelength (nm)
Rel
ativ
e In
tens
ity
Athletic Field
Dormant Trees
Golf Course Turf
Oxygen Line

37
Verrazano-Narrows Bridge, New York
Noteclearlydefinedshadow ofbridge

38
Lake Frome Calibration Site

39
Applying Calibration:Repeatability
50 % CompleteSolar Calibration DCEs indicate instrument repeatabilityDuplicate ground images may also be used to verify repeatability based on Top ofAtmosphere Radiance, EX: Mt. Fitton, Saharan
Day 362 Day 362 Day 012Day 012
VNIR: 630 nm 549 nm 487 nm SWIR: 2358 nm 2327 nm 2206 nm

40
MTF Examples
Port Eglin Day 359
-10 -5 0 5 100
20
40
60
80
100
120
140
160
180
Interlaced bridge images and curve-fit from band 40
line 220 line 225 line 230 line 235 line 240 Curve-Fit
0 1 2 3 4 50
0.1
0.2
0.3
0.4
0.5
0.6
0.7
0.8
0.9
1
MTF from curve-fit: 0.42164
Direct MTF: 0.388
Direct MTF with window: 0.41676
MTF
Normalized Frequency
Crosstrack MTF calculated from Mid-Bay bridge for band 40
Scene crosstrack MTF: 0.41Ground measurement: 0.34 - 0.44
41
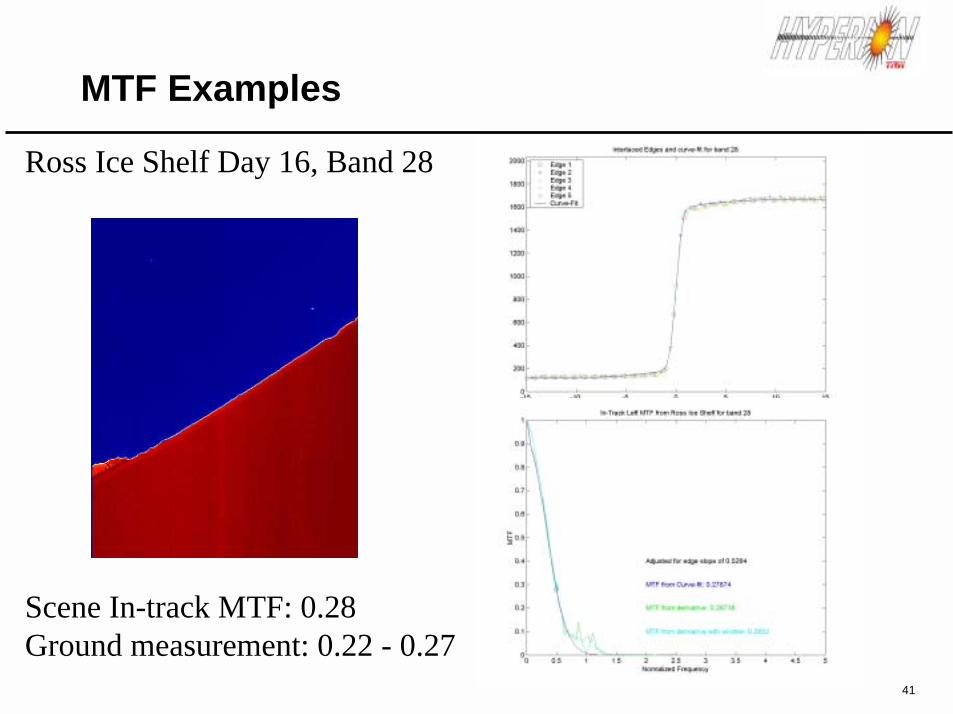
MTF Examples
Ross Ice Shelf Day 16, Band 28
Scene In-track MTF: 0.28Ground measurement: 0.22 - 0.27

42
Active Illumination with 3 Lamps
On the night of December 10,2000 three Xenon lampsspaced linearly 160 metersapart were directed at EO-1from Edwards AFB. Highclouds were present duringthe test.The spotlight spectrum hassharp lines for spectralcalibration and a broadspectrum for spatialcoregistration.This was very early in theEO-1 mission while pointingwas being established.Spotlights were seen byLandsat-7 and ALI.
Predicted Satellite Irradiance
0.00E+001.00E-072.00E-073.00E-074.00E-075.00E-07
350 850 1350 1850 2350wavelength [nm]
Spec
tral
Irrad
ianc
e [W
/m^2
-m
icro
n]
Landsat-7 PAN image ALI PAN image

43
Expanded View of ALI data
134
137
140
143
146
149
152
155
158
161
164
167
170
173
176 5799
5807
0
500
1000
1500
2000
2500
3000
300
* Rad
ianc
e
X
Y

44
14 Lamp Active IlluminationConfiguration
The expandedconfiguration allowstesting of MTF, spatialcoregistration, spectralaccuracy, GSD andartifact correction.
Experiment wasscheduled for Jan 10,2000 but had to berescheduled due toweather and pointinguncertainty.• Results should be
available by May 2001
Hyperion Swath Width = 7.68 km
1420.001420.00 1420.00 1420.002000.00
14 SpotlightConfiguration
160.00
160.00
160.00 160.00
5.33 GSD
5.33 GSD
5.33 GSD 5.33 GSD
1 GSD = 30 meters
MTF Array Detail
EnlargementOf 3x3 matrix

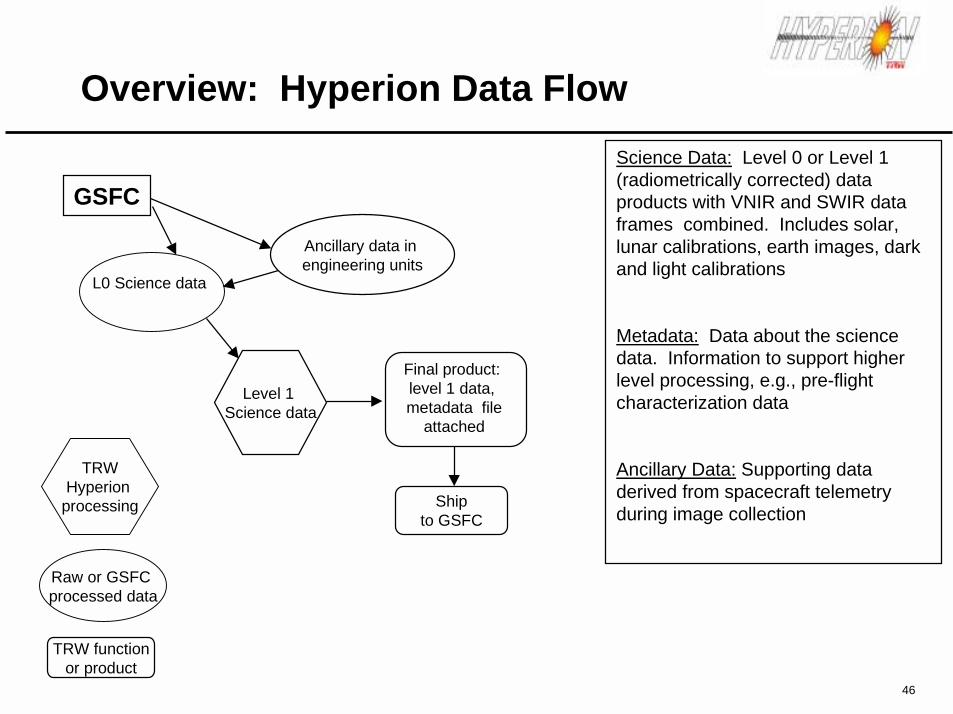
Hyperion Data Processing
46
Final product:level 1 data,
metadata file attached
Overview: Hyperion Data Flow
L0 Science data
TRWHyperion
processing
Raw or GSFC processed data
TRW functionor product
Level 1 Science data
Shipto GSFC
Ancillary data in engineering units
Science Data: Level 0 or Level 1(radiometrically corrected) dataproducts with VNIR and SWIR dataframes combined. Includes solar,lunar calibrations, earth images, darkand light calibrations
Metadata: Data about the sciencedata. Information to support higherlevel processing, e.g., pre-flightcharacterization data
Ancillary Data: Supporting dataderived from spacecraft telemetryduring image collection
GSFC

47
X-bandScience
Data
Hyperion Data Flow
• Level-1 ALI & AC Processing
• Science Data Archive• Data Distribution• Image Assessment• Calibration
EO-1 ScienceValidation
Facility
HyperionSupport
• Process to level 1 data• Performance monitoring
Mission Operations Center (MOC)
Data Processing System (DPS)
Tape Handling and Data
Distribution
Mission PlanningOffice
TRW
GSFC
GSFC
GSFC
Long TermArchive?