identification of modeling approaches to support common
TRANSCRIPT
ORNL/LTR-2015/289
Identification of Modeling Approaches To Support Common-Cause Failure Analysis
Kofi Korsah Richard Wood June 2015 Approved for public release. Distribution is unlimited.

DOCUMENT AVAILABILITY Reports produced after January 1, 1996, are generally available free via US Department of Energy (DOE) SciTech Connect. Website http://www.osti.gov/scitech/ Reports produced before January 1, 1996, may be purchased by members of the public from the following source: National Technical Information Service 5285 Port Royal Road Springfield, VA 22161 Telephone 703-605-6000 (1-800-553-6847) TDD 703-487-4639 Fax 703-605-6900 E-mail [email protected] Website http://www.ntis.gov/help/ordermethods.aspx Reports are available to DOE employees, DOE contractors, Energy Technology Data Exchange representatives, and International Nuclear Information System representatives from the following source: Office of Scientific and Technical Information PO Box 62 Oak Ridge, TN 37831 Telephone 865-576-8401 Fax 865-576-5728 E-mail [email protected] Website http://www.osti.gov/contact.html
This report was prepared as an account of work sponsored by an agency of the United States Government. Neither the United States Government nor any agency thereof, nor any of their employees, makes any warranty, express or implied, or assumes any legal liability or responsibility for the accuracy, completeness, or usefulness of any information, apparatus, product, or process disclosed, or represents that its use would not infringe privately owned rights. Reference herein to any specific commercial product, process, or service by trade name, trademark, manufacturer, or otherwise, does not necessarily constitute or imply its endorsement, recommendation, or favoring by the United States Government or any agency thereof. The views and opinions of authors expressed herein do not necessarily state or reflect those of the United States Government or any agency thereof.
ORNL/LTR-2015/289
Electrical and Electronics Systems Research Division Reactor and Nuclear Systems Division
Identification of Modeling Approaches To Support Common-Cause Failure Analysis
Kofi Korsah Richard Wood
Date Published: June 2015
Prepared by OAK RIDGE NATIONAL LABORATORY
Oak Ridge, Tennessee 37831-6283 managed by
UT-BATTELLE, LLC for the
US DEPARTMENT OF ENERGY under contract DE-AC05-00OR22725

vi
CONTENTS
Page CONTENTS .................................................................................................................................................. v ACKNOWLEDGMENTS .......................................................................................................................... vii ABSTRACT ................................................................................................................................................. ix 1. INTRODUCTION .................................................................................................................................. 1
1.1 Technical Issue .............................................................................................................................. 1 1.2 Research Approach ....................................................................................................................... 2
2. GENERAL APPROACH TO FAILURE MODELING ......................................................................... 3 3. ELEMENTS OF HARDWARE/SOFTWARE SYSTEM RELIABILITY MODELS .......................... 7 4. GENERIC APPROACH TO RELIABILITY MODELING OF DIGITAL I&C SYSTEMS ................ 9 5. DYNAMIC MODELING APPROACH .............................................................................................. 11 6. SUMMARY OVERVIEW ................................................................................................................... 13 7. REFERENCES ..................................................................................................................................... 15

Page intentionally blank

viii
ACKNOWLEDGMENTS
The research described in this report was sponsored by the Nuclear Energy Enabling Technologies (NEET) Advanced Sensors and Instrumentation (ASI) Program of the U.S. Department of Energy (DOE) Office of Nuclear Energy.
The authors wish to thank the technical peer reviewers and editorial staff at Oak Ridge National
Laboratory for their feedback and assistance in improving this report.

Page intentionally blank
x
ABSTRACT
Experience with applying current guidance and practices for common-cause failure (CCF)
mitigation to digital instrumentation and control (I&C) systems has proven problematic, and the regulatory environment has been unpredictable. The impact of CCF vulnerability is to inhibit I&C modernization and, thereby, challenge the long-term sustainability of existing plants. For new plants and advanced reactor concepts, the issue of CCF vulnerability for highly integrated digital I&C systems imposes a design burden resulting in higher costs and increased complexity. The regulatory uncertainty regarding which mitigation strategies are acceptable (e.g., what diversity is needed and how much is sufficient) drives designers to adopt complicated, costly solutions devised for existing plants.
The conditions that constrain the transition to digital I&C technology by the U.S. nuclear industry
require crosscutting research to resolve uncertainty, demonstrate necessary characteristics, and establish an objective basis for qualification of digital technology for usage in Nuclear Power Plant (NPP) I&C applications. To fulfill this research need, Oak Ridge National Laboratory is conducting an investigation into mitigation of CCF vulnerability for nuclear-qualified applications. The outcome of this research is expected to contribute to a fundamentally sound, comprehensive technical basis for establishing the qualification of digital technology for nuclear power applications.
This report documents the investigation of modeling approaches for representing failure of I&C
systems. Failure models are used when there is a need to analyze how the probability of success (or failure) of a system depends on the success (or failure) of individual elements. If these failure models are extensible to represent CCF, then they can be employed to support analysis of CCF vulnerabilities and mitigation strategies. Specifically, the research findings documented in this report identify modeling approaches that can be adapted to contribute to the basis for developing systematic methods, quantifiable measures, and objective criteria for evaluating CCF vulnerabilities and mitigation strategies.

Page intentionally blank
1. INTRODUCTION
The U.S. Department of Energy (DOE) Office of Nuclear Energy (NE) established the Advanced Sensors and Instrumentation (ASI) technology area under the Nuclear Energy Enabling Technologies (NEET) Program to coordinate the instrumentation and controls (I&C) research across DOE-NE and to identify and lead efforts to address common needs. As part of the NEET ASI research program, the Digital Technology Qualification project was established based on collaboration between Oak Ridge National Laboratory (ORNL) and Idaho National Laboratory (INL). ORNL is performing an investigation into mitigation of digital common-cause failure (CCF) vulnerability for nuclear-qualified applications, and INL is conducting an investigation into the suitability of digital alternatives to analog sensors, control loops, and actuators. ORNL is responsible for integrating the technical findings and research products of this collaborative effort.
This technical report documents recent findings from research activities by ORNL. Specifically, the
report describes the modeling approaches that may be extensible to represent CCF vulnerability for investigation and analysis. 1.1 Technical Issue
Although digital technology can provide substantial benefits in terms of performance and reliability, the U.S. nuclear power industry has been slow to adopt the technology extensively in its I&C applications. This condition is the result of inhibiting factors such as regulatory uncertainty, insufficient technological experience base, implementation complexity, limited availability of nuclear-qualified products and vendors, and inadequate definition of modernization cost recapture. Key issues, such as software quality and mitigation of CCF vulnerability, have led to the imposition of complex, costly design conventions and implementation practices that challenge the qualification of digital technology for high-integrity nuclear power plant (NPP) applications and constrain the benefits that can be achieved through the transition to digital.
Design criteria for safety-related I&C systems embody principles such as high quality, integrity,
reliability, independence, and qualification to ensure that safe conditions are maintained under all operational conditions. Separation and redundancy, physical barriers, and electrical isolation are commonly applied as design measures within a defense-in-depth concept to address potential vulnerabilities related to single failures of equipment and the propagation of failure effects. However, errors, deficiencies, or defects at any stage of a system’s life cycle can result in systematic faults that may remain undetected until operational conditions activate the faulted state to result in a failure of a critical function. The potential for CCF of multiple systems constitutes the principal credible threat to defeating the defense-in-depth provisions within I&C system architectures of NPPs. The unique characteristics and inherent complexity of digital I&C systems can exacerbate this vulnerability.
Diverse and defensive design measures are the primary means employed to address CCF
vulnerability. However, the benefits of various strategic approaches for design, implementation, and architecture are not well understood. The lack of technical certainty results in the imposition of complex (and costly) expedient solutions that inhibit the use of digital technology and complicate its regulatory acceptance. The impact of this uncertainty cuts across existing, new and future plants. Consequently, diversity and defense in depth (D3) has been identified as a high-priority technical issue for the nuclear power industry by both the Digital I&C Steering Committee of the U.S. Nuclear Regulatory Commission (NRC) and the Industry Digital I&C and Human Factors Working Group of the Nuclear Energy Institute (NEI) [1].
2
1.2 Research Approach
Without a quantitative assessment capability, the nuclear power industry is limited to the more-subjective assessments and best-practice remediation that are currently employed to provide reasonable assurance that adequate CCF mitigation is attained. To resolve this situation, more thorough definition of CCF vulnerability and mitigation techniques must be developed, along with suitable metrics and measure. Specifically, there are no readily available models on which to develop systematic methods, quantifiable measures, and objective criteria for evaluating CCF mitigation approaches.
The starting point for this research involved investigating diversity approaches and experience from
the international nuclear power industry as well as other industries and organizations, capturing expert knowledge and lessons learned, determining best practices, and evaluating the knowledge gaps that remain [2]. Subsequently, the research established a taxonomy to provide the fundamental basis for characterizing and analyzing CCF vulnerability and for assessing the suitability for various mitigation strategies [3]. The resulting CCF taxonomy can serve as the foundation for a rigorous identification of fault types and triggers to enable a thorough, systematic evaluation of CCF vulnerability and allow for comprehensive determination of effective mitigation techniques with the goal of substantially reducing the potential for CCF in NPP I&C systems. The current step in the research involves identification of modeling approaches that can be used to represent CCF and support analysis of vulnerabilities and mitigation strategies.
In general, failure models are used when there is a need to analyze how the probability of success of
a system (e.g., the ability of a safety system to effect a reactor shutdown when required) depends on the success of individual elements (i.e. the various independent and/or redundant subsystems making up the safety system). System-level failure models can be complex and various approaches may be used, depending on the goal of the modeling and the granularity of desired information. For example, the goal of the modeling effort may be one of the following types.
• Reliability Modeling: The goal of reliability modeling is to answer the question “What are the chances that the system will perform its function as long as it is needed?”
• Availability Modeling: Availability modeling attempts to answer the question, “Can the system be used now?”
• Safety Modeling: The goal of safety modeling is to answer the question, “What are the consequences if the system fails?”
• Maintainability Modeling: Maintainability modeling strives to answer the question, “How easy is it to fix the system if it breaks?”
This report focuses on approaches to reliability modeling of I&C systems. These models were judged
to be the most extensively developed and are deemed to be most suitable for extension to treat CCF.
3
2. GENERAL APPROACH TO FAILURE MODELING
There are two basic approaches to modeling component/product failures: Black-Box Modeling and White-Box Modeling. In Black-Box modeling (also known as data-based or empirical modeling), the modeling process is based either on complete or censored data (where relevant information is only partially available) for similar items. The black box approach is used when there is very little understanding of the different mechanisms that lead to product failure or when the unit is too complex.
In White-Box modeling (also known as physics-based modeling), the failure modeling at the
component level is based on the different mechanisms that lead to failure. At the product level, the failure is analyzed in terms of the failures of the different components. This form of modeling requires an understanding of the physics of failure.
In practice, modeling of a (large) system will typically incorporate elements or features of both
approaches. White-Box modeling depends largely on the details of the system under study. Black-Box modeling depends on the availability of failure data. Given the more generic applicability of Black-Box modeling, a discussion follows of the general steps involved.
As noted, in Black-Box modeling, the data required for the modeling can be complete, censored or
truncated [4]. In the case of complete data, the data relates to the age at failure. With censored data, the lifetimes are only known to exceed some value(s). Censored data may result from the item not having failed during the period of observation and hence still being operational for a certain length of time afterwards. “Grouped data” are data resulting from the failure of items over different disjoint time intervals. When failures of different components are pooled together, the result is “grouped data.”
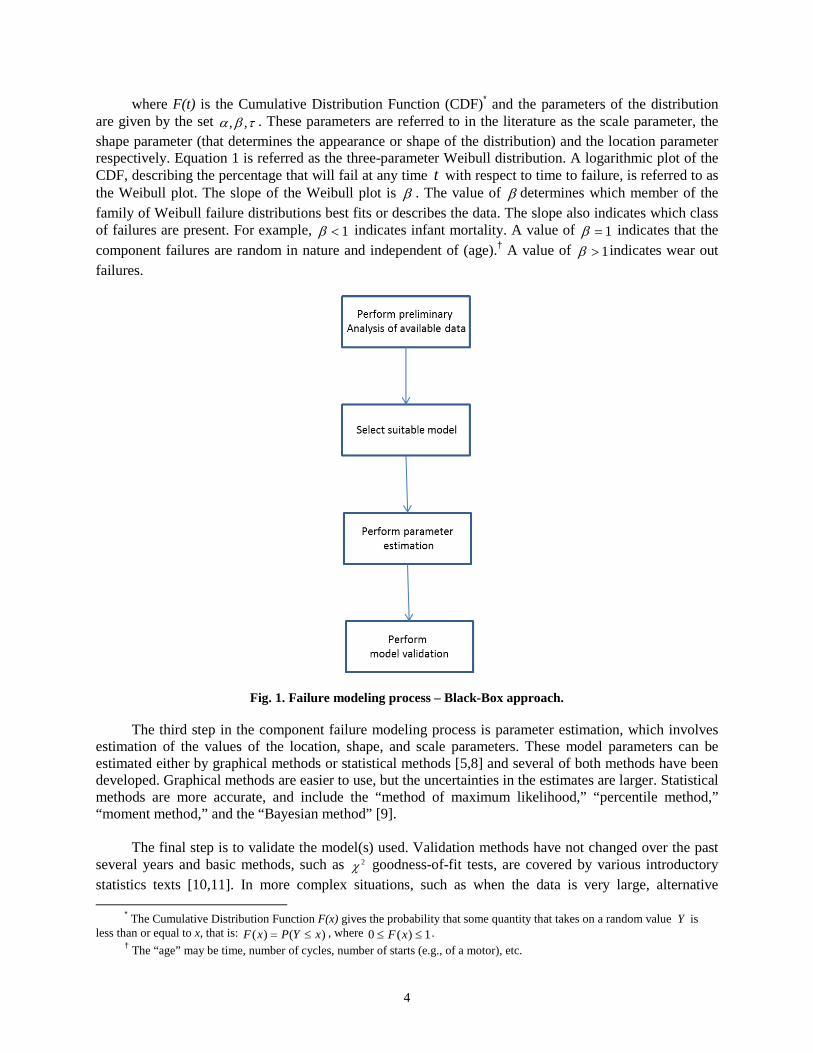
The general approach to failure modeling using the Black-Box approach is illustrated in Figure 1. A
preliminary analysis of the available data is important in order to identify the relevant mathematical formulations needed for modeling. Thus, as the figure shows, the first step in developing a failure model is to explore the data by performing various plots of the data. This can provide valuable information to help in selecting a model. Examples of such plots are hazard functions, density functions, Weibull probability plots, and cumulative intensity functions [4].
The next step is the selection of a suitable component failure model. In this regard, the Weibull
distribution is one of the best-known lifetime distributions. This model adequately describes observed failures of many different types of components [5]. Murphy et al. [6] provide a comprehensive taxonomic guide to such models and discuss steps for selecting an appropriate model. In particular, the cited taxonomy for Weibull models involves seven major types, each of which can be divided into other sub-types. However, the seven major types can be further aggregated into just three groups as follows:
1. Univariate models, 2. Multivariate models, and 3. Stochastic process models.
As noted, Murphy et al. provides a comprehensive discussion on the subject. However, in order to illustrate the concept, Halliman [7] defines one of the most common forms of the Weibull distribution as follows:
τ
ατ β
≥
−
−−= tttF ,exp1)( , (1)
4
where F(t) is the Cumulative Distribution Function (CDF)* and the parameters of the distribution are given by the set τβα ,, . These parameters are referred to in the literature as the scale parameter, the shape parameter (that determines the appearance or shape of the distribution) and the location parameter respectively. Equation 1 is referred as the three-parameter Weibull distribution. A logarithmic plot of the CDF, describing the percentage that will fail at any time t with respect to time to failure, is referred to as the Weibull plot. The slope of the Weibull plot is β . The value of β determines which member of the family of Weibull failure distributions best fits or describes the data. The slope also indicates which class of failures are present. For example, 1<β indicates infant mortality. A value of 1=β indicates that the component failures are random in nature and independent of (age).† A value of 1>β indicates wear out failures.
Fig. 1. Failure modeling process – Black-Box approach.
The third step in the component failure modeling process is parameter estimation, which involves estimation of the values of the location, shape, and scale parameters. These model parameters can be estimated either by graphical methods or statistical methods [5,8] and several of both methods have been developed. Graphical methods are easier to use, but the uncertainties in the estimates are larger. Statistical methods are more accurate, and include the “method of maximum likelihood,” “percentile method,” “moment method,” and the “Bayesian method” [9].
The final step is to validate the model(s) used. Validation methods have not changed over the past
several years and basic methods, such as 2χ goodness-of-fit tests, are covered by various introductory statistics texts [10,11]. In more complex situations, such as when the data is very large, alternative
* The Cumulative Distribution Function F(x) gives the probability that some quantity that takes on a random value Y is less than or equal to x, that is: )()( xYPxF ≤= , where 1)(0 ≤≤ xF .
† The “age” may be time, number of cycles, number of starts (e.g., of a motor), etc.
5
approaches may be employed. One such approach is to take a random sample from the data set, fit the model(s) to this sub-sample and then evaluate how well the model(s) fit the remaining data using plots and tests [4].
Weibull analysis is used to answer several reliability-related questions and when added to an overall
reliability improvement program, the tool can be used to optimize availability of manufactured products. In particular, Weibull analysis can be used to (1) perform failure forecasting and prediction, (2) evaluate corrective action plans, (3) substantiate tests for new designs with minimum cost, (4) perform maintenance planning and cost-effective replacement strategies, and (5) perform spare parts forecasting.

Page intentionally blank
7
3. ELEMENTS OF HARDWARE/SOFTWARE SYSTEM RELIABILITY MODELS
System reliability modeling has not changed significantly in the last couple of decades. Typically, system reliability modeling is based on the Failure Modes and Effects Analysis (FMEA) of the system. A system FMEA is a bottom-up reliability analysis technique that provides a mapping between failures and their impact on system services. An evaluation of the system reliability characteristics is based on reliability block diagrams and Markov state diagrams (developed from the FMEA analysis of the system) and the individual hardware and software component failure rates [12,13,14].
Reliability modeling of a system with combined hardware/software is similar to the reliability
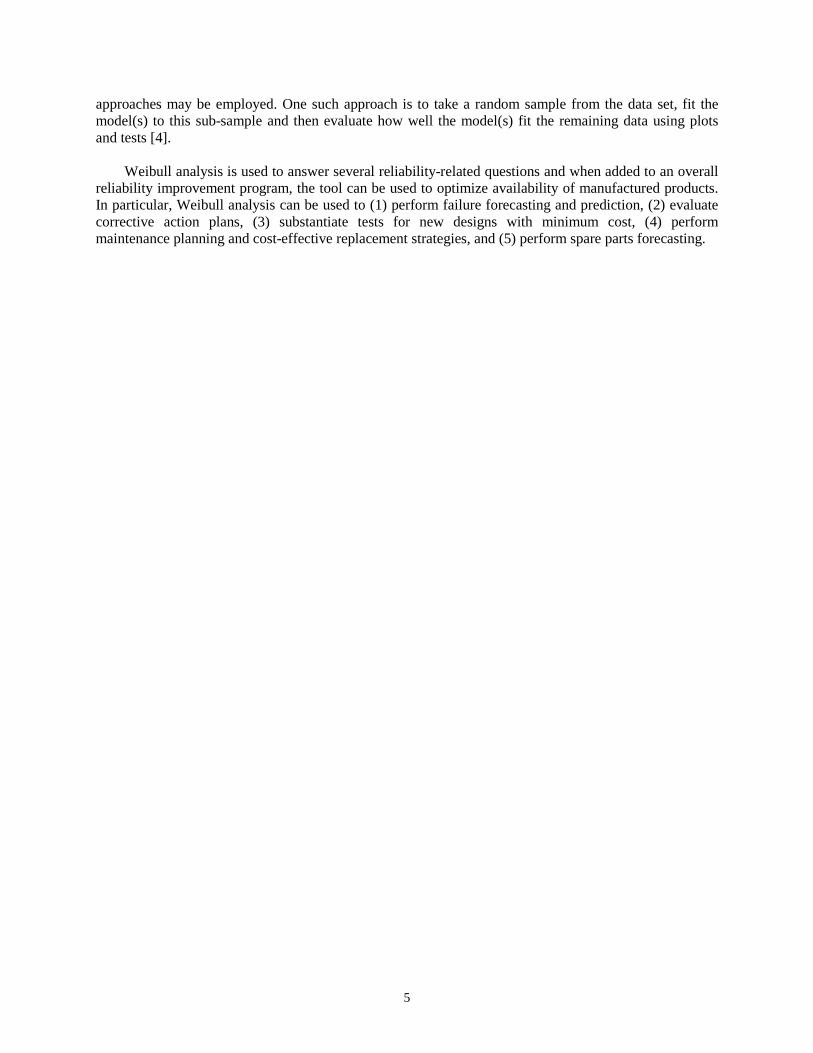
modeling of purely hardware systems: The analyst first constructs reliability block diagrams consisting of individual pieces of the entire system. Any software platform assigned to a piece of hardware becomes an integral part of the hardware and is independent of other hardware/software platforms. The basic premise is that individual software components do not fail independently and are not subject to wear out. Also, unlike hardware, software components are not replaced independently like hardware. The state of the art of hardware/software reliability modeling procedures is depicted in Fig. 2. The reliability models developed can then be used to estimate the reliability of the entire system.
Fig. 2. Basic steps in reliability modeling of hardware/software systems.
Reliability models of redundant combined software/hardware are considerably more complex than
reliability models of non-redundant hardware/software elements. In particular, the addition of redundancy introduces complexity associated with the ability of the hardware and software to correctly respond to

8
failure events. Reliability modeling of redundant hardware/software elements with hot standby and automatic switch-over capability significantly increases the complexity required to properly account for system behavior.
9
4. GENERIC APPROACH TO RELIABILITY MODELING OF DIGITAL I&C SYSTEMS
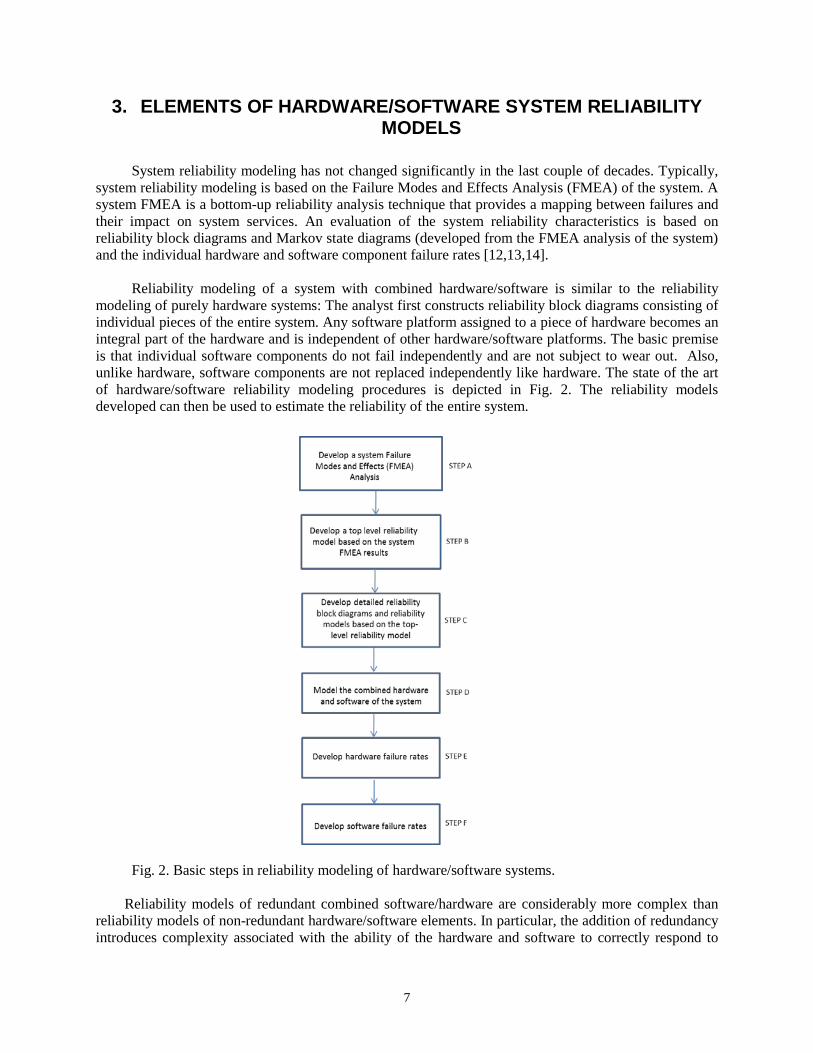
Chu et al. [15] provide a generic failure modes and effects analysis (FMEA) based approach for reliability modeling of digital I&C systems. Using a digital feedwater control system (DFWCS) as an example, the entire system is decomposed into successful levels of detail, starting at the overall system level and working down until the level of the generic components is reached. The authors state that the number of intermediate levels depends on the complexity of, and information available about, the particular system. The development of the FMEA begins at the lowest level (i.e. at the generic component level), where failure modes are postulated and their effects are propagated back to the higher levels, until the effect on the entire system is determined. To illustrate, Figure 3 shows a generic digital I&C system consisting of several arbitrarily-connected modules. Some of the modules have been labeled but this is only for illustrative purposes to show that the entire system consists of both hardware and software. In general, the major components of the modules are identified based on the architecture of the system. Three levels are typically identified: (1) the highest level consists of the entire system, (2) the middle level consists of the identified modules that make up the system (this is based on the architecture), and (3) the lowest level consists of the major components of the modules. The failure modes at the system level are the failure effects of the modules, and the failure modes at the module level are the failure effects of the components that make up the module [15].
Fig. 3. Illustration of the breakdown of a generic digital I&C system into modules.
Some of the key issues in developing the FMEA include how to treat undetectable and latent failures. If a component failure causes an undetectable failure of any module, the entire system is assumed to fail. Latent failures are treated differently. A latent failure is a component failure that does not cause the system to fail until some undetermined conditions arise. Since a latent failure does not by itself cause a system failure, the impact of combinations of latent failures on the system must be evaluated [15]. In a reasonably complex system, the number of combinations of failures may be very large. For the digital
10
feedwater example system used, Chu et al. developed an automated FMEA tool to provide an efficient way to address the problem. Based on their tests and validation results from the automated tool, the authors conclude the following:
1) “many failure modes of components of modules will not fail the system;” 2) “the impacts of different failure modes for a specific component may be very different from each
other;” 3) “the failure impacts of the same failure modes of the same components on different modules can
be significantly different” 4) “fault-tolerance features implemented via specifically designed hardware (e.g., an external Watch
Dog Timer) or hardware redundancy (e.g., the main central processing unit (CPU) and the backup CPU), or application software, play a vital role in determining the effect of each component failure mode on its respective module and on the entire system.”
Further details of the automated FMEA tool, including the assumptions made, are provided in
References [15] and [16].
11
5. DYNAMIC MODELING APPROACH
Dynamic modeling methodologies are defined as those that can account for the coupling between the triggered or stochastic logical events (e.g., pump startup, valve opening) in system reliability modeling through explicit consideration of the time element in system evolution.* They provide a considerably more accurate representation of probabilistic system evolution in time than the traditional static event-tree/fault-tree (ET/FT) approach that has been used in the reliability modeling of digital l&C systems in nuclear power plants. However, it is generally difficult to integrate a dynamic model into existing plant probabilistic risk assessments (PRAs), most of which are based on the static ET/FT approach. As identified by Aldemir et al. [17], suitable dynamic methodologies include the following:
• Markov models (a discrete-state representation of the system with transition rates between states) • Petri net methodologies (a graph theoretic approach with simulation). • Dynamic Flowgraph methodology (DFM; a discrete-state representation of the system with the
physical and software component functional behavior modeled through decision tables) • Bayesian methodologies • Test based methodologies and Software metric-based methodologies • Black-box methodologies
According to Aldemir et al., the methodologies to be used for digital systems assessments in nuclear power plants must demonstrate that they meet the following requirements as a minimum:
1) The methodology should account for both Type I and Type II interactions.† 2) The model must be able to predict encountered and future failures well and cannot be purely
based on previous experience. 3) The model must make valid and plausible assumptions and the consequences of violating these
assumptions need to be identified. 4) The data used in the quantification process must be credible to a significant portion of the
technical community. 5) The model must be able to differentiate between a state that fails one safety check and those that
fail multiple ones. 6) The model must be able to differentiate between faults that cause function failures and
intermittent failures. 7) The model must have the ability to provide uncertainties associated with the results.
Up until about a decade ago, no single methodology had been identified that satisfied all the above requirements. Using subjective criteria based on reported experience, Aldemir et al. identified the dynamic flowgraph methodology (DFM) and the Markov methodology coupled with the cell-to-cell-mapping technique (CCMT) as the methodologies that rank as the top two with the most positive features and least negative or uncertain features when evaluated against the requirements for the reliability modeling of digital I&C systems. Aldemir et al. also concluded that benchmark systems should be defined to allow assessment of the methodologies proposed for the reliability modeling of digital I&C systems using a common set ardware/software/firmware states and state transition data. Based on this, the authors later developed a proof-of-concept for the use of the Markov/CCMT and DFM methods to model
* For example, the dynamic interactions between: (a) the reactor protection and control systems and controlled plant physical processes (e.g., plant heatup, pressurization), and (b) the components of the reactor protection and control systems itself (e.g., communication between different components, multitasking, multiplexing) [17].
† As defined by Aldemir et al. [17], Type I interactions are those between the reactor protection and control systems and controlled plant physical processes (e.g., heatup, pressurization). Type II interactions are those between the components of the reactor protection and control system itself (e.g., communication between different components, multitasking, multiplexing).
12
a benchmark digital feedwater control system (DFWS) [18]. The study also illustrated how these dynamic models can be developed and integrated into an existing PRA model of a pressurized-water reactor. The study showed that:
• the DFM and Markov/CCMT can be implemented for the reliability modeling of the benchmark
system; and • the outputs of the DFM and Markov/CCMT can be incorporated into the existing ET/FT based
PRA of a NUREG-1150 [19] plant.
The study concluded that both the DFM and Markov/CCMT methodologies can account for all the features of the benchmark system with consistent results and that the results can be integrated into an existing PRA. However, the study also identified some possible challenges with the methodologies. These include the following:
1) considerable expertise is required of the analyst in order to successfully implement the
methodologies, 2) Correct description of the coupling between failure events is computationally intensive. 3) There was lack of general acceptance of the data used for quantification by a significant portion
of the technical community, 4) There was the need for routine integration and processing of the results of these methodologies
within the structure of existing PRAs.
These and other concerns detailed in Ref. 18 were addressed by the authors in Ref. 20, in which two dynamic methodologies − dynamic flowgraph methodology (DFM) and the Markov/Cell-to-cell mapping technique (CCMT) − were implemented on the benchmark DFWCS specified in Ref. 18 to demonstrate how an existing nuclear power plant PRA can incorporate a digital upgrade of the instrumentation and control system. The results obtained from the DFM and Markov/CCMT models of the DFWCS failure modes were compared, and the impact of scenarios directly related to the hypothetical digital upgrade on the core damage frequency was assessed on a demonstrative basis.
13
6. SUMMARY OVERVIEW
This report documents the investigation of reliability failure models at the component, product, and complex system levels, including systems that may contain both hardware and software. It has been shown that that component reliability models such as Weibull plots primarily address component reliability issues related to failure forecasting and prediction, evaluation of corrective action plans, substantiation of tests for new designs at minimum cost, performance of maintenance planning and cost-effective replacement strategies, and performance of spare parts forecasting.
Traditional FMEA tools used to support reliability modeling of digital I&C systems have not
changed significantly over the past several years. Some of the key issues in developing an FMEA include how to treat undetectable and latent failures. The current (best) approach to treating an undetectable failure is to assume that the entire system fails in the event of an undetectable failure. With regard to latent failures, the impact of combinations of latent failures on the system must be evaluated. In a reasonably complex system, the number of combinations of failures may be very large. Automated FMEA tools to provide an efficient way to address the problem are becoming available. A significant issue of FMEAs with regard to the focus of this report is that they address only single failures, not multiple failures, and they do not address CCFs.
Dynamic reliability modeling tools provide a more accurate representation of probabilistic system
evolution in time than the traditional static ET/FT approach that has been used in the reliability modeling of digital l&C systems in nuclear power plants. The drawback is that it is more difficult to integrate a dynamic model into existing plant PRAs, most of which are based on the static ET/FT approach. Studies have shown that two dynamic methodologies − DFM and the Markov CCMT − provide some of the best reliability modeling techniques that are well suited to successfully represent and analyze the risk relevant failure modes of modern NPP digital I&C systems. Future work will investigate how to quantitatively incorporate CCFs into the reliability models.

Page intentionally blank
15
7. REFERENCES
1. U.S. Nuclear Regulatory Commission, “Summary Of March 28-29, 2006, EPRI and NEI
Workshop on Digital Instrumentation and Controls (I&C) and Control Room Licensing Issues,” NRC Agencywide Documents Access and Management System (ADAMS) Accession Number ML070590059, March 7, 2007.
2. R. T. Wood et al., “Update on Common-Cause Failure Experience and Mitigation Practices,” ORNL/TM-2013/563, December 2013.
3. R. T. Wood et al., “Taxonomy for Common-Cause Failure Vulnerability and Mitigation,” ORNL/SPR-2015/209, April 2015.
4. “Two-Dimensional Failure Modeling,” in Handbook of Engineering Statistics, Part A/5, Springer 2006.
5. “Weibull Distributions and their Applications,” in Handbook of Engineering Statistics, Part A/3, Springer 2006.
6. D. N. P. Murthy, M. Xie, and R. Jiang, Weibull Models, Wiley, New York 2003.
7. A.J. Halliman, “A Review of the Weibull Distribution,” J. Qual. Technol. 25, (1993) 85-93.
8. Mohammad A. Al-Fawzan, “Methods for Estimating the Parameters of the Weibull Distribution,” http://interstat.statjournals.net/YEAR/2000/articles/0010001.pdf, accessed June 2, 2015.
9. J.D. Kalbfleisch, R.L. Prentice, The Statistical Analysis of Failure Data, Wiley, New York, 1980.
10. S. B. Vardeman, Statistics for Engineering Problem Solving, PWS, 1993.
11. R.B. D’Agostino and M.A. Stephen,Goodness of fit Techniques, Msrcel Dekker, New York, 1986.
12. http://www.cs.colostate.edu/~cs530/rh/section5.pdf, accessed June 4, 2015.
13. Stephen R. Welke, Barry W. Johnson, James H. Aylor, “Reliability Modeling of Hardware/Software Systems,” IEEE transactions on reliability, vol. 44. no. 3, 1995.
14. M.A. Friedman, P.Y. Tran and P.L. Goddard, Reliability Techniques for Combined Hardware and Software Systems, RL-TR-92-15, Final Technical Report, February 1992, Hughes Aircraft Company.
15. T.L. Chu, M. Yue, G. Martinez, and J. Lehner, “A Generic Failure Modes and Effects Analysis (FMEA) Approach for Reliability Modeling of Digital Instrumentation and Control (I&C) Systems,” 10th International Probabilistic Safety Assessment and Management Conference, Seattle, Washington: 2010, ISBN: 978-1-62276-578-2.
16. T.L. Chu et al., Modeling a Digital Feedwater Control System Using Traditional Probabilistic Risk Assessment Methods, NUREG/CR-6997, September 2009.
17. T. Aldemir et al., Current State of Reliability Modeling Methodologies for Digital Systems and Their Acceptance Criteria for Nuclear Power Plant Assessments, NUREG/CR-6901, February 2006.
18. T. Aldemir et al., Dynamic Reliability Modeling of Digital Instrumentation and Control Systems for Nuclear Reactor Probabilistic Risk Assessments, NUREG/CR-6942, October 2007
19. Severe Accident Risks: An Assessment for Five U.S. Nuclear Power Plants, NUREG 1150, Vol I, December 1990.

16
20. T. Aldemir et al., A Benchmark Implementation of Two Dynamic Methodologies for the
Reliability Modeling of Digital Instrumentation and Control Systems, NUREG/CR-6985, February 2009.