identification and characterisation of microsatellite dna ... · research article open access...
TRANSCRIPT

VETERINARY RESEARCHChakrabarty et al. Veterinary Research (2015) 46:110 DOI 10.1186/s13567-015-0248-2
RESEARCH ARTICLE Open Access
Identification and characterisation ofmicrosatellite DNA markers in order to recognisethe WSSV susceptible populations of marine giantblack tiger shrimp, Penaeus monodonUsri Chakrabarty, Sourav Dutta, Ajoy Mallik, Debabrata Mondal and Nripendranath Mandal*
Abstract
White spot disease (WSD) which is caused by white spot syndrome virus (WSSV) creates severe epizootics in capturedand cultured black tiger shrimp, resulting a huge loss in the economic output of the aquaculture industry worldwide.Performing selective breeding using DNA markers would prove to be a potential cost effective strategy for long termdisease control in shrimps. In the present investigation, microsatellite DNA fingerprints were compared betweennaturally occurring WSSV resistant and susceptible populations of Penaeus monodon. After PCR with a set of shrimpspecific primers three reproducible DNA fragments of varying sizes were found, among which 442 bp and 236 bpfragments were present in considerably higher frequencies in the WSSV susceptible shrimp population (p≤ 0.0001).After WSSV challenge experiment the copy no. of WSSV was determined using real-time PCR, where it was found to bealmost 4 × 10³ fold higher in WSSV susceptible shrimps than in the resistant ones. Thus, these microsatellite DNAmarkers will be useful to distinguish between WSSV susceptible and resistant brood stocks of P. monodon. Sequencingstudies revealed that these DNA markers were novel in P. monodon. Highest WSSV resistance using these DNA markers,was observed in the shrimp populations of Andaman Island and Chennai among the different coastal areas of India,suggesting these places as safe for specific pathogen resistant brood stock shrimp collection. This study will be a veryeffective platform towards understanding the molecular pathogenesis of WSD for generation of disease free shrimpaquaculture industry.
IntroductionAquaculture industry enjoys an exponentially profitablemarket worldwide and deals with various valuable mar-ine and fresh water invertebrate and vertebrate species.Marine black tiger shrimp, Penaeus monodon, is one ofthe most economically important native cultivated spe-cies of India due to its bigger size, higher nutritionalvalue and huge demand as food delicacies across theglobe. They contribute to 95% of the total production ofthe captured and cultured shrimps in India [1]. Prone-ness of the shrimp species towards many deadly viraldiseases is an alarming factor in aquaculture industry[2]. Among them, the white spot disease (WSD) causeddue to white spot syndrome virus (WSSV), a rod shaped
* Correspondence: [email protected] of Molecular Medicine, Bose Institute, P-1/12 CIT Scheme VII-M,Kolkata 700054, India
© 2015 Chakrabarty et al. Open Access This aInternational License (http://creativecommonsreproduction in any medium, provided you gthe Creative Commons license, and indicate if(http://creativecommons.org/publicdomain/ze
dsDNA virus (genus Whispovirus of the family Nimaviri-dae) of 305.12 Kb length is the deadliest one. WSSV has avery wide host range and is able to sustain for a consider-ably long period of time in the virion state increasing thechances of further infection [3-5]. Several preventive mea-sures were tested and applied throughout the worldagainst the WSSV infection, but with a very less successrate [6-9].It is well known that, some resistance phenomena always
lies in the repository of the nature itself. Nature alwaysfavoured some individuals for better existance and resist-ance as well as preventive capability against any kind ofodds like natural and artificial disasters. So that is obviousthat, some kind of disease resistance phenomena might bepresent in shrimps also and some special genomic finger-prints may be accountable for this resistance.
rticle is distributed under the terms of the Creative Commons Attribution 4.0.org/licenses/by/4.0/), which permits unrestricted use, distribution, andive appropriate credit to the original author(s) and the source, provide a link tochanges were made. The Creative Commons Public Domain Dedication waiverro/1.0/) applies to the data made available in this article, unless otherwise stated.

Chakrabarty et al. Veterinary Research (2015) 46:110 Page 2 of 10
Several DNA fingerprinting methods are used in popul-ation genetic studies, genetic diversity analysis, classifyinggermplasm and selective breeding in animals and plantsfor disease resistance [10-14]. Microsatellite markersare vastly used for study due to their reproducibility, co-dominant expression type, even genomic distribution, smalllocus size and high polymorphism. This enriched know-ledge about DNA fingerprints can be very useful in theisolation of resistant individuals from an economicallyimportant species and cultivating them selectively asper the suitable genomic content. Disease resistance hasbeen a major field of interest in several species of shrimpssince decades. Eight markers associated with infectioushypodermal and hematopoietic necrosis virus (IHHNV)resistance or susceptibility in mutant and wild type popu-lations of Litopenaeus stylirostris have been discoveredusing RAPD technique [15]. Evidence of clear associationof a microsatellite marker was found with taura syndromevirus (TSV) susceptibility/resistance in Litopenaeus van-namei [16]. There are more instances where, one moremicrosatellite loci (RS0622) was identified to be associatedwith WSSV resistance in Fenneropenaeus chinensis [17].Recently, single nucleotide polymorphism (SNP) discoveryand association analysis detected several SNP markers as-sociated with resistance to TSV in L. vannamei [18].Previously, one 71 bp microsatellite DNA marker has
been developed from two populations of P. monodondesignated as WSSV resistant and disease susceptiblewhich were collected from ponds, highly infected withWSSV [19]. Later both of these two populations of P.monodon were challenged individually by injecting WSSVand finally mortality as well as WSSV propagation wasmeasured by quantitative real-time PCR. It was observed~103 fold higher WSSV propagation was occured in thedisease susceptible population than the WSSV resistantpopulation [20]. This study is mainly focused on the identi-fication of more microsatellite DNA markers associated toWSSV resistance or susceptibility in shrimps. From thesequence analysis some very useful novel DNA markersare identified and practical applicability of these DNAmarkers are subsequently confirmed by WSSV challengeexperiment. The possible safer places for WSSV resistantbrood stock collection for Indian shrimp aquaculture arealso suggested in this investigation.
Materials and methodsSample collectionP. monodon samples were collected from 20 highly diseaseaffected ponds in West Bengal, India. The mature adultshrimp samples of 75 days post larva weighed ~55 g inaverage were collected from the culture ponds wherethe water temperature was 25°-30 °C and the infectionlasted for 3–4 days. The collected shrimps were dividedinto two groups, WSSV resistant (n = 195) and disease
susceptible (n = 255). The former population survivedwell in the affected ponds, had no clinical signs of diseaseand were found to be WSSV negative by nested PCR; thelatter population, however, died because of disease withobvious clinical signs and were observed WSSV positiveby PCR.
WSSV screening by nested PCRWSSV was qualitatively tested using genomic DNA fromgill tissue of shrimps according to the method reported pre-viously using commercially available kit (GeNei™, MERCK,India) [21]. The gel photograph was documented in agel documentation system (EC3 Chemi HR 410 ImagingSystem, UVP, USA).
Genomic DNA extractionThe pleopod tissues (~100 mg) were collected from individ-ual shrimps and subjected for genomic DNA preparationusing phenol-chloroform method [22]. Each DNA samplewas quantified by UV spectrophotometer (ShimadzuUV160U, Japan) and electrophoresed in 0.8% agarose gelto determine their quality before using in subsequent PCRreactions.
Identification of disease susceptible and WSSV resistantpopulation of P. monodon using microsatellite DNA markersTo accomplish the PCR reaction from the isolated shrimpgenomic DNA, shrimp specific primers (forward: OM 73and reverse: OM 74) [23] were taken from the microsatel-lite locus (PM205; Accession no - AY500854) of P. mono-don. The PCR reaction for the microsatellite amplificationwas carried out in a 25 μL reaction mixture containing400 ng genomic DNA, 30 pmol forward and reverseprimer (Biotech Desk, India), 0.2 mM dNTPs (MP Bio-medicals, USA), 1 mM MgCl2 (MP Biomedicals, USA),1X buffer (10 mM Tris–HCl, pH 9.0, 50 mM KCl, 0.1%Triton X100, 0.2 mg mL−1 BSA) (MP Biomedicals, USA)and 1.0 U Taq DNA polymerase (MP Biomedicals, USA).Each reaction mixture was placed in a thermal cycler(PTC100, MJ Research Inc., USA). The thermal profilesfor PCR was as follows: 94 °C for 5 min; followed by 35 cy-cles of 94 °C for 45 s, experimental annealing temperatureat 50–60 °C for 1 min and extension at 72 °C for 1 min,after that final extension at 72 °C for 5 min. The amplifiedDNA fragments were separated by electrophoresis in 2.5%agarose gel at 80–90 volt for 2–3 h and subsequently visu-alized by staining with ethidium bromide (1 μg mL−1).WSSV was extracted using PEG virus precipitation kitfrom WSSV infected tissue (hepatopancreas and gill) ofshrimp (BioVision, USA). DNA was extracted from WSSVusing High Pure Viral Nucleic Acid Kit (Roche, Germany)and was subjected to PCR with microsatellite primers fol-lowing above mentioned protocol to confirm the shrimporigin of these DNA markers. This method was also applied
Chakrabarty et al. Veterinary Research (2015) 46:110 Page 3 of 10
later for the samples of challenge experiment after prepar-ation of genomic DNA by phenol-chloroform method.
WSSV challenge test to confirm the significant associationbetween DNA markers and disease susceptibilityLive P. monodon samples (~50 g body weight, n = 382), de-void of any WSSV infection, were collected from pondsand kept for acclimatization before the challenge for twodays in recirculatory marine aquarium at 23–26 °Ctemperature and 6–8 gl−1 salinity. Some essential saltswere added and the marine aquarium system was standard-ized to provide optimal conditions in favor of growth andmolting of shrimps. For maintaining appropriate healthynatural aquatic environment some chemicals that arewidely used in aquaculture farms, viz., PondDtox® andPondProtect® (Novozyme, Europe) were also used inthe aquarium. For the challenge experiment WSSV stocksolution was prepared using PEG virus precipitation kitfrom ~48 g of WSSV infected tissue (hepatopancreas andgill) of shrimp (BioVision, USA). The bioassay experimentwas performed to determine the virus titer responsible for50% mortality, which was found at 104 dilution of virusstock. Therefore, 40 μL of 105 dilution of virus solutionwas injected into the tail muscle of each shrimp (n = 240)and genomic DNA was extracted from tail tissue ofshrimps after 72 h of WSSV challenge experiment. Sur-vivability as well as WSSV propagation by real-time PCRwas also recorded at post 72 h.
WSSV quantification for the samples of WSSV challengeexperiment by real-time PCRQuantification of WSSV copies in shrimp samples were de-termined by comparing the average CT (cycle threshold)values with the standard curve by real-time PCR preparedby plotting various CT values against different consecutivedilutions of standard plasmids. The real-time PCR reactionwas carried out in a thermal cycler (StepOnePlus™, AppliedBiosystems, USA) with 10 μL reaction mixture containing10 ng genomic DNA from pleopod tissue, 3 pmol of eachWSSV specific primers producing 50 bp amplicon (Biotechdesk, India) and 0.8X SYBR green master mix (AppliedBiosystems, USA). The thermal profile was, 50 °C for10 min, 95 °C for 10 min followed by 40 cycles of 95 °Cfor 15 s, 50–55 °C for 30 s, 72 °C for 45 s. All the samplesfor real-time PCR were run in duplicates and t- test wasperformed to observe the mean CT value among the chal-lenged samples.
Cloning and sequencing of microsatellite DNA markersThe 442 bp and 236 bp microsatellite DNA markers werecloned and sequenced by using an ABI PRISM dye ter-minator ready reaction kit followed by the manufacturerprotocol (Applied Biosystems, USA). The sequence wasanalysed in the NCBI (USA), EMBL (Europe) and DDBJ
(Japan) nucleotide Blast program for homology searchingwith known sequence database.
Determination of disease susceptible and diseaseresistant population of P. monodon using microsatelliteDNA markers along the entire coastal areas of IndiaAlmost 100 shrimp samples (~100 gm each) were collectedfrom 9 different coastal areas along Indian coastline. Eastcoast samples were collected from Digha, West Bengal(co-ordinates: 21°38′N, 87°33′E); Chilika, Orissa (co-ordi-nates: 20°1′N, 85°32′E); Visakhapatnam, Andhra Pradesh(co-ordinates: 17°41′N, 83°18′E); Chennai, Tamil Nadu (co-ordinates: 13°02′N, 80°10′E), Port Blair, Andaman (co-ordi-nates: 12°16′N, 93°51′E). West coast samples, on the otherhand, were collected from Kochi, Kerala (co-ordinates:9°96′N, 76°21′E); Mangalore, Karnataka (co-ordinates:12°87ʹN, 74°88ʹE); Vasco-Da-Gama, Goa (co-ordinates:15°40ʹN, 73°83ʹE); and Veraval, Gujarat (co-ordinates:20°90ʹN, 70°37ʹE). The PCR was accomplished followingprotocol described above during microsatellite DNA markeridentification to identify disease susceptible or resist-ant shrimp population from the isolated shrimp gen-omic DNA collected from different coastal areas.
Statistical analysisThe molecular size of the amplified PCR products were cal-culated using DNA markers by Molecular Analyst software(VisionWorksLS, UVP, USA). The polymorphism of DNAbands were carefully analyzed among WSSV resistant andWSSV susceptible shrimp population and the significancelevel of frequency of band (presence and absence in twopopulations) was calculated by Fisher’s exact test. The meanmortality assay between WSSV resistant and WSSV suscep-tible individuals was analyzed using the statistical program(SPSS v10.0 and MS Excel 2010). The real-time PCR datawere analyzed by StepOne software v2.1 (Applied Biosys-tems, USA). The t- test was performed to differenciatebetween the mean CT value of the WSSV resistant and dis-ease susceptible samples by statistical software Kyplot(version 2.0 beta 13). The cor-relation analysis between thetwo developed microsatellite DNA markers was performedby a statistical program (SPSS v10.0 and MS Excel 2010).
ResultsDetection of WSSV by nested PCR in collected naturalshrimp populationWSSV specific primers using commercially available kit(GeNei™, MERCK, India) were used for PCR and generatedthree DNA fragments of 942 bp, 525 bp and 204 bp re-spectively from WSSV genome based on the severity of in-fection. Very high infection (≥105 viral particles) producedall the three DNA fragments (942 bp, 525 bp and 204 bp),whereas moderate to high infection (≥103 - <105 viral par-ticles) produced two DNA fragments (525 bp and 204 bp)

Chakrabarty et al. Veterinary Research (2015) 46:110 Page 4 of 10
and low infection (10 to 200 viral particles) produced onlythe 204 bp DNA fragment. Lanes 1–8 in Figure 1 rep-resents the absence of WSSV in the gill tissues of theindividuals of WSSV resistant population in single tubenested PCR by WSSV-specific primers provided withthe kit. However, moderate to high WSSV infection (with103-105 WSSV particles) was observed in the gill tissues ofthe disease susceptible individuals, as reflected in lanes 9–16in Figure 1. Among the collected shrimp overall 56.66%of individuals were found to be naturally infected byWSSV while 43.33% individuals were found devoid ofvirus at the time of their capture.
Microsatellite DNA marker analysis of shrimp genomic DNAPCR amplification by the shrimp specific primers takenfrom microsatellite locus of P. monodon produced twosignificant DNA fingerprints in order to differentiate be-tween WSSV resistant and disease susceptible shrimppopulations. Upon PCR amplification two bands of mo-lecular sizes 442 bp and 236 bp were generated in diseasesusceptible population whereas, absence of these two bandswere evident in the WSSV resistant population. Moreover,appearance of another 215 bp DNA band was observed inboth the populations (Figure 2A). These results illustratetwo reproducible microsatellite DNA markers in diseasesusceptible population. Table 1 shows the allele frequenciesof 442 bp were 0.39 and 0.43 in WSSV resistant and suscep-tible populations while in case of 236 bp the frequency inWSSV resistant and susceptible populations were 0.21 and0.27, respectively. Chi square was calculated with thesedata, and value was optimised by applying Yates’ correctionusing Fischer's Exact Test. The 442 bp and 236 bpfragments are highly statistically significant (p ≤ 0.0001)
Figure 1 WSSV detection test by commercially available kit. The PCR athe no amplification of DNA bands specific to WSSV from WSSV resistant Penae942 bp, 525 bp and 204 bp from disease susceptible P. monodon. Lane C-, a nethe three fragments (942 bp, 525 bp and 204 bp) that indicated very highmolecular weight marker. The molecular weights of the bands specific tohand side of the gel in the figure.
microsatellite DNA markers which can distinguish betweenWSSV resistant and susceptible populations of P. monodon.PCR amplification with shrimp specific primers (OM 73
and OM 74) from viral genomic DNA did not produce anyDNA band, whereas PCR amplification using virus specificprimers only produced appropriate DNA bands (Figure 2B).
Mortality analysis among the WSSV resistant and diseasesusceptible shrimps after WSSV challenge experimentAmong the total of 382 individuals of challenged P. mono-don, 240 samples were found WSSV negative prior to thechallenge and were therefore taken for subsequent resultanalysis. The percentages of mortality among diseasesusceptible shrimps were 70.4% (p < 0.001) and 78.1%(p < 0.004), according to the 442 bp and 236 bp DNAmarkers, respectively (Figures 3A and B). While incase of resistant population, percentages of mortalitywere 30.6% and 48.9%, respectively for 442 bp and 236 bpmarkers. The percentage of mortality of WSSV resistantpopulation was significantly different (p < 0.001) from theWSSV susceptible population.
Quantification of WSSV among WSSV resistant and WSSVsusceptible shrimps after WSSV challenge experimentWSSV quantification was performed by comparing theCT value of the experimental samples with the standardcurve, which was obtained by using different consecutivedilutions of standard plasmids. Figure 4 showed the ampli-fication plots of WSSV using real-time PCR among WSSVresistant and WSSV susceptible populations of P. mono-don based on 442 bp (Figure 4A) and 236 bp (Figure 4D)DNA markers. The dissociation curves showed amplifi-cation of the similar amplicons of WSSV in two differ-ent populations according to both 442 bp and 236 bp
mplified DNA was electrophoresed in 2% agarose gel. Lanes 1–8 showedus monodon. Lanes 9–16 showed WSSV specific amplified DNA bands ofgative control with no viral DNA. Lane C+, a positive control produced allconcentration of virus (≥105 viral particle). Lane M indicated thethe different copies of WSSV are indicated by the arrows at the left

Figure 2 Microsatellite DNA marker analysis of shrimp and WSSV genomic DNA. Genomic DNA was isolated from pleopod tissue of Penaeusmonodon and subjected to microsatellite DNA marker analysis. PCR amplified DNA fragments were electrophoresed in 2.5% agarose gel and photographedafter staining with ethidium bromide. In panel A Lanes 1–6 show PCR amplified DNA bands from WSSV resistant P. monodon. Lanes 7–12 show PCRamplified DNA bands from disease susceptible P. monodon. Lane C- is the negative control and Lane M indicates molecular weight marker. Number in theright side indicated the molecular size of molecular weight marker and at the left hand side the molecular weights of the significant bandsspecific to the susceptible samples are indicated by the arrows in the figure. In panel B WC+ shows the amplified DNA bands in the nestedPCR of WSSV genomic DNA with WSSV specific primers, WC- shows no amplified DNA bands in the PCR of WSSV genomic DNA with shrimpspecific microsatellite primers (OM 73 and OM 74).
Chakrabarty et al. Veterinary Research (2015) 46:110 Page 5 of 10
microsatellite markers (Figures 4B and E). Results in-dicated that the mean CT ± SEM values in WSSV re-sistant and WSSV susceptible shrimps based on442 bp microsatellite DNA marker were 33.6 ± 0.4 and23.7 ± 0.59 whereas, the same were 33.5 ± 0.3 and 23.9± 0.87 in two populations discriminated using 236 bpmicrosatellite DNA marker. The difference in the meanCT values of WSSV amplicons were highly statistically sig-nificant (Figures 4C and 4F; p < 0.001) among WSSV re-sistant and susceptible populations designated by bothmarkers. The viral load was determined from standardcurve and it was found that the WSSV susceptible popu-lation had more than 103 fold higher WSSV amplicon inμg−1 of DNA than the resistant population (Table 2).Whereas, beta actin amplicon showed no significant dif-ference in CT value (± SEM) of WSSV resistant (22.9 ±0.7) and susceptible samples (22.2 ± 1.03) distinguished byboth markers.
Table 1 Microsatellite markers associated to disease susceptibilitsignificances
Location WSSV Resistant (n = 195) WSSV Suscep
Twenty various WSSVaffected ponds
Allele(bp) # of obs Frequencya Allele(bp) #
442 74 0.39 442 1
236 40 0.21 236 9
215 73 0.39 215 1
Total 3 187 - 3 3
Chi square value was calculated and yates’ correction was applied, while the probabn: number of samples for each group.NS: not significant; ***(p ≤ 0.001): HS/highly significant.aFrequency of allele = number of observation at the given allele/total number of obWSSV susceptible population).
Sequences of WSSV susceptible DNA markersThe 442 bp and 236 bp microsatellite DNA markers weresequenced. Subsequently, NCBI BLAST programme wasperformed but no such significant similarity was foundwith the known database. This firmly indicates towards thenovelty of these sequences and their specificity to blacktiger shrimp. These sequences were submitted to NCBInucleotide database under the following GenBank IDs:KP751417 and KP751418.
WSSV resistant prevalence among the collected shrimpsusing 442 bp and 236 bp microsatellite DNA markeralong the entire coast of IndiaThe shrimp samples which appeared negative for WSSVafter nested PCR were considered for WSSV resistantprevalence calculation. Samples where the microsatellitemarkers were absent, were considered as WSSV resistant.The mean WSSV resistant prevalence using both DNA
y in Penaeus monodon: their frequencies and statistical
tible (n = 255) Chi-square Value p value Significance
of obs Frequencya
49 0.43 18.139 <0.0001*** HS
3 0.27 13.281 <0.0001*** HS
02 0.30 0.260 0.626 NS
44 - 23.480 <0.0001*** HS
ility was calculated by using fischer's exact test.
servation of all alleles in a particular population (either in WSSV resistant or

Figure 3 Mortality analysis by 442 bp and 236 bp microsatellite DNA marker after WSSV Challenge experiment. Mortality ratio betweendisease resistant and susceptible population is statistically significant (p< 0.001 and p< 0.004). In panels A and B, R1 and R2 signifies WSSV resistantpopulation based on 442 bp and 236 bp microsatellite DNA marker, respectively and S1 and S2 denoted Susceptible population based on 442 bp and236 bp microsatellite DNA marker respectively.
Chakrabarty et al. Veterinary Research (2015) 46:110 Page 6 of 10
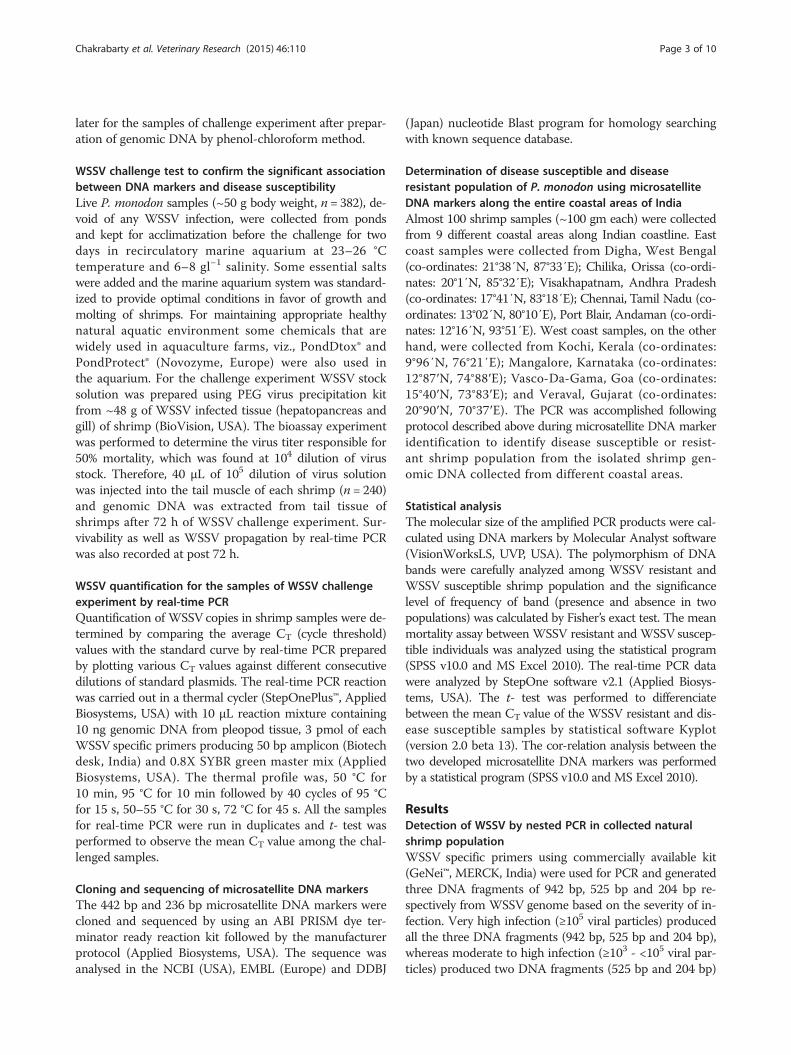
markers showed 10.5%, 85.18%, 80.28%, 90.24%, 97.8%,1.56%, 28.57%, 45.83% and 42.86% of the samples fromDigha, West Bengal; Chilika, Orissa; Visakhapatnam,Andhra Pradesh and Chennai, Tamil Nadu, Port blair,Andaman; Kochi, Kerala; Mangalore, Karnataka; Vasco-Da-Gama, Goa; Veraval, Gujarat, respectively (Figure 5).As it can be seen, WSSV resistant prevalence was high-est in Port Blair from the East coast and in Vasco-Da-Gama from the West coast, among the coastal areas ofIndia (Figure 6).
Correlation analysis in between the two microsatelliteDNA markersThe mean WSSV resistant prevalence using developed442 bp and 236 bp microsatellite DNA markers alongthe East and West coasts of India is positively corre-lated with the result of 236 bp microsatellite DNA marker(Figure 7). This strong positive correlation may indicatethat these markers belong to similar Quantitative TraitLoci (QTL).
DiscussionWhite spot disease of shrimps is a highly contagious waterborne infection, that has the ability to eradicate an entireshrimp population, within a very short period of time. Byvirtue of its brilliant adaptivity, WSSV persists in the cul-tured ponds even after they are completely dried at theend of the cultivation season. The vertical and horizontaltransmissions of this lethal virus may occur from infectedbroodstock to their offsprings, through cannibalism ofmoribund shrimps and even through water exchangebetween nearby farms [24]. Various oral vaccination ex-periments to immunize the shrimp samples by viral
envelope proteins and bacterial strains of Vibrio have beenpreviously tested [6,25]. The lack of adaptive immunity inthe invertebrate system and innate immunity being the soleline of defence, it usually results a decrease in the vaccineinduced resistance against viruses after a few days.Moreover, this exertion also has many limitations asto be applied practically in a large scale field. To gen-erate improved black tiger shrimp breeding lines withhigher survival rate, greater production in terms offeed to biomass conversion potency and reduced re-curring cost can only be done by understanding theshrimp genome constituent and inheritance modeusing DNA markers [26]. Different research groupswere involved in the development of WSSV resistantbroodstock of P. vannamei by WSSV challenge experiment[27]. Similarly, based on the clinical symptoms, the exist-ence of WSSV resistance or tolerance in P. monodon fol-lowing WSSV challenge experiment has been reported[28]. Studying the quantitative genetics of WSSV resist-ance in P. vannamei revealed that WSSV resistance is apolygenic trait with strong individual effluences in P. van-namei [29].Previously, a 71 bp microsatellite DNA marker in
P. monodon linked to WSSV susceptibility has beenreported [19]; after WSSV challenge greater viral copieswere detected by quantitave real-time PCR in WSSVsusceptible population of shrimp [20]. In this presentinvestigation, new microsatellite DNA markers thatmay be useful in identifying P. monodon populationassociated to WSSV susceptibility were detected. It hasbeen observed that a highly significant difference exists inthe microsatellite fingerprints of WSSV resistant andsusceptible populations of P. monodon. The susceptible

Figure 4 Quantitative assay of WSSV after experimental virus challenge. The amplification plots (A and D) of white spot syndrome virus(WSSV) in WSSV resistant [R1 = samples devoid of 442 bp band and R2 = samples devoid of 236 bp band] and susceptible populations [S1 = samplescontaining 442 bp band and S2 = samples containing 236 bp band] of Penaeus monodon based on 442 bp and 236 bp microsatellite DNA markerrespectively. Genomic DNA from tail tissue was amplified using WSSV (A and D) primers by real-time PCR after 72 h challenge experiment. The meanrelative WSSV was expressed as cycle threshold value, CT between [R1 and R2] and [S1 and S2] populations of P. monodon. A two sample t-test showedhighly statistically significant difference between these two populations (C and F, n = 240, P < 0.001) using both the microsatellite DNA marker.The dissociation curves for WSSV amplicon are shown in panels (B) and (E) for two populations ([R1 and R2] and [S1 and S2]) differentiated by442 bp and 236 bp microsatellite DNA marker. The Tm value indicated the same WSSV amplicon in every case.
Chakrabarty et al. Veterinary Research (2015) 46:110 Page 7 of 10
population generated two additional DNA fragmentsof 442 bp and 236 bp which were mostly absent inthe WSSV resistant population. Whereas, anotherfragment of 215 bp appeared that was omnipresent
for both the populations. Absence of product formation afteramplification with shrimp specific primers and WSSV DNAclearly suggested that, thesemicrosatellite DNAmarkerswerespecific to P. monodon. There was no sequence homology

Table 2 The absolute WSSV copy number at 72 hours post WSSV challenge
Sl No DNA Marker Mean copy number μg−1 of total extracted DNA at 72 hours post challenge p-Value Significance
WSSV Susceptible shrimps WSSV Resistant shrimps
1 442 bp 7.2 × 10⁶ 1.78 × 10³ <0.001** HS
2 236 bp 6.2 × 10⁶ 1.4 × 10³ <0.001*** HS
***(p ≤ 0.001): HS/highly significant.
Chakrabarty et al. Veterinary Research (2015) 46:110 Page 8 of 10
in between these DNA markers and the already reportedcomplete WSSV genome at NCBI/EMBL/DDBJ genbank.The main theme of this study was to describe the
natural potential for WSSV resistance in shrimp system bystudying its DNA content polymorphisms and makingit implicable in aquaculture practice. For this purpose,two populations of P. monodon were collected fromponds highly infected with WSD where almost 90-99%
Figure 5 India Map with studied area location mark up. The nine geog
black stars ( ). In the East coast samples were collected from Digha, We
Tamil Nadu and Port blair, Andaman while in the West coast samples wereGoa and Veraval, Gujarat.
of the shrimps died after the advent of WSSV infection butonly 1-10% survived in the same affected pond at the sametime [30]. These ponds were seeded with a random collec-tion of post larva obtained from the wild marine broodershaving variable genomic contents. After development ofthe markers with this WSSV infected shrimps from cultureponds, pathogen free live shrimps were again collected toperform a laboratory WSSV challenge experiment in order
raphic locations along the entire coastline of India are marked with
st Bengal; Chilika, Orissa; Visakhapatnam, Andhra Pradesh; Chennai,
collected from Kochi, Kerala; Mangalore, Karnataka; Vasco-Da-Gama,
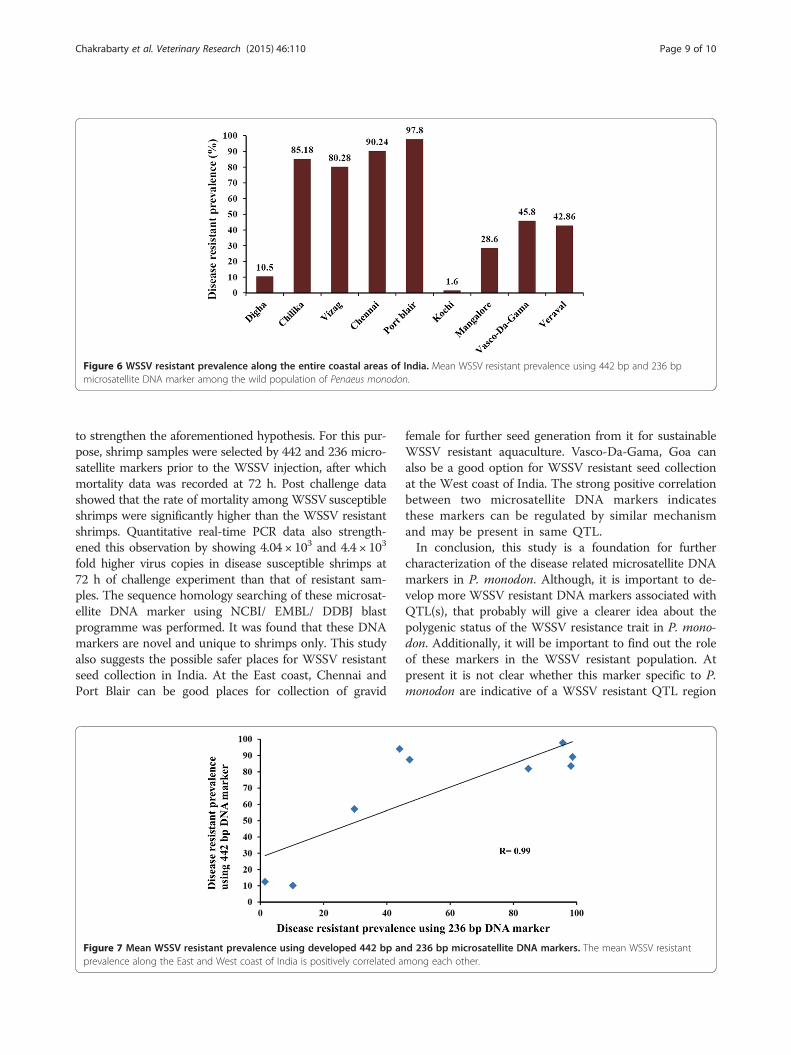
Figure 6 WSSV resistant prevalence along the entire coastal areas of India. Mean WSSV resistant prevalence using 442 bp and 236 bpmicrosatellite DNA marker among the wild population of Penaeus monodon.
Chakrabarty et al. Veterinary Research (2015) 46:110 Page 9 of 10
to strengthen the aforementioned hypothesis. For this pur-pose, shrimp samples were selected by 442 and 236 micro-satellite markers prior to the WSSV injection, after whichmortality data was recorded at 72 h. Post challenge datashowed that the rate of mortality among WSSV susceptibleshrimps were significantly higher than the WSSV resistantshrimps. Quantitative real-time PCR data also strength-ened this observation by showing 4.04 × 10³ and 4.4 × 10³
fold higher virus copies in disease susceptible shrimps at72 h of challenge experiment than that of resistant sam-ples. The sequence homology searching of these microsat-ellite DNA marker using NCBI/ EMBL/ DDBJ blastprogramme was performed. It was found that these DNAmarkers are novel and unique to shrimps only. This studyalso suggests the possible safer places for WSSV resistantseed collection in India. At the East coast, Chennai andPort Blair can be good places for collection of gravid
Figure 7 Mean WSSV resistant prevalence using developed 442 bp anprevalence along the East and West coast of India is positively correlated a
female for further seed generation from it for sustainableWSSV resistant aquaculture. Vasco-Da-Gama, Goa canalso be a good option for WSSV resistant seed collectionat the West coast of India. The strong positive correlationbetween two microsatellite DNA markers indicatesthese markers can be regulated by similar mechanismand may be present in same QTL.In conclusion, this study is a foundation for further
characterization of the disease related microsatellite DNAmarkers in P. monodon. Although, it is important to de-velop more WSSV resistant DNA markers associated withQTL(s), that probably will give a clearer idea about thepolygenic status of the WSSV resistance trait in P. mono-don. Additionally, it will be important to find out the roleof these markers in the WSSV resistant population. Atpresent it is not clear whether this marker specific to P.monodon are indicative of a WSSV resistant QTL region
d 236 bp microsatellite DNA markers. The mean WSSV resistantmong each other.

Chakrabarty et al. Veterinary Research (2015) 46:110 Page 10 of 10
or if so, then the molecular pathogenesis will be a verygood field of study. This observation also suggested thatthis marker would be useful for the generation of success-ful SPR breeding program through marker assisted selec-tion (MAS) to give a new lease of life to the aquacultureindustry.
Competing interestsThe authors declare that they have no competing interests.
Authors’ contributionsUC was invloved in performing experiments, manuscript writing, dataanalysis and data interpretation. SD performed experiments, thoroughlyrevised the manuscript and analysed data. AM did the sample collection andacquisition of data. DM was involved in the acquisition of data. NM adaptedthe concept designed experiments and was involved in manuscript writing.All authors have given final approval of the version to be published agreethat all work has been done accurately and all data are carefully checked.
AcknowledgementsTo achieve this research work successfully, Ministry of Earth Science (MoES),Govt. of India through Ocean and Atmospheric Science & Technology Cell(OASTC) of Berhampur University are acknowledged for funding support. Mr.Ajoy Mallik is thankful to the University Grants Commission for his fellowship.Mr. Debabrata Mondal is thankful to DST Inspire for his fellowship. Heartfeltthanks to Dr Santanu Biswas, Dr Bibhabasu Hazra, Dr Rhitajit Sarkar and DrAbhishek Das for their valuable suggestions in the manuscript preparation.Ranjit Kumar Das and Pradip Kumar Mallick are also acknowledged forsample collection and technical help.
Received: 27 May 2015 Accepted: 21 August 2015
References1. Fish Stat J, Fisheries and Aquaculture Department (2011) Food and
Agriculture Organization of the United Nations (FAO)., http://www.fao.org/fishery/statistics/software/fishstatj/en. Accessed 01 Dec 2011
2. Flegel TW (1997) Major viral diseases of the black tiger prawn (Penaeusmonodon) in Thailand. World J Microbiol Biotechnol 13:433–442
3. Wang CH, Lo CF, Leu JH, Chou CM, Yeh PY, Chou HY, Tung MC, Chang CF,Su M, Kou GH (1995) Purification and genomic analysis of baculovirusassociated with white spot syndrome (WSBV) of Penaeus monodon. DisAquat Organ 23:239–242
4. Durand SD, Lightner V, Redman RM, Bonami JR (1997) Ultra structure andmorphogenesis of white spot syndrome baculovirus (WSSV). Dis AquatOrgan 29:205–211
5. Yang F, He J, Lin X, Li Q, Pan D, Zhang X, Xu X (2001) Complete genomesequence of the shrimp white spot bacilliform virus. J Virol 75:11811–11820
6. Witteveldt J, Cifuentes CC, Vlak JM, van Hulten MCW (2004) Protection ofPeneaus monodon against white spot syndrome virus by oral vaccination. JVirol 78:2057–2061
7. Rameshthangam P, Ramasamy P (2007) Antiviral activity of bis (2-methylheptyl) phthalate isolate from Pongamia pinnata leaves against whitespot syndrome virus of Penaeus monodon Fabricius. Virus Res 126:38–44
8. Kim SC, Kosuke Z, Nam KY, Kim KS, Kim HK (2007) Protection of shrimp(Penaeus chinensis) against white spot syndrome virus (WSSV) challenge bydouble-stranded RNA. Fish Shellfish Immun 23:242–246
9. Sanitta P, Attasarta P, Panyima S (2014) Protection of yellow head virusinfection in shrimp by feeding ofbacteria expressing dsRNAs. J Biotechnol179:26–31
10. Welsh J, McClelland M (1990) Fingerprinting genomes using PCR witharbitrary primers. Nucleic Acids Res 18:7213–7218
11. Williams GK, Kubelik AR, Livak KL, Rafalski JA, Tingey SV (1990) DNApolymorphisms amplified by arbitrary primers are useful as genetic markers.Nucleic Acid Res 18:6531–6535
12. Penner GA, Bush A, Wise R, Kim W, Domier L, Kasha K, Laroche A, Scoles G,Molnar SJ, Fedak G (1993) Reproducibility of random amplified polymorphicDNA (RAPD) analysis among laboratories. PCR Methods Appl 2:341–345
13. Rao KK, Lakshminarasu M, Jena K (2002) DNA markers and marker-assistedbreeding for durable resistance to bacterial blight disease in rice. BiotechnolAdv 20:33–47
14. McElroy JP, Dekkers JCM, Fulton JE, O’Sullivan NP, Soller M, Lipkin E, ZhangW, Koehler KJ, Lamont SJ, Cheng HH (2005) Microsatellite markersassociated with resistance to Marek’s disease in commercial layer chickens.Poultry Sci 84:1678–1688
15. Hizer SE, Dhar AK, Klimpel KR, Garcia DK (2002) RAPD markers as predictorsof infectious hypodermal and hematopoietic necrosis virus (IHHNV)resistance in shrimp (Litopenaeus stylirostris). Genome 45:1–7
16. Xu Z, Wyrzykowski J, Alcivar-Warren A, Moss SM, Argue BJ, Arce SM, Traub M,Calderon FRO, Lotz J, Breland V (2003) Genetic Analyses for TSV-Susceptibleand TSV-Resistant Pacific White Shrimp Litopenaeus vannamei using M1Microsatellite. J World Aquacult Soc 34:332–343
17. Dong S, Kong J, Meng X, Zhang Q, Zhang T, Wang R (2008) MicrosatelliteDNA markers associated with resistance to WSSV in Penaeus(Fenneropenaeus chinensis). Aquaculture 282:138–141
18. Ciobanu DC, Bastiaansen JWM, Magrin J (2009) A major SNP resource fordissection of phenotypic and genetic variation in Pacific white shrimp(Litopenaeus vannamei). Anim Genet 41:39–47
19. Mukherjee K, Mandal N (2009) A microsatellite DNA marker developed foridentifying disease resistant population of Giant black tiger shrimp, Penaeusmonodon. J World Aquacult Soc 40:274–280
20. Dutta S, Chakrabarty U, Mallik A, Mandal N (2013) Experimental evidence forwhite spot syndrome virus (WSSV) susceptibility linked to a microsatelliteDNA marker in giant black tiger shrimp, Penaeus monodon (Fabricius). J FishDis 36:593–597
21. Chakrabarty U, Mallik A, Mondal D, Dutta S, Mandal N (2014) Assessment ofWSSV prevalence and distribution of disease resistant shrimp among the wildpopulation of Penaeus monodon along the West coast of India. J InvertebrPathol 119:12–18
22. Sambrook J, Russel DW (2001) Molecular cloning. A laboratory Manual, 3rdedn. Cold Spring Harbor Laboratory Press, New York
23. Pan YW, Chou HH, You EM, Yu HT (2004) Isolation and characterization of23 polymorphic microsatellite markers for diversity and stock analysis intiger shrimp (Penaeus monodon). Mol Ecol Notes 4:345–347
24. Chang PS, Lo CF, Wang YC, Kou GH (1996) Identification of white spotsyndrome associated baculovirus WSBV target organs in the shrimp Penaeusmonodon by in situ hybridization. Dis Aquat Organ 27:131–139
25. Chang C, Su MS, Chen HY, Lo CF, Kou GH, Liao IC (1999) Effect of dietary β-1, 3 glucan on resistance to white spot syndrome virus (WSSV) in post larvaland juvenile Penaeus monodon. Dis Aquat Organ 36:163–168
26. Sellars MJ, Dierens L, McWilliam S, Little B, Murphy B, Coman GJ, BarendseW, Henshall J (2012) Comparison of microsatellite and SNP DNA markers forpedigree assignment in Black Tiger shrimp, Penaeus monodon. Aquac Res45:417–426
27. Gitterle T, Salte R, Gjerde B, Cock J, Johansen H, Salazar M, Lozano C, Rye M(2005) Genetic (co) variation in resistance to white spot syndrome virus(WSSV) and harvest weight in Penaeus (Litopenaeus) vannamei. Aquaculture246:139–149
28. Maheswarudu G (2007) Evidence of the existence of resistance/tolerance toWSSV in Penaeus monodon. In: Aquaculture and Marine Biotechnology.National Centre for Aquatic Animal Health, CUSAT, Kerala, India
29. Perez F, Volckaert FAM, Calderon J (2005) Pathogenicity of white spotsyndrome virus on postlarvae and juvenile of Penaeus (Litopenaeus)vannamei. Aquaculture 250:586–591
30. Lightner DV (1996) A handbook of pathology and diagnostic procedures fordiseases of penaeid shrimp. World Aquaculture Society, Baton Rouge, LA, USA