the evolution of nuclear microsatellite dna markers...
TRANSCRIPT

THE EVOLUTION OF NUCLEAR MICROSATELLITE DNA MARKERS AND
THEIR FLANKING REGIONS USING RECIPROCAL COMPARISONS
WITHIN THE AFRICAN MOLE-RATS (RODENTIA: BATHYERGIDAE)
A Dissertation
by
COLLEEN MARIE INGRAM
Submitted to the Office of Graduate Studies of
Texas A&M University in partial fulfillment of the requirements for the degree of
DOCTOR OF PHILOSOPHY
August 2005
Major Subject: Genetics

THE EVOLUTION OF NUCLEAR MICROSATELLITE DNA MARKERS AND
THEIR FLANKING REGIONS USING RECIPROCAL COMPARISONS
WITHIN THE AFRICAN MOLE-RATS (RODENTIA: BATHYERGIDAE)
A Dissertation
by
COLLEEN MARIE INGRAM
Submitted to the Office of Graduate Studies of Texas A&M University
in partial fulfillment of the requirements for the degree of
DOCTOR OF PHILOSOPHY
Approved by:
Chair of Committee, Rodney L. Honeycutt Committee Members, James B. Woolley John W. Bickham Clare A. Gill Chair of Genetics Faculty, Geoffrey M. Kapler
August 2005
Major Subject: Genetics

iii
iii
ABSTRACT
The Evolution of Nuclear Microsatellite DNA Markers and Their Flanking Regions
Using Reciprocal Comparisons within the African Mole-rats (Rodentia: Bathyergidae).
(August 2005)
Colleen Marie Ingram, B.S., California State University, Long Beach
Chair of Advisory Committee: Dr. Rodney L. Honeycutt Microsatellites are repetitive DNA characterized by tandem repeats of short
motifs (2 – 5 bp). High mutation rates make them ideal for population level studies.
Microsatellite allele genesis is generally attributed to strand slippage, and it is assumed
that alleles are caused only by changes in repeat number. Most analyses are limited to
alleles (electromorphs) scored by mobility only, and models of evolution rarely account
for homoplasy in allele length. Additionally, insertion/deletion events (indels) in the
flanking region or interruptions in the repeat can obfuscate the accuracy of genotyping.
Many investigators use microsatellites, designed for a focal species, to screen for
genetic variation in non-focal species. Comparative studies have shown different
mutation rates of microsatellites in different species, and even individuals. Recent
studies have used reciprocal comparisons to assess the level of polymorphism of
microsatellites between pairs of taxa.
In this study, I investigated the evolution of microsatellites within a phylogenetic
context, using comparisons within the rodent family Bathyergidae. Bathyergidae
represents a monophyletic group endemic to sub-Saharan Africa and relationships are

iv
iv
well supported by morphological and molecular data. Using mitochondrial and nuclear
DNA, a robust phylogeny was generated for the Bathyergidae. From my results, I
proposed the new genus, Coetomys.
I designed species-specific genotyping and microsatellite flanking sequence
(MFS) primers for each genus. Sequencing of the MFS provided direct evidence of the
evolutionary dynamics of the repeat motifs and their flanking sequence, including
rampant electromorphic homoplasy, null alleles, and indels. This adds to the growing
body of evidence regarding problems with genotype scores from fragment analysis. A
number of the loci isolated were linked with repetitive elements (LTRs and SINEs),
characterized as robust phylogenetic characters. Results suggest that cryptic variation in
microsatellite loci are not trivial and should be assessed in all studies.
The phylogenetic utility of the nucleotide variation of the MFS was compared to
the well-resolved relationships of this family based on the 12S/TTR phylogeny.
Variation observed in MFS generated robust phylogenies, congruent with results from
12S/TTR. Finally, a number of the indels within the MFS provided a suite of suitable
phylogenetic characters.

v
v
DEDICATION
I dedicate this body of work to my parents, who have always encouraged me to
explore my interests, no matter what direction I decided to take, and opening up the
world to me from the beginning, including camping and an appreciation for the natural
world. To Sally, who has given me so much, including the strength to be my own
person and push to the end. To my Nana and Aunt Do, who weren’t here but I hope
would be proud. To my precious Hildie, who was with me until the end, giving me tail
wags, nudges, and kisses when I needed them most. And of course, to the love of my
life, Laurence, who sees in me something that I often can’t, helps me find my words,
inspires me to be the best scientist that I can be, and so much more…

vi
vi
ACKNOWLEDGEMENTS
I would like to acknowledge and thank the following people: Rodney Honeycutt,
my advisor, for his previous hard work in amassing the specimen collection necessary
for this study and who took me in, allowing me the independence I needed to solidify
this body of work; my committee members, John Bickham, who is always a friendly
face and provided me with one of my many teaching positions; James Woolley, who
provided me with a strong foundation in phylogenetics and whose chuckles always
brightened my day; and special thanks to Clare Gill, who picked up the slack in the
Davis lab and gave me a place to do molecular evolution in an Animal Science lab. Her
support and encouragement were paramount to my success during my graduate
experience at A&M. A special thanks to Hynek Burda, University of Essen, while not a
committee member, has acted in an adjunct capacity and has been extremely supportive
throughout this project. Thank you to Colette Abbey, of the Gill lab, for her laboratory
assistance and for enduring my numberous questions. I would like to thank Duane
Schlitter, for his outstanding collection of African small mammal references. Thank you
to Ron Adkins, for his assistance with running r8s. And a special thanks to Anthony
Cognato for stepping up and providing me with employment when no one else would,
allowing me to survive my last year and complete my dissertation, and to both him and
his wife, April Harlin-Cognato, for their friendship, empathy, and appreciation for life
outside of College Station. A number of individuals and institutions provided samples
from their collections and museums: (1) D. Schlitter and S. McLaren, Carnegie Museum
of Natural History, (2) D. Kock, Senckenberg Museum, and (3) I.R. Rautenbach,

vii
vii
Transvaal Museum. For assistance in field collections, I want to thank: W.N. Chitaukali,
T. Dhliwayo, G.L. Dryden, B.H. Erasmus, M. Kawalika, J.-L. Meier, I.R. Rautenbach,
A. Scharff, D. Schlitter, R. Sumbera, and P. Van Daele. I also want to thank the
numerous collaborators in this ongoing project, including H. Burda, P. Dammann, S.
Braude, D. Schlitter, M. Allard, E. Nevo, M. Kawalika, D. Kock, I. Rautenbabach, B.
Erasmus, W. Chitikauli, R. Sumbera, P. van Daele, and A. Scharff.
Special thanks to my parents, Judd and Nancy Ingram, who have given me so
much support, encouragement and enthusiasm for my research. Thank you to Sally
Tolle, my other mom, who is such a strong woman, who applauded me for tolerating her
son, and who shows a passion and excitement for my research endeavors as if I were her
own kid. And most of all, to my love, Laurence, who I could not have done this
without, thank you for helping me throughout every aspect of this project, from literature
searches, through long nights in the lab, to editing, for laughing at me when I need to be
laughed at, holding me up when I have doubts, believing in my abilities even more than I
do, and showing such excitement with each new result.

viii
viii
TABLE OF CONTENTS
Page
ABSTRACT ................................................................................................................. iii
DEDICATION .............................................................................................................. v
ACKNOWLEDGEMENTS .......................................................................................... vi
TABLE OF CONTENTS............................................................................................ viii
LIST OF TABLES........................................................................................................ xi
LIST OF FIGURES.................................................................................................... xiv
CHAPTER
I INTRODUCTION.................................................................................... 1
II MOLECULAR PHYLOGENETICS AND TAXONOMY OF THE AFRICAN MOLE-RATS, GENUS CRYPTOMYS AND THE NEW GENUS COETOMYS GRAY, 1864........................................................ 11
1. Introduction ........................................................................ 11 2. Materials and Methods........................................................ 18
2.1. Taxon sampling and DNA isolation......................... 18 2.2. PCR amplification and nucleotide sequencing ......... 18 2.3. Data analyses .......................................................... 21
3. Results ................................................................................ 24 3.1. Phylogenetic relationships based on 12S rRNA gene....................................................................... 24 3.2. Phylogenetic relationships based on TTR intron 1... 28 3.3. Phylogenetic relationships based on combined datasets .................................................................. 30
4. Discussion .......................................................................... 32 4.1. Corrections to previous taxonomic designations ...... 32 4.2. Chromosomal diversity ........................................... 33 4.3. Comments on the status of the genus Cryptomys..... 36 4.4. Divergence estimates .............................................. 40 4.5. Phylogenetic and biogeographic implications.......... 42 4.6. Patterns of intrageneric variation............................. 44
5. Conclusions ........................................................................ 47

ix
ix
CHAPTER Page
III DEVELOPMENT AND CHARACTERIZATION OF NOVEL MICROSATELLITE MARKERS FOR THE SIX GENERA OF BATHYERGIDAE (RODENTIA) AND THEIR UTILITY IN OTHER MEMBERS OF THE FAMILY ................................................ 48
1. Introduction ........................................................................ 48 2. Materials and Methods........................................................ 53
2.1. Microsatellite library and primer construction .......... 53 2.2. Taxon sampling........................................................ 55 2.3. Microsatellite amplification, genotyping, and
sequencing............................................................. 56 2.4. Data analyses ........................................................... 56
3. Results and Discussion........................................................ 57 3.1. Amplification and variation within focal taxa........... 57 3.2. Application and variation in non-focal taxa .............. 61
4. Conclusions ........................................................................ 70
IV CHARACTERIZING MICROSATELLITE LOCI AND THEIR PRIMER SITES BY DIRECT SEQUENCING: MOTIF DECAY, ELECTROMORPHIC HOMOPLASY, AND NULL ALLELES ............ 71
1. Introduction ......................................................................... 71 2. Materials and Methods......................................................... 73
2.1. Genomic library and primer construction ................. 73 2.2. Screening of genotyping and flanking sequence primer sets ............................................................. 74 2.3. Data analyses (Characterization of loci) ................... 76
3. Results ................................................................................ 80 3.1. Genotyping .............................................................. 80 3.2. Characterization of the microsatellite motifs and their immediate flanking sequences........................ 89
4. Discussion ........................................................................ 147 4.1. Comparison of microsatellite panels based on
genotyping data ................................................... 147 4.2. Comparisons of repeat motifs and the function of
sequence data....................................................... 149 4.3. Is ascertainment bias a problem? ............................ 150 4.4. Electromorphic size homoplasy.............................. 150 4.5. Null alleles............................................................. 151 4.6. Rare genomic changes (RGC) ................................ 152
5. Conclusions ....................................................................... 153

x
x
CHAPTER Page
V THE UTILITY OF MICROSATELLITE FLANKING SEQUENCES AS DATA IN PHYLOGENETIC RECONSTRUCTION...................... 155
1. Introduction ...................................................................... 155 2. Materials and Methods...................................................... 159
2.1. Taxon sampling and DNA isolation........................ 159 2.2. Microsatellite flanking region amplification and
sequencing........................................................... 159 2.3. Data analyses ........................................................ 161
3. Results .............................................................................. 163 3.1. Success of sequencing effort across MFS loci ....... 163 3.2. Phylogenetic analyses of 16 microsatellite flanking sequences............................................... 163 3.3. Combined data sets ................................................ 182
4. Discussion ........................................................................ 185 4.1. Utility of flanking sequences in phylogenetic
reconstruction ...................................................... 185 4.2. Combined analysis ................................................ 186
5. Conclusions ....................................................................... 187 VI SUMMARY...................................................................................... 188
REFERENCES.......................................................................................................... 191
APPENDIX............................................................................................................... 210
VITA......................................................................................................................... 211

xi
xi
LIST OF TABLES
TABLE Page
2.1 Estimation of the ages of the lineages within the family Bathyergidae using non-parameteric rate smoothing........................................................ 41
3.1 Characterization of seven polymorphic microsatellite loci isolated from Heliopbobius argenteocinereus.................................................................. 58
3.2 Characterization of 6 polymorphic microsatellite loci isolated from Georychus capensis. .................................................................................. 59
3.3 Characterization of 5 polymorphic microsatellite loci isolated from Bathyergus suillus...................................................................................... 62
3.4 Characterization of 5 polymorphic microsatellite loci isolated from Cryptomys hottentotus. .............................................................................. 63
3.5 Characterization of 5 polymorphic microsatellite loci isolated from Coetomys mechowii. .................................................................................. 64
3.6 Characterization of seven polymorphic microsatellite loci isolated from Heterocephalus glaber............................................................................... 65
3.7 Number of alleles observed at each microsatellite loci designed from Heliophobius argenteocinereus (Harg), Georychus capensis (Gcap), Bathergus suillus (Bsuil), Cryptomys hottentotus (Chott), Coetomys mechowii (Cmech), and Heterocephalus glaber (Hglab). ........................... 67
4.1 Observed and expected heterozygosities (obs/exp) calculated using data from microsatellite loci designed from Heliophobius argenteocinereus (Harg), Georychus capensis (Gcap), Bathergus suillus (Bsuil), Cryptomys hottentotus (Chott), Coetomys mechowii (Cmech), and Heterocephalus glaber (Hglab)............................................................................................ 78
4.2 Range of alleles observed at microsatellite loci designed from Heliophobius argenteocinereus (Harg), Georychus capensis (Gcap), Bathergus suillus (Bsuil), Cryptomys hottentotus (Chott),
Coetomys mechowii (Cmech), and Heterocephalus glaber (Hglab). ........... 79
4.3 Comparison of number of loci with the longest alleles, number of loci with the highest number of alleles, and range of alleles for focal and non-focal taxa for each microsatellite panel. .............................................. 90

xii
xii
TABLE Page 4.4 Observed sequence length, repeat motif, indels, additional repetitive regions, and changes in the primer sites for locus Harg02. ......................... 91 4.5 Observed sequence length, repeat motif, and indels documented for locus Harg03.............................................................................................. 93 4.6 Observed sequence length, repeat motif, indels, additional repetitive regions, and changes in the primer sites for locus Harg07. ......................... 95 4.7 Observed sequence length, repeat motif, indels, additional repetitive regions, and changes in the primer sites for locus Gcap01. ......................... 97 4.8 Observed sequence length, repeat motif, indels, additional repetitive regions, and changes in the primer sites for locus Gcap07. ......................... 99 4.9 Observed sequence length, repeat motif, indels, additional repetitive regions, and changes in the primer sites for locus Bsuil01.. ...................... 101 4.10 Observed sequence length, repeat motif, indels, and changes in the primer sites for locus Bsuil04................................................................... 103 4.11 Observed sequence length, repeat motif, indels, and changes in the primer sites for locus Bsuil06................................................................... 105 4.12 Observed sequence length, repeat motif, indels, and changes in the primer sites for locus Chott01. ................................................................. 107 4.13 Observed sequence length, repeat motif, indels, and changes in the primer sites for locus Chott03. ................................................................. 109 4.14 Observed sequence length, repeat motif, indels, and changes in the primer sites for locus Chott08. ................................................................. 111 4.15 Observed sequence length, repeat motif, indels, additional repetitive regions, and changes in the primer sites for locus Cmech03. .................... 113 4.16 Observed sequence length, repeat motif, indels, additional repetitive regions, and changes in the primer sites for locus Cmech04. .................... 115 4.17 Observed sequence length, repeat motif, indels, and changes in the primer sites for locus Cmech09................................................................ 117

xiii
xiii
TABLE Page 4.18 Observed sequence length, repeat motif, indels, additional repetitive regions, and changes in the primer sites for locus Cmech11. .................... 119
4.19 Observed sequence length, repeat motif, indels, and changes in the Hglab10-R primer site for locus Hglab10................................................. 121 4.20 Microsatellite loci with confirmation of null alleles ................................. 124 4.21 Detection of electromorphic homoplasies................................................. 127 5.1 Phylogenetic use of microsatellite flanking sequences (MFS). ................. 164

xiv
xiv
LIST OF FIGURES FIGURE Page
2.1 Sampling localities for specimens. ............................................................. 13 2.2 12S rRNA maximum-likelihood phylogeny under GTR + Γ + I ................. 25 2.3 TTR Intron I maximum-likelihood phylogeny under HKY85 + Γ .............. 29 2.4 Combined data (12S rRNA and TTR Intron I) maximum-likelihood
phylogeny under GTR + Γ + I.................................................................... 31 2.5 Diploid numbers (2N) mapped on the12S rRNA phylogeny....................... 35 4.1 Two scenarios of microsatellite flanking sequence (MFS) primer design. .. 75 4.2 Microsatellite repeat motif of Harg02 plotted on the phylogeny based on Ingram et al. 2004. ................................................................................ 92 4.3 Microsatellite repeat motif of Harg03 plotted on the phylogeny based on Ingram et al. 2004.. ............................................................................... 94 4.4 Microsatellite repeat motif of Harg07 plotted on the phylogeny based on Ingram et al. 2004. ................................................................................ 96 4.5 Microsatellite repeat motif of Gcap01 plotted on the phylogeny based on Ingram et al. 2004. ................................................................................ 98 4.6 Microsatellite repeat motif of Gcap07 plotted on the phylogeny based on Ingram et al. 2004. .............................................................................. 100 4.7 Microsatellite repeat motifs of Bsuil01 plotted on the phylogeny based on Ingram et al. 2004. .............................................................................. 102 4.8 Microsatellite repeat motif of Bsuil04 plotted on the phylogeny based on Ingram et al. 2004.. ............................................................................. 104 4.9 Microsatellite repeat motif of Bsuil06 plotted on the phylogeny based on Ingram et al. 2004. .............................................................................. 106
4.10 Microsatellite repeat motif of Chott01 plotted on the phylogeny based on Ingram et al. 2004.. ............................................................................. 108
xv
xv
FIGURE Page 4.11 Microsatellite repeat motif of Chott03 plotted on the phylogeny based on Ingram et al. 2004.. ............................................................................. 110 4.12 Microsatellite repeat motif of Chott08 plotted on the phylogeny based on Ingram et al. 2004. .............................................................................. 112 4.13 Microsatellite repeat motif of Cmech03 plotted on the phylogeny based on Ingram et al. 2004. .............................................................................. 114 4.14 Microsatellite repeat motif of Cmech04 plotted on the phylogeny based on Ingram et al. 2004.. ............................................................................. 116 4.15 Microsatellite repeat motif of Cmech09 plotted on the phylogeny based on Ingram et al. 2004 ............................................................................... 118 4.16 Microsatellite repeat motif of Cmech11 plotted on the phylogeny based on Ingram et al. 2004 ............................................................................... 120 4.17 Microsatellite repeat motif of Hglab10 plotted on the phylogeny based on Ingram et al. 2004.. ............................................................................. 122 5.1 Bsuil06 microsatellite flanking sequence maximum-likelihood phylogeny under GTR ............................................................................. 165 5.2 Cmech03 microsatellite flanking sequence maximum-likelihood phylogeny under K80............................................................................... 166 5.3 Cmech09 microsatellite flanking sequence maximum-likelihood phylogeny under TrN + G........................................................................ 167 5.4 Bsuil01 microsatellite flanking sequence maximum-likelihood phylogeny under K80+G.......................................................................... 168 5.5 Cmech04 microsatellite flanking sequence maximum-likelihood phylogeny under K80 + G........................................................................ 169 5.6 Harg03 microsatellite flanking sequence maximum-likelihood phylogeny under K80............................................................................... 170
5.7 Harg02 microsatellite flanking sequence maximum-likelihood phylogeny under K80............................................................................... 171

xvi
xvi
FIGURE Page
5.8 Harg07 microsatellite flanking sequence maximum-likelihood phylogeny under K80............................................................................... 172 5.9 Chott03 microsatellite flanking sequence maximum-likelihood phylogeny under HKY85. ........................................................................ 173 5.10 Gcap07 microsatellite flanking sequence maximum-likelihood phylogeny under K80............................................................................... 175 5.11 Chott01 microsatellite flanking sequence maximum-likelihood phylogeny under K81uf + G .................................................................... 176 5.12 Chott08 microsatellite flanking sequence maximum-likelihood phylogeny under GTR ............................................................................. 177 5.13 Cmech11 microsatellite flanking sequence maximum-likelihood phylogeny under TrN............................................................................... 178 5.14 Gcap01 microsatellite flanking sequence maximum-likelihood phylogeny under K80............................................................................... 179 5.15 Bsuil04 microsatellite flanking sequence maximum-likelihood phylogeny under HKY85......................................................................... 180 5.16 Hglab10 microsatellite flanking sequence maximum-likelihood phylogeny under K80............................................................................... 181 5.17 Combined maximum-likelihood phylogeny of Cmech04, Gcap01, and Hglab10 under TVM + G .................................................................. 183 5.18 Combined maximum-likelihood phylogeny of all 16 microsatellite flanking sequence (MFS) loci under TVM + G ........................................ 184

1
1
CHAPTER I
INTRODUCTION
Microsatellites are regions of DNA containing simple sequence motifs (2-6 bp in
length) that are repeated in tandem up to 100 times (Tautz, 1993; Zhivotovsky and
Feldman, 1995). Currently, microsatellite loci are considered the marker of choice for
population genetics (Bowcock et al., 1994; Gardner et al., 2000; Sunnucks, 2000). In
addition, they have been used extensively for paternity and kinship assessment (Altet et
al., 2001), forensic identification (Edwards et al., 1992), epidemiology of infectious
diseases (Wang et al., 2001), and genome mapping (Causse et al., 1994; Dib et al., 1996;
Su and Willems, 1996). Many microsatellite loci are characterized by moderate to high
levels of polymorphism associated with the repeat region and sequence conservation in
the flanking regions where site-specific PCR (polymerase chain reaction) primers can be
made for the amplification of orthologous loci across individuals within a species. In
addition, many loci isolated from one species (the focal species) can be used in genetic
studies of related species (non-focal species), thus providing a high yield of genetic
information with little start-up investment (Clisson et al., 2000; Glenn et al., 1996;
Fitzsimmons et al., 1995; Jordan et al., 2002; Moore et al., 1991).
____________ This dissertation follows the style of Molecular Phylogenetics and Evolution.

2
2
Microsatellites are ideal for intraspecific and population level studies because of
their high mutation rate that has been documented to be 10-5 to 10-2 per generation
(Edwards et al., 1992; Macaubas et al., 1997). Other markers that have been applied to
studies at similar levels of taxonomic divergence (allozymes, mtDNA, etc.) usually
cannot provide sufficient variation when comparing closely related individuals
(Fitzsimmons et al., 1995). The high mutation rate observed in microsatellites is due to
increases or decreases in the number of repeat units as a result of either slip-strand
mispairing or unequal crossing-over (Levinson and Gutman, 1987). Slip-strand
mispairing (SSM) occurs during the process of DNA replication, when the DNA
polymerase is believed to “slip,” causing the newly synthesized fragment of DNA to
become misaligned with the template. For continued replication of the template strand,
the two strands must be realigned. If the realignment is not perfect, then a mutation will
be generated, generally resulting in changes to the number of tandem repeat elements. It
is expected that SSM will occur in microsatellites at an increased rate due to their
repetitive nature (Streisinger et al., 1966). The instability of microsatellite DNA also has
been attributed to unequal crossing-over (UCO) within the microsatellite repeat. It is
believed that misalignment along the repeating sequence of homologous chromosomes
during meiosis increases the likelihood of UCO. While multiple studies support the
SSM model to account for the majority of mutation events in microsatellite DNA
(Levinson and Gutman, 1987; Macaubas et al., 1997; Schlötterer and Tautz, 1992;
Strand et al., 1993), UCO has been shown to be a contributor to the instability of these
regions, as evidenced by changes in the flanking regions (Gardner et al., 2000; Jin et al.,

3
3
1996; Primmer et al., 1998).
Although SSM and UCO explain the mechanism by which new mutations, or
alleles, can be produced in microsatellite DNA, an adequate evolutionary model is
necessary for the quantitative assessment of genetic variation within and between
populations. Two of the most frequently applied models are the infinite alleles model
(IAM: Kimura and Crow, 1964) and the stepwise mutation model (SMM: Kimura and
Ohta, 1978). These models both assume that mutation rate is constant across all loci and
for all alleles at a single locus (Goldstein et al., 1995b; Shriver et al., 1993; Slatkin,
1995; Valdes et al., 1993). The IAM assumes no homoplasy with each new mutation
creating a novel allele (Estoup and Cornuet, 1999). Therefore, if two alleles are identical
by state (IBS), then they must also be identical by decent (IBD). Data analyzed under
IAM are limited to alleles (electromorphs) scored by mobility only, without information
about repeat number. While this model is not realistic because mutations in these loci
and restrictions in maximum length make homoplasy virtually inevitable, it is useful as a
standard (or null) for comparison with other models. The SMM explains mutations as
single additions or deletions of the repeat unit due to strand slippage (Valdes et al.,
1993). Therefore, alleles that are identical by state are not assumed to be IBD, allowing
for size homoplasy (Estoup et al., 1995). Although the IAM and SMM are extreme
models, they are incorporated into most of the statistical/analytical software available to
analyze microsatellite data, with the assumption that the true model falls somewhere
between the two extremes. Recently, additional models have been developed or
revisited as a means of explaining the intermediate distributions of microsatellite alleles

4
4
found in natural populations. The K-allele Model (KAM: Crow and Kimura, 1970;
Crow, 1986) was the first modification of the IAM and is receiving renewed
consideration in the search for more appropriate models. Like the IAM, the KAM
defines each mutation event as unique, resulting in a novel allele, but places limitations
on the number of alleles possible (Estoup and Cornuet, 1999). The Two-Phase Model
(TPM: Di Rienzo et al., 1994) allows for gain/loss of X number of repeats, assuming that
single step changes are most frequent, but allowing for larger jumps in repeat number.
While modifications of this model provide allowances for rate variation between loci
and an allele length ceiling (Feldman et al., 1997), no current models address the known
complexities of microsatellite DNA evolution.
Many different factors have been shown to influence mutation rates of
microsatellites. Variation in mutation rates across multiple loci or within different
lineages is common (Crozier et al., 1999; Gardner et al., 2000; Primmer and Ellegren,
1998; Weber and Wong, 1993). It also has been suggested that rates can vary among
alleles at a single locus (Jin et al., 1996). Alleles with greater number of repeats
generally demonstrate increased mutation rates (Macaubas et al., 1997; Primmer et al.,
1996a; Weber, 1990). Longer repeat stretches offer more opportunities for slippage
events resulting in a positive correlation between allele size and mutation rate at a locus
(Primmer et al., 1998). Through the use of cell lines and deep pedigrees, several studies
support a bias toward expansions in repeat number (Amos et al., 1996; Ellegren, 2000;
Primmer et al., 1998, 1996a; Weber and Wong, 1993). This expansion appears to be
limited by as yet undefined mechanisms, enforcing upper limits on allele sizes (Bowcock

5
5
et al., 1994; Garza et al., 1995; Primmer et al., 1998). Mutation rates and the direction
of mutations have been shown to differ between sexes in both human and non-human
studies (Primmer et al., 1998; Weber and Wong, 1993). The structure of the repeat array
can influence mutation rates (Estoup et al., 1995). In general, disease-causing
trinucleotide loci have shown the highest mutation rates, followed by dinucleotide, non-
disease trinucleotide, and tetranucleotide loci in decreasing order (Chakraborty et al.,
1997; Schug et al., 1998). A number of studies, however, found extraordinarily high
mutation rates in rare non-disease-causing tetranucleotide loci (Gardner et al., 2000;
Primmer et al., 1996a). Complex repeats have been documented to have slower
mutation rates than intact repeat motifs (Chung et al., 1993; Estoup et al., 1995).
Interrupting point mutations within a repeat motif are believed to slow down mutation
rate and have been linked to the “death” of microsatellite loci (Chung et al., 1993;
Macaubas et al., 1997). Among individuals, mutation rates have been shown to increase
in heterozygotes with large size differences between alleles, relative to heterozygotes
with small size differences (heterozygote instability)(Amos et al., 1996). The base
composition of flanking sequences also has been shown to influence mutation rate and
high GC content of flanking regions appears to be negatively-correlated with allelic
diversity (Glenn et al., 1996).
Although these markers can provide the necessary amount of polymorphism at
the population level, there are problems with their current application, usually as the
result of limited knowledge of the markers being used (Primmer et al., 1998). One
problem with the current use of microsatellite markers is that the complexity in the

6
6
repeat patterns of loci is not usually accounted for in either model selection or the
interpretation of results. Studies that use perfect dinucleotide repeats, have shown
support for the stepwise mutation model, although most are limited to species-specific
markers in population level work (Bell and Jurka, 1997). Any expansion to comparisons
at higher taxonomic levels could be compromised by lineage-specific mutation rates. To
reduce costs, microsatellite primers previously designed for a focal species are used to
screen for genetic variation in non-focal species (Fitzsimmons et al., 1995; Glenn et al.,
1996; Jordan et al., 2002; Moore et al., 1991). Any successfully amplified loci that show
any degree of polymorphism are then included, under the assumption that the nature of
variation at each microsatellite locus will be comparable to that of the species from
which the primers were originally designed. It is assumed that detectable “alleles” are
caused only by changes in repeat number. More importantly, most investigators score
electromorphs as alleles, based on migration of an amplified fragment (fragment
analysis). Scoring alleles by product length alone cannot detect “cryptic”
electromorphic homoplasy of alleles. When microsatellite alleles are sequenced, it has
often been discovered that the variability is due to an insertion/deletion (indel) event
within the flanking sequence or varying changes along a complex repeat motif (e.g.,
(CA)8(CG)10 to (CA)9(CG)10 versus (CA)8(CG)10 to (CA)8(CG)11) (Angers and
Bernatchez, 1997; Colson and Goldstein, 1999; Estoup et al., 1995; Jin et al., 1996; Ortí
et al., 1997; Schlötterer, 2001; van Oppen et al., 2000). If undetected, this homoplasy
will lead to inaccurate measurements of population statistics (heterozygosity, diversity,
effective population size, migration rates, etc.). Additionally, most models assume that

7
7
markers have equal mutation rates, both among sites and among taxa. Comparative
studies have shown that the mutation rates at microsatellite loci are not equal in different
species, populations, and even individuals (Cooper et al., 1998; Crawford et al., 1998;
Glenn et al., 1996; Rubinsztein et al., 1995; van Oppen et al., 2000). A recurring
observation is higher levels of polymorphism in the taxa from which the markers were
originally designed, suggesting increased mutation rates in the focal species. These
trends have usually been explained as a result of an ascertainment bias toward higher
levels of polymorphism in the focal species due to the qualifiers (amplification success,
product length, number of repeats, etc.) used for the initial selection of a locus as a
marker for the focal species (Ellegren et al., 1995; Jordan et al., 2002; Primmer et al.,
1996b). One caveat to accepting ascertainment bias alone, as an explanation for the
differences in the levels of polymorphism observed, is that most studies examine the
behavior of proven markers (previously designed for a focal taxon) in other related taxa
without reciprocal tests. Since most previous studies compared only two taxa (focal
versus non-focal), they are limited in their ability to uncover the mechanisms responsible
for differences in levels of polymorphism. While many of these studies may show true
ascertainment bias, they fail to provide unbiased data for alternative explanations.
Recent studies do not support the ascertainment bias hypothesis, but rather support
directional evolution in which a particular species would tend to gain or lose repeats
across all loci in concert (Cooper et al., 1998; Crawford et al., 1998; Ellegren et al.,
1995; Estoup et al., 1995; Zhu et al., 2000).
Recently the utility of microsatellites as phylogenetic markers has been assessed

8
8
(Arévalo et al., 2004; Jin et al., 1996; Ortí et al., 1997; Schlötterer, 2001; Zardoya et al.,
1996). The results were mixed with some microsatellites showing sound phylogenetic
information, particularly imperfections within the repeat motif, while the utility of
perfect repeats was limited to closely related taxa (Zhu et al., 2000). Although these
studies have provided more information on the value of microsatellites as informative
genetic markers, each was limited to few loci, analogous to earlier work with single
locus mtDNA gene trees (Avise, 1994).
The goal of this study is to investigate the evolutionary processes of
microsatellite DNA within a phylogenetic context using reciprocal comparisons within
and among the genera of African mole-rats (Bathyergidae: Rodentia). Many
characteristics make Bathyergidae an ideal model for evolutionary studies. African
mole-rats represent a monophyletic group endemic to sub-Saharan Africa and
relationships among the genera are well supported by morphological, chromosomal, and
nuclear and mitochondrial DNA sequence data (Chapter II; Allard and Honeycutt, 1992;
Faulkes et al., 1997; Honeycutt et al., 1987; Ingram et al., 2004; Janecek et al., 1992;
Walton et al., 2000). Prior to the current study, there were five recognized genera:
Heterocephalus (1 sp) and Heliophobius (1 sp), which are restricted in distribution to
Eastern Africa; Bathyergus (2 sp) and Georychus (1sp), which are limited to southern
Africa; and, the broadly distributed and specious genus Cryptomys (11 species currently
recognized), whose range extends from Ghana in west Africa to southern Sudan and
northern Angola in east Africa, and south to the Cape Province of South Africa (Aguilar,
1993; Burda et al., 1999; Faulkes et al.,1997; Honeycutt et al., 1987; Macholán et al.,

9
9
1993; Walton et al., 2000). Within Cryptomys, were two well-defined monophyletic
clades: the southern hottentotus species group and the mechowii group that includes all
other forms (Bennett and Faulkes, 2000; Walton et al., 2000). All species of the family
are strictly fossorial and have been much studied due to their unique life histories
(Bennett and Faulkes, 2000; Sherman, et al., 1991). As with other families of fossorial
rodents, bathyergids exhibit high levels of chromosomal evolution. All species in
Heterocephalus, Georychus, Bathyergus and the C. hottentotus group have fixed diploid
numbers, ranging from 54 to 60. A recent paper describes a second karyotype within
Heliophobius (Scharff et al., 2001). In contrast, the C. mechowii group shows high
levels of chromosomal evolution (ranging from 40 to 72), coupled with lower levels of
sequence divergence, suggesting the rapid and isolating effect of changes in
chromosome number (Ingram et al., 2004). Among bathyergids, population structure
ranges from solitary to the highly structured social system of the naked mole-rat,
Heterocephalus. The genus Heterocephalus was the first mammalian species to be
documented as eusocial, with colonies showing a definitive caste system analogous to
the social insects (Jarvis, 1981). Because of their varying life histories, differences in
effective population size, and chromosomal evolution, this family is ideal for
investigating the evolution of microsatellites and their flanking regions.
Previous molecular and morphological studies have focused on relationships
among genera and the placement of Bathyergidae, relative to other families of
hystricognath rodents (Allard and Honeycutt, 1992; Faulkes et al., 1997; Honeycutt et
al., 1987; Janecek et al., 1992;Walton et al., 2000). Although molecular data have

10
10
contributed to the resolution of relationships among genera in Bathyergidae and the
placement of the family relative to other families, few studies have been conducted on
geographic variation within either genera or species. For instance, considerable
allozyme (Filippucci et al., 1997, 1994; Janacek et al., 1992; Nevo et al., 1987),
chromosome (Burda et al., 1999), and nucleotide sequence variation (Faulkes et al.,
1997; Walton et al., 2000) has been reported in Cryptomys, yet no study has thoroughly
documented patterns of genetic variation throughout the distribution of the genus. In
Chapter II, a well-supported phylogeny is recovered for the family using both
mitochondrial (12S rRNA) and nuclear (Intron 1 of Transthyretin) DNA markers. This
phylogeny provides evidence for the elevation of the mechowii species group to the
genus Coetomys and an independent phylogenetic framework of the relationships of the
genera and species of Bathyergidae.
To examine the evolution of microsatellite DNA within this phylogenetic
framework, species-specific genotyping primers were designed for each genus (Chapter
III). In addition to genotyping primers, primers were designed outside of the genotyping
fragment so the evolutionary dynamics of the repeat motifs and their flanking sequence
could be investigated (Chapter IV). Additionally, the microsatellite flanking sequences
(MFS) were tested for their utility in phylogenetic reconstruction when compared to the
well-resolved relationships of this family based on the 12S/TTR phylogeny (Chapter V).

11
11
CHAPTER II
MOLECULAR PHYLOGENETICS AND TAXONOMY OF THE AFRICAN
MOLE-RATS, GENUS CRYPTOMYS AND THE NEW GENUS COETOMYS
GRAY, 1864*
1. Introduction
African mole-rats of the family Bathyergidae represent a monophyletic group of
subterranean rodents endemic to sub-Saharan Africa. Two members of this family,
Heterocephalus and Cryptomys, have received extensive attention due to their unique
life histories and ecology (e.g., Bennett and Faulkes, 2000; Lacey et al., 2000; Nevo,
1999; Nevo and Reig, 1990; Sherman et al., 1991). Among members of the family,
social structure ranges from solitary (Bathyergus, Georychus, Heliophobius) to the
highly-structured social system of the naked mole-rat, Heterocephalus glaber, the first
mammalian species to be documented as eusocial (Jarvis, 1981). Currently, there are 5
recognized genera, 4 of which have relatively low species diversity. These taxa include:
1) the monotypic genus Heterocephalus, restricted to eastern Africa; 2) the monotypic
genus Heliophobius occurring in eastern and southeastern Africa; 3) the monotypic
genus Georychus, which is endemic to South Africa and 4) Bathyergus, containing two
species found in Namibia and South Africa. In contrast, the fifth genus, Cryptomys,
____________ *Reprinted with permission from “Molecular phylogenetics and taxonomy of the African mole-rats, genus Cryptomys and the new genus Coetomys Gray, 1864”: by CM Ingram, H Burda, and RL Honeycutt, 2004. Molecular Phylogenetics and Evolution, 31: 997– 1014. 2005 by Elsevier Inc.

12
12
contains 11 currently recognized species, and displays a broad but disjunct distribution
extending from Ghana and Nigeria in west Africa to the southern Sudan in east Africa
(within the Sudanian vegetation phytochorion, cf., White 1983), and from southern
Congo and southern Tanzania to the Western Cape Province of South Africa (i.e.,
throughout the Zambezian, Kalahari-Highveld, Karoo-Namib and Cape phytochoria)
(Fig. 2.1a-c: also, Bennett and Faulkes, 2000; Burda, 2001; Honeycutt et al., 1991). All
species of the genus Cryptomys are social and some can be considered eusocial (cf.,
Bennett and Faulkes, 2000; Burda et al., 2000; Burda and Kawalika, 1993; Jarvis and
Bennett, 1993; Jarvis et al., 1994). In addition, this genus displays considerable
chromosomal variation (diploid numbers ranging from 40-78: Burda, 2001) and
complex patterns of morphological variation, especially relative to size and color
patterns (Honeycutt et al., 1991; Rosevear, 1969).
Previous molecular and morphological studies have focused on relationships
among genera and the placement of Bathyergidae relative to other families of
hystricognath rodents (Allard and Honeycutt, 1992; Faulkes et al., 1997; Honeycutt et
al., 1987; Janecek et al., 1992; Walton et al., 2000). Although molecular data have
contributed to the resolution of relationships among genera of Bathyergidae and the
placement of the family relative to other families, few studies have been conducted on
geographic variation within either genera or species. For instance, considerable
allozyme (Filippucci et al., 1994, 1997; Janacek et al., 1992; Nevo et al., 1987),
chromosome (Burda et al., 1999), and nucleotide sequence variation (Faulkes et al.,

13
13
Fig. 2.1 Sampling localities for specimens. Sample numbers correspond to the specimens listed in the Appendix. a) Heterocephalus, Heliophobius, Bathyergus, Georychus specimens used in this study.
a)

14
14
Fig. 2.1 continued. b) Cryptomys (hottentotus group) specimens used in this study.
b)

15
15
Fig. 2.1 continued. c) Coetomys (mechowii group) specimens used in this study.
c)

16
16
1997; Walton et al., 2000) has been reported in Cryptomys, yet no study has thoroughly
documented patterns of genetic variation throughout the range of the genus.
In terms of taxonomy and phylogenetics, the genus Cryptomys is problematic for
several reasons (cf., Honeycutt et al., 1991). First, Cryptomys is the most broadly
distributed bathyergid genus. The current distribution of the genus presumably reflects
the influence of past climatic and geologic events associated with alterations of the
African landscape (Grubb et al., 1999). Therefore, an understanding of relationships
among populations and species of Cryptomys will provide phylogeographic information
that can be compared to historical changes that influenced the biogeography of African
flora and fauna since the Miocene. Second, as with other fossorial rodents such as
Ctenomys in South America, Thomomys and Geomys in North America, and Spalax in
the eastern Mediterranean, patterns of morphological and genetic variation in Cryptomys
make the delineation of species boundaries difficult (Bennett and Faulkes, 2000;
Honeycutt et al., 1991; Rosevear, 1969). For instance, the number of recognized species
of Cryptomys ranges between 1 to 49 depending on whether the particular taxonomic
treatment of morphological variation emphasized lumping (Ellerman et al., 1940) or
splitting (Allen, 1939; Roberts, 1951). The latest detailed taxonomic treatment of
Cryptomys recognized seven species: C. bocagei, C. damarensis, C. foxi, C. hottentotus,
C. mechowii, C. ochraceocinereus, and C. zechi (Honeycutt et al., 1991). Subsequent to
this study, several subspecies have been elevated to species status (C. darlingi and C.
amatus: Aguilar, 1993; Macholán et al., 1998, respectively), and two species were
recently described (C. anselli and C. kafuensis: Burda et al., 1999). Third, karyotypic

17
17
variation in Cryptomys is pronounced with diploid numbers ranging from 40 to 78 (C.
mechowii and C. damarensis: Macholán et al., 1993; Nevo et al., 1986, respectively).
Indeed, several studies have used chromosomal variation as a yardstick for species
recognition (Aguilar, 1993; Burda et al., 1999; Macholán et al., 1998). Nevertheless, no
study has investigated relationships among all the various chromosomal forms. Finally,
Cryptomys is highly social, with some forms approaching eusociality similar to the
naked mole-rat, Heterocephalus glaber (Burda and Kawalika, 1993; Burda et al., 2000;
Jarvis and Bennett, 1993). Such aspects of behavioral ecology may influence the
partitioning of genetic variation within species, especially if animals/colonies display
restricted dispersal and populations are highly subdivided.
The objective of this paper is to use nucleotide sequences from nuclear and
mitochondrial genomes to generate a molecular phylogeny of populations and
presumptive species of bathyergids with emphasis on Cryptomys. The use of data from
both nuclear and mitochondrial sequences will provide independent support for
phylogenetic relationships. This molecular phylogeny will be used as an interpretive
framework for examining the evolutionary relationships in this group with brief
discussion on patterns of geographic variation, the delineation of species boundaries, and
chromosomal evolution.
18
18
2. Materials and Methods
2.1. Taxon sampling and DNA isolation
Representatives of Cryptomys species and subspecies were collected throughout
their distribution. Several specimens from other bathyergid genera and species also were
sampled. For Cryptomys, samples were examined from 41 localities of which 11 had
been sampled previously (Appendix; Fig. 2.1b-c). DNA from either frozen liver and/or
skin samples preserved in ethanol (70%) was isolated by proteinase-K digestion
followed by either phenol/chloroform extraction or QIAGEN DNAEasy spin columns
(Qiagen Inc., Valencia, CA). Skin samples from museum specimens, representing
species in geographic areas not previously available, were attained from the Transvaal,
Senckenberg, and Carnegie Museums (Appendix). For museum specimens, DNA was
extracted using a modified phenol:chloroform extraction, where precautionary steps
were taken to prevent contamination (Glenn et al., 2002). All protocols were performed
in a separate room from other extractions or PCR experiments. Negative controls were
used to identify potential contamination of museum extractions.
2.2. PCR amplification and nucleotide sequencing
To allow for the inclusion of museum samples and published sequences from
previous studies (Allard and Honeycutt, 1992; Bennett and Faulkes, 2000; Faulkes et al.,
1997; Walton et al., 2000), our sequencing efforts focused on the mitochondrial 12S
ribosomal RNA (rRNA) gene and intron 1 of the nuclear transthyretin gene (TTR). Due

19
19
to lower observed levels of sequence variation, only a subset of specimens were
examined for TTR.
The polymerase chain reaction (PCR) was used to amplify an 1140 base pair (bp)
fragment of the mitochondrial 12S rRNA gene. Initial amplification was performed
using two universal primers, L651 and 12GH (Nedbal et al., 1994), and reaction
conditions consisted of an initial denaturation at 94oC for five min, followed by 35
cycles of a 94oC for 30 sec, 52oC for 30 sec, and 72oC for 30 sec, with a final extension
at 72oC degrees for ten min. Amplification of the correct fragment length was confirmed
by electrophoresis of PCR product (5µl) with a size standard marker on 1% minigels,
stained with ethidium bromide, and visualized under UV light. PCR products were
cleaned using QIAquick Spin PCR purification spin columns and following a standard
protocol (Qiagen Inc., Valencia, CA).
Both strands of the PCR product were sequenced using the PCR primers, as well
as four internal primers: Ha12S, L109, H147, and 12EL (Nedbal et al., 1994). Cycle
sequencing reactions were performed using ABI Prism BigDye Terminator v3.0
chemistry (Applied Biosystems, Foster City, CA), with 25 cycles of 97oC for 30 secs,
50oC for five sec, and 60oC for two min. Excess terminator dye, oligonucleotides, and
polymerase were removed by centrifugation at 3000 rpm through a Sephadex G-50
matrix (Sigma-Aldrich, Inc.). Sequencing reactions were electorphoresed and analyzed
on an ABI 377 XL automated sequencer. Sequence data were imported into Sequencer
v3.0 (Gene Codes Corporation, Ann Arbor, MI) for alignment and contig assembly for

20
20
each individual. Once the entire sequence was confirmed by overlapping reads, the
contigs were exported in Nexus file format into PAUP* v4.0b10 (Swofford, 2002).
Due to the poor quality of DNA extracted from museum samples, three small
overlapping fragments (avg length = 418 bp) of the 12S rRNA gene were amplified
using three primer pairs (L651-Ha12S, L109-H147, and 12EL-12GH). Conditions of
PCR and sequencing reactions for the three smaller fragments were the same as those
described for the complete 12S fragment. Sequences from independent PCR
amplifications were used to confirm sequences. For some museum samples, the DNA
was too degraded to produce a complete contig. In all reactions, multiple negative
controls were included, both from the extraction and PCR reaction to ensure that there
was no contamination. Subsequent to multiple alignment in ClustalX (Thompson et al.,
1997), sequences were aligned by eye to a 12S alignment of previously sequenced and
analyzed hystricognath dataset (ongoing study in the Honeycutt lab) based on the
secondary structure proposed by Springer and Douzery (1996). Previously sequenced
individuals (Allard and Honeycutt, 1992; Faulkes et al., 1997; Walton et al. 2000) were
included to increase sample size and geographic representation and allow for comparison
to these studies. Although some published sequences were shorter than those acquired
in the current study, they were included with missing sites (145-188 bp missing, 14-
19%).
Primers PreAlb(F) and PreAlb(R) were used to amplify intron 1 of the
transthyretin gene (modified from Tsuzuki et al., 1985). Additional primers, BR6 and
HF3, designed for the family Bathyergidae (Walton et al. 2000), were used to sequence

21
21
both strands. The sequencing protocol was the same as that described for the 12S rRNA
gene. Sequences were aligned by eye to the previous alignment of Walton et al. (2000).
2.3. Data analyses
A 156 bp fragment, containing an invariable portion of the Valine tRNA, was
excluded from all 12S sequences prior to analysis. To account for the phylogenetic
information of insertions and deletions (indels), gaps were treated as missing and an
interleaved matrix, coding presence/absence of phylogenetically informative gaps, was
added to the end of the aligned sequences. For the 12S rDNA data, stems and loops
(determined from the secondary structure alignment) were partitioned and tested for
congruence using the partition homogeneity test (PHT: Farris et al., 1995) implemented
in PAUP*.
Maximum-parsimony (MP) and maximum-likelihood (ML) analyses were
performed using PAUP* v4.0b10 (Swofford, 2002). Based on phylogenetic affinities
recovered in previous studies (Allard and Honeycutt, 1992; Huchon and Douzery, 2001;
Nedbal et al., 1994), two phiomorphs, Thryonomys swinderianus and Petromus typicus,
were chosen as outgroup taxa for the 12S rRNA and TTR analyses. Under MP, all
analyses were performed using the heuristic search option with 1,000 replicate searches,
random addition of taxa, and tree bisection and reconnection (TBR) branch swapping,
with the steepest descent option not in effect. When equally-weighted heuristic searches
failed to recover a single MP tree, additional MP analyses were performed with
characters successively-weighted (Farris, 1969) by their rescaled consistency index (RC;

22
22
Farris, 1989). Bootstrap proportions (Felsenstein, 1985) and decay indices (Bremer,
1988) were used as relative measures of nodal support. Bootstrap analyses were
initiated using 1,000 replicates, each with 10 random addition sequences and TBR
branch-swapping using PAUP*. Decay indices were generated using TreeRot v.2
(Sorenson, 1999).
To determine the appropriate model of evolution for maximum-likelihood (ML)
and Bayesian (BA) analyses, a hierarchical likelihood ratio test (hLRT) was performed
using MODELTEST v3.06 (Posada and Crandall, 1998). For ML and BA, only one
outgroup (Thryonomys) was used. A search, using the parameters estimated from the
MP tree and employing the heuristic search option, was used to obtain a ML tree. Using
an iterative approach, additional heuristic searches were performed using the parameters
recovered in the prior search until the likelihood value stabilized (Sullivan and Swofford,
1997). Bootstrap support for the ML tree was determined using the "fast" stepwise
addition option. The MP and ML trees were compared using the Shimodaira-Hasagawa
(S-H) test (Shimodaira and Hasagawa, 1999) in PAUP*.
Congruence of the phylogenetic signal for the 12S and TTR data was determined
by trimming the 12S dataset to include only those taxa for which TTR sequences also
were available. These datasets were compared for combinability with the PHT. Based
on sufficient homogeneity, datasets were then combined and analyzed together with
characters coded as missing for incomplete sequences.
Bayesian posterior probabilities were calculated using the Metropolis-coupled
Markov chain Monte Carlo (MCMCMC) sampling approach in MrBayes v3.01

23
23
(Huelsenbeck and Ronquist, 2001). Four independent searches were performed for each
dataset; each search consisted of a cold chain and 3 heated chains (temp = 0.2). All
searches started with random trees and uniform prior probabilities for all possible trees.
For all datasets, Markov chains were run for 1 x 10⁶ generations and trees were sampled
every 100 generations. To determine appropriate burn-in values, an initial run of 35,000
generations was performed to check for stationarity of the likelihood values. The
“burnin” value was conservatively set at 500, the first 500 (50,000 generations) trees
were eliminated from the approximation of posterior probabilities. The trees retained
from each run were combined and a 50% majority rule consensus tree was produced.
For the 12S gene, and combined 12S and TTR sequences, the data were analyzed under
the general time-reversible model (Yang, 1994) with site-specific rate variation
(GTR+SS) (stems:loops:TTR), or corrected for invariable sites and among site rate
variation using a discrete gamma distribution (GTR+Γ+I). The TTR dataset was
analyzed under the HKY+Γ model (Hasagawa et al., 1985).
To test for clock-like behavior, ML scores with and without the enforcement of a
molecular clock were compared using a likelihood ratio test (LRT; Felsenstein, 1985) in
PAUP*. Tajima’s relative rate test (RRT, 1-D method; Tajima, 1993a) was performed
to identify operational taxonomic units (OTUs) that deviated from a clock-like rate of
substitution. For the RRT, P-values were corrected using the Bonferroni method to
account for multiple pairwise comparisons.
To evaluate congruence between the molecular phylogeny and previously
described patterns of chromosomal variation, MacClade v4.05 (Maddison and

24
24
Maddison, 2000) was used to map diploid number from known karyotypes (Burda,
2001) onto the molecular phylogeny.
3. Results
3.1. Phylogenetic relationships based on 12S rRNA gene
Approximately 1140 bp of the 12S rRNA gene were analyzed for 77 samples,
and 156 bp were excluded from further analyses. Of the 1,050 remaining characters
(984 nucleotides and 66 indels), 597 (47%) were variable and 382 (64% of 597) were
parsimony-informative.
Average corrected (GTR+Γ+I) pairwise sequence differences between the
ingroup and outgroup taxa ranged from 38.8-65.2% (mean = 51.3%). The average
corrected pairwise sequence differences observed among and within the ingroup genera
were 34.0% (R = 15.0 -73.4%) and 10.5% (R = 0.1 - 24.6%), respectively. In
Cryptomys, the average pairwise differences between the karyotypically stable
hottentotus species group and the taxa within the large, karyotypically-diverse mechowii
species group was 18.5% (R = 13.8-24.6%). Pairwise differences within each of these
two clades (hottentotus species group and mechowii species group) were 4.2% (R = 0.1-
7.5%) and 4.7% (R = 0.1-14.6), respectively.
A heuristic search under maximum-parsimony (equal-weights) recovered 20
equally-parsimonious trees (not shown: TL = 1435, CI = 0.511, RI= 0.876).
Successively-weighted MP (by RC) recovered a single tree (not shown, see Fig. 2.2: TL
= 1435, CI = 0.511, RI= 0.876). All currently recognized genera formed well-supported

25
25
Fig. 2.2 12S rRNA maximum-likelihood phylogeny under GTR + Γ + I (-lnL = 7343.00, α = 0.5642, proportion of invariable sites = 0.3317). Successively-weighted maximum-parsimony (by RC) recovered the same topology. For all major branches, values above branches refer to MP bootstrap proportions, ML bootstrap proportions, and Bayesian posterior probabilities, respectively; values below branches represent Bremer decay indices under MP; values at nodes of interest are as follow: A- 86/62/81, 2; B – 95/66/100, 4; C – 100/100/100, 10; D – 53/88/81, 0; E – 66/<50/97, 1; F – 100/99/100, 11; G – 100/98/100; 11; H –100/97/100; 7; I – 100/89/97, 6. Numbers correspond to the specimens listed in Appendix.

26
26
monophyletic groups: Heterocephalus (Bootstrap proportions (BP) = 100, Decay Indices
(DI) = 57), Heliophobius (BP = 100, DI = 17), Bathyergus (BP = 100, DI = 26),
Georychus (BP = 100, DI = 13), and Cryptomys (BP = 81, DI = 5). In this tree,
Heterocephalus was basal to the remaining genera with Heliophobius as sister to a clade
containing Bathyergus, Georychus and Cryptomys.
Within Cryptomys, two divergent clades (hottentotus species group and mechowii
species group) were recovered in all 20 trees, with differences representing small
rearrangements of lineages within the mechowii clade (not shown). Cryptomys
holosericeus, C. hottentotus, C. natalensis, C. nimrodi and C. anomalus (‘pretoriae’)
formed the monophyletic hottentotus species group (BP = 100%, DI = 25), and the
remaining species of Cryptomys formed the monophyletic mechowii species group (BP =
98, DI = 15). Included in the mechowii species group is the Sudanian clade (C. foxi + C.
ochraceocinereus). These two taxa formed a monophyletic group (BP = 100, DI = 23)
sister to other taxa of the mechowii species group (BP = 98, DI = 9). Monophyly of a
clade containing Cryptomys mechowii and C. bocagei also was supported (BP = 86, DI =
2). Although the amatus/whytei clade was not strongly supported (BP = 63, DI = 1),
monophyly of the internal clade containing C. ‘Kasama’ and C. whytei was strongly
supported (BP = 95, DI = 4). An anselli/ kafuensis clade had strong support (BP = 100,
DI = 10), but the monophyly of each species was only weakly supported (BP = 53, DI =
0 and BP = 66, DI = 1, respectively).
Under ML, the general time-reversible (Yang, 1994), corrected for among-site
rate variation using the discrete gamma distribution and invariable sites (GTR+Γ+I), was

27
27
significantly better than all simpler models (MODELTEST; p-value < 0.001). In
addition, the GTR+Γ+I model, the general time-reversible model corrected for site-
specific rate variation (GTR+SS), was used in ML and Bayesian analyses of the 12S
data. The heuristic likelihood search recovered the same topology as the MP search
(Fig. 2.2, -ln= 7335.29), and branches leading to each genus were long (0.036-0.279)
relative to branch lengths observed within each genus (0.001-0.026). An exception is
Cryptomys sensu lato with the two divergent lineages defined by branch lengths of 0.083
and 0.056 (hottentotus species group and mechowii species group, respectively).
Another long branch was observed in the Sudanian clade (C. foxi + C. ochraceocinereus,
BL = 0.061).
For the Bayesian analyses of the 12S data, the GTR+SS model generated higher
posterior probabilities (PP). Incorporating site-specific rates for stems and loops
produced the same topology supported by both the MP and ML analyses. In both
Bayesian analyses and ML analysis, a Bathyergus + Georychus clade was recovered,
but with weak to moderate support (PP = 53 and 78, GTR+SS and GTR+Γ+I,
respectively; ML BP < 50). In all analyses, the Sudanian clade (C. foxi + C.
ochraceocinereus) was basal within the mechowii species group clade. This placement
was strongly supported (MP BP = 100, DI = 23; ML BP = 100; PP = 100).
The null hypothesis of equal rates among lineages was not supported by the (-ln
L0 = 7438.83, -ln L1 = 7363.00, p < 0.001), thus suggesting that lineages are not
evolving in a clock-like manner. The conservative Tajima 1-D RRT (with Boneferroni
correction) failed to detect significant rate heterogeneity.

28
28
3.2. Phylogenetic relationships based on TTR intron 1
DNA sequences of approximately 986 bp were analyzed from 27 bathyergids:
new specimens of Cryptomys representing 16 new sequences (this study) in addition to
the 12 reported by Walton et al. (2000). Of the 1081 characters (1046 nucleotides and
35 indels), 382 (64%) of 597 variable characters were parsimony-informative.
Average corrected (HKY+Γ) pairwise sequence difference between the ingroup
and outgroup taxa was 23.1% (R = 18.9-25.5%). Corrected sequence divergence among
and within the ingroup genera ranged from 3.6-15.6% (mean = 8.6%) and 0.1-4.6%
(mean = 2.1%), respectively. Average corrected pairwise differences between the
hottentotus species group and mechowii species group was 3.9% (R = 3.0- 4.6%).
Average pairwise difference within each of these two clades was 1.2% (R = 1.5-1.6%)
and 0.4% (R = 0.1-0.8%), respectively.
A heuristic search under an equally-weighted MP analysis recovered two most-
parsimonious trees (not shown, see Fig. 2.3: TL = 446, CI = 0.872, RI = 0.936).
Successive-weighting (by RC) recovered a single tree (not shown, see Fig. 2.3: TL =
446, CI = 0.872, RI = 0.936). Although fewer taxa were represented in the transthyretin
(TTR) dataset, the topology matched that obtained with the 12S dataset. Branching
order of the genera within the family were consistent with previous studies and the 12S
rRNA sequences. Heterocephalus (BP = 100, DI = 34) was basal to a clade containing
the other genera (BP = 100, DI = 29) with Heliophobius (BP = 100, DI = 18) sister to a
Bathyergus, Georychus + Cryptomys clade. Although the monophyly of each genus
(Bathyergus, Georychus, and Cryptomys) was well supported (BP = 100, DI = 18; BP =

29
Fig. 2.3 TTR Intron I maximum-likelihood phylogeny under HKY85 + Γ (-lnL = 3241.73, α = 0.8512). Successively-weighted maximum-parsimony (by RC) recovered the same topology. For all major branches, values above branches refer to MP bootstrap proportions, ML bootstrap proportions, and Bayesian posterior probabilities, respectively; values below branches represent Bremer decay indices under MP. Numbers correspond to the specimens listed in Appendix.

30
30
100, DI = 12; BP = 100, DI =17, respectively), the relationship among the 3 genera
remained unresolved. Within Cryptomys, the two divergent and monophyletic lineages
were recovered (hottentotus clade: BP = 100, DI = 10; mechowii clade: BP = 100, DI =
12).
For TTR, the HKY+Γ model was significantly better than all simpler models (p-
value < 0.001) and was used for the ML and BA analyses. ML and BA analyses
recovered identical topologies to that recovered by MP (with successive-weighting). All
genera and the two clades within Cryptomys were strongly supported by ML bootstrap
proportions and posterior probabilities of 100% (Fig. 2.3).
As with the 12S data, LRT revealed significant rate heterogeneity (-ln L0 =
3244.90, -ln L1 = 3269.37, p-value < 0.001). The Tajima 1-D relative rate test failed to
detect significant rate heterogeneity (after Bonferroni correction: α = 0.0001).
3.3. Phylogenetic relationships based on combined datasets
To allow comparisons between the mitochondrial and nuclear gene data, the
phylogeny based on 12S was trimmed to include only samples represented in the TTR
dataset. Based on the S-H test, the ML trees from each dataset were not significantly
different (p–value = 1.000), although the 12S tree showed more phylogenetic structure.
A PHT (1000 replications) suggested that the datasets were homogeneous (p = 1.00).
This result and strong overall topological congruence between the recovered phylogenies
provided support for analyses of the combined dataset. To achieve a better geographic
representation of the species, all 36 sequences of TTR were included in the combined

31
Fig. 2.4 Combined data (12S rRNA and TTR Intron I) maximum-likelihood phylogeny under GTR + Γ + I (-lnL = 10053.88, α = 0.5885, proportion of invariable sites = 0.3404). Unweighted maximum-parsimony recovered the same topology. For all major branches, values above branches refer to MP bootstrap proportions, ML bootstrap proportions, and Bayesian posterior probabilities, respectively; values below branches represent Bremer decay indices under MP. Numbers correspond to the specimens listed in Appendix.

32
analyses. The combined MP analysis resulted in a single tree (Fig. 2.4: TL=1395, CI =
0.674, RI = 0.847), recovering the same relationships found in the single gene analyses.
Bathyergus and Georychus formed a monophyletic clade, again with only weak support
(BP = 68, DI = 2). ML and Bayesian analyses (both under GTR+G+I) recovered the
same tree with strong support for the monophyly of the genera as well as the hottentotus
and mechowii species groups (Fig. 2.4).
4. Discussion
4.1. Corrections to previous taxonomic designations
Since previous molecular phylogenetic studies either emphasized intergeneric
relationships (Allard and Honeycutt, 1992; Faulkes et al., 1997; Honeycutt et al., 1987;
Janecek et al., 1992; Walton et al., 2000) or had limited geographic and taxonomic
sampling within a genus (Faulkes et al., 1997), broad patterns of variation could not be
detected. This lack of sampling, coupled with taxonomic problems associated with
Cryptomys, has lead to several cases of potential errors in assignment of specimens to
particular species. By sampling from type localities of currently recognized species, our
study identified discrepancies in the assignment of some specimens. A sample from
Zambia (H650) was designated as C. cf. bocagei by Walton et al. (2000) for the 12S
rRNA gene (Accession #AF290211). Based on our current 12S rRNA tree (Fig. 2.2),
this specimen should be assigned to C. anselli. C. amatus (AF012234) from Faulkes et
al. (1997) also should be assigned to C. anselli as it grouped within the C. anselli clade
of the 12S phylogeny, is located within C. anselli’s range, and shares the same karyotype

33
(2N = 68: Aguilar, unpublished data; Bennett and Faulkes, 2000) as C. anselli. C.
‘choma’ (AF012217) was recovered within the kafuensis clade. It apparently does not
share the same karyotype (2N = 50: Aguilar, unpublished data; Bennett and Faulkes,
2000), and may in fact be distinct from kafuensis, but more data will be required.
The two species of dune mole-rats (Bathyergus suillus and B. janetta) did not
form clades as was expected. The Cape dune mole-rat (B. suillus) from Allard and
Honeycutt (1992; Accession M63564) was not recovered with the B. suillus samples.
This may be explained by two scenarios: 1) there is more variability within this genus,
warranting the recognition of additional taxa, or 2) a tissue sample was assigned to the
wrong museum voucher. Additional sampling within the distribution of Bathyergus is
required to resolve this discrepancy and the phylogenetic relationships within this genus.
To prevent additional misidentifications, new species descriptions should be
based on the most currently recognized taxa, phylogenetic affinity, chromosome
morphology, geographic distribution, and molecular genetics. The 12S phylogeny,
which incorporates previous genetic samples, could be used as the framework for future
species identification and taxonomic designations.
4.2. Chromosomal diversity
Chromosomal diversity within the Bathyergidae has been a topic of interest for
the past 25 years. Based on the karyotypes of Heterocephalus and Heliophobius
specimens from Kenya, George (1979) concluded that the family Bathyergidae was
karyotypically stable (2N = 60, mostly biarmed chromosomes, NF = 118-120). To date,

34
Heterocephalus has revealed a stable diploid number of 60, but individuals from Kenya
and Somalia show length differences in chromosomal arms (Capanna and Merani, 1980).
Recently, a new karyotype (2N = 62) was discovered in Zambian populations of
Heliophobius argenteocinereus (Scharff et al., 2001), revealing slight chromosomal
diversity not documented in previous studies. This new karyotype may be representative
of Heliophobius argenteocinereus, while George’s Kenyan sample may represent H.
spalax (Thomas, 1910).
The relative chromosomal stability in bathyergids was further corroborated by
the low levels of chromosomal variation (2N = 54-56, NF = 104-108: Nevo et al., 1986)
for Bathyergus janetta, B. suillus, Cryptomys hottentotus, Georychus capensis. The only
exception was C. damarensis with a 2N = 74-78 and NF = 92-96 (Nevo et al., 1986).
Subsequent studies have documented a large amount of chromosomal diversity within
the mechowii species group of Cryptomys sensu lato, with diploid number ranging from
40 to 78 in C. mechowii (Macholán et al., 1993) and C. damarensis (Nevo et al., 1986),
respectively. As the number of known karyotypes has increased, complexity of
chromosomal evolution and the patterns of diversification within the family have
increased. Several new species descriptions are based on fixed novel karyotypes
(Aguilar, 1993; Burda et al., 1999; Chitaukali et al., 2001; Kawalika et al., 2001;
Macholán et al., 1998). Although changes in chromosome number and morphology may
be an important isolating mechanism, karyotypic comparisons alone have not provided
information on phylogenetic relationships and/or patterns of chromosomal change. In
order to resolve this, diploid numbers were plotted on the current phylogeny (Fig. 2.5).

35
Fig. 2.5 Diploid numbers (2N) mapped on the12S rRNA phylogeny. Ancestral states at the major nodes were estimated using MacClade v4.05, * refer to ambiguous nodes.

36
Due to the strong congruence of the nuclear and mitochondrial datasets, the larger 12S
phylogeny was selected to represent our hypothesis for the phylogenetic relationships
among bathyergids. While functional in defining clades, no clear phylogenetic pattern is
apparent, with the exception of marked chromosomal diversity in the mechowii species
group. Chromosomal rearrangements appear to be correlated with speciation (or at least
coincide with it), although there is no clear pattern of evolution (e.g., fissions or fusions,
increase or decrease in chromosome numbers). Much of the current genetic diversity of
this species group has evolved from the Zambezian region, where the high level of
chromosomal evolution has been documented (Burda, 2001). To date, direct
comparisons of published karyotypes have been limited by the quality of the
chromosome preparations and staining techniques (Burda et al., 1999). Without
differential staining (G-banding), it is difficult to derive a cladistically-based
chromosome phylogeny.
4.3. Comments on the status of the genus Cryptomys
Within the currently recognized genus Cryptomys, two reciprocally-
monophyletic clades (hottentotus species group and mechowii species group) were
consistently recovered, with strong support from both the mitochondrial and nuclear
genes (Figure 2.2 and 2.3). C. hottentotus, C. holosericeus, C. natalensis, and C.
anomalus (cf. ’pretoriae’) form a monophyletic group separate from other Cryptomys
species (the mechowii species group), many of which were previously considered
subspecies of C. hottentotus. Average corrected pairwise distances between these two

37
clades based on both nuclear and mtDNA data (TTR = 3.9%, 12S =18.5 %) are
equivalent to the level of sequence divergence observed between other genera (i.e.,
Bathyergus and Georychus: TTR = 3.7%, 12S = 18.8%). This level of divergence was
observed also by Bennett and Faulkes (2000) for 12S and cytochrome b sequences.
The two divergent lineages within Cryptomys have been noted in numerous
genetic studies (Faulkes et al., 1997; Filippucci et al., 1994, 1997; Janecek et al., 1992;
Nevo et al., 1987; Walton et al., 2000). This was first observed in comparisons of
allozyme data that produced relatively large genetic distances between two South
African species, C. damarensis (of the mechowii species group) and C. hottentotus
(Nevo et al., 1987). While several authors have suggested the recognition of both groups
as distinct genera, no study to date has provided sufficient data to support this
recommendation (Faulkes et al., 1997; Filippucci et al., 1994; Honeycutt et al., 1991).
Based on our nuclear and mitochondrial DNA analyses, and support from other
data (allozymes, chromosomes, and other nuclear and mtDNA data), we propose the
recognition of two genera Coetomys Gray, 1864 and Cryptomys. This change in
classification is supported by: 1) reciprocal monophyly of the two lineages based on
independent nuclear and mitochondrial datasets and multiple analyses, 2) the level of
sequence divergence observed between these two lineages for both nuclear and
mitochondrial markers, relative to that observed for other genera (i.e., Bathyergus and
Georychus), 3) different modes and patterns of chromosomal evolution with Cryptomys
being karyotypically-conserved (2N = 54) and Coetomys exhibiting high karyotypic
diversity with diploid numbers ranging from 40-78.

38
4.3.1. Coetomys Gray, 1864 gen. nov.
Etymology. Coetus = aggregation, society plus mys = mouse, Coetomys =
“social mouse”. The name expresses one of the most striking characteristics of
mole-rats of this genus – their (eu)sociality which is pointed out by all students
of the biology of these rodents (cf., Bennett and Faulkes, 2000; Burda et al.,
2000). Noteworthy that C. damarensis, C. anselli, and C. mechowii, the most
studied representatives of the genus Coetomys, are considered to be more social,
living in larger family groups than Cryptomys hottentotus (Burda et al., 2000;
Jarvis and Bennett, 1993).
Type species. Bathyergus damarensis, Ogilby, 1838: When originally described
as a subgenus of Georychus, no type species was designated, but B. caecutiens,
Licht and B. damarensis, Ogilby 1838, were both included. Since B. caecutiens
is no longer recognized as a valid species (Honeycutt et al., 1991), we select B.
damarensis, Ogilby 1838 as the type species of this genus.
Type specimen.- B.M. 149
Type locality : Usakos, Namibia (Damaraland)
Genus diagnosis – At the current state of knowledge, and due to large
interspecific and intraspecific polymorphism, the genus cannot be clearly separated from
the genus Cryptomys on grounds of morphological or morphometric traits. The genus
(and its separation from other genera) can be characterized by allozyme (Filippucci et
al., 1994, 1997; Nevo et al., 1987) and molecular (nuclear and mitochondrial) markers
described in this study and relevant papers cited above. This genus has high karyotypic

39
diversity with diploid numbers ranging from 40-78 and is distributed in sub-Saharan
Africa, south to the Limpopo River where it is substituted by the genus Cryptomys.
Mole-rats of the genus Coetomys seem to be characterized by their social and mating
system: monogamy with helpers and pronounced philopatry. Living in larger families,
where only one parental pair is reproducing and offspring are engaged in cooperative
burrowing and foraging denoted as eusociality in at least some members of the genus.
Prenatal and postnatal development in Coetomys seems to be slower/longer than in
Cryptomys (cf., Bennett and Faulkes, 2000). Note, however, that data on social and
reproductive biology are still missing for many species of this genus.
Included species. – C. amatus Wroughton, 1907; C. anselli Burda et al., 1999; C.
bocagei De Winton, 1897; C. damarensis Ogilby, 1838; C. darlingi Thomas, 1895; C.
foxi Thomas, 1911; C. kafuensis Burda et al., 1999; C. mechowii Peters, 1881; C.
micklemi Chubb, 1909; C. ochraceocinereus Heuglin, 1864; C. whytei Thomas, 1897; C.
zechi Matschie, 1900. Additionally, a Coetomys species from Kasama in Zambia
(Kawalika et al., 2001) is yet to be formally described.
4.3.2. Cryptomys Gray, 1864
Etymology. Cryptos = hidden plus mys = mouse, Cryptomys = “hidden mouse”.
The genus name refers to the fossorial natural history of members of this family.
Type species. Georychus holosericeus Wagner, 1843
Type specimen. Leipzig Museum, Germany
Type locality. Graaff-Reinet, Northern Province, South Africa

40
Genus diagnosis – To date, all members of this genus are characterized by a
stable diploid number (2N = 54). Cryptomys is distributed in southern Africa, primarily
south of the Limpopo River to the Cape of Good Hope, with the exception of C. cf.
nimrodi which occurs in Zimbabwe. There are no clear morphological characters to
distinguish Cryptomys from Coetomys.
Included species. C. anomalus Roberts, 1913; C. holosericeus Wagner, 1843; C.
hottentotus Lesson, 1826; C. natalensis Roberts, 1913.
4.4. Divergence estimates
Like other lineages of African rodents, the fossil record for Bathyergidae is not
well represented in the geologic record. Only a few taxa have been recovered from the
early and middle Miocene (Lavocat, 1978), and extant genera do not appear prior to the
mid-Pliocene (Denys and Jaeger, 1992). The earliest known fossils, Proheliophobius
and Richardus, were recovered from early to mid-Miocene formations of Kenya and
Uganda (Lavocat, 1973, 1988). Therefore, calibration points that can be used to estimate
divergence times are limited. Based on the rate of nucleotide substitutions per site per
year in the 12S rRNA gene and assuming a molecular clock, Allard and Honeycutt
(1992) estimated origin of the family to be approximately 38 MYA. Likelihood ratio

41
Table 2.1. Estimation of the ages of the lineages within the family Bathyergidae using non-parameteric rate smoothing (Sanderson, 2003). Calibration based on 20-19 MYA for the divergence of Heliophobius (Proheliophobius) lineage.
tests revealed that both datasets, 12S rRNA and TTR, violate the assumption of a
molecular clock. Divergence dates were therefore estimated using a nonparametric rate
smoothing method (r8s, Sanderson, 2003). This method allows for a unique substitution
rate for each branch of the tree rather than the single rate enforced under the molecular
clock scenario. To allow for comparisons between the two datasets, the trimmed
phylogeny from the combined dataset was used and divergence dates were estimated for
each dataset (Table 2.1). Based on the available fossil evidence and dating of the sites
(Lavocat, 1973), a date of 20-19 MYA was used as a calibration point for the divergence
of the Heliophobius lineage (A. Winkler, per. comm.). Dates estimated from
Split 12S TTR Both
Heterocephalus- All 26.19-24.88 52.61-49.98 34.75-33.01
Heliophobius- S.African 20-19 20-19 20-19
Georychus- S.African 16.96-16.12 17.21-16.34 16.96-16.11
Bathyergus- Cryptomys sensu lato 15.77-14.98 17.21-16.35 16.20-15.39
Cryptomys sensu scripto - Coetomys 12.48-11.86 10.91-10.37 11.97-11.37
Coetomys 6.59-6.26 4.82-4.58 6.23-5.92
Cryptomys sensu scripto 4.62-4.39 5.00-4.75 4.99-4.74

42
12S substitution rates for the basal nodes were typically earlier than estimates from TTR,
although this relationship is reversed in the Coetomys+Cryptomys clade (Table 1).
Based on these dates, the hypothesized North-South migration through a proposed “arid
corridor” would have occurred 17 – 16MYA during the early/mid-Miocene. A rapid
radiation resulting in the differentiation of Bathyergus, Georychus, Cryptomys, and
Coetomys is estimated to have occurred in the early Miocene (17 – 15MYA), and the
divergence of Coetomys from Cryptomys is estimated to have occurred during the mid-
Miocene, 12 – 10MYA. These estimates are much earlier than that predicted by the
fossil record. These data support the hypothesized origin of the family in East Africa
(Lavocat, 1973). Connection of the eastern taxa with the South African genera has been
hypothesized as the product of a migration through an arid corridor as supported by
current distribution patterns and fossil evidence. The sister-group relationship between
Heliophobius and the common ancestor of the South African genera suggests a single
migration event into the Cape region of South Africa.
4.5. Phylogenetic and biogeographic implications
Separate and combined analyses produced the same overall topology. Within the
family Bathyergidae, relationships among genera are similar to those recovered in
previous studies (Allard and Honeycutt, 1992; Faulkes et al., 1997; Walton et al., 2000).
In all analyses, Heterocephalus is basal to the clade of remaining genera (Heliophobius,
Bathyergus, Georychus, Cryptomys and Coetomys). Within this clade, the East African
genus, Heliophobius, is sister to the remaining genera. As in previous studies (Walton et

43
al., 2000), relationships among Bathyergus, Georychus, and Cryptomys +Coetomys
remain poorly resolved. The inability to resolve relationships among these three
lineages, even with multiple genes, suggests a rapid radiation similar to those
experienced by other groups of fossorial rodents in North and South America (Smith,
1998; Sudman and Hafner, 1992). The separation of Coetomys from Cryptomys roughly
follows the borders between the Zambezian and the Kalahari-Highveld phytochoria (cf.,
White, 1983), and the pattern of flow of the PaleoZambezi River. Historically, the
Upper Zambezi continued its southern course, crossing what is now Botswana to join
either the Oranje system or the Limpopo (cf., Thomas and Shaw, 1988). This would
have provided a barrier separating the ancestral stock into what would become
Cryptomys and Coetomys, allowing for subsequent northern expansion of Coetomys.
Within Coetomys, the Sudanian species, C. foxi and C. ochraceocinereus are
sister to all of the Zambezian species. Although the affinity of Sudanian taxa has been
suggested by morphology and geographic proximity (Honeycutt et al., 1991), their
placement within the genus has not been examined with genetic data. Expansion of the
rainforest has provided a geographic barrier, isolating this northern stock from the East
Africa taxa. Subsequently, in the late Pleistocene/early Pliocene, the Middle Zambezi
developed, linking the Upper Zambezi and Lower Zambezi (cf., Thomas and Shaw,
1988), thus separating C. damarensis and C. darlingi.
The radiation of recent species within the Zambezian region may have occurred
in the Pleistocene, as supported by allozyme data (Filippucci et al., 1994, 1997; Nevo et
al., 1987), coinciding with dramatic geomorphological changes producing physical

44
barriers (Thomas and Shaw, 1988) and dramatic climatic and vegetational changes
forming ecological barriers (Adams, 2001). Both of these factors lead to habitat
fragmentation and speciation by vicariance.
4.6. Patterns of intrageneric variation
Silvery mole-rats (Heliophobius) from Kenyan on one side and Zambian and
Malawian samples on the other side of the Rift Valley are divergent (12S corrected
pairwise difference = 7.3%), and this is reflected in a slightly different karyotype found
in Zambia (Scharff et al., 2001). Nevertheless, since sampling was limited to a few
localities within their area of occurrence, additional sampling across their entire
distribution is required prior to any formal taxonomic decisions.
Among Cape mole-rats (Georychus), there are at least two well-supported
lineages: Cape Region (Eastern + Western Cape Province) and Transvaal/Natal
(Mpumalanga + Kwazulu-Natal Province). Two previous studies (mtDNA RFLP:
Honeycutt et al., 1987; allozymes: Nevo et al., 1987) documented a substantial amount
of genetic distance between the two regions. Both studies recommended further
investigation into the relationships within Georychus, and we are currently assessing the
genetic patterns of additional samples from across the distribution.
Within Cryptomys (sensu stricto), the pattern of variation is similar to that
reported by Faulkes et al. (1997). Based on the larger 12S phylogeny, there appears to
be five monophyletic lineages that show geographic cohesion: anomalus (cf.
‘pretoriae’), natalensis, nimrodi, holosericeus (North-West/Free State), and hottentotus

45
(Western Cape/Northern Cape). All of these clades have strong support (MP BP = 100,
DI = 6 - 11; ML BP = 89 - 99, PP = 97-100) with the exception of nimrodi, which is
limited to the single sample from Faulkes et al. (1997). Our anomalus clade is
represented by specimens from Pretoria and surrounding areas (Appendix, Figs. 2.1-2.4).
Faulkes et al. (1997) referenced animals collected in Pretoria as Cryptomys ‘pretoriae’,
but De Graaff (1964) included C. pretoriae Roberts, 1913 as a synonym under C.
anomalus Roberts, 1913. We follow De Graaff’s recommendation. The North-
West/Free State clade (Figs. 2.2-2.4) roughly corresponds to C. holosericeus
Wagner,1843 supporting the taxonomy of Roberts (1951) and De Graaff (1964). De
Graaff (1964) questioned the validity of Graaff-Reinet (Cape Province = Northern
Province) as the true type locality for C. holosericeus based on the distribution of the
known localities of all C. holosericeus museum specimens. We believe the specimens
considered here as C. holosericeus are representative samples from within its true
distribution.
The genus Coetomys has the largest geographic distribution. Within this genus,
there are six well-defined clades: Sudanian, mechowii/bocagei, darlingi, damarensis,
anselli/kafuensis, and amatus/whytei. The Sudanian clade is sister to all other Coetomys.
This clade includes C. foxi and C. ochraceocinereus. The C. foxi samples are from
Cameroon (Williams et al., 1983), and other authors have referred to them as C.
ochraceocinereus (Bennett and Faulkes, 2000; Honeycutt et al., 1991). While the
genetic divergence between these two taxa is relatively high, a more complete sampling
throughout this geographic region (Ghana, Nigeria, Cameroon, Central African

46
Republic, Southern Sudan, Northern Zaire, North-east Uganda) is necessary prior to any
conclusions about phylogenetic relationships within this clade as well as their
relationship to the unsampled species, C. zechi. The only available karyotype for this
clade is for C. foxi (2N = 66/70: Williams et al., 1983).
The west-Zambezian mechowii/bocagei clade consists of two recognized species
and is sister to the other Zambezian clades. While the placement of C. bocagei within
this clade has weak support (MP BP = 86, DI = 2; ML BP = 62, PP = 84/<50), additional
samples of C. bocagei may help resolve its phylogenetic position. The monophyly of C.
mechowii is well supported (MP BP = 100, DI = 5; ML BP = 81, PP = 100/100). The
north-eastern Zambezian amatus/whytei clade (MP BP = 100, DI = 1; ML BP = 61, PP =
99/100) contains three taxa, C. amatus (2N = 50; Macholán et al., 1998), C. sp.
‘Kasama’ (2N = 64; Kawalika et al., 2001), and C. whytei (2N = 46; Chitaukali et al.,
2001). The monophyly of both southern species, C. darlingi (MP BP = 100, DI = 1; ML
BP = <50, PP = 98-100) and C. damarensis (MP BP = 100, DI = 7; ML BP = 93, PP =
100), is supported.
While there is strong support for the central Zambezian anselli/kafuensis clade
(MP BP = 100, DI = 10; ML BP = 100, PP = 100), relationships within this clade are not
well resolved. There appear to be at least three species, C. anselli (2N = 68; Burda et al.,
1999), C. kafuensis (2N = 58; Burda et al., 1999), and C. micklemi (2N = 58; Meier,
2001), although we expect more will be identified with the addition of samples from this
region of Zambia (Van Daele et al., in prep).

47
5. Conclusions
Although this study does not provide exhaustive sampling across the entire
distribution of the Bathyergidae, it presents the most robust genetic representation of the
family to date. Additional data continue to identify complexities in the evolutionary
history of this group. Instead of fitting the accepted taxonomic views of Ellerman et al.
(1940) and DeGraaff (1964, 1981) (i.e., Faulkes et al., 1997; Honeycutt et al., 1991;
McKenna et al., 1998; Nevo et al., 1987; Nowak, 1999), the level of diversity appears to
reflect the species-rich classification scheme of Roberts (1951). More detailed
sampling/analysis, including the development of a chromosomal evolution hypothesis, is
required to fully understand the relationships within each genus and formulate a
complete biogeographic history.

48
CHAPTER III
DEVELOPMENT AND CHARACTERIZATION OF NOVEL
MICROSATELLITE MARKERS FOR THE SIX GENERA OF
BATHYERGIDAE (RODENTIA) AND THEIR UTILITY IN OTHER MEMBERS
OF THE FAMILY
1. Introduction
African mole-rats (family Bathyergidae) represent a monophyletic group of
subterranean rodents endemic to sub-Saharan Africa. Within Bathyergidae, there are
currently six recognized genera; Heterocephalus, Heliophobius, Bathyergus, Georychus,
Cryptomys, and Coetomys (Ingram et al., 2004). Bathyergidae has received extensive
attention due to their varying social structures that range from solitary (Bathyergus,
Georychus, Heliophobius) to the highly structured social system of the naked mole-rat,
Heterocephalus glaber.
Among the solitary species of Bathyergidae is the Silvery mole-rat, Heliophobius
argenteocinereus. Heliophobius is currently recognized as a monotypic genus endemic
to eastern and southeastern Africa and distributed in Kenya, Tanzania, Zambia, Malawi,
and Mozambique (Burda, 2001). Recent research has focused on their burrowing
activity (e.g. Sumbera et al., 2003), parasites (e.g. Tenora et al., 2003), or phylogenetic
studies of the family Bathyergidae (e.g. Ingram et al., 2004). Their phylogenetic
position within the family has been well supported, but there has been no investigation
of the intra-generic relationships. Within the genus, a high degree of genetic variation

49
has been observed (Ingram et al., 2004). Heliophobius samples from Kenya and
Malawi/Zambia, on opposite sides of the Rift Valley, are markedly divergent at the
molecular level (12S rRNA: ML divergence = 7.3%), and this is reflected in distinct
karyotypes found in Zambia versus Kenya (Scharff et al., 2001).
The Cape mole-rat, Georychus capensis, is also a solitary species, occurring in
sandy or loose soil of South Africa. Its distribution is coastal, consisting of disjunct
populations. Although Georychus is recognized as a monotypic genus, there are at least
two well-supported lineages, Cape Region (including the eastern Cape) and
Transvaal/Natal, which show a substantial amount of genetic divergence (Honeycutt et
al., 1987; Ingram et al., 2004; Nevo et al., 1987). Research on Georychus has been
limited to investigations of their physiology {e.g. circadian rhythms (Oosthuizen et al.,
2003), reproductive biology (Bennett and Jarvis, 1988), visual systems (Omlin, 1997)}
and environmental conditions (Roper et al., 2001). There has been recent focus on the
phylogenetic relationships within Bathyergidae (Faulkes et al., 2004; Ingram et al.,
2004), but no studies have focused on the genetics within Georychus. With high genetic
divergence documented between disjunct populations, investigation of typical population
parameters is essential.
The genus Bathyergus is comprised of two species, the Cape dune mole-rat, B.
suillus and the Namaqua dune mole-rat, B. janetta. Both species are solitary, endemic to
South Africa or South Africa and Namibia, respectively. Dune mole-rats have the
largest body size of the bathyergids reaching up to 2000 g, with the average weight of
933 g and 635g for males and females, respectively (Jarvis and Bennett, 1991). Unlike

50
the other members of this family that rely solely on their incisors for excavating their
burrow systems, Bathyergus primarily use the clawed forefoot (Bennett and Faulkes,
2000). While the position of Bathyergus within the family has been investigated
(Faulkes et al., 2004; Honeycutt et al., 1987; Ingram et al., 2004; Walton et al., 2000),
few studies have focused on the relationships within Bathyergus. The available
information of the social organization and behavior of this genus has been obtained
through observation (Davies and Jarvis, 1986; Lovegrove, 1986). Genotypic
information, through microsatellite data, could provide insight into the social structure
and mating patterns, as well as the amount of gene flow, migration patterns, and other
population parameters. Population level genetic studies will be helpful in the ongoing
studies of the evolution of sociality in Bathyergidae since B. janetta is a solitary species
and is found in arid habitats which are usually occupied by the species exhibiting more
social behavior.
The common mole-rat, Cryptomys hottentotus, is endemic to South Africa. C.
hottentotus is described as social in nature (Bennett and Faulkes, 2000). Social structure
and other aspects of behavioral ecology likely influence the partitioning of genetic
variation within species, especially if animals or colonies display restricted dispersal,
resulting in highly subdivided populations (Nevo et al., 1990). Cryptomys, in particular,
has been the focus of recent studies due to a relatively high amount of species diversity
compared to the other genera of the family (Faulkes et al., 2004; Ingram et al., 2004).
All species of the genus Coetomys are social, with some forms approaching
eusociality similar to the naked mole-rat (e.g., C. mechowii, Burda and Kawalika, 1993).

51
Coetomys, currently contains eleven recognized species in a broad but disjunct
distribution extending from Ghana and Nigeria in west Africa to the southern Sudan in
east Africa and from southern Congo and southern Tanzania, south to the Limpopo
River where it is replaced by members of Cryptomys. The delineation of species
boundaries among Coetomys species based on morphological variation is problematic,
but unlike other members of the family, Coetomys displays considerable species-specific
chromosomal variation (2N = 40-78: Burda, 2001). The Zambezian region has been
proposed as the center of origin for Coetomys with the highest species per area density
for the entire family (Burda, 2001). For this reason, I developed an array of
microsatellite loci for the well-characterized Zambian giant mole-rat, Coetomys
mechowii.
The naked mole-rat or sand puppy, Heterocephalus glaber, has received much
attention due to its unique life history and ecology. They are fossorial rodents that live
in extensive burrow systems in the semi-arid deserts of Ethiopia, Somalia, and Kenya.
H. glaber was the first eusocial mammal to be described (Jarvis, 1981), and the
evolution of eusociality in mammals has been a popular topic since this discovery.
Previous molecular studies revealed significantly low levels of genetic diversity in both
mitochondrial DNA and nuclear minisatellite markers (Faulkes et al., 1990; Honeycutt et
al., 1991; Reeve et al., 1990). The high relatedness within colonies was interpreted as
supporting the hypothesis that inbreeding was an important genetic factor leading to the
evolution of eusociality (e.g., Freeman and Herron, 1998). More recent studies have
documented a preference for outbreeding (Braude, 2000; Ciszek, 2000) and propose that

52
the high levels of relatedness and low levels of genetic variation reported in previous
studies (Faulkes et al., 1990; Honeycutt et al., 1991; Reeve et al., 1990) may have been
sampling error (Braude, 2000).
Burland et al. (2001) reported a panel of microsatellite markers for Cryptomys,
seven isolated from C. damarensis and four from C. hottentotus. Subsequent to this
study, the clade containing C. damarensis was elevated to the genus Coetomys (Ingram
et al., 2004). All seven microsatellite markers reported for C. damarensis were
polymorphic in C. mechowii, my focal species for Coetomys.
To date, no species-specific microsatellite primers have been reported for
Heterocephalus, Heliophobius, Georychus, or Bathyergus. Burland et al. (2001)
demonstrated cross-species amplification of their microsatellite markers. Of their eleven
loci, only two successfully amplified in a small sample of H. glaber (5-6 individuals):
one (DMR1) from Coetomys (Cryptomys) damarensis had five alleles, while the other,
CH2 from Cryptomys hottentotus was monomorphic in H. glaber. Four of seven loci
developed for Coetomys (Cryptomys) damarensis and all four loci developed for
Cryptomys hottentotus amplified in a small sample of H. argenteocinereus (4-8
individuals). Although amplification was successful in eight loci, two of the eight were
monomorphic. In Georychus capensis (1-5 individuals), six of seven loci developed for
Coetomys (Cryptomys) damarensis and all four loci developed for Cryptomys
hottentotus successfully amplified with the number of alleles at each locus ranging from
2-6. In Bathyergus, four of seven loci developed from Coetomys (Cryptomys)
damarensis and three of four loci developed from Cryptomys hottentotus amplified in a

53
small sample of B. suillus (1-6 individuals). Amplification was more successful in B.
janetta (2-5 individuals) with six of seven and four of four loci, respectively.
Here I present six polymorphic species-specific markers designed from
Heterocephalus glaber, five designed from Bathyergus suillus, seven loci designed from
Heliophobius argenteocinereus, six loci designed from Georychus capensis, five
additional Cryptomys hottentotus loci, five loci developed for C. mechowii, and test their
application across the other species in Bathyergidae.
2. Materials and Methods
2.1. Microsatellite library and primer construction
Six individuals were selected for genomic DNA library construction:
Heterocephalus (H034), Heliophobius (H046), Georychus (TM38353), and Bathyergus
(TM41494), Cryptomys (TM38375) and Coetomys (Z9). Genomic DNA was digested
with Pst I and size selected to eliminate fragments outside the range of 400-1500 bp.
Fragments were ligated using T4 ligase into pBluescript plasmid and transformed into
DH10β Electrocomp E. coli (Stratagene). Cells were grown on Amp+ LB agar plates
with standard blue/white screening. Colonies with inserts were transferred into 96-well
plates and cultured in Amp+ LB broth with 1% freezing medium for permanent storage.
Colonies were transferred and grown on nylon membrane, the cells and DNA were
denatured and fixed to the membranes, and probed with the following repeat motifs:
(GT)18, (CT)18, (GTCT)8, (CA)18, (GA)18, and (GTAA)8. For recombinants containing
microsatellites, plasmid DNA was purified via organic miniprep, and the insert DNA

54
was sequenced using the pUC primers (pUC-F, pUC-R). PCR amplifications were
conducted in 50 µL reactions with a final concentration of 2.5U of EX-Taq polymerase
(Takara: Fisher Scientific), 1X EX-Taq Buffer w/ MgCl2 (Takara), 0.25 mM dNTPs
(Takara), 0.1 µM of each primer. Reaction conditions included an initial 2 min
denaturation at 95 °C, followed by 35 cycles of 95 °C for 30 s, 52 °C for 30 s, and 72 °C
for 30 s, with a final extension time of 7 min at 72 °C. Fragment length was determined
by electrophoresis of PCR product (5µl) with a size standard on 1% agarose minigels,
stained with ethidium bromide, and visualized under UV light. This allowed for the
confirmation that the plasmid contained an insert. For PCR products greater than 500 bp
in length, the product were cleaned using QIAquick Spin PCR purification spin columns,
following a standard protocol (Qiagen Inc., Valencia, CA). Clean PCR products were
sequenced in both directions using pUC primers. Cycle sequencing reactions were
performed using ABI Prism BigDye Terminator v3.0 chemistry (Applied Biosystems),
with 25 cycles of 97 ºC for 30 s, 50 ºC for 5 s, and 60 ºC for 2 min. Excess terminator
dye, oligonucleotides, and polymerase were removed by centrifugation at 3000 g
through a Sephadex G-50 matrix (Sigma-Aldrich, Inc.). Sequencing reactions were
electrophoresed and analyzed on an ABI 377 XL automated sequencer. Sequence data
were imported into SEQUENCHER v4.2 (Gene Codes Corporation, Ann Arbor, MI) for
alignment and contig assembly for each clone.
Once the entire sequence was confirmed by overlapping reads, contigs were
exported as FASTA files. Repeat regions of each contig were masked out of the
sequence using RepeatMasker v3.0 (Smit et al., 2004) and searched with BLAST to

55
ensure absence of contamination in the sequence (e.g. dimerism with E. coli) and to
identify any similarity to previously published sequences. PCR primers were designed
in the flanking sequence of each microsatellite using Primer 0.5 (Whitehead Institute,
MIT).
2.2. Taxon sampling
For Heterocephalus, a total of 79 Kenyan DNA samples were used: 30 from
Meru (7 colonies), eight from Mbovo (3 colonies), and 41 (10 colonies) from Mtito
Andei. A total of 76 Heliophobius samples were included: 34 individuals from Kenya
and 42 individuals from Malawi/Zambia. A total of 47 individuals of B. suillus and 11
individuals of B. janetta, and a total of 28 Georychus samples were screened: 11
individuals from the Western Cape Province (WC), 14 individuals from the Eastern
Cape Province (EC), and three individuals from the Mpumalanga (Transvaal) Province
(TP). Four species of Cryptomys were included with a total of 11 Cryptomys anomalus
(2 populations), 19 C. holosericeus (4 populations), 13 C. hottentotus (5 populations),
and 24 C. natalensis (7 populations) samples. Five species of Coetomys, with a total of
75 individuals: two Coetomys amatus (1 population), five C. anselli (3 populations), 52
C. damarensis (10 populations), ten C. mechowii (4 populations) and six C. whytei (2
populations) samples. The individuals from which the microsatellite libraries were
designed were included for each genus.

56
2.3. Microsatellite amplification, genotyping, and sequencing
All primer sets were screened via polymerase chain reaction (PCR) across all
lineages of Bathyergidae to determine if each locus is conserved. If amplification of a
locus was successful, then all available samples were genotyped using an ABI 377
automated sequencer using primers labeled with one of three fluorescent dyes: TET,
FAM, or HEX. Approximately 20-100 ng of template DNA was amplified in 25 µL
reactions using 1.25U of EX-Taq polymerase (Takara: Fisher Scientific), and a final
concentration of 1X EX-Taq Buffer (w/ MgCl2)(Takara), 0.25 mm dNTPs (Takara),
0.1µM of fluorescent-labeled (forward) and unlabeled (reverse) primers. Reaction
conditions included an initial 2 min denaturation at 95 °C, followed by 35 cycles of 95
°C for 30 s, annealing temperature (Tables 3.1–3.6) for 30 s, and 72 °C for 30 s, with a
final extension time of 7 min at 72 °C. An internal size standard (MapMarker 400:
BioVentures, Inc.) was run with every sample. Each locus was compiled and analyzed
using GENOTYPER v.2.5 software (PE Applied Biosystems).
2.4. Data analyses
Both POPGENE v1.31 (Yeh and Boyle, 1997) and GENEPOP (Raymond and
Roussett, 1995) were used to test for deviation from Hardy-Weinberg equilibrium
(HWE) and assay linkage disequilibrium. When pairwise comparisons were made, p-
values were adjusted using Bonferroni correction.

57
3. Results and Discussion
3.1. Amplification and variation within focal taxa
3.1.1. Heliophobius
The primer sequence, annealing temperature, number of alleles, and both
observed (HO) and expected (HE) heterozygosities found at each locus are listed in Table
3.1. In the Kenyan samples, Harg01 and Harg07 were not in Hardy-Weinberg
equilibrium (HWE; p < 0.0001). In the Malawi/Zambian samples, Harg03 and Harg08
were not at HWE. Both the Kenyan and Malawi/Zambian datasets consisted of pooled
populations, which, when separated by sampling locality, met HWE except one
Malawian population (Blantyre) that was not in HWE for Harg08. No loci were in
linkage disequilibrium after pairwise testing (GENEPOP).
3.1.2. Georychus
Six primers designed from Georychus capensis are shown in Table 3.2, including
primer sequence, number of alleles, and both observed (HO) and expected (HE)
heterozygosities at each locus. Gcap01 and Gcap10 were the only loci that deviated
from HWE (eastern Cape only). This sample consisted of individuals from multiple
sampling sites in that region, that when separated by locality, met Hardy-Weinberg
expectations. No linkage disequilibrium was detected. Mean number of alleles (± S.D.)
per loci for the genus was 7.50 ± 3.39. Mean observed heterozygosity (HO) was 0.424 ±
0.260.

58
Table 3.1 Characterization of seven polymorphic microsatellite loci isolated from Heliopbobius argenteocinereus.
Sequence 5' - 3' Dye Repeats in cloned allele Location* H0* HE*
Harg01 F: TACATATGGCAGGGCTGG 6-FAM 63 222/222 (GTT)8ATT(GTT)2ATT Kenya 216 - 222 2 0.000 0.060
R: TACCTTGTGAGTGAGTGACTGG Malawi 216 - 219 2 0.152 0.179
Harg02 F: AAAGGAAAGGCAGGCAAG HEX 61 324/323 (GTT)7GT Kenya 320 - 323 2 0.000 0.056
R: ATTTTAGTGACACCCTGACCC Malawi 317 - 323 3 0.237 0.219
Harg03 F: TCCACTGTCCTCCCTCAAT 6-FAM 61 259/259 (GT)10GC(GT)4 Kenya 258 1 0.000 0.000
R: ACGTCAGAACGAAAGGTCTG Malawi 272 - 296 12 0.600 0.901
Harg07 F: ATGAGAGTTTCCTGATGTCCC TET 54 171/171 (GT)15GCTT(GT)5 Kenya 163 - 175 3 0.039 0.298
R: TCCATCTTTCCCACACCTAA Malawi 143 - 159 3 0.105 0.103
Harg08 F: CTAAGGTTTTTGGCTCTGACC HEX 58 310/314 (GT)24 Kenya 304 - 322 6 0.526 0.795
R: CTCAAGGTGCCTGCTATATACA Malawi 297 - 322 13 0.667 0.891
Harg10 F: CTTCCCAGCTGTCACAGAGT TET 61 195/195 (GTT)13 Kenya 192 - 195 2 0.333 0.419
R: CTTCCAGTCCATGGTAATGC Malawi 177 1 0.000 0.000
Harg11 F: CTGTGTCCCTTCTTCCTTCA HEX 65 333/334 (GT)17 Kenya 334 - 346 5 0.600 0.822
R: GACTGAGTCGAGGTTTAGATGG Malawi - - - -
*For each locus, the allele size range, number of alleles (Na), observed (HO) and expected (HE) heterozygosity are reported for H.argenteocinereus from Kenya and Malawi.
Primer
Name
Annealing
Temp (oC)
Size of clones (bp)
exp/obs
Size
Range (bp)* Na*

59
Table 3.2 Characterization of 6 polymorphic microsatellite loci isolated from Georychus capensis
Sequence 5' - 3' Dye Repeats in cloned allele Locality* H0* HE*
Gcap01 F: CTTGTTGGGAAGTTTCACTCA TET 58 124/113 (GT)10 AT (GT)5 CP 113 - 129 8 0.900 0.868
R: AGTTCTGAGCCCAGCTGAC EC 113 - 125 4 0.083 0.308
TP 123 - 125 2 0.333 0.333
Gcap02 F: TATGTGTCTCAGCAGCCAAA 6-FAM 58 417/294 (GT)17 CP 286 - 324 9 0.900 0.916
R: ACATAGGTTAACAGCTGTGCG EC 286 - 308 7 0.571 0.656
TP - - - -
Gcap03 F: TTGATGAGGTGAAGCATAAGC HEX 58 283 (GT)14 CP 286 - 288 2 0.000 0.533
R: CTACCCACTCTCGGGGAC EC 284 - 284 2 0.000 0.667
TP 284 1 0.000 0.000
Gcap04 F: GGGTGATGAGAGCATGTCTT 6-FAM 58 167/159 (GTT)7 CP 163 - 173 4 0.455 0.688
R: CAGTGGGAAGAGTTTTAGATGG EC 161 - 167 2 0.071 0.071
TP 161 - 167 3 0.333 0.733
Gcap07 F: TAAGGACACGGAGTAGGTGG HEX 58 242/218 (GT)21 CP 216 - 228 5 0.546 0.706
R: AGTTCCCCAAGTTGGTAAGG EC 216 -222 3 0.539 0.557
TP 242 - 246 3 0.667 0.733
Gcap10 F: TAGTTTCCCCTTTGTTTCC TET 58 162/163 (GT)19 CP 163 - 173 6 0.727 0.849
R: TAGGCTAAAAAGAAGCCTTGG EC 161 - 171 6 0.500 0.765
TP 163 - 177 2 0.500 0.500
*For each locus, the allele size range, number of alleles (Na), observed (HO) and expected (HE) heterozygosity are reported for G.capensis from western Cape (CP), eastern Cape (EC)
and Mpumalanga (TP) .
Primer
Name
Annealing
Temp (oC)
Size of clones
(bp) exp/obs
Size
Range (bp)* Na*

60
60
3.1.3. Bathyergus
Table 3.3 lists the primer sequence, annealing temperature, number of alleles and
both observed (HO) and expected (HE) heterozygosities for each locus. For B. suillus,
mean number of alleles per loci (±SD) was 11.8 ± 3.49, and mean observed
heterozygosity was 0.602 ± 0.2. Bsuil01, Bsuil02, and Bsuil06 were not in Hardy-
Weinberg equilibrium (p < 0.0001) when populations were pooled together, but when
populations were separated by sampling locality, the loci met HWE in B. suillus. None
of the loci were in linkage disequilibrium after pairwise testing using GENEPOP v3.4.
3.1.4. Cryptomys
Characterization of five microsatellite loci designed from C. hottentotus are listed
in Table 3.4, including primer sequence, number of alleles, and both observed (HO) and
expected (HE) heterozygosities at each locus. After Bonferroni correction to account for
multiple pairwise comparisons, only Chott05, Chott06, and Chott08 were not at HWE in
C. natalensis, and Chott08 did not meet HWE in C. anomalus. Once separated by
localities, all loci met HWE, except a single population of C. anomalus for Chott08. No
significant linkage disequilibrium was detected between loci. Mean number of alleles
(±S.D.) per loci for the genus was 14.6 ± 2.61 and mean observed heterozygosity (HO)
was0.538 ± 0.113.

61
61
3.1.5. Coetomys
Primer sequence, number of alleles, and both observed (HO) and expected (HE)
heterozygosities are listed in Table 3.5. After Bonferroni correction, Cmech03,
Cmech06, Cmech09 and Cmech11 were not at HWE in C. damarensis, and Cmech06
did not meet HWE in C. mechowii. Once separated by localities, all loci met HWE. No
significant linkage disequilibrium was detected among loci. Mean number of alleles (±
SD) per loci for the genus was 13.6 ± 7.50. Mean observed heterozygosity (HO) was
0.400 ± 0.309.
3.1.6. Heterocephalus
The primer sequence, annealing temperature, number of alleles, and both
observed (HO) and expected (HE) heterozygosities found at each locus are listed in Table
3.6. After Bonferroni correction, only Hglab10 in Mtito Andei samples, and Hglab01
and Hglab03 in Meru samples were not in Hardy-Weinberg equilibrium (HWE;
corrected p < 0.0028). All localities consist of multiple colonies, which may account
for this deviation from HWE, as well as the fact that the mating system does not meet
the assumption of random mating and colonies have very low Ne and overlapping
generations. No loci were in linkage disequilibrium after pairwise testing (GENEPOP).

62
Table 3.3 Characterization of 5 polymorphic microsatellite loci isolated from Bathyergus suillus.
Sequence 5' - 3' Dye Repeats in cloned allele Species* H0* HE*
Bsuil01 F: GTCTACCCGTCCTCCAGG 6-FAM 64.7 211/208 (GT)14 GC (GT)4 BS 194 - 216 10 0.404 0.827
R: AACGTTCTCCTAATTCTCCTCC BJ 192 - 204 3 0.091 0.645
Bsuil02 F: CAGGGAGAGGGTGGGTAG 6-FAM 56.4 198/131 (GT)14 GCAC (GT)5 TTGTG BS 127 - 141 7 0.422 0.680
R: CCTTTGTGAGCTCCATCAGT BJ 123 - 135 5 0.300 0.794
Bsuil04 F: TTGCAACACAGAGGAACTGA HEX 58.9 337/337 (GT)21 BS 321 - 353 14 0.838 0.872
R: GTGGGTTGCTGATCTGTCTT BJ 317 - 343 4 0.333 0.867
Bsuil05 F: CCTCTCTGACCCTGTGACAC HEX 62.7 364/378 (GT)16 (GA)10 BS 360 - 396 16 0.787 0.923
R: TCGAAGATCCCACCACAG BJ 362 - 366 3 0.429 0.648
Bsuil06 F: TGTGGTCTCTTTCTTGGCTC TET 63.9 253/242 (GT)2 GA (GT)16 G (GT)4 BS 238 - 266 12 0.558 0.873
R: AACAGTGGAGGAGCTTTGTG BJ 242 1 0.000 0.000
Na*
*For each locus, the allele size range, number of alleles (Na), observed (H0) and expected (HE) are reported for both B.suillus (BS) and B. janetta (BJ).
Size
Range (bp)*Size of clones
(bp) exp/obs
Primer
Name
Annealing
Temp (oC)

63
Table 3.4 Characterization of 5 polymorphic microsatellite loci isolated from Cryptomys hottentotus.
Sequence 5' - 3' Dye Repeats in cloned allele Species* H0* HE*
Chott01 F: CCTCCCGGTTACTTAGGGT HEX 58.9 281/279 (GT)19 C.anomalus 263-291 8 0.778 0.895
R: CTGACATGCAAGGCTTTTG C.holosericeus 263-293 10 0.632 0.873
C.hottentotus 271-287 5 0.500 0.725
C.natalensis 271-291 10 0.474 0.845
Chott03 F: TGCCTCAGTATAAGGCTAGAGG6-FAM 61 208/210 (GT)2(GC)5(GT)3(GCGT)3(GT)4(GCGT)2GTGC(GT)3GCGTGCAT(GT)12C.anomalus 182-208 4 0.546 0.541
R: ATGTTCAGGACCTACAGGAGG C.holosericeus 156-238 9 0.556 0.832
C.hottentotus 198-214 7 0.615 0.825
C.natalensis 180-212 8 0.792 0.858
Chott05 F: ATCTAGAGAGGCTTGACCTGC HEX 63.9 302/303 (GT)15(GC)5(GT)3GCGT C.anomalus 283-307 7 0.750 0.858
R: GCTTGAGCAGTTTCTAAAATGC C.holosericeus 273-301 8 0.375 0.925
C.hottentotus 283-303 5 0.571 0.593
C.natalensis 285-301 4 0.250 0.767
Chott06 F: CTTGAAGGGGCTATGACAA 6-FAM 58.9 265/267 (GT)18 C.anomalus 245-265 6 0.444 0.824
R: GTATTCTCTTCCAAAGCAGTGG C.holosericeus 247-273 6 0.833 0.802
C.hottentotus 243-273 6 0.385 0.812
C.natalensis 259-275 8 0.625 0.780
Chott08 F: CTCAGCCCCTCACTACCC TET 63.9 140/141 (GT)20 C.anomalus 113-123 3 0.000 0.554
R: GTGTCTTCCCCCTTTTCTGT C.holosericeus 115-159 5 0.222 0.611
C.hottentotus 115-147 8 0.692 0.843
C.natalensis 115-155 12 0.478 0.897
*For each locus, the allele size range, number of alleles (Na), observed (HO) and expected (HE) heterozygosity are reported for C. anamalus, C.holosericeus, C.hottentotus, and C.natalensis .
Primer
Name
Annealing
Temp (oC)
Size of clones
(bp) exp/obs
Size
Range (bp)* Na*

64
Table 3.5 Characterization of 5 polymorphic microsatellite loci isolated from Coetomys mechowii.
Sequence 5' - 3' Dye Repeats in cloned allele Species* H0* HE*
Cmech03 F: CATAAATAAGCAATAGCCCAGCHEX 58 294/294 (GT)16 C.amatus 300-304 2 0.667 0.000
R: CCAGAAGTGGAGGACTAGCA C.anselli 284-290 4 0.733 0.800
C.damarensis 264-294 8 0.650 0.265
C.mechowii 278-294 6 0.817 0.750
C.whytei 284-306 9 0.955 0.833
Cmech04 F: GGAGTGGTGAGGACTGTGAC6-FAM 58 374/374 (GT)17 C.amatus 372-386 3 0.833 0.500
R: TCTGACTGGAACCCATCACT C.anselli 376-390 6 0.929 1.000
C.damarensis 354-396 15 0.924 0.898
C.mechowii 370-390 7 0.901 0.571
C.whytei 370-390 5 0.933 1.000
Cmech06 F: AGACGACTCTGTTTTCGGTG TET 58 168/166 (GTT)8 (GCA)6 C.amatus 148 1 0.000 0.000
R: CCAGTCTGTGCCTCTGAGAT C.anselli 160-163 2 0.536 0.750
C.damarensis 142-169 7 0.743 0.385
C.mechowii 148-169 4 0.634 0.222
C.whytei 139-163 5 0.893 0.250
Cmech09 F: TGTCTTGGCTCCTAGGTCAG HEX 58 296/310 (GT)10 (GT)21 C.amatus 310 1 0.000 0.000
R: CACCCCAACATTATACTCGC C.anselli 310 1 0.000 0.000
C.damarensis 306-312 3 0.169 0.026
C.mechowii 310-314 2 0.546 0.333
C.whytei 308-310 2 0.667 0.000
Cmech11 F: GACAGTAGGCCGTAATGTGCTET 58 149/146 (GT)18 C.amatus 152-156 2 1.000 1.000
R: CCACCTGTGGTTATCTCTCG C.anselli 146-150 3 0.733 0.200
C.damarensis 132-150 7 0.770 0.212
C.mechowii 140-154 6 0.842 0.500
C.whytei 142-162 2 0.667 0.000
*For each locus, the allele size range, number of alleles (Na), observed (HO) and expected (HE) heterozygosity are reported for C. amatus, C. anselli, C.
damarensis, C. mechowii, and C. whytei.
Na
*
Primer
Name
Annealing
Temp (oC)
Size of
clones (bp)
exp/obs
Size
Range (bp)*

65
Table 3.6 Characterization of seven polymorphic microsatellite loci isolated from Heterocephalus glaber.
Sequence 5' - 3' Dye Repeats in cloned allele Location* H0* HE*
Hglab01 F:TCAGAGTGCTACCCAGGATC 6-FAM 58 228/231 (GTT)6GT Mtito Andei 231 1 0.000 0.000
R:TACCAAAACTTGCAAAATTTCA Mbovo 229 - 231 2 0.125 0.125
Meru 231 - 235 3 0.513 0.08
Hglab03 F:GTCAGGTTGGCAGATTTTGA HEX 58 296/297 (GT)19(GA)16CA(GA)3(GGGA)2(GA)2AAGAGGGG(GA)2 Mtito Andei 297 1 0.000 0.000
R:TGTGTGAGGGGGAGACAG Mbovo 315 - 323 5 0.733 0.626
Meru 293 - 323 11 0.870 0.670
Hglab07 F:AACTGAAGTTCACTGTGCTGG TET 58 181/181 GTGA(GT)19AT(GT)4 Mtito Andei 181 1 0.000 0.000
R:TGAGGACACATTTCTTCTTGG Mbovo 169 - 183 3 0.396 0.429
Meru 177 - 183 4 0.706 0.636
Hglab09 F:AGATTTGTTCACCTCAATCC TET 58 168/170 (GT)13 Mtito Andei 168 - 172 3 0.499 0.353
R:GTTTTGGTAAAGGCTTCTTGG Mbovo 172 - 174 2 0.485 0.333
Meru 170 - 174 3 0.192 0.207
Hglab10 F:ACCAAGGGAAATAAACCTGC HEX 58 302/304 (GT)21 Mtito Andei 294 - 306 3 0.222 0.182
R:TTCTTCTTGTTCCTTGTGGC Mbovo 294 - 304 3 0.275 0.143
Meru 294 - 308 5 0.627 0.52
Hglab13 F:TCAGTTGGCTAGAGTGGGAG 6-FAM 58 380/385 (GT)21 Mtito Andei 385 1 0.000 0.000
R:CCAGGTTTCTGAGCGACTAA Mbovo 383 - 385 2 0.536 0.25
Meru 375 - 383 5 0.700 0.563
*For each locus, the allele size range, number of alleles (Na), observed (HO) and expected (HE) heterozygosity are reported for H. glaber from Mtito Andei, Mbovo, and Meru.
Primer
Name
Annealing
Temp (oC)
Size of clones
(bp) exp/obs
Size
Range (bp)* Na*

66
66
3.2. Application and variation in non-focal taxa
3.2.1. Heliophobius (Harg) loci
Cross-amplification of all seven loci was tested in the other five genera of
Bathyergidae (Table 3.7). A single locus, Harg01, amplified in the highly divergent
basal member, Heterocephalus glaber, but high levels of non-specific binding resulted in
no scorable genotypes. Although Harg07 amplified in all other species tested, the
fragment was too large (>650 bp) for use in fragment analysis. Only Harg03 and Harg11
showed promise for use in other species of Bathyergidae. Harg02 failed to amplify in
Coetomys, Bathyergus, Georychus or Heterocephalus, but showed polymorphism, with
number of alleles ranging from 3-5, in all species of Cryptomys tested. Although limited
in their use in other studies, this new suite of microsatellite markers provide a promising
tool for detailed studies of Heliophobius.
3.2.2. Georychus (Gcap) loci
To test the applicability of these markers in other species of Bathyergidae,
genotyping reactions were run across samples of 12 representative species. Successful
amplification and number of alleles detected at each locus are listed in Table 3.7. A
single locus, Gcap10, successfully amplified Heterocephalus glaber, and showed
variability with 8 alleles. In the other four genera, Bathyergus, Cryptomys, Heliophobius,
and Coetomys, only two markers failed to amplify all samples: Gcap02 in Coetomys and
Gcap03 in Cryptomys. Overall, these markers show great promise for their application in
genetics studies in all genera but the highly divergent Heterocephalus.

67
Table 3.7 Number of alleles observed at each microsatellite loci designed from Heliophobius argenteocinereus (Harg), Georychus capensis (Gcap), Bathergus suillus (Bsuil), Cryptomys hottentotus (Chott), Coetomys mechowii (Cmech), and Heterocephalus glaber (Hglab).
Species
Cryptomys Cryptomys Cryptomys Cryptomys Coetomys Coetomys Coetomys Coetomys Coetomys Bathyergus Bathyergus Georychus
anomalus holosericeus hottentotus natalensis amatus anselli damarensis mechowii whytei janetta suillus capensis
Locus n = 11 17 14 27 2 5 50 10 6 9 31 27
Harg01 – – – – – – 4 – – 1 1 1
Harg02 4 3 5 4 – – – – – – – –
Harg03 5 7 6 10 1 1 8 2 3 3 3 3
Harg07 > > > > > > > > > > > >
Harg08 – – – – – – – – – – – –
Harg10 – – – – – – – – – – – –
Harg11 – – – – 2 1 7 1 1 5 10 7
Gcap01 5 11 8 10 3 3 8 6 1 3 6 8
Gcap02 5 7 3 5 – – – – – 9 10 13
Gcap03 – – – – 4 2 19 4 – 1 4 3
Gcap04 1 2 1 1 2 2 3 3 – 4 9 5
Gcap07 8 9 7 11 3 5 10 5 1 5 13 8
Gcap10 1 2 2 1 1 1 2 1 2 3 8 8
Bsuil01 1 3 1 2 2 3 5 3 7 3 10 2
Bsuil02 7 8 6 10 3 4 13 7 4 5 7 8
Bsuil04 2 1 2 3 1 3 4 5 5 4 14 8
Bsuil05 1 1 2 3 1 1 2 2 1 3 16 13
Bsuil06 10 8 5 5 – – – – – 1 12 10
Chott01 8 10 5 10 – – 7 3 – 3 9 7
Chott03 4 9 7 8 4 4 17 7 4 6 10 7
Chott05 7 8 5 4 2 1 6 1 1 3 7 11
Chott06 6 6 6 8 1 1 11 4 4 1 1 1
Chott08 3 5 8 12 1 2 9 4 2 2 6 10
Cmech03 3 4 2 3 2 4 8 6 9 5 14 8
Cmech04 6 10 6 10 3 6 15 7 5 8 11 13
Cmech06 3 2 1 2 1 2 7 4 5 1 1 1
Cmech09 – – – – 1 1 3 2 2 5 10 7
Cmech11 3 3 4 3 2 3 7 6 2 1 2 5
Hglab01 3 8 5 6 2 2 10 5 3 7 10 7
Hglab03 – – – – – – – – – – – –
Hglab07 3 8 6 9 2 4 15 6 3 – – –
Hglab09 7 11 8 10 4 5 14 7 4 6 10 12
Hglab10 1 5 1 1 3 4 14 11 6 5 17 8
Hglab13 – – – – – – – – – – – –
Numbers indicate the number of alleles
– = amplification unsuccessful
+++ = multiple bands
> = fragment too large to analyze
The highest number of alleles is highlighted green if in the focal species, blue in a congener, or red in a different genus.

68
3.2.3. Bathyergus (Bsuil) loci
All five loci were tested across other members of the family Bathyergidae (Table
3.7). None of the primers successfully amplified in the basal member of the family,
Heterocephalus glaber. In Heliophobius, only Bsuil02 and Bsuil06 successfully
amplified. These taxa are highly divergent from other members of the family at the
molecular level (Ingram et al., 2004), so these results are not unexpected. In the more
closely related genera, Georychus, Cryptomys, and Coetomys, all five markers amplified,
except that Bsuil06 did not amplify in Coetomys. When amplification was successful,
all loci were polymorphic within each genus, ranging from 2–16 alleles (Table 3.7).
This new set of microsatellite markers provides a promising tool for detailed genetic
studies of Bathyergus. The successful amplification of polymorphic loci across several
species suggests their usefulness for other genetic studies.
3.2.4. Cryptomys (Chott) loci
Cross-species amplification was tested across 10 species representing the other
five genera of Bathyergidae. Amplification success and number of alleles are listed in
Table 3.7. Two loci (Chott05 and Chott06) amplified in the phylogenetically-divergent
genus, Heterocephalus, but both were monomorphic. Three loci (Chott03, Chott05,
Chott08) amplified in Heliophobius and showed some polymorphism with number of
alleles ranging from three to five. All five loci successfully amplified across the more
closely-related genera (Bathyergus, Georychus, and Coetomys), with number of alleles
ranging from 1 to 17. Based on the success of cross-taxon amplification, these markers

69
will provide a promising tool for detailed studies of the genus Cryptomys, as well as
other genera in Bathyergidae.
3.2.5. Coetomys (Cmech) loci
Cross-species amplification was tested across nine species representing the other
five genera of Bathyergidae. Successful amplification and number of alleles are listed in
Table 3.7. Only a single locus, Cmech04, amplified in the phylogenetically-divergent
Heterocephalus glaber, and was polymorphic (3 alleles). Two loci (Cmech04,
Cmech09) amplified in Heliophobius and showed high levels of polymorphism at locus
Cmech04 with 21 alleles. All five loci successfully amplified across the more closely
related genera (Bathyergus, Georychus, and Cryptomys), with number of alleles ranging
from 1 to 15 (Table 3.7). This new suite of microsatellite loci provides a promising tool
for detailed studies of the giant Zambian mole-rat, Coetomys mechowii, as well as other
Coetomys species. The ability of these primers to amplify across several species
suggests their potential for use in broader genetic studies across the family.
3.2.6. Heterocephalus (Hglab) loci
Cross-amplification of all seven Heterocephalus loci was tested in the other five
genera of Bathyergidae (Table 3.7). In the closest member based on a recent
phylogenetic study (Chapter II; Ingram et al. 2004), Heliophobius, five of the six primers
successfully amplified with four showing polymorphism, ranging from 4-19 alleles in
the samples screened. Hglab13 was the only locus that did not amplify in any of the
other species tested. Hglab01, Hglab09, and Hglab10 successfully amplified across all

70
five genera with number of alleles ranging from one to 19. This new suite of
microsatellite markers provides a promising tool for detailed studies of Heterocephalus,
as well as providing at least 3 loci that can be applied in studies of other genera of the
family Bathyergidae.
4. Conclusions
Because of the varying social structures found in Bathyergidae, with members
ranging from solitary (Heliophobius, Georychus, Bathyergus) to social or eusocial
(Cryptomys, Coetomys, Heterocephalus), detailed studies of each genus can provide
valuable information for parameters that influence behavior changes. Genotypic data
can provide insight into aspects of their biology that has not been observed, such as
heterozygosity levels, levels of gene flow, and mating structure. The availability of
molecular markers, such as microsatellite loci, will be invaluable to the further
investigations into the breeding system of these taxa. Although the Burland et al. (2001)
loci are available, the availability of species-specific primers will provide more robust
markers for studies of the more basal members of the family (Heterocephalus,
Heliophobius), rather than relying only on markers developed for genera that are
phylogenetically-divergent that could introduce problems associated with ascertainment
bias (Ellegren et al. 1995).

71
CHAPTER IV
CHARACTERIZING MICROSATELLITE LOCI AND THEIR PRIMER SITES
BY DIRECT SEQUENCING: MOTIF DECAY, ELECTROMORPHIC
HOMOPLASY, AND NULL ALLELES
1. Introduction
Microsatellites are regions of DNA consisting of simple sequence motifs (2 – 6
bp in length) that are repeated in tandem up to 100 times (Tautz, 1993; Zhivotovsky and
Feldman, 1995). Currently, microsatellite loci are considered the marker of choice for
population genetic studies (Bowcock et al., 1994; Gardner et al., 2000; Sunnucks, 2000).
In addition, they have been used extensively for paternity and kinship assessment (Altet
et al., 2001), forensic identification (Edwards et al., 1992), epidemiology of infectious
diseases (Wang et al., 2001), and genome mapping (Causse et al., 1994; Dib et al., 1996;
El Nahas et al., 2001; Su and Willems, 1996). Many microsatellite loci are characterized
by moderate to high levels of polymorphism associated with the repeat region that is
flanked by conserved stretches of nucleotides. These conserved flanking sequences
provide specific PCR (polymerase chain reaction) priming sites that allow for the
amplification of orthologous loci across individuals (usually within a species). In
addition, many loci isolated from one species (the focal species) have been applied in
genetic studies of related species (non-focal species), thus providing a high yield of
genetic information with little start-up investment (Clisson et al., 2000; Fitzsimmons et
al., 1995; Glenn et al., 1996; Jordan et al., 2002; Kim et al., 2004; Moore et al., 1991).

72
The use of cross-species primers assumes that a locus is evolving at the same rate
and under the same mutational mechanism across different lineages, and that only
changes in allele length within the motif are contributing to changes in electrophoretic
migration when scored as a genotype. Nevertheless, several processes can cause
violation of these assumptions. First, repeat motifs at the orthologous locus in the non-
focal species can change in complexity from a simple repeat to one that is interrupted or
consisting of multiple repeat motifs (Culver et al., 2001; Harr et al., 2000; Macaubas et
al., 1997; Sibley et al., 2003; Synmonds and Lloyd, 2003; Zhu et al., 2000). Second, the
flanking sequences adjacent to the repeat motif may experience insertion/deletion events
(indels), causing either fragment sizes to be out of phase with the expected change in
repeat length or mutations in phase with the repeat motif (Blankenship et al., 2002;
Karhu et al., 2000; Shao et al., 2005). The latter case will result in electromorphic
homoplasies. Third, mutations in the either of the genotyping primer sites can result in
failure to PCR amplify, either causing the locus to appear completely absent or
increasing the frequency of null alleles (Pemberton et al., 1995). Finally, conservation
of the primer sites can allow amplification, even in the absence of the microsatellite
locus in non-focal taxa.
In this study, I have used a phylogenetic approach and reciprocal comparisons of
microsatellite loci in focal and non-focal species to evaluate the processes of
microsatellite evolution in a monophyletic group of African rodents (family
Bathyergidae). All of these species are fossorial, and several show highly structured
social systems. In addition, phylogenetic relationships and the biogeographic history of

73
the family are well established (Faulkes et al., 2004; Ingram et al., 2004). Several
specific questions will be addressed including: 1) Do genotyping primers designed for
one of six possible focal genera successfully amplify PCR products suitable for fragment
analysis (genotyping in the non-focal taxa); 2) Do the levels of heterozygosity, number
of alleles, and range of allele sizes observed across all taxa suggest an ascertainment bias
associated with primer selection; 3) Does direct sequencing of the genotyping loci as
part of larger microsatellite flanking sequences (MFS) reveal changes in the repeat
motifs or indels within the genotyping fragments that contribute to estimated allele size
of electromorphs; and 4) Does sequencing of the genotyping loci reveal the presence of
undetected microsatellite alleles (null alleles) in taxa that fail to amplify the genotyping
fragment?
2. Materials and Methods
2.1. Genomic library and primer construction
Genomic libraries and genotyping primers were constructed using the methods
described in Chapter III. While designing the microsatellite primers described in
Chapter III, if sufficient flanking sequence was available, additional primers lying
outside of the genotyping fragment were designed to amplify larger fragments (500 –
800 bp) to allow for the sequencing of more nucleotides surrounding the repeat motif, as
well as the documentation of any changes in the genotyping primer site that would lead
to null alleles. For four microsatellite loci isolated from each taxon, both genotyping
and microsatellite flanking sequence (MFS) primers were designed to amplify either

74
fragments containing primarily a microsatellite locus (ca. 100 – 450 bp) or larger
fragments composed of the genotyping fragment and additional flanking sequence (ca.
500-800 bp). This strategy allowed for the assessment of changes in the microsatellite
locus as well as changes in regions distal and proximal to the repeat motif. Depending
on the amount of sequence available and the position of the microsatellite with respect to
the original genotyping primers, flanking sequence primer sets were designed under two
scenarios: 1) a single additional primer was designed to produce a 500 – 800 bp
fragment when combined with one of the original genotyping primers; or 2) two new
primers producing a 500 – 800 bp product bounding the original genotyping primers and
the microsatellite (Fig. 4.1).
2.2. Screening of genotyping and flanking sequence primer sets
Both the original genotyping and flanking sequence primer sets for each locus
were screened via PCR across representatives (same samples as Chapter III) from the six
genera of Bathyergidae to determine if each locus was conserved. For the genotyping
primers, if amplification of a locus was successful in a genus, then all available samples
for that genus were genotyped using primers labeled with one of three fluorescent dyes:
TET, FAM, or HEX on an ABI 377 automated sequencer. Genotyping parameters were
the same as those described in Chapter III.
If the flanking sequence primers amplified successfully, then two representatives
from each species were amplified. When possible, homozygotes (determined from
genotypic analyses) were selected for sequencing. Approximately 20-100 ng of template

75
Fig. 4.1 Two scenarios of microsatellite flanking sequence (MFS) primer design. a) a single additional primer was designed to produce a 500 – 800 bp fragment when combined with one of the original genotyping primers; or b) two new primers producing a 500 – 800 bp product bounding the original genotyping primers and the microsatellite.

76
DNA was amplified in 50 µL reactions containing 2.5 U of EX-Taq polymerase
(Takara), 1X EX-Taq Buffer w/ MgCl2 (Takara), 0.25 mM dNTPs (Takara), 0.1 µM of
primers. Reaction conditions included an initial 2 min denaturation at 95 °C, followed
by 35 cycles of 95 °C for 30 s, 58 °C for 30 s, and 72 °C for 30 s, with a final extension
time of 10 min at 72 °C. Amplification of the correct fragment length was confirmed by
electrophoresis of the PCR product (5 µl) with a size standard on 1% agarose minigels,
stained with ethidium bromide, and visualized under UV light. PCR products were
cleaned using QIAquick Spin PCR purification spin columns and following a standard
protocol (Qiagen Inc., Valencia, CA).
Both strands of the PCR product were sequenced using the PCR primers. Each
strand was sequenced at least two times for confirmation of the sequence. This was
necessary since the quality of the sequence dramatically declines once the polymerase
reaches the repeat region of the microsatellite. The cycle sequencing reactions, cleanup,
assembly, and contig construction were identical to that described in Chapter III.
2.3. Data analyses (Characterization of loci)
2.3.1. Genotyping data
Genotyping data from GENOTYPER were imported into Microsoft Excel
spreadsheets. The program CONVERT v1.31 (Glaubitz, 2004) was used to format files
for POPGENE v1.31 (Yeh and Boyle, 1997) and GENEPOP (Raymond and Rousset,
1995). Both POPGENE and GENEPOP were used to calculate summary statistics for
each species, such as the number of alleles and observed and expected heterozygosities

77
for each locus. The Wilcoxon Signed-Ranks test was used to test for the presence of an
ascertainment bias in marker selection on the following characteristics of the
microsatellite loci: 1) longest (genotyping fragment) allele; 2) highest number of alleles
per genus; and 3) largest range of alleles. To calculate the range of alleles (integer value
between the highest and lowest allele size), the step-wise mutation model (SMM) was
applied. Under SMM, it is assumed that with adequate sampling, all possible alleles
between the highest and lowest would be recovered in a given taxon (Kimura and Ohta,
1978; Valdes et al., 1993).
2.3.2. Sequencing data
Sequences were initially aligned using SEQUENCHER to establish a baseline
alignment and confirm sequence homology. After a working alignment was built in
SEQUENCHER, the file was imported into MacClade v3.02 (Maddison and Maddison,
2002). Fine-tuning of the alignments was performed visually using the plain molecular
data matrix setting in MacClade. All internal genotyping primers for each locus were
included in the alignment to identify any changes at the primer site. The boundaries of
the repeat region at each locus were determined using RepeatMasker. The masked
sequences were added to the alignments to delimit the range of the repeat region across
all taxa. Gaps were added throughout alignments to account for unique indels, as well as
any trackable changes in the repeat motif of each microsatellite locus.
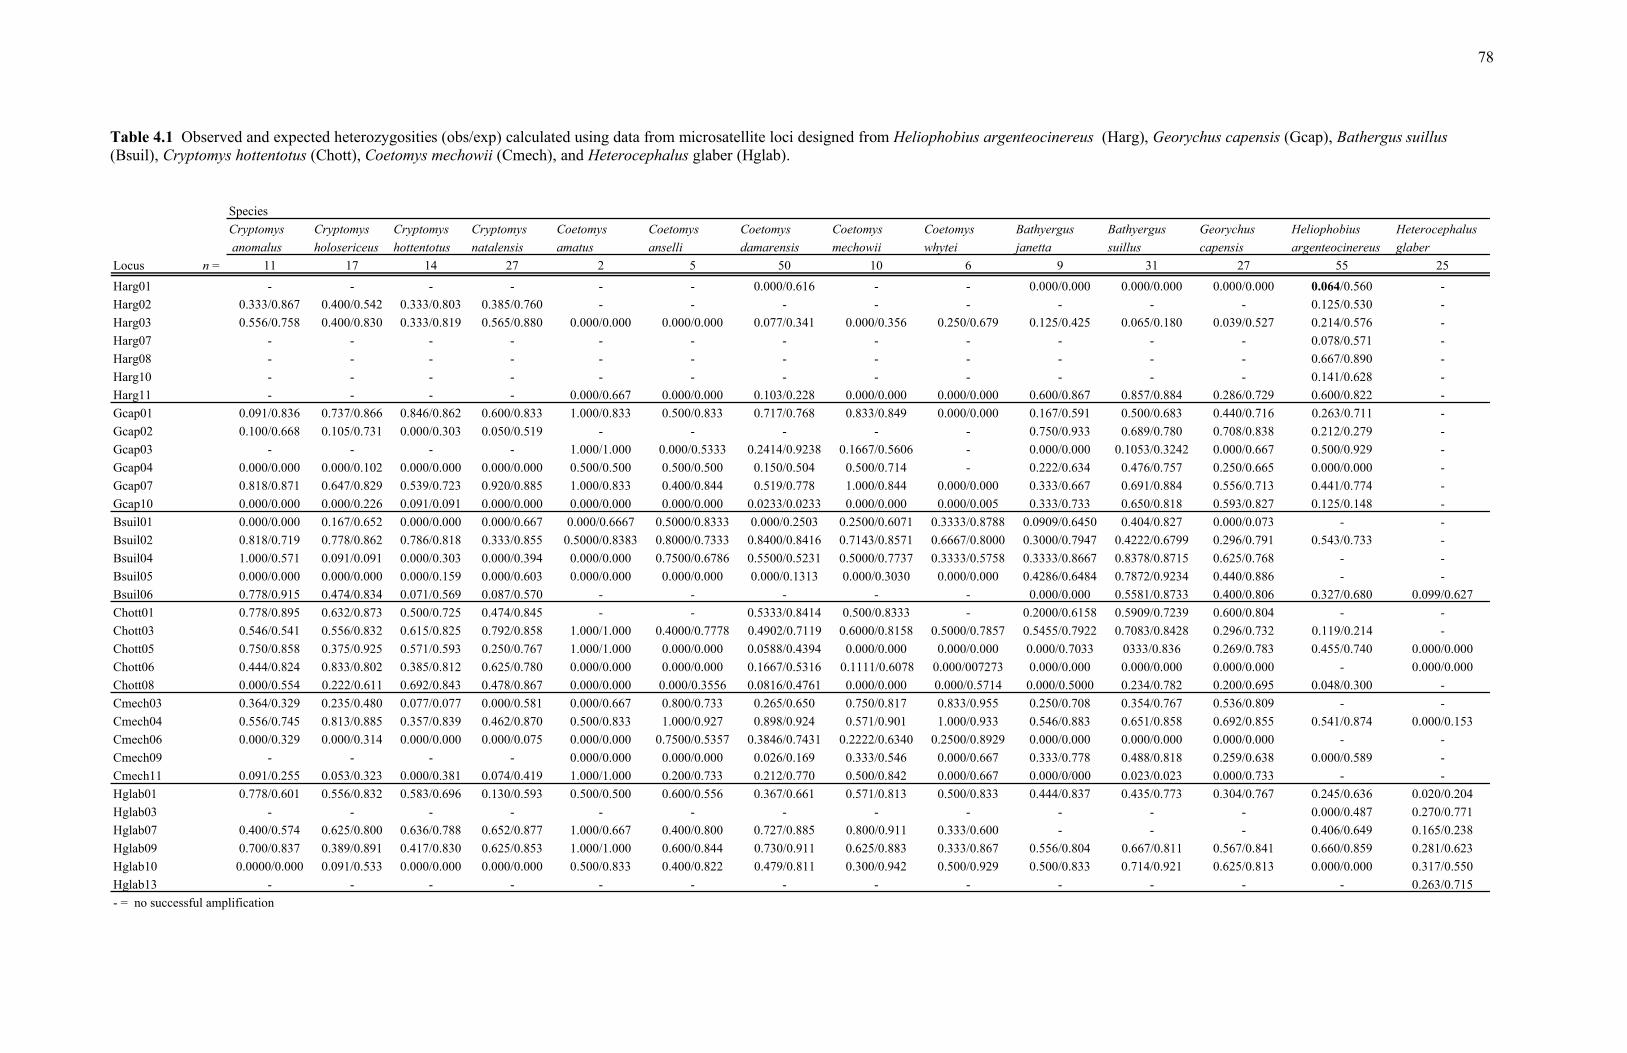
78
Table 4.1 Observed and expected heterozygosities (obs/exp) calculated using data from microsatellite loci designed from Heliophobius argenteocinereus (Harg), Georychus capensis (Gcap), Bathergus suillus (Bsuil), Cryptomys hottentotus (Chott), Coetomys mechowii (Cmech), and Heterocephalus glaber (Hglab).
Species
Cryptomys Cryptomys Cryptomys Cryptomys Coetomys Coetomys Coetomys Coetomys Coetomys Bathyergus Bathyergus Georychus Heliophobius Heterocephalus
anomalus holosericeus hottentotus natalensis amatus anselli damarensis mechowii whytei janetta suillus capensis argenteocinereus glaber
Locus n = 11 17 14 27 2 5 50 10 6 9 31 27 55 25
Harg01 - - - - - - 0.000/0.616 - - 0.000/0.000 0.000/0.000 0.000/0.000 0.064/0.560 -
Harg02 0.333/0.867 0.400/0.542 0.333/0.803 0.385/0.760 - - - - - - - - 0.125/0.530 -
Harg03 0.556/0.758 0.400/0.830 0.333/0.819 0.565/0.880 0.000/0.000 0.000/0.000 0.077/0.341 0.000/0.356 0.250/0.679 0.125/0.425 0.065/0.180 0.039/0.527 0.214/0.576 -
Harg07 - - - - - - - - - - - - 0.078/0.571 -
Harg08 - - - - - - - - - - - - 0.667/0.890 -
Harg10 - - - - - - - - - - - - 0.141/0.628 -
Harg11 - - - - 0.000/0.667 0.000/0.000 0.103/0.228 0.000/0.000 0.000/0.000 0.600/0.867 0.857/0.884 0.286/0.729 0.600/0.822 -
Gcap01 0.091/0.836 0.737/0.866 0.846/0.862 0.600/0.833 1.000/0.833 0.500/0.833 0.717/0.768 0.833/0.849 0.000/0.000 0.167/0.591 0.500/0.683 0.440/0.716 0.263/0.711 -
Gcap02 0.100/0.668 0.105/0.731 0.000/0.303 0.050/0.519 - - - - - 0.750/0.933 0.689/0.780 0.708/0.838 0.212/0.279 -
Gcap03 - - - - 1.000/1.000 0.000/0.5333 0.2414/0.9238 0.1667/0.5606 - 0.000/0.000 0.1053/0.3242 0.000/0.667 0.500/0.929 -
Gcap04 0.000/0.000 0.000/0.102 0.000/0.000 0.000/0.000 0.500/0.500 0.500/0.500 0.150/0.504 0.500/0.714 - 0.222/0.634 0.476/0.757 0.250/0.665 0.000/0.000 -
Gcap07 0.818/0.871 0.647/0.829 0.539/0.723 0.920/0.885 1.000/0.833 0.400/0.844 0.519/0.778 1.000/0.844 0.000/0.000 0.333/0.667 0.691/0.884 0.556/0.713 0.441/0.774 -
Gcap10 0.000/0.000 0.000/0.226 0.091/0.091 0.000/0.000 0.000/0.000 0.000/0.000 0.0233/0.0233 0.000/0.000 0.000/0.005 0.333/0.733 0.650/0.818 0.593/0.827 0.125/0.148 -
Bsuil01 0.000/0.000 0.167/0.652 0.000/0.000 0.000/0.667 0.000/0.6667 0.5000/0.8333 0.000/0.2503 0.2500/0.6071 0.3333/0.8788 0.0909/0.6450 0.404/0.827 0.000/0.073 - -
Bsuil02 0.818/0.719 0.778/0.862 0.786/0.818 0.333/0.855 0.5000/0.8383 0.8000/0.7333 0.8400/0.8416 0.7143/0.8571 0.6667/0.8000 0.3000/0.7947 0.4222/0.6799 0.296/0.791 0.543/0.733 -
Bsuil04 1.000/0.571 0.091/0.091 0.000/0.303 0.000/0.394 0.000/0.000 0.7500/0.6786 0.5500/0.5231 0.5000/0.7737 0.3333/0.5758 0.3333/0.8667 0.8378/0.8715 0.625/0.768 - -
Bsuil05 0.000/0.000 0.000/0.000 0.000/0.159 0.000/0.603 0.000/0.000 0.000/0.000 0.000/0.1313 0.000/0.3030 0.000/0.000 0.4286/0.6484 0.7872/0.9234 0.440/0.886 - -
Bsuil06 0.778/0.915 0.474/0.834 0.071/0.569 0.087/0.570 - - - - - 0.000/0.000 0.5581/0.8733 0.400/0.806 0.327/0.680 0.099/0.627
Chott01 0.778/0.895 0.632/0.873 0.500/0.725 0.474/0.845 - - 0.5333/0.8414 0.500/0.8333 - 0.2000/0.6158 0.5909/0.7239 0.600/0.804 - -
Chott03 0.546/0.541 0.556/0.832 0.615/0.825 0.792/0.858 1.000/1.000 0.4000/0.7778 0.4902/0.7119 0.6000/0.8158 0.5000/0.7857 0.5455/0.7922 0.7083/0.8428 0.296/0.732 0.119/0.214 -
Chott05 0.750/0.858 0.375/0.925 0.571/0.593 0.250/0.767 1.000/1.000 0.000/0.000 0.0588/0.4394 0.000/0.000 0.000/0.000 0.000/0.7033 0333/0.836 0.269/0.783 0.455/0.740 0.000/0.000
Chott06 0.444/0.824 0.833/0.802 0.385/0.812 0.625/0.780 0.000/0.000 0.000/0.000 0.1667/0.5316 0.1111/0.6078 0.000/007273 0.000/0.000 0.000/0.000 0.000/0.000 - 0.000/0.000
Chott08 0.000/0.554 0.222/0.611 0.692/0.843 0.478/0.867 0.000/0.000 0.000/0.3556 0.0816/0.4761 0.000/0.000 0.000/0.5714 0.000/0.5000 0.234/0.782 0.200/0.695 0.048/0.300 -
Cmech03 0.364/0.329 0.235/0.480 0.077/0.077 0.000/0.581 0.000/0.667 0.800/0.733 0.265/0.650 0.750/0.817 0.833/0.955 0.250/0.708 0.354/0.767 0.536/0.809 - -
Cmech04 0.556/0.745 0.813/0.885 0.357/0.839 0.462/0.870 0.500/0.833 1.000/0.927 0.898/0.924 0.571/0.901 1.000/0.933 0.546/0.883 0.651/0.858 0.692/0.855 0.541/0.874 0.000/0.153
Cmech06 0.000/0.329 0.000/0.314 0.000/0.000 0.000/0.075 0.000/0.000 0.7500/0.5357 0.3846/0.7431 0.2222/0.6340 0.2500/0.8929 0.000/0.000 0.000/0.000 0.000/0.000 - -
Cmech09 - - - - 0.000/0.000 0.000/0.000 0.026/0.169 0.333/0.546 0.000/0.667 0.333/0.778 0.488/0.818 0.259/0.638 0.000/0.589 -
Cmech11 0.091/0.255 0.053/0.323 0.000/0.381 0.074/0.419 1.000/1.000 0.200/0.733 0.212/0.770 0.500/0.842 0.000/0.667 0.000/0/000 0.023/0.023 0.000/0.733 - -
Hglab01 0.778/0.601 0.556/0.832 0.583/0.696 0.130/0.593 0.500/0.500 0.600/0.556 0.367/0.661 0.571/0.813 0.500/0.833 0.444/0.837 0.435/0.773 0.304/0.767 0.245/0.636 0.020/0.204
Hglab03 - - - - - - - - - - - - 0.000/0.487 0.270/0.771
Hglab07 0.400/0.574 0.625/0.800 0.636/0.788 0.652/0.877 1.000/0.667 0.400/0.800 0.727/0.885 0.800/0.911 0.333/0.600 - - - 0.406/0.649 0.165/0.238
Hglab09 0.700/0.837 0.389/0.891 0.417/0.830 0.625/0.853 1.000/1.000 0.600/0.844 0.730/0.911 0.625/0.883 0.333/0.867 0.556/0.804 0.667/0.811 0.567/0.841 0.660/0.859 0.281/0.623
Hglab10 0.0000/0.000 0.091/0.533 0.000/0.000 0.000/0.000 0.500/0.833 0.400/0.822 0.479/0.811 0.300/0.942 0.500/0.929 0.500/0.833 0.714/0.921 0.625/0.813 0.000/0.000 0.317/0.550
Hglab13 - - - - - - - - - - - - - 0.263/0.715
- = no successful amplification

79
Table 4.2 Range of alleles observed at microsatellite loci designed from Heliophobius argenteocinereus (Harg), Georychus capensis (Gcap), Bathergus suillus (Bsuil), Cryptomys hottentotus (Chott), Coetomys mechowi (Cmech), and Heterocephalus glaber (Hglab).
Species
Cryptomys Cryptomys Cryptomys Cryptomys Coetomys Coetomys Coetomys Coetomys Coetomys Bathyergus Bathyergus Georychus Heliophobius
anomalus holosericeus hottentotus natalensis amatus anselli damarensis mechowii whytei janetta suillus capensis argenteocinereus
Locus n = 11 17 14 27 2 5 50 10 6 9 31 27 55
Harg01 – – – – – – 149–237 – – 259 259 177 216–222
Harg02 308–338 305–335 308–335 308–335 – – – – – – – – 317–323
Harg03 256–264 246–260 250–268 246–274 248 248 248–280 248–250 244–250 244–252 248–256 250–252 258–296
Harg07 – – – – – – – – – – – – 143–175
Harg08 – – – – – – – – – – – – 298–322
Harg10 – – – – – – – – – – – – 177–195
Harg11 – – – – 324–326 338 332–368 390 338 322–332 312–336 362–372 334–346
Gcap01 119–135 111–133 117–141 107–135 123–127 127–133 121–141 117–127 131 99–117 113–123 113–125 117–135
Gcap02 278–308 266–318 278–302 278–320 – – – – – 274–304 290–310 286–324 244–316
Gcap03 – – – – 258–268 238–248 244–340 252–316 – 268 254–290 284–288 366–384
Gcap04 157 143–157 157 157 241–245 237–239 221–239 225–229 – 147–169 153–175 161–173 157
Gcap07 224–242 226–244 230–248 230–250 238–248 232–248 230–252 226–236 246 204–242 224–260 216–246 238–266
Gcap10 141 127–141 141–143 141 141 141 125–141 141 127–141 153–157 151–165 161–177 141–179
Bsuil01 182 182–250 182 182–206 214–222 216–224 182–216 194–214 204–221 192–204 194–216 206–214 –
Bsuil02 145–161 143–161 147–159 131–163 149–157 147–157 135–163 137–155 147–151 123–135 127–141 129–145 135–151
Bsuil04 311–313 311 311–313 309–313 307 299–307 299–307 297–305 299–307 317–343 321–353 315–347 –
Bsuil05 338 338 322–334 322–338 338 338 322–338 334–338 338 362–366 360–396 362–406 –
Bsuil06 234–272 242–290 234–314 234–264 – – – – – 242 238–266 240–262 246–280
Chott01 263–291 263–293 271–287 271–291 – – 277–293 285–289 – 257–263 247–271 267–281 –
Chott03 182–208 156–238 198–214 180–212 154–160 138–168 154–204 160–208 156–170 142–154 134–154 146–174 154–158
Chott05 283–307 273–301 283–303 285–301 287–293 273 271–285 279 295 257–287 285–315 255–309 207–255
Chott06 245–265 247–273 243–273 259–275 251 253 243–273 243–253 245–251 239 239 239 –
Chott08 113–123 115–159 115–147 115–155 115 115–119 111–181 111–123 111–115 121–123 113–123 121–223 115–125
Cmech03 262–266 260–288 266–270 264–270 300–304 284–290 264–294 278–294 284–306 276–298 272–306 290–314 –
Cmech04 368–384 350–390 370–382 368–394 372–386 376–390 354–396 370–390 370–390 364–384 368–392 362–394 400–476
Cmech06 140–145 142–145 145 142–145 148 160–163 142–169 148–169 139–163 139 139 136 –
Cmech09 – – – – 310 310 306–312 310–314 308–310 296–312 296–316 296–308 302–306
Cmech11 126–132 128–144 128–136 132–136 152–156 146–150 132–150 140–154 142–162 116 116 120–188 –
Hglab01 219–223 213–243 221–229 219–243 241–245 237–239 221–243 225–239 221–233 211–241 229–249 223–237 231–257
Hglab03 – – – – – – – – – – – – 291–313
Hglab07 167–181 165–181 175–187 165–185 187–191 179–193 161–197 167–183 173–177 – – – 177–195
Hglab09 180–200 176–202 180–196 182–198 190–198 192–202 170–204 170–194 178–192 170–200 176–208 162–204 170–210
Hglab10 292 280–330 292 292 318–330 324–334 290–332 290–332 310–326 396–306 302–346 300–322 296
Hglab13 – – – – – – – – – – – – –
– = no successful amplification

80
3. Results
3.1. Genotyping
The number of alleles, range of allele size, and observed and expected
heterozygosities for each locus are shown in Tables 3.7, 4.1 – 4.2. Since values of
observed and expected heterozygosity were calculated from pooled populations within
each species, the reduced levels of observed heterozygosity may be the result of
admixture (Wahlund effect). In order to make comparisons across species/genera for
each microsatellite locus, I used the number and range of electromorphic alleles as
assessments of genetic variability.
3.1.1. Heliophobius (Harg) loci
For Heliophobius, seven microsatellite loci were characterized. Four of the
seven genotyping loci were successful in amplifying taxa other than the focal species.
No Heliophobius (Harg) genotyping primers amplified in Heterocephalus glaber, the
basal member of the family.
Harg01 had low variation and little success in amplification. Coetomys
damarensis had a higher number of alleles than the focal taxon, but consisted of only
homozygotes. Harg02 amplified only in Heliophobius and Cryptomys. The amount of
variation across Cryptomys was greater than observed in Heliophobius, which had only
three alleles. Harg03 amplified in all genera, except Heterocephalus. The highest
number of alleles was found in Heliophobius (13 alleles). Although Harg07 amplified in
Georychus, Bathyergus, Cryptomys, and Coetomys, the fragment was too large (> 450

81
bp) to run as a genotype fragment (Table 3.7). Locus Harg08 and Harg10 successfully
amplified only in Heliophobius. The most variable loci in Heliophobius were Harg03
and Harg08, both with 13 alleles. Hatg08 is the only Heliophobius locus that consists of
a complex repeat (GT/GC). Harg11 amplified in all taxa, except Heterocephalus and
Cryptomys. The variability was highest in Bathyergus suillus with 10 alleles and
Coetomys showed a moderate amount of variation, with 1 – 7 alleles.
3.1.2. Georychus (Gcap) loci
For Georychus, six microsatellite loci were characterized. All Georychus loci
consisted of simple GT dinucleotide repeats, except the trinucleotide repeat (GTT) found
at the Gcap04 locus. The most basal member of the family, Heterocephalus, amplified
only with the Gcap10 primer set. Although five of the six loci amplified across species
of Coetomys, no samples of C. whytei (six individuals) amplified for any of the six
Georychus loci.
For Gcap01, the number of alleles ranged from 3 – 11 alleles. The highest
number of alleles (11) was observed in Cryptomys holosericeus. Genotyping Gcap02
was unsuccessful in Heterocephalus and all species of Coetomys. The number of alleles
ranged from 3 (C. hottentotus) to 13 (G. capensis). Gcap03 amplified in Heliophobius,
Georychus, Bathyergus, and all species of Coetomys, except C. whytei. The number of
alleles ranged from one (B. janetta) to 19 (C. damarensis). Higher polymorphism and
variability was documented in a non-focal genus, Coetomys. Gcap04 amplified in all
species except for H. glaber and C. whytei. In G. capensis and both species of

82
Bathyergus, the polymorphism and variability were relatively high with the number of
alleles ranging from 4 – 9. In Cryptomys and Coetomys, the variation was substantially
lower with the number of alleles ranging from 1 – 3. For Cryptomys, no heterozygotes
were observed. Gcap07 was consistently polymorphic across all species that it
successfully amplified. The number of alleles ranged from 3 – 13 (mean number of
alleles = 8) with G. capensis having the mean number of alleles. B. suillus and H.
argentoceocinereus shared the highest number of alleles. For Gcap10, the amount of
polymorphism was skewed across the six genera. For Heliophobius, Georychus, and
Bathyergus, the number of alleles ranged from 3 – 8 alleles. In Cryptomys and
Coetomys, the number of alleles was much lower (1 – 2). Gcap10 was the only
Georychus microsatellite locus to amplify Heterocephalus. The highest number of
alleles was found in Heterocephalus, G. capensis and B. suillus.
3.1.3. Bathyergus (Bsuil) loci
For Bathyergus, five microsatellite loci were characterized. All Bsuil loci
consisted of simple GT dinucleotide repeats, except Bsuil05 which consisted of a
complex GT/GA dinucleotide repeat. None of the Bathyergus genotyping primers
successfully amplified the basal member of the family, Heterocephalus glaber. Only
two loci, Bsuil02 and Bsuil06, amplified in Heliophobius. All Bathyergus loci amplified
in Bathyergus, Georychus, Cryptomys, and Coetomys, except Bsuil06 that did not
amplify any species of Coetomys.

83
In Bsuil01, the number of alleles ranged from 1 to 10. The highest number of
alleles was documented in the focal taxon, B. suillus. The number of alleles was much
lower (3 alleles) in the sister species, B. janetta. In G. capensis, there were 2 alleles but
no heterozygotes were observed. This locus was monomorphic in three of the four
species of Cryptomys. Variation at this locus was inconsistent across the five species of
Coetomys, with the number of alleles ranging from 2 to 7. Bsuil02 was the most
variable Bathyergus locus. The number of alleles observed across the species sampled
was 3 – 13 (mean number of alleles = 7). The level of variation seen in the four species
of Cryptomys was relatively high with the number of alleles ranging from 6 to 10. The
highest amount of polymorphism and variation was observed in the genus Coetomys
with the number of alleles ranging from 3 to 13. C. damarensis had the highest number
of alleles, while B. suillus showed the average number of alleles.
In the species for which Bsuil04 could be amplified, the number of alleles ranged
from 1 to 14. The focal taxon, B.suillus, showed the highest number of alleles, but B.
janetta had only 4 alleles. In the four species of Cryptomys, the number of alleles was
low, ranging from 1 to 3. No heterozygotes were observed in three of the four species
(C. holosericeus, C. hottentotus, and C. natalensis). In contrast, all individuals of C.
anomalus were heterozygous at this locus.
For Bsuil05, the number of alleles ranged from 1 to 16. Most of the variation
was observed in the focal taxon, B. suillus, and its closest relatives. The number of
alleles (16) was highest in B. suillus, G. capensis had 13 alleles, and B. janetta again
showed little variation with only 3 alleles. For both Cryptomys and Coetomys, there was

84
little variation at this locus. The number of alleles ranged from 1 to 3 and all individuals
were homozygous. Bsuil06 did not amplify in either Coetomys or Heterocephalus. The
number of alleles ranged from 1 to 13 (mean = 8), in the taxa in which it did amplify,
Heliophobius had the most alleles, B. suillus had 12 alleles, and B. janetta was
monomorphic at this locus. For G. capensis, the variation at this locus was high with 10
alleles.
3.1.4. Cryptomys (Chott) loci
For Cryptomys, five microsatellite loci were characterized. Three of the
Cryptomys loci, Chott01, Chott06 and Chott08, were simple dinucleotide (GT) repeats,
while the other two loci, Chott03 and Chott05, consisted of complex dinucleotide
repeats. Only one genotyping locus, Chott05, successfully amplified all species
sampled. At Chott01, amplification was not successful in Heterocephalus,
Heliophobius, Coetomys amatus, C. anselli, or C.whytei. In the other taxa, number of
alleles ranged from 3 to 10 (mean number of alleles = 7). Within the genus Cryptomys,
the number of alleles ranged from 5 to 10. The highest number of alleles was observed
in C. holosericeus and C. natalensis. Among Coetomys, Chott01 amplified only in C.
damarensis and C. mechowii with 3 and 7 alleles, respectively.
Chott03 amplified in all species, except H. glaber. Across the five genera
sampled, the number of alleles ranged from 3 to 17 (mean = 7). The highest amount of
variation at this locus was not found in the focal species or its congeners. Within the
focal genus, number of alleles ranged from 4 to 9. Across the five species of Coetomys,

85
number of alleles ranged from 4 to 17 with the highest number of alleles found in
Coetomys damarensis (Table 3.7).
At Chott05, the number of alleles ranged from 1 to 11 (mean = 4). In
Heterocephalus, Chott05 was monomorphic. The highest number of alleles was
observed in Georychus. In Cryptomys, the number of alleles ranged from 4 – 7. Across
the five species of Coetomys, the number of alleles ranged from 1 – 6. Coetomys anselli,
C. mechowii, and C. whytei were all monomorphic, while both C. amatus individuals
were heterozygotes.
Chott06 amplified in all species except Heliophobius. The number of alleles
across all species sampled ranged from 1 – 11 (mean = 4). Chott06 was monomorphic in
Heterocephalus, Georychus, both species of Bathyergus, and three species of Coetomys
(C. amatus, C. anselli, and C. whytei). Within Cryptomys, the number of alleles ranged
from 6 – 8. Across the five species of Coetomys sampled, the number of alleles ranged
from 1 – 11. The highest number of alleles was not observed in the focal taxon,
Cryptomys hottentotus, but in Coetomys damarensis. Chott08 amplified successfully in
all species, except for Heterocephalus glaber. The number of alleles observed at this
locus ranged from 1 - 12 (mean = 5). The highest number of alleles was observed in the
congener, C. natalensis.
3.1.5. Coetomys (Cmech) loci
For Coetomys, five microsatellite loci were characterized. Four of the Coetomys
genotyping loci, Cmech03, Cmech04, Cmech09 and Cmech11 consisted of simple

86
dinucleotide (GT) repeats and one locus, Cmech06, contained a complex trinucleotide
(GTT/GCA) repeat. Only one locus, Cmech04, amplified across all species of
bathyergids (Table 3.7). Two loci, Cmech04 and Cmech09, successfully amplified in
Heliophobius, and all Cmech loci amplified in Georychus, Bathyergus, Cryptomys, and
Coetomys, except Cmech09 that did not amplify in any species of Cryptomys.
For the taxa that amplified Cmech03, number of alleles ranged from 2 – 14 (mean = 6).
The number of alleles was substantially different (5 vs. 14) between the two species of
Bathyergus. The highest number of alleles was found in B. suillus rather than the focal
species. Cmech04 was the only Coetomys locus that could be amplified in all species.
The number of alleles across all species ranged from 3 – 21 (mean = 9). In
Heterocephalus, 3 alleles were identified and all individuals were homozygous.
Heliophobius had the highest number of alleles. Neither polymorphism nor genetic
variation was highest in the focal taxon, C. mechowii, as expected. Heliophobius was
the most polymorphic with 21 alleles (Table 3.7).
The number of alleles at Cmech06 ranged from 1 – 7 (mean = 3). This locus was
monomorphic in Georychus capensis, both species of Bathyergus, Cryptomys
hottentotus, and Coetomys amatus. In the other three species of Cryptomys (C.
anomalus, C. holosericeus, and C. natalensis), the number of alleles ranged from 2 to 3
alleles and all individuals were homozygous. With the exception of C. amatus, the
number of alleles within Coetomys ranged from 2 to 7. The highest number of alleles
was observed in C. damarensis.

87
Cmech09 did not amplify in Heterocephalus glaber or any species of Cryptomys.
Across the species that amplified this locus, number of alleles ranged from 1 – 10 (mean
= 4). In Heliophobius, 3 alleles were observed, but no heterozygotes. Within the genus
Coetomys, two species (C. amatus and C. anselli) were monomorphic. Among the other
three species, the number of alleles ranged from 2 – 3. At locus Cmech11, amplification
was successful in all species, except Heterocephalus and Heliophobius. Across the taxa
that amplified, number of alleles ranged from 1 – 7 (mean = 3). In Georychus, there
were 5 alleles, but all individuals sampled were homozygous. The largest number of
alleles was observed in C. damarensis.
3.1.6. Heterocephalus (Hglab) loci
For Heterocephalus, six microsatellite loci were characterized. Three of the
Hglab genotyping loci (Hglab09, Hglab10, and Hglab13) consisted of simple
dinucleotide (GT) repeats, Hglab01 contained a trinucleotide (GTT) repeat, and Hglab03
and Hglab07 both contained complex repeats. Three of the loci amplified in all species.
Hglab13 amplified only in the focal species.
Across all species sampled, the number of alleles in Hglab01 ranged from 2 –10
(mean = 6). In the focal taxon, the amount of variation at this locus was markedly low
with 5 alleles. The highest polymorphism (number of alleles = 8) was seen in C.
damarensis. Hglab03 only amplified in Heterocephalus and Heliophobius. In
Heliophobius, there were 4 alleles, but all individuals were homozygous, while
Heterocephalus had 15 alleles.

88
Three species did not successfully amplify with the Hglab07 genotyping primers
(B. janetta, B. suillus, and G. capensis). Across the species that did amplify, the number
of alleles ranged from 2 –15 (mean = 6). Heterocephalus had the average number of
alleles (6), while C. damarensis had the highest (15 alleles). All species successfully
amplified with the Hglab09 genotyping primers. Among all species sampled, number of
alleles ranged from 4 to 19 (mean = 9). Heliophobius showed the highest variation at
this locus. In the focal species, variation at this locus was again low with 5 alleles.
The number of alleles at Hglab10 ranged from 1 – 17 (mean = 6). Heliophobius,
C. anomalus, C. hottentotus, and C. natalensis were monomorphic. The amount of
variation in Cryptomys spp. was markedly low. C. holosericeus, the only species that
showed polymorphism at this loci, had 5 alleles. The focal species had 8 alleles, and B.
suillus had the highest number of alleles. Hglab13 only amplified in Heterocephalus
with seven alleles. Although this locus was specific for the focal taxon, suggesting an
ascertainment bias, when an Hglab locus could be amplified in the other bathyergid taxa,
variation was always higher in a non-focal species.
3.1.7. Ascertainment bias
For each microsatellite panel, the number of loci with the longest alleles, highest
number of alleles, and range of alleles for focal and non-focal taxa are shown in Table
4.3. If the largest allele, number of alleles, or range of alleles was observed in a
congener it was still treated as being observed in the focal taxon, thereby possibly
inflating an ascertainment bias. Nevertheless, no ascertainment bias was detected in any

89
of the three comparisons (p = 0.562, 0.438, and 0.375, respectively). A one-tail test
comparing the range of alleles between the focal and non-focal taxa with the largest
range at each locus found a significant difference between the two groups (p = 0.027).
However, rather than supporting an ascertainment bias, the larger range was observed in
a non-focal taxon.
3.2. Characterization of the microsatellite motifs and their immediate flanking sequences
Microsatellite flanking sequence (MFS) data was recovered for 16 of the 34
microsatellite loci. Information, including repeat motif, changes in primer sites, indels,
and additional repetitive elements, is shown in Tables 4.4 – 4.19 for each individual
sequenced. The repeat motif, genotyping fragment length, and genotyping success of
each locus were plotted on the Bathyergidae phylogeny modified from Ingram et al.,
2004 (Figs. 4.2 – 4.17). Due to potential errors in allele size based on the fragment
analysis, the genotyping fragment lengths were calculated from the MFS data.
3.2.1. Heliophobius (Harg) loci
Three Heliophobius loci (Harg02, Harg03, and Harg07) were sequenced.
Representatives of Heliophobius, Bathyergus, Cryptomys, and Coetomys were
successfully sequenced for the Harg02 MFS locus (Table 4.4). In all individuals, the
repeat motif was a perfect trinucleotide (GTT) repeat. In the immediate flanking
sequence, there were seven regions identified that contributed to variation in the
fragment size of the genotyping product. Four of these regions varied only between

90
Table 4.3 Comparison of number of loci with the longest alleles, number of loci with the highest number of alleles, and range of alleles for focal and non-focal taxa for each microsatellite panel. P-values for the Wilcoxon Signed-Ranks test is shown for each comparison.
a) b) c)
Origin of marker focal species non focal Origin of marker focal species non focal Origin of marker focal species non focal
Heterocephalus 2 4 Heterocephalus 2 4 Heterocephalus 3 3
Heliophobius 5 2 Heliophobius 3 5 Heliophobius 5 2
Bathyergus 1 4 Bathyergus 2 4 Bathyergus 3 3
Georychus 1 5 Georychus 1 5 Georychus 0 6
Cryptomys 3 2 Cryptomys 4 1 Cryptomys 2 5
Coetomys 3 2 Coetomys 3 2 Coetomys 1 4
W+ = 7.50, W- = 13.50, N = 6, p <= 0.5625 W+ = 6, W- = 15, N = 6, p <= 0.4375 W+ = 2, W- = 8, N = 4, p <= 0.375
Number of loci with largest range
of alleles observed in
Number of loci with largest allele
observed in
Number of loci with highest
number of alleles observed in

91
Table 4.4 Observed sequence length, repeat motif, indels, additional repetitive regions, and changes in the primer sites for locus Harg02. Expansions within a SINE element are included with other indels documented at this locus.
Changes in primer site
Repeat motifs Indels Harg02-F
Taxa Sample Target region A TTT T/A w/in Sine A G CAGGA (C) n 5'-AAAGGAAAGGCAGGCAAG-3'
H.argenteocinereus H046 323 325 (GTT)7 X X 13 -GG--- - X CAGGA (C)6 ******************
H.argenteocinereus H050 323 324 (GTT)7 X X 13 -GG--- - X CAGGA (C)6 ******************
H.argenteocinereus HA24 320 322 (GTT)6 X X 13 -GG--- - X CAGGA (C)6 ******************
B.suillus BS NA 320 (GTT)3 - X 11 -GG--- - X CAGGA (C)9 *************A****
B.suillus BJ NA 320 (GTT)3 - X 11 -GG--- - X CAGGA (C)9 *************A****
B.suillus N8 NA 320 (GTT)3 - X 11 -GG--- - X CAGGA (C)9 *************A****
C.hottentotus MCA324 NA 308 (GTT)6 X - 12 AGG--- X - - *************A****
C.hottentotus TM38375 NA 315 (GTT)7 X - 12 AGG--- X - - *************A****
C.holosericeus SP7552 305 308 (GTT)6 X - 12 AGG--- X - - *************A****
C.natalensis CHN2 308 309 (GTT)5 X X 12 AGG--- X X - *************A****
C.anaomalus SP7705 323/326 318 (GTT)10 X X 12 AGG--- X X - *************A****
C.mechowii M71 NA 295 (GTT)2 X X 13 GGGG-- - X - *************A**G*
C.kafuensis Z10 NA 295 (GTT)2 X X 13 GGGG-- - X - *************A**G*
C.damarensis HW3084 NA 295 (GTT)2 X X 13 GGGG-- - X - *************A**G*
C.'Sekute' SEK NA 295 (GTT)2 X X 13 GGGG-- - X - *************A**G*
C.anselli Z4 NA 295 (GTT)2 X X 13 GGGG-- - X - *************A**G*
C.amatus AMATUS1 NA 297 (GTT)2 X X 13 GGGGGG - X - *************A**G*
NA - no amplification
* X denotes presence of sequence, - denotes absence
ExpansionFragment
length
Observed Seq
length
GENOTYPE

92
Fig. 4. 2 Microsatellite repeat motif of Harg02 plotted on the phylogeny based on Ingram et al. 2004. ✔ indicates successful genotyping amplification. Fragment length was determined from sequencing product size. For species with multiple samples, a representative was selected. Absence of a repeat motif indicates that no sequence data is available and does not suggest information about the repeat region itself.

93
Table 4.5 Observed sequence length, repeat motif, and indels documented for locus Harg03. No genotyping primer sites were available.
Repeat motifs Indels
Taxa Sample Target region T AC TGGG
H.argenteocinereus H046 258 259 (GT)10 GC (GT)3 X - X
H.argenteocinereus H050 258 259 (GT)10 GC (GT)3 X - X
B.suillus BS 252 252 (GT)3 AT (GT)5 X X X
B.suillus TM41494 252 252 (GT)3 AT (GT)5 X X X
G.capensis TM38354 252 251 (GT)3 AT (GT)5 - X X
G.capensis TM38362 252 251 (GT)3 AT (GT)5 - X X
C.hottentotus TM38375 255 258 (GT)14 X - -
C.hottentotus MCA324 248 248 (GT)9 X - -
C.mechowii Z9 250 252 (GT)3 AT (GT)7 X - -
C.mechowii M71 248 250 (GT)3 AT (GT)6 X - -
* X denotes presence of sequence, - denotes absence
GENOTYPE
Fragment
length
Observed Seq
length

94
Fig. 4.3 Microsatellite repeat motif of Harg03 plotted on the phylogeny based on Ingram et al. 2004. ✔ indicates successful genotyping amplification. Fragment length was determined from sequencing product size. For species with multiple samples, a representative was selected. Absence of a repeat motif indicates that no sequence data is available and does not suggest information about the repeat region itself.

95
Table 4.6 Observed sequence length, repeat motif, indels, additional repetitive regions, and changes in the primer sites for locus Harg07. Included are indels that were found within the LTR that was discovered in all taxa except for Heliophobius.
Indels Primer sites
Repeat motifs Insertions W/In LTR Harg07-F
Taxa Sample Target region LTR [GTTTGACTGTCTG] [TTGGA] GT TGGGTGGCTAGGA139BP W/REPEAT AG AA 5'-ATGAGAG-TTT-CC-TGATGTCC-3'
H.argenteocinereus H046 171/175 171 (GT)15GCTT(GT)5 - 0 0 X X - X X *******C***C**T*********
H.argenteocinereus H050/H053 171 170 (GT)13GCTT(GT)5 - 0 0 X X - X X *******C***C**T*********
H.argenteocinereus HA24 157 158 (GT)7 GCTT(GT)5 - 0 0 X X - X X *******C***C**T*********
B.suillus BS NA- TOO BIG 588 (GT)5ATATCATGT X - X - X - - X *******C***C**T*********
B.suillus TM41494 NA- TOO BIG 588 (GT)5ATATCATGT X - X - X - - X *******C***C**T*********
B.janetta BJ NA- TOO BIG 588 (GT)5ATATCATGT X - X - X - - X *******C***C**T*********
B.janetta N8 NA- TOO BIG 588 (GT)5ATATCATGT X - X - X - - X *******C***C**T*********
G.capensis GPPH2 NA- TOO BIG 599 (GT)5ATGCATGCTT (GT)4GCATGT X - - X X - - X *******C***G**T*********
G.capensis TM38354 NA- TOO BIG 603 (GT)8GCGTGCTTGA(GT)3GCATGT X - - X X X - X *******C***G**T*********
G.capensis TM41550 NA- TOO BIG 563 (GT)5ATGCATGCTT (GT)4GCATGT X - - X X - - X *******C***G**T*********
C.darlingi DAR NA- TOO BIG 627 (GT)19ATGT(GC)2ATGT X X - X - - X - *******C***G**T*********
C.kafuensis Z10 NA- TOO BIG 622 (GT)18 (GC)2ATGT X X - X - - X - *******C***G**T*********
C.damarensis CHD NA- TOO BIG 624 (GT)17ATGT(GC)2ATGT X X - X - - X - *******C***G**T*********
C. 'Sekute' SEK NA- TOO BIG 622 (GT)16ATGT(GC)2ATGT X X - X - - X - *******C***G**T*********
C.anselli Z4 NA- TOO BIG 618 (GT)14ATGT(GC)2ATGT X X - X - - X - *******C***G**T*********
C.amatus AMATUS 2 NA- TOO BIG 624 (GT)16 (GC)5ATGT X X - X - - X - *******C***G**T*********
NA - no amplification
* X = presence of sequence, - = absence
0 = no sequence in that region to compare
Outside LTR
GENOTYPE
Fragment
length
Observed
Seq length
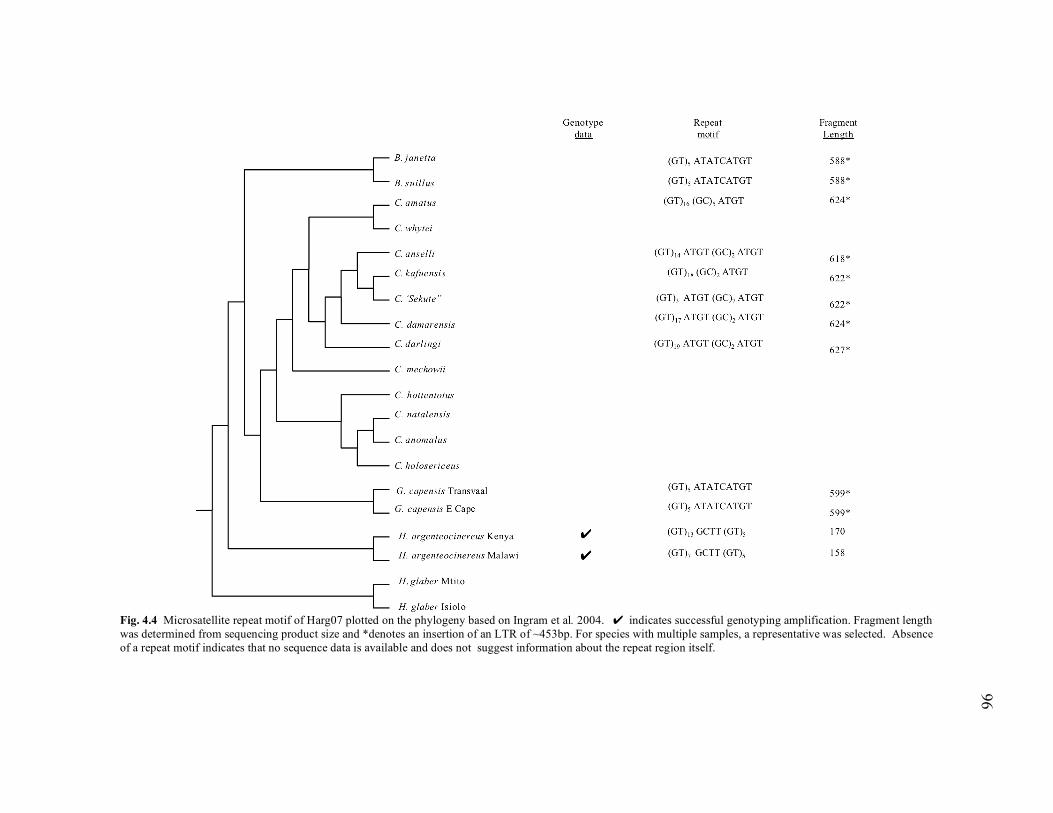
96
Fig. 4.4 Microsatellite repeat motif of Harg07 plotted on the phylogeny based on Ingram et al. 2004. ✔ indicates successful genotyping amplification. Fragment length was determined from sequencing product size and *denotes an insertion of an LTR of ~453bp. For species with multiple samples, a representative was selected. Absence of a repeat motif indicates that no sequence data is available and does not suggest information about the repeat region itself.

97
Table 4.7 Observed sequence length, repeat motif, indels, additional repetitive regions, and changes in the primer sites for locus Gcap01.
PRIMER
Indel GCAP01-F GCAP01-R
Taxa Sample Repeat motif A 95 bp insertion 5'-CTTGTTGGGAAGTTTCACTCA-3'5'-AGTTCTGAGCCCAGCTGAC-3'
H.glaber H025 NA 211 CTGTGTATGCGTGTATGTGTATGT - X *****C******C*C**T**** ******AG***********
H.glaber h006 NA 211 CTGTGTATGCGTGTATGTGTATGT - X *****C******C*C**T**** ******AG***********
H.glaber H875 NA 211 CTGTGTATGCGTGTATGTGTATGT - X *****C******C*C**T**** ******AG***********
H.glaber L4018 NA 211 CTGTGTATGCGTGTATGTGTATGT - X *****C******C*C**T**** ******AG***********
H.argenteocinereus H045/46/50 125 126 (GT)13(GA)2GT - - ************C*C****** *******************
H.argenteocinereus HA24 119 119 (GT)10GAGT X -
H.argenteocinereus B4 119 117 (GT)9 GAGT X - ************C*C****** *******************
B.suillus TM41500 119 120 GTGC(GT)11 - - **************C****** *******************
B.suillus BS 113 114 GTGC(GT)8 - - **************C****** *******************
B.suillus TM38417 119 120 GTGC(GT)12 - - **************C****** *******************
B.janetta BJ 117 118 GTGC(GT)10 - - **************C****** *******************
B.janetta N8 117 118 GTGC(GT)10 - - **************C****** *******************
G.capensis SP6063 127/129 128 (GT)17 - - **************C****** *******************
G.capensis TM41550 123/125 124 (GT)16 - - **************C****** *******************
G.capensis TM38357 113 114 (GT)10 - - **************C****** *******************
G.capensis TM38362 121 122 (GT)14 - - **************C****** *******************
C.hottentotus SP6230 127/133 128 (GT)17 - **************C****** *******************
C.hottentotus MCA324 125 122 (GT)14 - - **************C****** *******************
C.hottentotus SP7520 133 132 (GT)19 - - **************C****** *******************
C.holosericeus SP7552 117/123 118 (GT)12 - - **************C****** *******************
C.natalensis TM38464 135 118 (GT)12 - - **************C****** *******************
C.natalensis CHN2 107 108 (GT)7 - - **************C****** *******************
C.anaomalus SP7705 129 128 (GT)17 - - **************C****** *******************
C.mechowii Z6/7 119 118 (GT)12 - - **************C****** *******************
C.mechowii M71 NA 122 (GT)14 - - **************C****** *******************
C.kafuensis Z10 121 122 (GT)14 - - **************C****** *******************
C.damarensis Wessam0201 123/125 124 (GT)10GC(GT)4 - - **************C****** *******************
C.damarensis TM39469 123 122 (GT)14 - - **-*C*********C****** *******************
C.damarensis SP7758 125 123 (GT)6 G (GT)3GC(GT)4 - - **************C****** *******************
C.'Sekute' LIV/SEN/SEK 121/123 122 (GT)14 - - **************C****** *******************
C.whytei KAR1 NA 132 (GT)19 - - **************C****** *********T*********
C.anselli Z1 127/133 132 (GT)19 - - *************CC****** *******************
C.anselli Z4 NA 132 (GT)19 - - **************C****** *******************
C.amatus AMATUS 125/127? 126 (GT)17 - - **************C****** *********T*********
NA - no amplification
* X denotes presence of sequence, - denotes absence
GENOTYPE
Fragment
length
Observed
Seq length

98
Fig. 4.5 Microsatellite repeat motif of Gcap01 plotted on the phylogeny based on Ingram et al. 2004. ✔ indicates successful genotyping amplification. Fragment length was determined from sequencing product size and * denotes the 95bp insertion (SINE) . For species with multiple samples, a representative was selected. Absence of a repeat motif indicates that no sequence data is available and does not suggest information about the repeat region itself.

99
Table 4. 8 Observed sequence length, repeat motif, indels, additional repetitive regions, and changes in the primer sites for locus Gcap07.
Indel Primer - GCAP07R
Taxa Sample Repeat motif A AA A 5'-AGTTCCCCAAGTTGGTAAGG-3'
H.argenteocinereus H050 264 264 GTGC(GT)6AT(GT)21ATGT X X - *****************G**
H.argenteocinereus HA24 254/260 254 GTGC(GT)4AT(GT)20 X X - *****************G**
B.suillus TM41494 242/244 242 GTGC(GT)4GC(GT)16 X - - ********************
B.suillus BS 252/256 251 GTGC(GT)4GC(GT)20 - - - ********************
B.janetta BJ 238 238 GTGC(GT)4GC(GT)14 - - - ********************
G.capensis TM38354 216/218 216 (GT)8 X X - ********************
G.capensis TM38353 216/218 242 (GT)21 X X - ********************
G.capensis GPPH2 218 218 (GT)9 X X - ********************
C.hottentotus TM38375 236/242 236 GTGA(GT)15 X X - ********************
C.hottentotus MCA324 240 234 GTGA(GT)15 X X - ********************
C.hottentotus TM38475 238/244 244 GTGA(GT)20 X X - ********************
C.holosericeus TM41446 230/240 240 GTGA(GT)18 X X - ********************
C.holosericeus SP7552 232/234 234 GTGA(GT)15 X X - ********************
C.natalensis CHN2 230/250 230 (GT)15 X X - ********************
C.natalensis TM38464 234/246 234 (GT)17 X X - ********************
C.anaomalus SP7705 224/242 224 GTGA(GT)10 X X - ********************
C.mechowii Z9 234/236 234 GTGACT(GT)14 X X - ****************T***
C.darlingi DAR4 NA 226 GTGACT(GT)11 X X - ****************T***
C.kafuensis Z10 234 234 GTGACT(GT)14 X X - ****************T***
C.damarensis HW3084 236/240 236 GTGACT(GT)15 X X X *****T**********T***
C.'Sekute' C. 'sekute' 242 242 GTGACT(GT)18 X X - ****************T***
C.anselli Z4 232/248 232 GTGACT(GT)13 X X - ****************T***
C.amatus AMATUS2 238/240 238 GTGACT(GT)16 X X - ****************T***
C. 'Livingstone' LIV 234 232 GTGACT(GT)13 X X - ****************T***
NA - no amplification
* X = presence of sequence, - = absence
GENOTYPE
Fragment
length
Observed Seq
length

100
Fig. 4.6 Microsatellite repeat motif of Gcap07 plotted on the phylogeny based on Ingram et al. 2004. ✔ indicates successful genotyping amplification. Fragment length was determined from sequencing product size. For species with multiple samples, a representative was selected. Absence of a repeat motif indicates that no sequence data is available and does not suggest information about the repeat region itself.
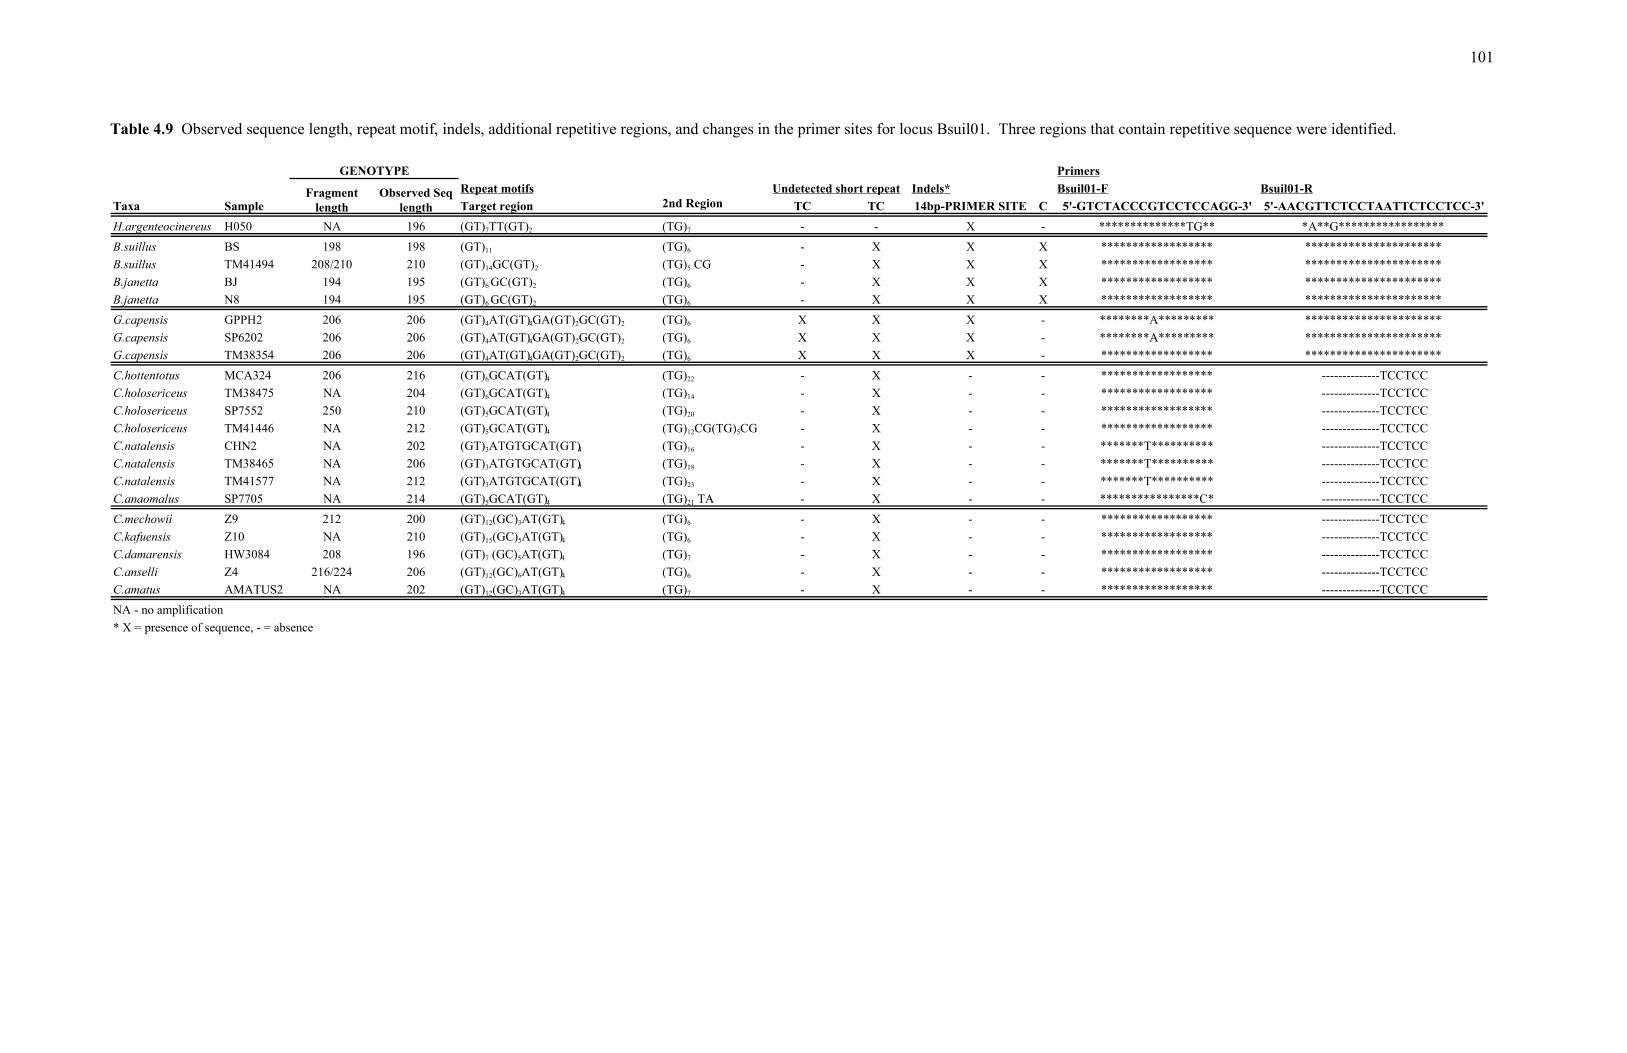
101
Table 4.9 Observed sequence length, repeat motif, indels, additional repetitive regions, and changes in the primer sites for locus Bsuil01. Three regions that contain repetitive sequence were identified.
Primers
Repeat motifs Indels* Bsuil01-F Bsuil01-R
Taxa Sample Target region 2nd Region TC TC 14bp-PRIMER SITE C 5'-GTCTACCCGTCCTCCAGG-3' 5'-AACGTTCTCCTAATTCTCCTCC-3'
H.argenteocinereus H050 NA 196 (GT)7TT(GT)2 (TG)7 - - X - **************TG** *A**G*****************
B.suillus BS 198 198 (GT)11 (TG)6 - X X X ****************** **********************
B.suillus TM41494 208/210 210 (GT)14GC(GT)2 (TG)5 CG - X X X ****************** **********************
B.janetta BJ 194 195 (GT)6 GC(GT)2 (TG)6 - X X X ****************** **********************
B.janetta N8 194 195 (GT)6 GC(GT)2 (TG)6 - X X X ****************** **********************
G.capensis GPPH2 206 206 (GT)4AT(GT)4GA(GT)2GC(GT)2 (TG)6 X X X - ********A********* **********************
G.capensis SP6202 206 206 (GT)4AT(GT)4GA(GT)2GC(GT)2 (TG)6 X X X - ********A********* **********************
G.capensis TM38354 206 206 (GT)4AT(GT)4GA(GT)2GC(GT)2 (TG)6 X X X - ****************** **********************
C.hottentotus MCA324 206 216 (GT)6GCAT(GT)4 (TG)22 - X - - ****************** --------------TCCTCC
C.holosericeus TM38475 NA 204 (GT)6GCAT(GT)4 (TG)14 - X - - ****************** --------------TCCTCC
C.holosericeus SP7552 250 210 (GT)5GCAT(GT)4 (TG)20 - X - - ****************** --------------TCCTCC
C.holosericeus TM41446 NA 212 (GT)5GCAT(GT)4 (TG)12CG(TG)5CG - X - - ****************** --------------TCCTCC
C.natalensis CHN2 NA 202 (GT)3ATGTGCAT(GT)4 (TG)16 - X - - *******T********** --------------TCCTCC
C.natalensis TM38465 NA 206 (GT)3ATGTGCAT(GT)4 (TG)18 - X - - *******T********** --------------TCCTCC
C.natalensis TM41577 NA 212 (GT)3ATGTGCAT(GT)4 (TG)23 - X - - *******T********** --------------TCCTCC
C.anaomalus SP7705 NA 214 (GT)5GCAT(GT)4 (TG)21 TA - X - - ****************C* --------------TCCTCC
C.mechowii Z9 212 200 (GT)12(GC)3AT(GT)4 (TG)6 - X - - ****************** --------------TCCTCC
C.kafuensis Z10 NA 210 (GT)15(GC)5AT(GT)4 (TG)6 - X - - ****************** --------------TCCTCC
C.damarensis HW3084 208 196 (GT)7 (GC)5AT(GT)4 (TG)7 - X - - ****************** --------------TCCTCC
C.anselli Z4 216/224 206 (GT)12(GC)6AT(GT)4 (TG)6 - X - - ****************** --------------TCCTCC
C.amatus AMATUS2 NA 202 (GT)12(GC)3AT(GT)4 (TG)7 - X - - ****************** --------------TCCTCC
NA - no amplification
* X = presence of sequence, - = absence
Undetected short repeat
GENOTYPE
Fragment
length
Observed Seq
length

102
Fig. 4.7 Microsatellite repeat motifs of Bsuil01 plotted on the phylogeny based on Ingram et al. 2004. ✔ indicates successful genotyping amplification. Fragment length was determined from sequencing product size. For species with multiple samples, a representative was selected. Absence of a repeat motif indicates that no sequence data is available and does not suggest information about the repeat region itself.

103
Table 4.10 Observed sequence length, repeat motif, indels, and changes in the primer sites for locus Bsuil04.
Primer
Indels Bsuil04-R
Taxa Sample Repeat motif GG GG G 5'-TTGCAACACAGAGGAACTGA-3'
H.glaber L4016 NA 302 GGGGGT X X X ******A**T**********
B.suillus BS NA 339 (GT)22 X X - ********************
B.suillus TM41494 337/339 339 (GT)22 X X - ********************
B.janetta BJ 317 319 (GT)12 X X - ********************
G.capensis TM38353 331 333 GG(GT)18 X X - ***T****************
G.capensis GPPH2 NA 337 GG(GT)21 - X - ***T****************
C. hottentotus MCA324 311 311 GGGCAG(GT)3GGGT X - - *****************T**
C. darlingi DAR4 305 311 (G)5 TTCGGTGGGT X X - *****************T**
C. kafuensis Z10 303 311 (G)5 TTCGGTGGGT X X - *****************T**
C. damarensis HW3084 NA 311 (G)5 TTCGGTGGGT X X - *****************T**
C. 'Sekute' SEK 305 311 (G)5 TTCGGTGGGT X X - *****************T**
C. anselli Z4 303 311 (G)5 TTCGGTGGGT X X - *****************T**
C. amatus AMATUS2 307 311 (G)5 TTCGGTGGGT X X - *****************T**
NA - no amplification
* X = presence of sequence, - = absence
GENOTYPE
Fragment length
Observed Seq
length

104
Fig. 4.8 Microsatellite repeat motif of Bsuil04 plotted on the phylogeny based on Ingram et al. 2004. ✔ indicates successful genotyping amplification. Fragment length was determined from sequencing product size. For species with multiple samples, a representative was selected. Absence of a repeat motif indicates that no sequence data is available and does not suggest information about the repeat region itself.

105
Table 4.11 Observed sequence length, repeat motif, indels, and changes in the primer sites for locus Bsuil06.
Primer
Indels Bsuil06-R
Taxa Sample Repeat motif CT/GT T CT 5' -AACAGTGGAGGAGCTTTGTG-3'
H.argenteocinereus H050/053 248 245 GC(GT)2GA(GT)9GCG(GT)4 CT - X ********************
H.argenteocinereus B4 270 267 (GT)3GA(GT)21G(GT)4 CT - X ********************
H.argenteocinereus HA25 268 247 (GT)3GA(GT)11G(GT)4 CT - X ********************
H.argenteocinereus HA24 268 265 (GT)3GA(GT)20G(GT)4 CT - X ********************
B.suillus BS 240 232 (GT)2GA(GT)8G(GT)3 TT - X ********************
B.suillus TM41494 242 234 (GT)2GA(GT)8GGA(GT)3 TT - - ********************
B.janetta BJ 242 234 (GT)2GA(GT)7GGA(GT)3 TT - - ********************
B.janetta N8 242 234 (GT)2GA(GT)9GGA(GT)3 TT - - ********************
G.capensis GPPH2 246 243 (GT)2GA(GT)6GG(GT)4GGTATGT TT - X ********************
G.capensis TM38354 252 247 (GT)2GA(GT)13GGTATGT TT - X ********************
G.capensis TM41550 246 243 (GT)2GA(GT)6GG(GT)4GGTATGT TT - X ********************
G.capensis SP6202 242 241 (GT)2GA(GT)5GG(GT)4GGTATGT TT - X ********************
C.holosericeus TM38475 248/268 246 GTGC(GT)15G(GT)2 - X X **T**********T******
C.holosericeus SP7552 242 240 GTGC(GT)12G(GT)2 - X X **T**********T******
C.natalensis CHN2 234 231 (GT)9 G(GT)2 - X X **T**********T******
C.anaomalus SP7705 252/258 248 (GT)18G(GT)2 - - X **T**********T******
C.mechowi M71 NA 243 (GT)2GA(GT)11G(GT)3 CT - X ********************
C.mechowi z9 NA 257 (GT)2GA (GT)18G(GT)3 CT - X ********************
C.darlingi DAR4 NA 255 (GT)2GA (GT)17G(GT)3 CT - X ********************
C.kafuensis z10 NA 252 (GT)18G(GT)3 CT - X ********************
C.damarensis HW3084 NA 259 (GT)2GA(GT)19G(GT)3 CT - X ********************
C.damarensis CHD NA 265 (GT)2GA(GT)22G(GT)3 CT - X ********************
C. 'sekute' LIV/Sek NA 259 (GT)2GA(GT)19G(GT)3 CT - X ********************
C.anselli Z4 NA 260 (GT)22G(GT)3 CT - X ********************
C.anselli Z12 NA 250 (GT)18G(GT)3GC CT - X ********************
C.amatus AMATUS2 NA 247 (GT)2GA(GT)13G(GT)3 CT - X ********************
NA - no amplification
* X = presence of sequence, - = absence
GENOTYPE
Fragment
length
Observed
Seq length

106
Fig. 4.9 Microsatellite repeat motif of Bsuil06 plotted on the phylogeny based on Ingram et al. 2004. ✔ indicates successful genotyping amplification. Fragment length was determined from sequencing product size. For species with multiple samples, a representative was selected. Absence of a repeat motif indicates that no sequence data is available and does not suggest information about the repeat region itself.

107
Table 4.12 Observed sequence length, repeat motif, indels, and changes in the primer sites for locus Chott01. A SINE/Alu was identified overlapping the primer site of Chott01-F.
Primer
Indels Chott01-F (in sine) Chott01-R
Taxa Sample Repeat motif AAAC AC/GC AA/AT/TT C T T 5'-CCTCCCGGTTACTTAGGGGT-3'5'-CTGACATGCAAGGCTTTTG-3'
H.argenteocinereus H042/H050 NA 279 (GT)21 - AC AA - - - --------**********A* *******A******C****
H.argenteocinereus SP5566 NA 276 (GT)19 - AC AA - - - --------**G********* *******A******C****
H.argenteocinereus B4 NA 273 (GT)17 X AC AA - - - --------************ *******A******C****
B.suillus BS 257 250 (GT)10AT(GT)3 X GC -- - - - A*****G************* *******************
B.suillus SP6175 257 250 (GT)10AT(GT)3 X GC -- - - - A*****G***********C* *******************
B.suillus TM41493 263 252 (GT)11AT(GT)3 X GC -- - - - G*****C***********C* **************C****
B.suillus TM41450 259 252 (GT)11AT(GT)3 X GC -- - - - A*****G***********C* **************C****
B.janetta BJ 257 250 (GT)10AT(GT)3 X GC -- - - - A*****G***********C* **************C****
B.janetta N8 261 254 (GT)12AT(GT)3 X GC -- - - - A*****G***********C* *******************
G.capensis TM38354 275/281 286 (GT)20 X GC -- C - - A*****C*-T********** *******************
G.capensis TM41550 277 286 (GT)20 X GC -- C - - A*****C*-T********** *******************
G.capensis GPPH2 275/277 286 (GT)20 X GC -- C - - A*****C*-T********** *******************
C.hottentotus TM38365/TM38375 277 278 (GT)18 X GC -- - - - ********************* *******************
C.hottentotus SP7501 291 292 (GT)21 X GC AT - - - ********************* *******************
C.hottentotus SP6228 273 274 (GT)16 X GC -- - - - ********************* *******************
C.hottentotus TM38402 279 280 (GT)18 X GC TT - - - ********************* *******************
C.holosericeus SP7552(H258) 287 284 (GT)17 X GC AT - - - ********************* *******************
C.natalensis CHN2 291 294 (GT)22 X GC AT - - - ********************* ******************A
C.anaomalus SP7705 275 268 (GT)13 X GC AT - - - ********************* *******************
C.mechowi MEC2/Z9 285 265 (GT)14 X GC -- - - - A****T**********C*** *******************
C.kafuensis Z10 NA 285 (GT)11AT(GT)10 X -- -- - X - A****T**********GA** *******************
C.damarensis HW3084/CHD NA 292 (GT)11(AT)2(GT)12 X -- -- - X X A****T**********GA** *******************
C.damarensis SP7654 NA 290 (GT)24 X -- -- - X X A****T**********GA** *******************
C. 'sekute' SEK NA 281 (GT)10AT(GT)9 X -- -- - X - A****T**********GA** *******************
C.anselli Z12 NA 283 (GT)11AT(GT)9 X -- -- - X - A****T**********GA** *******************
C.anselli Z1/MAZUBUKU NA 281 (GT)10AT(GT)9 X -- -- - X - A****T**********GA** *******************
C.amatus AMATUS2 NA 268 (GT)13 X -- -- - - - A****T**********C*** *******************
NA - no amplification
* X = presence of sequence, - = absence
GENOTYPE
Fragment
length
Observed
Seq length

108
Fig. 4.10 Microsatellite repeat motif of Chott01 plotted on the phylogeny based on Ingram et al. 2004. ✔ indicates successful genotyping amplification. Fragment length was determined from sequencing product size. For species with multiple samples, a representative was selected. Absence of a repeat motif indicates that no sequence data is available and does not suggest information about the repeat region itself.

109
Table 4.13 Observed sequence length, repeat motif, indels, and changes in the primer sites for locus Chott03.
Primer -Chott03-R
Taxa Sample Repeat motif 5'-ATGTTCAGGACCTACAGGAGG-3'
H.argenteocinereus H050 158 157 GC(GT)2CT(GT)6CT(GT)4CTGTGCT(CA)2CG ***C*************A***
H.argenteocinereus HA24/143 158 157 GC(GT)2CT(GT)6CT(GT)4CTGTGCT(CA)2CG ***C*************A***
C.hottentotus TM38375 210 209 (GT)2(GC)5(GT)4(GCGT)3(GT)4GCGTGC(GT)2GC(GT)3GCGTGCAT(GT)12(GC)3G *********************
C.hottentotus MCA324 206/208 205 (GT)2(GC)5(GT)7GCGTGC(GT)2GC(GT)3(GC)5(GT)5GC(GT)5(GC)5A *********************
C. holosericeus sp7552 216/238 215 (GT)2(GC)6(GT)12(GC)3(GT)14(GC)2(GT)5(GC)5A *********************
C.anaomalus SP7705 182 185 (GT)2(GC)3ACGCCT(GT)2GCGTGC(GT)3GCGTGCAT(GT)7(GC)6G *********************
C.mechowii M71 206/208 165 GC(GT)12GC(GT)3GC(GT)2GCGT(GC)2ATGCA ************C********
C.mechowii Z9 164/168 163 GC(GT)11GC(GT)3GC(GT)2GCGT(GC)2ATGCA ************C********
C.kafuensis Z10 160 157 GC(GT)12(GC)2GTGCGT(GC)2ATGCA *********************
C.damarensis CHD 162/170 161 GC(GT)14(GC)2GTGCGT(GC)2ATGCA *********************
C.damarensis HW3084 160 159 GC(GT)13(GC)2GTGCGT(GC)2ATGCA *********************
C.anselli Z12 160 159 GC(GT)13(GC)2GTGCGT(GC)2ATGCA *********************
C.amatus AMATUS2 154/158 157 (GC)8(GT)8 GCGT(GC)2ATGCA *********************
NA - no amplification
* X = presence of sequence, - = absence
GENOTYPE
Fragment
length
Observed
Seq length

110
Fig. 4.11 Microsatellite repeat motif of Chott03 plotted on the phylogeny based on Ingram et al. 2004. ✔ indicates successful genotyping amplification. Fragment length was determined from sequencing product size. For species with multiple samples, a representative was selected. Absence of a repeat motif indicates that no sequence data is available and does not suggest information about the repeat region itself.

111
Table 4.14 Observed sequence length, repeat motif, indels, and changes in the primer sites for locus Chott08.
Primer
Indels Chott08-f Chott08-R
Taxa Sample Repeat motif A T G/C T/C G G 5'-CTCAGCCCCTCACTACCC-3' 5'-GTGTCTTCCCCCTTTTCTGT-3'
H.argenteocinereus H050/059 121 122 (GT)5GGGT(G)7 - X G C X X **********CA****** T*******************
H.argenteocinereus H772 121 122 (GT)5GGGT(G)7 - X G C X X **********CA****** T*******************
H.argenteocinereus HA24 125 125 (GT)6GGC (G)8 X X G T X X **********CA****** T*******************
H.argenteocinereus HA143 NA 124 (GT)7C (G)7 X X G T X X **********CA****** T*******************
B.suillus BS 121 113 (GT)7(G)6 - - - - - X ****************** T*******************
C.hottentotus MCA324 115 117 (GT)6(G)7 - - - C X X ****************** ********************
C.hottentotus TM38375 139/141 140 (GT)20GG - - - C X X ****************** ********************
C.hottentotus TM38365 121 122 (GT)11GG - - - C X X ****************** ********************
C.hottentotus SP7501 115 115 (GT)5(G)7 - - - C X X ****************** ********************
C.holosericeus SP7552 115 116 (GT)6(G)7 - - - C X X ACT*******-******* ********************
C.natalensis CHN2 117 118 (GT)4TT(G)10 - - - C X X ****************** ********T***********
C.anomalus SP7705 113 115 (GT)5(G)7 - - - C X X ****************** ********************
C.mechowi Z9 115 115 (GT)5(G)7 - - C C X X ***********C****** T******T************
C.darlingi DAR4 111 116 (GT)7(G)3 - - C C X X ***********C****** T******T************
C.kafuensis Z10 115 116 (GT)6(G)5 - - C C X X ***********C****** T******T************
C.'sekute' SEK/LIV 115 112 (GT)6(G)4 - - C C X - ***********C****** T******T************
C.anselli Z4 115 116 (GT)6(G)5 - - C C X X ***********C****** T******T************
C.amatus AMATUS2 115 117 (GT)6(G)3 - - C C X X ***********C****** T******T************
C.whytei B2 111 116 (GT)6(G)5 - - C C X X ***********C****** T******T************
NA - no amplification
* X = presence of sequence, - = absence
GENOTYPE
Fragment
length
Observed Seq
length

112
Fig. 4.12 Microsatellite repeat motif of Chott08 plotted on the phylogeny based on Ingram et al. 2004. ✔ indicates successful genotyping amplification. Fragment length was determined from sequencing product size. For species with multiple samples, a representative was selected. Absence of a repeat motif indicates that no sequence data is available and does not suggest information about the repeat region itself.

113
Table 4.15 Observed sequence length, repeat motif, indels, additional repetitive regions, and changes in the primer sites for locus Cmech03. Included in the genotyping fragment was a CT-rich region
Primer
Indels Cmech03-F
Taxa Sample Repeat motif CT-RICH REGION CTC GG 5'-CATAAATAAGCAATAGCCCAGC-3'
B.suillus BS 286 284 (GT)6 CTTC(CTTT)2GTTCTT(CT)2CCTTCTG(CTT)2(CCT)2(CT)5G(CT)7 GCTGTAT(CT)3CCTCCCACTCCTX - ***************-******G*
B.suillus TN39386 290 288 (GT)6 CTTC(CTTT)2GTTCTT(CT)2CCTTCTG(CTT)2(CCT)2 (CT)6 TTCT GCTGTAT(CT)3CCTCCCACTCCTX - ***************-******G*
B.suillus TM41494 276/290 275 (GT)6 CTTC(CTTT)2GTTCTC(CT)2CCTTCTG(CTT)2(CCT)2(CT)5 G(CT)7 TTCTGCTGTAT(CT)3CCTCCCACTCCTX - ***************-******G*
B.janetta BJ 296 294 (GT)6 CTTC(CTTT)2GTTCTT(CT)2CCTTCTG(CTT)2(CCT)2(CT)5 G(CT)12 GCTGTAT(CT)3CCTCCCACTCCTX - ***************-******G*
G.capensis GPPH2 306/314 289 (GT)13GAGTGA CTTC(CTTT)2GTTCTT(CT)2CCTG (CTT)3(CCT)3(CT)4 GCTGTAT(CT)3CCTCCCACGCCTX - -'**************-******G*
G.capensis TM38353 294 302 (GT)15GA CTT (CTTT)2GTTCTT(CT)2CCTG (CTT)3(CCT)3(CT)4GCTCTTT(CT)3GCTGTAT(CT)3CCTCCCACGCCTX - ***************-******G*
G.capensis TM41550 290/294 275 (GT)12GAGTGA CTTC(CTTT)2GTTCTT(CT)2CCTG (CTT)3(CCT)3(CT)4 GCTGTAT(CT)3CCTCCCACGCCTX - ***************-******G*
C.hottentotus MCA324 264 261 (GT)5 CTTC(CTTT)2GTTCTT(CT)2C (CTT)4(CCT)2TT(CT)3GCTTTAT(CT)3CCCACCCCT - - -'**************-********
C.hottentotus TM38375 266 265 (GT)5 CTTC(CTTT)3GTTCTT(CT)2CCTTCTG(CTT)3(CCT)2TT(CT)3GCTTTAT(CT)3CCCACCCCT X - ***************-*******
C.hottentotus TM41446 266 265 (GT)5 CTTC(CTTT)2GTTCTT(CT)2CCTTCTG(CTT)3(CCT)2TT(CT)3GCTTTAT(CT)3CCCACCCCT X - ***************-*******
C.holosericeus SP7552 264 262 (GT)5 CTTC(CTTT)2GTTCTT(CT)2C (CTT)4(CCT)2TT(CT)3GCTTTAT(CT)3CCCACCCCT - - ***************-*******
C.natalensis CHN2 NA 269 (GT)6 TTTC(CTTT)2GTTCTT(CT)2CCTTCTA (CTT)3(CCT)2TT(CT)3GCTTTAT(CT)3CCCACCCCT X X ***************-*******
C.anomalus SP7705 264 261 (GT)5 CTTC(CTTT)2GTTCTT(CT)2C (CTT)4(CCT)2TT(CT)3GCTTTAT(CT)3CCCACCCCT - - -'**************-*******
C.mechowii Z9 290/294 294 TT(GT)15 CTTC(CTTT)2GTTCTT(CT)2CCTTCTG(CTT)3(CCT)2(CT)5G(CT)2AT(CT)3CCTCCCATCCCT X X ***************-*******
C.darlingi DAR4 282 279 (GT)9 CTTC(CTTT) GTT (CT)2CCTTCTG(CTT)3(CCT)2(CT)6G(CT)2ATCTC(CCT)2CCCATCCCT X X ***************-*******
C.damarensis HW3084 284 281 (GT)11 CTTC(CTTT)2GTT (CT)2CCTTCTG(CTT)3(CCT)2(CT)5G(CT)2ATCTC(CCT)2CCCATCCCT X X ***************-*******
C.damarensis CHD 286 285 (GT)13 CTTC(CTTT)2GTT (CT)2CCTTCTG(CTT)3(CCT)2(CT)5G(CT)2ATCTC(CCT)2CCCATCCCT X X ***************-*******
C.'Sekute' SEK 290 287 (GT)14 CTTC(CTTT)2GTT (CT)2CCTTCTG(CTT)3(CCT)2(CT)5G(CT)2ATCTC(CCT)2CCCATCCCT X X ***************-*******
C. 'Livingstone' LIV 294 291 (GT)16 CTTC(CTTT)2GTT (CT)2CCTTCTG(CTT)3(CCT)2(CT)5G(CT)2ATCTC(CCT)2CCCATCCCT X - ***************-*******
C.anselli Z12/4 286/288 285 (GT)13 CTTC(CTTT)2GTT (CT)2CCTTCTG(CTT)3(CCT)2(CT)5G(CT)2ATCTC(CCT)2CCCATCCCT X X ***************-*******
C.amatus AMATUS2 304 302 (GT)21 CTTC(CTTT)2GTT (CT)2CCTTCTG(CTT)3(CCT)2(CT)5G(CT)2ATCTC(CCT)2CCCATCCCT X X ***************T*******
NA - no amplification
* X = presence of sequence, - = absence
GENOTYPE
Fragment
length
Observed
Seq length

114
Fig. 4.13 Microsatellite repeat motif of Cmech03 plotted on the phylogeny based on Ingram et al. 2004. ✔ indicates successful genotyping amplification. Fragment length was determined from sequencing product size. For species with multiple samples, a representative was selected. Absence of a repeat motif indicates that no sequence data is available and does not suggest information about the repeat region itself.

115
Table 4.16 Observed sequence length, repeat motif, indels, additional repetitive regions, and changes in the primer sites for locus Cmech04. Included in the genotyping fragment was an (CAAAA) repeat.
Primer
Indels Cmech04-R
Taxa Sample Repeat motif Second repetitive region C AAT/AAA GGTGT TGATTAA/TGGTTAA5'-TCTGACTGGAACCCATCACT-3'
H.glaber H006 374 374 (T)20 AACTAG(A)5G(A)4C(A)5C(A)5T - - X TGATTAA ****G***************
H.glaber H040 374 374 (T)20 AACTAG(A)5G(A)4C(A)5C(A)5T - - X TGATTAA ****G***************
H.glaber MR1-3835 NA 374 (T)20 AACTAG(A)5G(A)4C(A)5C(A)5T - - X TGATTAA ****G***************
H.glaber MS11 NA 373 (T)19 AACTAG(A)5G(A)4C(A)5C(A)5T - - X TGATTAA ****G***************
H.argenteocinereus H050 430 428 (GT)13GC(GT)4GCGTGC(GT)5AT(GT)11 AA(CAA)3C(A)9CCA - AAT X TGGTTAA ****G***************
H.argenteocinereus H045 NA 428 (GT)20GC(GT)5AT(GT)11 AA(CAA)3C(A)9CCA - AAT X TGGTTAA ****G***************
H.argenteocinereus H772 434/436 430 (GT)20GC(GT)5AT(GT)12 AA(CAA)3C(A)9CCA - AAT X TGGTTAA ****G***************
H.argenteocinereus SP5565 430 482 (GT)19(GC)4(GT)5AT(GT)13GC(GT)4GCGTGC(GT)5AT(GT)10AA(CAA)3C(A)10CC - AAT X TGGTTAA ****G***************
H.argenteocinereus sp5566 NA 428 (GT)19GCGTGC(GT)16 AA(CAA)3C(A)9CCC - AAT X TGGTTAA ****G***************
H.argenteocinereus B4 422/434 413 (GT)2TT(GT)2(GGT)2(GC)5ACGC(GT)15 AACGTCATCAACATCGAAAAGCCA - AAT X TGGTTAA ****G***************
B.suillus BS 372 373 GTGA(GT)12 AA(CAAA)5C(A)6C - AAA - - ***********T********
B.suillus TM38415 378 378 GTGA(GT)15 AA(CAAA)4C(A)9C - AAA - - ***********T********
B.suillus TM41500 378 379 GTGA(GT)15 AA(CCAA)4AC(A)6 CCCC - AAA - - ***********T********
B.suillus TM39307 374 375 GTGA(GT)13 AA(CCAA)4(A)8CCCC - AAA - - ***********T********
B.janetta BJ 376/378 376 GTGA (GT)15 AA(CAAA)3C(A)9CCC - AAA - - ***********T********
B.janetta N8 376 377 GTGA (GT)15 AA(CAAA)3C(A)11CC - AAA - - ***********T********
G.capensis TM39874 362 364 (GT)9 AA(CAA) (CAAAA)3C(A)9C - AAA - - ********************
G.capensis TM38399 382/386 380 (GT)17 AA(CAA)2CA(CAAAA)2C(A)9C - AAA - - *****************C**
C.hottentotus TM38375 394 375 (GT)17 AACACCAACAC(CAA)2C(A)7C - AAA - - ********************
C.hottentotus H258 378/386 376 (GT)18 AA(CAC)2 (CAA)3C(A)8C - AAA - - **********C*********
C.hottentotus SP7743 376/378 377 (GT)19 AA CAC (CAA)4C(A)7C - AAA - - **********C******T**
C.hottentotus SP7501 390 388 (GT)24 AA(CAC)2 (CAA)2C(A)7C - AAA - - **********C*********
C.natalensis TM38464 370/376 369 (GT)15 AACAC (CAA)4C(A)7C - AAA - - ********************
C.mechowii Z9 370/374 402 (GT)31 AA(CAA)3CAGCAAC(A)6C - AAA - - ********************
C.mechowii M69 380 380 (GT)20 AA(CAA)3CAGCAAC(A)6C - AAA - - ********************
C.darlingi DAR4 380/384 400 (GT)30 AA(CAA)3CAGCAAC(A)6C - AAA - - ********************
C.kafuensis Z10 NA 380 (GT)20 AA(CAA)3CAGCAAC(A)6C X AAA - - ********************
C.damarensis SP7576 386 386 (GT)23 AA(CAA)3CAGCAAC(A)6C - AAA - - ********************
C.damarensis SP7591 388 388 (GT)24 AA(CAA)3CAGCAAC(A)6C - AAA - - ********************
C.'Mazubuku' mazubuku 386 388 G (GT)24 AA(CAA)3CAGCAAC(A)6C - AAA - - ********************
C.'Sekute' SEK/SEN/LIV 380/384 384 (GT)22 AA(CAA)3CAGCAAC(A)6C X AAA - - ********************
C.anselli Z1/Z4 384/390 384 (GT)22 AA(CAA)3CAGCAAC(A)6C X AAA - - ********************
C.amatus KAR1 372/390 390 (GT)25 AA(CAA)3CAGCAAC(A)6C - AAA - - ********************
NA - no amplification
* X = presence of sequence, - = absence
GENOTYPE
Fragment
length
Observed
Seq length
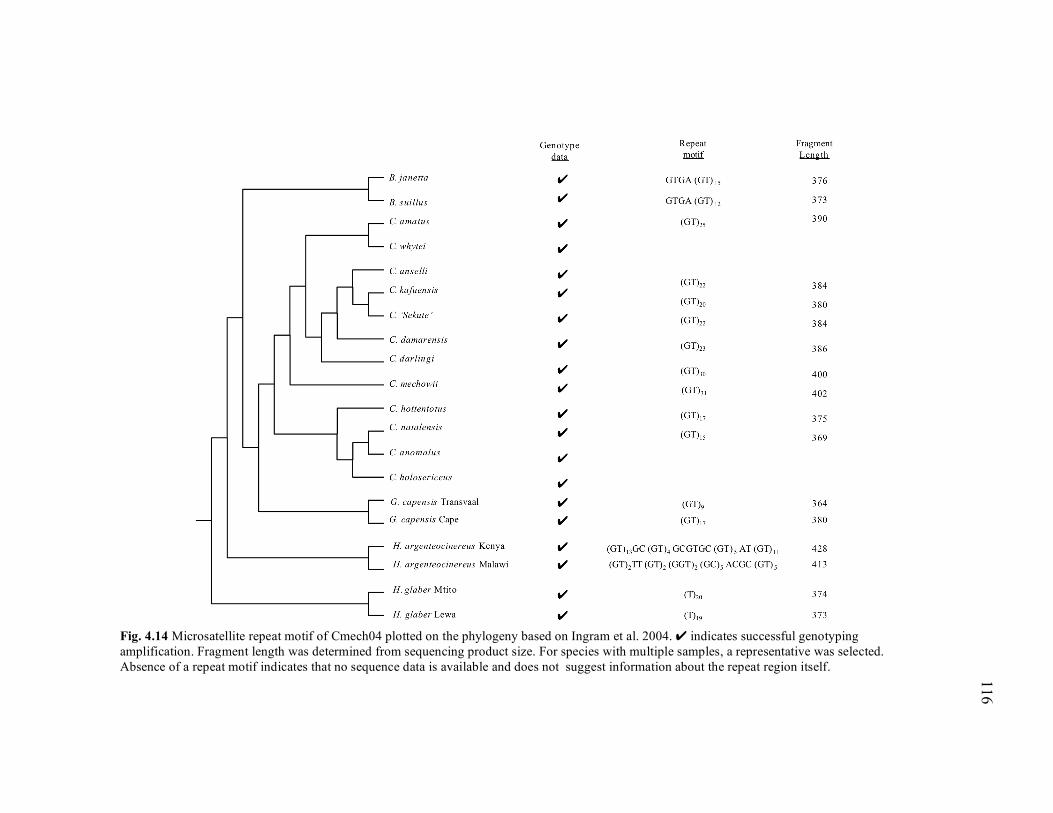
116
Fig. 4.14 Microsatellite repeat motif of Cmech04 plotted on the phylogeny based on Ingram et al. 2004. ✔ indicates successful genotyping amplification. Fragment length was determined from sequencing product size. For species with multiple samples, a representative was selected. Absence of a repeat motif indicates that no sequence data is available and does not suggest information about the repeat region itself.

117
Table 4.17 Observed sequence length, repeat motif, indels, and changes in the primer sites for locus Cmech09.
Primer
Indels Cmech09-R
Taxa Sample Repeat motif TC C/T 5'-CACCCCAACATTATACTCGC-3'
H. argenteocinereus H050 NA 291 AC(GT)6GC(GT)3GCACGC(GT)3CCATGTGCAC(GT)4 - - ***********G******A*
H. argenteocinereus H772 NA 291 AC(GT)6GC(GT)3GCACGC(GT)3CCATGTGCAC(GT)4 - - ***********G******A*
H. argenteocinereus HA143 NA 291 AC(GT)6GC(GT)2(GC)2AT(GT)4CCATGTGCAC(GT)4 - - ***********G******A*
B.suillus BS 304/306 304 AT(GT)13(GC)2TC(GC)2AT(GT)2CCATGTGCACTT(GT)3 X C ********************
B.suillus TM41494 304 306 AT(GT)12(GC)7 AT(GT)2CCATGTGCACTT(GT)3 X C ********************
B.janetta BJ 312 312 (GT)3AT(GT)13(GC)6 AT(GT)2CCATGTGCACTT(GT)3 X C ********************
B.janetta N8 298/300 302 AT (GT)10 (GC)7 AT (GT)2 CCATGTGCACTT(GT)3 X C ********************
G.capensis TM38354 302 302 (GT)11(GC)2AC(GC)3AC(GT)3CCATGTCACTTGTGCGT X C ********************
C.holosericeus TM41446 NA 304 (GT)11 (GC)6AT(GT)5CCATGTGCACTT(GT)3 - C ****************A-**
C.natalensis TM38464 NA 304 (GT)10 (GC)7AT(GT)5CCATGTGCACTT(GT)3 - C ****************A-**
C.mechowi Z9 296 296 AT(GT)10GC (AC)4AT(GT)2CCATGTGCACTT(GT)3 - C ********************
C.darlingi DAR4 NA 302 AT(GT)2GC(GT)10 (GC)2(AC)3(GT)3CCATGTGCACTT(GT)3 - C ********************
C.damarensis HW3084 NA 302 AT(GT)2GC(GT)10 (GC)2(AC)3(GT)3CCATGTGCACTT(GT)3 - T ********************
C. damarensis CHD 306 302 AT(GT)2GC(GT)10 (GC)2(AC)3(GT)3CCATGTGCACTT(GT)3 - T ********************
C.amatus AMATUS2 310 306 AT(GT)2GC(GT)5 GA(GT)4(GC)3(AC)4(GT)3CCATGTGCACTT(GT)3 - C ********************
NA - no amplification
* X = presence of sequence, - = absence
GENOTYPE
Fragment
length
Observed
Seq length

118
Fig. 4.15 Microsatellite repeat motif of Cmech09 plotted on the phylogeny based on Ingram et al. 2004. ✔ indicates successful genotyping amplification. Fragment length was determined from sequencing product size. For species with multiple samples, a representative was selected. Absence of a repeat motif indicates that no sequence data is available and does not suggest information about the repeat region itself.

119
Table 4.18 Observed sequence length, repeat motif, indels, additional repetitive regions, and changes in the primer sites for locus Cmech11.
Primers
Indel Cmech11-F Cmech11-R
Taxa Sample Repeat motif immediate indel CATTCCG 5'-GACAGT-GGCCGTAATGTGC-3'5'-CCACCTGTGGTTATCTCTCG-3'
H.argenteocinereus H050 NA 129 (GT)16 ------- ******* ******A*******T***** **************G*G*GT
H.argenteocinereus HA24 NA 131 (GT)17 ------- ******* ******A*******T***** **************G*G*GT
B.suillus BS 116 117 (GC)4AT(GT)5 CTCGCAC ------- ******A****G**T***** *****************G*A
B.suillus TM38417 116 117 (GC)4AT(GT)5 CTCGCAC ------- ******A****G**T***** *****************G*A
B.suillus TM39386 116 117 (GC)4AT(GT)5 CTCGCAC ------- ******A****G**T***** *****************G*A
B.suillus TM41453 116 117 (GC)4AT(GT)5 CTCGCAC ------- ******A****G**T***** *****************G*A
B.suillus TM41500 116 117 (GC)4AT(GT)5 CTCGCAC ------- ******A****G**T***** *****************G*A
B.suillus TM38438 116 117 (GC)4 AT (GT)5 CTCGCAC ------- ******A****G**T***** *****************G*A
B.janetta BJ 116 117 GT(GC)3AT(GT)5 CTCGCAC ------- ******A****G**T***** *****************G*A
B.janetta N8 116 117 (GC)4AT(GT)5 CTCGCAC ------- ******A****G**T***** *****************G*A
G.capensis GPPH2/3 134 130 (GT)15 CTC---- **C**** ******A***T***T***** *****************GT*
G.capensis TM38354 NA 136 (GT)18 CTC---- **C**** ******A***T***T***** *****************GT*
G.capensis TM38356 136/140 136 (GT)18 CTC---- **C**** ******A***T***T***** *****************GT*
G.capensis TM41605 120 140 (GT)20 CTC---- **C**** **T***A***T***T***** *****************GT*
C.hottentotus TM38375 132 134 GCGAGCGT(GC)6(GT)5 CTCGCGA **C**T* ******A************* *****************G**
C.hottentotus MCA324 132 134 GCGAGCGT(GC)6(GT)5 CTCGCGA **C**T* ******A************* *****************G**
C.holosericeus SP7552 132 134 GCGAGCGT(GC)6(GT)5 CTCGCGA **C**T* ******A************* *****************G**
C.holosericeus TM41446 132 134 GCGAGC(GT)2(GC)5(GT)5 CTCGCGA **C**T* ******A************* *****************G**
C.natalensis CHN2 136 138 GCGAGCGT(GC)7(GT)6 CTCGCGA **C**T* ******A************* *****************G**
C.anomalus SP7705 132 132 GCGAGCGT(GC)6(GT)5 CTCGCGA **C**T* ******A************* *****************G**
C.mechowi Z9 146/150 150 (GCGA)GTGC(GT)19 CTCGCGA **G**** ******A************* *****************G**
C.mechowi M71 146 154 (GCGA)GTGC(GT)21 CTCGCGA **G**** ******A************* *****************G**
C.darlingi DAR4 144 146 (GCGA)GC(GT)18 CTCGCGA **G**** ******A************* *****************G**
C.kafuensis Z10 146 156 (GCGA)(GC)2(GT)2GC(GT)18 CTCGCGA **G**** ******A************* *****************G**
C.damarensis CHD 144 144 (GCGA)(GC)2(GT)2GC(GT)13 CTCGCGA **G**** ******A************* *****************G**
C.damarensis HW3084 146 146 (GCGA)GCAA(GC)2(GT)2GC(GT)14 CTCGCGA **G**** ******A************* *****************G**
C.'sekute' LIV 148 148 (GCGA)(GC)2(GT)2GC(GT)15 CTCGCGA **G**** ******A************* *****************G**
C.anselli Z12 150 150 (GCGA)(GC)2(GT)2GC(GT)16 CTCGCGA **G**** ******A************* *****************G**
C.anselli Z4 148 148 (GCGA)(GC)2(GT)2GC(GT)15 CTCGCGA **G**** ******A************* *****************G**
C.amatus AMATUS2/3 152/156 162 (GCGA)(GC)2(GT)2GC(GT)22 CTCGCGA **G**** ******A************* *****************G**
C.whytei B2 142 150 (GCGA)GTGC(GT)19 CTCGCGA **G**** ******A************* *****************G**
NA - no amplification
* X = presence of sequence, - = absence
GENOTYPE
Fragment
length
Observed
Seq length

120
Fig. 4.16 Microsatellite repeat motif of Cmech11 plotted on the phylogeny based on Ingram et al. 2004. ✔ indicates successful genotyping amplification. Fragment length was determined from sequencing product size. For species with multiple samples, a representative was selected. Absence of a repeat motif indicates that no sequence data is available and does not suggest information about the repeat region itself.

121
Table 4.19 Observed sequence length, repeat motif, indels, and changes in the Hglab10-R primer site for locus Hglab10.
Primer
Indels Hglab10 -R
Taxa Sample Repeat Motif G C/T GCAACCA 5'-TTCTTCTTGTTCCTTGTGGC-3'
H.glaber H006/033/069 304 302 (GT)21 X - - ********************
H.glaber MS1 NA 302 (GT)21 X - - ********************
H.glaber COL8134 304 302 (GT)21 X - - ********************
H.glaber mc16 304 303 (GT)21 X C - ********************
H.glaber mr1_3847 294/304 295 (GT)17 X C - ********************
H.glaber L4016 294 295 (GT)17 X C - ********************
H. argenteocinereus HA24 NA 321 GTTG(GT)2AGGG(GT)15 AGGG(GT)7 - T - ***C****************
H. argenteocinereus HA84 NA 331 GTTG(GT)2AGGG(GT)13AT(GT)6AGGG(GT)7 - T - ***C****************
B.suillus TM41452 NA 334 (GT)2GCGTAG(GT)12TTT(GT)17 - - X ***C****************
B.suillus TM38419 340 337 (GT)2GCGTAG(GT)15TTT(GT)15 - - X ***C****************
B. janetta BJ NA 339 (GT)2GCGTAG(GT)29 - - X ***C****************
G.capensis GPPH3 300/306 306 (GT)4AG(GT)15 - - X ***C****************
G.capensis TM38354 304/306 304 (GT)3AG(GT)15 - - X ***C****************
G.capensis TM39874 310 306 (GT)4AG(GT)15 - - X ***C****************
C. hottentotus MCA324 292 290 (GT)4AG(GT)4GC(GT)2 - - X ***C****************
C. hottentotus TM38375 292 290 (GT)4AG(GT)4GC(GT)2 - - X ***C****************
C. hottentotus TM41446 292 290 (GT)4AG(GT)4GC(GT)2 - - X ***C****************
C. holosericeus SP7519 292 290 (GT)4AG(GT)4GC(GT)2 - - X ***C****************
C. holosericeus SP7700 292 290 (GT)4AG(GT)4GC(GT)2 - - X ***C****************
C. holosericeus SP7701 292 290 (GT)4AG(GT)4GC(GT)2 - - X ***C****************
C. holosericeus SP7552 292 290 (GT)4AG(GT)4GC(GT)2 - - X ***C****************
C. anomalus SP7705 292 290 (GT)4AG(GT)4GC(GT)2 - - X ***C****************
C. mechowii Z9 314 312 (GT)4AG(GT)3GAT(GT)13 - - X ***C****************
C. darlingi DAR4 276 326 (GT)4AG(GT)4AT(GT)10AT(GT)9 - - X ***C****************
C. damarensis HW3053 316/328 340 (GT)4AG(GT)4 AT(GT)25TTGT - - X ***C****************
C. damarensis SP7559 322/332 330 (GT)4AG(GT)25TTGT - - X ***C****************
C. damarensis SP7604 314/324 312 (GT)4AG(GT)16TTGT - - X ***C****************
C. damarensis CHD 300/312 330 (GT)4AG(GT)25TTGT - - X ***C****************
C.'sekute' SEK 326 324 (GT)4AG(GT)4AT(GT)17TTGT - - X ***C****************
C. 'mazubuku' mazubuku 330 328 (GT)4AG(GT)4AT(GT)19TTGT - - X ***C****************
C. 'kasama' Z5 NA 321 (GT)4AG(GT)4AT(GT)18 - - X ***C****************
C. anselli Z12 334 332 (GT)4AG(GT)4AT(GT)21TTGT - - X ***C****************
C. amatus AMATUS2 330 329 (GT)4AG(GT)4AT(GT)22 - - X ***C****************
NA - no amplification
* X = presence of sequence, - = absence
GENOTYPE
Fragment
length
Observed
Seq length

122
Fig. 4.17 Microsatellite repeat motif of Hglab10 plotted on the phylogeny based on Ingram et al. 2004. ✔indicates successful genotyping amplification. Fragment length was determined from sequencing product size. For species with multiple samples, a representative was selected. Absence of a repeat motif indicates that no sequence data is available and does not suggest information about the repeat region itself.

123
genera, while the other three varied between species within both Cryptomys and
Coetomys. Unfortunately, this variation was not documented as errors in genotyping
since the genotyping primers did not amplify any individuals of Coetomys. Comparison
of the repeat motif to the sequencing data showed a lack variation at the repeat motif in
all species of Coetomys sampled even when there was a difference in genotype that
would have been mis-scored with genotype fragment analysis alone (Fig. 4.2).
Mutations in the 3’ end of the Harg02-F primer site were documented in
Bathyergus, Cryptomys, and Coetomys (Table 4.4; Fig. 4.2). These mutations help
explain the lack of amplification of the genotyping fragment in Bathyergus, Coetomys,
and some species of Cryptomys.
When RepeatMasker was used to identify any repetitive sequence in the Harg02
sequence, it identified the target region in Heliophobius and Cryptomys. In both genera,
there was variation in the number of repeats. In Heliophobius, there were two alleles
sequenced, (GTT)6 and (GTT)7. Although the genotype fragments were miscalled by
two nucleotides from the observed size based on sequencing, the number of repeats was
congruent with the genotype allele size of 320 and 323. In Cryptomys, the comparison
of genotyping and sequencing was puzzling. In the three species with both sequencing
information and genotype scores, the genotyping scores were inconsistent, from 3 to 5
bp larger than the fragment length predicted from the sequence A SINE/Alu element
was also identified by RepeatMasker in the Harg02 sequences of Heliophobius,
Bathyergus, and Coetomys. Although this element was not identified in Cryptomys, it is
clear from the sequence alignment that this 54 bp Alu element represents a single ancient

124
Table 4.20 Microsatellite loci with confirmation of null alleles.
Locus Taxa Variation at locus
Harg02 B. suillus 320 ? yes
B. janetta 320 ? yes
C. hottentotus 308/315 yes yes
C. mechowi 295 ? yes
C. kafuensis 289 ? yes
C. damarensis 295 ? yes
C. 'Sekute' 295 ? yes
C. anselli 295 ? yes
C. amatus 297 ? yes
Harg07 B. suillus 588 no yes
B. janetta 588 no yes
G. capensis 563/599/603 yes yes
C.darlingi 627 ? yes
C. kafuensis 622 ? yes
C. damarensis 624 ? yes
C. 'Sekute' 622 ? yes
C. anselli 618 ? yes
C. amatus 624 ? yes
Gcap01 C. mechowi 122 yes yes
C. whytei 132 ? yes
C. anselli 132 ? yes
Gcap07 C. darlingi 226 ? yes
Bsuil01 H. argenteocinereus 196 ? yes
C. holosericeus 204/212 yes yes
C. natalensis 202/206/212 no yes
C. anomalus 214 ? yes
C. kafuensis 210 ? yes
C. amatus 202 ? yes
Expected allele sizes
documented change
in primer site

125
Table 4.20 (continued)
Locus Taxa Variation at locus
Bsuil04 B. suillus 339 ? no (R)
G. capensis 337 yes yes
C. damarensis 311 no yes
Bsuil06 C. mechowii 243/257 yes no (R)
C. darlingi 255 ? no (R)
C. kafuensis 252 ? no (R)
C. damarensis 259/265 yes no (R)
C. 'Sekute' 259 ? no (R)
C. anselli 250/260 yes no (R)
C. amatus 247 no (R)
Chott01 H. argenteocinereus 273/276/279 yes yes
C. kafuensis 285 ? yes
C. damarensis 290/292 yes yes
C. 'Sekute' 281 ? yes
C. anselli 281/283 yes yes
C. amatus 268 ? yes
Cmech03 C. natalensis 269 ? ?
Cmech04 H. glaber 374/373 yes yes
H. argenteocinereus 428 yes yes
C. kafuensis 380 ? no (R)
Cmech09 H. argenteocinereus 291 yes yes
C. hottentotus 304 ? yes
C. natalensis 304 ? yes
C. darlingi 302 ? no (R)
C. damarensis 302 ? no (R)
Cmech11 H. argenteocinereus 129/131 yes yes
G. capensis 136 yes yes
Hglab10 H. argenteocinereus 321/331 yes yes
B. suillus 334 yes yes
B.janetta 339 ? yes
C. 'Kasama' 321 ? yes
R = only reverse primer included within MFS
Expected allele sizes
documented change in primer
site

126
insertion event present in all bathyergids with MFS amplification, The presence of this
repeat could not be confirmed in Heterocephalus since the MFS primers of Harg02 did
not amplify in this genus. Sequence divergence of 9.8% between the focal taxon and a
representive of Cryptomys (TM38464) may explain the lack of identification of this
repeat in Cryptomys by RepeatMasker. Within the SINE element, there was additional
length variation that contributed to fragment length in these taxa. MFS data identified
numerous null alleles (Table 4.20).
For Harg03, MFS sequencing efforts recovered sequences for Heliophobius,
Bathyergus, Georychus, Cryptomys, and Coetomys. For each genus, only two individuals
from a single species were sequenced (Table 4.5). Heterocephalus failed to amplify
with either genotyping or sequencing primer sets. RepeatMasker identified the repeat
region in all species sampled. The repeat region (GT) is interrupted in all species except
for Cryptomys hottentotus. In B. suillus, G. capensis, and C. mechowii, the GT repeat is
interrupted by an AT, while Heliophobius is interrupted with a GC. In addition, three
indels were identified in the flanking sequence of Harg03 and these changes all affected
fragment length allele size. The MFS sequence revealed homoplasies at this locus.
Allele 248 was a homoplastic electromorph in C.hottentotus and C. mechowi (Table
4.21). When comparing the MFS fragment lengths to the motif sequence, size alone
would mis-identify variation at this locus (Fig. 4.3; Table 4.21).
For Harg07, Heterocephalus and Cryptomys did not amplify the MFS fragment.
Although a potential outgroup taxon, (Hystrix africaeaustralis: SP7702), successfully
amplified, the sequence was not similar to any of the ingroup taxa. The repeat motif was

127
Table 4.21 Detection of electromorphic homoplasies.
Marker Allele length Taxa motif sequence
Harg03 248 C. hottentotus (GT)9
C. mechowii (GT)3 AT (GT)7
Gcap01 119 H. argenteocinereus (GT)10 GAGT
H. argenteocinereus (GT)9 GAGT
B. suillus GTGC (GT)11
B. suillus GTGC (GT)10
C. mechowii (GT)12
125 H. argenteocinereus (GT)13 (GA)2 GT
C. hottentotus (GT)14
C. damarensis (GT)6 G (GT)3 GC (GT)4
113 B. suillus GTGC (GT)8
G. capensis (GT)10
Gcap07 234 C. holosericeus GTGA (GT)15
C. natalensis (GT)17
C. mechowii GTGACT (GT)14
C. kafuensis GTGACT (GT)15
C. 'livingstone' GTGACT (GT)13
236 C. hottentotus GTGA (GT)15
C. damarensis GTGACT (GT)15
238 B. janetta GTGC (GT)4 GC (GT)14
C. amatus GTGACT (GT)16
242 B. suillus GTGC (GT)4 GC (GT)16
C. 'sekute' GTGACT (GT)18
Bsuil01 206 G. capensis (GT)4 AT (GT)4 GA (GT)2 GC (GT)2
C. hottentotus (GT)6 GCAT (GT)4
Bsuil06 268 H. argenteocinereus (GT)3 GA (GT)11 G (GT)4
H. argenteocinereus (GT)3 GA (GT)20 G (GT)5
242 B. janetta (GT)2 GA (GT)7 (GGA) (GT)3
B. janetta (GT)2 GA (GT)9 (GGA) (GT)4
G. capensis (GT)2 GA (GT)5 GG (GT)4 GGTATGT
C. holosericeus GTGC (GT)12 G (GT)2
252 G. capensis (GT)2 GA (GT)13 GGTATGT
C. anomalus (GT)18 G (GT)2

128
Table 4.21 (continued)
Marker Allele length Taxa motif sequence
Chott01 277 G. capensis (GT)20
C. hottentotus (GT)18
291 C. hottentotus (GT)21
C. natalensis (GT)22
Chott03 158 H. argenteocinereus GC (GT)2 CT (GT)6 CT(GT)4 CT GTGCT (CA)2 CG
C. amatus (GC)8 (GT)8 GCGT (GC)2 ATGCA
160 C. kafuensis GC (GT)12 (GC)2 GTGCGT (GC)2 ATGCA
C. damarensis GC (GT)13 (GC)2 GTGCGT (GC)2 ATGCA
C. anselli GC (GT)13 (GC)2 GTGCGT (GC)2 ATGCA
206/208 C. hottentotus (GT)2(GC)5(GT)7GCGTGC(GT)2GC(GT)3(GC)5(GT)5GC(GT)5(GC)5A
C. mechowii (GC (GT)12 GC (GT)3 GC (GT)2 GCGT (GC)2 ATGCA
Chott08 121 H. argenteocinereus (GT)5 GGGT (G)7
B. suillus (GT)7 (G)6
C. hottentotus (GT)11 GG
115 C. hottentotus (GT)6 (G)7
C. hottentotus (GT)5(G)7
C. holosericeus (GT)6 (G)7
C. mechowii (GT)5(G)7
C. kafuensis (GT)6 (G)5
C. 'sekute' (GT)6 (G)4
C. anselli (GT)6 (G)5
C. amatus (GT)6 (G)3
111 C. darlingi (GT)7 (G)3
C. whytei (GT)6 (G)5

129
Table 4.21 (continued)
Marker Allele length Taxa motif sequence
Cmech03 290 B. suillus (GT)6
C. 'sekute' (GT)14
286 B. suillus (GT)6
C. damarensis (GT)13
294 G. capensis (GT)15 GA
C. 'livingstone' (GT)16
C. mechowii TT(GT)15
Cmech04 374 H. glaber (T)20
B. suillus GTGA(GT)13
386 C. damarensis (GT)23
C. 'mazubuku' G (GT)24
Cmech11 116 B. suillus (GC)4 AT (GT)5
B. janetta GT (GC)3 AT (GT)5
132 C. hottentotus GCGAGCGT (GC)6 (GT)5
C. holosericeus GCGAGC(GT) (GC)5 (GT)6
C. natalensis GCGAGCGT (GC)6 (GT)5
144 C. darlingi GCGAGC (GT)18
C. damarensis GCGA (GC)2 (GT)2 GC (GT)13
146 C. mechowii GCGAGTGC (GT)21
C. kafuensis GCGA (GC)2 (GT)2 GC (GT)18
C. damarensis GCGAGCAA (GC)2 (GT)2 GC (GT)14
Hglab10 304 H. glaber (GT)21
G. capensis (GT)3 AG (GT)15
314 C. mechowii (GT)4 AG (GT)3 GAT (GT)13
C. damarensis (GT)4 AG (GT)16 TTGT
330 C. 'mazubuku' (GT)4 AG (GT)4 AT (GT)19 TTGT
C. amatus (GT)4 AG (GT)4 AT (GT)22

130
present in all species of Bathyergidae, although the complexity varied among genera
(Table 4.6; Fig. 4.4). In the focal taxon, Heliophobius, the repeat motif consisted of a
(GT)n GCTT (GT)5. The repeat region appears to be mutating on only one side of the
GCCTT interruption in this genus. In Georychus, there were two regions within the
microsatellite that are contributing to variation within this species. In Bathyergus, the
number of repeats was fixed across both species.
Within Coetomys, there were two different interruptions in the repeat motif. All
had a (GT)n (GC)n ATGT in the motif. In C. darlingi, C. damarensis, C. ‘Sekute’, and
C. anselli, there was an additional ATGT interruption between the (GT)n and the (GC)n
ATGT termination.
Sequencing of the MFS revealed that the Harg07 genotyping primer sites were
conserved across the four genera sequenced. Genotyping was not successful in
Bathyergus, Georychus, and Coetomys due to a large insertion of 453 bp in the flanking
region. This element was not present in the focal species. RepeatMasker recovered a
simple dinucleotide repeat in Heliophobius and in the 3 genera, another region identified
as the repeat class/family LTR/ERVL. These are the long terminal repeats of some
retrotransposons, similar in structure to retroviruses. Within this region, there was an
additional indel that separated Coetomys from Bathyergus and Georychus. Five
additional indels were identified in the flanking sequence of Harg07. Four of these
were only variable between genera. The fifth indel consisted of a 139 bp insertion in
two representatives of G. capensis.

131
3.2.2. Georychus (Gcap) loci
Two Georychus MFS loci (Gcap01 and Gcap07) were sequenced. For Gcap01, a
thorough sampling of numerous individuals and species in all six genera were
sequenced. The sequence from a representative of each genus was searched for any
repetitive elements using RepeatMasker. No repetitive sequences were identified in the
basal member, Heterocephalus glaber. A simple dinucleotide (GT) repeat was identified
in the representative of the other 5 genera. The largest repeat (GT)19 was confirmed in
Coetomys anselli, C. whytei, and Cryptomys hottentotus and not in the focal taxon as
predicted under an ascertainment bias.
Genotyping was successful in all genera but Heterocephalus. Changes in both
primer sites (Gcap01-F = 19%, Gcap01-R = 10.5%; Table 4.7) explain the lack of
amplification. From the MFS sequencing, no microsatellite was detected at this locus in
Heterocephalus (Fig.4.5). The flanking sequences, however, were alignable to other
taxa, so orthology was assumed. The fragment size predicted by the MFS was within 1-
3 bp of the genotyping fragment size in all cases, except for a single individual of
Cryptomys natalensis (TM38464). This discrepancy cannot be explained by any
changes in the flanking sequence.
Two indels were identified in the adjacent flanking region of Gcap01 (Table 4.7).
The first, an additional A was found only in the Heliophobius from Malawi. A second
95 bp indel adjacent to the repeat motif (present only in H. glaber) was identified as a
SINE/ID (ID_RN2). When the SINE/ID fragment was searched with BLAST, a
published C. damarensis (DMR4) microsatellite sequence (Burland et al. 2004) was

132
found with a score of 78 bits and a high e-value (1e-10). This suggests that the two
microsatellite primer sets (Gcap01 and DMR4) are associated with paralogous related
SINE/ID elements. With the 95 bp SINE/ID masked from the H. glaber sequence, all
significant BLAST searches aligned to mRNA sequences associated with PI 3-kinase
enhancer long isoform mRNA. Numerous electromorphic homoplasies were identified
for allele 113, 119 and 125 (Table 4.21)
The microsatellite and MFS of Gcap07 amplified in all genera but
Heterocephalus. Genotyping was successful in Georychus, Bathyergus, Cryptomys,
Coetomys, and Heliophobius. Most of the genotype allele sizes were within 1 bp of the
predicted size based on MFS sequencing (Table 4.8). One of the Georychus samples
(GPPH2) had an inconsistent genotype (216/218) with its sequence information (242 bp)
the cause of which could not be determined. A Cryptomys hottentotus sample
(MCA324) also showed inconsistency between genotyping (240 bp) and actual sequence
length (234 bp). Amplification was sporadic in Coetomys and may be due to mutations
in the primer sequence. The genotyping primer region was only confirmed for Gcap07-
R and was conserved across Georychus, Bathyergus, and Cryptomys. Mutations in the
primer site of Heliophobius and Coetomys were at different sites (Table 4.8).
RepeatMasker identified a simple dinucleotide repeat in the five successfully amplified
genera. No other repetitive sequence was identified. A BLAST search found no
published sequence of significant similarity. Georychus and Cryptomys natalensis had
perfect (GT) repeats. All other taxa had either interruptions or modifications on the ends
of the repetitive element (Table 4.8; Fig. 4.6). Three indels in the flanking sequences

133
were identified. Two of the indels were the result of poly-As adjacent to the repeat
motif. The third indel was the addition of a single nucleotide (A) in C. damarensis.
Multiple electromorphic homoplasies were identified for allele 234, 236, 238, and 242
(Table 4.21).
3.2.3. Bathyergus (Bsuil) loci
Three Bathyergus loci (Bsuil01, Bsuil04, and Bsuil06) were sequenced.
Heliophobius, Georychus, Bathyergus, Cryptomys, and Coetomys successfully amplified
the MFS of Bsuil01. RepeatMasker detected a dinucleotide (GT) repeat in all genera
except Heliophobius and Cryptomys. RepeatMasker identified a separate dinucleotide
(GT) repeat in Cryptomys. No repetitive element was identified in Heliophobius. When
all sequences were aligned, three different and distinct repetitive elements were
identified between the genotyping primers, including the two regions identified by
RepeatMasker. In a single Bathyergus suillus sample (BS), the target microsatellite was
a perfect GT repeat, while in all other taxa, the target microsatellite had multiple
interruptions in the repeat. In both Cryptomys and Coetomys, both of the repetitive
regions identified by RepeatMasker appear to be mutating (Table 4.11; Fig. 4.7). For the
short repeats unrecognized by RepeatMasker, variation was only detectable among
genera.
Genotypes across genera could not be compared due to the presence null alleles,
impact on fragment length due to indels rather than number of repeats, and the presence
of two distinct and mutating repetitive regions in members of this family. Genotyping

134
was consistent with the sequence length in Bathyergus and Georychus. However, this
was not the case for either Cryptomys or Coetomys. Sequencing revealed that the
priming site of one of the genotyping primers (Bsuil01-R) contained a large indel (14bp)
in some taxa (all Cryptomys and Coetomys) and variation could not be detected by
genotyping in all individuals (null alleles; Table 4.20). In addition, the microsatellite
was intact in Heliophobius, although amplification of the genotyping fragment was
unsuccessful. This is most likely due to the changes present in both of the genotyping
primers. In the individuals that amplified with the genotyping primers, genotypes were
not equal to that of the actual sequence length. Electromorph size homoplasy was
identified for at least one allele, 206 (Table 4.21). Additional size homoplasy was seen
when comparing genotype sequencing length with repeat motif.
For Bsuil04, the MFS primers did not amplify in Heliophobius. RepeatMasker
identified a simple dinucleotide repeat in both Georychus and Bathyergus. Sequencing
showed that the repeat was perfect in both genera (Table 4.10; Fig. 4.8). When searched
with BLAST, there was no significant similarity to published sequences. In Coetomys,
the repeat region was replaced by an identical GGGGGTTCGTGTGGGT in all of the
species sampled. In Cryptomys, the repeat motif was GGGCAG (GT)3 GGGT. Since
only one individual was sequenced, variation within this genus could not be assessed. In
Heterocephalus, no repetitive sequence was identified and the genotyping primers failed
to amplify. Three indels were identified, two of which are distinct across genera. The
third was isolated to a loss of GG adjacent to the microsatellite in a single representative
of Georychus (GPPH2). The genotyping primer Bsuil04-F was conserved in both

135
species of Bathyergus. In Georychus, only a single substitution (G→A) was present. In
Cryptomys and Coetomys, there was a change (A→G) in the 2nd position at the 3’end of
the primer site. In Heterocephalus, two mutation events were observed, both near the 5’
end (not in the 3 bp clamp) but may still explain the lack of amplification of genotypes
in these two genera (Table 4.10).
All genera amplified the Bsuil06 MFS locus, except Heterocephalus.
RepeatMasker identified the simple (GT) dinucleotide repeat in all of the sequenced
taxa. The BLAST search did not find any published sequences with significant
similarity. In all taxa, the repeat region was interrupted into three different separate
sections of (GT) repeats (Table 4.11). In Heliophobius, Bathyergus, and Cryptomys,
only one repetitive region was variable within each genus. Within Coetomys and
Georychus, two repetitive sections of the microsatellite changed. The Bsuil06
genotyping primer sites were conserved in all genera, except Cryptomys. Even with two
mutations within the Bsuil06-R priming site, amplification was successful in Cryptomys.
In contrast, the Bsuil06-R genotyping primer sites were conserved in Coetomys, but did
not amplify in any members of the genus (Fig. 4.9). Since the Bsuil06-F primer site was
not within the MFS sequence, changes in that region could not be observed.
Three indels were identified within the genotyping fragment of Bsuil06 (Table
4.11). The first indel consisted of a CT or TT sequence present in all taxa but
Cryptomys. The second indel was the insertion of a single T in two of the three species
of Cryptomys sampled (C. holosericeus and C. natalensis). The third indel, a CT
insertion, was present in all taxa except for two individuals of B. janetta and one B.

136
suillus. Electromorphic size homoplasy, both among and within genera, was detected
for three alleles, 242, 252, and 268 (Table 4.21).
3.2.4. Cryptomys (Chott) loci
Three Cryptomys MSF loci (Chott01, Chott03, and Chott08) were sequenced.
The MFS of Chott01 amplified in all genera, except Heterocephalus. RepeatMasker
identified a simple repeat (GT) in all taxa, as well as two other repetitive elements, an
LTR/MaLR (mammalian-apparent LTR) on one side of the repeat region (outside of the
genotyping fragment) and a SINE/Alu on the other side starting approximately 80 bp
from the repeat. The SINE/Alu was identified in all genera. Although the sequence was
present, RepeatMasker failed to recognize the LTR/MaLR in either Cryptomys or
Georychus.
Variation in fragment length of the genotyping fragment was not confined to
changes in the dinucleotide motif. Six indels provided additional length variation
(Table 4.12; Fig. 4.10). One of the six indels was exclusive to a single genus
(Georychus). The other five contributed to variation in length both among and within
genera. Although not included in Table 4.12, mutations occurred within the SINE/Alu
element, most of which contributed to variation in length between genera. There was a
deletion of ATTTT seen only in Heliophobius (H050) from Kenya that was not shared
with Heliophobius from Malawi. In both species of Bathyergus, there was a 15 bp
deletion and in both Cryptomys and Coetomys, there was a 2 bp (TT) indel. The allele
lengths determined via genotyping for the non-focal taxa were inconsistent with the

137
expected length determined from the sequencing data. This may be due to changes in
the stability of the genotyping primers from mutation events combined with the 3’ T
which is the least discriminating nucleotide increasing the chance for mismatch. Primer
Chott01-F was not conserved in any of the sequenced genera. In Heliophobius, there
was an indel that overlaped with the primer site of Chott01-F and two mutations in the
Chott01-R primer site. This explains the lack of amplification with the genotyping
primers, documenting null alleles (Table 4.20). In Bathyergus, there were changes in
both primer sites that may explain the inconsistency of the genotyping lengths. In
Georychus, although Chott01-R is conserved, numerous mutations affected the forward
primer site (three base substitutions and a deletion). This is the only information from
the data that could potentially explain the mis-scoring of the genotypes. The Chott01-R
primer site in Coetomys was conserved, but Chott01-F varied across the species of
Coetomys (with 3 or 4 substitutions). This is the most likely explanation for the lack of
amplification of the genotyping product in Coetomys. Electromorphic size homoplasy
was detected for two alleles, 277 and 291, both among and within genera (Table 4.21).
The MFS of Chott03 amplified in Heterocephalus, Heliophobius, Cryptomys,
and Coetomys. An outgroup taxon, Petromus typicus (D99), was amplified with these
primers. Neither Petromus nor Heterocephalus were alignable with the other genera or
each other. No repetitive element was identified in either. A BLAST search on the
Heterocephalus (H006) sequence found significant similarity (score= 239, E value = 3e-
60) to the large subunit rRNA (LSU/28S). RepeatMasker identified a simple (GT)
dinucleotide repeat in Heliophobius, Cryptomys, and Coetomys and a second SINE/MIR

138
region outside of the genotyping fragment. A BLAST search of these sequences did not
find significant similarity with any published sequences. The microsatellite motif was
complex in these three genera, consisting of multiple regions of expansion/contraction.
No indels were identified within the genotyping fragment. Variation in fragment size,
therefore, should only be due to variation in the repeat region. Changes in the primer
site were documented for Chott03-R in both Heliophobius and C. mechowii (Table 4.13;
Fig. 4.11). These changes did not appear to be affecting the genotyping product in these
taxa. The sequence length determined by the MFS fragments were consistent with the
observed genotypes in all cases except one C. mechowii (M71). The fragment was 41
nucleotides longer than expected. Electromorphic size homoplasy was identified for at
least 3 alleles, 158, 160, and 206/208 (Table 4.21).
The MFS primers for Chott08 amplified in all taxa but Heterocephalus,
Georychus, and B. janetta. RepeatMasker did not identify any repetitive sequence in
Heliophobius, Bathyergus, or Coetomys. The BLAST search failed to recover any
published sequence with significant similarity to the flanking sequence of Chott08. In
the focal species, Cryptomys hottentotus (TM38375), the repeat region consisted of a
simple (GT) dinucleotide repeat flanked by GGG on one side and GG on the other
(Table 4.14; Fig. 4.12). In all the other taxa, the GG end was variable, acting as a
mononucleotide repeat, while the number of GT repeats was reduced. This poly-G
region was variable both among and within genera. The repeat motif was longest in the
individual (TM38375) from which the microsatellite locus was designed. Six indels
were identified in the genotyping fragment. Four of the six were variable across genera,

139
while the other two indels were also variable within a genus (Georychus and Coetomys).
Substitutions were identified in both of the genotyping primer sites (Table 4.14). In the
Chott08-F site, there were two substitutions in Heliophobius and one in Coetomys.
Cryptomys holosericeus had 3 substitutions in the 5’ end of the primer site and a deletion
in the middle. At the Chott08-R priming site, there was one substitution in the 5’end of
the Heliophobius, Bathyergus, and Coetomys sequences. Coetomys also had an
additional substitution in the center of the primer site. These changes did not appear to
have any impacted the amplification of the genotyping locus. Most of the genotypes
were consistent with the expected size determined from sequencing the MFS fragment.
For the few that did vary, this may be due to slippage of Taq polymerase on the stretches
of poly-G (Clarke et al., 2001). Electromorphic size homoplasy was detected both
among and within genera at three alleles, 111, 115, and 121 (Table 4.21). This is due to
the changes in the number of dinucleotide versus mononucleotide repeats.
3.2.5. Coetomys (Cmech) loci
Four Coetomys MSF loci (Cmech03, Cmech04, Cmech09, and Cmech11) were
sequenced. MFS sequences of Cmech03 were generated for all genera, except
Heterocephalus and Heliophobius, neither of which amplified with the genotyping
primers. RepeatMasker identified a simple (GT) dinucleotide repeat in Georychus and
Coetomys. A BLAST search failed to find any published sequences with significant
similarity to Cmech03. Although not detected by RepeatMasker, the GT repeat was

140
present in Bathyergus, Georychus, Cryptomys, and Coetomys. The GT repeat was
longest in the congener, C. amatus (amatus2).
RepeatMasker identified an additional CT-rich region within the genotyping
fragment in all of the specimens sequenced. This region was fixed in all species of
Coetomys, except C. darlingi (Dar4), which had an additional CT, and C. mechowi (Z9 -
the individual from which the microsatellite library was constructed) had a TTC in
another part of this region. In Cryptomys, two different haplotypes were detected with a
3 bp difference. In Bathyergus and Georychus, this region was variable in length (Table
4.15).
The original genotyping of Cmech03 was only successful for Bathyergus,
Georychus, Cryptomys, and Coetomys (Fig. 4.13). In Bathyergus, polymorphism due to
migration of fragment size was observed. This variation was due to mutations in the
adjacent CT-rich region. In Georychus and Cryptomys, variation observed in the
fragment analysis contributed to both changes in the number of repeats and within the
CT-rich region. Although most of the polymorphism within Coetomys was from
variation in the number of repeats, mutations within the CT-rich region also contributed
to the allele size for C. darlingi and C.mechowii, In the genotyping primer site of
Cmech03, there was a substitution of G→C in the second position of 3’ GC clamp in
both Bathyergus and Georychus. Since Cmech03-R was used for both the genotyping
and MFS sequencing, changes in that primer site could not be identified. A null allele
was identified for C. natalensis. Three alleles, 286, 290, and 294, were identified as
electromorphic size homoplasies (Table 4.21).

141
All species were successfully sequenced with Cmech04 MFS primers.
RepeatMasker identified the simple (GT) dinucleotide repeat in all taxa, except in
Heterocephalus where the repeat motif changes from GT to poly-T. The (GT) repeat
was perfect in the focal taxon, as well as Cryptomys, Bathyergus and Georychus. In
Heliophobius, the repeat region had multiple interruptions producing a number of
separately variable regions. The largest number of repeats was observed in
Heliophobius although this was interrupted. RepeatMasker identified an additional
repetitive element (CAAAA) in Georychus and Bathyergus. The BLAST search did not
find any published sequences with significant similarity.
Original genotyping data were recovered for all members of the family (Table
4.16; Fig.4.14). In Heliophobius, alleles were often greater than 400bp (compared to
average of 377 bp for other taxa) and therefore, genotyping was problematic. In
Heterocephalus, for the individuals that successfully genotyped, the scored fragment
length was exactly the same as the sequencing fragment. The fragment lengths recorded
as allele sizes in Bathyergus were within one base pair of that predicted by the
sequencing fragment. In Georychus, there was a two base pair difference. The majority
of Cryptomys samples were within 2 bp, except for C. hottentotus (TM38375) that
differed by 19 bp. Discrepancies between genotype alleles size and that predicted from
the sequence fragment were found within the focal species and some of its congeners.
C. mechowii (Z9) and C. darlingi (DAR4) differed by 28 bp and 20 bp, respectively.
There were substitutions in the Cmech04 primer site in at least one representative of
each of the other five genera (Table 4.16). In Georychus (TM38399), there was a

142
mutation from A→C in the third base position on the 3’ end. In Cryptomys, three
specimens had a change from A→C in the middle of the primer site and (SP7743) had
an additional change from A→T at the third position from the 3’ end. In Bathyergus,
there was a change from C→A in position 8 from the 3’end. In Heliophobius and
Heterocephalus, there was a change in position 15 from A→G.
In addition to the CAAAA repeat identified by RepeatMasker, there were four
indels within the genotyping fragment that contributed to size variation at this locus.
Three of these indels were only variable across genera. The other one was present in
only three species of Coetomys and therefore affecting fragment size estimates when
making comparisons across species of this genus. Although the CAAA region was fixed
in both Heterocephalus and Coetomys, there was variation at that region within and
among the other four genera. Confirmation of a null allele was documented for at least
one individual from three different genera, Heterocephalus, Heliophobius, and Coetomys
(Table 4.20). For two alleles, 374 and 386, the MFS sequences revealed electromorphic
size homoplasies (Table 4.21).
The flanking sequence of Cmech09 amplified in all genera, except
Heterocephalus. RepeatMasker identified simple repeats in Coetomys, Cryptomys,
Georychus, and Bathyergus. Although recognized as a simple (GT) repeat, this region
was very complex in all taxa, with numerous repeat types and interruptions (Table 4.17;
Fig. 4.15). A BLAST search found no significant similarity between the flanking
sequence of Cmech09 and any previous published sequence.

143
The original genotyping primers amplified Coetomys, Georychus, Bathyergus,
and Heliophobius. Within the genotyping fragment, there were two indels that were
variable between genera but fixed within, thus potentially complicating comparisons
across genera (Table 4.17). The genotyping and sequenced fragment size were
consistent in Bathyergus and Georychus, within 2 bp. The primer site of Cmech09-R
showed some substitutions in the non-focal genera. In Cryptomys, it most likely would
not amplify due to a mutation at the 3’ end of the primer site and an internal deletion at
the 3rd bp in at the 3’end (Table 4.17). There were two substitutions in the primer site of
Heliophobius. Again, this could explain the lack of amplification of the genotype
fragment for Heliophobius. Genotyping was inconsistent in Coetomys. This was
unexpected since the primers were designed from C. mechowii. Changes in the primer
site of Cmech09-F could not be examined since it was used as both the genotyping and
MFS primer. Null alleles were documented in Heliophobius, Cryptomys, and Coetomys
(Table 4.20).
The Cmech11 MFS primers amplified in all taxa, except Heterocephalus.
RepeatMasker identified a simple repeat in all taxa except Cryptomys, for which no
repetitive sequences were found. The BLAST search found significant similarity
between sequences published from both human and mouse X chromosome (Score = 62,
E value = 1e-06). The flanking sequence immediately adjacent to the repeat had an indel
that was unique to each genus (Table 4.18; Fig. 4.16) except Cryptomys and Coetomys
that shared an identical sequence. A second indel (7 bp deletion) was unique to

144
Bathyergus downstream from repeat but in the genotype fragment. The nucleotide
sequence of the 7 bp segment was species-specific for the remaining taxa.
Comparison of the MFS fragment to the genotyping data revealed null alleles in
both Heliophobius and one Georychus (Table 4.5). The genotype data were consistent
with the observed fragment lengths of all samples of Bathyergus. For Georychus, the
results were not consistent. Across species of Cryptomys, the genotypes were scored
two bp shorter than the sequence data revealed, except in C. anomalus (SP7705) with
identical allele lengths. This documents a case in which some variation remains
undetected by the fragment analysis. Genotype data were misleading in Coetomys. For
samples Z9, Z10, Amatus2, and B2, the genotypes were scored at least 8 -10 bp shorter
than the sequence revealed. These discrepancies may be explained by the efficiency of
the genotyping primers. Base changes were documented in both primers, Cmech11-F
and Cmech11-R, some of which were due to sequence error of the original clone.
Neither primer had an exact fit with the sequence from Z9 (the individual from which
the primers were designed). In the Cmech11-F site, there was an A present at the
seventh position from the 5’ end that was undetected during the original primer design.
In the Cmech11-R site, there was an error at the third position from the 3’ end (T vs. G).
This is in the GC-clamp region of the 3’ end of the primer and could affect the primers
binding. In Heliophobius, the genotyping primers did not amplify. This can be
explained by the amount of mis-pairing (20% of sequence, all located within the 3’ end)
at the primer site (Table 4.18). At the Cmech11-R site, Heliophobius had 4 substitutions
in the last six bases of the primer, affecting the most important binding region for

145
amplification. Both Georychus and Bathyergus had substitutions at two of the last three
bp, which would affect the efficiency of the primer. This may explain the inconsistent
genotypes observed in Georychus. Electromorphic size homoplasy was identified for at
least 4 alleles, 116, 132, 144, and 146, all of which were genus specific (Table 4.21).
3.2.6. Heterocephalus (Hglab) loci
Only one Heterocephalus MFS locus provided consistent sequencing results.
Hglab10 amplified in all of the six genera of Bathyergidae (Table 4.19). In order to
maximize the information for this single Hglab locus, multiple representatives from each
genus were included for sequencing.
RepeatMasker identified a simple (GT) dinucleotide repeat in all genera, except
for Cryptomys. No significant similarity was found between the flanking sequence and
any published sequences (NCBI BLAST). In the focal taxon, Heterocephalus, the repeat
motif was a perfect (GT) dinucleotide repeat. In the other five genera, the repeat motif
contained at least one interruption (Table 4.19; Fig. 4.17). Heliophobius had multiple
interruptions and at least two variable regions in the microsatellite. Georychus had a
single AG interrupting the (GT) repeat, and in the individuals sampled, only the GT to
one side of the interruption showed variation. The interruptions were different between
the two species of Bathyergus. In both species, there was a GCGTAG interrupting the
GT repeat, but in B. suillus, there was a second interruption of TTT followed by a third
region of GTs. Unlike Georychus, the first region was fixed across both species of
Bathyergus and the second and third regions showed expansions. In all species of

146
Cryptomys, the repeat motif had two interruptions (AG and GC). There was no variation
in this region either among or within any Cryptomys species. Within Coetomys, the
repeat motifs varied across species. All individuals shared the first region of (GT)4 AG
(GT)n , but the rest of the motif varied across species (Table 4.19; Fig. 4.17). The
longest repeat was not detected in the focal taxa as expected. Even though the repeat
motif was interrupted in other species sampled, the longest stretches of (GT)n were
present in both C. damarensis and C. amatus.
Three indels were identified in the genotyping fragment of the Hglab10. The
first was a G insertion found only in samples of Heterocephalus. The second was
variable, with a T present in members of Heliophobius and a C in some but not all
Heterocephalus. The third was a 7 bp indel that differed between
Heterocephalus/Heliophobius and Bathyergus/Georychus/Cryptomys/Coetomys.
Comparison of the genotype allele length from the fragment analysis with the
length determined from the sequencing data had mixed results for each genus. Within
Heterocephalus, the fragment size was within two bases for that expected. Although this
did not affect the genotyping size, one of the indels did affect the allele length
determined through sequencing. The amplification of Hglab10 was sporadic in
Heliophobius, so no comparisons could be made. In the three samples of Georychus,
two were consistent, while the actual fragment length of a third (TM39874) was longer
than it would be when scored as a genotype, causing detection of variation when it was
not present. Amplification was sporadic in Bathyergus, so no confident comparisons
could be made. Although varying by two bp, Cryptomys had very consistent results

147
between the genotyping and sequencing data. This locus was fixed across species of this
genus, and this was reflected in both datasets. The genotyping data were inconsistent in
Coetomys. Most species (C. anselli, C. amatus, C. mechowii, C. darlingi, C.
‘mazubuku’, and C. ‘sekute’) had genotypes that were very consistent with the sequence
data, within at most 2 bp. In C. damarensis, however, the genotyping results were
inconsistent in two of the four samples included. SP7559 and ChD shared at least one
allele since their sequences at the repeat motif were exactly the same, but their genotype
data were scored differently, 322/332 and 300/312, respectively. Three alleles, 304, 314,
and 330, were documented as having electromorphic size homoplasy both among and
within genera (Table 4.21).
Across the entire data set, there was a single substitution in the Hglab10-R
primer site (Table 4.19). At the fourth position from the 5’ end, there was a change from
T→C. This substitution was shared among all five non-focal genera. Since Hglab10-F
was used in both the genotyping and sequencing reactions, no information about
potential changes at that site could be determined. This change in the primer site may
explain the problematic amplification of the genotyping fragment in Heliophobius,
Bathyergus, and Coetomys, although no issues were observed in the other two genera.
4. Discussion
4.1. Comparison of microsatellite panels based on genotyping data
One advantage of microsatellite loci is their ability to cross-amplify in closely
related taxa. When determining if a microsatellite locus was useful in amplifying

148
members across the family Bathyergidae, a number of criteria were considered: 1)
consistency of amplification across genera; 2) number of genera amplified; 3) the
number of genera showing polymorphisms for a given locus. For the six panels of
microsatellites presented here, none successfully amplified in all taxa. The results were
skewed. Heterocephalus (Hglab) primers were the most successful, with three loci
amplifying in all genera. It should be noted that loci designed from other taxa were least
successful in amplifying in Heterocephalus, suggesting that isolating these loci from the
most basal taxa may recover ancestral and even conserved microsatellites. In contrast to
this, Heliophobius markers had the lowest success rate in amplifying in other taxa. Only
three other loci successfully amplified in all members of the family. The Cryptomys
locus, Chott05, amplified in all genera, but it was monomorphic in Heterocephalus.
Two other loci, Gcap10 and Cmech04, showed greater promise of cross-taxon utility,
being polymorphic in all genera.
By examining these markers in a phylogenetic context, one would expect that
more closely related taxa would have a higher success rate in the amplification of non-
specific primers. This was observed in several loci, especially for sister-genera. For
example, most Heterocephalus loci (67%) amplified in its closest relative, Heliophobius.
However, no Heliophobius markers amplified Heterocephalus. Heliophobius had the
least number of loci that amplified in other taxa, with three loci (of 7) amplifying only in
Heliophobius. Although the comparisons in this study were limited in size, with only 5
– 7 loci per genus, these results suggest that the assumption that microsatellites will be
informative markers in closely related taxa is not necessarily true.

149
4.2. Comparisons of repeat motifs and the function of sequence data
Direct sequencing of the MFS fragments affords the only method to conclusively
examine the evolution of the microsatellite repeat motif (Zhu et al., 2000). By plotting
the repeat motifs on the phylogeny, it becomes apparent that interruptions within a
repeat motif are phylogenetically informative (Fig. 4.2 – 4.17). The use of multiple
sequence alignments provides a means for establishing the true limit of the repetitive
element. By default, the presence of a repetitive element is obvious during examination
of the original focal taxon during primer design, and most of the observed changes in
allele size are attributed to deletion or addition of a few units of repeats (Eckert et al.,
2002; Deka et al, 1995), fitting the assumptions of the SMM (Ohta and Kimura, 1973).
The majority of mutation at these loci are believed to be from slippage of DNA
polymerase which results in the loss or gain of the repeat element (Primmer et al., 1996a;
Weber and Wong, 1993; Schlötterer and Tautz, 1992; Levinson and Gutman, 1987).
This assumption is clearly violated by the results presented here, for microsatellite
evolution in Bathyergidae. Multiple studies, including this one, have documented
variation that was not accounted for by changes in the repeat (Blankenship et al., 2002;
Macaubas et al., 1997; Deka et al., 1985; Valdes et al., 1993). Additional studies of
other natural populations will be necessary to see if this is a general pattern and help to
incorporate additional mechanisms that are affecting these regions of DNA.

150
4.3. Is ascertainment bias a problem?
Microsatellite markers are often used because of their ability to be cross-
amplified in closely related taxa and the literature is laden with warnings about the
potential for an ascertainment bias as a result of methods used in the isolation of the
markers (Hutter et al., 1988; Ellegren et al., 1997; Forbes et al., 1995). Since the
markers presented here were designed using the same parameters, this bias should be
apparent when making comparisons across the six different microsatellite panels. If
there is an ascertainment bias, then the number of alleles and maximum allele length
should be highest in the focal species (Amos, 1999). This trend was not observed in the
data presented here. As shown in Table 4.3, the largest allele, highest number of alleles,
and largest range in allele lengths were not identified in the focal species more
frequently than in the non-focal species. Looking at each microsatellite panel separately,
results could be misleading. For instance, if only Coetomys loci had been used, the
results suggest an ascertainment bias. While these trends may be isolated to the family
Bathyergidae, it does provide a model for investigating the dynamics of microsatellites
and effects of primer design protocols.
4.4. Electromorphic size homoplasy
Through the use of direct MFS sequencing, electromorphic size homoplasies
were detected as changes in the repeat motif in twelve of the sixteen loci sampled, with a
total of 32 homoplastic alleles sequenced (Table 4.21). Genotypic fragment length allele
size alone was very limited at detecting the amount of variation present at these loci.

151
When primers are used in taxa beyond their original design, hidden variation at the locus
is expected (Culver et al., 2001; Gertsch et al., 1995). In most cases, as expected, the
homoplastic events were between different species or genera. In four cases, however,
homoplastic electromorphs were discovered within a species, but these were observed in
cross-taxon comparisons. In the Chott08 locus, an allele observed in the C. hottentotus
had different repeat motifs in separate individuals. Considering the limited nature of the
intraspecific sampling of this study, these data suggest that the incidence of homoplasy
could be much higher than predicted, and caution should be made when accepting
fragment length results without confirmation of distinct alleles. Genotyping fragment
analysis alone can lead to miscalculations of allele frequencies, deflated measures of
heterozygosity within populations, and decreased measures of divergence between
populations (Balloux et al., 2000; Hedrick, 1999). This is important to consider when
using microsatellite markers for conservation and population genetic studies.
4.5. Null alleles
Like electromorphic size homoplasies, non-amplifying (or null alleles) are
believed to predominate when primers are used in cross-specific or cross-generic
amplification (Pemberton et al., 1995). Lack of amplification provides no direct
information about the locus itself. In general, lack of amplification of the original
genotyping fragment, however, shows clear phylogenetic constraint (Figs. 4.2- 4.17). In
the sixteen loci sequenced, null alleles were detected at thirteen (Table 4.20). The
majority of these null alleles were detected in non-focal species. Only one locus,

152
Bsuil04, produced a null allele in the focal species. In 100% of the null alleles
sequenced, a microsatellite repeat motif was observed. By using MFS sequences,
microsatellite repetitive elements can be confirmed and changes in the genotyping
primers detected. In 46 of the 58 null alleles detected, mutations in the genotyping
primer site explain the lack of amplification.
4.6. Rare genomic changes (RGC)
Rare genomic changes (RGCs) such as indels, gene order, LINEs/SINEs, Alu
elements, and LTRs, are becoming increasingly important in phylogenetics and
comparative genomics (de Jong et al., 2003; Matthee et al., 2001; Okada, 1991; Rokas
and Holland, 2000; Springer et al., 2004; Takahashi and Okada, 2002). Arcot et al.
(1995) reported an association between Alu elements with microsatellite repeats, and
suggested that these elements may be the catalyst for microsatellite genesis. In
dipterans, a novel mobile element, mini-me, has been identified that is believed to be
associated with microsatellite genesis (Wilder and Hollocher, 2001). In the present
study, multiple indels were present at 14 of the 16 loci sequenced and showed potential
for being phylogenetically informative. Three loci had SINE elements, and one locus,
Harg07, contained an LTR within the genotyping fragment. In sequences outside of the
genotyping fragment, multiple transposable elements and indels were identified (data not
shown).
The SINE/Alu element identified by RepeatMasker in one locus in particular
(Harg02), is noteworthy. This element was identified in the sequences of Heliophobius,

153
Bathyergus, and Coetomys, but not in Cryptomys. From the sequence alignment, this 54
bp Alu represents a single ancient insertion event. Further inquery identified this Alu as
a FLAM_A. FLAM_A and associated 6 bp homology motif (CAAATT – present in all
samples sequenced) have been linked with deletion breakpoints associated with human
disease (Krawczak and Cooper, 1991; Trarbach et al., 2004). A parsimony analysis of
the 54 bp FLAM_A sequence (5 parsimony-informative sites) revealed sequence
divergence of 9.8% between the focal taxon and a representative of Cryptomys
(TM38464), and yielded 18 trees (CI = 1.0, RI = 1.0). Analyzing the nucleotides of this
FLAM_A Alu provided five parsimony informative characters, while presence/absence
of the element alone would have been uninformative. The results of this study
contribute to the growing data that support the association of microsatellite repeats with
RGCs, and provide a method to isolate these informative sites.
5. Conclusions
This study provides a novel look at the evolution of microsatellites. While
previous studies have examined few loci within a phylogenetic context, or made
reciprocal comparisons between two species, this study provides a broader picture of
how some microsatellite loci are evolving. The number of electomorphic homoplasies,
null alleles, and changes within the flanking sequence that impact allele size were
markedly high. This study shows the importance of characterizing the entire genotyping
fragment across all taxa of interest, and the use of MFS allows for characterization of the
repeat motif, RGCs in the flanking sequence, and mutations at the priming sites,

154
confirming null alleles. While this study was restricted to the family Bathyergidae, there
is no reason to believe that these patterns are isolated to this family, especially when
other studies examining phylogenetic relationships across Mammalia have utilized
nuclear markers that successfully amplify in the Bathyergidae (Murphy et al., 2001).

155
CHAPTER V
THE UTILITY OF MICROSATELLITE FLANKING SEQUENCES AS DATA IN
PHYLOGENETIC RECONSTRUCTION
1. Introduction
Microsatellite loci represent a class of molecular markers ideal for detailed
studies of variation within a species (Bowcock et al., 1994; Gardner et al., 2000;
Sunnucks, 2000). These molecular markers occur in thousands of copies within the
mammalian genome and are distributed throughout autosomes and sex chromosomes
(Dietrich et al., 1996; Goodfellow, 1993; Weber and May, 1989). A locus is defined by
a specific repeat motif, consisting of multiple, tandem repeat units that vary in size from
2 to 5 nucleotides and flanking sequences specific to a particular chromosomal region
(Tautz, 1993; Weber and May, 1989). Variation at microsatellite loci is the consequence
of mutations involving insertions and deletions (indels) of specific repeat units during
replication, which yield alleles differing in overall length (Weber and May, 1989; Weber
and Wong, 1993). Most microsatellite loci are highly polymorphic, owing to a mutation
rate ranging between 10-5 and 10-2 mutations per generation (Edwards et al., 1992;
Macaubus et al., 1997). Their distribution throughout the genome and high levels of
polymorphism provide a useful means of mapping genomes (Causse et al., 1994; Dib et
al., 1996; Su and Willems, 1996) as well as providing markers for epidemiology (Wang
et al., 2001), forensics (Edwards et al., 1991), and the establishment of relatedness
among individuals (Altet et al., 2001; Queller et al., 1993). Microsatellite loci have

156
proven useful to population genetics, especially in studies involving the partitioning of
genetic variation within and between populations that have experienced fragmentation
and/or bottlenecks (Kimmel et al., 1998; Luikart et al., 1998a, b; Rooney et al., 1999;
Taylor et al., 1994). As such, these markers have been broadly applied in conservation
genetics (Maudet et al., 2002; O’Ryan et al., 1998; Paetkau et al., 1995; Roy et al., 1994;
Roy et al., 1996).
One major analytical hurdle associated with microsatellite loci relates to the
particular mutation processes responsible for allelic variation at a locus. This process
complicates selection of models used to provide accurate estimates of population genetic
parameters such as gene flow, population subdivision, and genetic distance between
populations (Calabrese et al., 2001; Goldstein and Pollack, 1994; Goldstein et al., 1995b;
Kimmel et al., 1998; Slatkin, 1995). In broad scale studies of geographic variation
among widespread populations within species, such as humans, selection of both the
appropriate model of evolution and the tree/network building method influences the
resultant relationships (Goldstein et al., 1995a). Several studies have used distance-
based approaches (neighbor-joining) for phylogenetic reconstruction to determine
relationships among members of closely related species (Takezaki and Nei, 1996). In
the case of the Peromyscus maniculatus species complex, ten microsatellite loci
successfully approximated the well-corroborated phylogeny (Chirhart et al., 2004). In
their study, however, the model selection and the tree building method influenced
accuracy.

157
Problems associated with the use of fragment size data produced for
microsatellite loci prevent widespread use of these markers for phylogenetic studies. As
phylogenetic distance increases, the probability of homoplasy increases due to back
mutations of fragment length (alleles). Therefore, alleles based on fragment size may
not be homologous (identical by descent). This is especially troubling given some
empirical evidence suggesting a ceiling on the length of alleles (Garza et al., 1995).
Another potential source of homoplasy in estimates of allele size based on fragment
length relates to insertion/deletion (indel) events in flanking sequences. This results in
the convergence of scored allele sizes derived from different motif length + indel
combinations (see Chapter IV). Despite problems associated with the use of allele size
data at microsatellite loci for phylogeny reconstruction, these loci have the potential of
providing a more accurate genome-wide assessment of variation and relatedness among
species. For instance, microsatellite loci map to specific chromosomal sites defined by
their unique flanking sequences, and they are distributed throughout the genome.
Therefore, direct comparisons of nucleotide sequence differences in their flanking
regions can be used to reconstruct relationships among species over considerably larger
scales of divergence. To date, only a few studies (Arévalo et al., 2004; Ortí et al., 1997;
Schlötterer, 2001; Zardoya et al., 1996) have addressed the utility of flanking sequences
for phylogeny reconstruction, and these relied on a small number of loci.
The goal of this chapter is to assess the utility of microsatellite flanking
sequences in recovering the phylogenetic relationships within and among genera of
African mole-rats (Bathyergidae: Rodentia). African mole-rats represent a monophyletic

158
group endemic to sub-Saharan Africa, and relationships among the genera are well
supported by morphological, chromosomal, and nuclear and mitochondrial DNA
sequence data (see Chapter II; Allard and Honeycutt, 1992; Faulkes et al., 1997; Ingram
et al., 2004; Janecek et al., 1992; Walton et al., 2000). Currently, there are six
recognized genera: Heterocephalus (1 species) and Heliophobius (1 sp), which are
restricted in distribution to Eastern Africa; Bathyergus (2 sp) and Georychus (1 sp),
which are limited to southern Africa; Coetomys (13 species currently recognized), whose
range extends from Ghana in west Africa to southern Sudan and northern Angola in east
Africa, and south to Namibia just crossing the border of Botswana into South Africa
where it is replaced by Cryptomys (5 species currently recognized) which extends to the
Cape Province of South Africa (Aguilar, 1993; Burda et al., 1999; Faulkes et al., 1997;
Honeycutt et al., 1987; Macholán et al., 1993; Walton et al., 2000). Using the well-
resolved phylogeny as a framework, the ability of microsatellite flanking sequences
(MFS) to recover the relationships within this family can be assessed. Rather than
relying on the flanking sequence of a single microsatellite locus as done in previous
studies (Jin et al., 1996; Ortí et al., 1997; Schlötterer, 2001; Zardoya et al., 1996), I
designed microsatellite flanking sequence (MFS) loci for each of the six genera, so
comparisons could be made on the amount of phylogenetic information that each locus
provides, as well as combinations of multiple intra- and cross-taxon loci.

159
2. Materials and Methods
2.1. Taxon sampling and DNA isolation
For the monotypic genera: Heterocephalus, Heliophobius, and Georychus, a
minimum of two individuals were chosen from the extremes of their geographic
distribution to increase the chance of assessing the amount of variability within each
species. For Bathyergus, Cryptomys, and Coetomys, representatives from a number of
species were included. DNA from either frozen liver and/or skin samples preserved in
ethanol (70%) was isolated by proteinase-K digestion followed by either
phenol/chloroform extraction or QIAGEN DNAEasy spin columns (Qiagen Inc.,
Valencia, CA).
2.2. Microsatellite flanking region amplification and sequencing
All MFS primer sets (described in Chapter IV) were screened via the polymerase
chain reaction (PCR) across all available lineages of Bathyergidae to assess the
conservation of each locus. The sequencing efforts focused on loci that successfully
amplified across the majority of the taxa. When possible, genotypic homozygotes
(determined from original microsatellite genotyping – See Chapter IV), representing
multiple localities within each taxon, were sequenced to characterize the microsatellites’
repeat motifs and flanking regions. Initial amplification was performed using the
external primers that flanked the genotyping fragment. Approximately 20 – 100 ng of
template DNA was amplified in 50 µL reactions using 0.5 µL of EX-Taq polymerase
(Takara), 5 µL of 10X EX-Taq Buffer w/ MgCl2 (Takara), 5 µL of 2.5 mM dNTPs

160
(Takara), 0.1 µM of each primer, and ddH20 to a final volume. Reaction conditions
consisted of an initial denaturation at 94 ºC for 5 min, followed by 35 cycles of a 94 ºC
for 30 sec, 58 ºC for 30 sec, and 72 ºC for 30 sec, with a final extension at 72 ºC degrees
for 10 min. Amplification of the correct fragment length was confirmed by
electrophoresis of PCR product (5µL) with a size standard on 1% agarose minigels,
stained with ethidium bromide, and visualized under UV light. When amplification was
unsuccessful, additional attempts were made using a gradient block PCR thermal cycler
(MJ Research) at annealing temperatures ranging from 50 – 65 ºC, with all other reaction
parameters remaining identical. PCR products were cleaned using QIAquick Spin PCR
purification spin columns and followed a standard protocol (Qiagen Inc., Valencia, CA).
Both strands of the PCR product were sequenced using the PCR primers. Each
fragment was sequenced in both directions at least two times for confirmation of the
sequence. This was necessary due to decline in quality of the sequence once the repeat
motif was encountered. When necessary, the original genotyping primers were used in
an attempt to increase the quality of the sequencing across the repeat motif. Cycle
sequencing reactions were performed using ABI Prism BigDye Terminator v3.0
chemistry (Applied Biosystems, Foster City, CA), with 25 cycles of 97 ºC for 30 sec, 50
ºC for 5 sec, and 60 ºC for 2 min. Excess terminator dye, oligonucleotides, and
polymerase were removed by centrifugation at 3000 rpm through a Sephadex G-50
matrix (Sigma-Aldrich, Inc.). Sequencing reactions were electrophoresed and analyzed
on an ABI 377 XL automated sequencer or ABI PRISM® 3100-Avant Genetic
Analyzer. Sequence data were imported into SEQUENCHER v4.2 (Gene Codes

161
Corporation, Ann Arbor, MI) for alignment and contig assembly for each individual.
Once the entire sequence was confirmed by overlapping reads, the contigs were exported
in FASTA file format. Repeat motifs were masked using RepeatMasker v3.0 (Smit et
al., 2004), that identifies the repetitive sequence with lower case so that the repeat could
be delimited and masked from further analysis, yet remain in the alignment. All
sequences for a locus were initially aligned using SEQUENCHER to establish that
fragments were homologous and provided a rough alignment. Each alignment was then
imported into MacClade v4.05 (Maddison and Maddison, 2002) and fine-tuned visually
using the plain molecular data matrix setting, and saved in NEXUS format for analysis.
2.3. Data analyses
Maximum-parsimony (MP) analyses were performed using PAUP* v4.0b10
(Swofford, 2002). Amplification of an outgroup, outside of Bathyergidae, was
unsuccessful in all loci and midpoint rooting was applied to all trees. When possible, a
branch-and-bound search was performed. If the branch-and-bound search exceeded 24
hours, the run was terminated and the shortest tree length found was used as the
maximum tree length for a heuristic search with 1,000 replicate searches, random
addition of taxa, and TBR branch swapping, with the steepest descent option not in
effect. When equally-weighted searches failed to recover a single MP tree, additional
MP analyses were performed with characters successively-weighted (Farris, 1969) by
their rescaled consistency index (RC: Farris, 1989). For each locus, the analyses were
multi-tiered: 1) all the sequence data, including the repeat sequence, and 2) flanking

162
sequence alone with the repeat motif removed from analyses by square brackets in the
NEXUS file. Bootstrap resampling (Felsenstein, 1985) and decay indices (Bremer,
1988) were used as relative measures of nodal support. Bootstrap analyses were
initiated using 1,000 replicates, each with 100 random addition sequences and TBR
branch-swapping using PAUP*. Decay indices were generated using MacClade and
PAUP*.
To determine the appropriate model of evolution for maximum-likelihood (ML)
analyses, the Akaike information criterion (Akaike, 1974) was calculated using
MODELTEST v3.06 (Posada and Crandall, 1998). Under the estimated model for each
locus, a heuristic search, with 10 random addition sequences and TBR branch-swapping,
was used to obtain a ML tree. Bootstrap support for the ML tree was determined using
the "fast" stepwise addition option and a minimum of 100 replicates.
To investigate the phylogenetic utility of all MFS loci combined, the datasets
were pared down to representatives from each genus and analyzed together with
characters coded as missing for incomplete or missing sequences. A minimum of one
specimen per genus was selected based on high representation across all data
partitions/loci. Identifiable indels across all sixteen loci were coded for representative
of each genus in a presence/absence matrix and analyzed using an exhaustive search
under MP. Nodal support was assessed using bootstrap proportions.

163
3. Results
3.1. Success of sequencing effort across MFS loci
Sequence data were recovered for the MFS of 16 microsatellite loci. The number
of genera that successfully amplified and sequenced varied across loci (Tables 4.4–4.21).
Only three genera (ten species) were successfully sequenced for Chott03. Four loci,
Harg02, Harg07, Cmech03, and Chott08, successfully amplified in only four genera (10
– 14 species). Eight loci (Harg03, Bsuil01, Bsuil04, Bsuil06, Gcap07, Cmech09,
Cmech11, and Chott01) successfully amplified and sequenced across five genera (6 – 16
species). One non-focal locus (Bsuil04) amplified in Heterocephalus, but not in
Heliophobius. Three loci, Cmech04, Gcap10, and Hglab10, successfully amplified and
sequenced all six Bathyergid genera (16 – 17 species).
3.2. Phylogenetic analyses of 16 microsatellite flanking sequences
The average number of characters, number of variable sites, and parsimony-
informative characters at each locus were 403 (R = 194 – 683), 67 (R = 13 – 120), and
46 (R = 9 – 89), respectively (Table 5.1). The average percent of variable sites was
16.4% (R = 6.7 – 26.9%). The average percent of variable sites that were parsimony-
informative was 66.8% (R = 25 – 91.5%).
Either branch-and-bound or heuristic searches recovered a single parsimonious
tree at nine loci (MP trees not shown: CI = 0.864 – 1.0, RI = 0.92 – 1.0; see Figs. 5.1 –
5.9). In eight of these trees (Figs. 5.2 – 5.9), the genera formed well-supported

164
Table 5.1 Phylogenetic use of microsatellite flanking sequences (MFS).
Locus
Hglab10 6 16 25 412 111 26.9 89 80.2 10 130 0.915 0.975 0.085 TVM+G – 1.7604 1271.2428 22
Harg02 4 12 15 606 82 13.5 62 75.6 1 89 0.955 0.977 0.045 TrN – – 1396.5031 1
Harg03 5 5 8 194 13 6.7 9 69.2 1 14 1 1 0 HKY – – 347.35284 1
Harg07 4 10 13 683 73 10.7 53 72.6 1 77 0.974 0.984 0.026 HKY – – 1418.2163 1
Bsuil01 5 13 21 365 55 15.1 31 56.4 1 66 0.864 0.92 0.136 K80+G – 0.3896 900.72252 1
Bsuil04 5 11 11 310 44 14.2 14 31.8 6 59 0.966 0.95 0.05 HKY – – 739.38997 3
Bsuil06 5 14 18 277 50 18.1 36 72.0 1 55 0.945 0.978 0.055 GTR – – 707.68314 101
Gcap01 6 16 23 493 89 18.1 68 76.4 3 97 0.969 0.988 0.031 K80 – – 1244.5058 1
Gcap07 5 16 22 318 55 17.3 38 69.1 1 *SA 73 0.822 0.926 0.178 TrN+G – 0.2234 871.84045 1
Chott01 5 14 20 657 120 18.3 85 70.8 3 *SA 144 0.931 0.975 0.069 K81uf+G – 0.6229 1148.4598 1
Chott03 3 9 14 253 33 13.0 24 72.7 1 36 0.972 0.984 0.028 HKY – – 558.96569 1
Chott08 4 13 18 347 85 24.5 46 54.1 9 94 0.979 0.987 0.071 K81uf – – 1008.6729 4
Cmech03 4 14 11 196 22 11.2 20 90.9 1 26 0.923 0.977 0.077 K80 – – 427.57847 4
Cmech04 6 15 22 382 94 24.6 86 91.5 1 115 0.904 0.972 0.096 K80+G – 0.7714 1168.6965 1
Cmech09 5 10 14 512 85 16.6 52 61.2 1 95 0.937 0.956 0.063 TrN+G – 1.0917 1260.4849 2
Cmech11 6 16 30 436 60 13.8 15 25.0 2 64 0.969 0.992 0.031 TrN – – 999.01887 1
# ML
treesmodel I G - ln LTL CI RI HI
%
variable
# of pars-
inf
% pars-
inf # trees
# of
genera
# of
species
# of
characters
# of variable
sites
# of
haplotypes

165
165
Fig. 5.1 Bsuil06 microsatellite flanking sequence maximum-likelihood phylogeny under GTR (one of 101 trees, – ln L = 900.72252). Midpoint rooting was used. A branch and bound search under maximum-parsimony recovered a similar topology. Value above major branches represent MP bootstrap proportions and ML bootstrap proportions, respectively; values below represent Bremer decay indices.

166
166
Fig. 5.2 Cmech03 microsatellite flanking sequence maximum-likelihood phylogeny under K80 (one of four trees, – ln L = 427.57847). A branch and bound search under maximum-parsimony recovered the same topology. Value above major branches represent MP bootstrap proportions and ML bootstrap proportions, respectively; values below represent Bremer decay indices.

167
167
Fig. 5.3 Cmech09 microsatellite flanking sequence maximum-likelihood phylogeny under TrN + G (one of 2 trees, – ln L = 1260.48490, a = 1.0917). A branch and bound search under maximum-parsimony recovered the same topology (TL = 95). Value above major branches represent MP bootstrap proportions and ML bootstrap proportions, respectively; values below represent Bremer decay indices.

168
168
Fig. 5.4 Bsuil01 microsatellite flanking sequence maximum-likelihood phylogeny under K80+G ( – ln L = 900.72252, a = 0.3896). Midpoint rooting was used. A branch and bound search under maximum-parsimony recovered a similar topology (TL = 64). Value above major branches represent MP bootstrap proportions and ML bootstrap proportions, respectively; values below branches represent Bremer decay indices.

169
169
Fig. 5.5 Cmech04 microsatellite flanking sequence maximum-likelihood phylogeny under K80 + G (– ln L = 427.57847, a = 0.7714). Midpoint rooting was used. A heuristic search under maximum-parsimony recovered the same topology. Values above major branches represent MP bootstrap proportions and ML bootstrap proportions, respectively; values below represent Bremer decay indices.

170
170
Fig. 5.6 Harg03 microsatellite flanking sequence maximum-likelihood phylogeny under K80 (– ln L = 1396.60309). Midpoint rooting was used. A branch and bound search recovered a similar topology (TL = 14). Values above major branches represent MP bootstrap proportions and ML bootstrap proportions, respectively; values below branches represent Bremer decay indices.

171
171
Fig. 5.7 Harg02 microsatellite flanking sequence maximum-likelihood phylogeny under K80 (– ln L = 1396.60309). Midpoint rooting was used. A branch and bound search recovered a similar topology (TL = 89). Values above major branches represent MP bootstrap proportions and ML bootstrap proportions, respectively; values below represent Bremer decay indices.

172
172
Fig. 5.8 Harg07 microsatellite flanking sequence maximum-likelihood phylogeny under K80 (– ln L = 1418.21633). Midpoint rooting was used. A branch and bound search recovered a similar topology (TL = 76). Value above major branches represent MP bootstrap proportions and ML bootstrap proportions, respectively; values below branches represent Bremer decay indices.

173
173
Fig. 5.9 Chott03 microsatellite flanking sequence maximum-likelihood phylogeny under HKY85 ( – ln L = 558.96569). Midpoint rooting was used. A branch and bound search under maximum-parsimony recovered the same topologies. Value above major branches represent MP bootstrap proportions and ML bootstrap proportions, respectively; values below represent Bremer decay indices.

174
174
monophyletic groups: Heterocephalus (Bootstrap proportions (BP) = 100, Decay
Indices (DI) = 38), Heliophobius (BP = 95 - 100, DI = 4 – 22), Bathyergus (BP = 90 -
100, DI = 1 –10), Georychus (BP = 79 – 100, DI = 1 – 6), Cryptomys (BP = 64 – 100, DI
= 1 – 6), and Coetomys (BP = 53 – 100, DI = 1 – 7). For locus Harg03, the five genera
formed monophyletic groups, but support was low across Bathyergus, Georychus,
Cryptomys, and Coetomys (Fig. 5.6: CI = 1.0, RI = 1.0). Gcap07 recovered a single
most-parsimonious tree when successively-weighted parsimony was used (not shown: CI
= 0.822, RI = 0.926; see Fig. 5.10). Chott01 recovered 3 equally parsimonious trees
when successive-weighting was used (not shown: CI = 0.931, RI = 0.975; see Fig. 5.11).
For Chott08, nine equally-parsimonious trees were recovered (not shown: CI = 0.979, RI
= 0.987; see Fig. 5.12).Two equally-parsimonious trees were recovered for Cmech11
(not shown: CI = 0.969, RI = 0.992; see Fig. 5.13). Three equally-parsimonious trees
were recovered for Gcap01, with strong support for monophyly of all genera (not shown:
CI = 0.969, RI = 0.988; see Fig. 5.14). For Bsuil04, six equally-parsimonious trees were
recovered (not shown; see Fig. 5.15). Ten equally-parsimonious trees were recovered
for Hglab10 (not shown: CI = 0.966, RI = 0.95; see Fig. 5.16).
The models of evolution varied across each locus (Table 5.1), ranging from very
simple: K80 (Kimura, 1980), with equal base frequencies and two substitution rates
(transitions vs. transversions) to a complex submodel of the general time reversible
model: TVM+Γ (GTR: Tavaré, 1986; TVM: Posada and Crandall, 1998) with unequal
base frequencies, five substitution rates (4 transversion + 1 transversion), and among-site
rate variation estimated by the gamma distribution. Compared with the results from the

175
175
Fig. 5.10 Gcap07 microsatellite flanking sequence maximum-likelihood phylogeny under K80 (– ln L = 1244.5058). Heliophobius was used as the outgroup. Successively weighted maximum-parsimony (by RC) recovered a similar topology. Values above major branches represent MP bootstrap proportions and ML bootstrap proportions, respectively; values below represent Bremer decay indices.

176
176
Fig. 5.11 Chott01 microsatellite flanking sequence maximum-likelihood phylogeny under K81uf + G ( – ln L = 1148.45978, a = 0.6229). Successively-weighted maximum-parsimony (by RC) recovered the same topologies. Value above major branches represent MP bootstrap proportions and ML bootstrap proportions, respectively; values below represent Bremer decay indices.

177
177
Fig. 5.12 Chott08 microsatellite flanking sequence maximum-likelihood phylogeny under GTR (one of four trees, – ln L = 558.96569). Heliophobius was set as the outgroup. Successively weighted maximum-parsimony recovered 9 trees, including this topology. Value above major branches represent MP bootstrap proportions, and ML bootstrap proportions, respectively; values below represent Bremer decay indices.

178
178
Fig. 5.13 Cmech11 microsatellite flanking sequence maximum-likelihood phylogeny under TrN (one of 202 trees, – ln L = 999.01887). Heliophobius was used as the outgroup. A heuristic search under maximum-parsimony recovered similar topologies (6 trees). Value above major branches represent MP bootstrap proportions, value below represents ML bootstrap proportions.

179
179
Fig. 5.14 Gcap01 microsatellite flanking sequence maximum-likelihood phylogeny under K80 (– ln L = 1244.5058). A branch and bound search under maximum-parsimony recovered a similar topology (3 trees). Values above major branches represent MP bootstrap proportions and ML bootstrap proportions, respectively; values below represent Bremer decay indices.

180
180
Fig. 5.15 Bsuil04 microsatellite flanking sequence maximum-likelihood phylogeny under HKY85 (one of three trees, – ln L = 739.38997). Successively-weighted maximum-parsimony (by RC) recovered the same topologies. Value above major branches represent MP bootstrap proportions and ML bootstrap proportions, respectively; values below represent Bremer decay indices.

181
181
Fig. 5.16 Hglab10 microsatellite flanking sequence maximum-likelihood phylogeny under K80 (one of 22 trees, – ln L = 1396.60309, a = 1.7604). Heterocephalus was used as the outgroup. A heuristic search recovered similar topologies (10 trees; TL = 130). Values above major branches represent MP bootstrap proportions and ML bootstrap proportions, respectively; values below represent Bremer decay indices.

182
182
parsimony analysis, in which 9 loci each recovered a single tree, a different set of ten
loci recovered single trees using their respective models under ML (Table 5.1). Under
ML, Gcap01 recovered a single tree (Fig. 5.14) versus three from MP. This topology
was consistent with the 12S/TTR phylogeny (Fig. 2.4), with the exception of a non-
monophyletic Cryptomys. Similarly, a single tree was also recovered under ML for
Cmech11, versus two MP trees (Fig. 5.13), with strong support for monophyly of all
included genera (ML BP = 87 – 100). Three loci (Cmech09, Cmech03, and Bsuil06)
that recovered single MP trees, recovered multiple trees under ML (Fig. 5.1 – 5.3). The
most extreme example was Bsuil06 that recovered 101 trees under ML (Fig. 5.1). The
differences among the 101 trees were small changes in branch lengths and branching
patterns within Coetomys.
3.3. Combined data sets
Due to the variable success of amplification across the available samples, the sets
of taxa analyzed per locus were quite different, limiting the possibilities for combined
analyses of the 16 MFS loci. Two separate combinations of loci were analyzed: 1) a set
of 3 loci (Cmech04, Gcap01, and Hglab10) across members of all 6 genera (8 taxa), and
2) all 16 loci for the same 8 taxa, but, with missing data for one or more taxon per
partition. The Cmech04/Gcap01/Hglab10 dataset consisted of 1287 characters (238
variable sites; 43 parsimony-informative sites – 18% of variable positions) and
recovered single trees under both MP and ML with strong nodal support (CI = 0.973, RI
= 0.868;76–100 MP BP; 69–100 ML BP) (Fig. 5.17). The larger dataset containing

183
183
Fig. 5.17 Combined maximum-likelihood phylogeny of Cmech04, Gcap01, and Hglab10 under TVM + G (- ln L = 3118.8554, α = 1.8738). A branch and bound search under maximum-parsimony recovered the same topology (TL = 262, CI = 0.973, RI = 0.868). Values above major nodes represent MP and ML bootstrap proportions, respectively.

184
184
Fig. 5.18 Combined maximum-likelihood phylogeny of all 16 microsatellite flanking sequence (MFS) loci under TVM + G (- ln L = 13167.3867, α = 1.0101). Midpoint rooting was used. A branch and bound search under maximum-parsimony recovered the same topology (TL = 883, CI = 0.972, RI = 0.893). Values above major nodes represent MP and ML bootstrap proportions, respectively.

185
185
6212 nucleotides (817 variable sites; 199 parsimony-informative sites – 24%) also
recovered single trees under MP and ML (Fig. 5.18: CI = 0.972, RI = 0.893).
From the larger combined data set, 96 indel events were coded for
presence/absence across the genera and an exhaustive search recovered a single MP tree
(not shown; TL = 107, CI = 0.907, RI = 0.545) with weak to strong nodal support for the
intergeneric relationships (MP BP = 50 – 89). Of the 96 characters, 20 were parsimony-
informative.
4. Discussion
4.1. Utility of flanking sequences in phylogenetic reconstruction
Microsatellite flanking sequences (MFS) were effective in recovering
relationships at the generic and sub-generic level (geographic units or species groups)
congruent with the phylogeny recovered from 12S/TTR (Chapter II; Ingram et al., 2004).
Only one locus, Hglab10, showed any deviation from the expected branching pattern
from mtDNA and nDNA (12S/TTR phylogeny: Chapter II; Ingram et al., 2004). For this
locus, an unexpected grouping of Heliophobius with Bathyergus, but excluding
Georychus was recovered under ML (Fig. 5.16). This relationship was not recovered
under maximum-parsimony. The three samples of Georychus sequenced for this locus
showed numerous fixed differences at sites in which Heliophobius and Bathyergus
shared the symplesiomorphic state with Heterocephalus. All other loci recovered strong
monophyly for the six genera of Bathyergidae, and most recovered sister relationships of
(Georychus + Bathyergus) and (Cryptomys + Coetomys).

186
186
At the sub-generic level, the majority of loci recovered several of the taxa
recommended for recognition in Chapter II. Ten loci show a strong split between
populations of Heliophobius argenteocinereus separated by the Rift Valley; Kenya and
Malawi, respectively. Six loci show strong separation between Cape and eastern
populations of Georychus capensis. Ten loci recovered some of the expected species
groups within Cryptomys. Some of the major lineages (C. anselli + C. kafuensis + C.
‘Sekute’ + C. ‘Livingstone’; C. mechowii + C. darlingi; C. amatus + C. whytei)
identified in Coetomys (Fig. 2.5) were resolved by nine loci.
4.2. Combined analyses
Both the Cmech04/Gcap01/Hglab10 and complete (16 loci) datasets recovered
single trees under both MP and ML with strong nodal support (Figs. 5.17-18: CI = 0.973
and 0.972, RI = 0.868 and 0.893, respectively). The model of evolution determined for
each combination was identical (TVM+Γ), despite differences in the models estimated
for each individual partition (Table 5.1).
Identifiable indels across all sixteen loci were coded in a presence/absence matrix
that provided 20 parsimony-informative characters that recovered a single tree with the
expected generic relationships with low to moderate nodal support (CI = 0.907, RI =
0.545). Given the limited number of taxa and number of missing data in this analysis,
the results are encouraging and show promise for use in a larger dataset.

187
187
5. Conclusions
The goal of this chapter was to assess the phylogenetic utility of the
microsatellite flanking sequences (MFS) isolated for sixteen microsatellite loci from
members of the family Bathyergidae. It was not intended to generate an exhaustive
analysis of all available samples from members of this family across these loci (6212
nucleotides). The deep relationships at the generic and intergeneric levels were
recovered with very strong support (high bootstrap proportions and decay, consistency,
and retention indices). Herein, I have described a suitable method for isolating and
screening putative phylogenetic markers for use at the family level within Rodentia. The
direct sequencing applied in this method can confirm orthology of the loci and has
advantages over other types of loci that randomly sample the genome, such as RFLPs or
AFLPs (Fleischer, 1996). A number of the loci reported here amplified in all samples
tested and are suitable for more detailed studies within this family. Further optimization
of the loci, where some taxa showed difficulties in amplification, may provide additional
sequences per locus.

188
188
CHAPTER VI
SUMMARY
The purpose of this dissertation was to investigate the molecular evolution of
microsatellite DNA loci and their flanking regions (MFS) under a phylogenetic context.
I selected the endemic African family of mole-rats, Bathyergidae (Rodentia: Mammalia)
as my model. In Chapter II, I produced a robust phylogeny for the Bathyergidae based
on both mitochondrial (12S rRNA) and nuclear (Transthyretin Intron 1) DNA. The
relationships identified in this phylogeny are supported by previous studies of allozymes,
karyotypes, morphology, and DNA sequences. As a result of my findings, I proposed
the recognition of the mechowii species group of Cryptomys as the new genus Coetomys
(Ingram et al., 2004). In addition, I found support for a number of intrageneric
relationships including deep divergences between populations of Heliophobius
argenteocinereus from either side of the Rift Valley, between Cape and eastern
populations of Georychus capensis, and fine scale resolution at the species/species group
level in both Cryptomys and Coetomys.
In Chapter III, I isolated and characterized microsatellite loci from each of the six
genera for use in population genetics level studies. Cross-species application of each
locus was tested across a sample of representatives from each genus with varied success.
Few studies have examined population level genetic relationships within members of the
family and these panels of microsatellite loci will provide tools for further studies.

189
189
In Chapter IV, I further characterized the genotyping fragment of the
microsatellite loci through the amplification and sequencing of 500 – 800 bp
microsatellite flanking sequences (MFS). Direct sequencing of the microsatellite loci
revealed rampant electromorphic homoplasy, null alleles, and insertion/deletion (indel)
events in both the repeat motif and adjacent flanking region. This evidence adds to the
growing body of information regarding problems associated with the acceptance of
genotype scores from fragment analysis (Wright et al., 2004; Baliraine et al., 2003;
Culver et al., 2001; Ellegren, 2000; Angers and Bernatchez, 1997; Macaubas et al.,
1997). A number of the loci isolated were linked with various repetitive elements
(LTRs, Alu repeats, SINEs, and MIRs), which as a suite, have been characterized as rare
genomic changes (RGCs) that make robust phylogenetic characters (Springer et al.,
2004). The method applied in this chapter may be useful in identifying additional RGC
markers for phylogenetic use.
In Chapter V, I examined the phylogenetic utility of the genotyping fragments
(sans repeat element) and their associated MFS regions. Sixteen of the previously
described MFS loci were analyzed under standard phylogenetic methods (parsimony and
maximum-likelihood). In all but one of the resulting topologies, the MFS loci recovered
the expected relationships among the genera of Bathyergidae with moderate to strong
nodal support (MP and ML bootstrap proportions, and decay indices). When combined
as either: 1) loci sampling all genera (3 loci) or 2) all sixteen loci, with a reduced number
of taxa (8), the intergeneric relationships were recovered with strong nodal support.
Ninety-six identifiable indel events were coded across the genera in a presence/absence

190
190
matrix and recovered a single MP tree with weak to strong nodal support for the
intergeneric relationships.
The overall findings of this dissertation suggest that levels of cryptic variation in
microsatellite loci is not a trivial issue and should be integrated into studies, particularly
those using cross-species markers. Direct sequencing can both confirm the stability of
some microsatellites while revealing problems in others. A number of the indels present
in the genotyping fragments showed phylogenetic information and can be applied to
population genetic studies. Direct sequencing also provides a number of
phylogenetically informative characters in the form of nucleotides that show promise in
population/species level studies.

191
191
REFERENCES
Adams, J., 2001. Africa during the last 150,000 years. Available at
http://www.esd.ornl.gov/projects/qen/nercAFRICA.html Aguilar, G.H., 1993. The karyotype and taxonomic status of Cryptomys hottentotus
darlingi (Rodentia: Bathyergidae). S. Afr. J. Zool. 28, 201–204. Akaike, H., 1974. A new look at the statistical model identification. IEEE Transactions
on Automatic Control 19,716–722. Allard, M.W., Honeycutt R.L, 1992. Nucleotide sequence variation in the mitochondrial
12S rRNA gene and the phylogeny of African mole-rats (Rodentia: Bathyergidae). Mol. Biol. Evol. 9, 27–40.
Allen, G.M., 1939. A checklist of African mammals. Bull. Mus. Comp. Zool. Harvard
Coll. 83, 425–433. Altet, L., Francino, O., Sanchez A, 2001. Microsatellite polymorphism in closely related
dogs. J. Hered. 92, 276–279.
Amos, W., 1999. A comparative approach to the study of microsatellite evolution. In: Goldstein, D.B., Schlötterer, C. (Eds.), Microsatellites: Evolution and Application. Oxford University Press, New York. pp. 66–79.
Amos, W., Sawcer, S.J., Feakes, R.W., Rubensztein D.C., 1996. Microsatellites show
mutational bias and heterozygote instability. Nat. Genet. 13, 390–391.
Angers, B., Bernatchez, L., 1997. Complex evolution of a salmonid microsatellite locus and its consequences in inferring allelic divergence from size information. Mol. Biol. Evol. 14, 230–238.
Arcot, S.S., Wang, Z., Weber, J.L., Deininger, P.L., Batzer, M.A., 1995. Alu repeats: a
source for the genesis of primate microsatellites. Genomics 29, 136–144
Arévalo, E., Zhu, Y., Carpenter, J.M., Strassmann, J.E., 2004. The phylogeny of the social wasp subfamily Polistinae: evidence from microsatellite flanking sequences, mitochondrial COI sequence, and morphological characters. BMC Evol. Biol. 4:8.
Avise, J.C., 1994. Molecular Markers, Natural History and Evolution. Chapman &
Hall, New York, 551 pp.

192
192
Baliraine, F.N., Bonizzoni, M., Osir, E.O., Lux, S.A., Mulaa, F.J., Zheng, L., Gomulski, L.M., Gasperi, G., Malacrida, A.R., 2003. Comparative analysis of microsatellite loci in four fruit fly species of the genus Ceratitis (Diptera: Tephritidae). Bull. Entomol. Res. 93, 1–10.
Balloux, F., Brünner, H., Lugon-Moulin, N., Hausser, J., Goudet, J., 2000.
Microsatellites can be misleading: an empirical and simulation study. Evolution 54, 1414–1422.
Bell, G.I., Jurka, J., 1997. The length distribution of perfect dimmer repetitive DNA is
consistent with its evolution by an unbiased single-step mutation process. J. Mol. Evol. 44, 414–421.
Bennett, N.C., Faulkes, C.G., 2000. African Mole-Rats: Ecology and Eusociality.
Cambridge University Press, Cambridge, UK, 273pp. Bennett, N.C., Jarvis, J.U.M., 1988. The reproductive biology of the Cape mole-rat,
Georychus capensis (Rodentia, Bathyergidae). J. Zool. Lond. 214, 95–106. Blankenship, S.M., May, B., Hedgecock, D., 2002. Evolution of a perfect simple
sequence repeat locus in the context of its flanking sequence. Mol. Biol. Evol. 19, 1943–1951.
Bowcock, A.M., Ruiz-Linares, A., Tomfohrde, J., Minch, E., Kidd, J.R., Cavalli-Sforza,
L.L., 1994. High resolution of human evolutionary trees with polymorphic microsatellites. Nature 368, 455–457.
Braude, S., 2000. Dispersal and new colony formation in wild naked mole-rats:
evidence against inbreeding as the system of mating. Behavioral Ecology 11, 7–12.
Bremer, K., 1988. The limits of amino-acid sequence data in angiosperm phylogenetic
reconstruction. Evolution 42: 795–803. Burda, H., 2001. Determinants of the distribution and radiation of African mole-rats
(Bathyergidae, Rodentia): ecology or geography? In: Denys, C., Granjon, L., Poulet, A. (Eds.), African Small Mammals, IRD Editions, collection Colloques et seminaires, Paris, France. pp. 261–277.
Burda, H., Honeycutt, R.L., Begall, S., Grütjen, O., Scharff, A., 2000. Are naked and
common mole-rats eusocial and if so, why? Behav. Ecol. Sociobiol. 47, 293–303. Burda, H., Kawalika, M., 1993. Evolution of eusociality in the Bathyergidae: the case of
the giant mole-rat (Cryptomys mechowi). Naturwissenschaften 80, 235–237.

193
193
Burda, H., Zima, J., Scharff, A., Macholán, M., Kawalika, M., 1999. The karyotypes of
Cryptomys anselli sp. nova and Cryptomys kafuensis sp. nova: new species of the common mole-rat from Zambia (Rodentia, Bathyergidae). Z. Säugetierkd. 64, 36–50.
Burland, T.M., Bishop, J.M., O’Ryan, C., Faulkes, C.G., 2001. Microsatellite primers
for the African mole-rat genus Cryptomys and cross-species amplification within the family Bathyergidae. Mol. Ecol. Notes 1, 311–314.
Calabrese, P.P., Durrett, R.T., Aquadro, C.F., 2001. Dynamics of microsatellite
divergence under stepwise mutation and proportional slippage/point mutation models. Genetics 159, 839–852.
Capanna, E., Merani, M.S., 1980. Karyotypes of Somalian rodent populations. 1.
Heterocephalus glaber. Ruppell, 1842 (Mammalia, Rodentia). Monit. Zool. Ital. Suppl. 13, 45–52.
Causse, M. A., Fulton, T.M., Cho, Y.G., Ahn, S.N., Chunwongse, J., Wu, K., Ziao, J.,
Yu, Z., Ronald, P.C., Harrington, S.E., 1994. Saturated molecular map of the rice genome based on an interspecific backcross population. Genetics 138, 1251–1274.
Chakraborty, R., Kimmel, M., Stivers, D.N., Davidson, L.J., Deka, R., 1997. Relative
mutation rates at di-, tri-, and tetranucleotide microsatellite loci. Proc. Natl. Acad. Sci. USA 94, 1041–1046.
Chirhart, S.E., Honeycutt, R.L., Greenbaum, I.F., 2004. Microsatellite variation and
evolution in the Peromyscus maniculatus species group. Mol. Phylogenet. Evol. 34: 408–415.
Chitaukali, W.N., Burda, H., Kock, D., 2001. On small mammals of the Nyika Plateau,
Malawi. In: Denys, C., Granjon, L., Poulet, A. (Eds.). African Small Mammals IRD Editions, collection Colloques et seminaires, Paris, pp. 415–426.
Chung, M.Y., Ranum, M.P.W., Duvick, L.A., Servadio, A., Zoghbi, H.Y., Orr, H.T.,
1993. Evidence for a mechanism predisposing to intergenerational CAG repeat instability in spinocerebellar ataxia type I. Nat. Genet. 5, 254–258.
Cizsek, D., 2000. New colony formation in the “highly inbred” eusocial naked mole-rat:
outbreeding is preferred. Behav. Ecol. 11, 1–6.

194
194
Clarke, L.A., Rebelo, C.S., Gonçalves, J., Boavida, M.G., Jordan, P., 2001. PCR amplification introduces errors into mononucleotide and dinucleotide repeat sequences. Mol. Path. 54, 351–353.
Clisson, I., Lathuilliere, M., Crouau-Roy, B., 2000. Conservation and evolution of
microsatellite loci in primate taxa. Amer. J. Prim. 50, 205–214.
Colson, E., Goldstein, D.B., 1999. Evidence for complex mutations at microsatellite loci in Drosophila. Genetics 143, 617–627.
Cooper, G., Rubinsztein, D.C., Amos, W., 1998. Ascertainment bias cannot entirely
account for human microsatellites being longer than their chimpanzee homologues. Human Molec. Genet. 7: 1425–1429.
Crawford, A. M., S. M. Kappes, K. A. Paterson, M. J. DeGotari, K. G. Dodds, B. A.
Freking, R. T. Stone, Beattie, C. W., 1998. Microsatellite evolution: testing the ascertainment bias hypothesis. J. Mol. Evol. 46, 256–260.
Crozier, R.H., Kaufmann, B., Carew, M.E., Crozier, Y.C., 1999. Mutability of
microsatellites developed for the ant Camponotus consobrinus. Mol. Ecol. 8, 271–276.
Crow, J.F., 1986. Basic Concepts in Population, Quantitative, and Evolutionary
Genetics. W.H. Freeman, New York, 273 pp. Crow, J.F. , Kimura, M. 1970. An Introduction to Population Genetics Theory. Harper
and Row, New York, 591 pp.
Culver, M., Menotti-Raymond, M.A., O’Brien, S.J., 2001. Patterns of size homoplasy at 10 microsatellite loci in pumas (Puma concolor). Mol. Biol. Evol. 18, 1151–1156.
Davies, K.C., Jarvis, J.U.M., 1986. The burrow systems and burrowing dynamics of the
mole-rats Bathyergus suillus and Cryptomys hottentotus in the fynbos of the south-western Cape, South Africa. J. Zool. 209, 125–147.
de Jong, W.W., van Dijk, M.A.M., Poux, C., Kappé, G., van Rheede, T., Madsen, O.,
2003. Indels in protein-coding sequences of Euarchontoglires constrain the rooting of the eutherian tree. Mol. Phylogenet. Evol. 28, 328–340
DeGraaff, G., 1964. A systematic revision of the Bathyergidae (Rodentia) of Southern
Africa. Ph.D. dissertation, University of Pretoria, South Africa.

195
195
DeGraaff, G., 1981. The Rodents of Southern Africa. Butterworths, Durban, South Africa.
Deka, R., Shriver, M.D., Yu, L.M., Ferrell, R.E., Chakraborty, R., 1995. Intra- and
interpopulation diversity at short tandem repeat loci in diverse populations of the world. Electrophoresis 16, 1659–1664.
Denys, C., Jaeger, J.-J., 1992. Rodents of the Miocene site of Fort Ternan (Kenya). First
part: Phiomyids, bathyergids, sciurids and anomalurids. Neues Jahrb. Geol. P.-A. 185, 63–84.
Dib, C., Raure, S., Fizames, C., Samson, D., Drouot, N., Vignal, A., Millasseau, P.,
Marc, S., Hazan, J., Seboun, E., Lathrop, M., Gyapay, G., Morissete, J., Weissenbach, J., 1996. A comprehensive genetic map of the human genome based on 5,264 microsatellites. Nature 380, 152–154.
Dietrich, W.F., Miller, J., Steen, R., Merchant, M.A., Damron-Boles, D., Husain, Z.,
Dredge, R., Daly, M.J., Ingalls, K.A., O'Connor, T.J., 1996. A comprehensive genetic map of the mouse genome. Nature 380, 152–154.
Di Rienzo, A., Peterson, A.C., Garza, J.C., Valdes, A.M., Slatkin, M., Freimer, M.B.,
1994. Mutational processes of single-sequence repeat loci in human populations. Proc. Natl. Acad. Sci. USA 91, 3166–3170.
Eckert, K.A., Mowery, A., Hile, S.E., 2002. Misalignment-mediated DNA polymerase
beta mutations: comparison of microsatellite and frame-shift error rates using a forward mutation assay. Biochemistry 41, 10490–10498.
Edwards, A., Civitello, A., Hammond, H.A., Caskey, C.T., 1991. DNA typing and
genetic mapping with trimeric and tetrameric tandem repeats. Am. J. Hum. Genet. 49,746–756.
Edwards, A., Hammond, H.A., Jin, L., Caskey, C.T., Chakraborty, R., 1992. Genetic
variation at five trimeric and tetrameric tandem repeat loci in four human populations. Proc. Natl. Acad. Sci. USA 91, 3166–3170.
El Nahas, E. M., de Hondt, H.A., Womack, J.E., 2001. Current status of the river
buffalo (Bubalus bubalus L.) gene map. J. Heredity 92, 221–225. Ellegren, H., 2000. Microsatellite mutations in the germline; implications for
evolutionary inference. Trends in Genet. 16, 551–558.

196
196
Ellegren, H., Moore, S., Robinson, N., Byrne, K., Ward, W., Sheldon, B.C., 1997. Microsatellite evolution — a reciprocal study of repeat lengths at homologous loci in cattle and sheep. Mol. Biol. Evol. 14, 854–860.
Ellegren, H., Primmer, C.R., Sheldon, B.C. 1995. Microsatellite “evolution”:
directionality or bias? Nat. Genet. 11, 360–362.
Ellerman, J.R., Hayman, R.W., Holt, G.W.C., 1940. The families and genera of living Rodents. The Trustees of the British Museum (Natural History) London 1, 79–95.
Estoup, A., Cornuet, J.-M., 1999. Microsatellite evolution: inferences from population
data. In: Goldstein, D.B., Schlötterer, C. (Eds.), Microsatellites: Evolution and Application. Oxford University Press, New York, pp 49–65.
Estoup, A., Tailliez, C., Cornuet, J.-M., Solignac, M., 1995. Size homoplasy and
mutational processes of interrupted microsatellites in two bee species, Apis mellifera and Bombus terrestris (Apidae). Mol. Biol. Evol. 12, 1074–1084.
Farris, J.S., 1969. A successive approximations approach to character weighting. Syst.
Zool. 18, 374–385. Farris, J.S., 1989. The retention index and homoplasy excess. Syst. Zool. 38, 406–407. Farris, J.S., Kallersjo, M., Kluge, A.G., Bult, C., 1995. Testing significance of
incongruence. Cladistics 10, 315–320. Faulkes, C.G., Abbott, D.H., Mellor, A.L., 1990. Investigation of genetic diversity in
wild colonies of naked mole-rats (Heterocephalus glaber) by DNA fingerprinting. J. Zool. 221, 87–97.
Faulkes, C.G., Bennett, N.C., Bruford, M.W., O’Brien, H.P., Aguilar, G.H., Jarvis,
J.U.M., 1997. Ecological constraints drive social evolution in the African mole-rats. Proc. R. Soc. Lond. B. Biol. Sci. 264, 1619–1627.
Faulkes, C.G., Verheyen, E., Verheyen, W., Jarvis, J.U.M., Bennett N.C., 2004.
Phylogeographical patterns of genetic divergence and speciation in African mole-rats (Family: Bathyergidae). Mol. Ecol. 13, 613–29.
Feldman, M.W., Bergman, A., Pollock, D.D., Goldstein, D.B., 1997. Microsatellite
genetic distances with range constraints – analytic description and problems of estimation. Genetics 145, 207–216.

197
197
Felsenstein, J., 1985. Confidence limits on phylogenies: an approach using the bootstrap. Evolution 39, 783–791.
Filippucci, M.G., Burda, H., Nevo, E., Kocka, J., 1994. Allozyme divergence and
systematics of common mole-rats (Cryptomys, Bathyergidae, Rodentia) from Zambia. Z. Säugetierkd. 59, 42–51.
Filippucci, M.G., Kawalika, M., Macholán, M., Scharff, A., Burda, H., 1997. Allozyme
differentiation and taxonomic status of Zambian giant mole-rats, Cryptomys mechowi (Bathyergidae, Rodentia). Z. Säugetierkd. 62, 172–178.
Fitzsimmons, N.N., Moritz, C., Moore, S.S., 1995. Conservation and dynamics of
microsatellite loci over 300 million years of marine turtle evolution. Mol. Biol. Evol. 12, 432–440.
Fleischer, R.C., 1996. Application of molecular methods to the assessment of genetic
mating systems in vertebrates. In: Ferraris, J.D., Palumbi, S.R. (Eds.), Molecular Zoology: Advances, Strategies, and Protocols. Wiley-Liss, New York, pp. 133–161.
Forbes, S.H., Hogg, J.T., Buchanan, F.C., Crawford, A.M., Allendorf, F.W., 1995.
Microsatellite evolution in congeneric mammals: domestic and bighorn sheep. Mol. Biol. Evol. 12, 1106–1113.
Freeman, S., Herron, J.C., 1998. Evolutionary Analysis. Prentice-Hall, Englewood
Cliffs, NJ. Gardner, M.G., Bull, C.M., Cooper, S.J.B., Duffield, G.A., 2000. Microsatellite
mutations in litters of the Australian lizard, Egernia stokessi. J. Evol. Biol. 13, 551–560.
Garza, J.C., Slatkin, M., Freimer, N.B., 1995. Microsatellite allele frequencies in
humans and chimpanzees, with implications for constraints on allele size. Mol. Biol. Evol 12, 594–603.
George, W., 1979. Conservatism in the karyotypes of two African mole-rats (Rodentia,
Bathyergidae). Z. Säugetierkd. 44, 278–285. Gertsch, P., Pamilo, P., Varvio, S.-L., 1995. Microsatellites reveal high genetic diversity
within colonies of Camponotus ants. Mol. Ecol. 4, 257–260. Glaubitz, J.C., 2004. Convert: a user-friendly program to reformat diploid genotypic
data for commonly used population genetic software packages. Mol. Ecol. Notes 4, 309.

198
198
Glenn, T.C., Staton, J.L., Vu, A.T., Davis, L.M., Bremer, J.R., Rhodes, W.E., Brisbin, I.L., Jr., Sawyer, R.H., 2002. Low mitochondrial DNA variation among American alligators and a novel non-coding region in crocodilians. J. Exp. Zool. 294, 312–24.
Glenn, T.C., Stephan, W., Dessauer, H.C., Braun, M.J., 1996. Allelic diversity in
alligator microsatellite loci is negatively correlated with GC content of flanking sequences and evolutionary conservation of PCR amplifiability. Mol. Biol. Evol. 13, 1151–1154.
Goodfellow, P.N., 1993. Viewpoint: microsatellites and the new genetic maps. Curr.
Biol. 3, 149–151.
Goldstein, D.B., Pollack, D.D., 1994. Least squares estimation of molecular distance – noise abatement in phylogenetic reconstruction. Theor. Popul. Biol. 45, 219–226.
Goldstein, D.B., Ruiz Linares, A., Cavalli-Sforza, L.L., Feldman, M.W., 1995a. Genetic
absolute dating based on microsatellites and the origin of modern humans. Proc. Nat. Acad. Sci. USA 92, 6723–6727.
Goldstein, D.B., Ruiz Linares, A., Cavalli-Sforza, L.L., Feldman, M.W., 1995b. An
evaluation of genetic distances for use with microsatellite loci. Genetics 139, 463–471.
Grubb, P., Sandrock, O., Kullmer, O., Kaiser, T.M., Schrenk, F., 1999. Relationships
between Eastern and Southern African mammal faunas. In : Bromage, T.G., Schrenk F. (Eds.), African Biogeography, Climate Change, and Human Evolution. Oxford University Press, New York, pp. 253–267.
Harr, B., Zangerl, B., Schlötterer, C., 2000. Removal of microsatellite interruptions by
DNA replication slippage: phylogenetic evidence from Drosophila. Mol. Bio. Evol. 17, 1001–1009.
Hasagawa, M., Kishino, H., Yano, T., 1985. Dating the human-ape splitting by a
molecular clock of mitochondrial DNA. J. Mol. Evol. 21, 160–174. Hedrick, P.W., 1999. Highly variable loci and their interpretation in evolution and
conservation. Evolution 53, 313–318. Honeycutt, R. L., Allard, M.W., Edwards, S.V., Schlitter, D.A., 1991. Systematics and
evolution of the family Bathyergidae. In: Sherman, P.W., Jarvis, J.U.M., Alexander, R.D. (Eds.), The Biology of the Naked Mole-Rat. Princeton University Press, Princeton, NJ, pp. 45–65.

199
199
Honeycutt, R.L., Edwards, S.V., Nelson, K., Nevo, E. 1987. Mitochondrial DNA variation and the phylogeny of African mole rats (Rodentia: Bathyergidae). Syst. Zool. 36, 280–292.
Honeycutt, R.L., Nelson, K., Schlitter, D.A., Sherman, P.W., 1991. Genetic variation
within and among populations of the naked mole-rat: evidence from nuclear and mitochondrial genomes. In: Sherman, P.W., Jarvis, J.U.M., Alexander, R.D. (Eds.), The Biology of the Naked Mole-Rat, Princeton University Press, Princeton, NJ, pp. 195–208.
Huchon, D., Douzery, E.J., 2001. From the Old World to the New World: a molecular
chronicle of the phylogeny and biogeography of hystricognath rodents. Mol. Phylogenet. Evol. 20, 238–251.
Huelsenbeck, J., Ronquist, F., 2001. MrBayes: Bayesian inference of phylogenetic trees.
Bioinformatics 17, 754–755. Hutter, C.M., Schug, M.D., Aquadro, C.F., 1998. Microsatellite variation in Drosophila
melanogaster and Drosophila simulans: a reciprocal test of the ascertainment bias hypothesis. Mol. Biol. Evol. 12, 1620–1636.
Ingram, C.M., Burda, H., Honeycutt, R.L., 2004. Molecular phylogenetics and
taxonomy of the African mole-rats, genus Cryptomys and the new genus Coetomys Gray, 1864. Mol. Phylogenet. Evol. 31, 997–1014.
Janecek, L.L., Honeycutt, R.L., Tautenbach, I.L., Erasmus, B.H., Reig, S., Schlitter, D.A., 1992. Allozyme variation and systematics of African mole-rats (Rodentia: Bathyergidae). Biochem. Syst. Ecol. 60, 401–416.
Jarvis, J.U.M., 1981. Eusociality in a mammal – cooperative breeding in naked mole-rat
Heterocephalus glaber colonies. Science 212, 571–573. Jarvis, J.U.M., Bennett, N.C., 1991. Ecology and behavior of the family Bathyergidae.
In: Sherman, P.W., Jarvis, J.U.M., Alexander, R.D. (Eds.), The Biology of the Naked Mole-Rat. Princeton University Press, Princeton, NJ, pp. 66–96.
Jarvis, J.U.M., Bennett, N.C., 1993. Eusociality has evolved independently in two
genera of bathyergid mole-rats – but occurs in no other subterranean mammal. Behav. Ecol. Sociobiol. 33, 253–260.
Jarvis, J.U.M., O'Riain, M.J., Bennett, N.C., Sherman, P.W., 1994. Mammalian
eusociality: a family affair. Trends Ecol. Evol. 9, 47–51. Jin, L., Macaubas, C., Hallmayer, J., Kimura, A., Mignot, E., 1996. Mutation rate varies

200
200
among alleles at a microsatellite locus – phylogenetic evidence. Proc. Natl. Acad. Sci. USA 93, 15285–15288.
Jordan, P.W., Goodman, A.E., Donnellan, S. 2002. Microsatellite primers for
Australian and New Guinean pythons isolated with an efficient marker development method for related species. Mol. Ecol. Notes 2, 78–82.
Karhu, A., Dieterich, J.-H., Savolainen, 2000. Rapid expansion of microsatellite
sequences in pines. Mol. Biol. Evol. 17, 259–265.
Kawalika, M., Burda, H., Brüggert, D., 2001. Was Zambia a cradle of the genus Cryptomys (Bathyergidae, Rodentia)? A further new ancestral (?) species of Cryptomys from Zambia. In: Denys C., Granjon L., Poulet A. (Eds.), African Small Mammals. IRD Editions, collection Colloques et seminaires, Paris, pp. 253–261.
Kim, K.-S., Min, M.-S., An, J.-H., Lee, H., 2004. Cross-species amplification of
Bovidae microsatellites and low diversity of the endangered Korean goral. J. Hered. 95, 521–525.
Kimmel, M., Chakraborty, R., King, J.P., Bamshad, M., Watkins, W.S., Jorde, L.B.,
1998. Signature of population expansion in microsatellite repeat data. Genetics 148, 1921–1930.
Kimura, M., 1980. A simple method for estimating evolutionary rate of base
substitutions through comparative studies of nucleotide sequences. J. Mol. Evol. 16, 111–120.
Kimura, M., Crow, J.F., 1964. The number of alleles that can be maintained in a finite
population. Genetics 49, 725–738.
Kimura, M., Ohta, T., 1978. Stepwise mutation model and distribution of allelic frequencies in a finite population. Proc. Natl. Acad. Sci. USA 75, 2868–2872.
Krawczak, M., Cooper, D.N., 1991. Gene deletions causing human genetic disease:
Mechanism of mutagenesis and the role of the local DNA sequence environment. Hum. Genet. 86, 425–441.
Lacey, E., Patton, J.L., Cameron, G.N., 2000. Life Underground: The Biology of
Subterranean Rodents. University of Chicago Press, Chicago. Lavocat, R., 1973. Les rongeurs du miocène d'Afrique orientale. I. Miocène inférieur,
Mém. Trav. E.O.H.E. Institut de Montpellier. 1: 1–284.

201
201
Lavocat, R., 1978. Rodentia and Lagomorpha . In : Maglio, V., Cooke, H.V. (Eds.), Evolution of African Mammals. Harvard Univ Press, Cambridge, MA, pp. 69–89.
Lavocat, R., 1988. Un rongeur bathyergidé nouveau remarquable du Miocène de Fort
Ternan (Kenya). C. R. Acad. Sci. Paris 306, 1301–1304. Levinson, G., Gutman, G.A., 1987. Slipped-strand mispairing: a major mechanism for
DNA sequence evolution. Mol. Biol. Evol. 4, 203–221.
Lovegrove, B.G., 1986. Thermoregulation of the subterranean rodent genus Bathergus (Bathyergidae). S. Afr. J. Zool. 21, 283–288.
Luikart, G.L., Sherwin, W.B., Steele, B.M., Allendorf, F.W., 1998a. Usefulness of
molecular markers for detecting population bottlenecks via monitoring genetic change. Mol. Ecol. 7, 963–974.
Luikart, G.L., Sherwin, W.B., Steele, B.M., Allendorf, F.W., 1998b. Distortion of allele
frequency distributions provides a test for recent population bottlenecks. J. Hered. 89, 238–247.
Macaubas, C., Jin, L., Hallmayer, J., Kimura, A., Mignot, E., 1997. The complex
mutation pattern of a microsatellite. Genome Res. 7, 635–641.
Macholán, M., Burda, H., Zima, J., Misek, I., Kawalika, M., 1993. Karyotype of the giant mole-rat, Cryptomys mechowi (Bathyergidae, Rodentia). Cytogenet. Cell Genet. 64, 261–263.
Macholán, M., Burda, H., Zima, J., Misek, I., Kawalika, M., 1998. A new karyotype of
a common mole-rat and taxonomical status of Cryptomys amatus from Zambia. Z. Säugetierkd 63, 186–190.
Maddison, D.R., Maddison, W.P., 2002. MacClade 4: Analysis of Phylogeny and
Character Evolution. Version 4.0. Sinauer Associates, Sunderland, MA. Matthee, C. A., Burzlaff, J. D., Taylor, J. F., Davis, S. K., 2001. Mining the mammalian
genome for artiodactyl systematics. Syst. Biol. 50, 367–90. Maudet, C., Miller, C., Bassano, B., Breitenmoser-Wursten, C., Gauthier, D., Obexer-
Ruff, G., Michallet, J., Taberlet, P. Luikart, G., 2002. Microsatellite DNA and recent statistical methods in wildlife conservation management: applications in Alpine ibex (Capra ibex ( ibex)). Molec. Ecol. 11, 421–436.

202
202
McKenna, M. C., Bell, S.K., Simpson, G.G., 1998. Classification of Mammals Above the Species Level. Columbia University Press, New York.
Meier, J.-L., 2001. Diversität und Artbildung der Graumulle (Cryptomys, Bathyergidae)
entlang des oberen Sambesi. M.Sc. Dissertation, University of Essen, Germany. Michalakis, Y., Excoffier, L., 1996. A genetic estimation of population subdivision
using distances between alleles with special reference for microsatellite loci. Genetics 142, 1061–1064.
Moore, S. S., Sargeant, L.L., King, T.J., Mattick, J.S., Georges, M., Hetzel, J.S., 1991.
The conservation of di-nucleotide microsatellites among mammalian genomes allows the use of heterologous PCR primer pairs in closely related species. Genomics 10, 654–660.
Murphy, W., Eizirik, E., Johnson, W.E., Zhang, Y.P., Ryder, E.O., O'Brien, S.J., 2001.
Molecular phylogenetics and the origins of placental mammals. Nature 409, 614–618.
Nedbal, M.A., Allard, M.W., Honeycutt, R.L., 1994. Molecular systematics of
hystricognath rodent: evidence from the mitochondrial 12S rRNA gene. Mol. Phylogenet. Evol. 3, 206–220.
Nevo, E., 1999. Mosaic Evolution of Subterranean Mammals: Regression, Progression
and Global Convergence. Oxford University Press, Oxford, UK. Nevo, E., Ben-Shlomo, R., Beiles, A., Jarvis, J.U.M., Hickman, G.C., 1987. Allozyme
differentiation and systematics of the endemic subterranean mole rats of South Africa. Biochem. Syst. Ecol. 15, 489–502.
Nevo, E., Capanna, E., Corti, M., Jarvis, J.U.M., Hickman, G.C., 1986. Karyotype
differentiation in the endemic subterranean mole-rats of South Africa (Rodentia, Bathyergidae). Z. Säugetierkd. 51, 36–49.
Nevo, E., Filippucci, M.G., Beiles, A., 1990. Genetic diversity and its ecological
correlates in nature: comparisons between subterranean, fossorial, and above ground small mammals. In: Nevo, E., Reig, O.A. (Eds.), Evolution of Subterranean Mammals at the Organismal and Molecular Levels. Wiley-Liss, New York. pp. 347–366.
Nevo, E., Reig, O.A. (eds.), 1990. Evolution of Subterranean Mammals at the
Organismal and Molecular Levels. Wiley-Liss, New York.

203
203
Nowak, R. M., 1999. Walker's Mammals of the World, Volume II, Sixth Edition. Johns Hopkins University Press, Baltimore, pp. 1635–1644.
Ohta, T., Kimura, M., 1973. A model of mutation appropriate to estimate the number of
electrophoretically detectable alleles in a finite population. Genet. Res. 22, 201–204.
Okada, N., 1991. SINEs: short interspersed tepeated elements of the eukaryotic genome.
Trends Ecol. Evol. 6, 358–361. Omlin, F.X., 1997. Optic disc and optic nerve of the blind Cape mole-rat (Georychus
capensis): a proposed model for naturally occurring reactive gliosis. Brain Res. Bull. 44, 627–632.
Oosthuizen, M.K., Cooper, H.M., Bennett, N.C., 2003. Circadian rhythms of locomotor
activity in solitary and social species of African mole-rats (Family: Bathyergidae). J. Biol. Rhythm. 18, 481–490.
Ortí, G., Pearse, D.E., Avise, J.C., 1997. Phylogenetic assessment of length variation at
a microsatellite locus. Proc. Natl. Acad. Sci. USA 94, 10745–10749. O’Ryan, C., Harley, E.H., Bruford, M.W., Beaumont, M.A., Wayne, R.K., Cherry, M.I.,
1998. Microsatellite analysis of genetic diversity in fragmented South African buffalo (Syncerus caffer) populations. Anim. Conserv. 1, 85–95.
Paetkau, D., Calvert, W., Stirling, I., Strobeck, C., 1995. Microsatellite analysis of
population structure in Canadian polar bears. Mol. Ecol. 4, 347–354. Pemberton, J.M., Slate, J., Bancroft, D.R., Barrett, J.A., 1995. Non-amplifying alleles at
microsatellite loci: a caution for parentage and population studies. Mol. Ecol. 4, 249–25.
Posada, D., Crandall, K.A., 1998. MODELTEST: testing the model of DNA
substitution. Bioinformatics 14, 817–818. Primmer, C.R., Ellegren, H., 1998. Patterns of molecular evolution in avian
microsatellites. Mol. Biol. Evol. 15, 997–1008. Primmer, C.R., Ellegren, H., Saino, N., Møller, A.P., 1996a. Directional evolution in
germline microsatellite mutations. Nat. Genet.13, 391–393.
Primmer, C.R., Møller, A., Ellegren, H., 1996b. A wide-range survey of cross-species microsatellite amplification in birds. Mol. Ecol. 5, 365–378.

204
204
Primmer, C.R., Saino, N., Møller, A.P., Ellegren, H., 1998. Unraveling the processes of microsatellite evolution through analysis of germ line mutations in barn swallows Hirundo rustica. Mol. Biol. Evol. 15, 1047–1054.
Queller, D.C., Strassmann, J.E., Hughes, C.R., 1993. Microsatellites and kinship. Trends
Ecol. Evol. 8, 285–288. Raymond, M., Rousset, F., 1995. GENEPOP Version 1.2: population genetics software
for exact tests and ecumenicism. J. Hered. 86, 248–249. Reeve, H.K., Westneat, D.F., Noon, W.A., Sherman, P.W., Aquadro, C.F., 1990. DNA
“fingerprinting” reveals high levels of inbreeding in colonies of the eusocial naked mole-rat. Proc. Natl. Acad. Sci. USA 87, 2496–2500.
Roberts, A., 1951. The Mammals of South Africa. Trustees of the “Mammals of South
Africa” Book Fund, Johannesburg. Rokas A., Holland, P.W., 2000. Rare genomic changes as a tool for phylogenetics.
Trends Ecol. Evol. 15, 454-459. Rooney, A.P., Honeycutt, R.L., Davis, S.K., Derr, J.N., 1999. Evaluating a putative
bottleneck in a population of bowhead whales from patterns of microsatellite diversity and genetic disequilibria. J. Mol. Biol. 48, 682–690.
Roper, T.J., Bennett, N.C., Conradt, L., Molteno, A.J., 2001. Environmental conditions
in burrows of two species of African mole-rat, Georychus capensis and Cryptomys damarensis. J. Zool. 254, 101–107.
Rosevear, D.R., 1969. The Rodents of West Africa. Trustees of the British Museum (Natural History), London.
Roy, M.S., Geffen, E., Smith, D., Ostrander, E.A., Wayne, R.K., 1994. Patterns of
differentiation and hybridization in North American wolflike canids, revealed by analysis of microsatellite loci. Mol. Biol. Evol. 11, 553–570.
Roy, M.S., Geffen, E., Smith, D., Wayne, R.K., 1996. Molecular of pre-1940 red
wolves. Conserv. Biol. 10, 1413–1424. Rubinsztein, D.C., Amos, W., Leggo, J., Goodburn, S., Jain, S., Li, S.-H., Margolis,
R.L., Ross, C.A., Ferguson-Smith, M.A., 1995. Microsatellite evolution – evidence for directionality and variation in rate between species. Nat. Genet. 10, 337–343.

205
205
Sanderson, M.J., 2003. r8s: inferring absolute rates of molecular evolution and divergence times in the absence of a molecular clock. Bioinformatics 19, 301–302.
Schlötterer, C., 2001. Genealogical inference of closely related species based on
microsatellites. Genet. Res. 78, 209–212.
Schlötterer, C., Tautz, D., 1992. Slippage synthesis of simple sequence DNA. Nuc. Acids Res. 20, 211–215.
Scharff, V.A., Macholán, M., Zima, J., Burda, H., 2001. A new karyotype of
Heliophobius argenteocinereus (Bathyergidae, Rodentia) from Zambia with field notes on the species. Mamm. Biol. 66, 376–378.
Schug, M.D., Hutter, C.M., Wetterstrand, K.A., Gaudette, M.S., Mackay, T.R.C.,
Aquadro, C.F., 1998. The mutation rates of di-, tri-, and tetranucleotide repeats in Drosophila melanogaster. Mol. Biol. Evol. 15, 1751–1760
Shao, Z., Lek, S., Chang, J., 2005. Complex mutation at a microsatellite locus in
sturgeons: Acipenser sinensis, A. schrenckii, A. gueldenstaedtii, and A. baerii. J. Applied Ichth. 21, 2–7.
Sherman, P.W., Jarvis, J.U.M., Alexander, R.D., 1991. The Biology of the Naked Mole-
Rat. Princeton University Press, Princeton, NJ, 518 pp. Shriver, M.D., Jin, L., Chakraborty, R., Boerwinkle, E., 1993. VNTR allele frequency
distributions under the stepwise mutation model. Genetics 134, 983–993. Shimodaira, H., Hasagawa, M., 1999. Multiple comparisons of log-likelihoods with
applications to phylogenetic inference. Mol. Biol. Evol. 16, 1114–1116. Sibley, R.M., Meade, A., Boxall, N., Wilkinson, M.J., Corne, D.W., Whittaker, J.C.,
2003. The structure of interrupted human AC microsatellites. Mol. Biol. Evol. 20, 453–459.
Slatkin, M., 1995. A measure of population subdivision based on microsatellite allele
frequencies. Genetics 139, 457–462. Smit, A.F.A., Hubley, R., Green, P., 2004. RepeatMasker Open–3.0. Available at
http://www.repeatmasker.org. Smith, M.F., 1998. Phylogenetic relationships and geographic structure in pocket
gophers in the genus Thomomys. Mol. Phylogenet. Evol. 9, 1–14.
206
206
Sorenson, M.D., 1999. TreeRot, version 2. Boston University, Boston, MA. Springer, M.S., Douzery, E., 1996. Secondary structure and patterns of evolution among
mammalian mitochondrial 12S rRNA molecules. J. Mol. Evol. 43, 357–73. Springer, M.S., Stanhope, M.J., Madsen, O., de Jong, W.W., 2004. Molecules
consolidate the placental mammal tree. Trends Ecol. Evol. 19, 430–438.
Strand, M.T., Prolla, A., Liskay, R.M., Petes, T.D., 1993. Destabilization of tracts of simple repetitive DNA in yeast by mutations affecting DNA mismatch repair. Nature 365, 274–276.
Streisinger, G., Okada, Y., Emrich, J., Newton, J., Tsugita, A., Terzaghi, E., Inouye, M.,
1966. Frameshift mutations and the genetic code. Cold Spring Harbor Symposium on Quantitative Biology 31, 77–84.
Su, X.Z., Willems, T.E., 1996. Towards a high-resolution Plasmodium falciparum
linkage map-polymorphic markers from hundreds of simple sequence repeats. Genomics 33, 431–444.
Sudman, P.D., Hafner, M.S., 1992. Phylogenetic relationships among middle American
pocket gophers (genus Orthogeomys) based on mitochondrial DNA sequences. Mol. Phylogenet. Evol. 1, 17–25.
Sullivan, J., Swofford, D.L., 1997. Are guinea pigs rodents? The importance of
adequate models in molecular phylogenetics. J. Mamm. Evol. 4, 77–86. Sumbera, R., Burda, H., Chitaukali, W.N., Kubova, J., 2003. Silvery mole-rats
(Heliophobius argenteocinereus, Bathyergidae) change their burrow architecture seasonally. Naturwissenschaften 90, 370–373.
Sunnucks, P., 2000. Efficient genetic markers for population biology. Trends Ecol.
Evol. 15, 199–203. Swofford, D.L., 2002. PAUP*. Phylogenetic Analysis Using Parsimony (*and Other
Methods). Version 4. Sinauer Associates, Sunderland, MA. Synmonds, V.V., Lloyd, A.M., 2003. An analysis of microsatellite loci in Arabidopsis
thaliana: mutational dynamics and application. Genetics 165, 1475–1488. Tajima, F., 1993a. Unbiased estimation of evolutionary distance between nucleotide-
sequences. Mol. Biol. Evol. 10, 677–688.

207
207
Tajima, F., 1993b. Simple methods for testing the molecular evolutionary clock hypothesis. Genetics 135, 599–607.
Takahashi, K, Okada, N., 2002. Mosaic structure and retropositional dynamics during
evolution of subfamilies of short interspersed elements of African cichlids. Mol. Biol. Evol. 19, 1303–1312.
Takazaki, N., Nei, M., 1996. Genetic distances and reconstruction of phylogenetic trees
from microsatellite DNA. Genetics 144, 389–399. Tautz, D., 1993. Notes on the definition and nomenclature of tandemly repetitive DNA
sequences. In: Pena, S.D.J., Chakraborty, R., Epplen, J.T., Jeffreys, A.J. (Eds.), DNA Fingerprinting: State of the Science. Birkauser, Basel. pp. 21–28.
Tavaré, S., 1986. Some probabilistic and statistical problems in the analysis of DNA
sequences. Lect. Notes Math. Life Sci. 17, 57–86. Taylor, A.C., Sherwin, W.B., Wayne, R.K., 1994. Genetic variation of microsatellite
loci in bottlenecked species: the northern hairy-nosed wombat (Lasiorhinus krefftii). Mol. Ecol. 3, 277–290.
Tenora, F., Baru, V., Proke, M., Sumbera, R., Koubkov, B., 2003. Helminths
parasitizing the silvery mole-rat, Heliophobius argenteocinereus (Rodentia: Bathyergidae) from Malawi. Helminthologia 40, 153–160.
Thomas, D.S.G., Shaw, P.A., 1988. Late Cainozoic drainage evolution in the Zambezi
basin: geomorphological evidence from the Kalahari rim. J. Afr. Earth Sci. 7, 611–618.
Thomas, O., 1910. List of mammals from Mount Kilimanjaro, obtained by Mr. Robin
Kemp, and presented to the British Museum by Mr. C. D. Rudd. Ann. Mag. Nat. Hist. 8, 303–316.
Thompson, J.D., Gibson, T.J., Plewniak, F., Jeanmougin, F., Higgins, D.G., 1997. The
CLUSTAL X windows interface: flexible strategies for multiple sequence alignment aided by quality analysis tools. Nuc. Acids Res. 25, 403–405.
Trarbach, E.B., Monlleo, I.L., Porciuncula, C.G.G., Fontes, M.I.B., Baptista, M.T.M.,
Hackel, C., 2004. Similar interstitial deletions of the KAL-1 gene in two Brazilian families with X-linked Kallmann Syndrome. Genet. Molec. Biol. 27, 337–341.
Tsuzuki, T., Mita, S., Maeda, S., Aracki, S., Shimada, K., 1985. Structure of the human
prealbumin gene. J. Biol. Chem. 260, 2224–2227.

208
208
Valdes, A.M., Slatkin, M., Freimer, N.B., 1993. Allele frequencies at microsatellite loci:
the stepwise mutation model revisited. Genetics 133: 737–749.
van Oppen, M.J.H., Rico, C., Turner, G.F., Hewitt, G.M., 2000. Extensive homoplasy, nonstepwise mutations, and shared ancestral polymorphism at a complex microsatellite locus in Lake Malawi Cichlids. Mol. Biol. Evol. 17, 489–498.
Walton, A.H., Nedbal, M.A., Honeycutt, R.L., 2000. Evidence from intron 1 of the
nuclear transthyretin (Prealbumin) gene for the phylogeny of African mole-rats (Bathyergidae). Mol. Phylogenet. Evol. 16, 467–474.
Wang, R., Zheng, L., Toure, Y.T., Dandekar, T., Kafatos, F.C., 2001. When genetic
distance matters: measuring genetic differentiation at microsatellite loci in whole-genome scans of recent and incipient mosquito species. Proc. Natl. Acad. Sci. USA 98, 10769–10774.
Weber, J.L., 1990. Informativeness of human (dC-dA)n · (dG-dT) polymorphisms.
Genomics 7, 524–530.
Weber, J.L., May, P.E., 1989. Abundant class of human DNA polymorhisms which can be typed using the polymerase chain reaction. Am. J. Hum. Genet. 44, 388–396.
Weber, J.L., Wong,C., 1993. Mutation of human short tandem repeats. Hum. Mol.
Genet. 2, 1123–1128.
White, F., 1983. The Vegetation of Africa. UNESCO, Paris. Wilder, J., Hollocher, H., 2001. Mobile elements and the genesis of microsatellites in
dipterans. Mol. Biol. Evol. 18: 384–392. Williams, S.L., Schlitter, D.A., Robbins, L.W., 1983. Morphological variation in a
natural population of Cryptomys (Rodentia, Bathyergidae) from Cameroon. Ann. Mus. Roy. Afr. Centr. Sc. Zool. 237, 159–172.
Wright, T.F., Johns, P.M., Walters, Walters, J.R., Lerner, A.P., Swallow, J.G.,
Wilkinson, G.S., 2004. Microsatellite variation among divergent populations of stalk-eyed flies, genus Cyrtodiopsis. Genet. Res. Camb. 84, 27-40.
Yang, Z., 1994. Estimating the pattern of nucleotide substitution. J. Mol. Evol. 39, 105–
111. Yeh, F.C., Boyle, T.J.B., 1997. Population genetic analysis of co-dominant and
dominant markers and quantitative traits. Belg. J. Bot. 129, 157.

209
209
Zardoya, R., Vollmer, D.M., Craddock, C., Streelman, J.R., Karl, S., Meyer, A., 1996.
Evolutionary conservation of microsatellite flanking regions and their use in resolving the phylogeny of cichlid fishes (Pisces: Perciformes). Proc. R. Soc. Lond. B Biol. Sci. 263, 1589–1598.
Zhivotovsky, L.A., Feldman, M.W., 1995. Microsatellite variability and genetic
distances. Proc. Natl. Acad. Sci. USA 92, 11549–11552. Zhu, Y., Queller, D.C., Strassman, J.E., 2000. A phylogenetic perspective on sequence
evolution in microsatellite loci. J. Mol. Evol. 50: 324–338.

210
APPENDIX
No. Species Locality Coordinates Sourceb 12S rRNA TTR
Petromus typicus SAa: Cape Province, Farm Riemvasmaak H550 M63571 AF159313
Thyronomys swinderianus SA: Kwazulu-Natal, Durban Colony H571 M63570 AF159312
1 Heterocephalus glaber Kenya: Machakos District, 8 km N, 3 km W of Mtito Andei 2o 37' S, 38o 03' E M63563 M63563 AF159324
2 Heterocephalus glaber Kenya: Machakos District, 8 km N, 3 km W of Mtito Andei 2o 37' S, 38o 03' E H025 AY427071
3 Heterocephalus glaber Kenya: Machakos District, 8 km N, 3 km W of Mtito Andei 2o 37' S, 38o 03' E H035 AY427072
4 Heterocephalus glaber Kenya: Isiolo District, Buffalo Springs National Reserve H874 AY427074
5 Heterocephalus glaber Kenya: Machakos District, 1.5 km NW of Kathakani H791 AY427075 AF159325
6 Heterocephalus glaber Kenya: Isiolo District, Buffalo Springs National Reserve H871 AY427073 AF159326
7 Heliophobius argenteocinereus Kenya: Rift Valley Province, Athi River M63562 M63562 AF159323
8 Heliophobius argenteocinereus Malawi: Blantyre 14o 47' S, 35o 04' E B4 AY427067
9 Heliophobius argenteocinereus Malawi: Nyika 10o 26' S, 33o 51' E B3 AY427068
10 Heliophobius argenteocinereus Malawi: Nyika 10o 26' S, 33o 51' E B1 AY427069
11 Heliophobius argenteocinereus Zambia: Luano Valley 14o 40' S, 29o 55' E Z13 AY427070
12 Bathyergus janetta Namibia: Oranjemund (Orange River) 28o 33' S, 16o 24' E M63565 M63565 AF159320
13 Bathyergus janetta Namibia: Boesmanberg, Locality 4, Diamond 1 Area B.j. Male Nam AY427016
14 Bathyergus suillus SA: Western Cape, Swellendam 34o 01' S, 20o 27' E M63564 M63564 AF159321
Accession numbersc

211
No. Species Locality Coordinates Sourceb 12S rRNA TTR
15 Bathyergus suillus SA: Western Cape, University Western Cape 33o 54' S, 18o 39' E TM38370 AY427017
16 Bathyergus suillus SA: Western Cape, Lilydale 33o 56' S, 18o 46' E TM38374 AY427018
17 Bathyergus suillus SA: Western Cape, Langebaan, Postberg Nature Reserve 33o 07' S, 18o 00' E TM41452 AY427019
18 Bathyergus suillus SA: Western Cape, Langebaan, West Coast National Park 39o 09' S, 18o 56' E TM41500 AY427020
19 Georychus capensis SA: Kwazulu-Natal, Nottingham Road 29o 22' S, 29o 59' E M63566 M63566 AF159318
20 Georychus capensis SA: Western Cape, Cape Town 33o 56' S, 18o 28' E GC5 AY429592 AF159319
21 Georychus capensis SA: Eastern Cape, Port Elizabeth 33o 42' S, 26o 05' E TM38354 AY427065
22 Georychus capensis SA: Kwazulu-Natal, Wakkerstroom District 27o 17' S, 30o 16' E TM39874 AY427066
23 Coetomys amatus Zambia: Chibale Valley 13o 35' S, 30o 05' E AMATUS1 AY427021 AY426994
24 Coetomys anselli Zambia: Mungule 15o 20' S, 28o 10' E Z1 AY427022 AY426995
25 Coetomys anselli Zambia: Mungule 15o 20' S, 28o 10' E Z2 AY427023 AY426996
26 Coetomys anselli Zambia: Lusaka Z3 AY427024 AY426997
27 Coetomys anselli Zambia: Lusaka Z12 AY427025 AY426998
28 Coetomys damarensis Namibia: Okahanja 20o 27' S, 16o 42' E M63569 M63569 AF159316
Accession numbersc

212
No. Species Locality Coordinates Sourceb 12S rRNA TTR
29 Coetomys damarensis SA: North-West, 5 Km E Pomfret 25o 50' S, 25o 34' E HW3053 AY427026 AY426999
30 Coetomys damarensis SA: North-West, 5 Km E Pomfret 25o 50' S, 25o 34' E HW3084 AY427027
31 Coetomys damarensis SA: North-West, 5 Km E Pomfret 25o 50' S, 25o 34' E HW3085 AY427028
32 Coetomys damarensis SA: North-West, Farm Elibank 26o 20' S, 24o 53' E SP7540 AY427029 AY427000
33 Coetomys damarensis SA: North-West, Constantia Farm 309 27o 17' S, 22o 46' E SP7658 AY427030
34 Coetomys damarensis Zambia: West Bank Zambezi 16o 20' S, 23o 17' E Wessam0102 AY427031 AY427001
35 Coetomys damarensis Zambia: West Bank Zambezi 16o 20' S, 23o 17' E Wessam2-0101 AY427032
36 Coetomys darlingi Zimbabwe: Chimanimani 19o 48' S, 32o 50' E DAR3 AY427033 AY427002
37 Coetomys darlingi Zimbabwe: Chimanimani 19o 48' S, 32o 50' E DAR4 AY427034
38 Coetomys darlingi Zimbabwe: Mandara, Harare (Museum specimen) 17o 47' S, 31o 09' E CM40460 AY427035
39 Coetomys foxi Cameroon: 13 km S Ngaundere (Museum specimen) 07o 12' N, 13o 36' E CM59487 AY427036
40 Coetomys kafuensis Zambia: Itezhi-tezhi 15o 46' S, 26o 02' E Z10 AY427037 AY427003
41 Coetomys 'Kasama' Zambia: Kasama Z5-Holotype AY427038 AY427004
42 Coetomys mechowi Zambia: Ndola Z6 AY427039 AY427005
43 Coetomys mechowi Zambia: Chibale Valley 13o 35' S, 30o 05' E M69 AY427040
Accession numbersc

213
No. Species Locality Coordinates Sourceb 12S rRNA TTR
44 Coetomys mechowi Zambia: Chibale Valley 13o 35' S, 30o 05' E MEC1 AY427041
45 Coetomys mechowi Zambia: Ndola MEC2 AY427042
46 Coetomys m.mellandi Zambia: Solwezi Boma 12o 11' S, 26o 25' E TM12667 AY427043
47 Coetomys micklemi Zambia: Kataba KATJLM0401 AY427044
48 Coetomys ochraceocinereus South Sudan: Ivatoku (?) or Bahr-al-Ghazal C.O.#1 AY427045
49 Coetomys whytei Malawi: Nyika 10o 24' S, 33o 50' E B2 AY427046 AY427006
50 Coetomys whytei Malawi: Karonga 09o 56' S, 33o 56' E KAR1 AY427047 AY427007
51 Coetomys anselli Zambia: sample received from Shimon Simson 7/24/90 H650 AF290211 AF159317
52 Coetomys sp Zambia: Senanga 15o 58' S, 23o 20' E SEN AY427049 AY427009
53 Coetomys sp Zambia: Sekute SEKCHF AY427048 AY427008
54 Coetomys sp Zambia: Livingstone LIV0201 AY427050 AY427010
55 Cryptomys hottentotus SA: Western Cape, Eendekuil 32o 42' S, 18o 53' E CHH1 M63567 AF159314
56 Cryptomys hottentotus SA: Western Cape, 28 Km S Clanwilliam 32o 22' S, 18o 58' E TM38420 AY427056
57 Cryptomys hottentotus SA: Western Cape; Algeria Forest, Cederberg 32o 22' S, 18o 58' E TM38436 AY427055
Accession numbersc

214
No. Species Locality Coordinates Sourceb 12S rRNA TTR
58 Cryptomys hottentotus SA: Western Cape; Langebaan, Postberg Nature Reserve 33o 07' S, 18o 00' E TM41446 AY427058 AY427013
59 Cryptomys holosericeus SA: North-West; Farm Memel 26o 22' S, 24o 46' E SP7535 AY427051
60 Cryptomys holosericeus SA: North-West; Farm Elibank 26o 20' S, 24o 53' E SP7552 AY427052
61 Cryptomys holosericeus SA: Free State; Henneman 28o 01' S, 26o 59' E TM38475 AY427057 AY427012
62 Cryptomys holosericeus SA: Free State; Henneman 28o 01' S, 26o 59' E SP7697 AY427053
63 Cryptomys anomalus SA: Gauteng, Moreleta Nature Reserve 25o 45' S, 28o 12' E SP7703 AY427054 AY427011
64 Cryptomys natalensis SA: Kwazulu-Natal, Pietermaritzburg 29o 36' S, 30o 27' E CHN5 M63568 AF159315
65 Cryptomys natalensis SA: Free State, Ficksburg, Golf Course 28o 53' S, 27o 53' E TM41573 AY427059
66 Cryptomys natalensis SA: North-West; Farm Donkeshoek 26o 20' S, 25o 53' E SP7521 AY427064
67 Cryptomys natalensis SA: Kwazulu-Natal, Durban, Botanical Gardens 29o 53' S, 30o 58' E TM38327 AY427061 AY427014
68 Cryptomys natalensis SA: Kwazulu-Natal, Durban, Bluff Nature Reserve 29o 55' S, 30
o 59' E TM38461 AY427062 AY427015
69 Cryptomys natalensis SA: Mpumalanga, Dullstroom, Verlorenvalle 25o 18' S, 30o 07' E TM38464 AY427063
70 Cryptomys natalensis SA: Mpumalanga, Wakkerstroom 27o 17' S, 30o 16' E TM41610 AY427060
71 Coetomys bocagei Angola: Lubango 15o S, 13o E AF012213 AF012213
72 Coetomys kafuensis'choma' Zambia: Choma (Kalomo-Aguilar) 17o S, 27o E AF012217 AF012217
Accession numbersc

215
No. Species Locality Coordinates Sourceb 12S rRNA TTR
73 Cryptomys nimrodi Zimbabwe: Hillside 20o S, 29o E AF012219 AF012219
74 Cryptomys anomalus 'pretoria' SA: Gauteng, Pretoria 26o S, 28o E AF012218 AF012218
75 Coetomys anselli'amatus' Zambia: Lusaka 15o S, 28o E AF012216 AF012216
76 Coetomys darlingi Zimbabwe: Goromonzi 17o S, 30o E AF012215 AF012215
77 Coetomys mechowi Zambia: Chingola 12o S, 28o E AF012214 AF012214
aSA = South Africa
cGenbank accession numbers
bTransvaal Museum - TM, Carnegie Museum - CM, Senckenberg Museum, Frankfurt - SMF
Accession numbersc

216
216
VITA
Colleen Marie Ingram I. Personal Information Address: Department of Wildlife and Fisheries Sciences 2258 TAMUS College Station, TX 77843-2258 II. Education
B.S., Biology, California State University, Long Beach, May 1995 III. Awards & Fellowships Research Grant: Primate Conservation, Inc. ($2500.00) .............................................2000 Conservation Genetics of Populations of Two Malagasy Primates, Propithecus diadema and Propithecus tattersali Regents’ Fellowship (TAMU)........................................................................ 1998 - 1999 Phi Kappa Phi Honor Society...................................................................... Inducted 1997 CSULB President’s List......................................................................................Fall 1994 CSULB Dean’s List ....................................................................................... Spring 1995 National Dean’s List .......................................................................................1994 - 1995 IV. Publications Kock, D., C. M. Ingram, L. J. Frabotta, H. Burda, and R. L. Honeycutt. 2005. On the
nomenclature of Bathyergidae and Fukomys n. gen. (Mammalia:Rodentia). Zootaxa (in Review).
Ingram, C. M., H. Burda, and R. L. Honeycutt. 2004. Molecular phylogenetics and
taxonomy of the African mole-rats, genus Cryptomys and the new genus Coetomys Gray, 1864. Molecular Phylogenetics and Evolution, 31(3): 997-1014.
Mayor, M. I., J. A. Sommer, M. L. Houck, J. Zaonarivelo, P. C. Wright, C. M. Ingram,
S. R. Engel, and E. E. Louis, Jr. 2004. Specific Status of Propithecus spp. International Journal of Primatology. 25(4): 875-900.