identification of genes responsive to pfos using … toxicology and pharmacology 19 (2005) 57–70...
TRANSCRIPT

Environmental Toxicology and Pharmacology 19 (2005) 57–70
Identification of genes responsive to PFOS using geneexpression profiling
Wenyue Hu, Paul D. Jones∗, Trine Celius, John P. Giesy
Department of Zoology, National Food Safety and Toxicology Center and Institute of Environmental Toxicology,Michigan State University, East Lansing, 224 National Food Safety and Toxicology Center, MI 48824-1311, USA
Received 2 June 2003; accepted 8 April 2004Available online 15 September 2004
Abstract
Perfluorooctane sulfonic acid (PFOS) is widely distributed in the environment including in the tissues of wildlife and humans, however, itsmechanism of action remains unclear. Here, the Affymetrix rat genome U34A genechip was used to identify alterations in gene expressiondue to PFOS exposure. Rat hepatoma cells were treated with PFOS at 2–50 mg/L (4–100�M) for 96 h. Sprague-Dawley rats were orallyd ttya btained forr affected byP us fattya©
K
1
flflsiatatfiniam
diedidtis-
per-nateveral
lentbol-
actu-era-seds inisms
ar-,liver,
1d
osed with PFOS at 5 mg/kg/day for 3 days or 3 weeks. Genes that were significantly (P <0.0025) induced were primarily genes for facid metabolizing enzymes, cytochrome P450s, or genes involved in hormone regulation. Consistent expression profiles were oeplicate exposures, for short-term and long-term in vivo exposures, and for acute and chronic exposures. One major pathwayFOS was peroxisomal fatty acid�-oxidation, which could be explained by the structural similarity between PFOS and endogenocids.2004 Elsevier B.V. All rights reserved.
eywords:PFOS; Gene expression; Fatty acids metabolism
. Introduction
Perfluorinated fatty acids (PFFAs) are synthetic, fullyuorinated, fatty acid analogues. The high-energy carbon-uorine bond renders these compounds resistant to hydroly-is, photolysis, microbial degradation, and metabolism by an-mals, which makes them environmentally persistent (Giesynd Kannan, 2002). Perfluorinated compounds, manufac-
ured for over 50 years, are commonly used in materials suchs wetting agents, lubricants, corrosion inhibitors, stain resis-
ant treatments for leather, paper and clothing, and in foamre extinguishers (Sohlenius et al., 1994, Giesy and Kan-an, 2002). PFFAs also possess unique biological character-
stics that make them suitable for red blood cell substitutesnd hepatic drugs (Ravis et al., 1991). The global environ-ental distribution, bioaccumulation, and biomagnification
∗ Corresponding author. Tel.: + 1 517 432 6327; fax: +1 517 432 2310.E-mail address:[email protected] (P.D. Jones).
of several perfluorocompounds have recently been stu(Giesy and Kannan, 2001). Perfluorooctane sulfonic ac(PFOS) is the most commonly found compound in thesues of wildlife, perfluorooctane sulfonamide (PFOSA),fluorooctanoic acid (PFOA), and perfluorohexane sulfo(PFHS) have also been detected in the tissues of sespecies (Giesy and Kannan, 2001).
Since PFFAs are chemically stabilized by strong covaC F bonds, historically they were considered to be metaically inert and non-toxic (Sargent and Seffl, 1970). Ac-cumulating evidence has demonstrated that they areally biologically active and can cause peroxisomal proliftion, increased lipid metabolizing enzyme activity, increaxenobiotic metabolizing enzyme activity, and alterationother important biochemical processes in exposed organ(Obourn et al., 1997; Sohlenius et al., 1994). In wildlife themost widely distributed PFFA, PFOS, accumulates primily in blood and liver (Giesy and Kannan, 2001). Thereforethe major target organ for PFFAs is presumed to be the
382-6689/$ – see front matter © 2004 Elsevier B.V. All rights reserved.
oi:10.1016/j.etap.2004.04.008
58 W. Hu et al. / Environmental Toxicology and Pharmacology 19 (2005) 57–70
however, this does not exclude other possible target organssuch as the pancreas, testis and kidney (Olsen and Andersen,1983).
To date, most toxicological studies have been conductedon PFFAs such as PFOA and perfluorodecanoic acid (PFDA),rather than the more environmentally prevalent PFOS. PFOSappears to be the ultimate degradation product of a numberof commercially used perfluorinated compounds (Giesy andKannan, 2002). The concentrations of PFOS found in wildlifeare greater than other perfluorinated compounds (Giesy andKannan, 2002; Kannan et al., 2001a, b).
The mechanisms by which some PFFAs elicit their toxiceffects are not well known. For example several PFFAs havebeen reported to be peroxisome proliferators. PFFAs, suchas PFOA and PFDA can interfere with lipid metabolism byincreasing peroxisomal fatty acid�-oxidation, and inducingseveral hepatic enzyme activities (Sohlenius et al., 1996).Both in vivo and in vitro exposures to PFOA result in in-creased activities of peroxisomal acyl-CoA oxidase, whichcatalyzes the first and rate-limiting step in fatty acid oxi-dation (Sohlenius et al., 1994). Fatty acid oxidation is alsoa process that can produce hydrogen peroxide, an oxida-tive radical, such that PFFAs can lead to oxidative stressand could possibly result in DNA damage (Sohlenius et al.,1994).
eens po-s acyl-g lyc-ea ita e intk ad-i malc ta mesw .,1 ificf dw d-i d/ories -s redc
iron-m om-p on forEt wered me-w omeT spon-s th-
ways for the biological effects of PFOS. In vitro and in vivoexposures were used to allow comparison of gene expressionprofiles between in vitro and in vivo models, and long-termverses short-term exposure.
2. Materials and methods
2.1. Chemicals
Perfluorooctane sulfonic acid (PFOS, 68% straight-chain,17% branched-chain was obtained from 3M company (St.Paul, MN). The PFOS material used was from a commer-cial batch and so can be expected to be representative ofmaterials reaching the environment. While the presence ofbranched-chain isomers was confirmed no analytical meth-ods are currently available to identify and characterize theseisomers. The PFOS (potassium salt) used for in vivo ex-periments was purchased from Fluka Chemicals (Buchs,Switzerland), chemical analysis of the isomer patterns re-vealed that it was essentially the same as the product obtainedfrom 3 M.
2.2. Cell culture and treatment
d 15,w shes( 4)i c,M a-g ),s one,L dishw tof plit-t ceda cen-t lw eivedn aftere
2
m o-rc tiveT rousc evi-d in ad-d dies.R withs andf ays,w ck,
Some PFFAs, including PFOA and PFOSA, have bhown to be involved in regulating tissue fatty acid comition and content. PFOA can reduce cholesterol and trilycerol concentrations in serum, increase liver triacylgrol concentration, and reduce hepatic lipid output (Haughomnd Spydevold, 1992). Treatment with PFDA can inhibcyl-CoA synthetase activity and result in an increas
he level of free fatty acids (Reo et al., 1996) which arenown to be able to activate protein kinase C (PKC), leng to a signaling cascade that is important for norell function, cell proliferation and gene expression (Reo el., 1996). Hepatic microsomal cytochrome P450 enzyere induced in rats treated with PFOA (Permadi et al992). In the CYP4A sub-family, nine enzymes spec
or fatty acid �-hydroxylation were significantly induceith exposure to 500�M PFOA for 7 days. Recent stu
es have also demonstrated effects of PFOS in vitro ann vivo on gap junctional intercellular communication (Hut al., 2002a), membrane fluidity (Hu et al., 2002b) and serumteroid binding globulins (Jones et al., 2002). Chronic expoure of primates to PFOS resulted in significantly alteoncentrations of cholesterol in blood (Seacat et al., 2002).
The current state of knowledge concerning the envental and toxicological impacts of PFOS and related counds has recently been summarized by the Organizaticonomic Cooperation and Development (OECD, 2002). In
he current study the effects of PFOS on gene expressionetermined using the Affymetrix Genechip array, a genoide expression analysis method based on the rat genhis screening approach was used to identify genes reive to PFOS with the intent of identifying critical target pa
.
H4IIE rat hepatoma cells, between passages 5 anere cultured in 100 mm disposable tissue culture di
Corning, 25020) at 37◦C under sterile conditions (pH = 7.n a humidified 5/95% CO2/air incubator (Forma Scientifi
odel 8173). Cells were grown in Dulbecco’s Modified Ele Medium (DMEM, Sigma D-2902, Sigma, St. Louis MOupplemented with 10% fetal bovine serum (FBS, Hyclogan, UT). At confluence, cells were removed from theith trypsin/EDTA (Hyclone, Logan, UT), and then split in
our tissue culture plates. The cells were given 24 h after sing to allow for attachment, the medium was then repland cells were dosed with PFOS to achieve final con
rations of 2 and 50 mg/L (equivalent 4–100�M). Methanoas used as solvent control, and the blank control reco solvent or PFOS dose. Cells were incubated for 72 hxposure.
.3. In vivo treatment
Sixty-day-old Sprague-Dawley rats (males 294± 4 g; fe-ales 209± 2 g) were obtained from Charles River Lab
atories (Raleigh, NC), and housed at 20–24◦C in humidity-ontrolled (40–60%) facilities at the US-EPA Reproducoxicology Laboratory (Research Triangle Park NC). Estycle was not determined in female rats since there is noence to suggest that PFOS can alter the estrous cycle,ition breeding was not a targeted endpoint for these stuats were randomly assigned to two blocks, block oneix males and six females, and block two with four malesour females. Block one was exposed to PFOS for 21 dhile block two was exposed for 3 days. Within each blo

W. Hu et al. / Environmental Toxicology and Pharmacology 19 (2005) 57–70 59
half of the males and half of the females were randomly as-signed to treatment or control groups. Rats received PFOS(5 mg/kg) or vehicle control (0.5% Tween-20) daily by oralgavage at a rate of 1 ml/kg body weight. The physiologicalreproductive results of this larger reproductive study havebeen reported elsewhere (Thibodeaux et al., 2003; Lau et al.,2003).
At the end of exposure, animals were sacrificed by de-capitation and liver samples were collected and immediatelyplaced in TriReagent (Boehringer Ingelheim, Germany). Allanimals were sacrificed between 9 and 11 am and within a 1 hperiod. Livers were removed within 1–2 min of sacrifice andportions of the livers were placed in TriReagent. Liver sam-ples were either processed immediately for RNA isolation orwere stored at−80◦C until used for RNA isolation.
2.4. Genechip array experimental procedure
The Affymetrix rat genome U34A genechip array was pur-chased from Affymetrix Inc. (Santa Clara CA, P/N 900249).The oligonucleotide probes on U34A array cover approx-imately 8000 known genes and expressed sequence tags(ESTs) in the rat genome. Transcripts were selected fromGenebank Unigene build 34 and the dBEST database.
Only liver samples from female rats were analyzed usingG ul-t Iso-l them ensi-t andt con-c nm.T dis-t roseg otheR
totalR ibcoBw(C .S ubles ran-s eledc ndf za-t e per-f er-s ven6 n-l SA,a nda t wastl ated
washing, staining and scanning protocol on the fluidics sta-tion (Affymetrix, Santa Clara, CA). Each complete probearray image was stored in a separate data file identified byexperimental name.
A total of nine chips were used in this study. Three wereused to analyze samples from the in vitro exposure (solventcontrol, PFOS at 2 mg/L and 50 mg/L, 4–100�M), while fourchips were used for examining the long-term in vivo samples(two females exposed as solvent controls and two females ex-posed to PFOS at 5 mg/kg/day for 21days). The PFOS con-centration was measured in each rat liver sample (658 and616 mg/kg liver for 21days exposure, and 90.4 mg/kg liverfor 3 days exposure). Finally, two chips were used for thein vivo short-term samples (one female treated as a solventcontrol and one female exposed to PFOS at 5 mg/kg/d for3 days). Data collected from the nine chips was transferredto a Microsoft Access database.
2.5. Chemical analysis
PFOS in the rat liver tissue samples was extracted and an-alyzed based on slight modifications of previously describedmethods (Hansen et al., 2001). Extractions were carried outon homogenate volumes equivalent to 10–50 mg of originalthe original liver tissue samples. Homogenates, prepared inn .5 Mt and0 plew .T wasr ials.A d theea wlettP lto,C eter( ctedo -t sedo con-c ande ingw ev-e
2
usingt a,C erea Mi-c con-d aly-s con-d Red-w
eneChips in the current study. Total RNA from cell cures and rat liver samples were extracted using TriPureation Reagent (Boehringer Ingelheim, Germany) using
anufacturers recommended procedures. The optical dies of RNA samples were measured at 260 and 280 nmhe ratio was used to evaluate nucleic acid purity. RNAentration was quantified using optical density at 260he quality of RNA was evaluated by the appearance of
inct of 18s and 28s ribosomal RNA bands on 1% agaels and by the presence of an even smear representingNA species.First and second strand cDNA was synthesized from
NA samples using the SuperScript Choice System (GRL life Technologies). High-quality total RNA (16�g)as used as the starting material and 1 ul 100 pmol/�l T7-
dT)24 primer (5′–GGC CAG TGA ATT GTA ATA CGATC ACT ATA GGG AGG CGG –(dT)24–3′; Genset Cropan Diego, CA) was used to prime the reaction. After dotanded cDNA clean up and quality check, an in vitro tcription reaction was conducted to produce biotin-labRNA from the cDNA. The cRNA was then purified aragmented for hybridization analysis. Following hybridiion and washing, staining and scanning procedures werormed in the Genomics facility on Michigan State Univity campus (Fluidics Station 400 and Hybridization O40 from Affymetrix, Santa Clara, CA). Briefly the bioti
abeled cRNA was combined with probe array control, Bnd herring sperm DNA into a hybridization cocktail, applied to the probe array after a cleanup procedure. I
hen allowed to hybridize on the array for 16 h at 45◦C. Fol-owing the hybridization, the arrays underwent an autom
r
anopure water, were mixed with an equal volume of 0etrabutylammonium (TBA) hydrogen sulfate, pH 10.25 M sodium carbonate buffer. After mixing the samas extracted twice with methyl-tert-butyl ether (MTBE)he MTBE was evaporated to dryness and the extractesuspended in 1 ml methanol for transfer to injection vfter transfer, methanol was removed by evaporation anxtract was resuspended in 200�l of 50% methanol in 2 mMmmonium acetate. PFOS was analyzed using a Heackard 1100 HPLC system (Hewlett Packard, Palo AA) interfaced to a Micromass Platform II mass spectrom
Micromass, Beverly, MD). Chromatography was condun a (150 mm× 4 mm) Betasil C18 column (Keystone Scien
ific, Bellefonte, PA). Concentrations were calculated ban a standard curve generated with at least five PFOSentrations that were run three times at the start, middlend of the analytical run. All calculations and curve fittere performed with MassLynx software (Micromass, Brly, MD).
.6. GeneChip array data analysis
Each image file was analyzed and data was retrievedhe Affymetrix “data mining” tool (Affymetrix Santa ClarA). Initial data normalization and background filtering wlso conducted. The ‘outcome’ file was then stored in arosoft Access database. Initial data analysis was alsoucted using Microsoft Access query design. Cluster anis, Gene tree construction and pathway analysis wereucted using GeneSpring software (SiliconGenetics,ood City, CA).

60 W. Hu et al. / Environmental Toxicology and Pharmacology 19 (2005) 57–70
2.6.1. Scatter plotThe scatter plot is useful for examining the expression lev-
els of genes in two distinct conditions, samples, or normal-ization schemes. To evaluate the reproducibility of results forindividual animals and cell cultures, scatter plots based on acorrelation analysis were prepared for the different samples.
2.6.2. Gene treeGenes can be classified in a manner similar to the classifi-
cation of organisms into phylogenic dendrograms or trees. Asorganisms sharing properties tend to be clustered together, thepattern of responses of genes to toxicants can be used to deter-mine the similarity in responses of species, doses, or durationof exposure. The vertical distance along the branches of sucha tree represents a measure of how different the responses are.The Gene tree algorithm of Genespring was used to draw ahierarchical dendrogram of clustered genes according to theirexpression profiles among treatments. The algorithm calcu-lated the correlation for each gene with every other gene inthe set. Then, pairs of genes exhibiting the greatest corre-lations were paired and their expression profiles averaged.The new composite ‘gene’ was then compared with all theunpaired genes. This was repeated until all of the genes hadbeen paired. Based on the way their expression was alteredacross the nine samples, the 8000 genes were grouped on theh d ont ofile.
2their
e hwaya ymeC wnm mapsi site:h
2d by
t yingt ener-a olv-i amsu initialb usingp rraysa with as gth).E and am e seq otided ter-n is-t nces.W wasl evera
different concentrations both in vitro and in vivo. Our aimin this study was to identify genes that were changed consis-tently in all exposures. In addition, the experimental designallowed for comparison between samples and between expo-sure scenarios.
The Affymetrix Genechip system utilizes extensive statis-tical analysis of the array image before a gene is reported asinduced or suppressed. The detection of a single gene prod-uct is based on analysis of between 11 and 20 oligonucleotide‘probe pairs’. Each probe pair consists of two 25-mer oligonu-cleotides, one a ‘perfect match’ for the target sequence andone with a base mismatch at nucleotide13. The relative spotintensities between all perfect match probes and betweeneach match and mismatch probe pair give these chips ex-traordinary sensitivity and specificity. In ‘comparison analy-sis’ mode the software compares the arrays for two samplesanalyzed on two different chips. One array is designated asthe baseline (control) and the other the experiment (exposed).Before comparing the two arrays scaling and normalizationare carried out automatically to correct for variations in over-all signal intensity and heterogeneity between the two arrays.During a comparison analysis, each probe set on the exper-iment array is compared to its counterpart on the baselinearray and, using Wilcoxon’s signed rank test, a ‘changeP-value’ is calculated indicating an ‘increase’, ‘decrease’, or‘ A).T pec-i tudyd hena ed ssiont ne-s log( rrays( ncelo ared l logr ratio“ art nge’i rigori n.
3
3
asso-c theirf 5%o do n duet e 400g FOS.T on
orizontal axis with the nine treatment groups clusterehe vertical axis based on how they affected the gene pr
.6.3. Pathway analysis and target pathwayBased on the genes that were identified as having
xpression modulated by exposure to PFOS, a patnalysis was performed by linking genes via their Enzommission (EC) numbers to their positions in knoetabolic pathways as described in metabolic pathway
n the Kyoto Encyclopedia of Genes and Genomes (webttp://www.genome.ad.jp/kegg).
.6.4. Statistical analysisStatistical analysis of Gene Array data is complicate
he large amount of data generated, the different arraechnologies used by different manufacturers, and the glly small sample sizes typically used in experiments inv
ng Gene Arrays. In addition, many of the software progrsed to capture and analyze array data perform at leastackground corrections and some statistical analysisroprietary algorithms. For example Genechip probe are manufactured such that each gene is representederies of 11–20 probes pairs (each probe is 25 bp in lenach probe pair is composed of a perfect match probeismatch probe, the mismatch probe has almost the samuence as that of the “perfect match”, except one nucleifference. This so-called “tiling” design serves as an inal control for hybridization specificity which allows cons
ent discrimination between closely related target sequehile the number of chips used in the current study
imited to nine, these chips represented exposures at s
-
l
no change’ in gene expression (Affymetrix Santa Clara, Che degree of significance for the change call is user s
fied, for chip comparisons conducted in the current sefault probability cut-off values were used in all cases wgenes expression is reported as alteredP <0.0025. For thetermination of the degree of alteration in gene expre
he software determines the “signal log ratio” using a otep Tukey’s Biweight method by taking a mean of thebase 2) ratios of probe pair intensities across the two aAffymetrix Santa Clara, CA). This approach helps to caut differences in individual probe intensities, since ratioserived at the probe level, before computing the signaatio, since log base 2 is used to determine the signal logfold change” = 2(signallogratio). From this discussion it is clehat although the analysis system reports only a ‘fold chan gene expression there is a high degree of statisticaln the determination of these changes in gene expressio
. Results
.1. Overall changes
To determine the overall gene expression changesiated with PFOS exposure, genes were classified byold change in expression. Expression of approximatelyf the genes analyzed were significantly (P<0.0025) inducer suppressed beyond a three-fold change in expressio
o exposure to PFOS. However, this still represents somenes whose expression was altered by exposure to Phe use of a three-fold cut-off for significance is based

W. Hu et al. / Environmental Toxicology and Pharmacology 19 (2005) 57–70 61
several previous studies (Wan and Nordeen, 2002; Gerholdet al., 2002) and the desire to identify the most critical alter-ations in gene expression.
3.2. Scatter plot
Scatter plots were first constructed by comparing the du-plicate control and 21-day-in vivo PFOS exposed samples.These plots demonstrated that the majority of the data pointsfell into the reference space represented by the 95% confi-dence interval for a correlation coefficient of 1.0 (Fig. 1Aand B). This represents the degree of reproducibility of thebiological responses between different organisms as well asthe reproducibility of the analysis method. In contrast, whena sample from the long-term in vivo exposure was plottedagainst a control sample from the same experiment, a greaterdegree of scatter was observed (Fig. 1C). Many points inthe upper right quadrant of the graph are outside the 95%confidence interval indicating significant alterations in theexpression of genes expressed at high copy number.
Scatter plots comparing in vitro and in vivo exposure sys-tems showed differences in gene expression between the ratliver cells in vivo and the genetically modified rat hepatomacells (H4IIE) in culture. In this plot, a significant degree ofdata scattering and deviation from the reference lines were
FrCiv
observed across all expression levels (Fig. 1D). This demon-strated the relatively large difference in gene expression be-tween the in vitro and in vivo systems even without consid-ering the impact of chemical exposure.
3.3. Gene tree
When the patterns of responses for all samples were ex-amined using a ‘Gene tree’ analysis, the in vitro samplesexhibited a profile clearly different from the in vivo sam-ples (Fig. 2) that was consistent with the result observed inthe scatter plot analysis. In all three in vitro samples, genesseparated into two nodes according to their expression level.However, no distinguishing patterns were recognized amongthe six in vivo samples since subtle differences among thesesamples were masked by the greater differences between thein vitro and in vivo exposure systems.
When a similar gene tree analysis was conducted usingsolely the in vivo data, a group of genes exhibiting a dis-tinct pattern among treatments was discernable (Fig. 3). Allof the genes in this group were expressed at a significantly(P <0.0025) greater level in the two long-term PFOS treatedsamples than in the controls. The short-term sample exhibiteda pattern similar to that of the long-term exposure althoughlack of replicate analyses in the short-term exposure prohib-ited statistical comparison.
ig. 1. Scatter plots of gene expression comparisons due to exposure to Pegression line and the outer lines represent the 95% confidence interval. (A)omparison of gene expression in two individual rats exposed in vivo to PFO
n vivo to PFOS for 21 days (PFOS1) to a control rat (control 1). (D) Compaivo-control, respectively).
FOS. Each point represents a single gene or EST; the middle line represents a 1:1Comparison of gene expression in two in vivo control rats (control 1, control 2). (B)S for 21 days (PFOS1, PFOS2). (C) Comparison gene expression in a rat exposedrison of samples from in vitro and in vivo control exposures (in vitro-control,in

62 W. Hu et al. / Environmental Toxicology and Pharmacology 19 (2005) 57–70
Fig. 2. Gene tree dendrogram comparison of all samples from rats and cell lines exposed to PFOS in vitro and in vivo. Samples with a similar banding patternshow similar gene expression patterns. The Dendrogram links samples based on the gene expression pattern.
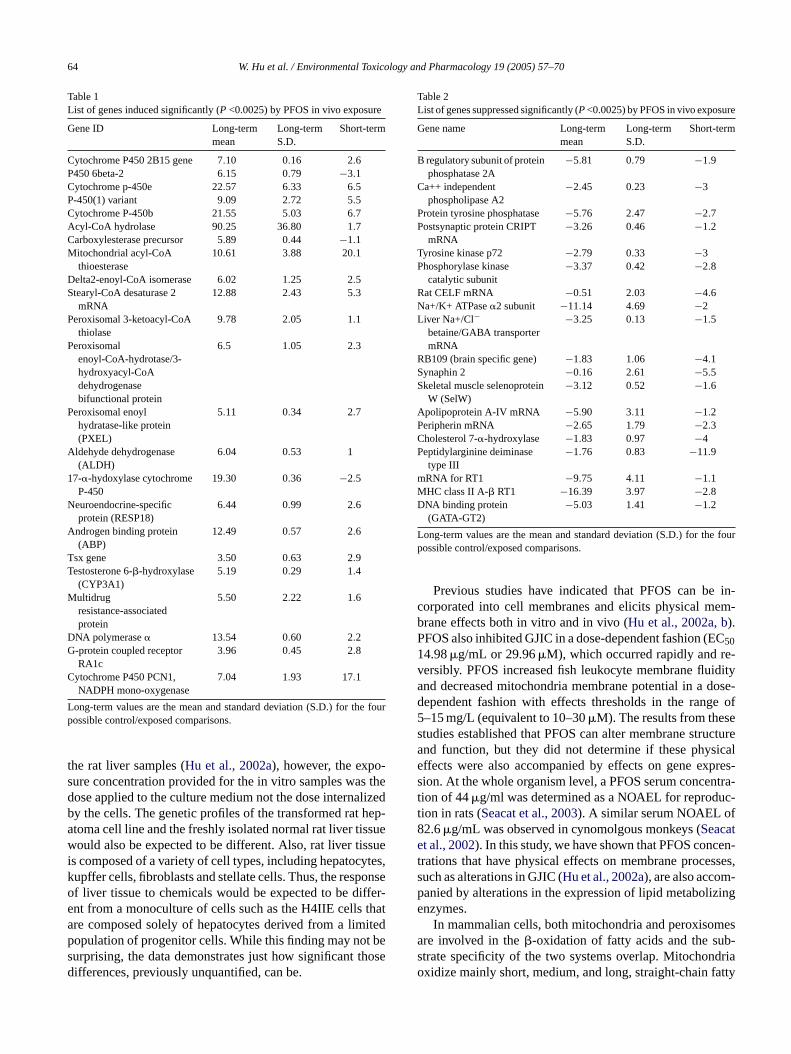
3.4. Gene list
A list of genes whose expression level was signifi-cantly (P <0.0025) altered by PFOS exposure was produced(Tables 1 and 2; Figs. 4 and 5). For the long-term exposurestwo exposed and two control rats were available for compari-son. Since the Affymetrix system is limited to comparing twochips at a time each of the exposed rats was compared to eachof the control rats providing a total of four estimates of the foldchange in gene expression. This approach was taken to en-sure that only consistent alterations in gene expression wereidentified. The largest grouping of genes induced by PFOSexposure in vivo, were the cytochrome P450s and genes thatcode for lipid metabolizing enzymes. Several genes involvedin hormone regulation and other regulatory processes were
also induced significantly (P<0.0025). Several genes encod-ing factors involved in signal transduction pathways weresuppressed by PFOS exposure as were genes involved in reg-ulating neuro-system functions. Of the pathways representedby these altered genes the peroxisomal fatty acid�-oxidationpathway seems to be the pathway most affected by expo-sure to PFOS (Fig. 6). The enzymes for peroxisomal lipidmetabolism were altered but those for the same pathway inmitochondria were not.
4. Discussion
The results of this study illustrate the utility of high-throughput toxicogenomics methods to study the effects of

W. Hu et al. / Environmental Toxicology and Pharmacology 19 (2005) 57–70 63
Fig. 3. Gene tree dendrogram comparison solely of samples from rats exposed to PFOS in vivo. Samples with a similar banding pattern show similar geneexpression patterns. The sample linking dendrogram has been omitted for clarity, sample grouping is indicated by proximity.
a compound for which the mechanism(s) of action are stillunclear. Gene expression analysis is useful in identifyingchemical-specific alterations in gene expression to allow clas-sification of toxicants and provide important insights intomechanisms of action (Hamadeh et al., 2002a,b). Alterationsin expression profiles were used to determine potential crit-ical pathways affected by exposure to PFOS. It is clear thatalterations in the concentrations of mRNA species do not nec-essarily translate to alterations in the corresponding enzymeconcentration or activity. However, coordinated alterations inmRNA concentrations for a particular biochemical pathwayprovide strong evidence for an effect of PFOS on that path-way. Confirmation of alterations at the protein/enzyme level
are the next step in the assessment but were beyond the scopeof this study.
Of the 8000 functionally annotated genes and ESTspresent on the array, only about 5% responded to PFOS witha greater than three-fold change in expression. Differencesbetween gene expression profiles were observed between thein vitro and in vivo control samples. All three in vitro ex-posures exhibited an expression pattern distinctly differentfrom that of the in vivo samples. This could be explained bythe differences in exposure system, dosage, toxicokinetics,toxicodynamics, levels of organization and functional inte-gration, which make in vivo exposure more complicated thanin vitro exposure. Concentrations of PFOS were measured in
64 W. Hu et al. / Environmental Toxicology and Pharmacology 19 (2005) 57–70
Table 1List of genes induced significantly (P <0.0025) by PFOS in vivo exposure
Gene ID Long-termmean
Long-termS.D.
Short-term
Cytochrome P450 2B15 gene 7.10 0.16 2.6P450 6beta-2 6.15 0.79 −3.1Cytochrome p-450e 22.57 6.33 6.5P-450(1) variant 9.09 2.72 5.5Cytochrome P-450b 21.55 5.03 6.7Acyl-CoA hydrolase 90.25 36.80 1.7Carboxylesterase precursor 5.89 0.44 −1.1Mitochondrial acyl-CoA
thioesterase10.61 3.88 20.1
Delta2-enoyl-CoA isomerase 6.02 1.25 2.5Stearyl-CoA desaturase 2
mRNA12.88 2.43 5.3
Peroxisomal 3-ketoacyl-CoAthiolase
9.78 2.05 1.1
Peroxisomalenoyl-CoA-hydrotase/3-hydroxyacyl-CoAdehydrogenasebifunctional protein
6.5 1.05 2.3
Peroxisomal enoylhydratase-like protein(PXEL)
5.11 0.34 2.7
Aldehyde dehydrogenase(ALDH)
6.04 0.53 1
17-�-hydoxylase cytochromeP-450
19.30 0.36 −2.5
Neuroendocrine-specificprotein (RESP18)
6.44 0.99 2.6
Androgen binding protein(ABP)
12.49 0.57 2.6
Tsx gene 3.50 0.63 2.9Testosterone 6-�-hydroxylase
(CYP3A1)5.19 0.29 1.4
Multidrugresistance-associatedprotein
5.50 2.22 1.6
DNA polymerase� 13.54 0.60 2.2G-protein coupled receptor
RA1c3.96 0.45 2.8
Cytochrome P450 PCN1,NADPH mono-oxygenase
7.04 1.93 17.1
Long-term values are the mean and standard deviation (S.D.) for the fourpossible control/exposed comparisons.
the rat liver samples (Hu et al., 2002a), however, the expo-sure concentration provided for the in vitro samples was thedose applied to the culture medium not the dose internalizedby the cells. The genetic profiles of the transformed rat hep-atoma cell line and the freshly isolated normal rat liver tissuewould also be expected to be different. Also, rat liver tissueis composed of a variety of cell types, including hepatocytes,kupffer cells, fibroblasts and stellate cells. Thus, the responseof liver tissue to chemicals would be expected to be differ-ent from a monoculture of cells such as the H4IIE cells thatare composed solely of hepatocytes derived from a limitedpopulation of progenitor cells. While this finding may not besurprising, the data demonstrates just how significant thosedifferences, previously unquantified, can be.
Table 2List of genes suppressed significantly (P<0.0025) by PFOS in vivo exposure
Gene name Long-termmean
Long-termS.D.
Short-term
B regulatory subunit of proteinphosphatase 2A
−5.81 0.79 −1.9
Ca++ independentphospholipase A2
−2.45 0.23 −3
Protein tyrosine phosphatase −5.76 2.47 −2.7Postsynaptic protein CRIPT
mRNA−3.26 0.46 −1.2
Tyrosine kinase p72 −2.79 0.33 −3Phosphorylase kinase
catalytic subunit−3.37 0.42 −2.8
Rat CELF mRNA −0.51 2.03 −4.6Na+/K+ ATPase�2 subunit −11.14 4.69 −2Liver Na+/Cl−
betaine/GABA transportermRNA
−3.25 0.13 −1.5
RB109 (brain specific gene) −1.83 1.06 −4.1Synaphin 2 −0.16 2.61 −5.5Skeletal muscle selenoprotein
W (SelW)−3.12 0.52 −1.6
Apolipoprotein A-IV mRNA −5.90 3.11 −1.2Peripherin mRNA −2.65 1.79 −2.3Cholesterol 7-�-hydroxylase −1.83 0.97 −4Peptidylarginine deiminase
type III−1.76 0.83 −11.9
mRNA for RT1 −9.75 4.11 −1.1MHC class II A-� RT1 −16.39 3.97 −2.8DNA binding protein
(GATA-GT2)−5.03 1.41 −1.2
Long-term values are the mean and standard deviation (S.D.) for the fourpossible control/exposed comparisons.
Previous studies have indicated that PFOS can be in-corporated into cell membranes and elicits physical mem-brane effects both in vitro and in vivo (Hu et al., 2002a, b).PFOS also inhibited GJIC in a dose-dependent fashion (EC5014.98�g/mL or 29.96�M), which occurred rapidly and re-versibly. PFOS increased fish leukocyte membrane fluidityand decreased mitochondria membrane potential in a dose-dependent fashion with effects thresholds in the range of5–15 mg/L (equivalent to 10–30�M). The results from thesestudies established that PFOS can alter membrane structureand function, but they did not determine if these physicaleffects were also accompanied by effects on gene expres-sion. At the whole organism level, a PFOS serum concentra-tion of 44�g/ml was determined as a NOAEL for reproduc-tion in rats (Seacat et al., 2003). A similar serum NOAEL of82.6�g/mL was observed in cynomolgous monkeys (Seacatet al., 2002). In this study, we have shown that PFOS concen-trations that have physical effects on membrane processes,such as alterations in GJIC (Hu et al., 2002a), are also accom-panied by alterations in the expression of lipid metabolizingenzymes.
In mammalian cells, both mitochondria and peroxisomesare involved in the�-oxidation of fatty acids and the sub-strate specificity of the two systems overlap. Mitochondriaoxidize mainly short, medium, and long, straight-chain fatty

W. Hu et al. / Environmental Toxicology and Pharmacology 19 (2005) 57–70 65
Fig. 4. Identification and fold change of genes whose expression is significantly (P <0.0025) increased by PFOS exposure in vivo. For long-term exposure,values are means for the four possible control/exposed pairings, error bars are one standard deviation. For the short-term exposure on one control/exposed pairwas analyzed.
acids, while peroxisomes are capable of oxidizing very longstraight-chain and branched-chain fatty acids. Short-chainfatty acids (2–6 carbons) are poor substrates for peroxisomesbecause of the low affinity of the peroxisomal�-oxidationenzymes for short-chain substrates. Results obtained in thisstudy, demonstrated that PFOS specifically enhanced the ex-pression of genes involved in peroxisomal but not mitochon-drial fatty acid�-oxidation. Fatty acid�-oxidation in perox-isomes is carried out in four consecutive steps. The enzymesinvolved in these processes were increased from 2 to10-foldby in vivo exposure to PFOS. Enzymes responsible for the
equivalent functions in mitochondria were not significantlyaffected by PFOS exposure (Fig. 6).
Other PFFAs have been reported to cause peroxisome pro-liferation (Berthiaume and Wallace, 2002). However, the re-sponse observed for PFOS was not characteristic of a ‘nor-mal’ peroxisome proliferator. Genes which are indicative ofperoxisome proliferation and other xenobiotic responses haverecently been identified (Hamadeh et al., 2002a,b). In thepresent study PFOS induced the activity of carnitine palmi-toyl transferase (CPT I) in a manner similar to the architypalperoxisome proliferator Wyeth 14,643. However, PFOS also

66 W. Hu et al. / Environmental Toxicology and Pharmacology 19 (2005) 57–70
Fig. 5. Identification and fold change of genes whose expression is significantly (P <0.0025) decreased by PFOS exposure in vivo. For long-term exposure,values are means for the four possible control/exposed pairings, error bars are one standard deviation. For the short-term exposure on one control/exposed pairwas analyzed.
increased the activities of carboxyesterase and CYP2B1, aresponse characteristic of phenobarbital inducible systems(Fig. 7). PFOS exposure resulted in increases in the activityof thiolase and enoyl-CoA isomerase, enzymes not increasedsignificantly (P <0.0025) by either of the above xenobiotics.Finally, while CYP4A is strongly induced by other peroxi-some proliferators it was not increased by exposure to PFOSin either the in vivo or in vitro exposures. Therefore, it seemsthat while other PFFAs function mainly through peroxisome
proliferation, PFOS results in additional alterations to geneexpression and so may exert it’s biological effects via othermechanisms of action. There is evidence of cross talk be-tween peroxisome proliferator and lipid metabolism path-ways, however, the exact mechanism for this cross talk is un-clear (Duplus et al., 2000). While there is evidence that freefatty acids are capable of altering gene expression, the mech-anism by which fatty acids can act as signaling moleculesis unknown (Duplus et al., 2000). It has been suggested that

W. Hu et al. / Environmental Toxicology and Pharmacology 19 (2005) 57–70 67
Fig. 6. Diagram of pathways for mitochondrial and peroxisomal fatty acid oxidation and the relative induction of the enzymes caused by long-term exposureto PFOS in vivo.
liver X receptors (LXR) are involved in regulation of bothfatty acid and sterol metabolism (Tobin et al., 2002). Indeedthe fact that LXR is responsive to fatty acids could provide aclear mechanism for the cross talk observed between choles-terol and fatty acid metabolism (Duplus et al., 2000). The im-plication of the LXR receptor in the mode of action of PFOSwould provide a plausible explanation for the hypocholes-terolaemic effects observed in primates chronically exposedto PFOS (Seacat et al., 2002). The possibility of PFOS actingon more than one metabolic or regulatory pathway is plau-sible because commercial mixtures of PFOS contain bothstraight-chain and branched-chain homologues which, dueto differences in molecular shape may interact with differentregulatory elements.
There are several possible ways that PFOS could alter per-oxisome function. The simplest explanation could be that, dueto the structural similarity of PFOS to endogenous fatty acids,PFOS could be mistaken by the fatty acid metabolism ma-chinery as a substrate. However, due to the non-degradable
nature of this compound, the�-oxidation process would failto oxidize PFOS. To compensate, the major enzymes in-volved in this pathway, could be induced. However, this hy-pothesis does not explain the lack of increase in the moreenergetically important mitochondrial pathway which pro-vides most of the cells energy. Another possible explana-tion of the effects of PFOS on peroxisomal function is thatPFOS alters peroxisomal membrane permeability in a waythat allows fatty acid influx, requiring greater activity of theoxidation enzymes. This mechanism of action may be lessrelevant to the mitochondrial pathway since fatty acid entryinto mitochondria occurs via a three-step enzymatic transportprocess.
It is also possible that the increase in peroxisomalmetabolism is a response to partial uncoupling of the mi-tochondrial membrane potential resulting in an increase inenergy production from peroxisomes. The fact that studieshave indicated that PFOS can act as a weak uncoupler ofmitochondrial respiration (Starkov and Wallace, 2002) and

68 W. Hu et al. / Environmental Toxicology and Pharmacology 19 (2005) 57–70
Fig. 7. Comparison of enzyme induction effects observed with PFOS compared to phenobarbital and Wyeth 14,643 for different time periods. Data forphenobarbital and Wyeth 14,643 are from (Hamadeh et al., 2002a,b). Abbreviations are:CYP2B1, cytochrome P450 2B1; CPT: carnitine palmitoyl transferase1; AFL ALD RED: aflatoxin aldehyde reductase; p55cdc: P55cdc; CYT PHOS: cytocolic phosphoprotein (p19); E-COA-ISO: enoyl CoA isomerase; thiolase:thiolase; Ar receptor: Ah receptor; Cease: carboxylesterase precursor.
is able to alter mitochondrial membrane potential (Hu et al.,2002a) support this hypothesis.
Peroxisomal�-oxidation is a process that generates hy-drogen peroxide (H2O2) that can cause oxidative stress andoxidative damage to proteins and DNA. While peroxisome�-oxidation enzymes were induced up to 10-fold, catalase, akey enzyme in detoxification of hydrogen peroxide, was rel-atively unchanged (1.4-fold). If catalase were a limiting stepin the removal of peroxide this could result in an increasein hydrogen peroxide, which could induce responses includ-ing lipid peroxidation, membrane damage, accumulation oflipofuscin, and DNA damage.
The one cytosolic enzyme that was dramatically induced(90-fold) by PFOS treatment was long-chain acyl-CoA hy-drolase, which cleaves acyl-CoA to free fatty acid and CoA.The counterparts of acyl-CoA hydrolase found in micro-somes and mitochondria are carboxylesterase and long-chainacyl-CoA thioesterase, in vivo these enzymes were induced5.9-fold and 10.6-fold, respectively. Acyl-CoA hydrolasesand related enzymes are important in the regulation of fattyacid metabolism. They have been proposed to maintainCoASH pools for both oxidation and synthesis of fatty acidsand to regulate the�-oxidation of fatty acids by control-ling the level of acyl-CoA. Induction of acyl-CoA hydro-lase would increase cytosolic free fatty acid concentrations.R hep-a uldb .,2 s al duc-
tion is controlled by HMG CoA reductase, the expression ofwhich was reduced 2.5-fold in the current gene expressionstudy. This is consistent with previous studies that suggestthat the hypolipemic effect of PFOS may, at least partly, bemediated via a common mechanism; impaired production oflipoprotein particles due to reduced synthesis and esterifica-tion of cholesterol together with enhanced oxidation of fattyacids in the liver (Haughom and Spydevold, 1992).
The effects on peroxisome fatty acid�-oxidation do notseem to be receptor mediated, since PPAR� mRNA expres-sion was not affected. This is consistent with previous stud-ies conducted in our laboratory investigating alterations inexpression of PPAR� and� in PFOS exposed fat head min-nows (Celius et al., unpublished results). Another observationthat supports this hypothesis is that even though PFOS hasbeen classified as a peroxisome proliferator, it did not in-duce P450 4A1 as do most peroxisome proliferators (Fig. 7).Two groups of P450s that were up-regulated by PFOS expo-sure were the P4502B and P4503A families. Both P4502B1and P4502B2 were significantly (P<0.0025) induced (9- and22-fold, respectively) by exposure to PFOS. These two cy-tochrome P450 enzymes are phenobarbital inducible, whichis a response mediated by the arylhydrocarbon receptor (Ah-R). However, previous work in our laboratory that investi-gated the effects of PFOS on Ah-R and its mediated responsesf siond ctiono musth ia
odents and primates, when exposed to PFOS exhibittocellular hypertrophy and lipid vacuolation which coe caused by accumulation of free fatty acids (Seacat et al002). Another significant finding from those studies wa
owered serum total cholesterol level. Cholesterol pro
ound no evidence for direct Ah-R mediated gene expresue to PFOS exposure (Hu et al., 2002). Therefore, induf phenobarbital-inducible P450s by PFOS exposureave been through a pathway other than the Ah-R (Sueyoshnd Negishi, 2001).

W. Hu et al. / Environmental Toxicology and Pharmacology 19 (2005) 57–70 69
Gene expression data is useful in identifying affected path-ways and possible mechanism of action, but should not beused to develop dose-response relationships. Furthermore,the degree of toxicity can not be inferred from these results.Once “significant” genes or pathways have been identified,changes in more toxicologically relevant parameters such asproteins or substrates should be measured subsequently. Alsothe comparison between in vitro and in vivo results indicatesthat while in vitro studies can be used to focus on responses ofspecific pathways to compounds such as PFOS, the in vitrosystem is not a substitute of in vivo studies. The greatestutility of the in vitro studies is to determine the effect of dif-ferent compound structures on a specific pathway and theirresponses once the critical pathway has been determined.
Acknowledgements
Funding for this project was provided by the 3M Com-pany, St. Paul, MN. The assistance of staff at the MichiganState University Macromolecular structure Facility is grate-fully acknowledged. The assistance of Dr. Chris Lau and as-sociates, US-EPA in Research Triangle Park, in carrying outthe in vivo exposures to PFOS was invaluable to this project.
R
B ctane-oxi-129,
D gene
G .R.,, El-le ofator-118.
G sul-
G envi-
H Sieg-, K.,eveals
H Ben-ules,undSci.
H 001.oro-770.
H e hy-tanecta
H J.P.,by
perfluorinated compounds in rat liver and dolphin kidney epithelialcell lines in vitro and Sprague-Dawley rats in vivo. Toxicol. Sci. 68,429–436.
Hu, W.-Y., Jones, P.D., DeCoen, W., King, L., Fraker, P., Newsted, J.L.,Giesy, J.P., 2002b. Alterations in cell membrane properties caused byperfluorinated compounds. Comp. Biochem. Physiol. 135, 77–88.
Jones, P.D., Hu, W.-Y., De Coen, W., Newsted, J.L., Giesy, J.P., 2002.Binding of Perfluorinated Chemicals to Serum Proteins. Environ. Tox-icol. Chem. (in press).
Kannan, K., Koistinen, J., Beckmen, K., Evans, T., Gorzelany, J.F.,Hansen, K.J., Jones, P.D., Helle, E., Nyman, M., Giesy, J.P., 2001a.Accumulation of perfluorooctane sulfonate in marine mammals. Env-iron. Sci. Technol. 35, 1593–1598.
Kannan, K., Franson, J.C., Bowerman, W.W., Hansen, K.J., Jones, P.D.,Giesy, J.P., 2001b. Perfluorooctane sulfonate in fish-eating water birdsincluding Bald eagles and Albatrosses. Environ. Sci. Technol. 35,3065–3070.
Lau, C., Thibodeaux, J.R., Hanson, R.G., Rogers, J.M., Grey, B.E., Stan-ton, M.E., Butenhoff, J.L., Stevenson, L.A., 2003. Exposure to pe-ruorooctane sulfonate during pregnancy in rat and mouse. II: postnatalevaluation. Toxicol. Sci. 74, 382–392.
Obourn, J.D., Frame, S.R., Bell, R.H., Longnecker, D.S., Elliott, G.S.,Cook, J., 1997. Mechanisms for the pancreatic oncogenic effects ofthe peroxisome proliferator wyeth-14,643. Toxicol. Appl. Pharmacol.145, 425–436.
OECD, 2002. (Organization for Economic Co-operation and De-velopment) (2002). Co-operation on existing chemicals: Hazardassessment of perfluorooctane sulfonate (PFOS) and its salts.ENV/JM/RD(2002)17/FINAL.
Olsen, C.T., Andersen, M.E., 1983. The acute toxicity of perfluorooc-tissue
P 992.en-and83–
R ythro-elim-
R rflu-lipases di-
S Proc.
S M.T.,ane-. 68,
S S.R.,y of–131.
S ierre,omeline.
S rre,ientoxi-
S of66,
S of cy-macol.
eferences
erthiaume, J., Wallace, K.B., 2002. Perfluorooctanoate, perflouroosulfonate, andN-ethyl perfluorooctanesulfonamido ethanol; persome proliferation and mitochondrial biogenesis. Toxicol. Lett.23–32.
uplus, E., Glorian, M., Forest, C., 2000. Fatty acid regulation oftranscription. J. Biol. Chem. 275, 30749–30752.
erhold, D.L., Liu, F., Jiang, G., Li, Z., Xu, J., Lu, M., Sachs, JBagchi, A., Fridman, A., Holder, D.J., Doebber, T.W., Berger, J.brecht, A., Moller, D.E., Zhang, B.B., 2002. Gene expression profiadipocyte differentiation and its regulation by peroxisome proliferactivated receptor-gamma agonists. Endocrinology 143, 2106–2
iesy, J.P., Kannan, K., 2001. Global distribution of perfluorooctanefonate in wildlife. Environ. Sci. Technol. 35, 1339–1342.
iesy, J.P., Kannan, K., 2002. Perfluorochemical surfactants in theronment. Environ. Sci. Technol. 36, 146A–152A.
amadeh, H.K., Bushel, P.R., Jayadev, S., Martin, K., DiSorbo, O.,ber, S., Bennett, L., Tennant, R., Stoll, R., Barrett, C., BlanchardPaules, R.S., Afshari, C.A., 2002a. Gene expression analysis rchemical-specific profiles. Toxicol. Sci. 67, 219–231.
amadeh, H.K., Bushel, P.R., Jayadev, S., Martin, K., DiSorbo, O.,nett, L., Lee, L., Tennant, R., Stoll, R., Barrett, C., Barrett, K., PaR.S., Blanchard, K., Afshari, C.A., 2002b. Prediction of composignature using high density gene expression profiling. Toxicol.67, 232–240.
ansen, K.J., Clemen, L.A., Ellefson, M.E., Johnson, H.O., 2Compound-specific, quantitative characterization of organic fluchemicals in biological matrices. Environ. Sci. Technol. 35, 766–
aughom, B., Spydevold, O., 1992. The mechanism underlying thpolipemic effect of perfluorooctanoic acid (PFOA), perfluoroocsulphonic acid (PFOSA) and clofibric acid. Biochim. Biophys. A1128, 65–72.
u, W.-Y., Jones, P.D., Upham, B.L., Trosko, J.E., Lau, C., Giesy,2002a. Inhibition of gap junctional intercellular communication
tanoic and perfluorodecanoic acids in male rats and effects onfatty acids. Toxicol. Appl. Pharmacol. 70, 362–372.
ermadi, H., Lundgren, B., Anderson, K., Depierre, J.W., 1Effects of perfluoro fatty acids on xenobiotic-metabolizingzymes, enzymes which detoxify reactive forms of oxygenlipid peroxidation in mouse liver. Biochem. Pharmacol. 44, 111191.
avis, W.R., Hoke, J.F., Parsons, D.L., 1991. Perfluorochemical ercyte substitutes: disposition and effects on drug distribution andination. Drug Metab. Rev. 23, 375–411.
eo, N.V., Narayanan, L., Kling, K.B., Adinehzadeh, M., 1996. Peorodecanoic acid, a peroxisome proliferator, activates phosphoC, inhibits CTP: phosphocholine cytidylyltransferase, and elevateacylglycerol in rat liver. Toxicol. Lett. 86, 1–11.
argent, J., Seffl, R., 1970. Properties of perfluorinated liquids. Fed.29, 1699–1703.
eacat, A.M., Thomford, P.J., Hansen, K.J., Olsen, G.W., Case,Butenhoff, J.L., 2002. Subchronic toxicity studies on perfluorooctsulfonate potassium salt in cynomolgus monkeys. Toxicol. Sci249–264.
eacat, A.M., Thomford, P.J., Hansen, K.J., Clemen, L.A., Eldridge,Elcombe, C.R., Butenhoff, J.L., 2003. Sub-chronic dietary toxicitpotassium perfluorooctanesulfonate in rats. Toxicology 183, 117
ohlenius, A.K., Andersson, K., Bergstrand, A., Spydevold, O., De PJ.W., 1994. Effects of perfluorooctanoic acid, a potent peroxisproliferator in rat, on morris hepatoma 7800C1 cells, a rat cellBiochim. Biophys. 1213, 63–74.
ohlenius, A.K., Reinfeldt, M., Backstrom, K., Bergstrand, A., DepieJ.W., 1996. Hepatic peroxisome proliferation in vitamin A deficmice without a simultaneous increase in peroxisomal Acyl-CoAdase activity. Biochem. Pharmacol. 51, 821–827.
tarkov, A.A., Wallace, K.B., 2002. Structural determinantsfluorochemical-induced mitochondrial dysfunction. Toxicol. Sci.244–252.
ueyoshi, T., Negishi, M., 2001. Phenobarbital response elementstochrome P450 genes and nuclear receptors. Annu. Rev. PharToxicol. 41, 123–143.

70 W. Hu et al. / Environmental Toxicology and Pharmacology 19 (2005) 57–70
Thibodeaux, J.R., Hanson, R.G., Rogers, J.M., Grey, B.E., Barbee, B.D.,Richards, J.H., Butenhoff, J.L., Stevenson, L.A., Lau, C., 2003. Ex-posure to peruorooctane sulfonate during pregnancy in rat and mouse.i: maternal and prenatal evaluations. Toxicol. Sci. 74, 369–381.
Tobin, K.A.R., Ulven, S.M., Schuster, G.U., Hermansen Steineger, H., An-dresen, S.M., Gustafsson, J.-A., Nebb, H.I., 2002. Liver X Receptors
as insulin-mediating factors in fatty acid and cholesterol biosynthesis.J. Biol. Chem. 277, 10691–10697.
Wan, Y., Nordeen, S.K., 2002. Overlapping but distinct generegulation profiles by glucocorticoids and progestins inhuman breast cancer cells. Mol. Endocrinol. 16, 1204–1214.