ideal investment period 3+ years
TRANSCRIPT

Refer Pg. No. 2 for Product Labelling
Facts Monthly fund analysis and market reviews
Figures inJune 2017
Transparency. The performance of a mutual fund is reviewed by various rating agencies and publications, making it easy for investors to compare one fund to another. As an investor, you are provided with regular updates, for example daily NAVs, as well as information on the fund's holdings and the fund manager's strategy.
Liquidity. You can redeem all or part of your investment any time you wish and receive the current value of the shares. Mutual Funds are more liquid than most investments in shares, deposits and bonds. Moreover, the process is standardized, making it quick and efficient so that you can get your cash in hand as soon as possible.
Professional management. Qualified professionals manage your money backed by a research team that continuously analyses the performance and prospects of companies. It is a continuous process that takes time and expertise which will add value to your investment.
Affordability. As a small investor, you may find that it is not possible to buy shares of larger corporations. Mutual funds generally buy and sell securities in large volumes which allow investors to benefit from lower trading costs.
Diversification. After investing in mutual funds, you are provided with the benefit of instant diversification and asset allocation without the large amounts of cash needed to create individual portfolios.
Regulations. All mutual funds are required to register with SEBI (Securities & Exchange Board of India). They are obliged to follow strict regulations designed to protect investors. All operations are also regularly monitored by SEBI.
How Mutual Funds can help you invest in EquityBelow mentioned are the added benefits of Equity Mutual Funds:
Why should you invest in Equities?
Ideal Investment Period
3+ years
Equities provide the highest potential returns. Historic data suggests that equities tend to outperform other asset classes over the long-term
Equities are volatile. However, the risk in equities can be managed and mitigated by investing periodically for the long-term after adequate research of the stocks and their underlying business
However, for people who don’t have the expertise, time, or the inclination to take care of their own investments, mutual funds are one of the best vehicles available to invest in equities, which provide investors with professional management, affordability, diversification, transparency, liquidity, regulations, etc
2
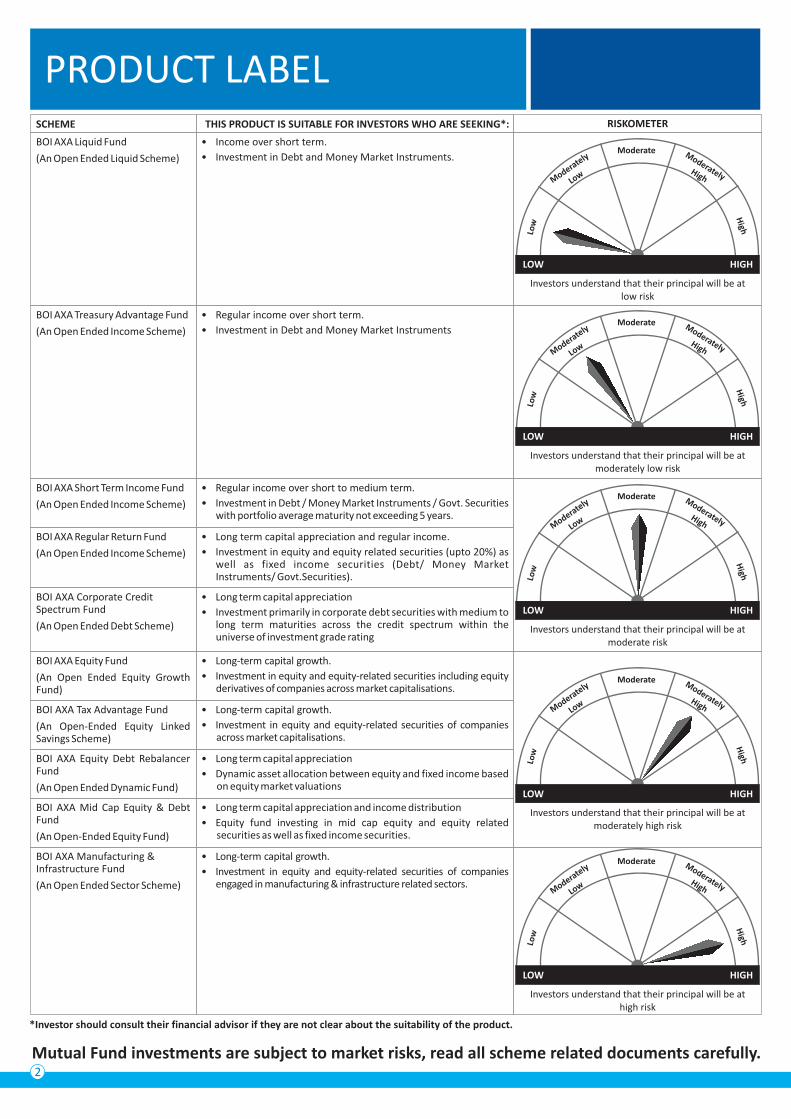
PRODUCT LABEL
*Investor should consult their financial advisor if they are not clear about the suitability of the product.
SCHEME THIS PRODUCT IS SUITABLE FOR INVESTORS WHO ARE SEEKING*:
BOI AXA Treasury Advantage Fund
(An Open Ended Income Scheme)
• Regular income over short term.
• Investment in Debt and Money Market Instruments
BOI AXA Short Term Income Fund
(An Open Ended Income Scheme)
• Regular income over short to medium term.
• Investment in Debt / Money Market Instruments / Govt. Securities with portfolio average maturity not exceeding 5 years.
BOI AXA Regular Return Fund
(An Open Ended Income Scheme)
• Long term capital appreciation and regular income.
• Investment in equity and equity related securities (upto 20%) as well as fixed income securities (Debt/ Money Market Instruments/ Govt.Securities).
BOI AXA Corporate Credit Spectrum Fund
(An Open Ended Debt Scheme)
• Long term capital appreciation
• Investment primarily in corporate debt securities with medium to long term maturities across the credit spectrum within the universe of investment grade rating
RISKOMETER
BOI AXA Equity Fund
(An Open Ended Equity Growth Fund)
• Long-term capital growth.
• Investment in equity and equity-related securities including equity derivatives of companies across market capitalisations.
BOI AXA Tax Advantage Fund
(An Open-Ended Equity Linked Savings Scheme)
• Long-term capital growth.
• Investment in equity and equity-related securities of companies across market capitalisations.
BOI AXA Equity Debt Rebalancer Fund
(An Open Ended Dynamic Fund)
• Long term capital appreciation
• Dynamic asset allocation between equity and fixed income based on equity market valuations
Moderate
Low
High
Moderately
Low
ModeratelyHigh
Investors understand that their principal will be at moderately high risk
LOW HIGH
BOI AXA Manufacturing & Infrastructure Fund
(An Open Ended Sector Scheme)
• Long-term capital growth.
• Investment in equity and equity-related securities of companies engaged in manufacturing & infrastructure related sectors.
Moderate
Low
High
Moderately
Low
ModeratelyHigh
Investors understand that their principal will be at high risk
LOW HIGH
BOI AXA Liquid Fund
(An Open Ended Liquid Scheme)
• Income over short term.
• Investment in Debt and Money Market Instruments.Moderate
Low
High
Moderately
Low
ModeratelyHigh
Investors understand that their principal will be at low risk
LOW HIGH
Moderate
Low
High
Moderately
Low
ModeratelyHigh
Investors understand that their principal will be at moderately low risk
LOW HIGH
Moderate
Low
High
Moderately
Low
ModeratelyHigh
Investors understand that their principal will be at moderate risk
LOW HIGH
BOI AXA Mid Cap Equity & Debt Fund
(An Open-Ended Equity Fund)
• Long term capital appreciation and income distribution
• Equity fund investing in mid cap equity and equity related securities as well as fixed income securities.
Mutual Fund investments are subject to market risks, read all scheme related documents carefully.
3
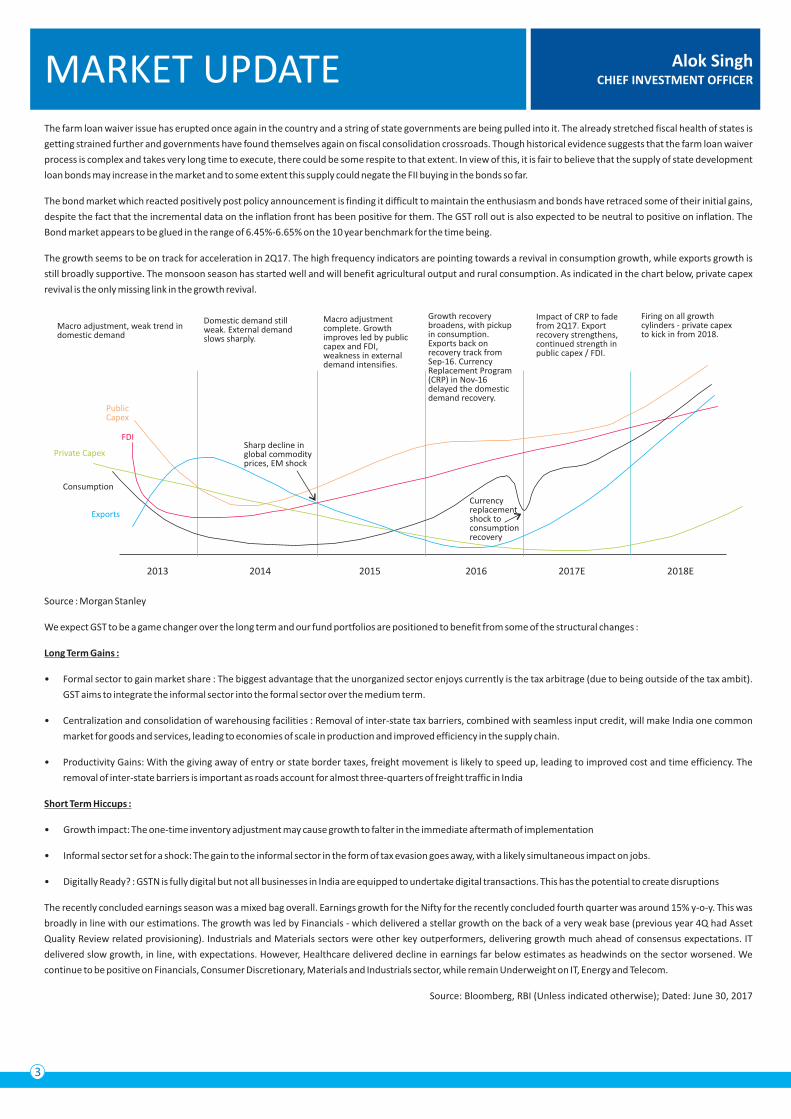
Alok SinghCHIEF INVESTMENT OFFICERMARKET UPDATE
The farm loan waiver issue has erupted once again in the country and a string of state governments are being pulled into it. The already stretched fiscal health of states is
getting strained further and governments have found themselves again on fiscal consolidation crossroads. Though historical evidence suggests that the farm loan waiver
process is complex and takes very long time to execute, there could be some respite to that extent. In view of this, it is fair to believe that the supply of state development
loan bonds may increase in the market and to some extent this supply could negate the FII buying in the bonds so far.
The bond market which reacted positively post policy announcement is finding it difficult to maintain the enthusiasm and bonds have retraced some of their initial gains,
despite the fact that the incremental data on the inflation front has been positive for them. The GST roll out is also expected to be neutral to positive on inflation. The
Bond market appears to be glued in the range of 6.45%-6.65% on the 10 year benchmark for the time being.
The growth seems to be on track for acceleration in 2Q17. The high frequency indicators are pointing towards a revival in consumption growth, while exports growth is
still broadly supportive. The monsoon season has started well and will benefit agricultural output and rural consumption. As indicated in the chart below, private capex
revival is the only missing link in the growth revival.
Source : Morgan Stanley
We expect GST to be a game changer over the long term and our fund portfolios are positioned to benefit from some of the structural changes :
Long Term Gains :
• Formal sector to gain market share : The biggest advantage that the unorganized sector enjoys currently is the tax arbitrage (due to being outside of the tax ambit).
GST aims to integrate the informal sector into the formal sector over the medium term.
• Centralization and consolidation of warehousing facilities : Removal of inter-state tax barriers, combined with seamless input credit, will make India one common
market for goods and services, leading to economies of scale in production and improved efficiency in the supply chain.
• Productivity Gains: With the giving away of entry or state border taxes, freight movement is likely to speed up, leading to improved cost and time efficiency. The
removal of inter-state barriers is important as roads account for almost three-quarters of freight traffic in India
Short Term Hiccups :
• Growth impact: The one-time inventory adjustment may cause growth to falter in the immediate aftermath of implementation
• Informal sector set for a shock: The gain to the informal sector in the form of tax evasion goes away, with a likely simultaneous impact on jobs.
• Digitally Ready? : GSTN is fully digital but not all businesses in India are equipped to undertake digital transactions. This has the potential to create disruptions
The recently concluded earnings season was a mixed bag overall. Earnings growth for the Nifty for the recently concluded fourth quarter was around 15% y-o-y. This was
broadly in line with our estimations. The growth was led by Financials - which delivered a stellar growth on the back of a very weak base (previous year 4Q had Asset
Quality Review related provisioning). Industrials and Materials sectors were other key outperformers, delivering growth much ahead of consensus expectations. IT
delivered slow growth, in line, with expectations. However, Healthcare delivered decline in earnings far below estimates as headwinds on the sector worsened. We
continue to be positive on Financials, Consumer Discretionary, Materials and Industrials sector, while remain Underweight on IT, Energy and Telecom.
Source: Bloomberg, RBI (Unless indicated otherwise); Dated: June 30, 2017
Macro adjustment, weak trend indomestic demand
Domestic demand stillweak. External demandslows sharply.
Macro adjustmentcomplete. Growthimproves led by publiccapex and FDI,weakness in externaldemand intensifies.
Growth recoverybroadens, with pickupin consumption.Exports back onrecovery track fromSep-16. CurrencyReplacement Program(CRP) in Nov-16delayed the domesticdemand recovery.
Impact of CRP to fadefrom 2Q17. Exportrecovery strengthens,continued strength inpublic capex / FDI.
Firing on all growthcylinders - private capexto kick in from 2018.
2013 2014 2015 2016 2017E 2018E
Public Capex
FDI
Private Capex
Consumption
Exports
Sharp decline inglobal commodityprices, EM shock
Currencyreplacementshock toconsumptionrecovery
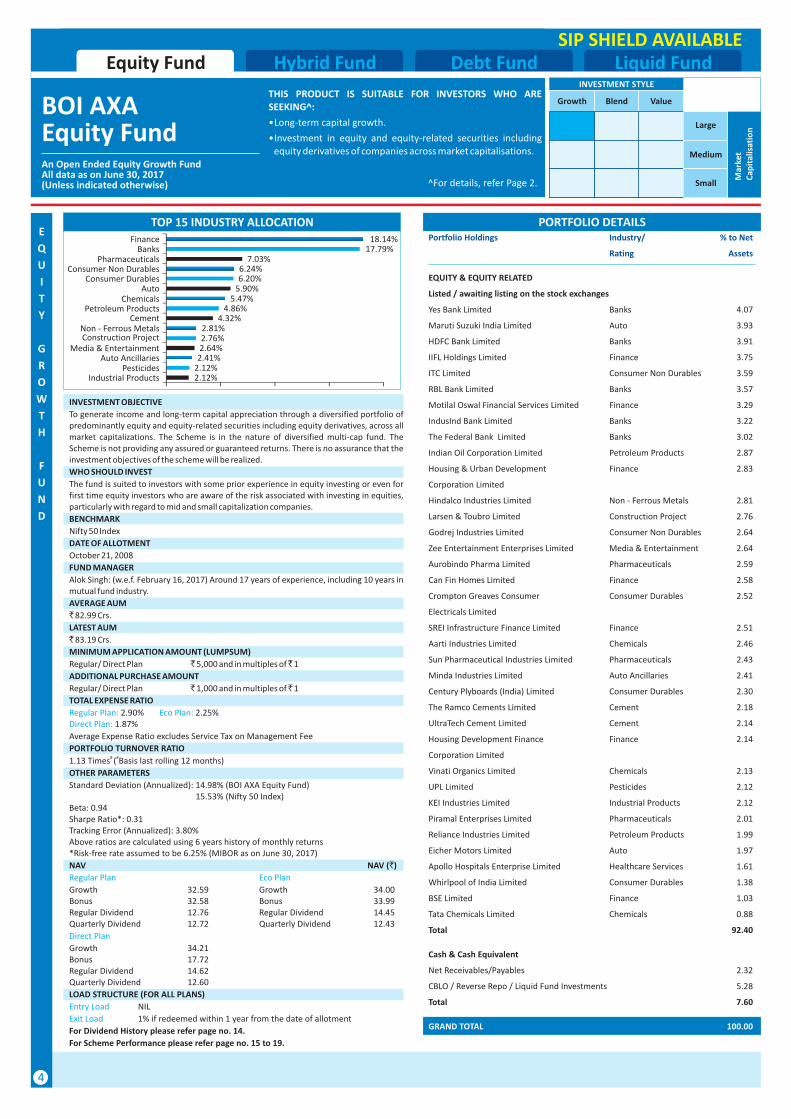
BOI Equity Fund
AXA
An Open Ended Equity Growth FundAll data as on June 30, 2017(Unless indicated otherwise)
E
Q
U
I
T
Y
G
R
O
W
T
H
F
U
N
D
Debt Fund Liquid FundHybrid FundEquity Fund
PORTFOLIO DETAILSPortfolio Holdings Industry/ % to Net
Rating Assets
EQUITY & EQUITY RELATED
Listed / awaiting listing on the stock exchanges
Yes Bank Limited Banks 4.07
Maruti Suzuki India Limited Auto 3.93
HDFC Bank Limited Banks 3.91
IIFL Holdings Limited Finance 3.75
ITC Limited Consumer Non Durables 3.59
RBL Bank Limited Banks 3.57
Motilal Oswal Financial Services Limited Finance 3.29
IndusInd Bank Limited Banks 3.22
The Federal Bank Limited Banks 3.02
Indian Oil Corporation Limited Petroleum Products 2.87
Housing & Urban Development
Corporation Limited
Hindalco Industries Limited Non - Ferrous Metals 2.81
Larsen & Toubro Limited Construction Project 2.76
Godrej Industries Limited Consumer Non Durables 2.64
Zee Entertainment Enterprises Limited Media & Entertainment 2.64
Aurobindo Pharma Limited Pharmaceuticals 2.59
Can Fin Homes Limited Finance 2.58
Crompton Greaves Consumer
Electricals Limited
SREI Infrastructure Finance Limited Finance 2.51
Aarti Industries Limited Chemicals 2.46
Sun Pharmaceutical Industries Limited Pharmaceuticals 2.43
Minda Industries Limited Auto Ancillaries 2.41
Century Plyboards (India) Limited Consumer Durables 2.30
The Ramco Cements Limited Cement 2.18
UltraTech Cement Limited Cement 2.14
Housing Development Finance
Corporation Limited
Vinati Organics Limited Chemicals 2.13
UPL Limited Pesticides 2.12
KEI Industries Limited Industrial Products 2.12
Piramal Enterprises Limited Pharmaceuticals 2.01
Reliance Industries Limited Petroleum Products 1.99
Eicher Motors Limited Auto 1.97
Apollo Hospitals Enterprise Limited Healthcare Services 1.61
Whirlpool of India Limited Consumer Durables 1.38
BSE Limited Finance 1.03
Tata Chemicals Limited Chemicals 0.88
Total 92.40
Cash & Cash Equivalent
Net Receivables/Payables 2.32
CBLO / Reverse Repo / Liquid Fund Investments 5.28
Total 7.60
Finance 2.83
Consumer Durables 2.52
Finance 2.14
GRAND TOTAL 100.00
4
THIS PRODUCT IS SUITABLE FOR INVESTORS WHO ARE SEEKING^:
•Long-term capital growth.
•Investment in equity and equity-related securities including equity derivatives of companies across market capitalisations.
^For details, refer Page 2.
INVESTMENT STYLE
Growth Blend Value
Small
Medium
Large
Mar
ket
Cap
ital
isat
ion
SIP SHIELD AVAILABLE
TOP 15 INDUSTRY ALLOCATION
INVESTMENT OBJECTIVE
To generate income and long-term capital appreciation through a diversified portfolio of predominantly equity and equity-related securities including equity derivatives, across all market capitalizations. The Scheme is in the nature of diversified multi-cap fund. The Scheme is not providing any assured or guaranteed returns. There is no assurance that the investment objectives of the scheme will be realized.
WHO SHOULD INVEST
The fund is suited to investors with some prior experience in equity investing or even for first time equity investors who are aware of the risk associated with investing in equities, particularly with regard to mid and small capitalization companies.
BENCHMARK
Nifty 50 Index
DATE OF ALLOTMENT
October 21, 2008
FUND MANAGER
Alok Singh: (w.e.f. February 16, 2017) Around 17 years of experience, including 10 years in mutual fund industry.
AVERAGE AUM
` 82.99 Crs.
LATEST AUM
` 83.19 Crs.
MINIMUM APPLICATION AMOUNT (LUMPSUM)
Regular/ Direct Plan ` 5,000 and in multiples of ̀ 1
ADDITIONAL PURCHASE AMOUNT
Regular/ Direct Plan ` 1,000 and in multiples of ̀ 1
TOTAL EXPENSE RATIO
2.90% 2.25%1.87%
Average Expense Ratio excludes Service Tax on Management Fee
PORTFOLIO TURNOVER RATIO# #1.13 Times ( Basis last rolling 12 months)
OTHER PARAMETERS
Standard Deviation (Annualized): 14.98% (BOI AXA Equity Fund)15.53% (Nifty 50 Index)
Beta: 0.94Sharpe Ratio*: 0.31Tracking Error (Annualized): 3.80%Above ratios are calculated using 6 years history of monthly returns*Risk-free rate assumed to be 6.25% (MIBOR as on June 30, 2017)
NAV NAV (`)
Growth 32.59 Growth 34.00Bonus 32.58 Bonus 33.99Regular Dividend 12.76 Regular Dividend 14.45Quarterly Dividend 12.72 Quarterly Dividend 12.43
Growth 34.21Bonus 17.72Regular Dividend 14.62Quarterly Dividend 12.60
LOAD STRUCTURE (FOR ALL PLANS)
NIL
1% if redeemed within 1 year from the date of allotment
For Dividend History please refer page no. 14.
For Scheme Performance please refer page no. 15 to 19.
Regular Plan: Eco Plan: Direct Plan:
Regular Plan Eco Plan
Direct Plan
Entry Load
Exit Load
2.12%2.12%2.41%2.64%2.76%2.81%
4.32%4.86%
5.47%5.90%6.20%6.24%
7.03%17.79%
18.14%
Industrial ProductsPesticides
Auto AncillariesMedia & Entertainment
Construction ProjectNon - Ferrous Metals
CementPetroleum Products
ChemicalsAuto
Consumer DurablesConsumer Non Durables
PharmaceuticalsBanks
Finance
E
Q
U
I
T
Y
L
I
N
K
E
D
S
A
V
I
N
G
S
C
H
E
M
E
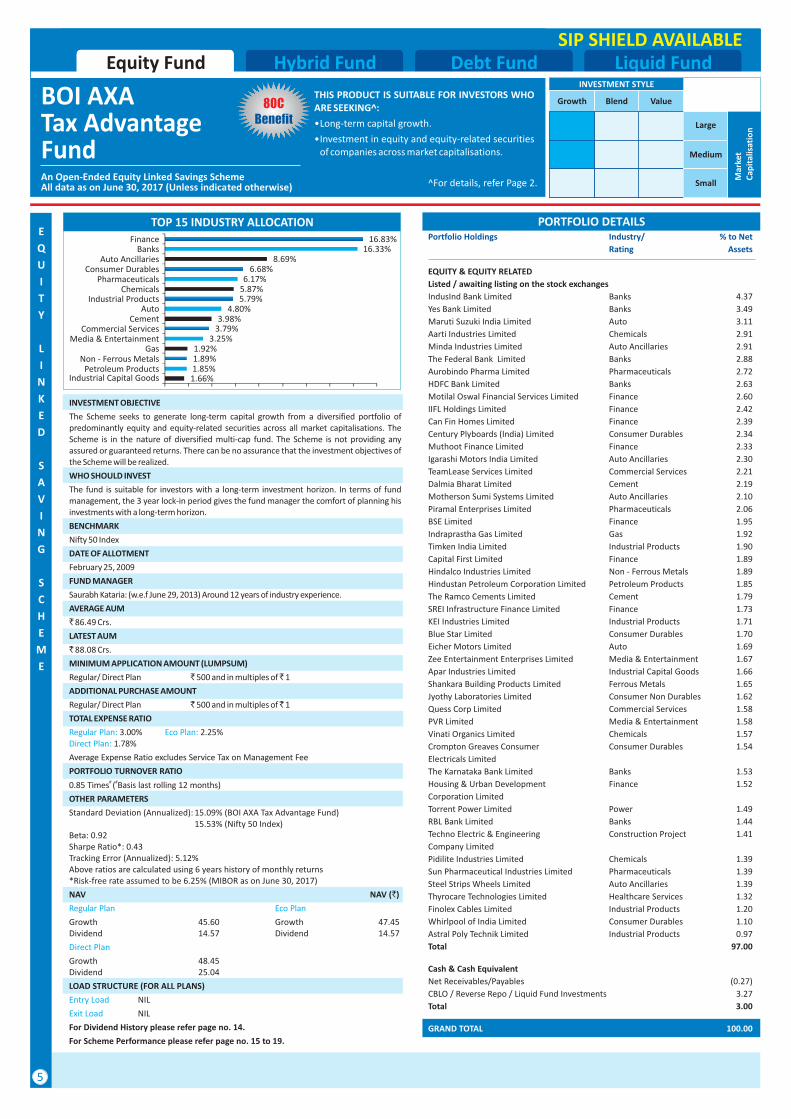
BOI AXATax Advantage FundAn Open-Ended Equity Linked Savings SchemeAll data as on June 30, 2017 (Unless indicated otherwise)
80C Benefit
5
THIS PRODUCT IS SUITABLE FOR INVESTORS WHO ARE SEEKING^:
•Long-term capital growth.
•Investment in equity and equity-related securities of companies across market capitalisations.
PORTFOLIO DETAILSPortfolio Holdings Industry/ % to Net
Rating Assets
EQUITY & EQUITY RELATED
Listed / awaiting listing on the stock exchanges
IndusInd Bank Limited Banks 4.37
Yes Bank Limited Banks 3.49
Maruti Suzuki India Limited Auto 3.11
Aarti Industries Limited Chemicals 2.91
Minda Industries Limited Auto Ancillaries 2.91
The Federal Bank Limited Banks 2.88
Aurobindo Pharma Limited Pharmaceuticals 2.72
HDFC Bank Limited Banks 2.63
Motilal Oswal Financial Services Limited Finance 2.60
IIFL Holdings Limited Finance 2.42
Can Fin Homes Limited Finance 2.39
Century Plyboards (India) Limited Consumer Durables 2.34
Muthoot Finance Limited Finance 2.33
Igarashi Motors India Limited Auto Ancillaries 2.30
TeamLease Services Limited Commercial Services 2.21
Dalmia Bharat Limited Cement 2.19
Motherson Sumi Systems Limited Auto Ancillaries 2.10
Piramal Enterprises Limited Pharmaceuticals 2.06
BSE Limited Finance 1.95
Indraprastha Gas Limited Gas 1.92
Timken India Limited Industrial Products 1.90
Capital First Limited Finance 1.89
Hindalco Industries Limited Non - Ferrous Metals 1.89
Hindustan Petroleum Corporation Limited Petroleum Products 1.85
The Ramco Cements Limited Cement 1.79
SREI Infrastructure Finance Limited Finance 1.73
KEI Industries Limited Industrial Products 1.71
Blue Star Limited Consumer Durables 1.70
Eicher Motors Limited Auto 1.69
Zee Entertainment Enterprises Limited Media & Entertainment 1.67
Apar Industries Limited Industrial Capital Goods 1.66
Shankara Building Products Limited Ferrous Metals 1.65
Jyothy Laboratories Limited Consumer Non Durables 1.62
Quess Corp Limited Commercial Services 1.58
PVR Limited Media & Entertainment 1.58
Vinati Organics Limited Chemicals 1.57
Crompton Greaves Consumer
Electricals Limited
The Karnataka Bank Limited Banks 1.53
Housing & Urban Development
Corporation Limited
Torrent Power Limited Power 1.49
RBL Bank Limited Banks 1.44
Techno Electric & Engineering
Company Limited
Pidilite Industries Limited Chemicals 1.39
Sun Pharmaceutical Industries Limited Pharmaceuticals 1.39
Steel Strips Wheels Limited Auto Ancillaries 1.39
Thyrocare Technologies Limited Healthcare Services 1.32
Finolex Cables Limited Industrial Products 1.20
Whirlpool of India Limited Consumer Durables 1.10
Astral Poly Technik Limited Industrial Products 0.97
Total 97.00
Consumer Durables 1.54
Finance 1.52
Construction Project 1.41
Cash & Cash Equivalent
Net Receivables/Payables (0.27)
CBLO / Reverse Repo / Liquid Fund Investments 3.27
Total 3.00
GRAND TOTAL 100.00
Debt Fund Liquid FundHybrid FundEquity FundINVESTMENT STYLE
Growth Blend Value
Small
Medium
Large
Mar
ket
Cap
ital
isat
ion
^For details, refer Page 2.
INVESTMENT OBJECTIVE
The Scheme seeks to generate long-term capital growth from a diversified portfolio of predominantly equity and equity-related securities across all market capitalisations. The Scheme is in the nature of diversified multi-cap fund. The Scheme is not providing any assured or guaranteed returns. There can be no assurance that the investment objectives of the Scheme will be realized.
WHO SHOULD INVEST
The fund is suitable for investors with a long-term investment horizon. In terms of fund management, the 3 year lock-in period gives the fund manager the comfort of planning his investments with a long-term horizon.
BENCHMARK
Nifty 50 Index
DATE OF ALLOTMENT
February 25, 2009
FUND MANAGER
Saurabh Kataria: Around 12 years of industry experience.
AVERAGE AUM
` 86.49 Crs.
LATEST AUM
` 88.08 Crs.
MINIMUM APPLICATION AMOUNT (LUMPSUM)
Regular/ Direct Plan ` 500 and in multiples of ̀ 1
ADDITIONAL PURCHASE AMOUNT
Regular/ Direct Plan ` 500 and in multiples of ̀ 1
TOTAL EXPENSE RATIO
3.00% 2.25% 1.78%
Average Expense Ratio excludes Service Tax on Management Fee
PORTFOLIO TURNOVER RATIO# #0.85 Times ( Basis last rolling 12 months)
OTHER PARAMETERS
Standard Deviation (Annualized): 15.09% (BOI AXA Tax Advantage Fund)15.53% (Nifty 50 Index)
Beta: 0.92Sharpe Ratio*: 0.43Tracking Error (Annualized): 5.12%Above ratios are calculated using 6 years history of monthly returns*Risk-free rate assumed to be 6.25% (MIBOR as on June 30, 2017)
NAV NAV (`)
Growth 45.60 Growth 47.45Dividend 14.57 Dividend 14.57
Growth 48.45Dividend 25.04
LOAD STRUCTURE (FOR ALL PLANS)
NIL
NIL
For Dividend History please refer page no. 14.
For Scheme Performance please refer page no. 15 to 19.
(w.e.f June 29, 2013)
Regular Plan: Eco Plan: Direct Plan:
Regular Plan Eco Plan
Direct Plan
Entry Load
Exit Load
SIP SHIELD AVAILABLE
TOP 15 INDUSTRY ALLOCATION
1.66%1.85%1.89%1.92%
3.25%3.79%3.98%
4.80%5.79%5.87%6.17%
6.68%8.69%
16.33%16.83%
Industrial Capital GoodsPetroleum Products
Non - Ferrous MetalsGas
Media & EntertainmentCommercial Services
CementAuto
Industrial ProductsChemicals
PharmaceuticalsConsumer Durables
Auto AncillariesBanks
Finance
An Open-Ended Sector Scheme**Fundamental Attributes and Name of the fund have been changed from BOI AXA Focused Infrastructure Fund to BOI AXA Manufacturing & Infrastructure Fund w.e.f. January 19, 2016.All data as on June 30, 2017 (Unless indicated otherwise)
BOI Manufacturing & Infrastructure Fund**
AXA
E
Q
U
I
T
Y
S
E
C
T
O
R
S
C
H
E
M
E
PORTFOLIO DETAILSPortfolio Holdings Industry/ % to Net
Rating Assets
EQUITY & EQUITY RELATED
Listed / awaiting listing on the stock exchanges
Power Grid Corporation of India Limited Power 6.44
Larsen & Toubro Limited Construction Project 5.20
Apar Industries Limited Industrial Capital Goods 4.70
KNR Constructions Limited Construction 3.67
Kalpataru Power Transmission Limited Power 3.51
Maruti Suzuki India Limited Auto 3.49
ITC Limited Consumer Non Durables 3.45
Techno Electric & Engineering
Company Limited
Blue Star Limited Consumer Durables 3.26
The Ramco Cements Limited Cement 3.11
APL Apollo Tubes Limited Ferrous Metals 3.03
Greaves Cotton Limited Industrial Products 2.93
KEI Industries Limited Industrial Products 2.62
Igarashi Motors India Limited Auto Ancillaries 2.61
AIA Engineering Limited Industrial Products 2.50
Kirloskar Brothers Limited Industrial Products 2.44
Torrent Power Limited Power 2.35
Carborundum Universal Limited Industrial Products 2.33
Triveni Turbine Limited Industrial Capital Goods 2.25
Aurobindo Pharma Limited Pharmaceuticals 2.18
Siemens Limited Industrial Capital Goods 2.17
Astra Microwave Products Limited Telecom - Equipment & 2.17
Orient Refractories Limited Industrial Products 2.17
Indian Oil Corporation Limited Petroleum Products 2.15
Aarti Industries Limited Chemicals 2.15
Kirloskar Oil Engines Limited Industrial Products 2.07
Ahluwalia Contracts (India) Limited Construction 2.01
VA Tech Wabag Limited Engineering Services 2.00
Eicher Motors Limited Auto 1.83
Hindalco Industries Limited Non - Ferrous Metals 1.83
Bharti Infratel Limited Telecom - Equipment & 1.81
Astral Poly Technik Limited Industrial Products 1.75
NHPC Limited Power 1.52
Total 91.04
NON-CONVERTIBLE DEBENTURES
NTPC Limited CRISIL AAA 0.22
Total 0.22
Cash & Cash Equivalent
Net Receivables/Payables (1.03)
CBLO / Reverse Repo / Liquid Fund Investments 9.78
Total 8.74
Construction Project 3.31
Accessories
Accessories
GRAND TOTAL 100.00
THIS PRODUCT IS SUITABLE FOR INVESTORS WHO ARE SEEKING^:
•Long-term capital growth.
•Investment in equity and equity-related securities of companies engaged in manufactur ing & infrastructure related sectors.
6
Debt Fund Liquid FundHybrid FundEquity FundINVESTMENT STYLE
Growth Blend Value
Small
Medium
Large
Mar
ket
Cap
ital
isat
ion
^For details, refer Page 2.
EQUITY INDUSTRY ALLOCATION
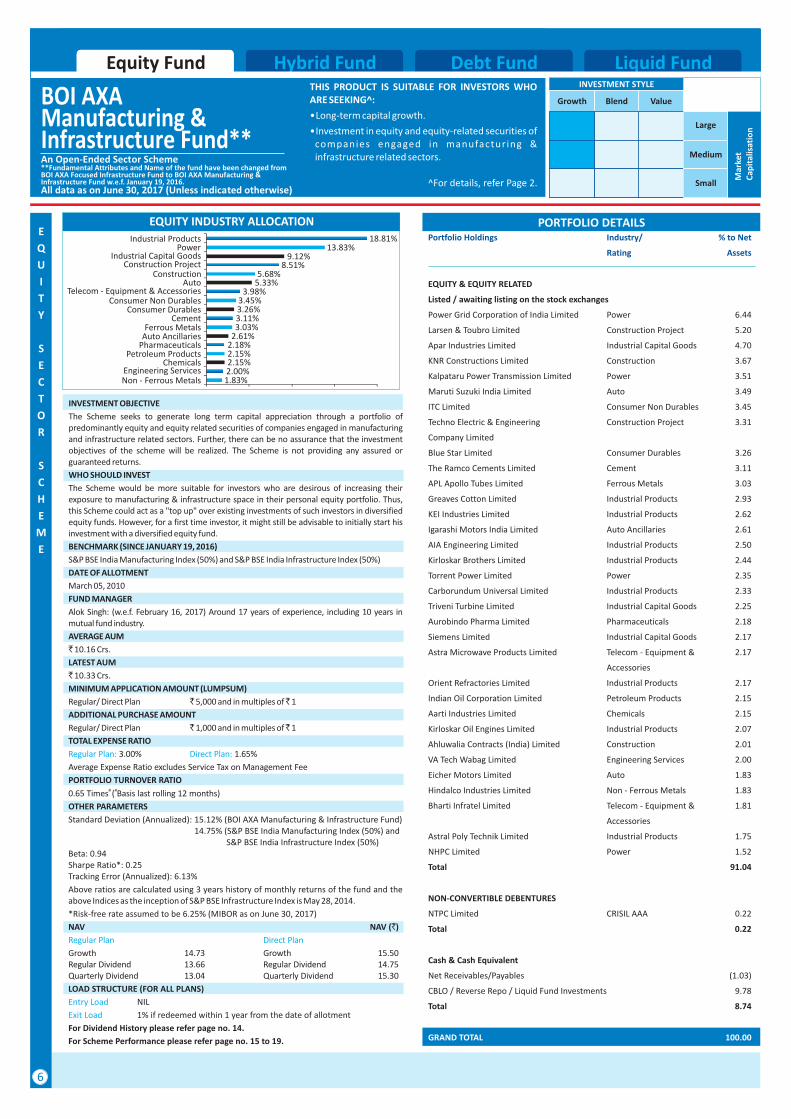
INVESTMENT OBJECTIVE
The Scheme seeks to generate long term capital appreciation through a portfolio of predominantly equity and equity related securities of companies engaged in manufacturing and infrastructure related sectors. Further, there can be no assurance that the investment objectives of the scheme will be realized. The Scheme is not providing any assured or guaranteed returns.
WHO SHOULD INVEST
The Scheme would be more suitable for investors who are desirous of increasing their exposure to manufacturing & infrastructure space in their personal equity portfolio. Thus, this Scheme could act as a "top up" over existing investments of such investors in diversified equity funds. However, for a first time investor, it might still be advisable to initially start his investment with a diversified equity fund.
BENCHMARK (SINCE JANUARY 19, 2016)
S&P BSE India Manufacturing Index (50%) and S&P BSE India Infrastructure Index (50%)
DATE OF ALLOTMENT
March 05, 2010
FUND MANAGER
Alok Singh: (w.e.f. February 16, 2017) Around 17 years of experience, including 10 years in mutual fund industry.
AVERAGE AUM
` 10.16 Crs.
LATEST AUM
` 10.33 Crs.
MINIMUM APPLICATION AMOUNT (LUMPSUM)
Regular/ Direct Plan ` 5,000 and in multiples of ̀ 1
ADDITIONAL PURCHASE AMOUNT
Regular/ Direct Plan ` 1,000 and in multiples of ̀ 1
TOTAL EXPENSE RATIO
3.00% 1.65%
Average Expense Ratio excludes Service Tax on Management Fee
PORTFOLIO TURNOVER RATIO# #0.65 Times ( Basis last rolling 12 months)
OTHER PARAMETERS
Standard Deviation (Annualized): 15.12% (BOI AXA Manufacturing & Infrastructure Fund)14.75% (S&P BSE India Manufacturing Index (50%) and S&P BSE India Infrastructure Index (50%)
Beta: 0.94Sharpe Ratio*: 0.25Tracking Error (Annualized): 6.13%
Above ratios are calculated using 3 years history of monthly returns of the fund and the above Indices as the inception of S&P BSE Infrastructure Index is May 28, 2014.
*Risk-free rate assumed to be 6.25% (MIBOR as on June 30, 2017)
NAV NAV (`)
Growth 14.73 Growth 15.50Regular Dividend 13.66 Regular Dividend 14.75Quarterly Dividend 13.04 Quarterly Dividend 15.30
LOAD STRUCTURE (FOR ALL PLANS)
NIL
1% if redeemed within 1 year from the date of allotment
For Dividend History please refer page no. 14.
For Scheme Performance please refer page no. 15 to 19.
Regular Plan: Direct Plan:
Regular Plan Direct Plan
Entry Load
Exit Load
1.83%2.00%2.15%2.15%2.18%2.61%3.03%3.11%3.26%3.45%
3.98%5.33%5.68%
8.51%9.12%
13.83%18.81%
Non - Ferrous MetalsEngineering Services
ChemicalsPetroleum Products
PharmaceuticalsAuto AncillariesFerrous Metals
CementConsumer Durables
Consumer Non DurablesTelecom - Equipment & Accessories
AutoConstruction
Construction ProjectIndustrial Capital Goods
PowerIndustrial Products
E
Q
U
I
T
Y
S
E
C
T
O
R
S
C
H
E
M
E
PORTFOLIO DETAILSPortfolio Holdings Industry/ % to Net
Rating Assets
EQUITY & EQUITY RELATEDListed / awaiting listing on the stock exchangesApar Industries Limited Industrial Capital Goods 3.40The Federal Bank Limited Banks 2.90Igarashi Motors India Limited Auto Ancillaries 2.82Minda Industries Limited Auto Ancillaries 2.76Heritage Foods Limited Consumer Non Durables 2.67Century Plyboards (India) Limited Consumer Durables 2.42Housing & Urban Development Corporation LimitedSREI Infrastructure Finance Limited Finance 2.30KEI Industries Limited Industrial Products 2.20Godrej Industries Limited Consumer Non Durables 1.85JM Financial Limited Finance 1.81Vinati Organics Limited Chemicals 1.70Carborundum Universal Limited Industrial Products 1.67TeamLease Services Limited Commercial Services 1.63Techno Electric & Engineering Company LimitedApollo Hospitals Enterprise Limited Healthcare Services 1.49Astral Poly Technik Limited Industrial Products 1.48Blue Star Limited Consumer Durables 1.46Indraprastha Gas Limited Gas 1.43Deep Industries Limited Gas 1.41Aarti Industries Limited Chemicals 1.40BSE Limited Finance 1.34IIFL Holdings Limited Finance 1.34Torrent Power Limited Power 1.32Can Fin Homes Limited Finance 1.27V-Mart Retail Limited Retailing 1.27Crompton Greaves Consumer Electricals LimitedAPL Apollo Tubes Limited Ferrous Metals 1.18Timken India Limited Industrial Products 1.09Supreme Industries Limited Industrial Products 1.09Dalmia Bharat Limited Cement 1.03AIA Engineering Limited Industrial Products 1.01RBL Bank Limited Banks 1.00Somany Ceramics Limited Construction 0.96Natco Pharma Limited Pharmaceuticals 0.91Navin Fluorine International Limited Chemicals 0.90Cera Sanitaryware Limited Construction 0.85Finolex Industries Limited Industrial Products 0.82Triveni Turbine Limited Industrial Capital Goods 0.82Muthoot Finance Limited Finance 0.81Steel Strips Wheels Limited Auto Ancillaries 0.78Advanced Enzyme Technologies Limited Consumer Non Durables 0.70PVR Limited Media & Entertainment 0.69Shankara Building Products Limited Ferrous Metals 0.61Kirloskar Brothers Limited Industrial Products 0.58Sudarshan Chemical Industries Limited Chemicals 0.48Total 66.69
BONDS & NCDsDewan Housing Finance Corporation Limited CARE AAA 5.32Housing Development Finance Corporation LimitedJanalakshmi Financial Services Ltd. ICRA A 3.92Indiabulls Housing Finance Limited CARE AAA 0.99Total 14.17
GOVERNMENT BONDGovernment of India SOV 9.19Total 9.19
Cash & Cash EquivalentNet Receivables/Payables 6.43CBLO / Reverse Repo Investments 3.51Total 9.94
Finance 2.31
Construction Project 1.52
Consumer Durables 1.21
CRISIL AAA 3.95
GRAND TOTAL 100.00
7
Debt Fund Liquid FundHybrid FundEquity FundINVESTMENT STYLE
Growth Blend Value
Small
Medium
Large
Mar
ket
Cap
ital
isat
ion
EQUITY INDUSTRY ALLOCATION
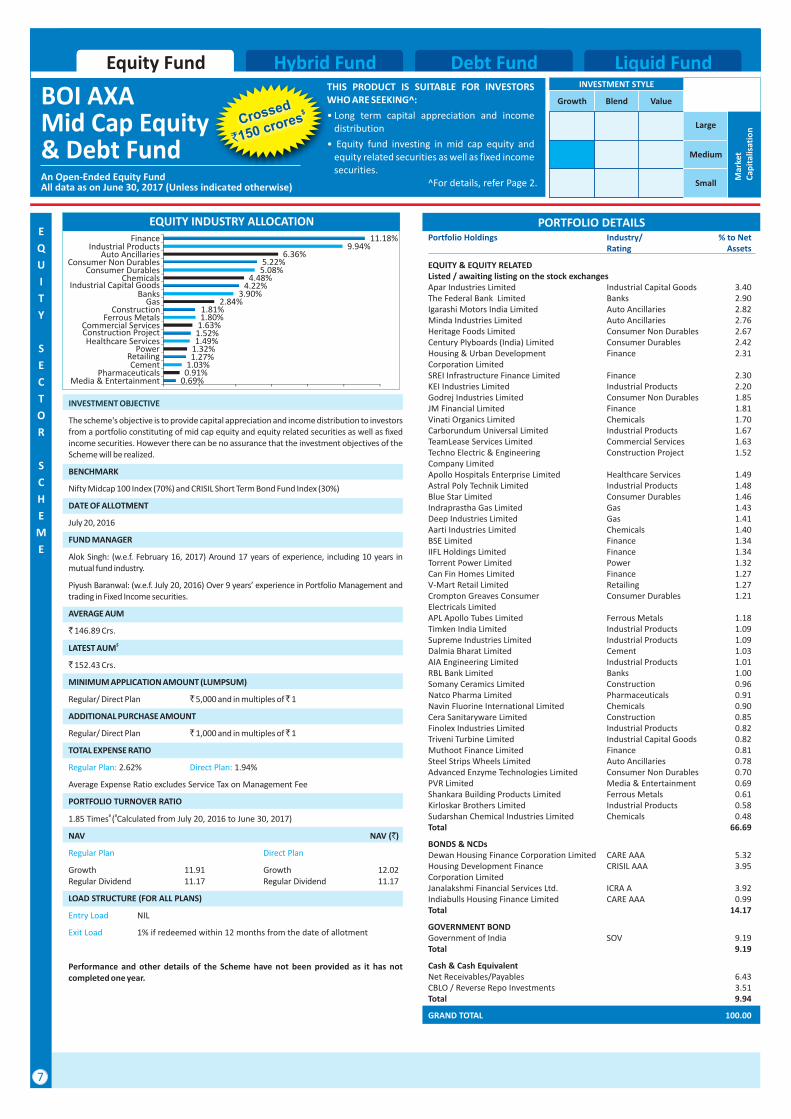
INVESTMENT OBJECTIVE
The scheme's objective is to provide capital appreciation and income distribution to investors from a portfolio constituting of mid cap equity and equity related securities as well as fixed income securities. However there can be no assurance that the investment objectives of the Scheme will be realized.
BENCHMARK
Nifty Midcap 100 Index (70%) and CRISIL Short Term Bond Fund Index (30%)
DATE OF ALLOTMENT
July 20, 2016
FUND MANAGER
Alok Singh: (w.e.f. February 16, 2017) Around 17 years of experience, including 10 years in mutual fund industry.
Piyush Baranwal: Over 9 years’ experience in Portfolio Management and trading in Fixed Income securities.
AVERAGE AUM
` 146.89 Crs.
$LATEST AUM
` 152.43 Crs.
MINIMUM APPLICATION AMOUNT (LUMPSUM)
Regular/ Direct Plan ` 5,000 and in multiples of ̀ 1
ADDITIONAL PURCHASE AMOUNT
Regular/ Direct Plan ` 1,000 and in multiples of ̀ 1
TOTAL EXPENSE RATIO
2.62% 1.94%
Average Expense Ratio excludes Service Tax on Management Fee
PORTFOLIO TURNOVER RATIO
# #1.85 Times ( Calculated from July 20, 2016 to June 30, 2017)
NAV NAV (`)
Growth 11.91 Growth 12.02Regular Dividend 11.17 Regular Dividend 11.17
LOAD STRUCTURE (FOR ALL PLANS)
NIL
1% if redeemed within 12 months from the date of allotment
Performance and other details of the Scheme have not been provided as it has not completed one year.
(w.e.f. July 20, 2016)
Regular Plan: Direct Plan:
Regular Plan Direct Plan
Entry Load
Exit Load
BOI AXA Mid Cap Equity & Debt Fund An Open-Ended Equity FundAll data as on June 30, 2017 (Unless indicated otherwise)
THIS PRODUCT IS SUITABLE FOR INVESTORS WHO ARE SEEKING^:
• Long term capital appreciation and income distribution
• Equity fund investing in mid cap equity and equity related securities as well as fixed income securities.
^For details, refer Page 2.
Crossed$
`150 crores
0.69%0.91%1.03%
1.27%1.32%1.49%1.52%1.63%1.80%1.81%
2.84%3.90%
4.22%4.48%
5.08%5.22%
6.36%9.94%
11.18%
Media & EntertainmentPharmaceuticals
CementRetailing
PowerHealthcare Services
Construction ProjectCommercial Services
Ferrous MetalsConstruction
GasBanks
Industrial Capital GoodsChemicals
Consumer DurablesConsumer Non Durables
Auto AncillariesIndustrial Products
Finance
BOI Equity Debt Rebalancer Fund
AXA
Equity Fund Debt Fund Liquid FundEquity Fund Hybrid Fund
H
Y
B
R
I
D
S
C
H
E
M
E
An Open Ended Dynamic FundAll data as on June 30, 2017 (Unless indicated otherwise)
THIS PRODUCT IS SUITABLE FOR INVESTORS WHO ARE SEEKING^:
•Long term capital appreciation
•Dynamic asset allocation between equity and fixed income based on equity market valuations
8
EQUITY INDUSTRY ALLOCATION
INVESTMENT STYLE
Growth Blend Value
Small
Medium
Large
Mar
ket
Cap
ital
isat
ion
PORTFOLIO DETAILSPortfolio Holdings Industry/ % to Net % to Nav
Rating Assets Derivatives
Portfolio Holdings Industry/ % to Net % to Nav
Rating Assets Derivatives
EQUITY HOLDINGS (UNHEDGED)
Listed / awaiting listing on the
stock exchanges
Bajaj Finance Limited Finance 2.76
IndusInd Bank Limited Banks 2.43
Aurobindo Pharma Limited Pharmaceuticals 2.19
Yes Bank Limited Banks 2.01
Eicher Motors Limited Auto 1.85
Maruti Suzuki India Limited Auto 1.73
HDFC Bank Limited Banks 1.54
Piramal Enterprises Limited Pharmaceuticals 1.46
Reliance Industries Limited Petroleum Products 1.45
ITC Limited Consumer Non Durables 1.33
Hindalco Industries Limited Non - Ferrous Metals 1.24
Pidilite Industries Limited Chemicals 1.10
PNB Housing Finance Limited Finance 1.09
Motherson Sumi Systems Limited Auto Ancillaries 1.06
Marico Limited Consumer Non Durables 1.04
Zee Entertainment Enterprises Limited Media & Entertainment 0.79
Sun Pharmaceutical Industries Limited Pharmaceuticals 0.64
Indian Oil Corporation Limited Petroleum Products 0.53
Equity Holdings (Unhedged) Total 26.24
EQUITY HOLDINGS (HEDGED)
Equity Holdings (Hedged) Total 39.59 (39.64)
Equity Holdings Total 65.83
BONDS & NCDs
Dewan Housing Finance CARE AAA 5.09
Housing Development Finance CRISIL AAA 2.29
Janalakshmi Financial Services Ltd. ICRA A 1.82
IndoStar Capital Finance Ltd CARE AA- 1.38
IDFC Bank Limited ICRA AAA 1.38
Total 11.96
GOVERNMENT BOND
Government of India SOV 7.38
Total 7.38
FIXED DEPOSITS (MARGIN)
HDFC Bank Limited 0.84
Total 0.84
Cash & Cash Equivalent
Net Receivables/(Payables) after 7.81
adjusting for futures
CBLO / Reverse Repo / Liquid Fund Investments 6.18
Total 13.99
For complete list of holdings please visit our website www.boiaxa-im.com
Sun Pharmaceutical Industries Limited Pharmaceuticals 4.22
Sun Pharmaceutical Industries (4.23)
Limited - Future
Indiabulls Housing Finance Limited Finance 3.07
Indiabulls Housing Finance (3.08)
Limited - Future
NHPC Limited Power 2.98
NHPC Limited - Future (3.01)
Other Equity Holding (Hedged) 29.33
Other Stock Futures Holding (Hedged) (29.33)
Corporation Limited
Corporation Limited
MONEY MARKET INSTRUMENTS
GRAND TOTAL 100.00
^For details, refer Page 2.
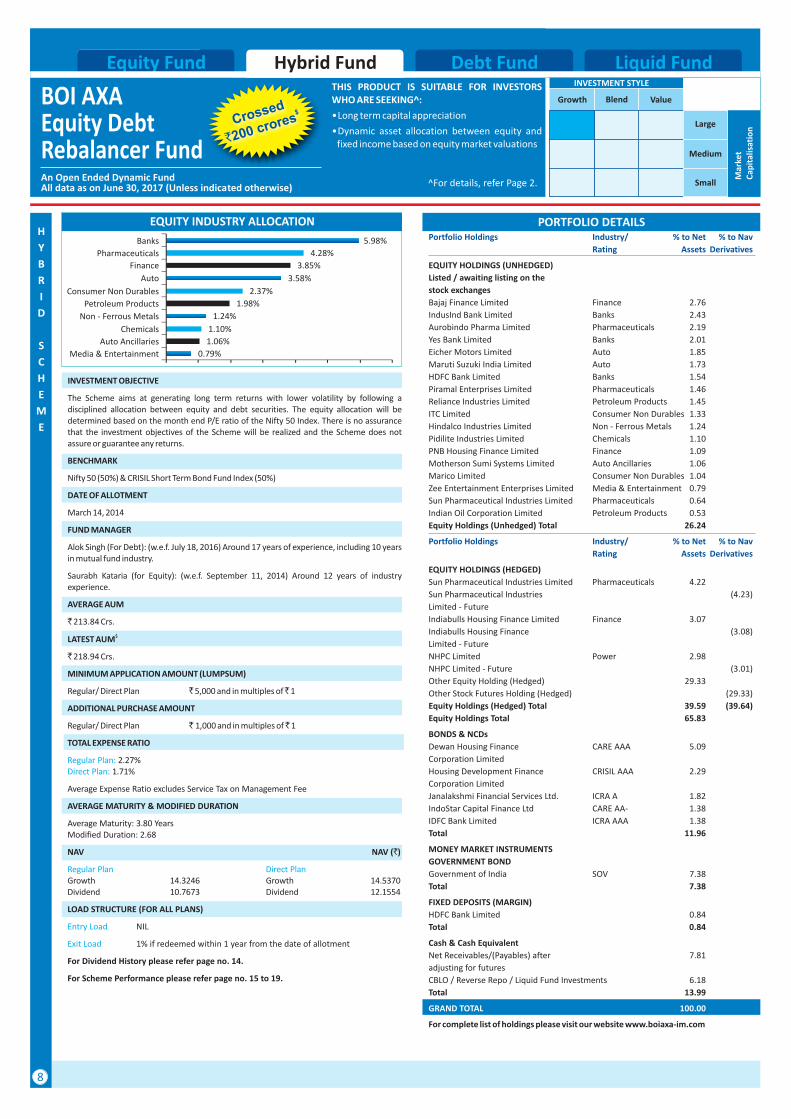
INVESTMENT OBJECTIVE
The Scheme aims at generating long term returns with lower volatility by following a disciplined allocation between equity and debt securities. The equity allocation will be determined based on the month end P/E ratio of the Nifty 50 Index. There is no assurance that the investment objectives of the Scheme will be realized and the Scheme does not assure or guarantee any returns.
BENCHMARK
Nifty 50 (50%) & CRISIL Short Term Bond Fund Index (50%)
DATE OF ALLOTMENT
March 14, 2014
FUND MANAGER
Alok Singh (For Debt): (w.e.f. July 18, 2016) Around 17 years of experience, including 10 years in mutual fund industry.
Saurabh Kataria (for Equity): Around 12 years of industry experience.
AVERAGE AUM
` 213.84 Crs.
$LATEST AUM
` 218.94 Crs.
MINIMUM APPLICATION AMOUNT (LUMPSUM)
Regular/ Direct Plan ` 5,000 and in multiples of ̀ 1
ADDITIONAL PURCHASE AMOUNT
Regular/ Direct Plan ` 1,000 and in multiples of ̀ 1
TOTAL EXPENSE RATIO
2.27% 1.71%
Average Expense Ratio excludes Service Tax on Management Fee
AVERAGE MATURITY & MODIFIED DURATION
Average Maturity: 3.80 YearsModified Duration: 2.68
NAV NAV (`)
LOAD STRUCTURE (FOR ALL PLANS)
NIL
1% if redeemed within 1 year from the date of allotment
For Dividend History please refer page no. 14.
For Scheme Performance please refer page no. 15 to 19.
(w.e.f. September 11, 2014)
Growth 14.3246 Growth 14.5370Dividend 10.7673 Dividend 12.1554
Regular Plan:Direct Plan:
Regular Plan Direct Plan
Entry Load
Exit Load
Crossed$
`200 crores
0.79%
1.06%
1.10%
1.24%
1.98%
2.37%
3.58%
3.85%
4.28%
5.98%
Media & Entertainment
Auto Ancillaries
Chemicals
Non - Ferrous Metals
Petroleum Products
Consumer Non Durables
Auto
Finance
Pharmaceuticals
Banks
An Open Ended Income SchemeAll data as on June 30, 2017(Unless indicated otherwise)
BOI Regular Return Fund
AXA
Equity Fund Debt Fund Liquid FundEquity Fund Hybrid Fund
PORTFOLIO DETAILS
H
Y
B
R
I
D
S
C
H
E
M
E
Portfolio Holdings Industry/ % to Net Rating Assets
Portfolio Holdings Industry/ % to Net Rating Assets
EQUITY & EQUITY RELATEDListed / awaiting listing on the stock exchangesDr. Lal Path Labs Ltd. Healthcare Services 1.03RBL Bank Limited Banks 0.95Shankara Building Products Limited Ferrous Metals 0.93Motilal Oswal Financial Services Limited Finance 0.88Apar Industries Limited Industrial Capital Goods 0.87SREI Infrastructure Finance Limited Finance 0.73Torrent Power Limited Power 0.72Maruti Suzuki India Limited Auto 0.69Housing & Urban Development Finance 0.68
Hindalco Industries Limited Non - Ferrous Metals 0.64Century Plyboards (India) Limited Consumer Durables 0.64Apollo Hospitals Enterprise Limited Healthcare Services 0.63BSE Limited Finance 0.59IIFL Holdings Limited Finance 0.59Minda Industries Limited Auto Ancillaries 0.58Piramal Enterprises Limited Pharmaceuticals 0.57Crompton Greaves Consumer Electricals Limited Consumer Durables 0.54The Federal Bank Limited Banks 0.46Steel Strips Wheels Limited Auto Ancillaries 0.45PVR Limited Media & Entertainment 0.44KEI Industries Limited Industrial Products 0.43Astral Poly Technik Limited Industrial Products 0.42Vinati Organics Limited Chemicals 0.42Advanced Enzyme Technologies Limited Consumer Non Durables 0.39V-Mart Retail Limited Retailing 0.38Sudarshan Chemical Industries Limited Chemicals 0.35L&T Technology Services Limited Software 0.35Timken India Limited Industrial Products 0.35PTC India Limited Power 0.35Blue Star Limited Consumer Durables 0.34Thyrocare Technologies Limited Healthcare Services 0.31Majesco Limited Software 0.28Pidilite Industries Limited Chemicals 0.27UltraTech Cement Limited Cement 0.27Larsen & Toubro Limited Construction Project 0.26Eicher Motors Limited Auto 0.26Aurobindo Pharma Limited Pharmaceuticals 0.21Triveni Turbine Limited Industrial Capital Goods 0.18Sun Pharmaceutical Industries Limited Pharmaceuticals 0.16Total 19.59
BONDS & NCDsHousing Development Finance CRISIL AAA 7.22
IDFC Bank Limited ICRA AAA 6.02Dewan Housing Finance Corporation Limited CARE AAA 4.86IndoStar Capital Finance Ltd CARE AA- 3.62Aadhar Housing Finance Ltd CARE AA+(SO) 3.60Indiabulls Housing Finance Limited CARE AAA 3.01Karuna Healthcare Private Limited IVR A(SO) 2.11NTPC Limited CRISIL AAA 0.02Total 30.46
GOVERNMENT BONDGovernment of India SOV 14.63Total 14.63
Cash & Cash EquivalentNet Receivables/Payables 10.93CBLO / Reverse Repo Investments 12.45Total 23.38
Corporation Limited
Corporation Limited
MONEY MARKET INSTRUMENTSCertificate of Deposit**HDFC Bank Limited CARE A1+ 5.96Total 5.96
Commercial Paper**JM Financial Products Ltd ICRA A1+ 5.97Total 5.97
**Thinly traded/Non traded securities and illiquid securities as defined in SEBI Regulations and Guidelines.
GRAND TOTAL 100.00
THIS PRODUCT IS SUITABLE FOR INVESTORS WHO ARE SEEKING^:
• Long term capital appreciation and regular income.
• Investment in equity and equity related securities (upto 20%) as well as fixed income securities (Debt / Money Market Instruments / Govt. Securities).
9
INVESTMENT STYLE
Growth Blend Value
Small
Medium
Large
Mar
ket
Cap
ital
isat
ion
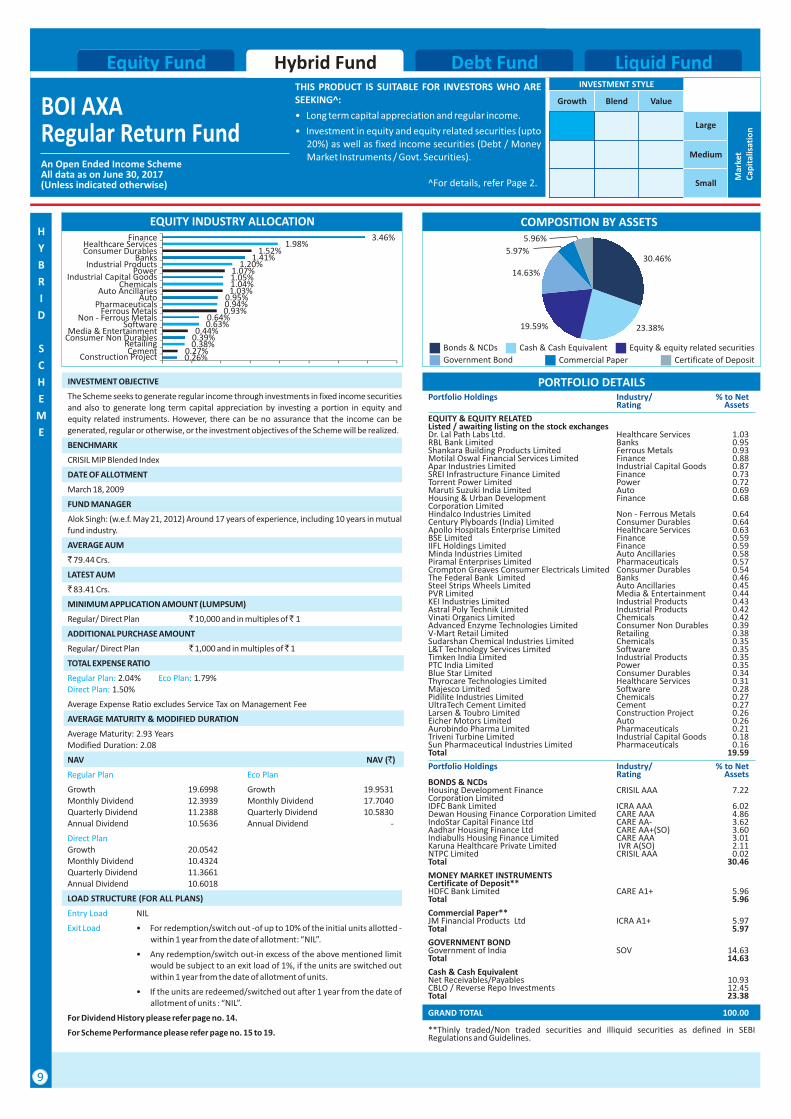
30.46%
19.59%
^For details, refer Page 2.
COMPOSITION BY ASSETSEQUITY INDUSTRY ALLOCATION
INVESTMENT OBJECTIVE
The Scheme seeks to generate regular income through investments in fixed income securities and also to generate long term capital appreciation by investing a portion in equity and equity related instruments. However, there can be no assurance that the income can be generated, regular or otherwise, or the investment objectives of the Scheme will be realized.
BENCHMARK
CRISIL MIP Blended Index
DATE OF ALLOTMENT
March 18, 2009
FUND MANAGER
Alok Singh: (w.e.f. May 21, 2012) Around 17 years of experience, including 10 years in mutual fund industry.
AVERAGE AUM
` 79.44 Crs.
LATEST AUM
` 83.41 Crs.
MINIMUM APPLICATION AMOUNT (LUMPSUM)
Regular/ Direct Plan ` 10,000 and in multiples of ̀ 1
ADDITIONAL PURCHASE AMOUNT
Regular/ Direct Plan ` 1,000 and in multiples of ̀ 1
TOTAL EXPENSE RATIO
2.04% 1.79% 1.50%
Average Expense Ratio excludes Service Tax on Management Fee
AVERAGE MATURITY & MODIFIED DURATION
Average Maturity: 2.93 YearsModified Duration: 2.08
NAV NAV (`)
Growth 19.6998 Growth 19.9531Monthly Dividend 12.3939 Monthly Dividend 17.7040Quarterly Dividend 11.2388 Quarterly Dividend 10.5830Annual Dividend 10.5636 Annual Dividend -
LOAD STRUCTURE (FOR ALL PLANS)
NIL
• For redemption/switch out -of up to 10% of the initial units allotted - within 1 year from the date of allotment: “NIL”.
• Any redemption/switch out-in excess of the above mentioned limit would be subject to an exit load of 1%, if the units are switched out within 1 year from the date of allotment of units.
• If the units are redeemed/switched out after 1 year from the date of allotment of units :
For Dividend History please refer page no. 14.
For Scheme Performance please refer page no. 15 to 19.
Regular Plan: Eco Plan: Direct Plan:
Regular Plan Eco Plan
Direct Plan
Entry Load
Exit Load
Growth 20.0542Monthly Dividend 10.4324Quarterly Dividend 11.3661Annual Dividend 10.6018
“NIL”.
5.96%
0.26%0.27%
0.38%0.39%0.44%
0.63%0.64%
0.93%0.94%0.95%
1.03%1.04%1.05%1.07%
1.20%1.41%
1.52%1.98%
3.46%
Construction ProjectCement
RetailingConsumer Non DurablesMedia & Entertainment
SoftwareNon - Ferrous Metals
Ferrous MetalsPharmaceuticals
AutoAuto Ancillaries
ChemicalsIndustrial Capital Goods
PowerIndustrial Products
BanksConsumer DurablesHealthcare Services
Finance
Government Bond Commercial Paper
Bonds & NCDs Cash & Cash Equivalent Equity & equity related securities
Certificate of Deposit
23.38%
14.63%
5.97%
10
COMPOSITION BY ASSETS
BOI Corporate CreditSpectrum Fund
AXA Equity Fund Debt Fund Liquid FundHybrid FundEquity Fund
D
E
B
T
S
C
H
E
M
E
PORTFOLIO DETAILSPortfolio Holdings Industry/ % to Net
Rating Assets
BONDS & NCDs
Listed / awaiting listing on the stock exchanges
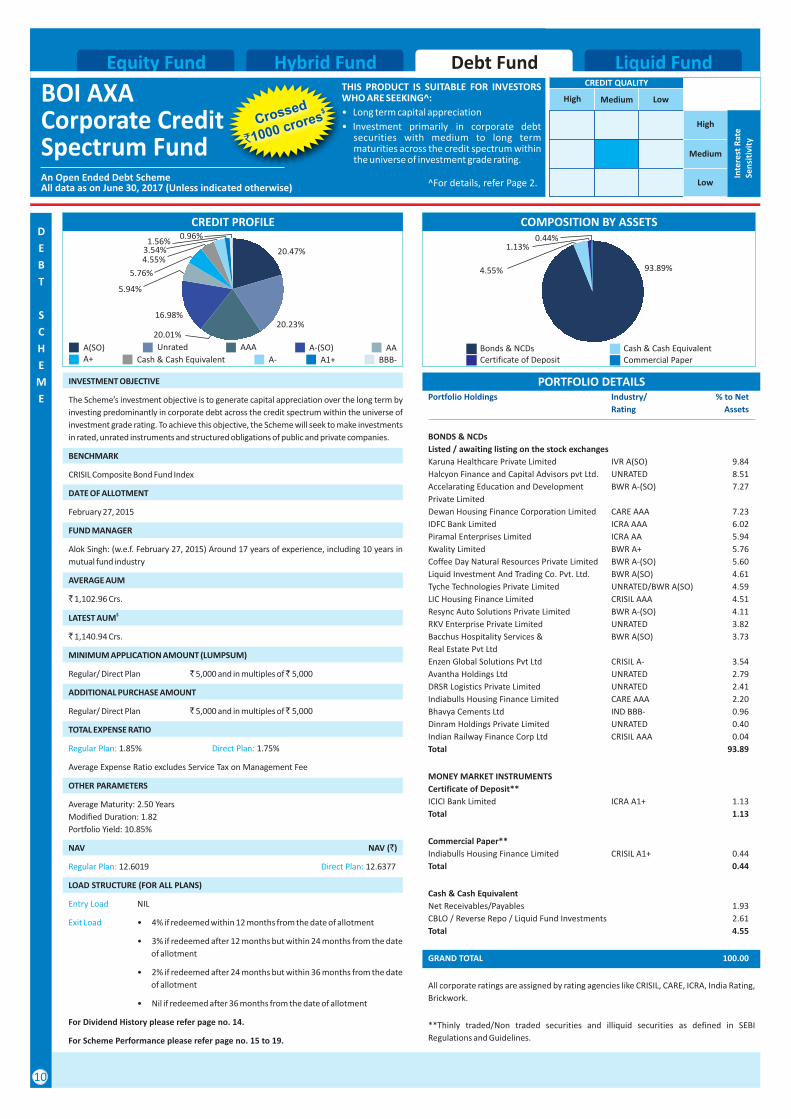
Karuna Healthcare Private Limited IVR A(SO) 9.84
Halcyon Finance and Capital Advisors pvt Ltd. UNRATED 8.51
Accelarating Education and Development BWR A-(SO) 7.27
Dewan Housing Finance Corporation Limited CARE AAA 7.23
IDFC Bank Limited ICRA AAA 6.02
Piramal Enterprises Limited ICRA AA 5.94
Kwality Limited BWR A+ 5.76
Coffee Day Natural Resources Private Limited BWR A-(SO) 5.60
Liquid Investment And Trading Co. Pvt. Ltd. BWR A(SO) 4.61
Tyche Technologies Private Limited UNRATED/BWR A(SO) 4.59
LIC Housing Finance Limited CRISIL AAA 4.51
Resync Auto Solutions Private Limited BWR A-(SO) 4.11
RKV Enterprise Private Limited UNRATED 3.82
Bacchus Hospitality Services & BWR A(SO) 3.73
Enzen Global Solutions Pvt Ltd CRISIL A- 3.54
Avantha Holdings Ltd UNRATED 2.79
DRSR Logistics Private Limited UNRATED 2.41
Indiabulls Housing Finance Limited CARE AAA 2.20
Bhavya Cements Ltd IND BBB- 0.96
Dinram Holdings Private Limited UNRATED 0.40
Indian Railway Finance Corp Ltd CRISIL AAA 0.04
Total 93.89
MONEY MARKET INSTRUMENTS
Certificate of Deposit**
Total 1.13
Commercial Paper**
Indiabulls Housing Finance Limited CRISIL A1+ 0.44
Total
Cash & Cash Equivalent
Net Receivables/Payables 1.93
CBLO / Reverse Repo / Liquid Fund Investments 2.61
Total 4.55
Private Limited
Real Estate Pvt Ltd
ICICI Bank Limited ICRA A1+ 1.13
0.44
All corporate ratings are assigned by rating agencies like CRISIL, CARE, ICRA, India Rating,
Brickwork.
**Thinly traded/Non traded securities and illiquid securities as defined in SEBI
Regulations and Guidelines.
GRAND TOTAL 100.00
CREDIT PROFILE
CREDIT QUALITY
High Medium Low
Low
Medium
High
Inte
rest
Rat
eSe
nsi
tivi
ty
An Open Ended Debt SchemeAll data as on June 30, 2017 (Unless indicated otherwise)
3.54%
THIS PRODUCT IS SUITABLE FOR INVESTORS WHO ARE SEEKING^:
• Long term capital appreciation
• Investment primarily in corporate debt securities with medium to long term maturities across the credit spectrum within the universe of investment grade rating.
20.47%
16.98%
5.94%
20.01%20.23%
10
^For details, refer Page 2.
93.89%
0.44%
INVESTMENT OBJECTIVE
The Scheme’s investment objective is to generate capital appreciation over the long term by
investing predominantly in corporate debt across the credit spectrum within the universe of
investment grade rating. To achieve this objective, the Scheme will seek to make investments
in rated, unrated instruments and structured obligations of public and private companies.
BENCHMARK
CRISIL Composite Bond Fund Index
DATE OF ALLOTMENT
February 27, 2015
FUND MANAGER
Alok Singh: (w.e.f. February 27, 2015) Around 17 years of experience, including 10 years in
mutual fund industry
AVERAGE AUM
` 1,102.96 Crs.
$LATEST AUM
` 1,140.94 Crs.
MINIMUM APPLICATION AMOUNT (LUMPSUM)
Regular/ Direct Plan ` 5,000 and in multiples of ̀ 5,000
ADDITIONAL PURCHASE AMOUNT
Regular/ Direct Plan ` 5,000 and in multiples of ̀ 5,000
TOTAL EXPENSE RATIO
1.85% 1.75%
Average Expense Ratio excludes Service Tax on Management Fee
OTHER PARAMETERS
Average Maturity: 2.50 Years
Modified Duration: 1.82
Portfolio Yield: 10.85%
NAV NAV (`)
LOAD STRUCTURE (FOR ALL PLANS)
NIL
• 4% if redeemed within 12 months from the date of allotment
• 3% if redeemed after 12 months but within 24 months from the date
of allotment
• 2% if redeemed after 24 months but within 36 months from the date
of allotment
• Nil if redeemed after 36 months from the date of allotment
For Dividend History please refer page no. 14.
For Scheme Performance please refer page no. 15 to 19.
Regular Plan: Direct Plan:
Regular Plan: Direct Plan:
Entry Load
Exit Load
12.6019 12.6377
0.96%1.56%
1.13%
4.55%4.55%
Crossed $
`1000 crores
Commercial PaperBonds & NCDs Cash & Cash EquivalentCertificate of Deposit
5.76%
A1+
A(SO) A-(SO)Unrated AAA AA
BBB-A-A+ Cash & Cash Equivalent
Duration % of Assets
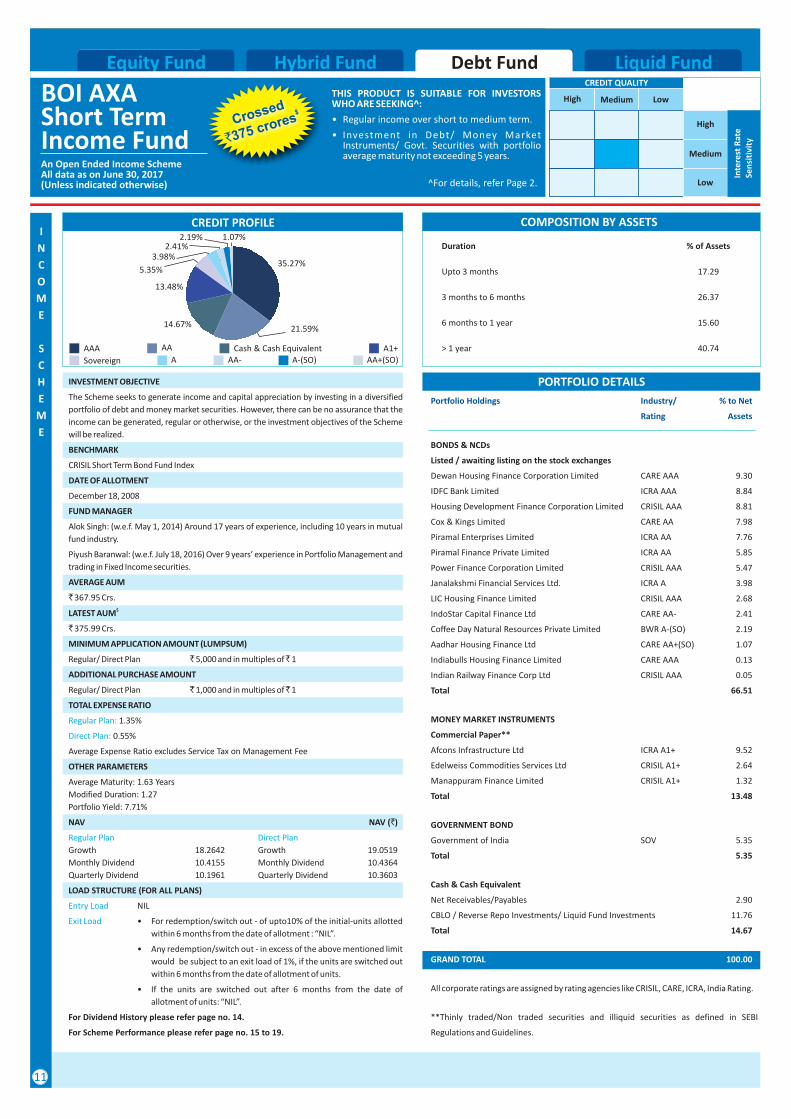
Upto 3 months 17.29
3 months to 6 months 26.37
6 months to 1 year 15.60
> 1 year 40.74
An Open Ended Income SchemeAll data as on June 30, 2017(Unless indicated otherwise)
BOI Short TermIncome Fund
AXA Equity Fund Hybrid Fund Liquid FundDebt Fund Liquid FundHybrid FundEquity Fund
I
N
C
O
M
E
S
C
H
E
M
E
PORTFOLIO DETAILS
Portfolio Holdings Industry/ % to Net
Rating Assets
BONDS & NCDs
Listed / awaiting listing on the stock exchanges
Dewan Housing Finance Corporation Limited CARE AAA 9.30
IDFC Bank Limited ICRA AAA 8.84
Housing Development Finance Corporation Limited CRISIL AAA 8.81
Cox & Kings Limited CARE AA 7.98
Piramal Enterprises Limited ICRA AA 7.76
Piramal Finance Private Limited ICRA AA 5.85
Power Finance Corporation Limited CRISIL AAA 5.47
Janalakshmi Financial Services Ltd. ICRA A 3.98
LIC Housing Finance Limited CRISIL AAA 2.68
IndoStar Capital Finance Ltd CARE AA- 2.41
Coffee Day Natural Resources Private Limited BWR A-(SO) 2.19
Aadhar Housing Finance Ltd CARE AA+(SO) 1.07
Indiabulls Housing Finance Limited CARE AAA 0.13
Indian Railway Finance Corp Ltd CRISIL AAA 0.05
Total 66.51
MONEY MARKET INSTRUMENTS
Commercial Paper**
Afcons Infrastructure Ltd ICRA A1+ 9.52
Edelweiss Commodities Services Ltd CRISIL A1+ 2.64
Manappuram Finance Limited CRISIL A1+ 1.32
Total 13.48
GOVERNMENT BOND
Government of India SOV 5.35
Total 5.35
Cash & Cash Equivalent
Net Receivables/Payables 2.90
CBLO / Reverse Repo Investments/ Liquid Fund Investments 11.76
Total 14.67
GRAND TOTAL 100.00
All corporate ratings are assigned by rating agencies like CRISIL, CARE, ICRA, India Rating.
**Thinly traded/Non traded securities and illiquid securities as defined in SEBI
Regulations and Guidelines.
THIS PRODUCT IS SUITABLE FOR INVESTORS WHO ARE SEEKING^:
• Regular income over short to medium term.
• Investment in Debt/ Money Market Instruments/ Govt. Securities with portfolio average maturity not exceeding 5 years.
11
CREDIT QUALITY
High Medium Low
Low
Medium
High
Inte
rest
Rat
eSe
nsi
tivi
ty
COMPOSITION BY ASSETSCREDIT PROFILE
^For details, refer Page 2.
INVESTMENT OBJECTIVE
The Scheme seeks to generate income and capital appreciation by investing in a diversified
portfolio of debt and money market securities. However, there can be no assurance that the
income can be generated, regular or otherwise, or the investment objectives of the Scheme
will be realized.
BENCHMARK
CRISIL Short Term Bond Fund Index
DATE OF ALLOTMENT
December 18, 2008
FUND MANAGER
Alok Singh: (w.e.f. May 1, 2014) Around 17 years of experience, including 10 years in mutual
fund industry.
Piyush Baranwal: (w.e.f. July 18, 2016) Over 9 years’ experience in Portfolio Management and
trading in Fixed Income securities.
AVERAGE AUM
` 367.95 Crs.$LATEST AUM
` 375.99 Crs.
MINIMUM APPLICATION AMOUNT (LUMPSUM)
Regular/ Direct Plan ` 5,000 and in multiples of ̀ 1
ADDITIONAL PURCHASE AMOUNT
Regular/ Direct Plan ` 1,000 and in multiples of ̀ 1
TOTAL EXPENSE RATIO
1.35%
0.55%
Average Expense Ratio excludes Service Tax on Management Fee
OTHER PARAMETERS
Average Maturity: 1.63 Years
Modified Duration: 1.27
Portfolio Yield: 7.71%
NAV NAV (`)
LOAD STRUCTURE (FOR ALL PLANS)
NIL
• For redemption/switch out - of upto10% of the initial-units allotted
within 6 months from the date of allotment : “NIL”.
• Any redemption/switch out - in excess of the above mentioned limit
would be subject to an exit load of 1%, if the units are switched out
within 6 months from the date of allotment of units.
• If the units are switched out after 6 months from the date of
allotment of units: “NIL”.
For Dividend History please refer page no. 14.
For Scheme Performance please refer page no. 15 to 19.
Regular Plan:
Direct Plan:
Regular Plan Direct Plan
Entry Load
Exit Load
Growth 18.2642 Growth 19.0519
Monthly Dividend 10.4155 Monthly Dividend 10.4364
Quarterly Dividend 10.1961 Quarterly Dividend 10.3603
2.41%
35.27%5.35%
21.59%
3.98%
1.07%
13.48%
2.19%
Crossed$
`375 crores
14.67%
A-(SO)AAA AA Cash & Cash Equivalent
AA- AA+(SO)ASovereign
A1+
BOI TreasuryAdvantage Fund
AXA Equity Fund Debt Fund Liquid FundHybrid FundEquity Fund
I
N
C
O
M
E
S
C
H
E
M
E
THIS PRODUCT IS SUITABLE FOR INVESTORS WHO ARE SEEKING^:
• Regular income over short term.
• Investment in Debt and Money Market Instruments
12
PORTFOLIO DETAILSPortfolio Holdings Industry/ % to Net
Rating Assets
BONDS & NCDs
Listed / awaiting listing on the stock exchanges
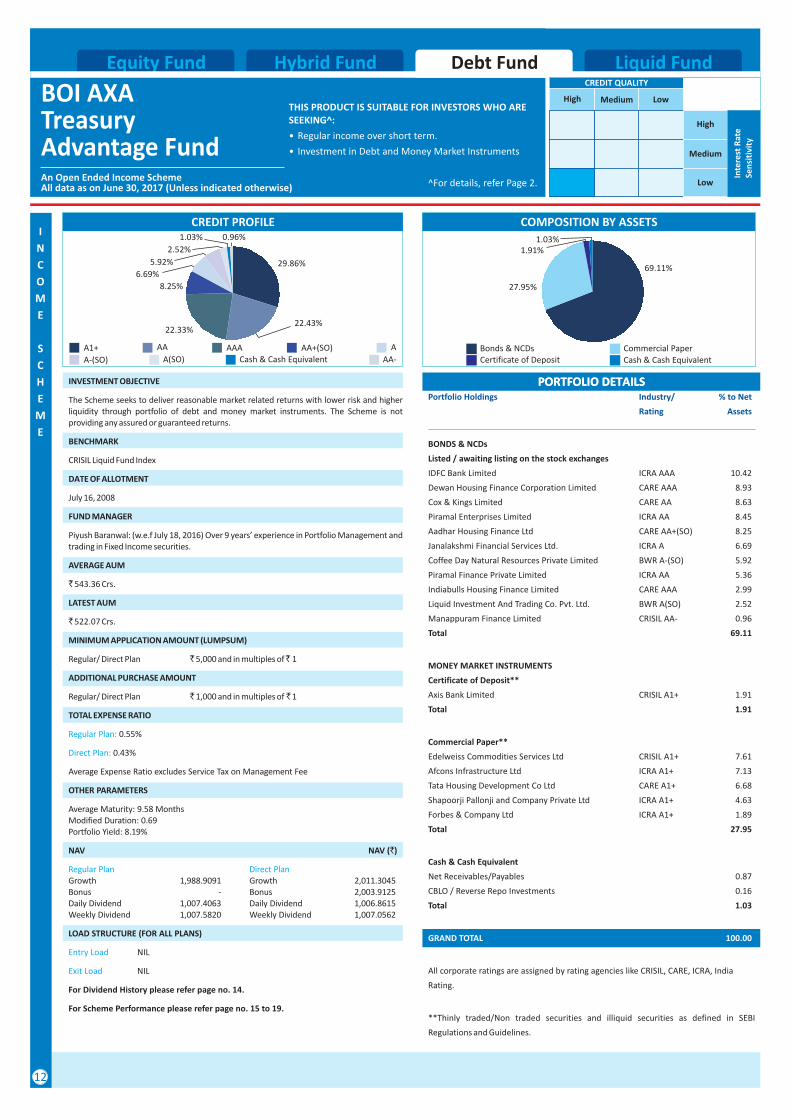
IDFC Bank Limited ICRA AAA 10.42
Dewan Housing Finance Corporation Limited CARE AAA 8.93
Cox & Kings Limited CARE AA 8.63
Piramal Enterprises Limited ICRA AA 8.45
Aadhar Housing Finance Ltd CARE AA+(SO) 8.25
Janalakshmi Financial Services Ltd. ICRA A 6.69
Coffee Day Natural Resources Private Limited BWR A-(SO) 5.92
Piramal Finance Private Limited ICRA AA 5.36
Indiabulls Housing Finance Limited CARE AAA 2.99
Liquid Investment And Trading Co. Pvt. Ltd. BWR A(SO) 2.52
Manappuram Finance Limited CRISIL AA- 0.96
Total 69.11
MONEY MARKET INSTRUMENTS
Commercial Paper**
Edelweiss Commodities Services Ltd CRISIL A1+ 7.61
Afcons Infrastructure Ltd ICRA A1+ 7.13
Tata Housing Development Co Ltd CARE A1+ 6.68
Shapoorji Pallonji and Company Private Ltd ICRA A1+ 4.63
Forbes & Company Ltd ICRA A1+ 1.89
Total 27.95
Cash & Cash Equivalent
Net Receivables/Payables 0.87
CBLO / Reverse Repo Investments 0.16
Total 1.03
Certificate of Deposit**
Axis Bank Limited CRISIL A1+ 1.91
Total 1.91
All corporate ratings are assigned by rating agencies like CRISIL, CARE, ICRA, India
Rating.
**Thinly traded/Non traded securities and illiquid securities as defined in SEBI
Regulations and Guidelines.
GRAND TOTAL 100.00
CREDIT QUALITY
High Medium Low
Low
Medium
High
Inte
rest
Rat
eSe
nsi
tivi
ty
An Open Ended Income SchemeAll data as on June 30, 2017 (Unless indicated otherwise) ^For details, refer Page 2.
INVESTMENT OBJECTIVE
The Scheme seeks to deliver reasonable market related returns with lower risk and higher liquidity through portfolio of debt and money market instruments. The Scheme is not providing any assured or guaranteed returns.
BENCHMARK
CRISIL Liquid Fund Index
DATE OF ALLOTMENT
July 16, 2008
FUND MANAGER
Piyush Baranwal: Over 9 years’ experience in Portfolio Management and trading in Fixed Income securities.
AVERAGE AUM
` 543.36 Crs.
LATEST AUM
` 522.07 Crs.
MINIMUM APPLICATION AMOUNT (LUMPSUM)
Regular/ Direct Plan ` 5,000 and in multiples of ̀ 1
ADDITIONAL PURCHASE AMOUNT
Regular/ Direct Plan ` 1,000 and in multiples of ̀ 1
TOTAL EXPENSE RATIO
0.55%
0.43%
Average Expense Ratio excludes Service Tax on Management Fee
OTHER PARAMETERS
Average Maturity: 9.58 MonthsModified Duration: 0.69Portfolio Yield: 8.19%
NAV NAV (`)
LOAD STRUCTURE (FOR ALL PLANS)
NIL
NIL
For Dividend History please refer page no. 14.
For Scheme Performance please refer page no. 15 to 19.
(w.e.f July 18, 2016)
Growth 1,988.9091 Growth 2,011.3045Bonus - Bonus 2,003.9125Daily Dividend 1,007.4063 Daily Dividend 1,006.8615Weekly Dividend 1,007.5820 Weekly Dividend 1,007.0562
Regular Plan:
Direct Plan:
Regular Plan Direct Plan
Entry Load
Exit Load
COMPOSITION BY ASSETSCREDIT PROFILE
Cash & Cash EquivalentA1+ AA AAA AA+(SO) A
AA-A(SO)A-(SO)
69.11%
1.03%
27.95%
2.52%
29.86%6.69%
22.43%
5.92%
0.96%
8.25%
1.03%
22.33%
PORTFOLIO DETAILS
Cash & Cash EquivalentBonds & NCDs Commercial PaperCertificate of Deposit
1.91%
An Open Ended Liquid SchemeAll data as on June 30, 2017(Unless indicated otherwise)
BOI Liquid Fund
AXA
Debt FundHybrid FundEquity Fund Liquid Fund
L
I
Q
U
I
D
S
C
H
E
M
E
THIS PRODUCT IS SUITABLE FOR INVESTORS WHO ARE SEEKING^:
• Income over short term.
• Investment in Debt and Money Market Instruments.
# Disclaimer for CRISIL AAAmfs: The assigned rating AAAmfs is valid only for “BOI AXA Liquid Fund”. The rating of CRISIL is not an opinion of the Asset Management Company’s willingness or ability to make timely payments to the investor. The rating is also not an opinion on the stability of the NAV of the Fund, which could vary with market developments.The rating indicates that the funds' portfolios will provide 'very strong' protection against losses from credit default. CRISIL's assessment of a rated fund's credit quality is based on the creditworthiness of the fund's portfolio. CRISIL reserves the right to suspend, withdraw or revise the ratings assigned to the scheme at any time on the basis of new information, or unavailability of information or other circumstances, which CRISIL believes, may have an impact on the rating. For detail methodology, please visit CRISIL's website www.crisil.com. Past performance is no guarantee of the future results.$Disclaimer for ICRA AAAmfs: Schemes with this rating are considered to have the highest degree of safety regarding timely receipt of payments from the investments that they have made. This rating should however, not be construed as an indication of the performance of the Mutual Fund scheme or of volatility in its returns. The rating should not be treated as a recommendation to buy, sell or hold units issued by the Mutual Fund.
PORTFOLIO DETAILSPortfolio Holdings Industry/ % to Net
Rating Assets
MONEY MARKET INSTRUMENTS
Certificate of Deposit**
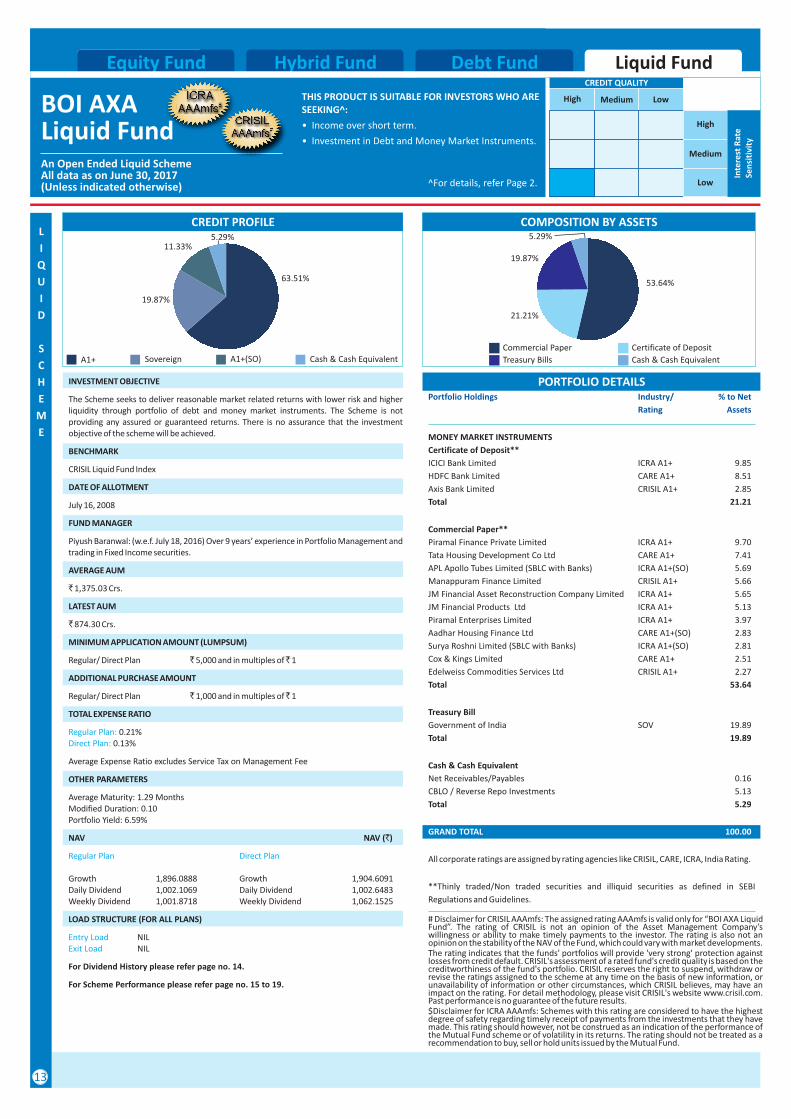
ICICI Bank Limited ICRA A1+ 9.85
HDFC Bank Limited CARE A1+ 8.51
Axis Bank Limited CRISIL A1+ 2.85
Total 21.21
Commercial Paper**
Piramal Finance Private Limited ICRA A1+ 9.70
Tata Housing Development Co Ltd CARE A1+ 7.41
APL Apollo Tubes Limited (SBLC with Banks) ICRA A1+(SO) 5.69
Manappuram Finance Limited CRISIL A1+ 5.66
JM Financial Asset Reconstruction Company Limited ICRA A1+ 5.65
JM Financial Products Ltd ICRA A1+ 5.13
Piramal Enterprises Limited ICRA A1+ 3.97
Aadhar Housing Finance Ltd CARE A1+(SO) 2.83
Surya Roshni Limited (SBLC with Banks) ICRA A1+(SO) 2.81
Cox & Kings Limited CARE A1+ 2.51
Edelweiss Commodities Services Ltd CRISIL A1+ 2.27
Total 53.64
Treasury Bill
Government of India SOV 19.89
Total 19.89
Cash & Cash Equivalent
Net Receivables/Payables 0.16
CBLO / Reverse Repo Investments 5.13
Total 5.29
GRAND TOTAL 100.00
All corporate ratings are assigned by rating agencies like CRISIL, CARE, ICRA, India Rating.
**Thinly traded/Non traded securities and illiquid securities as defined in SEBI
Regulations and Guidelines.
13
CREDIT QUALITY
High Medium Low
Low
Medium
High
Inte
rest
Rat
eSe
nsi
tivi
ty
COMPOSITION BY ASSETSCREDIT PROFILE
^For details, refer Page 2.
INVESTMENT OBJECTIVE
The Scheme seeks to deliver reasonable market related returns with lower risk and higher liquidity through portfolio of debt and money market instruments. The Scheme is not providing any assured or guaranteed returns. There is no assurance that the investment objective of the scheme will be achieved.
BENCHMARK
CRISIL Liquid Fund Index
DATE OF ALLOTMENT
July 16, 2008
FUND MANAGER
Piyush Baranwal: (w.e.f. July 18, 2016) Over 9 years’ experience in Portfolio Management and trading in Fixed Income securities.
AVERAGE AUM
` 1,375.03 Crs.
LATEST AUM
` 874.30 Crs.
MINIMUM APPLICATION AMOUNT (LUMPSUM)
Regular/ Direct Plan ` 5,000 and in multiples of ̀ 1
ADDITIONAL PURCHASE AMOUNT
Regular/ Direct Plan ` 1,000 and in multiples of ̀ 1
TOTAL EXPENSE RATIO
0.21% 0.13%
Average Expense Ratio excludes Service Tax on Management Fee
OTHER PARAMETERS
Average Maturity: 1.29 MonthsModified Duration: 0.10Portfolio Yield: 6.59%
NAV NAV (`)
LOAD STRUCTURE (FOR ALL PLANS)
NILNIL
For Dividend History please refer page no. 14.
For Scheme Performance please refer page no. 15 to 19.
Regular Plan:Direct Plan:
Regular Plan Direct Plan
Entry LoadExit Load
Growth Growth 1,904.6091Daily Dividend 1,002.1069 Daily Dividend 1,002.6483Weekly Dividend 1,001.8718 Weekly Dividend 1,062.1525
1,896.0888
Cash & Cash Equivalent
Commercial Paper Certificate of Deposit
Treasury BillsA1+ Sovereign A1+(SO)
53.64%
21.21%
5.29%
19.87%
63.51%
11.33%
19.87%
Cash & Cash Equivalent
5.29%
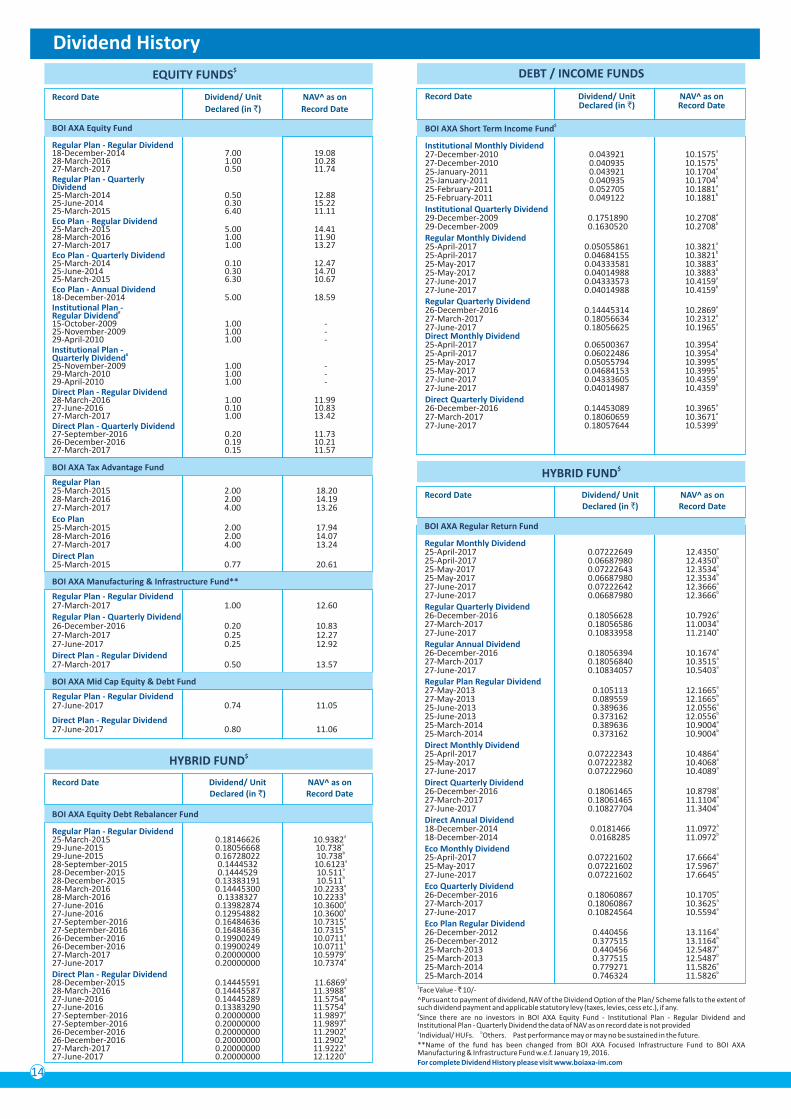
Dividend History$EQUITY FUNDS
Record Date Dividend/ Unit NAV^ as on
Declared (in `) Record Date
BOI AXA Equity Fund
Regular Plan - Regular Dividend
Regular Plan - Quarterly Dividend
Eco Plan - Regular Dividend
Eco Plan - Quarterly Dividend
Eco Plan - Annual Dividend
Institutional Plan - #Regular Dividend
Institutional Plan - #Quarterly Dividend
Direct Plan - Regular Dividend
Direct Plan - Quarterly Dividend
18-December-2014 7.00 19.0828-March-2016 1.00 10.2827-March-2017 0.50 11.74
25-March-2014 0.50 12.8825-June-2014 0.30 15.2225-March-2015 6.40 11.11
25-March-2015 5.00 14.4128-March-2016 1.00 11.9027-March-2017 1.00 13.27
25-March-2014 0.10 12.4725-June-2014 0.30 14.7025-March-2015 6.30 10.67
25-November-2009 1.00 - 29-March-2010 1.00 - 29-April-2010 1.00 -
28-March-2016 1.00 11.9927-June-2016 0.10 10.8327-March-2017 1.00 13.42
27-September-2016 0.20 11.7326-December-2016 0.19 10.2127-March-2017 0.15 11.57
18-December-2014 5.00 18.59
15-October-2009 1.00 - 25-November-2009 1.00 - 29-April-2010 1.00 -
$Face Value - ̀ 10/-
^Pursuant to payment of dividend, NAV of the Dividend Option of the Plan/ Scheme falls to the extent of such dividend payment and applicable statutory levy (taxes, levies, cess etc.), if any. #Since there are no investors in BOI AXA Equity Fund - Institutional Plan - Regular Dividend and
Institutional Plan - Quarterly Dividend the data of NAV as on record date is not provideda bIndividual/ HUFs. Others. Past performance may or may no be sustained in the future. **Name of the fund has been changed from BOI AXA Focused Infrastructure Fund to BOI AXA Manufacturing & Infrastructure Fund w.e.f. January 19, 2016.For complete Dividend History please visit www.boiaxa-im.com
DEBT / INCOME FUNDS
Record Date Dividend/ Unit NAV^ as onDeclared (in `) Record Date
$BOI AXA Short Term Income Fund
Institutional Monthly Dividend
Institutional Quarterly Dividend
Regular Monthly Dividend
Regular Quarterly Dividend
Direct Monthly Dividend
Direct Quarterly Dividend
a27-December-2010 0.043921 10.1575b27-December-2010 0.040935 10.1575a25-January-2011 0.043921 10.1704b25-January-2011 0.040935 10.1704a25-February-2011 0.052705 10.1881b25-February-2011 0.049122 10.1881
a29-December-2009 0.1751890 10.2708b29-December-2009 0.1630520 10.2708
a25-April-2017 0.05055861 10.3821b25-April-2017 0.04684155 10.3821a25-May-2017 0.04333581 10.3883b25-May-2017 0.04014988 10.3883a27-June-2017 0.04333573 10.4159b27-June-2017 0.04014988 10.4159
a26-December-2016 0.14445314 10.2869a27-March-2017 0.18056634 10.2312a27-June-2017 0.18056625 10.1965
a25-April-2017 0.06500367 10.3954b25-April-2017 0.06022486 10.3954a25-May-2017 0.05055794 10.3995b25-May-2017 0.04684153 10.3995a27-June-2017 0.04333605 10.4359b27-June-2017 0.04014987 10.4359
a26-December-2016 0.14453089 10.3965a27-March-2017 0.18060659 10.3671a27-June-2017 0.18057644 10.5399
$HYBRID FUND
Record Date Dividend/ Unit NAV^ as onDeclared (in `) Record Date
BOI AXA Regular Return Fund
Regular Monthly Dividend
Regular Quarterly Dividend
Regular Annual Dividend
Regular Plan Regular Dividend
Direct Monthly Dividend
Direct Quarterly Dividend
Direct Annual Dividend
Eco Monthly Dividend
Eco Quarterly Dividend
Eco Plan Regular Dividend
b25-April-2017 0.06687980 12.4350a25-May-2017 0.07222643 12.3534b25-May-2017 0.06687980 12.3534a27-June-2017 0.07222642 12.3666b27-June-2017 0.06687980 12.3666
a26-December-2016 0.18056628 10.7926a27-March-2017 0.18056586 11.0034a27-June-2017 0.10833958 11.2140
a26-December-2016 0.18056394 10.1674a27-March-2017 0.18056840 10.3515a27-June-2017 0.10834057 10.5403
a27-May-2013 0.105113 12.1665b27-May-2013 0.089559 12.1665a25-June-2013 0.389636 12.0556b25-June-2013 0.373162 12.0556a25-March-2014 0.389636 10.9004b25-March-2014 0.373162 10.9004
a25-April-2017 0.07222343 10.4864a25-May-2017 0.07222382 10.4068a27-June-2017 0.07222960 10.4089
a26-December-2016 0.18061465 10.8798a27-March-2017 0.18061465 11.1104a27-June-2017 0.10827704 11.3404
a18-December-2014 0.0181466 11.0972b18-December-2014 0.0168285 11.0972
a25-April-2017 0.07221602 17.6664a25-May-2017 0.07221602 17.5967a27-June-2017 0.07221602 17.6645
a26-December-2016 0.18060867 10.1705a27-March-2017 0.18060867 10.3625a27-June-2017 0.10824564 10.5594
a26-December-2012 0.440456 13.1164b26-December-2012 0.377515 13.1164a25-March-2013 0.440456 12.5487b25-March-2013 0.377515 12.5487a25-March-2014 0.779271 11.5826b25-March-2014 0.746324 11.5826
a25-April-2017 0.07222649 12.4350
14
$HYBRID FUND
Record Date Dividend/ Unit NAV^ as onDeclared (in `) Record Date
BOI AXA Equity Debt Rebalancer Fund
Regular Plan - Regular Dividend
Direct Plan - Regular Dividend
a25-March-2015 0.18146626 10.9382a29-June-2015 0.18056668 10.738b29-June-2015 0.16728022 10.738
a28-September-2015 0.1444532 10.6123a28-December-2015 0.1444529 10.511b28-December-2015 0.13383191 10.511a28-March-2016 0.14445300 10.2233b28-March-2016 0.1338327 10.2233a27-June-2016 0.13982874 10.3600b27-June-2016 0.12954882 10.3600a27-September-2016 0.16484636 10.7315b27-September-2016 0.16484636 10.7315a26-December-2016 0.19900249 10.0711b26-December-2016 0.19900249 10.0711a27-March-2017 0.20000000 10.5979a27-June-2017 0.20000000 10.7374
a28-December-2015 0.14445591 11.6869a28-March-2016 0.14445587 11.3988a27-June-2016 0.14445289 11.5754b27-June-2016 0.13383290 11.5754a27-September-2016 0.20000000 11.9897b27-September-2016 0.20000000 11.9897a26-December-2016 0.20000000 11.2902b26-December-2016 0.20000000 11.2902a27-March-2017 0.20000000 11.9222a27-June-2017 0.20000000 12.1220
BOI AXA Tax Advantage Fund
BOI AXA Manufacturing & Infrastructure Fund**
BOI AXA Mid Cap Equity & Debt Fund
Regular Plan
Eco Plan
Direct Plan
Regular Plan - Regular Dividend
Regular Plan - Quarterly Dividend
Direct Plan - Regular Dividend
Regular Plan - Regular Dividend
Direct Plan - Regular Dividend
25-March-2015 2.00 18.2028-March-2016 2.00 14.1927-March-2017 4.00 13.26
25-March-2015 2.00 17.9428-March-2016 2.00 14.0727-March-2017 4.00 13.24
27-March-2017 1.00 12.60
26-December-2016 0.20 10.8327-March-2017 0.25 12.2727-June-2017 0.25 12.92
27-March-2017 0.50 13.57
27-June-2017 0.74 11.05
27-June-2017 0.80 11.06
25-March-2015 0.77 20.61
15
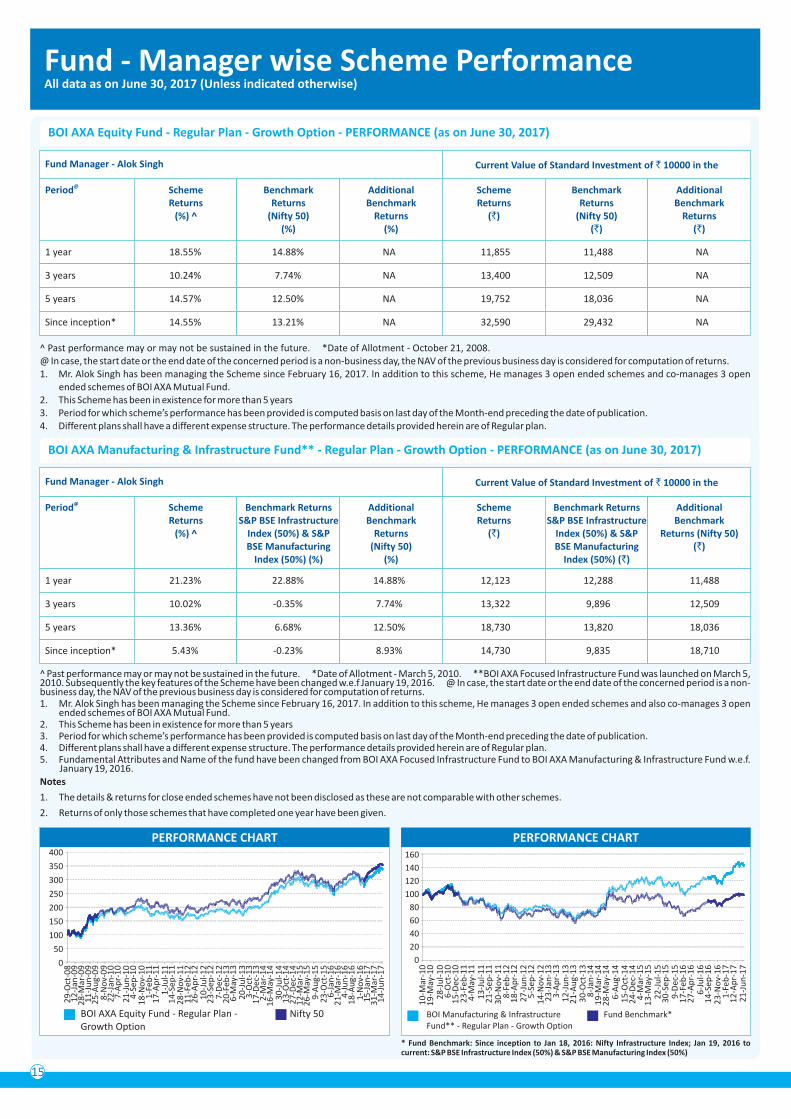
Fund - Manager wise Scheme PerformanceAll data as on June 30, 2017 (Unless indicated otherwise)
@Period Scheme Returns
(%) ^
Benchmark Returns
(Nifty 50)(%)
^ Past performance may or may not be sustained in the future. *Date of Allotment - October 21, 2008.@ In case, the start date or the end date of the concerned period is a non-business day, the NAV of the previous business day is considered for computation of returns.1. Mr. Alok Singh has been managing the Scheme since February 16, 2017. In addition to this scheme, He manages 3 open ended schemes and co-manages 3 open
ended schemes of BOI AXA Mutual Fund.2. This Scheme has been in existence for more than 5 years 3. Period for which scheme’s performance has been provided is computed basis on last day of the Month-end preceding the date of publication.4. Different plans shall have a different expense structure. The performance details provided herein are of Regular plan.
BOI AXA Equity Fund - Regular Plan - Growth Option - PERFORMANCE (as on June 30, 2017)
PERFORMANCE CHART
BOI AXA Equity Fund - Regular Plan - Growth Option
Nifty 50
0
50
100
150
200
250
300
350
400
Additional Benchmark
Returns(%)
Scheme Returns
(`)
Benchmark Returns
(Nifty 50)(`)
Additional Benchmark
Returns(`)
1 year 18.55% 14.88% NA 11,855 11,488 NA
3 years 10.24% 7.74% NA 13,400 12,509 NA
5 years 14.57% 12.50% NA 19,752 18,036 NA
Since inception* 14.55% 13.21% NA 32,590 29,432 NA
Current Value of Standard Investment of 10000 in the`
@Period Scheme Returns
(%) ^
Benchmark Returns S&P BSE Infrastructure
Index (50%) & S&P BSE Manufacturing
Index (50%) (%)
^ Past performance may or may not be sustained in the future. *Date of Allotment - March 5, 2010. **BOI AXA Focused Infrastructure Fund was launched on March 5, 2010. Subsequently the key features of the Scheme have been changed w.e.f January 19, 2016. @ In case, the start date or the end date of the concerned period is a non-business day, the NAV of the previous business day is considered for computation of returns.1. Mr. Alok Singh has been managing the Scheme since February 16, 2017. In addition to this scheme, He manages 3 open ended schemes and also co-manages 3 open
ended schemes of BOI AXA Mutual Fund.2. This Scheme has been in existence for more than 5 years 3. Period for which scheme’s performance has been provided is computed basis on last day of the Month-end preceding the date of publication.4. Different plans shall have a different expense structure. The performance details provided herein are of Regular plan.5. Fundamental Attributes and Name of the fund have been changed from BOI AXA Focused Infrastructure Fund to BOI AXA Manufacturing & Infrastructure Fund w.e.f.
January 19, 2016.
BOI AXA Manufacturing & Infrastructure Fund** - Regular Plan - Growth Option - PERFORMANCE (as on June 30, 2017)
Additional Benchmark
Returns (Nifty 50)
(%)
Scheme Returns
(`)
Benchmark Returns S&P BSE Infrastructure
Index (50%) & S&PBSE Manufacturing
Index (50%) (`)
Additional Benchmark
Returns (Nifty 50)(`)
1 year 21.23% 22.88% 14.88% 12,123 12,288 11,488
3 years 10.02% -0.35% 7.74% 13,322 9,896 12,509
5 years 13.36% 6.68% 12.50% 18,730 13,820 18,036
Since inception* 5.43% -0.23% 8.93% 14,730 9,835 18,710
Current Value of Standard Investment of 10000 in the`
Notes
1. The details & returns for close ended schemes have not been disclosed as these are not comparable with other schemes.
2. Returns of only those schemes that have completed one year have been given.
PERFORMANCE CHART
BOI Manufacturing & InfrastructureFund** - Regular Plan - Growth Option
Fund Benchmark*
0
20
40
60
80
100
120
160
140
* Fund Benchmark: Since inception to Jan 18, 2016: Nifty Infrastructure Index; Jan 19, 2016 to current: S&P BSE Infrastructure Index (50%) & S&P BSE Manufacturing Index (50%)
Fund Manager - Alok Singh
Fund Manager - Alok Singh
29
-Oct
-08
12
-Jan
-09
28
-Mar
-09
11
-Ju
n-0
92
5-A
ug-
09
8-N
ov-
09
22
-Jan
-10
7-A
pr-
10
21
-Ju
n-1
04
-Sep
-10
18
-No
v-1
01
-Feb
-11
17
-Ap
r-1
11
-Ju
l-1
11
4-S
ep-1
12
8-N
ov-
11
11
-Feb
-12
26
-Ap
r-1
21
0-J
ul-
12
23
-Sep
-12
7-D
ec-1
22
0-F
eb-1
36
-May
-13
20
-Ju
l-1
33
-Oct
-13
17
-Dec
-13
2-M
ar-1
41
6-M
ay-1
43
0-J
ul-
14
13
-Oct
-14
27
-Dec
-14
12
-Mar
-15
26
-May
-15
9-A
ug-
15
23
-Oct
-15
6-J
an-1
62
1-M
ar-1
64
-Ju
n-1
61
8-A
ug-
16
1-N
ov-
16
15
-Jan
-17
31
-Mar
-17
14
-Ju
n-1
7
10
-Mar
-10
19
-May
-10
28
-Ju
l-1
06
-Oct
-10
15
-Dec
-10
23
-Feb
-11
4-M
ay-1
11
3-J
ul-
11
21
-Sep
-11
30
-No
v-1
18
-Feb
-12
18
-Ap
r-1
22
7-J
un
-12
5-S
ep-1
21
4-N
ov-
12
23
-Jan
-13
3-A
pr-
13
12
-Ju
n-1
32
1-A
ug-
13
30
-Oct
-13
8-J
an-1
41
9-M
ar-1
42
8-M
ay-1
46
-Au
g-1
41
5-O
ct-1
42
4-D
ec-1
44
-Mar
-15
13
-May
-15
22
-Ju
l-1
53
0-S
ep-1
59
-Dec
-15
17
-Feb
-16
27
-Ap
r-1
66
-Ju
l-1
61
4-S
ep-1
62
3-N
ov-
16
1-F
eb-1
71
2-A
pr-
17
21
-Ju
n-1
7
16
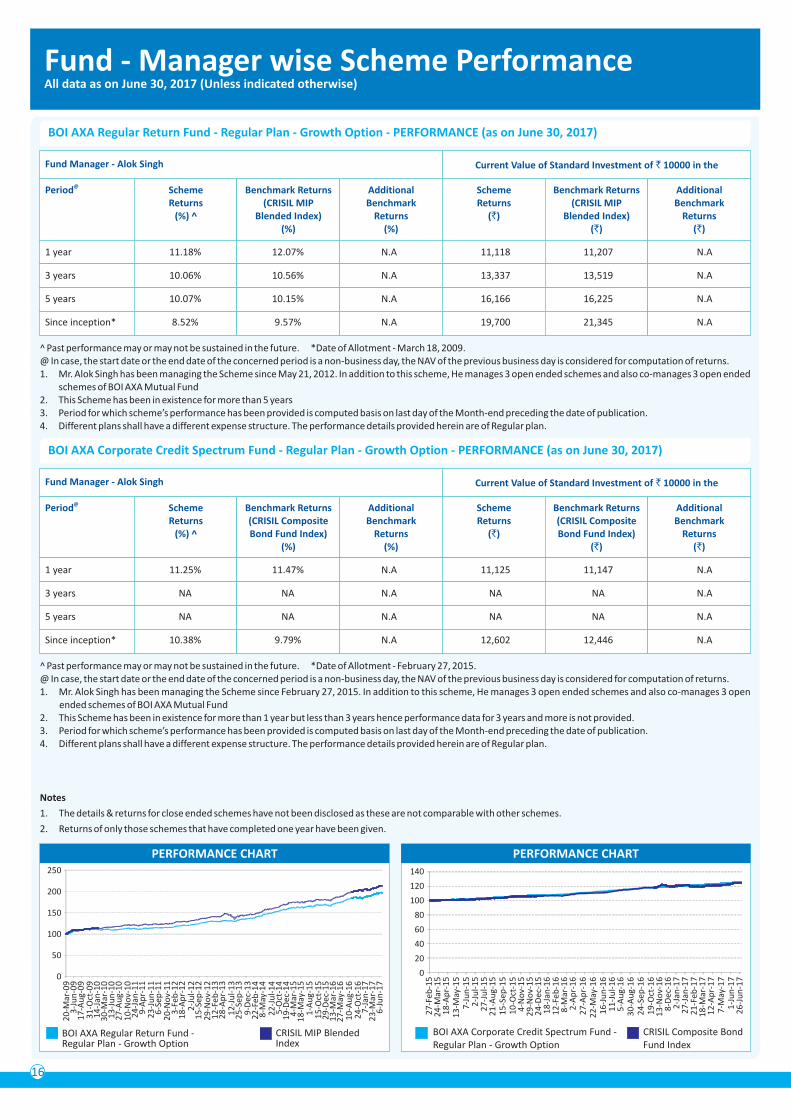
Fund - Manager wise Scheme PerformanceAll data as on June 30, 2017 (Unless indicated otherwise)
@Period Scheme Returns
(%) ^
Benchmark Returns(CRISIL MIP
Blended Index) (%)
^ Past performance may or may not be sustained in the future. *Date of Allotment - March 18, 2009.@ In case, the start date or the end date of the concerned period is a non-business day, the NAV of the previous business day is considered for computation of returns.1. Mr. Alok Singh has been managing the Scheme since May 21, 2012. In addition to this scheme, He manages 3 open ended schemes and also co-manages 3 open ended
schemes of BOI AXA Mutual Fund2. This Scheme has been in existence for more than 5 years 3. Period for which scheme’s performance has been provided is computed basis on last day of the Month-end preceding the date of publication.4. Different plans shall have a different expense structure. The performance details provided herein are of Regular plan.
BOI AXA Regular Return Fund - Regular Plan - Growth Option - PERFORMANCE (as on June 30, 2017)
Additional Benchmark
Returns(%)
Scheme Returns
(`)
Benchmark Returns(CRISIL MIP
Blended Index) (`)
Additional Benchmark
Returns(`)
1 year 11.18% 12.07% N.A 11,118 11,207 N.A
3 years 10.06% 10.56% N.A 13,337 13,519 N.A
5 years 10.07% 10.15% N.A 16,166 16,225 N.A
Since inception* 8.52% 9.57% N.A 19,700 21,345 N.A
Current Value of Standard Investment of 10000 in the`
Notes
1. The details & returns for close ended schemes have not been disclosed as these are not comparable with other schemes.
2. Returns of only those schemes that have completed one year have been given.
PERFORMANCE CHART
BOI AXA Regular Return Fund -Regular Plan - Growth Option
CRISIL MIP Blended Index
0
50
100
150
200
250
Fund Manager - Alok Singh
@Period Scheme Returns
(%) ^
Benchmark Returns(CRISIL Composite Bond Fund Index)
(%)
^ Past performance may or may not be sustained in the future. *Date of Allotment - February 27, 2015. @ In case, the start date or the end date of the concerned period is a non-business day, the NAV of the previous business day is considered for computation of returns.1. Mr. Alok Singh has been managing the Scheme since February 27, 2015. In addition to this scheme, He manages 3 open ended schemes and also co-manages 3 open
ended schemes of BOI AXA Mutual Fund2. This Scheme has been in existence for more than 1 year but less than 3 years hence performance data for 3 years and more is not provided. 3. Period for which scheme’s performance has been provided is computed basis on last day of the Month-end preceding the date of publication.4. Different plans shall have a different expense structure. The performance details provided herein are of Regular plan.
BOI AXA Corporate Credit Spectrum Fund - Regular Plan - Growth Option - PERFORMANCE (as on June 30, 2017)
Additional Benchmark
Returns(%)
Scheme Returns
(`)
Benchmark Returns(CRISIL Composite Bond Fund Index)
(`)
Additional Benchmark
Returns(`)
1 year 11.25% 11.47% N.A 11,125 11,147 N.A
3 years NA NA N.A NA NA N.A
5 years NA NA N.A NA NA N.A
Since inception* 10.38% 9.79% N.A 12,602 12,446 N.A
Current Value of Standard Investment of 10000 in the`Fund Manager - Alok Singh
BOI AXA Corporate Credit Spectrum Fund - Regular Plan - Growth Option
CRISIL Composite BondFund Index
PERFORMANCE CHART
0
20
40
60
80
100
120
140
20
-Mar
-09
3-J
un
-09
17
-Au
g-0
93
1-O
ct-0
91
4-J
an-1
03
0-M
ar-1
01
3-J
un
-10
27
-Au
g-1
01
0-N
ov-
10
24
-Jan
-11
9-A
pr-
11
23
-Ju
n-1
16
-Sep
-11
20
-No
v-1
13
-Feb
-12
18
-Ap
r-1
22
-Ju
l-1
21
5-S
ep-1
22
9-N
ov-
12
12
-Feb
-13
28
-Ap
r-1
31
2-J
ul-
13
25
-Sep
-13
9-D
ec-1
32
2-F
eb-1
48
-May
-14
22
-Ju
l-1
45
-Oct
-14
19
-Dec
-14
4-M
ar-1
51
8-M
ay-1
51
-Au
g-1
51
5-O
ct-1
52
9-D
ec-1
51
3-M
ar-1
62
7-M
ay-1
61
0-A
ug-
16
24
-Oct
-16
7-J
an-1
72
3-M
ar-1
76
-Ju
n-1
7
27
-Feb
-15
24
-Mar
-15
18
-Ap
r-1
51
3-M
ay-1
57
-Ju
n-1
52
-Ju
l-1
52
7-J
ul-
15
21
-Au
g-1
51
5-S
ep-1
51
0-O
ct-1
54
-No
v-1
52
9-N
ov-
15
24
-Dec
-15
18
-Jan
-16
12
-Feb
-16
8-M
ar-1
62
-Ap
r-1
62
7-A
pr-
16
22
-May
-16
16
-Ju
n-1
61
1-J
ul-
16
5-A
ug-
16
30
-Au
g-1
62
4-S
ep-1
61
9-O
ct-1
61
3-N
ov-
16
8-D
ec-1
62
-Jan
-17
27
-Jan
-17
21
-Feb
-17
18
-Mar
-17
12
-Ap
r-1
77
-May
-17
1-J
un
-17
26
-Ju
n-1
7
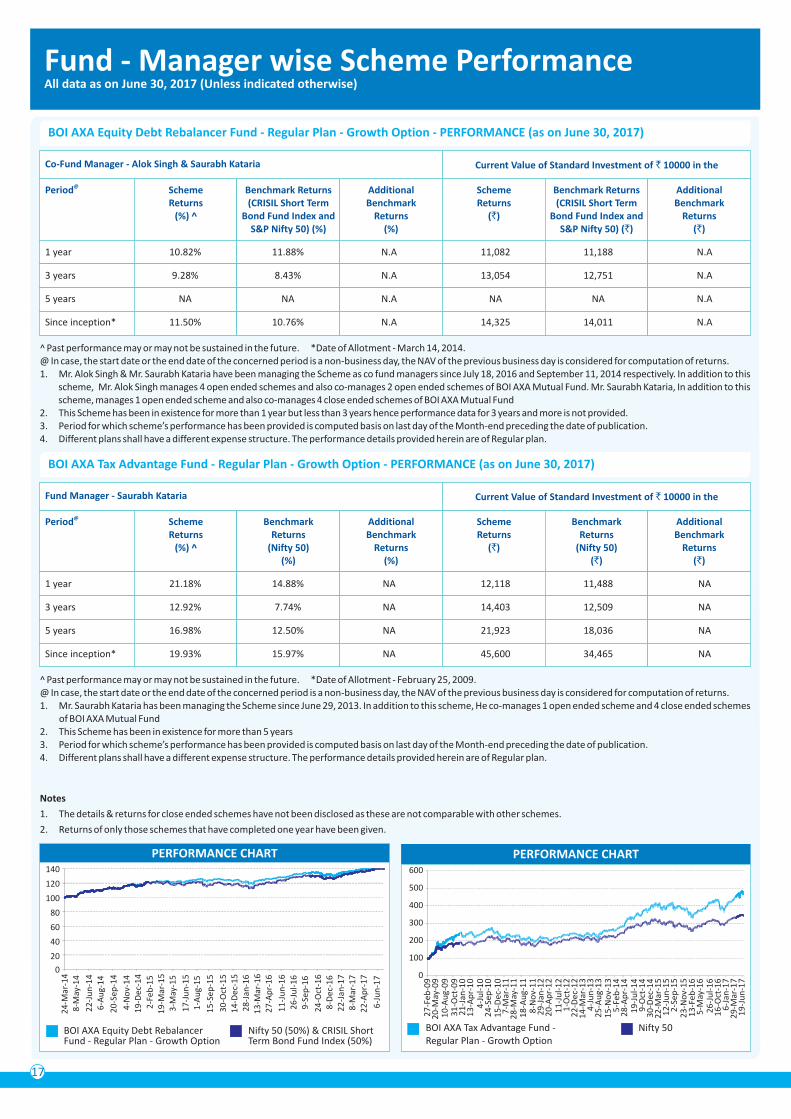
17
Fund - Manager wise Scheme PerformanceAll data as on June 30, 2017 (Unless indicated otherwise)
@Period Scheme Returns
(%) ^
Benchmark Returns(CRISIL Short Term
Bond Fund Index and S&P Nifty 50) (%)
^ Past performance may or may not be sustained in the future. *Date of Allotment - March 14, 2014. @ In case, the start date or the end date of the concerned period is a non-business day, the NAV of the previous business day is considered for computation of returns.1. Mr. Alok Singh & Mr. Saurabh Kataria have been managing the Scheme as co fund managers since July 18, 2016 and September 11, 2014 respectively. In addition to this
scheme, Mr. Alok Singh manages 4 open ended schemes and also co-manages 2 open ended schemes of BOI AXA Mutual Fund. Mr. Saurabh Kataria, In addition to this scheme, manages 1 open ended scheme and also co-manages 4 close ended schemes of BOI AXA Mutual Fund
2. This Scheme has been in existence for more than 1 year but less than 3 years hence performance data for 3 years and more is not provided. 3. Period for which scheme’s performance has been provided is computed basis on last day of the Month-end preceding the date of publication.4. Different plans shall have a different expense structure. The performance details provided herein are of Regular plan.
BOI AXA Equity Debt Rebalancer Fund - Regular Plan - Growth Option - PERFORMANCE (as on June 30, 2017)
Additional Benchmark
Returns(%)
Scheme Returns
(`)
Benchmark Returns(CRISIL Short Term
Bond Fund Index and S&P Nifty 50) (`)
Additional Benchmark
Returns(`)
1 year 10.82% 11.88% N.A 11,082 11,188 N.A
3 years 9.28% 8.43% N.A 13,054 12,751 N.A
5 years NA NA N.A NA NA N.A
Since inception* 11.50% 10.76% N.A 14,325 14,011 N.A
Current Value of Standard Investment of 10000 in the`
Notes
1. The details & returns for close ended schemes have not been disclosed as these are not comparable with other schemes.
2. Returns of only those schemes that have completed one year have been given.
BOI AXA Equity Debt Rebalancer Fund - Regular Plan - Growth Option
Nifty 50 (50%) & CRISIL Short Term Bond Fund Index (50%)
PERFORMANCE CHART
0
20
40
60
80
100
120
140
Co-Fund Manager - Alok Singh & Saurabh Kataria
@Period Scheme Returns
(%) ^
Benchmark Returns
(Nifty 50)(%)
^ Past performance may or may not be sustained in the future. *Date of Allotment - February 25, 2009. @ In case, the start date or the end date of the concerned period is a non-business day, the NAV of the previous business day is considered for computation of returns.1. Mr. Saurabh Kataria has been managing the Scheme since June 29, 2013. In addition to this scheme, He co-manages 1 open ended scheme and 4 close ended schemes
of BOI AXA Mutual Fund2. This Scheme has been in existence for more than 5 years 3. Period for which scheme’s performance has been provided is computed basis on last day of the Month-end preceding the date of publication.4. Different plans shall have a different expense structure. The performance details provided herein are of Regular plan.
BOI AXA Tax Advantage Fund - Regular Plan - Growth Option - PERFORMANCE (as on June 30, 2017)
Additional Benchmark
Returns(%)
Scheme Returns
(`)
Benchmark Returns
(Nifty 50)(`)
Additional Benchmark
Returns(`)
1 year 21.18% 14.88% NA 12,118 11,488 NA
3 years 12.92% 7.74% NA 14,403 12,509 NA
5 years 16.98% 12.50% NA 21,923 18,036 NA
Since inception* 19.93% 15.97% NA 45,600 34,465 NA
Current Value of Standard Investment of 10000 in the`Fund Manager - Saurabh Kataria
PERFORMANCE CHART
BOI AXA Tax Advantage Fund - Regular Plan - Growth Option
Nifty 50
0
100
200
300
400
600
24
-Mar
-14
8-M
ay-1
4
22
-Ju
n-1
46
-Au
g-1
4
20
-Sep
-14
4-N
ov-
14
19
-Dec
-14
2-F
eb-1
51
9-M
ar-1
53
-May
-15
17
-Ju
n-1
51
-Au
g-1
5
15
-Sep
-15
30
-Oct
-15
14
-Dec
-15
28
-Jan
-16
13
-Mar
-16
27
-Ap
r-1
6
11
-Ju
n-1
6
26
-Ju
l-1
69
-Sep
-16
24
-Oct
-16
8-D
ec-1
62
2-J
an-1
78
-Mar
-17
22
-Ap
r-1
7
6-J
un
-17
27
-Feb
-09
20
-May
-09
10
-Au
g-0
93
1-O
ct-0
92
1-J
an-1
01
3-A
pr-
10
4-J
ul-
10
24
-Sep
-10
15
-Dec
-10
7-M
ar-1
12
8-M
ay-1
11
8-A
ug-
11
8-N
ov-
11
29
-Jan
-12
20
-Ap
r-1
21
1-J
ul-
12
1-O
ct-1
22
2-D
ec-1
21
4-M
ar-1
34
-Ju
n-1
32
5-A
ug-
13
15
-No
v-1
35
-Feb
-14
28
-Ap
r-1
41
9-J
ul-
14
9-O
ct-1
43
0-D
ec-1
42
2-M
ar-1
51
2-J
un
-15
2-S
ep-1
52
3-N
ov-
15
13
-Feb
-16
5-M
ay-1
62
6-J
ul-
16
16
-Oct
-16
6-J
an-1
72
9-M
ar-1
71
9-J
un
-17
500
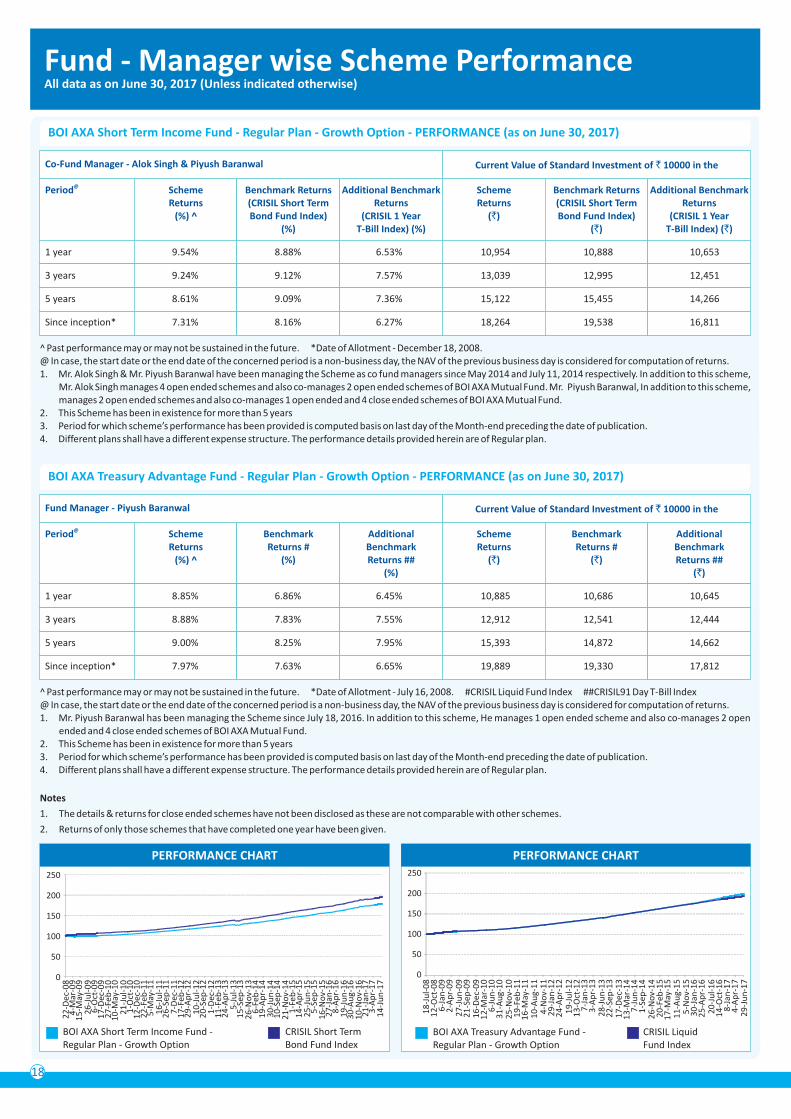
18
Fund - Manager wise Scheme PerformanceAll data as on June 30, 2017 (Unless indicated otherwise)
@Period Scheme Returns
(%) ^
Benchmark Returns(CRISIL Short Term Bond Fund Index)
(%)
^ Past performance may or may not be sustained in the future. *Date of Allotment - December 18, 2008. @ In case, the start date or the end date of the concerned period is a non-business day, the NAV of the previous business day is considered for computation of returns.1. Mr. Alok Singh & Mr. Piyush Baranwal have been managing the Scheme as co fund managers since May 2014 and July 11, 2014 respectively. In addition to this scheme,
Mr. Alok Singh manages 4 open ended schemes and also co-manages 2 open ended schemes of BOI AXA Mutual Fund. Mr. Piyush Baranwal, In addition to this scheme, manages 2 open ended schemes and also co-manages 1 open ended and 4 close ended schemes of BOI AXA Mutual Fund.
2. This Scheme has been in existence for more than 5 years 3. Period for which scheme’s performance has been provided is computed basis on last day of the Month-end preceding the date of publication.4. Different plans shall have a different expense structure. The performance details provided herein are of Regular plan.
BOI AXA Short Term Income Fund - Regular Plan - Growth Option - PERFORMANCE (as on June 30, 2017)
Additional Benchmark Returns
(CRISIL 1 Year T-Bill Index) (%)
Scheme Returns
(`)
Benchmark Returns(CRISIL Short Term Bond Fund Index)
(`)
Additional Benchmark Returns
(CRISIL 1 Year T-Bill Index) (`)
1 year 9.54% 8.88% 6.53% 10,954 10,888 10,653
3 years 9.24% 9.12% 7.57% 13,039 12,995 12,451
5 years 8.61% 9.09% 7.36% 15,122 15,455 14,266
Since inception* 7.31% 8.16% 6.27% 18,264 19,538 16,811
Current Value of Standard Investment of 10000 in the`
Notes
1. The details & returns for close ended schemes have not been disclosed as these are not comparable with other schemes.
2. Returns of only those schemes that have completed one year have been given.
Co-Fund Manager - Alok Singh & Piyush Baranwal
BOI AXA Treasury Advantage Fund - Regular Plan - Growth Option
CRISIL Liquid Fund Index
PERFORMANCE CHART
0
50
100
150
200
250
@Period Scheme Returns
(%) ^
Benchmark Returns #
(%)
^ Past performance may or may not be sustained in the future. *Date of Allotment - July 16, 2008. #CRISIL Liquid Fund Index ##CRISIL91 Day T-Bill Index@ In case, the start date or the end date of the concerned period is a non-business day, the NAV of the previous business day is considered for computation of returns.1. Mr. Piyush Baranwal has been managing the Scheme since July 18, 2016. In addition to this scheme, He manages 1 open ended scheme and also co-manages 2 open
ended and 4 close ended schemes of BOI AXA Mutual Fund.2. This Scheme has been in existence for more than 5 years 3. Period for which scheme’s performance has been provided is computed basis on last day of the Month-end preceding the date of publication.4. Different plans shall have a different expense structure. The performance details provided herein are of Regular plan.
BOI AXA Treasury Advantage Fund - Regular Plan - Growth Option - PERFORMANCE (as on June 30, 2017)
Additional Benchmark Returns ##
(%)
Scheme Returns
(`)
Benchmark Returns #
(`)
Additional Benchmark Returns ##
(`)
1 year 8.85% 6.86% 6.45% 10,885 10,686 10,645
3 years 8.88% 7.83% 7.55% 12,912 12,541 12,444
5 years 9.00% 8.25% 7.95% 15,393 14,872 14,662
Since inception* 7.97% 7.63% 6.65% 19,889 19,330 17,812
Current Value of Standard Investment of 10000 in the`Fund Manager - Piyush Baranwal
PERFORMANCE CHART
BOI AXA Short Term Income Fund - Regular Plan - Growth Option
CRISIL Short Term Bond Fund Index
0
50
100
150
250
200
18
-Ju
l-0
81
2-O
ct-0
86
-Jan
-09
2-A
pr-
09
27
-Ju
n-0
92
1-S
ep-0
91
6-D
ec-0
91
2-M
ar-1
06
-Ju
n-1
03
1-A
ug-
10
25
-No
v-1
01
9-F
eb-1
11
6-M
ay-1
11
0-A
ug-
11
4-N
ov-
11
29
-Jan
-12
24
-Ap
r-1
21
9-J
ul-
12
13
-Oct
-12
7-J
an-1
33
-Ap
r-1
32
8-J
un
-13
22
-Sep
-13
17
-Dec
-13
13
-Mar
-14
7-J
un
-14
1-S
ep-1
42
6-N
ov-
14
20
-Feb
-15
17
-May
-15
11
-Au
g-1
55
-No
v-1
53
0-J
an-1
62
5-A
pr-
16
20
-Ju
l-1
61
4-O
ct-1
68
-Jan
-17
4-A
pr-
17
29
-Ju
n-1
7
22
-Dec
-08
4-M
ar-0
91
5-M
ay-0
92
6-J
ul-
09
6-O
ct-0
91
7-D
ec-0
92
7-F
eb-1
01
0-M
ay-1
02
1-J
ul-
10
1-O
ct-1
01
2-D
ec-1
02
2-F
eb-1
15
-May
-11
16
-Ju
l-1
12
6-S
ep-1
17
-Dec
-11
17
-Feb
-12
29
-Ap
r-1
21
0-J
ul-
12
20
-Sep
-12
1-D
ec-1
21
1-F
eb-1
32
4-A
pr-
13
5-J
ul-
13
15
-Sep
-13
26
-No
v-1
36
-Feb
-14
19
-Ap
r-1
43
0-J
un
-14
10
-Sep
-14
21
-No
v-1
41
-Feb
-15
14
-Ap
r-1
52
5-J
un
-15
5-S
ep-1
51
6-N
ov-
15
27
-Jan
-16
8-A
pr-
16
19
-Ju
n-1
63
0-A
ug-
16
10
-No
v-1
62
1-J
an-1
73
-Ap
r-1
71
4-J
un
-17
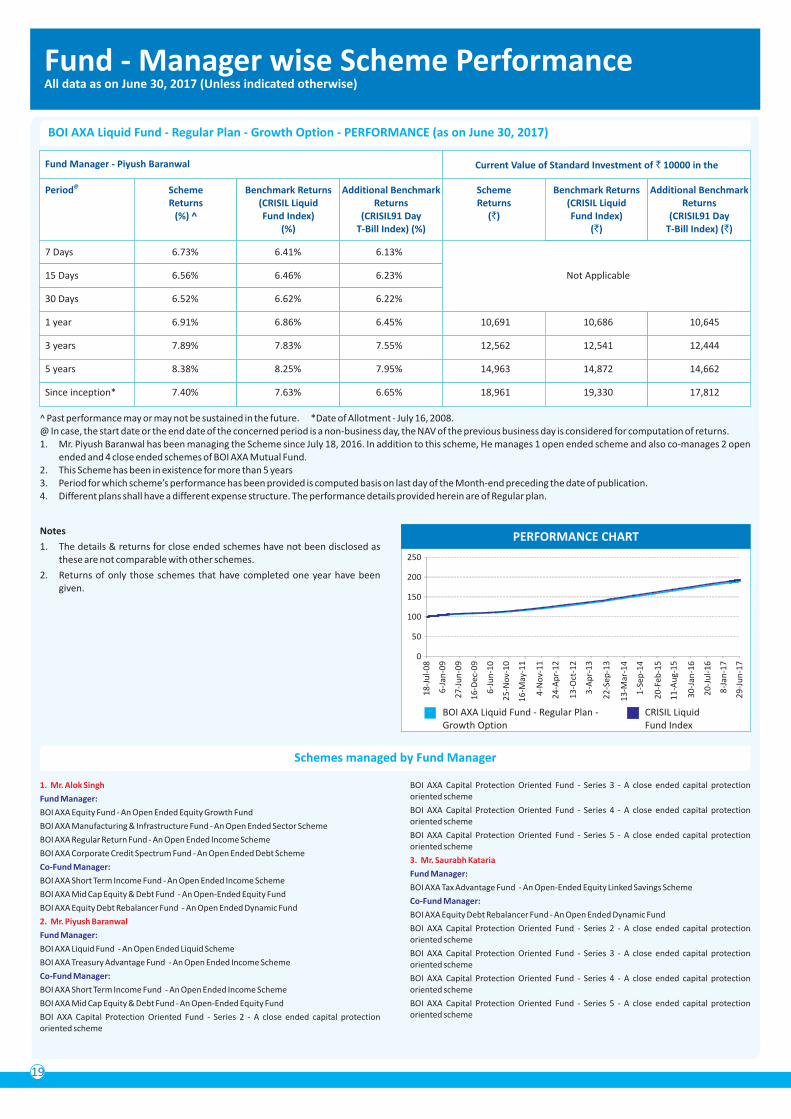
Fund - Manager wise Scheme PerformanceAll data as on June 30, 2017 (Unless indicated otherwise)
Notes
1. The details & returns for close ended schemes have not been disclosed as these are not comparable with other schemes.
2. Returns of only those schemes that have completed one year have been given.
19
@Period Scheme Returns
(%) ^
Benchmark Returns(CRISIL Liquid Fund Index)
(%)
^ Past performance may or may not be sustained in the future. *Date of Allotment - July 16, 2008.@ In case, the start date or the end date of the concerned period is a non-business day, the NAV of the previous business day is considered for computation of returns.1. Mr. Piyush Baranwal has been managing the Scheme since July 18, 2016. In addition to this scheme, He manages 1 open ended scheme and also co-manages 2 open
ended and 4 close ended schemes of BOI AXA Mutual Fund.2. This Scheme has been in existence for more than 5 years 3. Period for which scheme’s performance has been provided is computed basis on last day of the Month-end preceding the date of publication.4. Different plans shall have a different expense structure. The performance details provided herein are of Regular plan.
BOI AXA Liquid Fund - Regular Plan - Growth Option - PERFORMANCE (as on June 30, 2017)
Additional Benchmark Returns
(CRISIL91 Day T-Bill Index) (%)
Scheme Returns
(`)
Benchmark Returns (CRISIL Liquid Fund Index)
(`)
Additional Benchmark Returns
(CRISIL91 Day T-Bill Index) (`)
Current Value of Standard Investment of 10000 in the`Fund Manager - Piyush Baranwal
PERFORMANCE CHART
BOI AXA Liquid Fund - Regular Plan - Growth Option
CRISIL Liquid Fund Index
7 Days 6.73% 6.41% 6.13%
15 Days 6.56% 6.46% 6.23%
30 Days 6.52% 6.62% 6.22%
1 year 6.91% 6.86% 6.45% 10,691 10,686 10,645
3 years 7.89% 7.83% 7.55% 12,562 12,541 12,444
5 years 8.38% 8.25% 7.95% 14,963 14,872 14,662
Since inception* 7.40% 7.63% 6.65% 18,961 19,330 17,812
Not Applicable
0
50
100
150
200
250
Schemes managed by Fund Manager
1. Mr. Alok Singh
2. Mr. Piyush Baranwal
Fund Manager:
Co-Fund Manager:
Fund Manager:
Co-Fund Manager:
BOI AXA Equity Fund - An Open Ended Equity Growth Fund
BOI AXA Manufacturing & Infrastructure Fund - An Open Ended Sector Scheme
BOI AXA Regular Return Fund - An Open Ended Income Scheme
BOI AXA Corporate Credit Spectrum Fund - An Open Ended Debt Scheme
BOI AXA Short Term Income Fund - An Open Ended Income Scheme
BOI AXA Mid Cap Equity & Debt Fund - An Open-Ended Equity Fund
BOI AXA Equity Debt Rebalancer Fund - An Open Ended Dynamic Fund
BOI AXA Liquid Fund - An Open Ended Liquid Scheme
BOI AXA Treasury Advantage Fund - An Open Ended Income Scheme
BOI AXA Short Term Income Fund - An Open Ended Income Scheme
BOI AXA Mid Cap Equity & Debt Fund - An Open-Ended Equity Fund
BOI AXA Capital Protection Oriented Fund - Series 2 - A close ended capital protection oriented scheme
BOI AXA Capital Protection Oriented Fund - Series 3 - A close ended capital protection oriented scheme
BOI AXA Capital Protection Oriented Fund - Series 4 - A close ended capital protection oriented scheme
BOI AXA Capital Protection Oriented Fund - Series 5 - A close ended capital protection oriented scheme
BOI AXA Tax Advantage Fund - An Open-Ended Equity Linked Savings Scheme
BOI AXA Equity Debt Rebalancer Fund - An Open Ended Dynamic Fund
BOI AXA Capital Protection Oriented Fund - Series 2 - A close ended capital protection oriented scheme
BOI AXA Capital Protection Oriented Fund - Series 3 - A close ended capital protection oriented scheme
BOI AXA Capital Protection Oriented Fund - Series 4 - A close ended capital protection oriented scheme
BOI AXA Capital Protection Oriented Fund - Series 5 - A close ended capital protection oriented scheme
3. Mr. Saurabh Kataria
Fund Manager:
Co-Fund Manager:
18
-Ju
l-0
8
6-J
an-0
9
27
-Ju
n-0
9
16
-Dec
-09
6-J
un
-10
25
-No
v-1
0
16
-May
-11
4-N
ov-
11
24
-Ap
r-1
2
13
-Oct
-12
3-A
pr-
13
22
-Sep
-13
13
-Mar
-14
1-S
ep-1
4
20
-Feb
-15
11
-Au
g-1
5
30
-Jan
-16
20
-Ju
l-1
6
8-J
an-1
7
29
-Ju
n-1
7
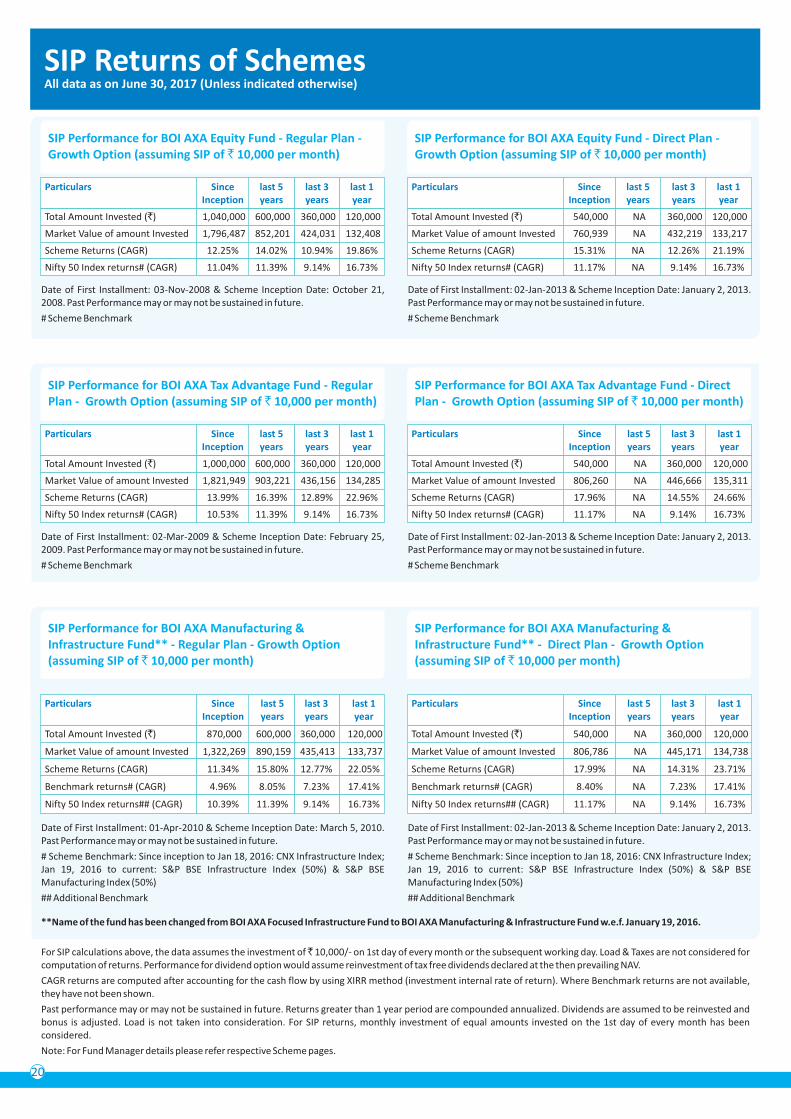
20
SIP Returns of SchemesAll data as on June 30, 2017 (Unless indicated otherwise)
Date of First Installment: 03-Nov-2008 & Scheme Inception Date: October 21, 2008. Past Performance may or may not be sustained in future.
# Scheme Benchmark
SIP Performance for BOI AXA Equity Fund - Regular Plan - Growth Option (assuming SIP of ` 10,000 per month)
Particulars Since last 5 last 3 last 1 Inception years years year
Total Amount Invested ( ) 1,040,000 600,000 360,000 120,000
Market Value of amount Invested 1,796,487 852,201 424,031 132,408
Scheme Returns (CAGR) 12.25% 14.02% 10.94% 19.86%
Nifty 50 Index returns# (CAGR) 11.04% 11.39% 9.14% 16.73%
`
Date of First Installment: 02-Jan-2013 & Scheme Inception Date: January 2, 2013. Past Performance may or may not be sustained in future.
# Scheme Benchmark
SIP Performance for BOI AXA Equity Fund - Direct Plan - Growth Option (assuming SIP of ` 10,000 per month)
Particulars Since last 5 last 3 last 1 Inception years years year
Total Amount Invested ( ) 540,000 NA 360,000 120,000
Market Value of amount Invested 760,939 NA 432,219 133,217
Scheme Returns (CAGR) 15.31% NA 12.26% 21.19%
Nifty 50 Index returns# (CAGR) 11.17% NA 9.14% 16.73%
`
Date of First Installment: 02-Mar-2009 & Scheme Inception Date: February 25, 2009. Past Performance may or may not be sustained in future.
# Scheme Benchmark
SIP Performance for BOI AXA Tax Advantage Fund - RegularPlan - Growth Option (assuming SIP of ` 10,000 per month)
Particulars Since last 5 last 3 last 1 Inception years years year
Total Amount Invested ( ) 1,000,000 600,000 360,000 120,000
Market Value of amount Invested 1,821,949 903,221 436,156 134,285
Scheme Returns (CAGR) 13.99% 16.39% 12.89% 22.96%
Nifty 50 Index returns# (CAGR) 10.53% 11.39% 9.14% 16.73%
`
Date of First Installment: 02-Jan-2013 & Scheme Inception Date: January 2, 2013. Past Performance may or may not be sustained in future.
# Scheme Benchmark
SIP Performance for BOI AXA Tax Advantage Fund - DirectPlan - Growth Option (assuming SIP of ` 10,000 per month)
Particulars Since last 5 last 3 last 1 Inception years years year
Total Amount Invested ( ) 540,000 NA 360,000 120,000
Market Value of amount Invested 806,260 NA 446,666 135,311
Scheme Returns (CAGR) 17.96% NA 14.55% 24.66%
Nifty 50 Index returns# (CAGR) 11.17% NA 9.14% 16.73%
`
For SIP calculations above, the data assumes the investment of ̀ 10,000/- on 1st day of every month or the subsequent working day. Load & Taxes are not considered for computation of returns. Performance for dividend option would assume reinvestment of tax free dividends declared at the then prevailing NAV.
CAGR returns are computed after accounting for the cash flow by using XIRR method (investment internal rate of return). Where Benchmark returns are not available, they have not been shown.
Past performance may or may not be sustained in future. Returns greater than 1 year period are compounded annualized. Dividends are assumed to be reinvested and bonus is adjusted. Load is not taken into consideration. For SIP returns, monthly investment of equal amounts invested on the 1st day of every month has been considered.
Note: For Fund Manager details please refer respective Scheme pages.
Date of First Installment: 01-Apr-2010 & Scheme Inception Date: March 5, 2010. Past Performance may or may not be sustained in future.
# Scheme Benchmark: Since inception to Jan 18, 2016: CNX Infrastructure Index; Jan 19, 2016 to current: S&P BSE Infrastructure Index (50%) & S&P BSE Manufacturing Index (50%)
## Additional Benchmark
SIP Performance for BOI AXA Manufacturing & Infrastructure Fund** - Regular Plan - Growth Option (assuming SIP of ` 10,000 per month)
Date of First Installment: 02-Jan-2013 & Scheme Inception Date: January 2, 2013. Past Performance may or may not be sustained in future.
# Scheme Benchmark: Since inception to Jan 18, 2016: CNX Infrastructure Index; Jan 19, 2016 to current: S&P BSE Infrastructure Index (50%) & S&P BSE Manufacturing Index (50%)
## Additional Benchmark
SIP Performance for BOI AXA Manufacturing & Infrastructure Fund** - Direct Plan - Growth Option (assuming SIP of ` 10,000 per month)
Particulars Since last 5 last 3 last 1 Inception years years year
Total Amount Invested ( ) 870,000 600,000 360,000 120,000
Market Value of amount Invested 1,322,269 890,159 435,413 133,737
Scheme Returns (CAGR) 11.34% 15.80% 12.77% 22.05%
Benchmark returns# (CAGR) 4.96% 8.05% 7.23% 17.41%
Nifty 50 Index returns## (CAGR) 10.39% 11.39% 9.14% 16.73%
`
Particulars Since last 5 last 3 last 1 Inception years years year
Total Amount Invested ( ) 540,000 NA 360,000 120,000
Market Value of amount Invested 806,786 NA 445,171 134,738
Scheme Returns (CAGR) 17.99% NA 14.31% 23.71%
Benchmark returns# (CAGR) 8.40% NA 7.23% 17.41%
Nifty 50 Index returns## (CAGR) 11.17% NA 9.14% 16.73%
`
**Name of the fund has been changed from BOI AXA Focused Infrastructure Fund to BOI AXA Manufacturing & Infrastructure Fund w.e.f. January 19, 2016.
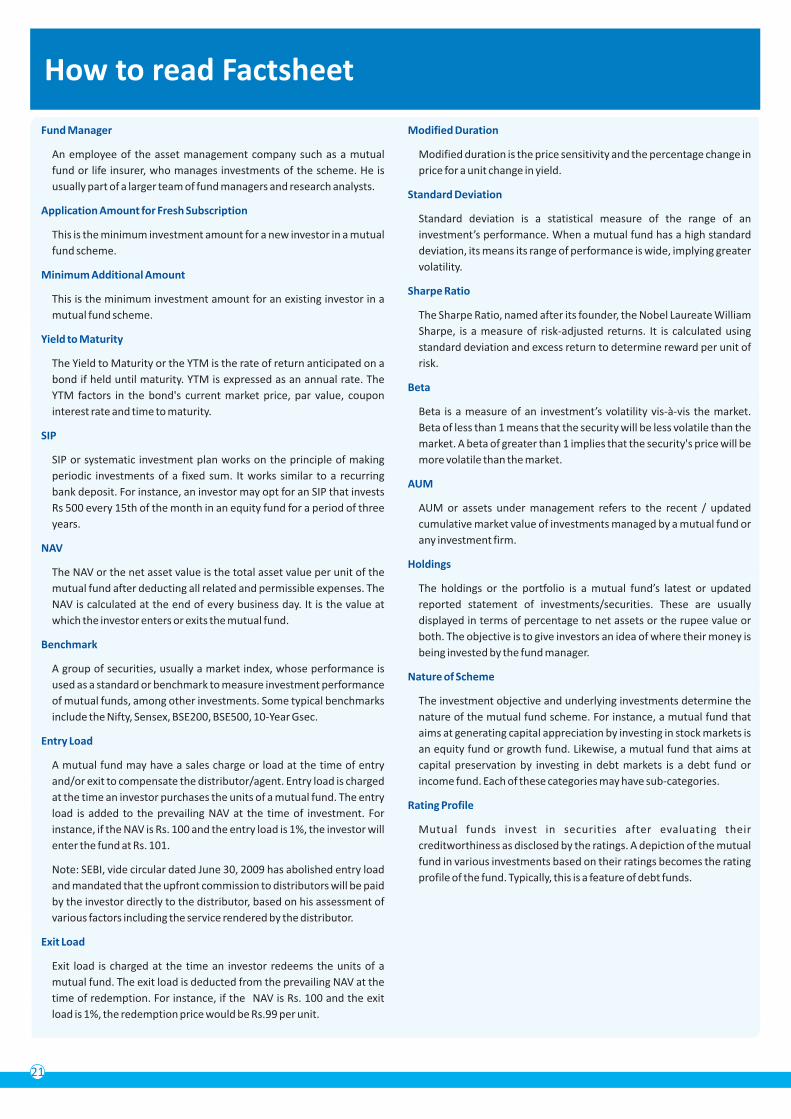
How to read Factsheet
Fund Manager
Application Amount for Fresh Subscription
Minimum Additional Amount
Yield to Maturity
SIP
NAV
Benchmark
Entry Load
Exit Load
An employee of the asset management company such as a mutual
fund or life insurer, who manages investments of the scheme. He is
usually part of a larger team of fund managers and research analysts.
This is the minimum investment amount for a new investor in a mutual
fund scheme.
This is the minimum investment amount for an existing investor in a
mutual fund scheme.
The Yield to Maturity or the YTM is the rate of return anticipated on a
bond if held until maturity. YTM is expressed as an annual rate. The
YTM factors in the bond's current market price, par value, coupon
interest rate and time to maturity.
SIP or systematic investment plan works on the principle of making
periodic investments of a fixed sum. It works similar to a recurring
bank deposit. For instance, an investor may opt for an SIP that invests
Rs 500 every 15th of the month in an equity fund for a period of three
years.
The NAV or the net asset value is the total asset value per unit of the
mutual fund after deducting all related and permissible expenses. The
NAV is calculated at the end of every business day. It is the value at
which the investor enters or exits the mutual fund.
A group of securities, usually a market index, whose performance is
used as a standard or benchmark to measure investment performance
of mutual funds, among other investments. Some typical benchmarks
include the Nifty, Sensex, BSE200, BSE500, 10-Year Gsec.
A mutual fund may have a sales charge or load at the time of entry
and/or exit to compensate the distributor/agent. Entry load is charged
at the time an investor purchases the units of a mutual fund. The entry
load is added to the prevailing NAV at the time of investment. For
instance, if the NAV is Rs. 100 and the entry load is 1%, the investor will
enter the fund at Rs. 101.
Note: SEBI, vide circular dated June 30, 2009 has abolished entry load
and mandated that the upfront commission to distributors will be paid
by the investor directly to the distributor, based on his assessment of
various factors including the service rendered by the distributor.
Exit load is charged at the time an investor redeems the units of a
mutual fund. The exit load is deducted from the prevailing NAV at the
time of redemption. For instance, if the NAV is Rs. 100 and the exit
load is 1%, the redemption price would be Rs.99 per unit.
Modified Duration
Standard Deviation
Sharpe Ratio
Beta
AUM
Holdings
Nature of Scheme
Rating Profile
Modified duration is the price sensitivity and the percentage change in
price for a unit change in yield.
Standard deviation is a statistical measure of the range of an
investment’s performance. When a mutual fund has a high standard
deviation, its means its range of performance is wide, implying greater
volatility.
The Sharpe Ratio, named after its founder, the Nobel Laureate William
Sharpe, is a measure of risk-adjusted returns. It is calculated using
standard deviation and excess return to determine reward per unit of
risk.
Beta is a measure of an investment’s volatility vis-à-vis the market.
Beta of less than 1 means that the security will be less volatile than the
market. A beta of greater than 1 implies that the security's price will be
more volatile than the market.
AUM or assets under management refers to the recent / updated
cumulative market value of investments managed by a mutual fund or
any investment firm.
The holdings or the portfolio is a mutual fund’s latest or updated
reported statement of investments/securities. These are usually
displayed in terms of percentage to net assets or the rupee value or
both. The objective is to give investors an idea of where their money is
being invested by the fund manager.
The investment objective and underlying investments determine the
nature of the mutual fund scheme. For instance, a mutual fund that
aims at generating capital appreciation by investing in stock markets is
an equity fund or growth fund. Likewise, a mutual fund that aims at
capital preservation by investing in debt markets is a debt fund or
income fund. Each of these categories may have sub-categories.
Mutual funds invest in securities after evaluating their
creditworthiness as disclosed by the ratings. A depiction of the mutual
fund in various investments based on their ratings becomes the rating
profile of the fund. Typically, this is a feature of debt funds.
21
22
Disclaimer/Statutory DetailsStatements relating to outlook and forecast are the opinions of the Author. The views expressed by the author are personal and are not necessarily that of BOI AXA Investment Managers Private Limited (AMC). This report is for information purpose only and is not intended to be any investment advice. Please make independent research/ obtain professional help before taking any decision of investment/ sale. AMC makes no representation as to the quality, liquidity or market perception of any securities/ issuer/ borrower, if described in the report above, nor does it provide any guarantee whatsoever. Information and material used in this report are believed to be from reliable sources. However, AMC does not warrant the accuracy, reasonableness and/or completeness of any information. AMC does not undertake to update any information or material in this report. Decisions taken by you based on the information provided in this report are to your own account and risk. AMC and any of its officers, directors and employees shall not be liable for any loss or damage of any nature, as also any loss of profit in any way arising from the use of this material in any manner. AMC or its directors, officers and employees, including author of this report/ persons involved in the preparation or issuance of this report may, from time to time, have long or short positions in, and buy or sell the securities, if any, mentioned herein or have other potential conflict of interest with respect to any recommendation and related information and opinions given in the report/ report. This report, or any part of it, should not be duplicated, or contents altered/ modified, in whole or in part in any form and or re-distributed without AMC’s prior written consent. © BOI AXA Investment Managers Private Limited 2017.
Mutual Fund investments are subject to market risks, read all scheme related documents carefully.
AMC Website: www.boiaxa-im.com is also an Investor Service Centre (for online transactions)
B/204, Tower 1, Peninsula Corporate Park, Ganpatrao Kadam Marg, Lower Parel, Mumbai - 400 013.
Toll free number : 1800-103-2263 & 1800-266-2676 • Alternate number : 020-4011 2300 & 020-6685 4100 • Website : www.boiaxa-im.com • Email : [email protected]
BOI AXA Investment Managers Pvt. Ltd.(Investment Manager for BOI AXA Mutual Fund)
BOI AXA Investment Managers’ Branches - Investor Service Centers (ISC's)
• Ahmedabad - Shop No.:- 405, 4th Floor, Zodiac Plaza, H. L. College Road, Navrangpura, Ahmedabad - 380 009. • Bangalore - 957, Regus Business Centre, Bangalore Pvt. Ltd., Level 9, Raheja Towers, 26 - 27, Mahatma Gandhi Road, Bangalore - 560 001. • Bhopal - F. F. 16, Part B, Mansarover Complex, Near Habibganj Railway Station, Bhopal - 462 016. • Chandigarh - 205, Megabyte Business Centre, SCO-333-334, Ist Floor, Sec-35B Chandigarh - 160 022. • Chennai - Cabin No. 203, Apeejay Business Center No: 39/12, Haddows Road, Nungambakkam, Chennai - 600 034. • Hyderabad - Cabin No. 23, Apeejay Business Centre, Tresorie, The Park, 22 Rajbhavan Road, Somajiguda, Hyderabad - 500 082. • Jaipur - Office no.154, 1st Floor, Ganpati Plaza,M I Road, Jaipur - 302 001. • Kolkata - Cabin 06, Block - A, 8th Floor, Apeejay House, 15 Park Street, Kolkata - 700 016. • Lucknow - Office No-504, 5th Floor, Sriram Tower, 13 Ashok Marg, Hazratganj, Lucknow - 226 001. • Mumbai B/204, Tower 1, Peninsula Corporate Park, Ganpatrao Kadam Marg, Lower Parel, Mumbai - 400 013. • New Delhi - Room No. 610, Avanta Business Center, 4th Floor, Statesman House, Barakhamba Road, Connaught Place, New Delhi - 110 001. • Pune - Apeejay Business Centre, 1st Floor, Pride House, S.No. 108/7, Shivajinagar, University Road, Pune - 411 016. • Vadodara - 118, 1st Floor, Siddharth Complex, R C Dutt Road, Alkapuri, Vadodara - 390 005.
• Agra: F-1, Ist Floor, Deepak Wasan Plaza, Above HDFC Bank, Sanjay Place, Agra - 282 002. • Ahmedabad: 201,Shail Building, Opp : Madhusudhan House, Nr. Navrangpura Telephone Exchange; Navrangpura Ahmedabad - 380 006. • Allahabad: Rsa Towers, 2nd Floor, Above Sony TV Showroom, 57, S P Marg, Civil Lines, Allahabad - 211001. • Amritsar: 72-A, Taylor'S Road, Aga Heritage Gandhi Ground, Amritsar - 143 001. • Anand: B/ 42, Vaibhav Commercial Center, Nr TVS Down Town Shrow Room, Grid Char Rasta, Anand - 388 001. • Asansol: 114/71, G.T. Road, Near Sony Centre, Bhanga Pachil, Asansol - 713 303. • Aurangabad: Ramkunj Niwas, Railway Station Road Near Osmanpura Circle Aurangabad- 431005. • Bangalore: 59, ‘Skanda’ Puttanna Road, Basavanagudi, Bangalore - 560 004. • Belgaum: CTS No 3939/ A2 A1, Above Raymonds Show Room, Beside Harsha Appliances, Club Road, Belgaum - 590 001. • Bhagalpur: 2nd Floor, Chandralok Complex, Ghantaghar, Radha Rani Sinha Road, Bhagalpur - 812 001. • Bhopal: Kay Kay Business Centre, 133, Zone I, M P Nagar, Bhopal - 462 011. • Bhubaneswar: 2nd & 3rd Floor, Janardan, House, A 181, Saheed Nagar, Bhubaneswar - 751 007. • Bokaro: B-1, 1st Floor, City Centre, Sector- 4, Near Sona Chandi-Jewellers, Bokaro - 827 004. • Calicut: 2nd Floor Soubhagya Shopping Complex Arayidathpalam, Mavoor Road Calicut- 673004. • Chandigarh: SCO-2423-2424 1ST Floor, Above TVS showroom, Sec 22C Chandigarh - 160 022. • Chennai: Flat No F11, First Floor, Akshya Plaza,(Erstwhile Harris Road), Opp Chief City Metropolitan Court, #108, Adhithanar Salai, Egmore, Chennai - 600 002. • Cochin: Building Nos.39 Ali Arcade, 1st Floor, Near Atlantis Junction, Kizhvana Road, Panampili Nagar, Cochin - 682 036. Ernakulum District. • Coimbatore: 3rd Floor,Jaya Enclave, 1056-1057, Avinashi Road, Coimbatore - 641 018. • Dehradun: Kaulagarh Road, Near Sirmour Marg, Above Reliance Webworld, Dehradun - 248 001. • Dhanbad: 208, New Market, 2Nd Floor, Katras Road, Bank More, Dhanbad - 826 001. • Gandhinagar: Plot No. - 945/2, Sector - 7/C, Gandhinagar - 382 007. • Ghaziabad: 1st Floor, C-7, Lohia Nagar, Ghaziabad - 201 001. • Gorakhpur: Above V.I.P. House, Ajdacent A.D. Girls Inter College, Bank Road Gorakpur - 273 001. • Gurgaon: Shop No. 18, Ground Floor, Sector – 14 Opp. Akd Tower, Near Huda Office Gurgaon- 122001. • Guwahati: 1st Floor, Bajrangbali Building, Near Bora Service Station, GS Road, Guwahati - 781 007. • Gwalior: 2nd Floor- Rajeev Plaza, Jayendra Ganj, Lashkar, Gwalior, M.P.- 474 009. • Hubli: CTS 483/A1/A2, Gr floor, Sri Ram Plaza, Club Road, Behind Kotak Mahindra Bank, Hubli - 580 023. • Hyderabad: 8-2-596 Karvy Plaza, Avenue 4, Street No.1, Banjara Hills, Hyderabad - 500 034. • Indore: 19/1, New Palasia, Balaji Corporate-203, 204 & 205, 2nd Floor, Above ICICI Bank, Near Curewell Hospital, Janjeerwala Square, Indore, Madhya Pradesh - 452 001. • Jabalpur: 43, Naya Bazar, Opposite shyam talkies Jabalpur (M.P.) 482 001. • Jaipur: S-16 A, 3Rd Floor Land Mark, Opposite Jaipur Club Mahavir Marg, C- Scheme Jaipur - 302 001. • Jalandhar: 1st Floor, Shanti Towers, SCO No. 37, PUDA Complex, Opposite Tehsil Complex, Jalandhar - 144001. • Jamshedpur: 2nd Floor, R R Square, SB Shop Area, Near Reliance Foot Print & Hotel - BS Park Plaza, Main Road, Bistpur, Jamshedpur 831001. • Jodhpur: 203, Modi Arcade; Chupasni Road, Jodhpur - 342 001. • Kanpur: 15/46,Ground Floor, Opp: Muir Mills, Civil Lines, Kanpur - 208 001. • Kolhapur: 605/1/4 E Ward, Near Sultane Chambers, Shahupuri 2nd Lane Kolhapur - 416 001. • Kolkata: Apeejay House (Beside Park Hotel), 15 Park Street, C Block, 3rd Floor, Kolkata - 700 016. • Lucknow: 1st Floor, A. A. Complex, Thaper House, 5 Park Road, Hazratganj, Lucknow - 226 001. • Ludhiana: SCO - 136, First Floor Above Airtel Show Room, Feroze Gandhi Market, Ludhiana - 141 001. • Madurai: Rakesh Towers, 30-C, Bye Pass Road Ist Floor, Opp Nagappa Motors, Madurai - 625 010. • Moradabad: Om Arcade, Parker Road, Above Syndicate Bank, Chowk Tari Khana, Moradabad - 244001. • Mumbai (Andheri): 6 & 7, 131 Andheri Industrial Estate Veera Desai Road, Andheri (West) Mumbai- 400053. • Mumbai (Borivali): A-1, Himanshu Building, Sodawala Cross Lane Near Chamunda Circle, Borivali (West), Mumbai - 400 092. • Mumbai (Chembur): Shop No 4 , Ground Floor, Shram Saflya Bldg N G Acharya Marg, Chembur Mumbai - 400071. • Mumbai (Fort): Office number: 01/04 24/B, Raja Bahadur Compound Ambalal Doshi Marg, Behind Bombay Stock Exchange, Fort Mumbai - 400 001. • Mumbai (Thane): 101, Yashwant Tower, Ram Maruti Road, Opp. Pooja Hotel, Naupada, Thane, Mumbai - 400 602. • Mumbai (Vashi): Shop No. 43-A, Ground Floor, Vashi Plaza Sector-17 Near Apna Bazar, Vashi, Mumbai-400705. • Mumbai (Vile Parle): 104, Sangam Arcade, V P Road, Opposite Railway Station, Above Axis Bank ATM, Vile Parle (West), Mumbai - 400 056. • Muzaffarpur: 1st Floor, Shukla Complex, Near ICICI Bank, Civil Court Branch, Company Bagh, Muzaffarpur - 842 001. • Nagpur: Plot No.2/1, House no. 102/1, Mangaldeep Apartment, Mata Mandir Road, Opp. Khandelwal Jewellers, Dharampeth, Nagpur - 440 010. • Nasik: S-12, Second Floor, Suyojit Sankul, Sharanpur Road Nasik - 422 002. • New Delhi: 305, 3rd Floor New Delhi House, Bara Khamba Road Connaught Place New Delhi - 110 001. • Noida: 307 Jaipuria Plaza; D 68 A, 2nd Floor Opp Delhi Public School, Sector 26 Noida - 201 301. • Panipat: 1st Floor, Krishna Tower Above Amertex, G.T. Road, Panipat - 132 103. • Panjim: Flat No.1-A, H. No. 13/70, Timotio Bldg, Heliodoro Salgado Road, Next to Navhind Bhavan (Market Area) Panjim - 403 001. • Patna: 3A, 3rd floor, Anand Tower, Beside Chankya Cinema Hall; Exhibition Road, Patna - 800 001. • Pune: Mozaic Bldg, CTS No.1216/1, Final Plot No.576/1 TP, Scheme No.1, F C Road, Bhamburda, Shivaji Nagar, Pune - 411 004. • Raipur: Room No. TF 31, 3 Rd Floor, Millennium Plaza Behind Indian Coffee House, G E Road, Raipur - 492 001. • Rajkot: 104, Siddhi Vinayak Complex Dr Yagnik Road, Opp Ramkrishna Ashram Rajkot - 360 001. • Ranchi: Room No. 307, 3Rd Floor, Commerce Towers, Beside Mahabir Towers, Main Road, Ranchi - 834 001. • Shillong: Mani Bhawan, Lower Thana Road, Police Bazar, Shillong - 793 001. • Siliguri: Nanak Complex, Near Church Road, Sevoke Road, Siliguri - 734 001. • Solapur: Block No. 06, Vaman Nagar, Opp. D-Mart, Jule Solapur, Solapur, Maharashtra - 413004. • Surat: G-6 Empire State Building, Near Parag House,Udhna Darwaja Ring Road Surat - 395 002. • Udaipur: 201-202, Madhav Chambers, Opp G P O, Chetak Circle, Udaipur - 313001. • Ujjain: 101, Aastha Tower, 13/1, Dhanwantri Marg, Free Gunj Ujjain - 456 010. • Vadodara: 203, Corner point, Jetalpur Road, Vadodara - 390 007. • Varanasi: D-64/132, KA 1st Floor, Anant Complex, Sigra, Varanasi - 221 010. • Vijayawada: 39-10-7, Opposite Municipal Water Tank, Labbipet, Vijayawada - 520 010. • Visakhapatnam: Door No: 48-8-7, Dwaraka Dimond, Ground Floor, Srinagar, Visakhapatnam - 530016.
-
Karvy Computershare Private Limited Branches - Investor Service Centers (ISC's)
Date of Publication: 5/7/17

THIS PA
GE IS IN
TRNTIONALL
Y LEFT
BLA
NK
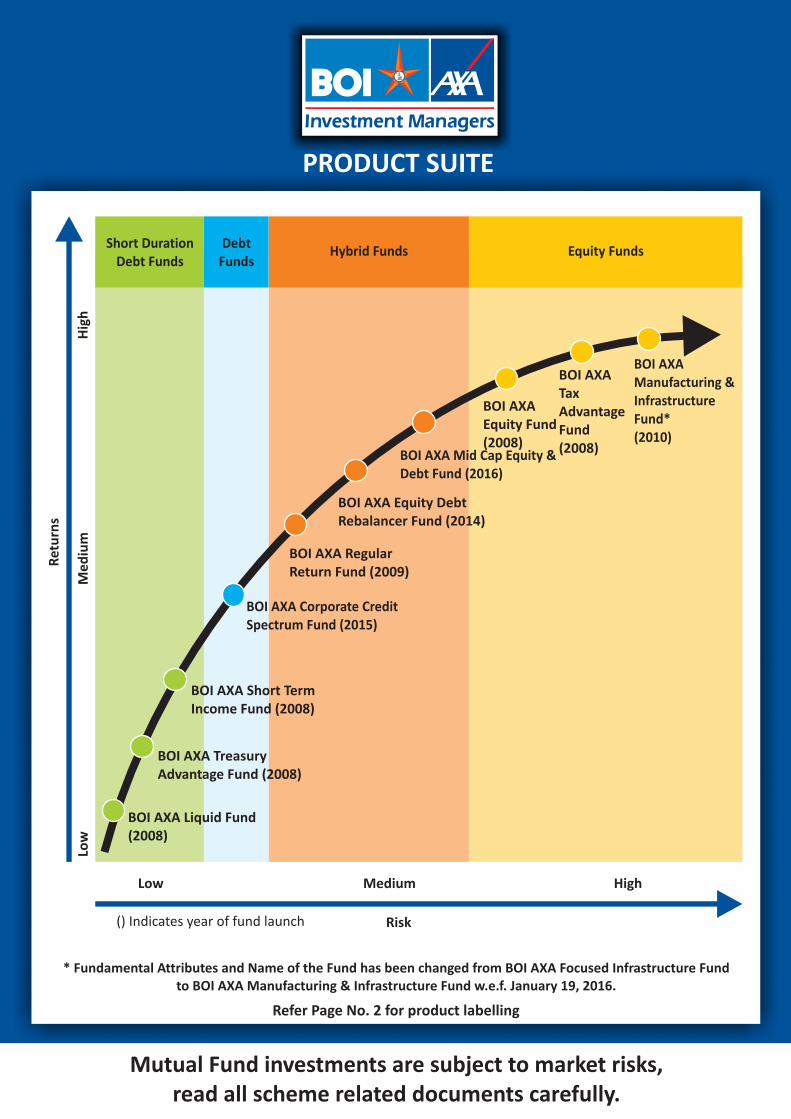
PRODUCT SUITE
Mutual Fund investments are subject to market risks, read all scheme related documents carefully.
Refer Page No. 2 for product labelling
* Fundamental Attributes and Name of the Fund has been changed from BOI AXA Focused Infrastructure Fund to BOI AXA Manufacturing & Infrastructure Fund w.e.f. January 19, 2016.
Risk
Low Medium High
() Indicates year of fund launch
Equity FundsHybrid FundsDebt
Funds
Low
Short DurationDebt Funds
Me
diu
mH
igh
Ret
urn
s
BOI AXA Regular Return Fund (2009)
BOI AXA Corporate Credit Spectrum Fund (2015)
BOI AXA Manufacturing & Infrastructure Fund*(2010)
BOI AXA Tax Advantage Fund (2008)
BOI AXAEquity Fund (2008)
BOI AXA Mid Cap Equity & Debt Fund (2016)
BOI AXA Equity Debt Rebalancer Fund (2014)
BOI AXA Short Term Income Fund (2008)
BOI AXA Treasury Advantage Fund (2008)
BOI AXA Liquid Fund (2008)