investment performance review period ending december 31, …
TRANSCRIPT

Investment Performance Review
Period Ending December 31, 2017
Southfield Employees'Retirement System

AndCoFirm Update
As we embark on a New Year together we first wanted to say, “Thank you” toour clients for giving us the opportunity to work with you. Our mission is torepresent the sole interests of our clients by redefining independence. Thismission means everything to us. We want to demonstrate this mission everyday by maintaining your trust in an evolving financial world. We are extremelygrateful to be your consultant and will continue to work tirelessly to uphold yourtrust and confidence.
As we enter 2018, AndCo has never been stronger and more committed todelivering high quality service. We are 87 people strong, all collectively strivingto serve our clients each day. Since most clients do not have the opportunity tointeract with our entire firm, we have attached a page which outlines ourcurrent organizational structure and illustrates our continued reinvestment inprofessionals to better serve you. Our steadfast focus on one line of business,general consulting, will remain our singular focus going forward.
Each January, we hold a Firmwide retreat to discuss the previous year’ssuccesses and challenges, as well as outline our Strategic plan, includingreinforcement of our Mission, Vision and Values. It’s a great time for ouremployees to spend time together and get a better understanding of where thecompany is going, why we’re headed in that direction, and more importantly,the critical role they each play in making it a success. Starting last year, alongwith this strategic review, we also started the process of announcing newpartners at the firm. Since the firm was founded in 2000 by Joe Bogdahn, itsfoundational goal was to make the firm a multigenerational organization led bythe employees. That succession plan was put into place in 2015 and lastJanuary we announced 6 new partners – Donna Sullivan, David Ray, JasonPurdy, Bryan Bakardjiev, Steve Gordon and Troy Brown.
This year, we added one new partner – Dan Johnson. Dan has been with thefirm for almost 10 years and has worked tirelessly serving his clients andevolving the firm in multiple areas. Dan believes in what we are doing and thevalue of the independent service model. Dan has continuously demonstratedhis willingness to drop everything to help others and help the firm better serveour clients, each other, and the community. As a testament to his contributions,when his name was announced Dan received a standing ovation from hispeers. We are honored to have Dan at our firm and part of our ownership team.
At AndCo, we believe in order to continue growing over time, and aligninterests of all employees, we must continue to recycle equity opportunitiesback into the organization. This belief embodies our commitment to remainemployee owned and managed, as well as reward those team members thathave helped make the company what it is today and what it will be goingforward. This shared belief also ensures legacy partners will eventually transfertheir units to new members.
As such, since Joe initially transferred units back to the firm, I have grantedunits to new members. I am also happy to acknowledge Dave West as themost recent 1st generation partner to voluntarily recycle his ownership unitsback into the company. Dave was one of our initial partners and was aninstrumental collaborator in the development of the early philosophies anddeliverables of the organization. Dave will continue to support the firm byserving our clients with the same passion and enthusiasm into the future asone of our most tenured senior consultants.
So, this New Year we want to say “Thank you” twice: once to you, our valuedclients, and once to Dave West for his support, belief and understanding of theAndCo way. We embark on 2018 stronger than ever thanks to your trust,people like Dave, and the rest of our tremendous, growing team.
On behalf of everyone at AndCo, thank you for your partnership.
Mike Welker, CFA®
President/CEO
2

3

AndCoFirm Update
Mike Welker,CFAPresident/CEO
Bryan Bakardjiev,CFAExecutive Director
Troy Brown, CFAExecutive Director
SteveGordonExecutive Director
Kim Spurlin, CPAExecutive Director
Jeff Gabrione, CFA Director of Research-Alternatives
Julie Baker, CFAInternational
Brad Hess, CFADomestic
Steve Jones,CFAHead of AssetStrategies
TimKominiarek, CAIAHead of RealAsset
Kevin Laake, CFADomestic
Rob Mills, CAIARealEstate
KadmielOnodje,CAIAAsset Strategies
Dan Osika, CFAAsset Strategies
Philip Schmitt, CIMAHead of Fixed Income
Evan Scussel, CFA, CAIAHead ofEquity
Matthew OgrenAssociate
David RayDirector of Client Solutions
Misha Bell
Jose Christiansen
Amy Foster
Nicole Hampton
Kim Hummel
Mary Ann JohnsonZach Chichinski, CFA, CIPM RosemarieKieskowski
Yoon Lee-Choi
Annie Lopez
Grace Niebrzydowski
Beth Porzelt
Jeff Pruniski
Albert Sauerland
Donna Sullivan
Brooke Wilson
Jacob PeacockDirector of Retirement Solutions
Joe Carter
Al DiCristofaro
Amy Heyel
Paul Murray
Rachel Brignoni,CLSC Director of Human Resources
Jason PurdyDirector of IT
Jamie UttIT Systems Administrator
Jerry Camel Director of Software Development
Tim LingerSoftware Developer
Brandie RiveraController
Derek Tangeman, CFP, CIMADirector of Marketing
Kim GoodearlHead of RFPTeam
Tala ChinMarketing Analyst
John Rodak,CIPMHead of Client On-Boarding
Meghan HainesClient On-Boarding Associate
Bonnie BurgessOffice Administrator
Matt DeConcini, Esq.Chief Compliance Officer
Sara SearleCompliance Officer
Matt DeConcini, Esq. Chief Compliance Officer (Moderator)Jack EvattDirector/Senior Consultant
Jeff Gabrione, CFADirector of Research
DanJohnsonDirector/Senior Consultant
Ian JonesSenior Consultant
Jacob PeacockDirector of RetirementSolutions
Jack EvattDirector of ConsultingDan Johnson Director of Consulting Doug AndersonAnnette Bidart Mike Bostler Jon Breth,CFPChristiaan J. Brokaw, CFA Peter BrownJennifer Brozstek Mike Fleiner
Michael Holycross,CIMA Jennifer Gainfort, CFA Brian GreenTylerGrumbles,CFA,CIPM Ian JonesTony Kay Brian KingJeff Kuchta, CFAChris Kuhn, CFA, CAIA Justin Lauver,Esq.John McCann,CIMAJohn Mellinger
Tim Nash Mary NyeT. Christopher Pipich, CFA Howard PohlKerry Richardville, CFA James RossJohn Thinnes, CFA, CAIABrendon M. Vavrica, CFPTim WaltersGreg Weaver Dave West, CFA
4

Market returns were positive across major equity and fixed income indices forthe 4th quarter and calendar year 2017. Broad domestic and internationalequity markets continued their year long trend of strong positive performance.Fixed income indices also posted positive results, but equities outpaced fixedincome investments for both the quarter and 1-year period as improvingmacroeconomic data and robust corporate earnings worldwide fosteredinvestor optimism in the continued global economic recovery. The US stockmarket represented by the Russell 3000 Index returned 6.3% and 21.1% forthe quarter and calendar year respectively. While the Russell 3000outperformed the international MSCI ACWI ex US Index during the 4th quarter,international stocks were the best performers of 2017. Domestic equity indicespushed higher as most measures continued to show continued signs of ahealthy US economy. Future prospects for lower corporate and individual taxrates following the passage of a republican party led tax code overhaul inDecember also boosted returns through the period.
International equity market benchmarks posted considerable gains for both the4th quarter and year-to-date period with the MSCI ACWI ex US returning 5.0%and 27.2% respectively. Emerging market stocks outpaced both internationaldeveloped and US equities over both periods with the MSCI Emerging MarketsIndex returning 7.4% through the quarter and an impressive 37.3% for thecalendar year. While developed market international index returns wereweaker by comparison, they still posted solid gains with the MSCI EAFE Indexreturning 25.0% for the 1-year period outpacing major domestic indices.International equities benefitted from continued strength in global fundamentaldata, a weakening U.S. Dollar (USD) and generally accommodative globalcentral bank policies. This positive trend in economic fundamentals led someglobal central banks to begin normalizing monetary policy with both theEuropean Central Bank (ECB) and the Bank of England (BoE) taking actionduring the 4th quarter. Many international markets also saw their returnsinfluenced, both positively and negatively, by ongoing political developmentsthroughout the quarter.
During the 4th quarter, interest rates on the US Treasury Yield Curve rose forshort-term maturities, but fell for long-term maturities causing further flatteningof the yield curve. The jump in interest rates on the short end of the curve waspartially due to increasing investor expectations for a US Federal Reserve(Fed) interest rate hike, which materialized in December. Despite the increasein short-term rates, broad fixed income indices posted modestly positiveresults with the bellwether Bloomberg Barclays U.S. Aggregate Index returning0.4% for the quarter and 3.5% for the year. Corporate credit continued its trendof outperformance relative to other investment grade sectors through 2017 asit benefitted from the further tightening of credit spreads relative to Treasuries.
Source: Investment Metrics
The Market EnvironmentMajor Market Index Performance
As of December 31, 2017
0.3%
1.2%
0.2%
1.3%
0.0%
0.4%
3.3%
6.1%
6.6%
6.3%
6.6%
7.4%4.2%
5.0%
0.0% 2.0% 4.0% 6.0% 8.0%
3-Month T-Bill
Bbg Barclays Corp IGBbg Barclays MBS
Bbg Barclays US TIPSBbg Barclays US GovtBbg Barclays US Agg
Russell 2000Russell MidCap
Russell 1000Russell 3000
S&P 500
MSCI Emerg MktsMSCI EAFE
MSCI ACWxUS
Quarter Performance
0.8%
6.4%
2.5%
3.0%
2.3%
3.5%
14.6%
18.5%
21.7%
21.1%
21.8%
37.3%25.0%
27.2%
0.0% 5.0% 10.0% 15.0% 20.0% 25.0% 30.0% 35.0% 40.0%
3-Month T-Bill
Bbg Barclays Corp IGBbg Barclays MBS
Bbg Barclays US TIPSBbg Barclays US GovtBbg Barclays US Agg
Russell 2000Russell MidCap
Russell 1000Russell 3000
S&P 500
MSCI Emerg MktsMSCI EAFE
MSCI ACWxUS
1-Year Performance
5

Source: Investment Metrics
The Market EnvironmentDomestic Equity Style Index Performance
As of December 31, 2017
US equity index returns were solidly positive across the style and capitalizationspectrum for the 4th quarter and trailing 1-year period. Throughout 2017, therewas only one instance of a negative quarterly return being posted by theRussell market cap and style indices, which was a -0.13% return by theRussell 2000 Value Index during 1Q 2017. Quarterly results benefitted fromthe passage of republican party tax reforms that represented the first majorrestructuring of the US Tax code since 1986. Investors cheered the reductionsto both individual and corporate income tax rates. In particular, the reduction ofthe corporate tax rate from 35% to 21%, all else equal, should act as atailwind to corporate earnings and therefore future investment returns.Furthermore, as seen through much of 2017, encouraging economic datacontinued to facilitate gains in U.S. equity markets as positive trends in GDP,consumer and business sentiment, corporate earnings and employmentcontinued throughout the period.
During the quarter, large cap stocks outperformed mid and small cap equities.The large cap Russell 1000 Index returned 6.6% during the period, double the3.3% return posted by the small cap Russell 2000 Index. Calendar year resultsecho the 4th quarter’s with the Russell 1000 gaining 21.7% versus a 14.6%increase for the Russell 2000. This trend of large cap outperformance can bepartially explained by their greater to exposure to foreign markets relative tosmall cap companies. This can be especially beneficial during periods of USDweakness, such as that experienced over the last year, which is typicallyfavorable to exporters and foreign sales. Large cap companies as a wholegenerate more revenue outside of the US which can expose them to fastergrowing markets, foreign tax benefits or strengthening foreign currencies.
Growth indices outperformed value indices across the market cap spectrum forthe fourth straight quarter. Performance for growth indices more than doubledvalue index performance for each respective cap segment with all market capgrowth indices posting returns greater than 20% during 2017. Growthbenchmarks benefitted from larger exposures to more cyclical names withinthe information technology, consumer discretionary, health care and industrialssectors. They also benefitted from underweights to more defensive “bondproxy” sectors such as REITs, utilities and telecom. Lower exposure to theenergy sector also acted as tailwind to growth benchmarks.
Domestic equity valuations appear stretched relative to historical levels basedon Forward Price/Earnings ratios (P/E), with even the most reasonably valuedindices trading above their historical P/E valuations. Index P/E valuationsrange from 110% to 132% of their respective 15-year P/E averages. The smallcap value index appears the most inexpensive and the small cap growthsegment looks the most overvalued.
4.6%
3.3%
2.0%
6.8%
6.1%
5.5%
7.9%
6.6%
5.3%
7.6%
6.3%
5.1%
0.0% 2.0% 4.0% 6.0% 8.0%
2000 Growth
2000 Index
2000 Value
MidCap Growth
MidCap Index
MidCap Value
1000 Growth
1000 Index
1000 Value
3000 Growth
3000 Index
3000 Value
Quarter Performance - Russell Style Series
22.2%
14.6%
7.8%
25.3%
18.5%
13.3%
30.2%
21.7%
13.7%
29.6%
21.1%
13.2%
0.0% 5.0% 10.0% 15.0% 20.0% 25.0% 30.0% 35.0%
2000 Growth
2000 Index
2000 Value
MidCap Growth
MidCap Index
MidCap Value
1000 Growth
1000 Index
1000 Value
3000 Growth
3000 Index
3000 Value
1-Year Performance - Russell Style Series
6

The Market EnvironmentGICS Sector Performance & (Sector Weight)
As of December 31, 2017
Source: Morningstar Direct
Sector performance was positive across all sectors for the 4th quarter of 2017.However, only four of eleven economic sectors outpaced the Russell 1000Index return. Cyclical sectors tended to do well through the period with thehigher yielding bond proxy sectors lagging on a relative basis. Apparel andretail companies drove performance within the consumer discretionary sector,which returned 9.2%, leading all other sectors. Technology stocks continuedtheir 2017 gains over the quarter benefitting from robust 3rd quarter earningsand product demand returning 8.9%. Over the trailing 1-year period,technology was the best performing sector by a relatively wide marginreturning an impressive 38.4%. Materials, consumer discretionary, healthcare,industrials and financials all posted returns greater than 20%. Nine of elevenlarge cap economic sectors posted positive returns for the year with eightposting double digit returns. Energy and telecom services were the only largecap sectors to post negative returns over the last year, returning -1.3% and-1.2% respectively.
Small cap sector results were mixed relative to their large capitalizationcounterparts. Five of eleven economic sectors outpaced the Russell 2000Index return for the quarter, with nine sectors posting positive results for theperiod. Most of the sector trends observable in large cap index sectorperformance also impacted small cap sectors. However, there were severalnotable differences, particularly in technology, telecom services and financialswhere there was significant underperformance relative to their large capcounterparts. Small cap sectors trailed large cap sectors in those threecategorizations by 8.0%, 7.4% and 6.7% during the quarter respectively. Overthe 1-year period, ten of eleven sectors have posted gains with six of elevensectors having returns greater than 10%. Over the one year period, healthcare stocks were the best performers within the Russell 2000 returning a solid35.7%. Energy was the only Russell 2000 sector to post a negative return overlast year, falling a meaningful -18.4%.
Using S&P 500 sector valuations as a proxy for the market, forward P/E ratiosfor eight of the GICS sectors were higher than their long-term averages atquarter-end. Using these historical P/E measures, the energy, materials andutilities sectors appear the most extended. In contrast the technology, healthcare and telecommunications sectors were trading at a discount to their long-term average P/E ratios.
12.3%
-1.2%
9.7%
24.1%
38.4%21.7%
22.1%
21.6%
-1.3%
12.9%
23.4%
0.5%
3.4%
3.1%
7.0%
8.9%
6.5%
1.5%
8.3%
6.4%
6.4%
9.2%
-5.0% 0.0% 5.0% 10.0% 15.0% 20.0% 25.0% 30.0% 35.0% 40.0%
Utilities (3.1%)
Telecom Services (1.9%)
Real Estate (3.7%)
Materials (3.4%)
Info Technology (23.4%)
Industrials (10.5%)
Health Care (13.5%)
Financials (14.8%)
Energy (5.8%)
Consumer Staples (7.6%)
Consumer Disc (12.3%)
Russell 1000 Quarter 1-Year
14.4%
5.6%
4.9%
17.7%
16.8%
19.5%
35.7%6.4%
-18.4%
5.3%
15.4%
1.0%
-4.0%
-0.5%
3.8%
0.9%
6.4%
2.5%
1.6%
6.9%
7.2%
7.7%
-20.0% -10.0% 0.0% 10.0% 20.0% 30.0% 40.0%
Utilities (3.7%)
Telecom Services (0.8%)
Real Estate (7.0%)
Materials (4.5%)
Info Technology (17.0%)
Industrials (15.2%)
Health Care (15.0%)
Financials (18.2%)
Energy (3.7%)
Consumer Staples (2.7%)
Consumer Disc (12.1%)
Russell 2000 Quarter 1-Year
7

The Market EnvironmentTop 10 Index Weights & Quarterly Performance for the Russell 1000 & 2000
As of December 31, 2017
Source: Morningstar Direct
Top 10 Weighted Stocks Top 10 Weighted Stocks
Russell 1000 Weight 1-Qtr Return
1-Year Return Sector Russell 2000 Weight 1-Qtr
Return1-Year Return Sector
Apple Inc 3.43% 10.2% 48.5% Information Technology Nektar Therapeutics Inc 0.42% 148.8% 386.7% Health Care
Microsoft Corp 2.53% 15.4% 40.7% Information Technology bluebird bio Inc 0.41% 29.7% 188.7% Health Care
Amazon.com Inc 1.83% 21.6% 56.0% Consumer Discretionary Sage Therapeutics Inc 0.30% 164.4% 222.6% Health Care
Facebook Inc A 1.63% 3.3% 53.4% Information Technology Exact Sciences Corp 0.29% 11.5% 293.3% Health Care
Berkshire Hathaway Inc B 1.50% 8.1% 21.6% Financials GrubHub Inc 0.29% 36.3% 90.9% Information Technology
Johnson & Johnson 1.49% 8.1% 24.4% Health Care Catalent Inc 0.26% 2.9% 52.4% Health Care
JPMorgan Chase & Co 1.46% 12.6% 26.7% Financials Knight-Swift Transportation Inc A 0.26% 5.4% 33.2% Industrials
Exxon Mobil Corp 1.40% 3.0% -3.8% Energy Curtiss-Wright Corp 0.26% 16.9% 24.6% Industrials
Alphabet Inc C 1.25% 9.1% 35.6% Information Technology EPAM Systems Inc 0.25% 22.2% 67.1% Information Technology
Alphabet Inc A 1.24% 8.2% 32.9% Information Technology Sterling Bancorp 0.25% 0.1% 6.4% Financials
Top 10 Performing Stocks (by Quarter) Top 10 Performing Stocks (by Quarter)
Russell 1000 Weight 1-Qtr Return
1-Year Return Sector Russell 2000 Weight 1-Qtr
Return1-Year Return Sector
CalAtlantic Group Inc 0.02% 54.1% 66.5% Consumer Discretionary Verso Corp A 0.03% 245.2% 147.5% Materials
Skechers USA Inc 0.02% 50.8% 53.9% Consumer Discretionary AnaptysBio Inc 0.09% 188.2% N/A Health Care
First Solar Inc 0.02% 47.2% 110.4% Information Technology Sage Therapeutics Inc 0.30% 164.4% 222.6% Health Care
Urban Outfitters Inc 0.01% 46.7% 23.1% Consumer Discretionary Valhi Inc 0.01% 154.6% 82.7% Materials
L Brands Inc 0.06% 46.5% -3.9% Consumer Discretionary Nektar Therapeutics Inc 0.42% 148.8% 386.7% Health Care
Regal Entertainment Group A 0.01% 45.4% 17.0% Consumer Discretionary Forterra Inc 0.01% 146.7% -48.8% Materials
HollyFrontier Corp 0.04% 43.5% 63.2% Energy Ignyta Inc 0.07% 116.2% 403.8% Health Care
Twitter Inc 0.06% 42.3% 47.3% Information Technology Overstock.com Inc 0.05% 115.2% 265.1% Consumer Discretionary
The Kroger Co 0.10% 37.6% -19.0% Consumer Staples Madrigal Pharmaceuticals Inc 0.02% 104.1% 516.0% Health Care
United States Steel Corp 0.02% 37.4% 7.4% Materials Boot Barn Holdings Inc 0.01% 86.6% 32.7% Consumer Discretionary
Bottom 10 Performing Stocks (by Quarter) Bottom 10 Performing Stocks (by Quarter)
Russell 1000 Weight 1-Qtr Return
1-Year Return Sector Russell 2000 Weight 1-Qtr
Return1-Year Return Sector
Mallinckrodt PLC 0.01% -39.6% -54.7% Health Care Iconix Brand Group Inc 0.00% -77.3% -86.2% Consumer Discretionary
Intrexon Corp 0.00% -39.4% -49.4% Health Care Aqua Metals Inc 0.00% -68.9% -83.8% Industrials
Pandora Media Inc 0.00% -37.4% -63.0% Information Technology Immune Design Corp 0.01% -62.3% -29.1% Health Care
Tesaro Inc 0.01% -35.8% -38.4% Health Care GNC Holdings Inc 0.01% -58.3% -66.6% Consumer Discretionary
PG&E Corp 0.09% -34.2% -24.5% Utilities Eastman Kodak Co 0.00% -57.8% -80.0% Information Technology
Acadia Healthcare Co Inc 0.01% -31.7% -1.4% Health Care GenMark Diagnostics Inc 0.01% -56.7% -65.9% Health Care
OPKO Health Inc 0.01% -28.6% -47.3% Health Care Willbros Group Inc 0.00% -55.9% -56.2% Energy
Celgene Corp 0.32% -28.4% -9.8% Health Care NanoString Technologies Inc 0.01% -53.8% -66.5% Health Care
General Electric Co 0.60% -27.3% -42.9% Industrials Nordic American Tankers Ltd 0.01% -53.6% -67.8% Energy
Newell Brands Inc 0.06% -27.0% -29.4% Consumer Discretionary Curis Inc 0.00% -53.0% -77.3% Health Care
8

Source: MSCI Global Index Monitor (Returns are Net)
International equity returns advanced during the 4th quarter, largely driven byongoing improvement in the global economy and continued weakness in theUSD. These trends, in tandem with a rally in technology stocks and risingcommodity prices, helped emerging markets continue their 2017outperformance relative to developed market equities. The USD continued itsyear-to-date decline against most major currencies through the period. Thisprovided additional tailwinds to international index returns denominated inUSD. The USD weakness is also visible in the 1-year performance for broadinternational indices, with all indices showing higher returns in terms of USD.
Results for broad developed market international indices were positive for the4th quarter in both USD and local currency terms with the MSCI EAFE Indexreturning 4.2% and 3.7% respectively. While developed markets advanced onthe back of positive economic data, ongoing political developments alsoimpacted several markets thorough the quarter. Enthusiasm over the ECB’sdecision to extend its quantitative easing program was waned by GermanChancellor Merkel’s failure to form a coalition government and Catalonia’sindependence referendum. In the UK, initial concerns over a “hard Brexit” weretempered toward the end of the quarter as a the EU and UK were able tocome to a preliminary agreement, increasing the odds of a more amicableseparation. Prime Minister Abe’s coalition government was successful inJapan’s October elections, winning a clear majority and providing reassurancethat Japan’s current monetary and fiscal policies will likely continue withoutmajor change. Performance for the past year has been strong on an absolutebasis with the MSCI EAFE Index returning 25.0% and 15.2% in USD and localcurrency terms respectively.
The MSCI Emerging Market Index outperformed developed markets during the4th quarter, returning 7.4% and 5.7% in USD and local currency termsrespectively. While the same tailwinds that pushed developed internationalmarkets higher also benefitted emerging market equities, rising commodityand technology stock prices also helped gains. Similar to developed markets,political news influenced emerging markets during the quarter. In China, therewas a change in posture with a greater focus on quality growth, financialstability and economic reforms. India announced relief for the country’s staterun banks designed to inject additional liquidity to the financial system toimprove lending and stimulate the economy. Mexican stocks suffered as thepeso weakened against the dollar and investor concerns surrounding thefuture of NAFTA’s pushed prices lower. Brazil also faced currency headwindsand despite the fact that corruption charges against President Temer weredropped, recent votes indicated that support for future political reforms mayhave weakened. One year returns for the MSCI Emerging Market Index werean impressive 37.3% in USD terms and 30.6% in terms of local currency.
The Market EnvironmentInternational and Regional Market Index Performance (Country Count)
As of December 31, 2017
1.9%
6.1%
7.3%
5.7%
8.1%
1.3%
3.7%
3.7%
4.2%
-2.3%
8.4%
11.7%
7.4%
8.0%
2.2%
4.2%
4.2%
5.0%
-4.0% -2.0% 0.0% 2.0% 4.0% 6.0% 8.0% 10.0% 12.0%
EM Latin Amer (5)
EM Asia (9)
EM EMEA (10)
Emerging Mkt (24)
Pacific (5)
Europe & ME (16)
EAFE (21)
WORLD x US (22)
AC World x US (46)
Quarter Performance USD Local Currency
22.1%
35.9%
15.2%
30.6%
19.7%
12.9%
15.2%
14.6%
18.2%
23.7%
42.8%
24.5%
37.3%
24.6%
25.3%
25.0%
24.2%
27.2%
0.0% 5.0% 10.0% 15.0% 20.0% 25.0% 30.0% 35.0% 40.0% 45.0%
EM Latin Amer (5)
EM Asia (9)
EM EMEA (10)
Emerging Mkt (24)
Pacific (5)
Europe & ME (16)
EAFE (21)
WORLD x US (22)
AC World x US (46)
1-Year Performance USD Local Currency
9

The Market EnvironmentU.S. Dollar International Index Attribution & Country Detail
As of December 31, 2017
Source: MSCI Global Index Monitor (Returns are Net in USD)
MSCI-EAFE MSCI-ACWIxUS Quarter 1- YearCountry Weight Weight Return ReturnJapan 24.0% 16.5% 8.5% 24.0%United Kingdom 17.8% 12.2% 5.7% 22.3%France 10.7% 7.3% 1.5% 28.8%Germany 9.8% 6.7% 2.8% 27.7%Switzerland 8.0% 5.5% 1.8% 22.5%Australia 6.9% 4.8% 6.8% 19.9%Hong Kong 3.6% 2.5% 6.6% 36.2%Netherlands 3.6% 2.5% 0.8% 32.2%Spain 3.2% 2.2% -1.6% 27.1%Sweden 2.7% 1.8% -3.8% 20.6%Italy 2.3% 1.6% -2.3% 28.4%Denmark 1.8% 1.3% 2.2% 34.7%Singapore 1.3% 0.9% 10.1% 35.6%Belgium 1.1% 0.8% -1.5% 18.6%Finland 0.9% 0.6% -2.6% 22.5%Norway 0.7% 0.5% 1.9% 28.3%Ireland 0.5% 0.3% 3.5% 18.1%Israel 0.5% 0.3% 4.1% 2.1%Austria 0.3% 0.2% 5.8% 58.3%New Zealand 0.2% 0.1% 1.5% 11.7%Portugal 0.2% 0.1% -2.0% 23.8%Total EAFE Countries 100.0% 68.7% 4.2% 25.0%Canada 6.6% 4.3% 16.1%Total Developed Countries 75.2% 4.2% 24.2%China 7.4% 7.6% 54.1%Korea 3.8% 11.4% 47.3%Taiwan 2.8% 4.0% 27.5%India 2.2% 11.8% 38.8%South Africa 1.8% 21.4% 36.1%Brazil 1.7% -2.0% 24.1%Russia 0.8% 4.3% 5.2%Mexico 0.7% -8.1% 16.0%Malaysia 0.6% 7.9% 25.1%Indonesia 0.6% 8.2% 24.2%Thailand 0.6% 9.5% 34.5%Poland 0.3% 5.8% 54.7%Chile 0.3% 7.2% 42.2%Philippines 0.3% 6.5% 24.6%Turkey 0.3% 4.3% 38.4%United Arab Emirates 0.2% -4.6% 2.9%Qatar 0.1% 4.7% -11.5%Colombia 0.1% 0.8% 16.3%Peru 0.1% 7.3% 38.4%Greece 0.1% 13.3% 28.6%Hungary 0.1% 7.1% 40.0%Czech Republic 0.0% 7.8% 35.5%Egypt 0.0% -2.1% 5.1%Pakistan 0.0% -5.5% -24.4%Total Emerging Countries 24.8% 7.4% 37.3%Total ACWIxUS Countries 100.0% 5.0% 27.2%
MSCI - EAFE Sector Weight Quarter Return 1-Year ReturnConsumer Discretionary 12.3% 5.3% 24.7%
Consumer Staples 11.2% 4.9% 24.1%
Energy 5.3% 10.0% 21.6%
Financials 21.2% 3.0% 24.7%
Health Care 10.1% 0.0% 16.9%
Industrials 14.6% 4.8% 30.0%
Information Technology 6.4% 5.0% 39.3%
Materials 8.2% 8.5% 33.9%
Real Estate 3.6% 6.4% 21.7%
Telecommunication Services 3.9% 0.7% 12.9%
Utilities 3.2% -1.0% 19.2%
Total 100.0% 4.2% 25.0%
MSCI - ACWIxUS Sector Weight Quarter Return 1-Year ReturnConsumer Discretionary 11.3% 6.1% 28.1%
Consumer Staples 9.6% 5.5% 24.0%
Energy 6.7% 7.4% 16.5%
Financials 23.1% 4.5% 26.0%
Health Care 7.6% 1.3% 18.1%
Industrials 11.9% 4.8% 29.4%
Information Technology 11.5% 6.2% 51.1%
Materials 8.2% 8.4% 32.2%
Real Estate 3.2% 5.6% 26.5%
Telecommunication Services 4.0% 1.5% 14.5%
Utilities 2.9% -0.4% 18.6%
Total 100.0% 5.0% 27.2%
MSCI - Emerging Mkt Sector Weight Quarter Return 1-Year ReturnConsumer Discretionary 10.2% 9.0% 40.1%
Consumer Staples 6.6% 8.2% 25.5%
Energy 6.8% 7.9% 21.1%
Financials 23.5% 8.2% 32.6%
Health Care 2.7% 16.6% 32.7%
Industrials 5.2% 5.1% 26.1%
Information Technology 27.7% 7.1% 60.6%
Materials 7.4% 8.7% 33.6%
Real Estate 2.8% 3.1% 49.5%
Telecommunication Services 4.8% 3.0% 16.8%
Utilities 2.4% 1.5% 16.6%
Total 100.0% 7.4% 37.3%
10

Source: Bloomberg
The Market EnvironmentDomestic Bond Sector & Broad/Global Bond Market Performance (Duration)
As of December 31, 2017
Broad fixed income benchmarks were slightly positive during the 4th quarter. InOctober, the Fed began implementation of its plan to gradually reduce itsbalance sheet by systematically slowing the rate of reinvestment of theTreasury and mortgage backed securities (MBS) it holds on its books as thesecurities mature. This process will reduce the size of the Fed’s balance sheetover time and can be viewed as tightening of monetary policy. Positivemacroeconomic data throughout the quarter increased expectations that theFederal Open Market Committee (FOMC) would increase short-term interestrates during the quarter, pushing interest rates higher, especially at the shortend of the yield curve. The FOMC announced a 25 bps interest rate hike afterits December meeting, however, investors were not surprised by the rateincrease and market reactions were relatively muted. Despite subduedinflation, the Fed feels the economy is tracking to be healthy enough towarrant continued tightening in 2018. This caused a flattening of the yieldcurve as short-term market yields rose and rates on maturities greater than 10years fell. Long-term rates fell due to the artificially low supply caused bysignificant Fed ownership of long maturity Treasuries as well as stronginvestor demand. All else equal, this was a benefit to longer duration indices.While this was a relatively difficult period for fixed income investments, theBloomberg Barclays U.S. Aggregate Index stayed slightly positive for thequarter and calendar year, returning 0.4% and 3.5% respectively.
Within investment grade credit, lower quality corporate issues outperformedhigher quality issues for both the quarter and 1-year period as contractingcredit spreads from improvements in economic fundamentals acted as atailwind to these issues. Baa rated credit was the best performing investmentgrade credit quality segment returning 1.2% for the quarter and 7.4% for theyear. High yield debt trailed investment grade credit for the quarter due to itslower duration and lack of spread compression relative to investment gradecredit. While investment grade spreads tightened 8 bps during the 4th quarter,spreads on high yield bonds tightened only 4 bps. However, high yield debtcontinues to be the largest beneficiary of the strengthening economy over lastyear with the Bloomberg Barclays High Yield Index appreciating 7.5%.
A review of sector performance shows that investment grade credit hascontinued its 2017 trend of outperformance versus Treasuries and MBSsecurities during the 4th quarter. As previously mentioned, corporate issuesbenefited from tightening credit spreads throughout the period. Treasuriesstruggled through the quarter due to lower yields and tightening monetarypolicy. Despite widening spreads and increased supply, MBS managed tooutperform Treasuries for the quarter and the year. For calendar year 2017,Treasury securities were the worst performing investment grade sectorreturning 2.3%, while U.S. investment grade corporate bonds were the bestperforming investment grade sector gaining 6.4%.
1.1%
1.6%
-0.1%
0.4%
1.3%
1.2%
0.2%
0.1%
0.5%
1.2%
1.1%
0.6%
0.1%
-1.0% 0.0% 1.0% 2.0%
Multiverse (6.8)
Global Agg x US (7.8)
Intermediate Agg (4.2)
Aggregate (6.0)
U.S. TIPS (5.8)
U.S. Corporate IG (7.6)
U.S. Mortgage (4.4)
U.S. Treasury (6.2)
U.S. High Yield (3.9)
Baa (7.7)
A (7.6)
AA (6.0)
AAA (5.4)
Quarter Performance
7.7%
10.5%
2.3%
3.5%
3.0%
6.4%
2.5%
2.3%
7.5%
7.4%
6.0%
4.2%
2.4%
0.0% 2.0% 4.0% 6.0% 8.0% 10.0% 12.0%
Multiverse (6.8)
Global Agg x US (7.8)
Intermediate Agg (4.2)
Aggregate (6.0)
U.S. TIPS (5.8)
U.S. Corporate IG (7.6)
U.S. Mortgage (4.4)
U.S. Treasury (6.2)
U.S. High Yield (3.9)
Baa (7.7)
A (7.6)
AA (6.0)
AAA (5.4)
1-Year Performance
11

Source: US Department of Treasury, FRED (Federal Reserve of St. Louis)
The Market EnvironmentMarket Rate & Yield Curve Comparison
As of December 31, 2017
Global fixed income indices also posted gains for the quarter. Globalbenchmarks are impacted by the same local yield and duration factors asdomestic benchmarks. While these indices have relatively high durations,which benefitted them in the current quarter, the returns of these indices arealso significantly influenced by fluctuations in their currency denominationrelative to the USD. This currency effect can add additional return to foreignissues as it did during calendar year 2017, or it can further exacerbatenegative performance as it did in 2016. Global bonds outperformed domesticissues during the quarter and 1-year period due to their relatively longdurations and a currency effect tailwind caused by a weakening USD. Returnson global bonds represented by the Bloomberg Barclays Global Aggregate exUS Index were 1.6% and 10.5% for the 4th quarter and year-to-date periodrespectively. As the global economy continues to recover, several internationalcentral banks have started to move toward a less accommodative postureduring the quarter. Notably, the ECB, while extending its current quantitativeeasing program well into 2018, announced that it be reducing the amount ofmonthly asset purchases from 60 billion euro per month to 30 billion euro permonth. Similarly, despite a dovish stance on future rate increases, the BoEvoted to raise interest rates for the first time in a decade.
Much of the index performance detailed in the bar graphs on the previouspage is visible on a time series basis by reviewing the line graphs to the right.The ‘1-Year Trailing Market Rates’ chart illustrates that the 10-year Treasuryyield (green line) ended 2017 close to where it began the year, modestly risingduring the 4th quarter. During the year, rates peaked during the 1st quarter of2017 before hitting a low during the 3rd quarter. They then gradually rose toend the year slightly lower than where they started, falling to 2.40% from2.45%. The blue line illustrates changes in the BAA OAS (Option AdjustedSpread). This measure quantifies the additional yield premium that investorsrequire to purchase and hold non-Treasury issues. This line illustrates a steadydecline in credit spreads throughout 2017. This decline is equivalent to aninterest rate decrease on corporate bonds, which produces a tailwind forcorporate bond index returns. These credit spreads have tightened by about38 bps over the last 12-months. The green shading at the bottom of the graphillustrates the gradual increase in the Federal Funds Rate due to a lessaccommodative US monetary policy.
The lower graph provides a snapshot of the U.S. Treasury yield curve at theend of each of the last four calendar quarters. As mentioned, the yield curvecontinues to flatten as yields on shorter-term maturities have risen, whileinterest rates on the long end of the curve have generally declined. Thesignificant upward shift in short-term interest rates and decline of long-terminterest rates throughout the year is clearly visible.
0.00
0.50
1.00
1.50
2.00
2.50
3.00
3.50
1 mo 3 mo 6 mo 1 yr 2 yr 3 yr 5 yr 7 yr 10 yr 20 yr 30 yr
Treasury Yield Curve
3/31/2017 6/30/2017 9/30/2017 12/31/2017
0.00
0.50
1.00
1.50
2.00
2.50
3.00
3.50
Dec-16 Jan-17 Feb-17 Mar-17 Apr-17 May-17 Jun-17 Jul-17 Aug-17 Sep-17 Oct-17 Nov-17 Dec-17
1-Year Trailing Market Rates
Fed Funds Rate TED Spread 3-Month LiborBAA OAS 10yr Treasury 10yr TIPS
12

Total Portfolio Compliance SummaryDecember 31, 2017 Current Target Range Act 314 Compliance Compliance
Market Value $ Allocation % Allocation % Allocation % Limit % within Ranges w/314 Limits
Total Portfolio (excluding Unfunded Commitments) 116,796,993.00 100.0% 100.0%
Total Equity (14) 78,930,961.00 67.6% 63.5% 53.0% - 70.0% 70.0% YES YES
Domestic Equity (14) 59,538,424.00 51.0% 48.0% 43.0% - 53.0% 70.0% YES YES
International Equity (14) 19,392,537.00 16.6% 15.5% 10.0% - 20.0% 70.0% YES YES
Total US Fixed Income (17 & 17.1.a.iii) 18,604,587.00 15.9% 22.0% 15.0% - 30.0% 100.0% YES YES
US Investment Grade Fixed Income (17) 12,159,923.00 10.4% 15.0% 10.0% - 25.0% 100.0% YES YES
US Non-Investment Grade Fixed Income (17.1.a.iii) 6,444,664.00 5.5% 5.0% 0.0% - 10.0% 100.0% YES YES
Total Non US Fixed Income (20k) 3,223,487.00 2.8% 2.0% 0.0% - 10.0% 20.0% YES YES
Total Real Estate (18 & 19) 7,527,385.00 6.4% 6.0% 0.0% - 10.0% 20.0% YES YES
Alternative Investments (20d) 8,126,514.00 7.0% 8.5% 0.0% - 10.0% 20.0% YES YES
Short Term/Cash Reserves 384,059.00 0.3% 0.0% 0.0% - 5.0% N/A YES YES
Southfield Fire and Police Retirement SystemTotal Fund Asset Allocation Compliance Summary
December 31, 2017
13

Asset Allocation By Segment as ofSeptember 30, 2017 : $114,269,219
Asset Allocation By Segment as ofDecember 31, 2017 : $116,796,994
Allocation
Segments Market Value Allocation
Domestic Equity 55,729,546 48.8¢
International Equity 20,651,065 18.1¢
Domestic Fixed Income 15,834,965 13.9¢
Global Fixed Income 2,529,703 2.2¢
Real Estate 7,409,413 6.5¢
Hedge Fund 5,026,570 4.4¢
Other Illiquid Asset 3,027,877 2.6¢
Cash Equivalent 4,060,082 3.6¢
Allocation
Segments Market Value Allocation
Domestic Equity 57,857,925 49.5¢
International Equity 18,807,395 16.1¢
Domestic Fixed Income 18,358,779 15.7¢
Global Fixed Income 3,223,487 2.8¢
Real Estate 7,464,479 6.4¢
Hedge Fund 5,098,637 4.4¢
Other Illiquid Asset 3,027,877 2.6¢
Cash Equivalent 2,958,414 2.5¢
Asset Allocation Summary
Total FundAs of December 31, 2017
NONE
14

Financial Reconciliation
Market Value10/01/2017
NetTransfers
Contributions DistributionsManagement
FeesOther
ExpensesReturn OnInvestment
Market Value12/31/2017
Total Domestic Equity 57,637,551 -1,000,000 - -42 -73,868 -3,461 2,978,244 59,538,424
Comerica S&P 500 Index Fund 23,547,743 -1,000,000 - - -3,213 - 1,565,604 24,110,134
Champlain MC Equity 6,918,008 - - -42 -13,901 -915 438,301 7,341,451
QMA US MC Equity 7,060,385 - - - -7,499 - 436,032 7,488,917
SouthernSun SC 13,581,648 - - - -32,931 -1,697 207,002 13,754,023
Walthausen & Co. SMID Value 6,529,767 - - - -16,324 -849 331,305 6,843,899
Total International Equity 21,068,375 -2,478,406 - - -39,543 -1,274 843,385 19,392,537
LSV International LCV 11,368,678 -1,478,406 - - -21,594 - 344,165 10,212,843
WCM Focused Growth International 9,699,698 -1,000,000 - - -17,948 -1,274 499,220 9,179,695
Total Fixed Income 18,510,995 3,124,436 - - -37,539 -23,827 254,010 21,828,075
Pacific Fixed Income 9,594,976 2,505,000 - - -7,195 -1,394 68,537 12,159,923
Bloomfield Capital Income Fund II 2,266,427 -49,907 - - -11,000 -7,516 100,324 2,298,328
Bloomfield Capital Income Fund III 4,119,890 -80,658 - - -19,344 -14,918 141,365 4,146,336
Templeton Global Bond R6 (FBNRX) 2,529,703 750,000 - - - - -56,216 3,223,487
Total Real Estate 7,467,150 -58,540 - - -17,746 - 136,521 7,527,385
AEW Core Property Trust 6,316,715 - - - -17,746 - 136,521 6,435,490
Metropolitan Real Estate V 1,150,435 -58,540 - - - - - 1,091,895
Total Timber Funds 3,027,877 - - - - - - 3,027,877
RMK Timberland US Fund 1,876,303 - - - - - - 1,876,303
RMK Timberland Intl Fund 1,151,574 - - - - - - 1,151,574
Total Hedge Fund of Funds 5,026,570 - - - - - 72,067 5,098,637
Magnitude Institutional 2,620,734 - - - - - 47,310 2,668,045
Titan Masters Int'l Fund 2,405,836 - - - - - 24,757 2,430,592
Cash Account 1,530,700 412,510 1,161,583 -2,684,947 - -51,566 15,778 384,059
Total Fund 114,269,219 - 1,161,583 -2,684,989 -168,695 -80,128 4,300,005 116,796,994
Financial Reconciliation
Total Fund
1 Quarter Ending December 31, 2017
15

Comparative Performance
QTR FYTD 1 YR 3 YR 5 YR 7 YR 10 YR InceptionInception
Date
Total Fund 3.77 (43) 7.94 (25) 17.87 (9) 7.95 (25) 10.42 (10) 9.94 (3) 7.75 (1) 7.96 (6) 06/01/1997
Total Fund Policy 3.67 (52) 7.27 (50) 14.47 (69) 8.05 (22) 10.08 (16) 9.20 (13) 6.82 (15) 8.19 (3)
Difference 0.10 0.67 3.40 -0.10 0.34 0.74 0.93 -0.23
All Public Plans-Total Fund Median 3.69 7.27 15.40 7.40 9.13 8.18 6.15 7.11
Total Domestic Equity 5.17 (56) 10.03 (51) 21.25 (36) 9.35 (53) 13.80 (56) 12.65 (39) 8.61 (39) 9.11 (73) 02/01/1992
Total Domestic Equity Policy 5.59 (48) 10.26 (48) 18.04 (51) 10.99 (29) 15.15 (33) 12.94 (33) 9.11 (30) 10.52 (35)
Difference -0.42 -0.23 3.21 -1.64 -1.35 -0.29 -0.50 -1.41
IM U.S. Equity (SA+CF+MF) Median 5.47 10.08 18.10 9.54 14.12 12.02 8.11 9.96
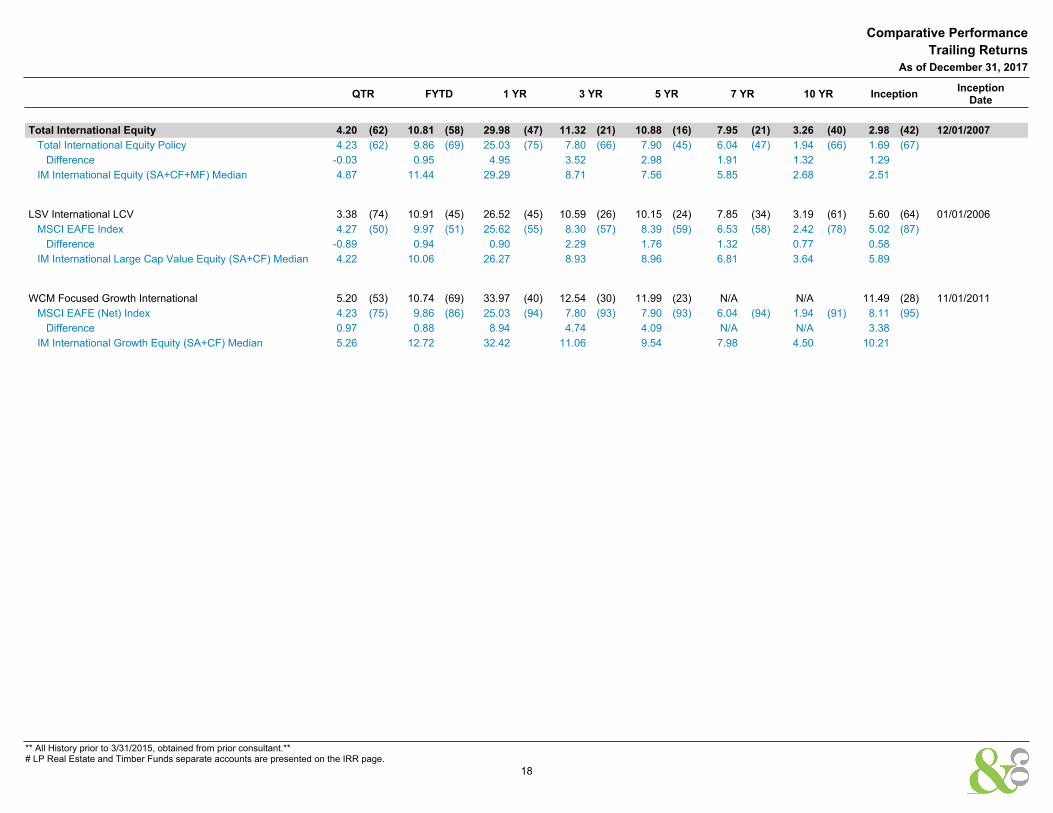
Total International Equity 4.20 (62) 10.81 (58) 29.98 (47) 11.32 (21) 10.88 (16) 7.95 (21) 3.26 (40) 2.98 (42) 12/01/2007
Total International Equity Policy 4.23 (62) 9.86 (69) 25.03 (75) 7.80 (66) 7.90 (45) 6.04 (47) 1.94 (66) 1.69 (67)
Difference -0.03 0.95 4.95 3.52 2.98 1.91 1.32 1.29
IM International Equity (SA+CF+MF) Median 4.87 11.44 29.29 8.71 7.56 5.85 2.68 2.51
Total Fixed Income 1.24 (1) 3.64 (1) 7.78 (1) 5.42 (1) 4.11 (1) 4.67 (4) N/A 5.69 (26) 03/01/2009
Total Fixed Income Policy 0.39 (80) 1.24 (81) 3.54 (83) 2.24 (88) 2.10 (84) 3.20 (88) 4.01 (91) 4.09 (89)
Difference 0.85 2.40 4.24 3.18 2.01 1.47 N/A 1.60
IM U.S. Broad Market Core Fixed Income (SA+CF) Median 0.52 1.45 4.05 2.61 2.49 3.68 4.63 5.04
Total Real Estate 1.84 (77) 3.65 (82) 8.13 (57) 9.81 (83) 10.72 (87) N/A N/A 5.12 (100) 01/01/2012
Total Real Estate Policy 1.80 (80) 3.52 (86) 6.96 (82) 9.38 (88) 10.19 (92) 10.81 (93) 6.08 (21) 10.25 (92)
Difference 0.04 0.13 1.17 0.43 0.53 N/A N/A -5.13
IM U.S. Open End Private Real Estate (SA+CF) Median 2.14 4.27 8.52 10.93 12.20 12.75 5.25 12.27
Total Hedge Fund of Funds 1.43 3.95 5.53 N/A N/A N/A N/A 1.01 08/01/2015
HFRI FOF: Diversified Index 1.86 4.29 6.66 2.27 3.82 2.65 1.12 1.60
Difference -0.43 -0.34 -1.13 N/A N/A N/A N/A -0.59
Total Timber Funds 0.00 -1.84 -1.80 -2.63 -0.82 N/A N/A -0.51 08/01/2012
Total Timber Policy 1.52 2.13 3.63 3.73 6.22 5.76 4.43 6.90
Difference -1.52 -3.97 -5.43 -6.36 -7.04 N/A N/A -7.41
Comparative Performance
Trailing Returns
As of December 31, 2017
** All History prior to 3/31/2015, obtained from prior consultant.**# LP Real Estate and Timber Funds separate accounts are presented on the IRR page.
16

Comparative Performance
Trailing Returns
As of December 31, 2017
QTR FYTD 1 YR 3 YR 5 YR 7 YR 10 YR InceptionInception
Date
Total Domestic Equity 5.17 (56) 10.03 (51) 21.25 (36) 9.35 (53) 13.80 (56) 12.65 (39) 8.61 (39) 9.11 (73) 02/01/1992
Total Domestic Equity Policy 5.59 (48) 10.26 (48) 18.04 (51) 10.99 (29) 15.15 (33) 12.94 (33) 9.11 (30) 10.52 (35)
Difference -0.42 -0.23 3.21 -1.64 -1.35 -0.29 -0.50 -1.41
IM U.S. Equity (SA+CF+MF) Median 5.47 10.08 18.10 9.54 14.12 12.02 8.11 9.96
Comerica S&P 500 Index Fund 6.63 (54) 11.40 (55) 21.80 (51) 11.41 (41) 15.77 (50) 13.77 (49) 8.52 (61) 8.68 (62) 04/01/2006
S&P 500 Index 6.64 (52) 11.42 (54) 21.83 (50) 11.41 (41) 15.79 (50) 13.76 (50) 8.50 (63) 8.65 (65)
Difference -0.01 -0.02 -0.03 0.00 -0.02 0.01 0.02 0.03
IM U.S. Large Cap Core Equity (SA+CF) Median 6.67 11.62 21.82 11.16 15.76 13.74 8.75 8.89
Champlain MC Equity 6.35 (43) N/A N/A N/A N/A N/A N/A 8.35 (68) 08/01/2017
Russell Midcap Index 6.07 (66) 9.75 (51) 18.52 (35) 9.58 (78) 14.96 (82) 12.76 (78) 9.11 (84) 8.16 (77)
Difference 0.28 N/A N/A N/A N/A N/A N/A 0.19
IM U.S. Mid Cap Core Equity (SA+CF) Median 6.27 9.75 16.49 11.12 15.61 13.23 10.03 8.73
QMA US MC Equity 6.18 (65) N/A N/A N/A N/A N/A N/A 9.19 (42) 08/01/2017
Russell Midcap Index 6.07 (66) 9.75 (51) 18.52 (35) 9.58 (78) 14.96 (82) 12.76 (78) 9.11 (84) 8.16 (77)
Difference 0.11 N/A N/A N/A N/A N/A N/A 1.03
IM U.S. Mid Cap Core Equity (SA+CF) Median 6.27 9.75 16.49 11.12 15.61 13.23 10.03 8.73
SouthernSun SC 1.52 (94) 8.30 (70) 19.53 (22) 5.22 (100) 9.18 (100) 10.72 (94) N/A 10.93 (56) 04/01/2008
Russell 2000 Index 3.34 (60) 9.20 (58) 14.65 (57) 9.96 (74) 14.12 (83) 11.62 (85) 8.71 (78) 10.12 (81)
Difference -1.82 -0.90 4.88 -4.74 -4.94 -0.90 N/A 0.81
IM U.S. Small Cap Core Equity (SA+CF) Median 3.84 9.70 15.20 11.21 15.76 13.03 9.75 11.23
Walthausen & Co. SMID Value 5.08 (54) 9.65 (42) 18.43 (21) N/A N/A N/A N/A 16.05 (56) 10/01/2015
Russell 2500 Value Index 4.25 (69) 8.25 (68) 10.36 (86) 9.30 (60) 13.27 (73) 11.54 (70) 8.82 (76) 16.87 (50)
Difference 0.83 1.40 8.07 N/A N/A N/A N/A -0.82
IM U.S. SMID Cap Value Equity (SA+CF) Median 5.37 9.44 14.63 9.84 14.39 12.67 9.96 16.60
** All History prior to 3/31/2015, obtained from prior consultant.**# LP Real Estate and Timber Funds separate accounts are presented on the IRR page.
17
Comparative Performance
Trailing Returns
As of December 31, 2017
QTR FYTD 1 YR 3 YR 5 YR 7 YR 10 YR InceptionInception
Date
Total International Equity 4.20 (62) 10.81 (58) 29.98 (47) 11.32 (21) 10.88 (16) 7.95 (21) 3.26 (40) 2.98 (42) 12/01/2007
Total International Equity Policy 4.23 (62) 9.86 (69) 25.03 (75) 7.80 (66) 7.90 (45) 6.04 (47) 1.94 (66) 1.69 (67)
Difference -0.03 0.95 4.95 3.52 2.98 1.91 1.32 1.29
IM International Equity (SA+CF+MF) Median 4.87 11.44 29.29 8.71 7.56 5.85 2.68 2.51
LSV International LCV 3.38 (74) 10.91 (45) 26.52 (45) 10.59 (26) 10.15 (24) 7.85 (34) 3.19 (61) 5.60 (64) 01/01/2006
MSCI EAFE Index 4.27 (50) 9.97 (51) 25.62 (55) 8.30 (57) 8.39 (59) 6.53 (58) 2.42 (78) 5.02 (87)
Difference -0.89 0.94 0.90 2.29 1.76 1.32 0.77 0.58
IM International Large Cap Value Equity (SA+CF) Median 4.22 10.06 26.27 8.93 8.96 6.81 3.64 5.89
WCM Focused Growth International 5.20 (53) 10.74 (69) 33.97 (40) 12.54 (30) 11.99 (23) N/A N/A 11.49 (28) 11/01/2011
MSCI EAFE (Net) Index 4.23 (75) 9.86 (86) 25.03 (94) 7.80 (93) 7.90 (93) 6.04 (94) 1.94 (91) 8.11 (95)
Difference 0.97 0.88 8.94 4.74 4.09 N/A N/A 3.38
IM International Growth Equity (SA+CF) Median 5.26 12.72 32.42 11.06 9.54 7.98 4.50 10.21
** All History prior to 3/31/2015, obtained from prior consultant.**# LP Real Estate and Timber Funds separate accounts are presented on the IRR page.
18

Comparative Performance
Trailing Returns
As of December 31, 2017
QTR FYTD 1 YR 3 YR 5 YR 7 YR 10 YR InceptionInception
Date
Total Fixed Income 1.24 (1) 3.64 (1) 7.78 (1) 5.42 (1) 4.11 (1) 4.67 (4) N/A 5.69 (26) 03/01/2009
Total Fixed Income Policy 0.39 (80) 1.24 (81) 3.54 (83) 2.24 (88) 2.10 (84) 3.20 (88) 4.01 (91) 4.09 (89)
Difference 0.85 2.40 4.24 3.18 2.01 1.47 N/A 1.60
IM U.S. Broad Market Core Fixed Income (SA+CF) Median 0.52 1.45 4.05 2.61 2.49 3.68 4.63 5.04
Pacific Fixed Income 0.64 (19) 1.65 (26) 4.24 (34) 2.79 (38) 2.48 (52) 3.39 (75) 4.55 (53) 5.50 (65) 06/01/1997
Bloomberg Barclays U.S. Aggregate Index 0.39 (80) 1.24 (81) 3.54 (83) 2.24 (88) 2.10 (84) 3.20 (88) 4.01 (91) 5.22 (94)
Difference 0.25 0.41 0.70 0.55 0.38 0.19 0.54 0.28
IM U.S. Broad Market Core Fixed Income (SA+CF) Median 0.52 1.45 4.05 2.61 2.49 3.68 4.63 5.64
Templeton Global Bond R6 (FBNRX) -1.76 (100) -0.55 (100) N/A N/A N/A N/A N/A -2.09 (100) 04/01/2017
Blmbg. Barc. Global Multiverse 1.06 (18) 2.97 (17) 7.69 (30) 2.31 (45) 1.03 (60) 2.20 (60) 3.29 (58) 5.68 (25)
Difference -2.82 -3.52 N/A N/A N/A N/A N/A -7.77
IM Global Fixed Income (MF) Median 0.69 2.23 6.98 2.14 1.18 2.49 3.60 4.61
Total Real Estate 1.84 (77) 3.65 (82) 8.13 (57) 9.81 (83) 10.72 (87) N/A N/A 5.12 (100) 01/01/2012
Total Real Estate Policy 1.80 (80) 3.52 (86) 6.96 (82) 9.38 (88) 10.19 (92) 10.81 (93) 6.08 (21) 10.25 (92)
Difference 0.04 0.13 1.17 0.43 0.53 N/A N/A -5.13
IM U.S. Open End Private Real Estate (SA+CF) Median 2.14 4.27 8.52 10.93 12.20 12.75 5.25 12.27
AEW Core Property Trust 2.16 (49) 3.99 (67) 7.96 (60) 10.03 (81) 10.73 (87) N/A N/A 10.71 (87) 10/01/2012
NCREIF Fund Index-ODCE (VW) 2.07 (64) 3.97 (67) 7.62 (67) 10.42 (74) 11.53 (74) 12.07 (78) 5.03 (67) 11.44 (76)
Difference 0.09 0.02 0.34 -0.39 -0.80 N/A N/A -0.73
IM U.S. Open End Private Real Estate (SA+CF) Median 2.14 4.27 8.52 10.93 12.20 12.75 5.25 12.17
Total Hedge Fund of Funds 1.43 3.95 5.53 N/A N/A N/A N/A 1.01 08/01/2015
HFRI FOF: Diversified Index 1.86 4.29 6.66 2.27 3.82 2.65 1.12 1.60
Difference -0.43 -0.34 -1.13 N/A N/A N/A N/A -0.59
Magnitude Institutional 1.81 3.97 6.96 N/A N/A N/A N/A 2.73 08/01/2015
HFRI FOF: Diversified Index 1.86 4.29 6.66 2.27 3.82 2.65 1.12 1.60
Difference -0.05 -0.32 0.30 N/A N/A N/A N/A 1.13
Titan Masters Int'l Fund 1.03 3.93 4.01 N/A N/A N/A N/A -1.16 08/01/2015
HFRI FOF: Diversified Index 1.86 4.29 6.66 2.27 3.82 2.65 1.12 1.60
Difference -0.83 -0.36 -2.65 N/A N/A N/A N/A -2.76
** All History prior to 3/31/2015, obtained from prior consultant.**# LP Real Estate and Timber Funds separate accounts are presented on the IRR page.
19

Comparative Performance - IRR
QTR FYTD 1 YR 3 YR 5 YR 7 YR
SinceInceptionEnding
Dec-2017
InceptionDate
Bloomfield Capital Income Fund II 3.61 5.96 10.24 10.62 N/A N/A 10.56 12/22/2014
Bloomfield Capital Income Fund III 2.60 5.95 12.07 N/A N/A N/A 12.33 12/31/2016
Metropolitan Real Estate V 0.00 1.70 8.98 8.96 11.02 N/A 9.44 11/30/2011
RMK Timberland US Fund 0.00 0.14 -1.56 -1.07 1.91 N/A 2.28 10/31/2012
RMK Timberland Intl Fund 0.00 -4.91 -1.53 -4.25 -4.93 N/A -5.02 11/21/2012
Comparative Performance - IRR
As of December 31, 2017
20

Schedule of Investable Assets
Total Fund Total Fund Policy Net Cash Flow
$0.0
$12,000,000.0
$24,000,000.0
$36,000,000.0
$48,000,000.0
$60,000,000.0
$72,000,000.0
$84,000,000.0
$96,000,000.0
$108,000,000.0
$120,000,000.0
$132,000,000.0
$144,000,000.0
($12,000,000.0)
Ma
rke
t
Va
lue
12/07 6/08 12/08 6/09 12/09 6/10 12/10 6/11 12/11 6/12 12/12 6/13 12/13 6/14 12/14 6/15 12/15 6/16 12/16 6/17 12/17
$37,515,147.5
$116,796,994.4
$99,666,712.6
Schedule of Investable Assets
Periods EndingBeginning
Market Value$
Contributions$
Withdrawals$
Gain/Loss$
NetCash Flow
$
EndingMarket Value
$
10 YR 103,654,214 89,955,893 156,094,960 79,281,847 -66,139,066 116,796,994
Schedule of Investable Assets
Total Fund
10 Years Ending December 31, 2017
21

Plan Sponsor Peer Group Analysis - All Public Plans-Total Fund
Comparative Performance
-1.00
2.00
5.00
8.00
11.00
14.00
17.00
20.00
23.00
Re
turn
QTR FYTD 1 YR 2 YR 3 YR 4 YR 5 YR
Total Fund 3.77 (43) 7.94 (25) 17.87 (9) 13.05 (6) 7.95 (25) 7.18 (53) 10.42 (10)��
Total Fund Policy 3.67 (52) 7.27 (50) 14.47 (69) 12.21 (21) 8.05 (22) 7.70 (27) 10.08 (16)��
Median 3.69 7.27 15.40 11.23 7.40 7.23 9.13
-8.00
-4.00
0.00
4.00
8.00
12.00
16.00
20.00
24.00
28.00
32.00
Re
turn
2016 2015 2014 2013 2012
Total Fund 8.43 (23) -1.58 (87) 4.92 (86) 24.38 (1) 14.51 (11)��
Total Fund Policy 9.99 (4) 0.18 (48) 6.66 (53) 20.12 (13) 12.91 (42)��
Median 7.29 0.07 6.78 16.92 12.54
1 QtrEnding
Sep-2017
1 QtrEnding
Jun-2017
1 QtrEnding
Mar-2017
1 QtrEnding
Dec-2016
1 QtrEnding
Sep-2016
1 QtrEnding
Jun-2016
Total Fund 4.02 (13) 3.36 (22) 5.64 (4) 1.93 (9) 3.90 (23) 0.97 (95)
Total Fund Policy 3.47 (48) 2.78 (66) 3.83 (82) 2.30 (7) 3.91 (22) 2.21 (29)
All Public Plans-Total Fund Median 3.46 2.99 4.43 0.80 3.39 1.91
As of December 31, 2017
Performance Review
Total Fund
NONE
22

Peer Group Scattergram - 3 Years
3 Yr Rolling Under/Over Performance - 5 Years
Peer Group Scattergram - 5 Years
3 Yr Rolling Percentile Ranking - 5 Years
Historical Statistics - 3 Years
Historical Statistics - 5 Years
Over Performance Under Performance
Earliest Date Latest Date
0.0
5.0
10.0
15.0
20.0
To
tal
F
un
d (%
)
0.0 5.0 10.0 15.0 20.0
Total Fund Policy (%)
Over
Performance
Under
Performance
0.0
25.0
50.0
75.0
100.0
Re
turn
Pe
rce
nti
le R
an
k
3/13 9/13 3/14 9/14 3/15 9/15 3/16 9/16 3/17 12/17
Total Period5-25
Count25-Median
CountMedian-75
Count75-95Count
Total Fund 20 13 (65%) 2 (10%) 3 (15%) 2 (10%)��
Total Fund Policy 20 17 (85%) 3 (15%) 0 (0%) 0 (0%)��
7.20
7.50
7.80
8.10
8.40
Re
turn
(%)
4.48 4.76 5.04 5.32 5.60 5.88 6.16 6.44 6.72
Risk (Standard Deviation %)
ReturnStandardDeviation
Total Fund 7.95 6.37��
Total Fund Policy 8.05 4.99��
Median 7.40 4.98¾
8.60
9.03
9.46
9.89
10.32
10.75
Re
turn
(%)
5.2 5.6 6.0 6.4 6.8 7.2
Risk (Standard Deviation %)
ReturnStandardDeviation
Total Fund 10.42 6.59��
Total Fund Policy 10.08 5.40��
Median 9.13 5.08¾
TrackingError
UpMarketCapture
DownMarketCapture
AlphaInformation
RatioSharpeRatio
BetaDownside
Risk
Total Fund 1.87 105.12 127.53 -1.95 -0.01 1.20 1.25 4.31
Total Fund Policy 0.00 100.00 100.00 0.00 N/A 1.54 1.00 3.09 90 Day U.S. Treasury Bill 4.91 3.77 -0.45 0.25 -1.54 N/A 0.02 0.00
TrackingError
UpMarketCapture
DownMarketCapture
AlphaInformation
RatioSharpeRatio
BetaDownside
Risk
Total Fund 1.94 105.83 117.67 -1.38 0.20 1.52 1.18 3.45
Total Fund Policy 0.00 100.00 100.00 0.00 N/A 1.79 1.00 2.58 90 Day U.S. Treasury Bill 5.38 2.08 -0.48 0.20 -1.79 N/A 0.00 0.00
As of December 31, 2017
Performance Review
Total Fund
NONE
23
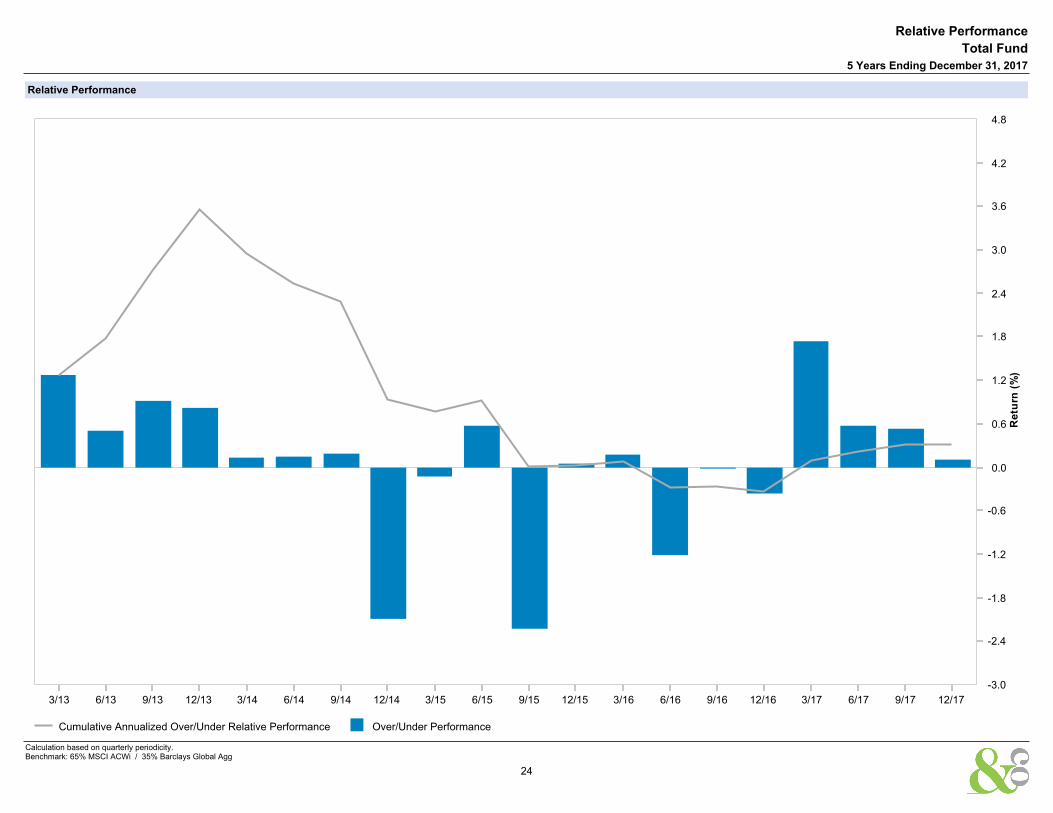
Relative Performance
Cumulative Annualized Over/Under Relative Performance Over/Under Performance
0.0
0.6
1.2
1.8
2.4
3.0
3.6
4.2
4.8
-0.6
-1.2
-1.8
-2.4
-3.0
Re
turn
(%)
3/13 6/13 9/13 12/13 3/14 6/14 9/14 12/14 3/15 6/15 9/15 12/15 3/16 6/16 9/16 12/16 3/17 6/17 9/17 12/17
Relative Performance
Total Fund
5 Years Ending December 31, 2017
Calculation based on quarterly periodicity.Benchmark: 65% MSCI ACWi / 35% Barclays Global Agg
24

Comerica S&P 500 - Portfolio Description Comerica S&P 500 - Strategy Details
QMA Midcap Equity - Portfolio Description
Champlain MidCap Equity - Portfolio Description
QMA Midcap Equity - Strategy Details
Champlian MidCap Equity - Strategy Details
· Strategy: S&P 500 Index Fund
· Vehicle: Commingled Fund
· Objective: To replicate the S&P 500
· Annual fees: .10% on first $5M.08% on next $20M.06% on next $25M
· Benchmark: S&P 500 Index
The 500 IndexStrategy seeks to provide investment results generally corresponding to the aggregateprice and dividend performance of the publicly traded common stocks in the large- capitalization sector ofthe U.S. equity market. The fund pursues this objective by investing primarily in the 500 common stocks
that compose the S&P 500 Index.
· Strategy: Mid Cap Equity
· Vehicle: Separately Managed Account
· Objective: To outperform the Russell Midcap Index
· Annual fees: .85% on first $50MM.75% on next $50MM.65% over $100M
· Benchmark: Russell Midcap Index
Champlain’s mid cap strategy invests in a broadly diversified portfolio of approximately 50 to 75 commonstocks of medium sized companies, and to a lesser extent small and large sized companies, which haveattractive long-term fundamentals, appreciation potential, and valuations. They believe that investing incompanies with sustainable competitive advantages, durable business models, sound balance sheets,credible and sincere management, and that are trading at valuations deemed reasonable by the team,can, over time, provide attractive returns with less risk than the overall market. Their investmentprocesses are focused on absolute returns and avoiding large losses, which they believe is critical to
wealth creation.
· Strategy: US Mid Cap Fore Equity
· Vehicle: Commingled Account
· Objective: To outperform the Russell Midcap Index
· Annual fees: .45% on first $50MM.40% over $50M
· Benchmark: Russell Midcap Index
At QMA, they believe that an adaptive, bottom-up, systematic investment process based on fundamentalinsights is the most efficient way to exploit market inefficiencies and add value. On a daily basis theyassess the relative attractiveness of their universe, scoring stocks according to fundamentals mostrelevant to their growth characteristics-more emphasis on valuation for slowly growing companies andindicators of future growth prospects for faster growing companies. These scores form the basis of theconstruction process whereby they focus risk on a breadth of exposures most likely to produce alpha andlimit exposures to uncompensated off-benchmark risk. Rebalancing is done with experienced judgment to
maintain desired portfolio alpha exposures and risk limits and with careful attention to trading costs.
Portfolio Summary
Domestic Equity Managers
As of December 31, 2017
25

SouthernSun Smallcap Equity - Portfolio Description SouthernSun Smallcap Equity - Strategy Details
Walthausen SMID Value Equity - Portfolio Description Walthausen SMID Value Equity - Strategy Details
· Strategy: Small Cap
· Vehicle: Separately Managed Account
· Objective: To outperform the Russell 2000 Index
· Annual fees: 1.00% on first $15M
· 0.85% over $15M
· Benchmark: Russell 2000 Index
The Small Cap strategy targets companies with market caps of $500 million to $3.5 billion at time of initialpurchase. While idea generation may come from traditional screening, new names are often sourcedthrough research on existing portfolio holdings, industry trade publications, and industry conferences. TheInvestment Team relies almost solely on internally conducted research for idea generation. This strategy
is generally closed to new investors.
· Strategy: Select Value (SMID)
· Vehicle: Separately Managed Account
· Objective: To outperform the Russell 2500 Index
· Annual fees: 1.00% of Assets
· Benchmark: Russell 2500 Index
This portfolio is constructed to provide strong returns with moderate volatility. It incorporates 40-50equally weighted holdings, broadly diversified across industry sectors. Positions are reduced when theybegin to exceed 3.0% of the portfolio. Companies included in the portfolio have a market capitalizationbetween $700 million and $7.0 billion. The majority (about 80%) of the portfolio is with companies whichhave consistently high returns on capital, ample free cash flow, well proven management and sell atmoderate valuations. Many of these stocks are frequently too dull to attract much “Wall Street” attentionand thus have carried low valuations and lower volatility. The remaining 20% of the fund is invested in“Special Situations.” For these stocks a focused approach is utilized to find 8-10 names with unusualpotential returns.The goal is for both parts of the strategy to outperform over the market cycle, and todeliver annualized returns 200 basis points above the Russell 2500 Value index.
Portfolio Summary
Domestic Equity Managers
As of December 31, 2017
26

Peer Group Analysis - IM U.S. Large Cap Core Equity (SA+CF)
Comparative Performance
-4.00
0.00
4.00
8.00
12.00
16.00
20.00
24.00
28.00
32.00
36.00
Re
turn
QTR FYTD 1 YR 2 YR 3 YR 4 YR 5 YR
Comerica S&P 500 6.63 (54) 11.40 (55) 21.80 (51) 16.76 (37) 11.41 (41) 11.97 (43) 15.77 (50)��
S&P 500 Index 6.64 (52) 11.42 (54) 21.83 (50) 16.79 (36) 11.41 (41) 11.98 (43) 15.79 (50)��
Median 6.67 11.62 21.82 16.11 11.16 11.71 15.76
-20.00
-12.00
-4.00
4.00
12.00
20.00
28.00
36.00
44.00
52.00
Re
turn
2016 2015 2014 2013 2012
Comerica S&P 500 11.94 (33) 1.44 (49) 13.66 (45) 32.30 (61) 16.10 (44)��
S&P 500 Index 11.96 (33) 1.38 (51) 13.69 (44) 32.39 (60) 16.00 (46)��
Median 10.49 1.39 13.43 32.98 15.70
1 QtrEnding
Sep-2017
1 QtrEnding
Jun-2017
1 QtrEnding
Mar-2017
1 QtrEnding
Dec-2016
1 QtrEnding
Sep-2016
1 QtrEnding
Jun-2016
Comerica S&P 500 4.48 (58) 3.08 (44) 6.06 (45) 3.80 (54) 3.85 (55) 2.45 (39)
S&P 500 Index 4.48 (58) 3.09 (43) 6.07 (45) 3.82 (53) 3.85 (54) 2.46 (39)
IM U.S. Large Cap Core Equity (SA+CF) Median 4.60 2.95 5.95 3.93 3.99 2.08
Performance Review
As of December 31, 2017
Comerica S&P 500
NONE
27

Peer Group Scattergram - 3 Years
3 Yr Rolling Under/Over Performance - 5 Years
Peer Group Scattergram - 5 Years
3 Yr Rolling Percentile Ranking - 5 Years
Historical Statistics - 3 Years
Historical Statistics - 5 Years
Over Performance Under Performance
Earliest Date Latest Date
5.0
10.0
15.0
20.0
25.0
30.0
Co
me
ric
a S
&P
50
0 (%
)
5.0 10.0 15.0 20.0 25.0 30.0
S&P 500 Index (%)
Over
Performance
Under
Performance
0.0
25.0
50.0
75.0
100.0
Re
turn
Pe
rce
nti
le R
an
k
3/13 9/13 3/14 9/14 3/15 9/15 3/16 9/16 3/17 12/17
Total Period5-25
Count25-Median
CountMedian-75
Count75-95Count
Comerica S&P 500 20 0 (0%) 11 (55%) 9 (45%) 0 (0%)��
S&P 500 Index 20 0 (0%) 11 (55%) 9 (45%) 0 (0%)��
11.16
11.25
11.34
11.43
11.52
Re
turn
(%)
6.88 6.96 7.04 7.12 7.20 7.28 7.36 7.44
Risk (Standard Deviation %)
ReturnStandardDeviation
Comerica S&P 500 11.41 6.95��
S&P 500 Index 11.41 6.97��
Median 11.16 7.35¾
15.74
15.76
15.78
15.80
Re
turn
(%)
7.20 7.30 7.40 7.50 7.60 7.70 7.80 7.90
Risk (Standard Deviation %)
ReturnStandardDeviation
Comerica S&P 500 15.77 7.28��
S&P 500 Index 15.79 7.30��
Median 15.76 7.78¾
TrackingError
UpMarketCapture
DownMarketCapture
AlphaInformation
RatioSharpeRatio
BetaDownside
Risk
Comerica S&P 500 0.03 99.97 99.92 0.00 0.01 1.11 1.00 5.42
S&P 500 Index 0.00 100.00 100.00 0.00 N/A 1.11 1.00 5.42 90 Day U.S. Treasury Bill 9.90 1.82 -0.39 0.36 -1.11 N/A 0.00 0.02
TrackingError
UpMarketCapture
DownMarketCapture
AlphaInformation
RatioSharpeRatio
BetaDownside
Risk
Comerica S&P 500 0.04 99.92 100.03 -0.01 -0.47 1.59 1.00 4.78
S&P 500 Index 0.00 100.00 100.00 0.00 N/A 1.59 1.00 4.78 90 Day U.S. Treasury Bill 9.41 1.00 -0.35 0.24 -1.59 N/A 0.00 0.01
Performance Review
As of December 31, 2017
Comerica S&P 500
NONE
28

Peer Group Analysis - IM U.S. Mid Cap Core Equity (SA+CF)
Comparative Performance
-4.00
0.00
4.00
8.00
12.00
16.00
20.00
24.00
28.00
32.00
Re
turn
QTR FYTD 1 YR 2 YR 3 YR 4 YR 5 YR
Champlain MC Equity 6.35 (43) N/A N/A N/A N/A N/A N/A��
Russell Midcap Index 6.07 (66) 9.75 (51) 18.52 (35) 16.13 (69) 9.58 (78) 10.48 (71) 14.96 (82)��
Median 6.27 9.75 16.49 18.10 11.12 10.87 15.61
-20.00
-12.00
-4.00
4.00
12.00
20.00
28.00
36.00
44.00
52.00
60.00
Re
turn
2016 2015 2014 2013 2012
Champlain MC Equity N/A N/A N/A N/A N/A��
Russell Midcap Index 13.80 (62) -2.44 (82) 13.22 (27) 34.76 (68) 17.28 (50)��
Median 16.80 -0.98 10.17 37.10 17.27
1 QtrEnding
Sep-2017
1 QtrEnding
Jun-2017
1 QtrEnding
Mar-2017
1 QtrEnding
Dec-2016
1 QtrEnding
Sep-2016
1 QtrEnding
Jun-2016
Champlain MC Equity N/A N/A N/A N/A N/A N/A
Russell Midcap Index 3.47 (50) 2.70 (34) 5.15 (36) 3.21 (75) 4.52 (51) 3.18 (42)
IM U.S. Mid Cap Core Equity (SA+CF) Median 3.47 1.98 4.70 6.82 4.52 2.67
Performance Review
As of December 31, 2017
Champlain MC Equity
NONE
29

Peer Group Analysis - IM U.S. Mid Cap Core Equity (SA+CF)
Comparative Performance
-4.00
0.00
4.00
8.00
12.00
16.00
20.00
24.00
28.00
32.00
Re
turn
QTR FYTD 1 YR 2 YR 3 YR 4 YR 5 YR
QMA US MC Equity 6.18 (65) N/A N/A N/A N/A N/A N/A��
Russell Midcap Index 6.07 (66) 9.75 (51) 18.52 (35) 16.13 (69) 9.58 (78) 10.48 (71) 14.96 (82)��
Median 6.27 9.75 16.49 18.10 11.12 10.87 15.61
-20.00
-12.00
-4.00
4.00
12.00
20.00
28.00
36.00
44.00
52.00
60.00
Re
turn
2016 2015 2014 2013 2012
QMA US MC Equity N/A N/A N/A N/A N/A��
Russell Midcap Index 13.80 (62) -2.44 (82) 13.22 (27) 34.76 (68) 17.28 (50)��
Median 16.80 -0.98 10.17 37.10 17.27
1 QtrEnding
Sep-2017
1 QtrEnding
Jun-2017
1 QtrEnding
Mar-2017
1 QtrEnding
Dec-2016
1 QtrEnding
Sep-2016
1 QtrEnding
Jun-2016
QMA US MC Equity N/A N/A N/A N/A N/A N/A
Russell Midcap Index 3.47 (50) 2.70 (34) 5.15 (36) 3.21 (75) 4.52 (51) 3.18 (42)
IM U.S. Mid Cap Core Equity (SA+CF) Median 3.47 1.98 4.70 6.82 4.52 2.67
Performance Review
As of December 31, 2017
QMA US MC Equity
NONE
30

Peer Group Analysis - IM U.S. Small Cap Core Equity (SA+CF)
Comparative Performance
-4.00
0.00
4.00
8.00
12.00
16.00
20.00
24.00
28.00
32.00
Re
turn
QTR FYTD 1 YR 2 YR 3 YR 4 YR 5 YR
SouthernSun SC 1.52 (94) 8.30 (70) 19.53 (22) 18.58 (42) 5.22 (100) 2.21 (100) 9.18 (100)��
Russell 2000 Index 3.34 (60) 9.20 (58) 14.65 (57) 17.93 (54) 9.96 (74) 8.67 (76) 14.12 (83)��
Median 3.84 9.70 15.20 18.01 11.21 10.03 15.76
-40.00
-25.00
-10.00
5.00
20.00
35.00
50.00
65.00
Re
turn
2016 2015 2014 2013 2012
SouthernSun SC 17.63 (82) -17.16 (100) -6.30 (99) 42.13 (44) 21.87 (11)��
Russell 2000 Index 21.31 (46) -4.41 (82) 4.89 (64) 38.82 (73) 16.35 (55)��
Median 20.61 -1.35 6.56 41.26 16.84
1 QtrEnding
Sep-2017
1 QtrEnding
Jun-2017
1 QtrEnding
Mar-2017
1 QtrEnding
Dec-2016
1 QtrEnding
Sep-2016
1 QtrEnding
Jun-2016
SouthernSun SC 6.67 (26) 1.93 (57) 8.29 (1) 6.65 (86) 5.67 (83) -0.80 (98)
Russell 2000 Index 5.67 (46) 2.46 (48) 2.47 (57) 8.83 (63) 9.05 (27) 3.79 (40)
IM U.S. Small Cap Core Equity (SA+CF) Median 5.54 2.29 2.85 9.72 7.54 3.12
Performance Review
As of December 31, 2017
SouthernSun SC
NONE
31

Peer Group Scattergram - 3 Years
3 Yr Rolling Under/Over Performance - 5 Years
Peer Group Scattergram - 5 Years
3 Yr Rolling Percentile Ranking - 5 Years
Historical Statistics - 3 Years
Historical Statistics - 5 Years
Over Performance Under Performance
Earliest Date Latest Date
-15.0
0.0
15.0
30.0
45.0
So
uth
ern
Su
n S
C (%
)
-15.0 0.0 15.0 30.0 45.0
Russell 2000 Index (%)
Over
Performance
Under
Performance
0.0
25.0
50.0
75.0
100.0
Re
turn
Pe
rce
nti
le R
an
k
3/13 9/13 3/14 9/14 3/15 9/15 3/16 9/16 3/17 12/17
Total Period5-25
Count25-Median
CountMedian-75
Count75-95Count
SouthernSun SC 20 7 (35%) 0 (0%) 0 (0%) 13 (65%)��
Russell 2000 Index 20 0 (0%) 0 (0%) 11 (55%) 9 (45%)��
3.00
6.00
9.00
12.00
15.00
Re
turn
(%)
8.37 9.30 10.23 11.16 12.09 13.02 13.95 14.88
Risk (Standard Deviation %)
ReturnStandardDeviation
SouthernSun SC 5.22 14.16��
Russell 2000 Index 9.96 10.46��
Median 11.21 9.70¾
6.00
9.00
12.00
15.00
18.00
Re
turn
(%)
9.88 10.64 11.40 12.16 12.92 13.68 14.44 15.20
Risk (Standard Deviation %)
ReturnStandardDeviation
SouthernSun SC 9.18 14.45��
Russell 2000 Index 14.12 11.45��
Median 15.76 11.14¾
TrackingError
UpMarketCapture
DownMarketCapture
AlphaInformation
RatioSharpeRatio
BetaDownside
Risk
SouthernSun SC 7.44 95.84 123.11 -4.26 -0.55 0.37 1.02 10.12
Russell 2000 Index 0.00 100.00 100.00 0.00 N/A 0.73 1.00 8.42 90 Day U.S. Treasury Bill 13.90 1.05 -0.95 0.37 -0.73 N/A 0.00 0.02
TrackingError
UpMarketCapture
DownMarketCapture
AlphaInformation
RatioSharpeRatio
BetaDownside
Risk
SouthernSun SC 8.09 87.23 106.58 -3.14 -0.53 0.64 0.92 9.04
Russell 2000 Index 0.00 100.00 100.00 0.00 N/A 1.01 1.00 8.00 90 Day U.S. Treasury Bill 13.79 0.59 -0.68 0.24 -1.01 N/A 0.00 0.01
Performance Review
As of December 31, 2017
SouthernSun SC
NONE
32

Peer Group Analysis - IM U.S. SMID Cap Value Equity (SA+CF)
Comparative Performance
-4.00
0.00
4.00
8.00
12.00
16.00
20.00
24.00
28.00
32.00
Re
turn
QTR FYTD 1 YR 2 YR 3 YR 4 YR 5 YR
Walthausen & Co. SMID Value 5.08 (54) 9.65 (42) 18.43 (21) 17.52 (43) N/A N/A N/A��
Russell 2500 Value Index 4.25 (69) 8.25 (68) 10.36 (86) 17.55 (43) 9.30 (60) 8.75 (62) 13.27 (73)��
Median 5.37 9.44 14.63 17.19 9.84 9.32 14.39
-30.00
-20.00
-10.00
0.00
10.00
20.00
30.00
40.00
50.00
60.00
Re
turn
2016 2015 2014 2013 2012
Walthausen & Co. SMID Value 16.63 (67) N/A N/A N/A N/A��
Russell 2500 Value Index 25.20 (24) -5.49 (70) 7.11 (50) 33.32 (74) 19.21 (36)��
Median 19.46 -2.97 7.09 35.75 16.96
1 QtrEnding
Sep-2017
1 QtrEnding
Jun-2017
1 QtrEnding
Mar-2017
1 QtrEnding
Dec-2016
1 QtrEnding
Sep-2016
1 QtrEnding
Jun-2016
Walthausen & Co. SMID Value 4.35 (41) 3.74 (9) 4.11 (37) 8.56 (44) 3.06 (91) 1.97 (57)
Russell 2500 Value Index 3.83 (59) 0.32 (70) 1.62 (79) 9.34 (37) 6.18 (50) 4.37 (12)
IM U.S. SMID Cap Value Equity (SA+CF) Median 4.01 1.61 3.78 8.20 6.13 2.37
Performance Review
As of December 31, 2017
Walthausen & Co. SMID Value
NONE
33
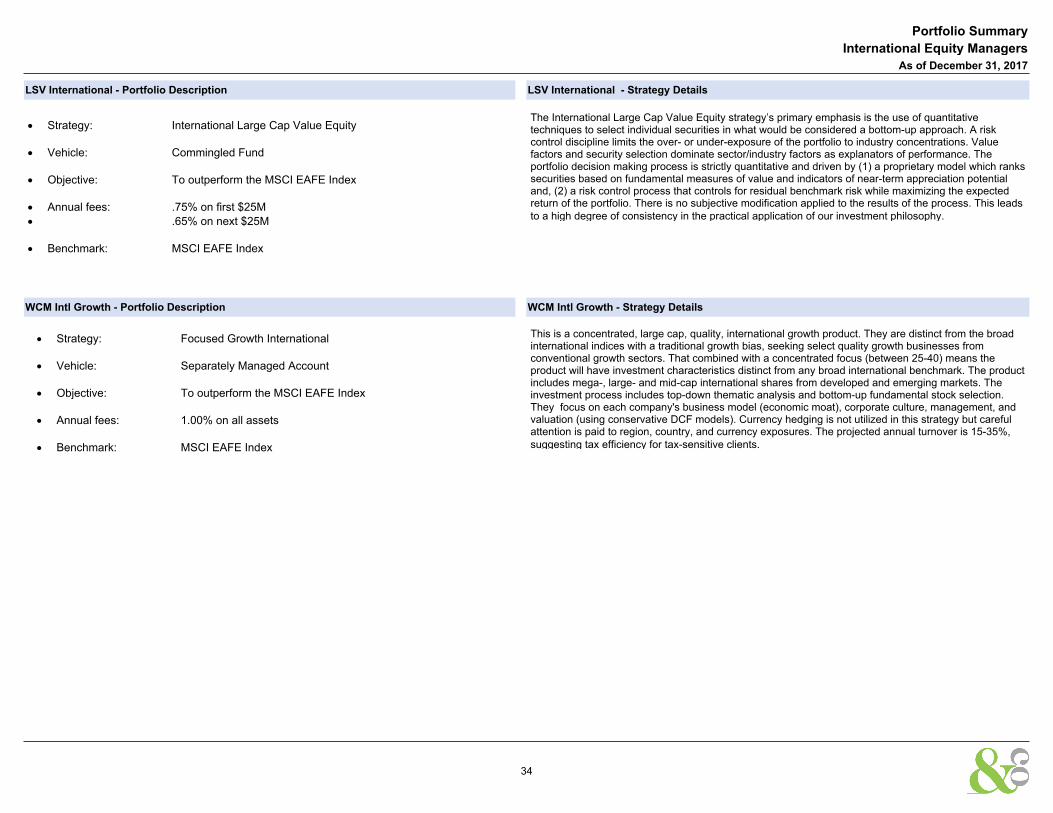
LSV International - Portfolio Description LSV International - Strategy Details
WCM Intl Growth - Portfolio Description WCM Intl Growth - Strategy Details
· Strategy: International Large Cap Value Equity
· Vehicle: Commingled Fund
· Objective: To outperform the MSCI EAFE Index
· Annual fees: .75% on first $25M
· .65% on next $25M
· Benchmark: MSCI EAFE Index
The International Large Cap Value Equity strategy’s primary emphasis is the use of quantitativetechniques to select individual securities in what would be considered a bottom-up approach. A riskcontrol discipline limits the over- or under-exposure of the portfolio to industry concentrations. Valuefactors and security selection dominate sector/industry factors as explanators of performance. Theportfolio decision making process is strictly quantitative and driven by (1) a proprietary model which rankssecurities based on fundamental measures of value and indicators of near-term appreciation potentialand, (2) a risk control process that controls for residual benchmark risk while maximizing the expectedreturn of the portfolio. There is no subjective modification applied to the results of the process. This leadsto a high degree of consistency in the practical application of our investment philosophy.
· Strategy: Focused Growth International
· Vehicle: Separately Managed Account
· Objective: To outperform the MSCI EAFE Index
· Annual fees: 1.00% on all assets
· Benchmark: MSCI EAFE Index
This is a concentrated, large cap, quality, international growth product. They are distinct from the broadinternational indices with a traditional growth bias, seeking select quality growth businesses fromconventional growth sectors. That combined with a concentrated focus (between 25-40) means theproduct will have investment characteristics distinct from any broad international benchmark. The productincludes mega-, large- and mid-cap international shares from developed and emerging markets. Theinvestment process includes top-down thematic analysis and bottom-up fundamental stock selection.They focus on each company's business model (economic moat), corporate culture, management, andvaluation (using conservative DCF models). Currency hedging is not utilized in this strategy but carefulattention is paid to region, country, and currency exposures. The projected annual turnover is 15-35%,suggesting tax efficiency for tax-sensitive clients.
Portfolio Summary
International Equity Managers
As of December 31, 2017
34
Peer Group Analysis - IM International Large Cap Value Equity (SA+CF)
Comparative Performance
-10.00
-4.00
2.00
8.00
14.00
20.00
26.00
32.00
38.00
44.00
Re
turn
QTR FYTD 1 YR 2 YR 3 YR 4 YR 5 YR
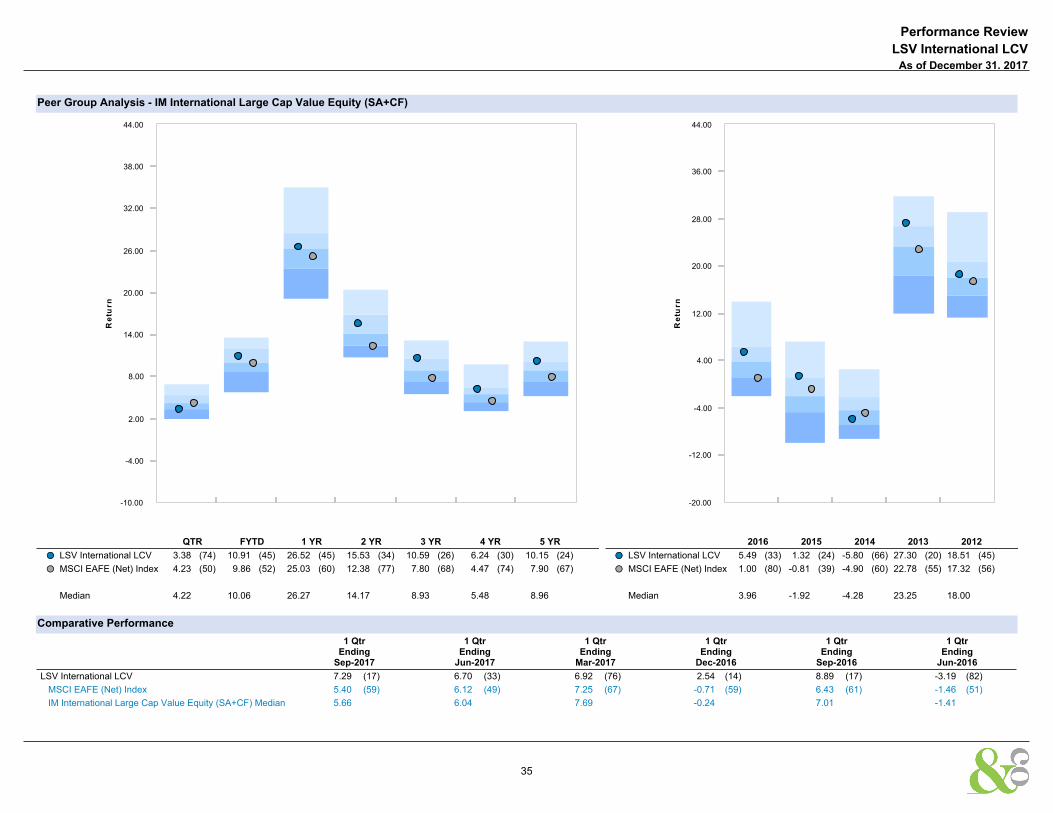
LSV International LCV 3.38 (74) 10.91 (45) 26.52 (45) 15.53 (34) 10.59 (26) 6.24 (30) 10.15 (24)��
MSCI EAFE (Net) Index 4.23 (50) 9.86 (52) 25.03 (60) 12.38 (77) 7.80 (68) 4.47 (74) 7.90 (67)��
Median 4.22 10.06 26.27 14.17 8.93 5.48 8.96
-20.00
-12.00
-4.00
4.00
12.00
20.00
28.00
36.00
44.00
Re
turn
2016 2015 2014 2013 2012
LSV International LCV 5.49 (33) 1.32 (24) -5.80 (66) 27.30 (20) 18.51 (45)��
MSCI EAFE (Net) Index 1.00 (80) -0.81 (39) -4.90 (60) 22.78 (55) 17.32 (56)��
Median 3.96 -1.92 -4.28 23.25 18.00
1 QtrEnding
Sep-2017
1 QtrEnding
Jun-2017
1 QtrEnding
Mar-2017
1 QtrEnding
Dec-2016
1 QtrEnding
Sep-2016
1 QtrEnding
Jun-2016
LSV International LCV 7.29 (17) 6.70 (33) 6.92 (76) 2.54 (14) 8.89 (17) -3.19 (82)
MSCI EAFE (Net) Index 5.40 (59) 6.12 (49) 7.25 (67) -0.71 (59) 6.43 (61) -1.46 (51)
IM International Large Cap Value Equity (SA+CF) Median 5.66 6.04 7.69 -0.24 7.01 -1.41
Performance Review
As of December 31, 2017
LSV International LCV
NONE
35

Peer Group Scattergram - 3 Years
3 Yr Rolling Under/Over Performance - 5 Years
Peer Group Scattergram - 5 Years
3 Yr Rolling Percentile Ranking - 5 Years
Historical Statistics - 3 Years
Historical Statistics - 5 Years
Over Performance Earliest Date Latest Date
-6.0
0.0
6.0
12.0
18.0
24.0
LS
V In
tern
ati
on
al
L
CV
(%)
-6.0 0.0 6.0 12.0 18.0 24.0
MSCI EAFE (Net) Index (%)
Over
Performance
Under
Performance
0.0
25.0
50.0
75.0
100.0
Re
turn
Pe
rce
nti
le R
an
k
3/13 9/13 3/14 9/14 3/15 9/15 3/16 9/16 3/17 12/17
Total Period5-25
Count25-Median
CountMedian-75
Count75-95Count
LSV International LCV 20 1 (5%) 17 (85%) 2 (10%) 0 (0%)��
MSCI EAFE (Net) Index 20 0 (0%) 2 (10%) 18 (90%) 0 (0%)��
6.65
7.60
8.55
9.50
10.45
11.40
Re
turn
(%)
9.62 9.88 10.14 10.40 10.66 10.92 11.18 11.44
Risk (Standard Deviation %)
ReturnStandardDeviation
LSV International LCV 10.59 11.11��
MSCI EAFE (Net) Index 7.80 9.87��
Median 8.93 10.36¾
7.02
7.80
8.58
9.36
10.14
10.92
Re
turn
(%)
9.57 9.90 10.23 10.56 10.89 11.22 11.55 11.88 12.21
Risk (Standard Deviation %)
ReturnStandardDeviation
LSV International LCV 10.15 11.62��
MSCI EAFE (Net) Index 7.90 10.15��
Median 8.96 10.37¾
TrackingError
UpMarketCapture
DownMarketCapture
AlphaInformation
RatioSharpeRatio
BetaDownside
Risk
LSV International LCV 2.43 107.63 91.47 2.35 1.10 0.84 1.04 7.82
MSCI EAFE (Net) Index 0.00 100.00 100.00 0.00 N/A 0.67 1.00 7.54 90 Day U.S. Treasury Bill 11.81 1.33 -0.80 0.36 -0.67 N/A 0.00 0.02
TrackingError
UpMarketCapture
DownMarketCapture
AlphaInformation
RatioSharpeRatio
BetaDownside
Risk
LSV International LCV 2.31 107.04 94.20 1.82 0.94 0.83 1.04 7.13
MSCI EAFE (Net) Index 0.00 100.00 100.00 0.00 N/A 0.70 1.00 6.94 90 Day U.S. Treasury Bill 11.56 0.85 -0.56 0.24 -0.70 N/A 0.00 0.01
Performance Review
As of December 31, 2017
LSV International LCV
NONE
36

Peer Group Analysis - IM International Growth Equity (SA+CF)
Comparative Performance
-12.00
-4.00
4.00
12.00
20.00
28.00
36.00
44.00
52.00
60.00R
etu
rn
QTR FYTD 1 YR 2 YR 3 YR 4 YR 5 YR
WCM Focused Growth Int'l 5.20 (53) 10.74 (69) 33.97 (40) 16.15 (36) 12.54 (30) 9.45 (18) 11.99 (23)��
MSCI EAFE (Net) Index 4.23 (75) 9.86 (86) 25.03 (94) 12.38 (79) 7.80 (93) 4.47 (94) 7.90 (93)��
Median 5.26 12.72 32.42 15.06 11.06 6.87 9.54
-20.00
-12.00
-4.00
4.00
12.00
20.00
28.00
36.00
44.00
52.00
Re
turn
2016 2015 2014 2013 2012
WCM Focused Growth Int'l 0.70 (39) 5.67 (31) 0.67 (16) 22.74 (51) 13.24 (94)��
MSCI EAFE (Net) Index 1.00 (34) -0.81 (85) -4.90 (66) 22.78 (51) 17.32 (70)��
Median -0.40 3.10 -3.37 22.87 20.00
1 QtrEnding
Sep-2017
1 QtrEnding
Jun-2017
1 QtrEnding
Mar-2017
1 QtrEnding
Dec-2016
1 QtrEnding
Sep-2016
1 QtrEnding
Jun-2016
WCM Focused Growth Int'l 5.26 (80) 9.08 (29) 10.91 (12) -6.74 (84) 5.15 (81) 2.28 (9)
MSCI EAFE (Net) Index 5.40 (78) 6.12 (89) 7.25 (86) -0.71 (10) 6.43 (57) -1.46 (59)
IM International Growth Equity (SA+CF) Median 7.26 7.77 8.74 -4.22 6.76 -0.97
Performance Review
As of December 31, 2017
WCM Focused Growth Int'l
NONE
37

Peer Group Scattergram - 3 Years
3 Yr Rolling Under/Over Performance - 5 Years
Peer Group Scattergram - 5 Years
3 Yr Rolling Percentile Ranking - 5 Years
Historical Statistics - 3 Years
Historical Statistics - 5 Years
Over Performance Earliest Date Latest Date
-5.0
0.0
5.0
10.0
15.0
20.0
WC
M F
oc
us
ed
Gro
wth
Int'
l
(%)
-5.0 0.0 5.0 10.0 15.0 20.0
MSCI EAFE (Net) Index (%)
Over
Performance
Under
Performance
0.0
25.0
50.0
75.0
100.0
Re
turn
Pe
rce
nti
le R
an
k
3/13 9/13 3/14 9/14 3/15 9/15 3/16 9/16 3/17 12/17
Total Period5-25
Count25-Median
CountMedian-75
Count75-95Count
WCM Focused Growth Int'l 13 7 (54%) 3 (23%) 3 (23%) 0 (0%)��
MSCI EAFE (Net) Index 20 0 (0%) 0 (0%) 9 (45%) 11 (55%)��
6.00
8.00
10.00
12.00
14.00
Re
turn
(%)
9.50 9.75 10.00 10.25 10.50 10.75 11.00 11.25 11.50
Risk (Standard Deviation %)
ReturnStandardDeviation
WCM Focused Growth Int'l 12.54 10.50��
MSCI EAFE (Net) Index 7.80 9.87��
Median 11.06 11.10¾
6.00
8.00
10.00
12.00
14.00
Re
turn
(%)
9.43 9.66 9.89 10.12 10.35 10.58 10.81 11.04
Risk (Standard Deviation %)
ReturnStandardDeviation
WCM Focused Growth Int'l 11.99 9.65��
MSCI EAFE (Net) Index 7.90 10.15��
Median 9.54 10.75¾
TrackingError
UpMarketCapture
DownMarketCapture
AlphaInformation
RatioSharpeRatio
BetaDownside
Risk
WCM Focused Growth Int'l 5.56 97.37 61.24 5.42 0.78 1.04 0.88 6.90
MSCI EAFE (Net) Index 0.00 100.00 100.00 0.00 N/A 0.67 1.00 7.54 90 Day U.S. Treasury Bill 11.81 1.33 -0.80 0.36 -0.67 N/A 0.00 0.02
TrackingError
UpMarketCapture
DownMarketCapture
AlphaInformation
RatioSharpeRatio
BetaDownside
Risk
WCM Focused Growth Int'l 5.01 94.42 60.63 4.89 0.74 1.06 0.87 6.32
MSCI EAFE (Net) Index 0.00 100.00 100.00 0.00 N/A 0.70 1.00 6.94 90 Day U.S. Treasury Bill 11.56 0.85 -0.56 0.24 -0.70 N/A 0.00 0.01
Performance Review
As of December 31, 2017
WCM Focused Growth Int'l
NONE
38

Page Intentionally Left Blank
39

Pacific Moderate Duration - Portfolio Description Pacific Moderate Duration - Strategy Details
· Strategy: Moderate Duration
· Vehicle: Separately Managed Account
· Objective: To outperform the Bloomberg Barclays US Aggregate Index
· Annual fees: .30% on all assets
· Benchmark: Bloomberg Barclays US Aggregate Index
The Moderate Duration product is a core bond strategy that seeks to outperform the Barclays CapitalAggregate Index on both an absolute and risk-adjusted basis over a full market cycle. The ModerateDuration product invests in U.S. Government securities, mortgage-backed securities, corporate debtsecurities and asset-backed securities. The product maintains duration of between 3.0 to 7.0 years and isgenerally within one year of the index.
Portfolio Summary
Fixed Income Managers
As of December 31, 2017
40

Peer Group Analysis - IM U.S. Broad Market Core Fixed Income (SA+CF)
Comparative Performance
-1.25
-0.46
0.33
1.12
1.91
2.70
3.49
4.28
5.07
5.86
6.65
Re
turn
QTR FYTD 1 YR 2 YR 3 YR 4 YR 5 YR
Pacific Fixed Income 0.64 (19) 1.65 (26) 4.24 (34) 4.55 (9) 2.79 (38) 3.59 (46) 2.48 (52)��
Blmbg Barc US Agg 0.39 (80) 1.24 (81) 3.54 (83) 3.09 (83) 2.24 (88) 3.16 (84) 2.10 (84)��
Median 0.52 1.45 4.05 3.60 2.61 3.52 2.49
-6.00
-4.00
-2.00
0.00
2.00
4.00
6.00
8.00
10.00
12.00
Re
turn
2016 2015 2014 2013 2012
Pacific Fixed Income 4.86 (7) -0.65 (100) 6.02 (63) -1.84 (65) 4.93 (77)��
Blmbg Barc US Agg 2.65 (75) 0.55 (75) 5.97 (67) -2.02 (74) 4.21 (91)��
Median 3.10 0.82 6.16 -1.56 5.88
1 QtrEnding
Sep-2017
1 QtrEnding
Jun-2017
1 QtrEnding
Mar-2017
1 QtrEnding
Dec-2016
1 QtrEnding
Sep-2016
1 QtrEnding
Jun-2016
Pacific Fixed Income 1.00 (33) 1.45 (75) 1.08 (30) -2.67 (34) 0.83 (34) 3.20 (3)
Bloomberg Barclays U.S. Aggregate Index 0.85 (75) 1.45 (75) 0.82 (77) -2.98 (76) 0.46 (77) 2.21 (70)
IM U.S. Broad Market Core Fixed Income (SA+CF) Median 0.92 1.54 0.93 -2.80 0.69 2.33
Performance Review
As of December 31, 2017
Pacific Fixed Income
NONE
41

Peer Group Scattergram - 3 Years
3 Yr Rolling Under/Over Performance - 5 Years
Peer Group Scattergram - 5 Years
3 Yr Rolling Percentile Ranking - 5 Years
Historical Statistics - 3 Years
Historical Statistics - 5 Years
Over Performance Under Performance
Earliest Date Latest Date
0.0
1.5
3.0
4.5
6.0
7.5
Pa
cif
ic F
ixe
d In
co
me
(%)
0.0 1.5 3.0 4.5 6.0 7.5
Bloomberg Barclays U.S. Aggregate Index (%)
Over
Performance
Under
Performance
0.0
25.0
50.0
75.0
100.0
Re
turn
Pe
rce
nti
le R
an
k
3/13 9/13 3/14 9/14 3/15 9/15 3/16 9/16 3/17 12/17
Total Period5-25
Count25-Median
CountMedian-75
Count75-95Count
Pacific Fixed Income 20 0 (0%) 3 (15%) 8 (40%) 9 (45%)��
Blmbg Barc US Agg 20 0 (0%) 0 (0%) 0 (0%) 20 (100%)��
2.00
2.20
2.40
2.60
2.80
3.00
Re
turn
(%)
3.08 3.15 3.22 3.29 3.36 3.43 3.50 3.57
Risk (Standard Deviation %)
ReturnStandardDeviation
Pacific Fixed Income 2.79 3.51��
Blmbg Barc US Agg 2.24 3.17��
Median 2.61 3.15¾
2.00
2.20
2.40
2.60
Re
turn
(%)
2.94 3.00 3.06 3.12 3.18 3.24 3.30 3.36
Risk (Standard Deviation %)
ReturnStandardDeviation
Pacific Fixed Income 2.48 3.27��
Blmbg Barc US Agg 2.10 3.00��
Median 2.49 3.04¾
TrackingError
UpMarketCapture
DownMarketCapture
AlphaInformation
RatioSharpeRatio
BetaDownside
Risk
Pacific Fixed Income 1.19 110.79 98.84 0.64 0.45 0.84 0.96 1.72
Bloomberg Barclays U.S. Aggregate Index 0.00 100.00 100.00 0.00 N/A 0.68 1.00 1.72 90 Day U.S. Treasury Bill 2.76 5.36 -5.07 0.37 -0.68 N/A 0.01 0.02
TrackingError
UpMarketCapture
DownMarketCapture
AlphaInformation
RatioSharpeRatio
BetaDownside
Risk
Pacific Fixed Income 0.95 106.82 98.68 0.41 0.39 0.77 0.98 1.83
Bloomberg Barclays U.S. Aggregate Index 0.00 100.00 100.00 0.00 N/A 0.67 1.00 1.80 90 Day U.S. Treasury Bill 2.81 3.32 -2.90 0.24 -0.67 N/A 0.00 0.01
Performance Review
As of December 31, 2017
Pacific Fixed Income
NONE
42

AEW Core Property - Portfolio Description AEW Core Property - Strategy Details
· Strategy: Core Property Trust
· Vehicle: Open Ended Commingled Real Estate Fund
· Objective: To outperform the NCREIF ODCE Index
· Annual fees: 1.10% on all assets
· Benchmark: NCREIF ODCE Index
The AEW Core Property Trust combines research-driven strategies with on-the-ground market knowledgeand experience to construct a diversified portfolio of multifamily, retail, office, industrial and, to a lesserextent, hotel properties. The Fund seeks to acquire primarily well-located, institutional-quality assets inmarkets throughout the U.S. - investments that are designed to provide durable income streams andappreciation over the mid- to long-term. AEW expects to invest primarily in major metropolitan marketsthat feature barriers to new supply - whether physical, governmental or economic - as well as solidpopulation and job growth. With limited supply and increasing demand, these markets should provide anopportunity for peak-to-peak rent growth and thus, long-term value creation. The Fund also seeks toexploit America’s changing demographics, and the impact they will have on economic growth anddemand for real estate. The Fund also focuses on markets and properties that are positively influencedby globalization as it continues to change the nature of U.S. jobs and affect the movement of goods andservices and consumer spending. Finally, the Fund’s target markets also exhibit economic diversity interms of the underlying industries that are driving the demand in the marketplace; providing both growthand diversification to the Fund.
Portfolio Summary
Real Estate Managers
As of December 31, 2017
43

Peer Group Analysis - IM U.S. Open End Private Real Estate (SA+CF)
Comparative Performance
-4.00
-1.00
2.00
5.00
8.00
11.00
14.00
17.00
20.00R
etu
rn
QTR FYTD 1 YR 2 YR 3 YR 4 YR 5 YR
AEW Core Property Trust 2.16 (49) 3.99 (67) 7.96 (60) 8.22 (71) 10.03 (81) 10.35 (90) 10.73 (87)��
NCREIF-ODCE (VW) 2.07 (64) 3.97 (67) 7.62 (67) 8.19 (72) 10.42 (74) 10.94 (76) 11.53 (74)��
Median 2.13 4.27 8.52 8.92 10.93 11.51 12.20
0.00
2.00
4.00
6.00
8.00
10.00
12.00
14.00
16.00
18.00
20.00
Re
turn
FYTD 1 YR 3 YR 5 YR
AEW Core Property Trust 3.99 (67) 7.96 (60) 10.03 (81) 10.73 (87)��
NCREIF-ODCE (VW) 3.97 (67) 7.62 (67) 10.42 (74) 11.53 (74)��
Median 4.27 8.52 10.93 12.20
1 QtrEnding
Sep-2017
1 QtrEnding
Jun-2017
1 QtrEnding
Mar-2017
1 QtrEnding
Dec-2016
1 QtrEnding
Sep-2016
1 QtrEnding
Jun-2016
AEW Core Property Trust 1.79 (48) 1.77 (69) 2.02 (44) 2.00 (63) 1.77 (75) 2.41 (55)
NCREIF Fund Index-ODCE (VW) 1.87 (46) 1.70 (72) 1.77 (54) 2.11 (61) 2.07 (58) 2.13 (64)
IM U.S. Open End Private Real Estate (SA+CF) Median 1.76 1.91 1.91 2.26 2.16 2.54
Performance Review
As of December 31, 2017
AEW Core Property Trust
NONE
44

Bloomfield Income Fund - Portfolio Description Bloomfield Income Fund - Strategy Details
RMK Timber - Portfolio Description
Metropolitan MREP VI - Portfolio Description
RMK Timber - Strategy Details
Metropolitan MREP VI - Strategy Details
· Strategy: Bloomfield Capital Income Fund II
· Objective: To provide an absolute return in excess of 9%
· Annual fees: 2.00% on Committed Capital
The Bloomfield Capital Income Fund II is a real estate opportunity fund focused on two primary strategies.1. Originating senior secured, high yield, interim and bridge loans on income producing real estate in theU.S. and 2. Acquiring a diverse portfolio of commercial mortgage loans, deeds of trust, and other realestate related opportunistic investments. The Fund's objective is to build a diverse portfolio of senior,secured mortgages providing investors with consistent income and superior risk adjusted returns.Bloomfield Capital targets a double-digit yield on secure, risk-mitigated investments. The porfoliomanagement team implements conservative underwriting techniques to provide a margin of safety.
· Strategy: Metropolitan Real Estate MREP VI Fund
· Vehicle: Real Estate Fund of Funds
· Objective: To outperform the NCREIF Property Index
· Annual fees: 1.35% on first $5M
· 1.00% on the next $20M
· Benchmark: NCREIF Property Index
Invest in a diversified portfolio of private real estate funds or other investment vehicles with direct orindirect exposure to real estate. The manager invests in funds with exposure to office, retail, industrials,multi-family, and other types of properties located primarily in the United States. The manger selectsvalue added and opportunistic funds with superior performance track records. The manager diversifiesthe strategy across property types, geographic markets, managers, and strategies.
· Strategy: RMK Global Timberland Resources US FundRMK Global Timberland Resources Intl Alternative Investment
· Objective: To outperform the NCREIF Timberland Index
· Management fees: US Fund: 1.00%Intl Fund: 1.25%
· Performance Fee: US Fund: 20% (6% Hurdle)Intl Fund: 20% (10% Hurdle)
The portfolio team develops an investment strategy for the Fund based on the current environment andmarket forecasts for timberlands, and related end products. RMK utilizes industry contacts to identifyattractive acquisition targets that achieve the Fund's investment strategy. Prior to purchasing a tract ofland, the team performs rigorous due diligence and develops an asset management plan. The portfolio isactively managed, evaluating the benefits of harvesting the forests, letting the trees further mature, orselling the timberland. The manager will diversity the portfolio by growth stage/maturity of the forests,geographic locations (50% US exposure / 50% International exposure), and species.
Portfolio Summary
Private Equity Managers
As of December 31, 2017
45
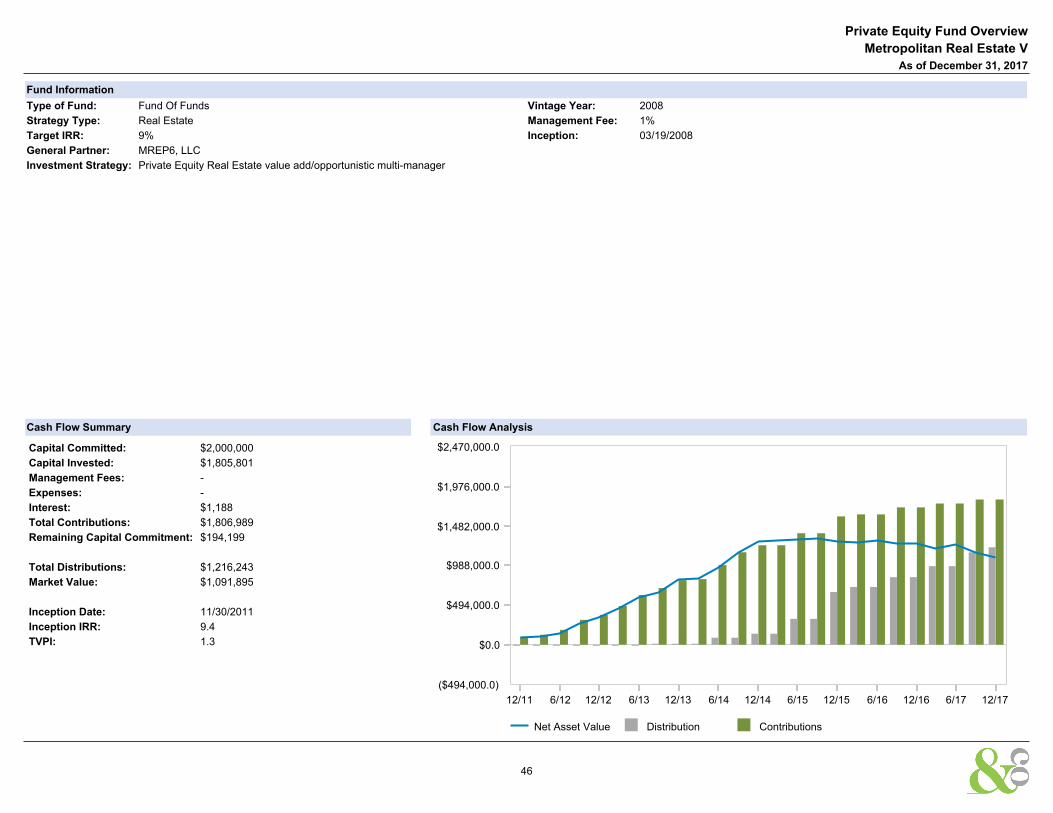
Fund Information
Type of Fund: Fund Of Funds Vintage Year: 2008
Strategy Type: Real Estate Management Fee: 1%
Target IRR: 9% Inception: 03/19/2008
General Partner: MREP6, LLC
Investment Strategy: Private Equity Real Estate value add/opportunistic multi-manager
Cash Flow Summary
Capital Committed: $2,000,000
Capital Invested: $1,805,801
Management Fees: -
Expenses: -
Interest: $1,188
Total Contributions: $1,806,989
Remaining Capital Commitment: $194,199
Total Distributions: $1,216,243
Market Value: $1,091,895
Inception Date: 11/30/2011
Inception IRR: 9.4
TVPI: 1.3
Cash Flow Analysis
Net Asset Value Distribution Contributions
$0.0
$494,000.0
$988,000.0
$1,482,000.0
$1,976,000.0
$2,470,000.0
($494,000.0)
12/11 6/12 12/12 6/13 12/13 6/14 12/14 6/15 12/15 6/16 12/16 6/17 12/17
Private Equity Fund Overview
Metropolitan Real Estate V
As of December 31, 2017
46

Fund Information
Type of Fund: Direct Vintage Year: 2011
Strategy Type: Other Management Fee: 2.00%
Target IRR: 9.00% Inception: 11/13/2011
General Partner: Bloomfield Capital Partners, LLC
Investment Strategy: Bloomfield Capital Income Fund II invests primarily in debt obligations consisting of commercial mortgage loans, deeds of trust and other real estate and/or debt-related investments, withthe objective of creating a diversified portfolio producing strong and consistent returns while providing considerable downside protection.
The Fund's investment strategy has a primary focus on commercial real estate loans and investments collateralized by significant margins of protective collateral such as real estate andother assets including but not limited to cash, marketable securities, equity interests, corporate interests and personal/corporate guarantees.
Cash Flow Summary
Capital Committed: $2,200,000
Capital Invested: $2,200,000
Management Fees: $259,046
Expenses: $102,668
Interest: -
Total Contributions: $2,200,000
Remaining Capital Commitment: -
Total Distributions: $594,542
Market Value: $2,298,328
Inception Date: 12/22/2014
Inception IRR: 10.6
TVPI: 1.3
Cash Flow Analysis
Net Asset Value Distribution Contributions
$0.0
$624,000.0
$1,248,000.0
$1,872,000.0
$2,496,000.0
$3,120,000.0
($624,000.0)
12/14 3/15 6/15 9/15 12/15 3/16 6/16 9/16 12/16 3/17 6/17 9/17 12/17
Private Equity Fund Overview
Bloomfield Capital Income Fund II
As of December 31, 2017
47

Fund Information
Type of Fund: Direct Vintage Year: 2015
Strategy Type: Other Management Fee: 2.00%
Target IRR: 8.00% Inception: 11/01/2015
General Partner: Bloomfield Capital Partners, LLC
Investment Strategy: Bloomfield Capital Income Fund III invests primarily in debt obligations consisting of commercial mortgage loans, deeds of trust and other real estate and/or debt-related investments, withthe objective of creating a diversified portfolio producing strong and consistent returns while providing considerable downside protection.
The Fund's investment strategy has a primary focus on commercial real estate loans and investments collateralized by significant margins of protective collateral such as real estate andother assets including but not limited to cash, marketable securities, equity interests, corporate interests and personal/corporate guarantees.
Cash Flow Summary
Capital Committed: $4,000,000
Capital Invested: $4,000,000
Management Fees: $133,884
Expenses: $57,996
Interest: -
Total Contributions: $4,000,000
Remaining Capital Commitment: -
Total Distributions: $313,425
Market Value: $4,146,336
Inception Date: 12/31/2016
Inception IRR: 12.3
TVPI: 1.1
Cash Flow Analysis
Net Asset Value Distribution Contributions
$0.0
$1,092,000.0
$2,184,000.0
$3,276,000.0
$4,368,000.0
$5,460,000.0
($1,092,000.0)
12/16 3/17 6/17 9/17 12/17
Private Equity Fund Overview
Bloomfield Capital Income Fund III
As of December 31, 2017
48

Total Fund Policy
Allocation Mandate Weight (%)
Jan-1985
S&P 500 Index 20.50
S&P MidCap 400 Index 16.00
Russell 2000 Index 14.00
MSCI EAFE (Net) Index 15.00
Bloomberg Barclays U.S. Aggregate Index 30.00
NCREIF Fund Index-ODCE (VW) 4.50
Jan-2017
S&P 500 Index 20.00
Russell Midcap Index 14.00
Russell 2000 Index 14.00
MSCI EAFE (Net) Index 15.50
Bloomberg Barclays U.S. Aggregate Index 20.00
Blmbg. Barc. Global Multiverse 2.00
NCREIF Fund Index-ODCE (VW) 6.00
HFRI FOF: Diversified Index 5.00
NCREIF Timberland Index 3.50
Total Domestic Equity Policy
Allocation Mandate Weight (%)
Jan-1985
S&P 500 Index 40.00
S&P MidCap 400 Index 32.00
Russell 2000 Index 28.00
Total International Equity Policy
Allocation Mandate Weight (%)
Jan-1970
MSCI EAFE (Net) Index 100.00
Total Fixed Income Policy
Allocation Mandate Weight (%)
Jan-1976
Bloomberg Barclays U.S. Aggregate Index 100.00
Total Real Estate Policy
Allocation Mandate Weight (%)
Jan-1978
NCREIF Property Index 100.00
Total Timber Policy
Allocation Mandate Weight (%)
Apr-1987
NCREIF Timberland Index 100.00
Benchmark History
Investment Policy Benchmarks
As of December 31, 2017
49

Plan Disclosures:
· All composite returns (except Timber and Real Estate) prior to March 31, 2015 was obtained from prior consultant.
· Though there was no changes made to any of the composites (except Timber and Real Estate) from 3/31/2015 and back to inception, and are shown as reported byprior consultant, there are changes made to individual portfolios.
· AEW Core Property- obtained all historical statements and built history.
· Bloomfield Capital Income Fund- obtained all historical statements and built history.
· Metropolitan Real Estate VI- obtained all historical statements and built history.
· RMK Timberland Intl Fund- obtained all historical statements and built history.
· RMK Timberland US Fund- obtained all historical statements and built history.
· After rebuilding history for all Real Estate Funds and all Timber funds, recalculated composite returns for each composite.
Disclosures
Total Fund
As of December 31, 2017
50

EstimatedAnnual Fee
(%)
Market Value($)
EstimatedAnnual Fee
($)Fee Schedule
Comerica S&P 500 Index Fund 0.09 24,110,134 20,688 0.12 % of First $2 M0.10 % of Next $3 M0.08 % of Next $20 M0.06 % of Next $25 M0.04 % of Next $50 M0.02 % Thereafter
Champlain MC Equity 0.85 7,341,451 62,402 0.85 % of Assets
QMA US MC Equity 0.00 7,488,917 337 0.00 % of Assets
SouthernSun SC 1.00 13,754,023 137,540 1.00 % of First $15 M0.85 % Thereafter
Walthausen & Co. SMID Value 1.00 6,843,899 68,439 1.00 % of Assets
Total Domestic Equity 0.49 59,538,424 289,407
WCM Focused Growth International 0.75 9,179,695 68,848 0.75 % of Assets
LSV International LCV 0.75 10,212,843 76,596 0.75 % of First $25 M0.65 % of Next $25 M0.55 % of Next $50 M0.45 % Thereafter
Total International Equity 0.75 19,392,537 145,444
Pacific Fixed Income 0.30 12,159,923 36,480 0.30 % of Assets
Templeton Global Bond R6 (FBNRX) 0.51 3,223,487 16,440 0.51 % of Assets
Bloomfield Capital Income Fund II 2.00 2,298,328 45,967 2.00 % of Assets
Bloomfield Capital Income Fund III 2.00 4,146,336 82,927 2.00 % of Assets
Total Fixed Income 0.83 21,828,075 181,813
AEW Core Property Trust 1.25 6,435,490 80,444 1.25 % of Assets
Metropolitan Real Estate V 1.00 1,091,895 10,919 1.00 % of Assets
Total Real Estate 1.21 7,527,385 91,363
Magnitude Institutional 1.00 2,668,045 26,680 1.00 % of Assets
Titan Masters Int'l Fund 0.75 2,430,592 18,229 0.75 % of Assets
Total Hedge Fund of Funds 0.88 5,098,637 44,910
Cash 384,059 -
Total Fund 0.67 116,796,994 786,094
Southfield Employees Retirement System
Fee Analysis
As of December 31, 2017
51

Report Statistics Definitions and Descriptions
Active Return - Arithmetic difference between the manager’s performance and the designated benchmark return over a specified time period. Alpha - A measure of the difference between a portfolio's actual performance and its expected return based on its level of risk as determined by beta. It determines the portfolio's
non-systemic return, or its historical performance not explained by movements of the market. Beta - A measure of the sensitivity of a portfolio to the movements in the market. It is a measure of the portfolio's systematic risk. Consistency - The percentage of quarters that a product achieved a rate of return higher than that of its benchmark. Higher consistency indicates the manager has contributed more to the
product’s performance. Distributed to Paid In (DPI) - The ratio of money distributed to Limited Partners by the fund, relative to contributions. It is calculated by dividing cumulative distributions by paid in capital. This multiple
shows the investor how much money they got back. It is a good measure for evaluating a fund later in its life because there are more distributions to measure against. Down Market Capture - The ratio of average portfolio performance over the designated benchmark during periods of negative returns. A lower value indicates better product performance Downside Risk - A measure similar to standard deviation that utilizes only the negative movements of the return series. It is calculated by taking the standard deviation of the negative
quarterly set of returns. A higher factor is indicative of a riskier product. Excess Return - Arithmetic difference between the manager’s performance and the risk-free return over a specified time period. Excess Risk - A measure of the standard deviation of a portfolio's performance relative to the risk free return. Information Ratio - This calculates the value-added contribution of the manager and is derived by dividing the active rate of return of the portfolio by the tracking error. The higher the
Information Ratio, the more the manager has added value to the portfolio. Public Market Equivalent (PME) - Designs a set of analyses used in the Private Equity Industry to evaluate the performance of a Private Equity Fund against a public benchmark or index. R-Squared - The percentage of a portfolio's performance that can be explained by the behavior of the appropriate benchmark. A high R-Squared means the portfolio's performance has
historically moved in the same direction as the appropriate benchmark. Return - Compounded rate of return for the period. Sharpe Ratio - Represents the excess rate of return over the risk free return divided by the standard deviation of the excess return. The result is an absolute rate of return per unit of risk. A
higher value demonstrates better historical risk-adjusted performance. Standard Deviation - A statistical measure of the range of a portfolio's performance. It represents the variability of returns around the average return over a specified time period. Total Value to Paid In (TVPI) - The ratio of the current value of remaining investments within a fund, plus the total value of all distributions to date, relative to the total amount of capital paid into the fund
to date. It is a good measure of performance before the end of a fund’s life Tracking Error - This is a measure of the standard deviation of a portfolio's returns in relation to the performance of its designated market benchmark. Treynor Ratio - Similar to Sharpe ratio but utilizes beta rather than excess risk as determined by standard deviation. It is calculated by taking the excess rate of return above the risk free
rate divided by beta to derive the absolute rate of return per unit of risk. A higher value indicates a product has achieved better historical risk-adjusted performance. Up Market Capture - The ratio of average portfolio performance over the designated benchmark during periods of positive returns. A higher value indicates better product performance.
52

Disclosures
AndCo compiled this report for the sole use of the client for which it was prepared. AndCo is responsible for evaluating the performance results of the Total Fund along with the investment advisors by comparing their performance with indices and other related peer universe data that is deemed appropriate. AndCo uses the results from this evaluation to make observations and recommendations to the client.
AndCo uses time-weighted calculations which are founded on standards recommended by the CFA Institute. The calculations and values shown are based on information that is received from custodians. AndCo analyzes transactions as indicated on the custodian statements and reviews the custodial market values of the portfolio. As a result, this provides AndCo with a reasonable basis that the investment information presented is free from material misstatement. This methodology of evaluating and measuring performance provides AndCo with a practical foundation for our observations and recommendations. Nothing came to our attention that would cause AndCo to believe that the information presented is significantly misstated.
This performance report is based on data obtained by the client’s custodian(s), investment fund administrator, or other sources believed to be reliable. While these sources are believed to be reliable, the data providers are responsible for the accuracy and completeness of their statements. Clients are encouraged to compare the records of their custodian(s) to ensure this report fairly and accurately reflects their various asset positions.
The strategies listed may not be suitable for all investors. We believe the information provided here is reliable, but do not warrant its accuracy or completeness. Past performance is not an indication of future performance. Any information contained in this report is for informational purposes only and should not be construed to be an offer to buy or sell any securities, investment consulting, or investment management services.
Additional information included in this document may contain data provided by from index databases, public economic sources and the managers themselves.
This document may contain data provided by Bloomberg Barclays. Bloomberg Barclays Index data provided by way of Barclays Live.
This document may contain data provided by Standard and Poor’s. Nothing contained within any document, advertisement or presentation from S&P Indices constitutes an offer of services in jurisdictions where S&P Indices does not have the necessary licenses. All information provided by S&P Indices is impersonal and is not tailored to the needs of any person, entity or group of persons. Any returns or performance provided within any document is provided for illustrative purposes only and does not demonstrate actual performance. Past performance is not a guarantee of future investment results.
This document may contain data provided by MSCI, Inc. Copyright MSCI, 2017. Unpublished. All Rights Reserved. This information may only be used for your internal use, may not be reproduced or redisseminated in any form and may not be used to create any financial instruments or products or any indices. This information is provided on an “as is” basis and the user of this information assumes the entire risk of any use it may make or permit to be made of this information. Neither MSCI, any of its affiliates or any other person involved in or related to compiling, computing or creating this information makes any express or implied warranties or representations with respect to such information or the results to be obtained by the use thereof, and MSCI, its affiliates and each such other person hereby expressly disclaim all warranties (including, without limitation, all warranties of originality, accuracy, completeness, timeliness, non-infringement, merchantability and fitness for a particular purpose) with respect to this information. Without limiting any of the foregoing, in no event shall MSCI, any of its affiliates or any other person involved in or related to compiling, computing or creating this information have any liability for any direct, indirect, special, incidental, punitive, consequential or any other damages (including, without limitation, lost profits) even if notified of, or if it might otherwise have anticipated, the possibility of such damages.
This document may contain data provided by Russell Investment Group. Russell Investment Group is the source owner of the data contained or reflected in this material and all trademarks and copyrights related thereto. The material may contain confidential information and unauthorized use, disclosure, copying, dissemination or redistribution is strictly prohibited. This is a user presentation of the data. Russell Investment Group is not responsible for the formatting or configuration of this material or for any inaccuracy in presentation thereof.
This document may contain data provided by Morningstar. All rights reserved. Use of this content requires expert knowledge. It is to be used by specialist institutions only. The information contained herein: (1) is proprietary to Morningstar and/or its content providers; (2) may not be copied, adapted or distributed; and (3) is not warranted to be accurate, complete or timely. Neither Morningstar nor its content providers are responsible for any damages or losses arising from any use of this information, except where such damages or losses cannot be limited or excluded by law in your jurisdiction. Past financial performance is not guarantee of future results.
52
