designing the ideal investment policy - seactuary.com the ideal investment policy presented to the...
TRANSCRIPT

Designing The Ideal Investment Policy
Presented To The Actuaries’ Club of the Southwest & the Southeastern Actuarial Conference
Presented by:
Greg Curran, CFA & Michael Kelch, CFA
AAM - Insurance Investment Management

Key Sections
• Purpose and Key Components of the Investment Policy
• Risk Tolerance and Ways to Minimize Exposures
• Investment Policies Catered to Insurance Companies
• Cash Flow and Liquidity Management
• Unique Circumstances

Investment Policy Purpose and Key Components
Investment Policy Purpose:
Serve as the governing document for investment decision-making
Key Components
• Goals, Objectives, and Constraints
• Responsibilities– Communication– Reporting: Performance and Holdings
• Periodic Review– Investment Portfolio and Policy Statement
• Special Considerations– Foreign currency exposure– Accounting issues– Tax issues– Limit or prohibition of investment to specific company types
• (e.g. alcohol, tobacco, defense, etc.)

Getting to Know the Client
Getting to Know the Client
• What are the portfolio goals and objectives?
• What are the portfolio constraints?
• What is the risk tolerance of the client?
• What performance measurement would be beneficial for determining portfolio success?
Investment Portfolio Goals and Objectives
• Defines intended purpose of the investment portfolio
• Helps to refine opportunity set for investment
– Examples of Insurance Company Goals and Objectives:
• Yield Oriented or Total Return Oriented Goals– Within acceptable risk levels
• Cash Flow Stability– Prudent management of call risk
• Preservation of Capital– Limit credit losses within the portfolio through diversification

Investment Portfolio Constraints
• Defines risk parameters that are of particular concern to the client
• Further narrows investment opportunities based on risk tolerance
– Examples of Insurance Company Portfolio Constraints
• Minimize interest rate sensitivity– Target portfolio duration to match the liabilities
• Achieve portfolio diversification – Both at a sector and issuer level
• Maintain sufficient short term cash flow and liquidity– To fund immediate liabilities
• Minimum Average Credit Quality– Forces portfolio into higher quality securities

Risk Tolerance: Risk Averse or Risk Seeker?
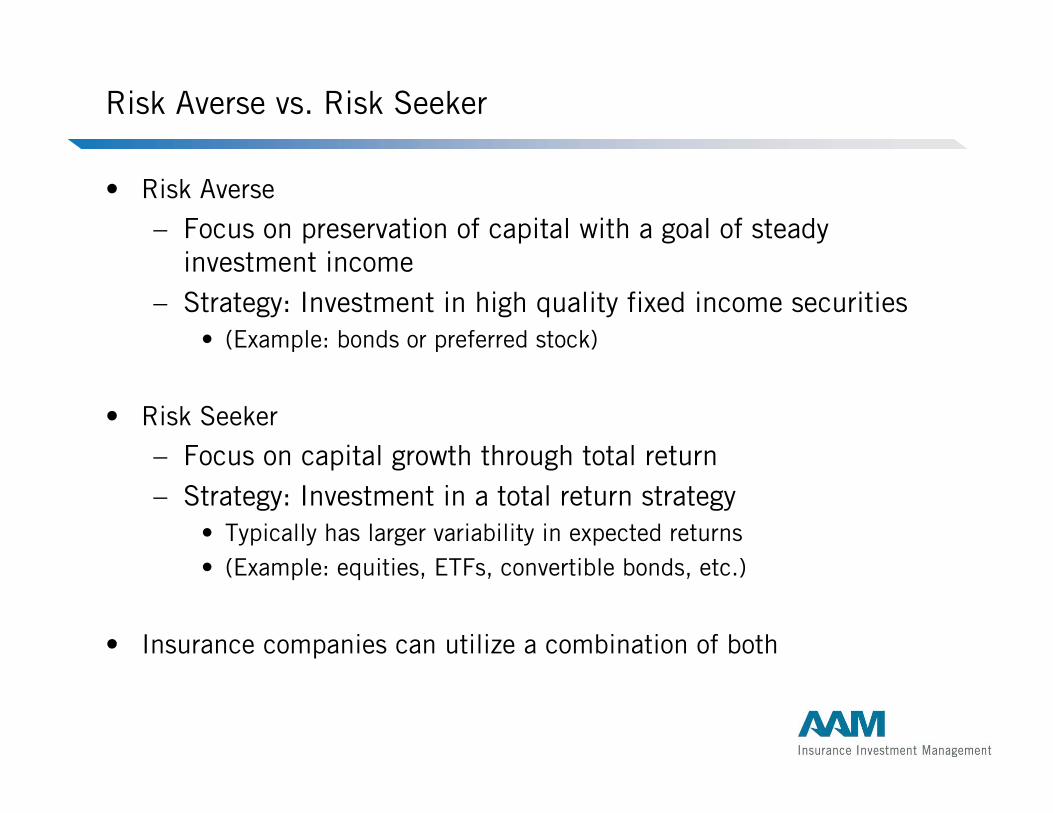
Risk Averse vs. Risk Seeker
• Risk Averse
– Focus on preservation of capital with a goal of steady investment income
– Strategy: Investment in high quality fixed income securities• (Example: bonds or preferred stock)
• Risk Seeker
– Focus on capital growth through total return– Strategy: Investment in a total return strategy
• Typically has larger variability in expected returns • (Example: equities, ETFs, convertible bonds, etc.)
• Insurance companies can utilize a combination of both
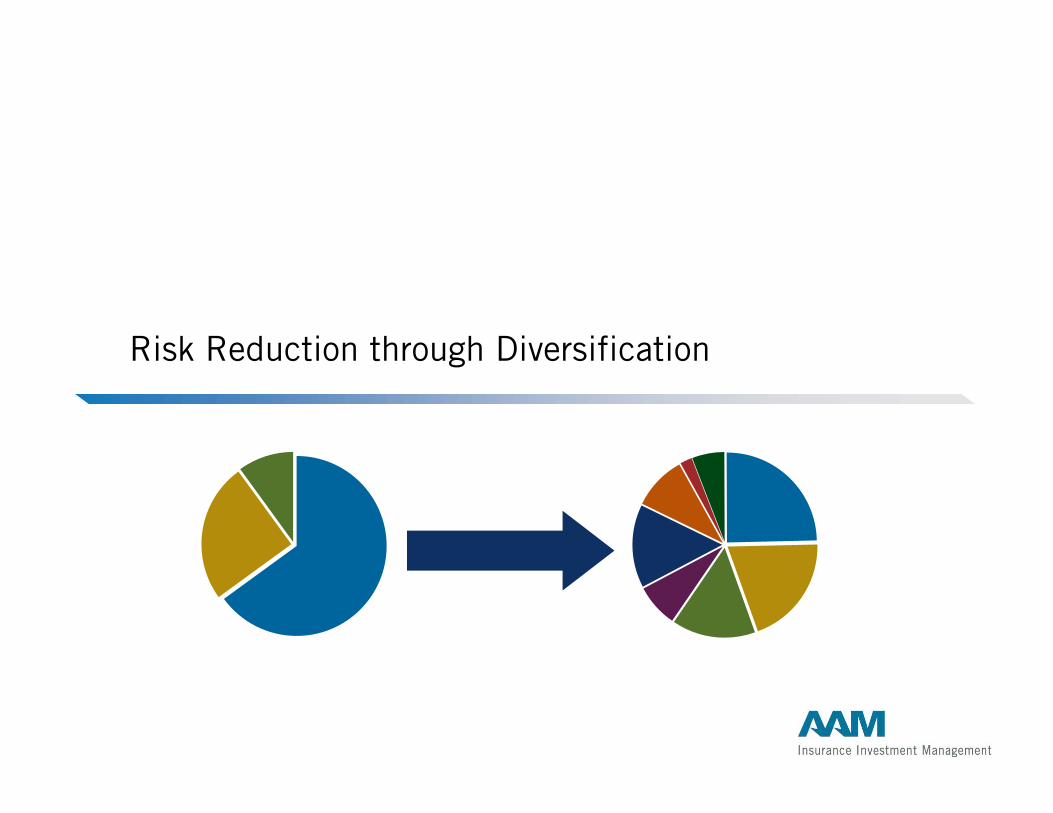
Risk Reduction through Diversification
Diversification
• Reduces exposure to individual event risk by limiting concentration by Sector and Issuer
• Reduces volatility of overall portfolio value
• Reduces correlation among individual asset classes – Decrease in variability of returns
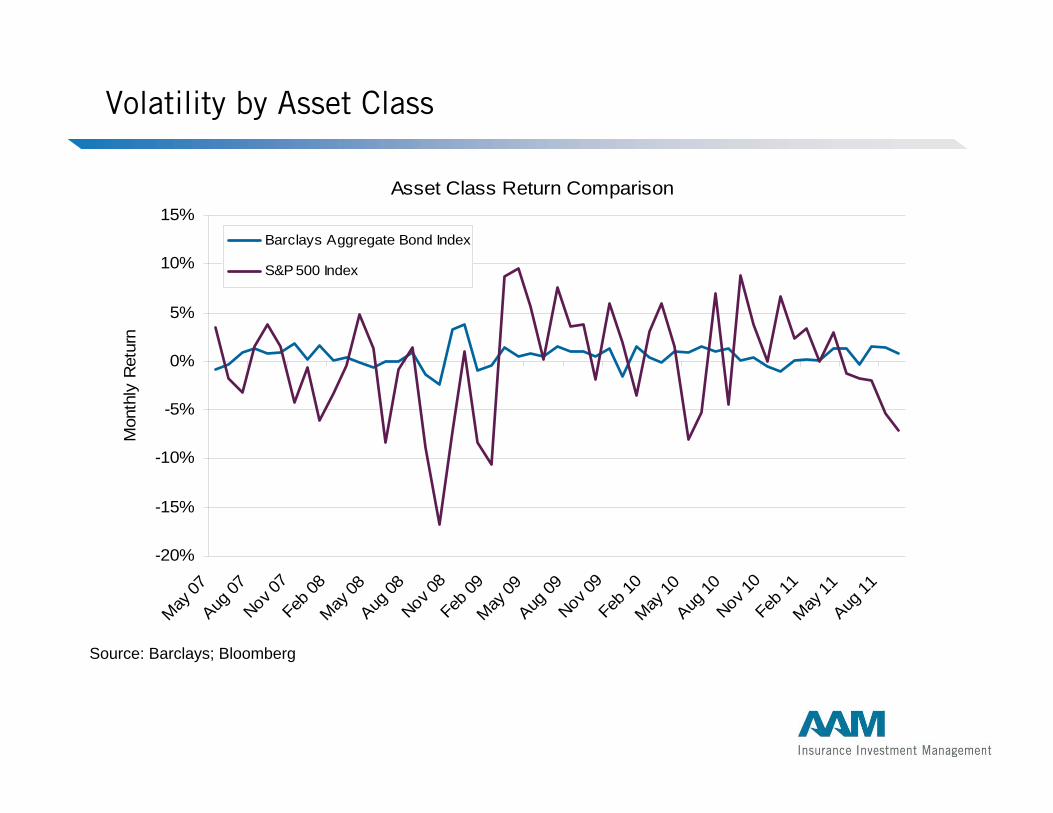
Volatility by Asset Class
Source: Barclays; Bloomberg
Asset Class Return Comparison
-20%
-15%
-10%
-5%
0%
5%
10%
15%
May 07
Aug 07
Nov 07
Feb 08
May 08
Aug 08
Nov 08
Feb 09
May 09
Aug 09
Nov 09
Feb 10
May 10
Aug 10
Nov 10
Feb 11
May 11
Aug 11
Mon
thly
Ret
urn
Barclays Aggregate Bond Index
S&P 500 Index
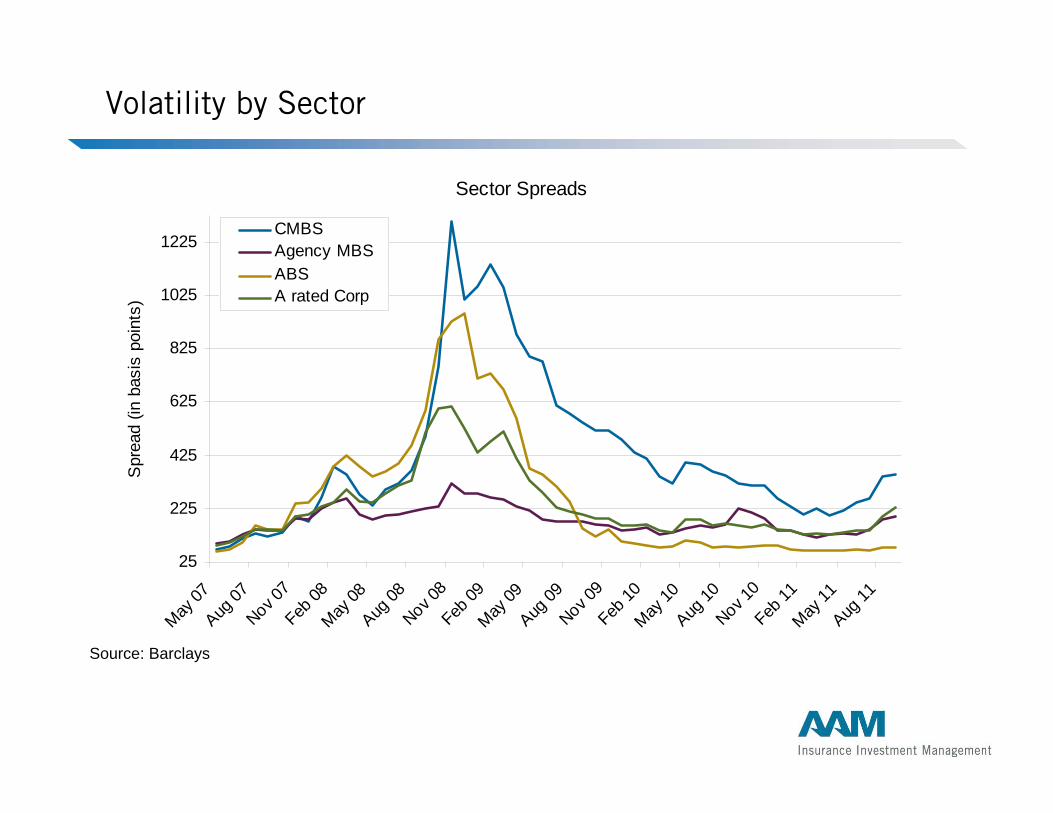
Volatility by Sector
Sector Spreads
25
225
425
625
825
1025
1225
May 07
Aug 07
Nov 07
Feb 08
May 08
Aug 08
Nov 08
Feb 09
May 09
Aug 09
Nov 09
Feb 10
May 10
Aug 10
Nov 10
Feb 11
May 11
Aug 11
Spr
ead
(in b
asis
poi
nts)
CMBSAgency MBSABSA rated Corp
Source: Barclays

Volatility by Credit Quality
Source: Barclays
Credit Spreads
0
100
200
300
400
500
600
700
800
May 07
Aug 07
Nov 07
Feb 08
May 08
Aug 08
Nov 08
Feb 09
May 09
Aug 09
Nov 09
Feb 10
May 10
Aug 10
Nov 10
Feb 11
May 11
Aug 11
OA
S (i
n ba
sis
poin
ts)
AAAAA
ABBB

Reduce Volatility by Diversifying Across...
• Asset class– Bonds, Common Stock, Convertible Bonds, etc.
• Sector and Industry– US Government, Corporate, Municipal, Structured, etc.
• Issuer based on Creditworthiness– Ratings: AAA, AA, A, BBB, BB, etc.– Consider NAIC Ratings
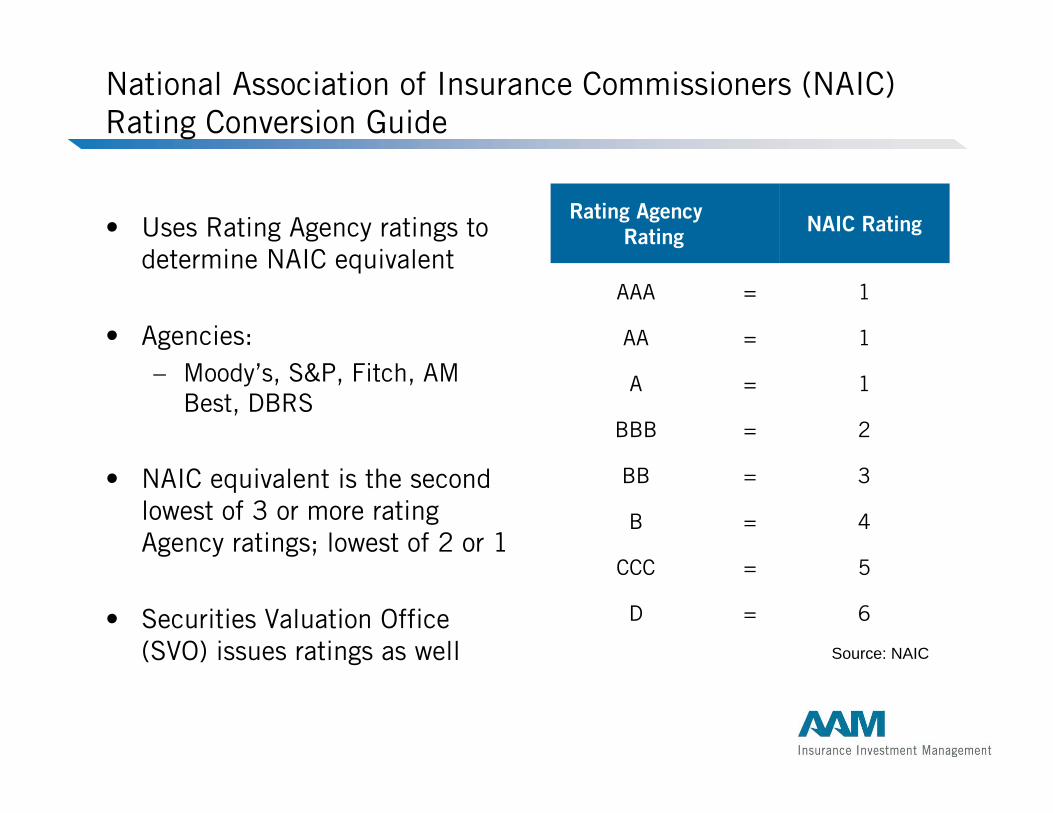
National Association of Insurance Commissioners (NAIC) Rating Conversion Guide
• Uses Rating Agency ratings to determine NAIC equivalent
• Agencies:– Moody’s, S&P, Fitch, AM
Best, DBRS
• NAIC equivalent is the second lowest of 3 or more rating Agency ratings; lowest of 2 or 1
• Securities Valuation Office (SVO) issues ratings as well
6=D
5=CCC
4=B
3=BB
2=BBB
1=A
1=AA
1=AAA
NAIC RatingRating Agency Rating
Source: NAIC
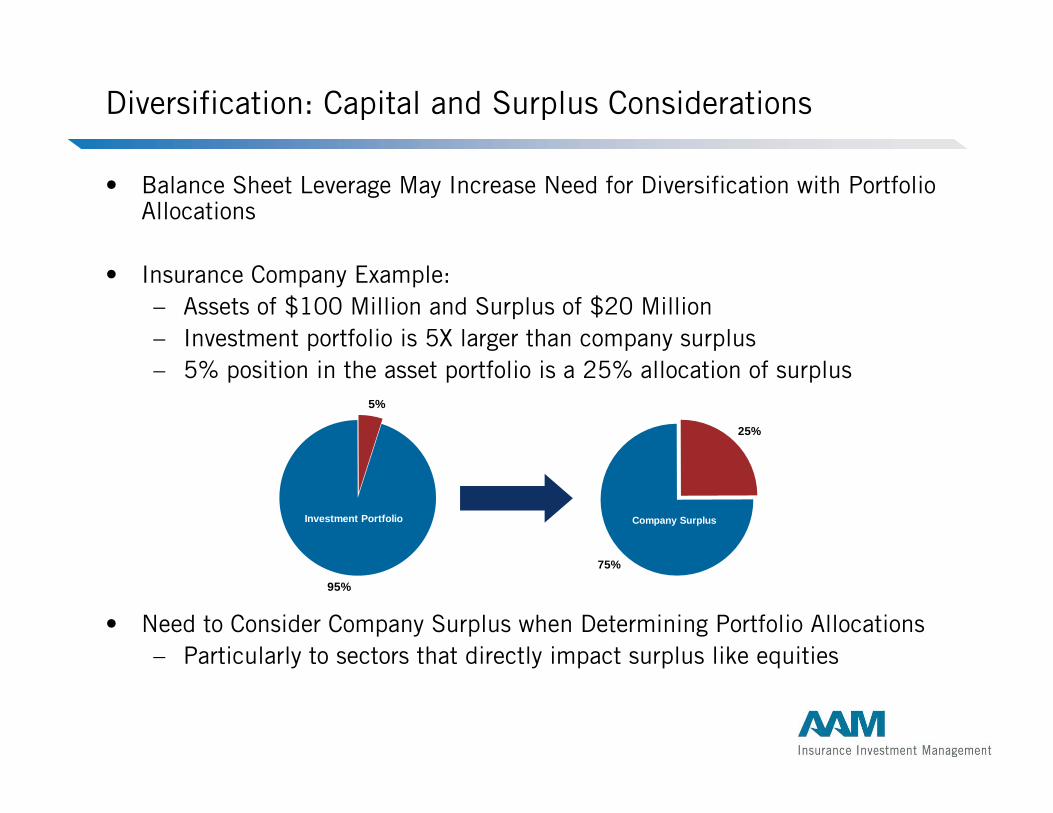
Diversification: Capital and Surplus Considerations
• Balance Sheet Leverage May Increase Need for Diversification with Portfolio Allocations
• Insurance Company Example:– Assets of $100 Million and Surplus of $20 Million– Investment portfolio is 5X larger than company surplus– 5% position in the asset portfolio is a 25% allocation of surplus
• Need to Consider Company Surplus when Determining Portfolio Allocations– Particularly to sectors that directly impact surplus like equities
5%
95%
Investment Portfolio
25%
75%
Company Surplus
Portfolio Benchmark
• Based on portfolio goals, objectives, and constraints
• Tool for measuring success of the investment portfolio strategy and policy
• Performance measurement for comparison should be defined– Total Return / Excess Return– Yield, Duration, etc.
Benchmark Examples
• Broad Market Bond Indexes– Barclays Aggregate Bond Index – Barclays U.S. Government/Credit Index
• Sector Specific Bond Indexes– Barclays Municipal Bond Index– Barclays CMBS Index
• Commercial Mortgage Backed Securities
• Equities: – S&P 500 Index– Russell 3000 Index
• Custom Benchmarks– Built around objectives and constraints defined in the Investment
Policy
Other Considerations for the Investment Policy
• Regulatory Guidelines and Restrictions– Additional constraints of the investment portfolio
• Accounting Considerations– STAT vs. GAAP
• Tax Implications – Gain / Loss Considerations
• Company Directed Restrictions– Prohibiting specific types of investments
• (e.g. alcohol, tobacco, defense)
Investment Portfolio and Policy Review: A Key Step in Shaping an Appropriate Investment Policy

Investment Portfolio and Investment Policy Review
• Monitor and Review Portfolio Performance – Relative to Policy Goals, Objectives, and Constraints– Relative to the defined portfolio benchmark
• Evaluate Portfolio Goals, Objectives, and Constraints to Determine:– If new goals, objectives, and constraints are needed– If the benchmark is still appropriate
• Revise the Investment Policy to reflect any changes
• Rebalance the Investment Portfolio in line with the Investment Policy
• Repeat

Investment Policies Catered to Insurance Companies
Insurance Company Unique Considerations
• Investment portfolio exists to fund liabilities
• Investment objectives differ based on line of business
• Corporate structure may alter investment strategy
• Surplus level helps to determine allocation within the context of risk
• Invested assets typically regulated– Both at the State and Federal level

Property and Casualty vs. Life Insurance Companies
• Property and Casualty
– Liabilities have a shorter life
– Capital gains are realized in the current period
– Underwriting profits have fallen leading to increased reliance on investment income
• Life Insurance
– Liabilities are usually longer in duration
– The IMR exists to realize capital gains over longer time horizon
– Business model relies on an assumed spread above crediting rate
• Yield Focused

Liquidity Management
• Structure the portfolio to produce steady cash flow with a laddered maturity profile
• Short bonds can be sold to provide immediate liquidity– Amortized cost and market value should be closer to par due to bond
amortization
• Provides regular cash flow for operations or reinvestment
Portfolio Expected Cash Flow as a % of Total
0%
2%
4%
6%
8%
10%
12%
14%
16%
18%
2011 2012 2013 2014 2015 2016 2017 2018 2019 2020 2021 2022 2023 2024+
Interest Principal
Liquidity Risks
• Certain types of investments carry larger liquidity risks
• Should be limited in the Investment Policy
• Examples:– Private placement securities– Direct underwritten mortgages– Convertible bonds– Foreign currency denominated issues

Unique Circumstances
Equities and Insurance Company Considerations
• Equities are marked to market through surplus
• Large equity allocation could lead to volatility on the balance sheet and increase the company risk profile
• Equities also carry a larger Risk Based Capital (RBC) charge
– Charge of 15%-45% vs. NAIC 1 Charge of 0.3%-0.4%
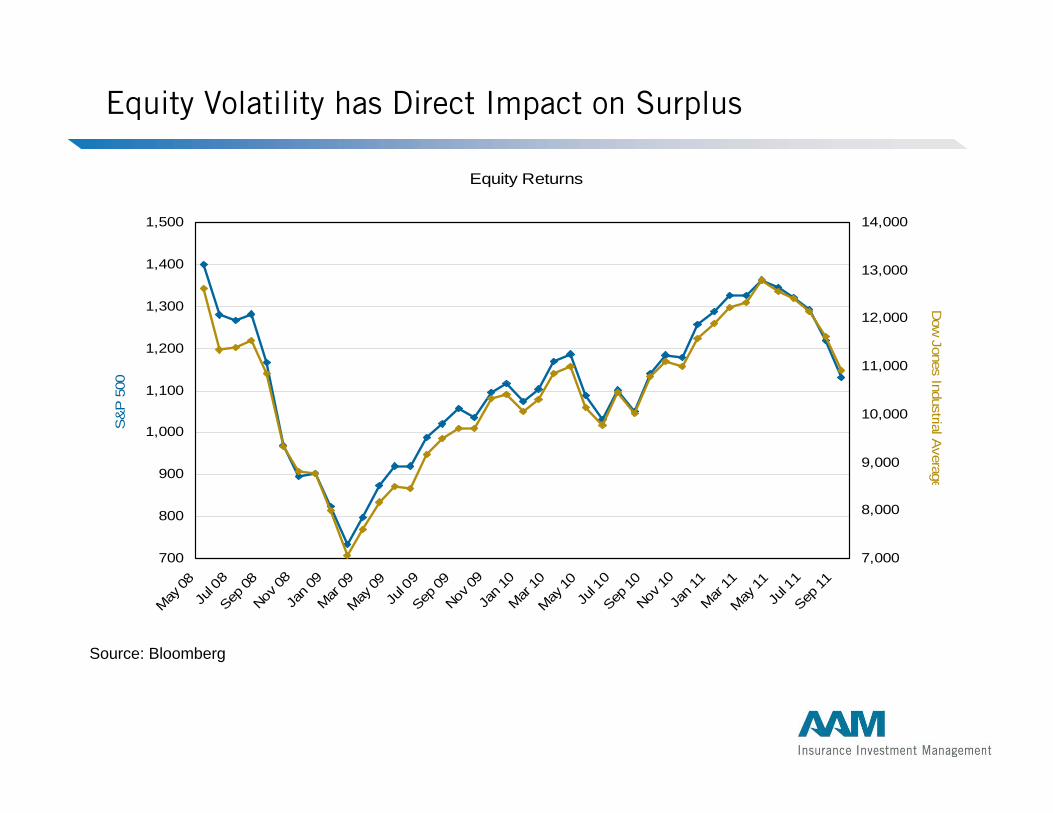
Equity Volatility has Direct Impact on Surplus
Source: Bloomberg
Equity Returns
700
800
900
1,000
1,100
1,200
1,300
1,400
1,500
May 08
Jul 0
8Sep
08Nov
08Ja
n 09
Mar 09
May 09
Jul 0
9Sep
09Nov
09Ja
n 10
Mar 10
May 10
Jul 1
0Sep
10Nov
10Ja
n 11
Mar 11
May 11
Jul 1
1Sep
11
S&
P 5
00
7,000
8,000
9,000
10,000
11,000
12,000
13,000
14,000
Dow
Jones Industrial Average
Derivatives
• Can be used as a tool to hedge various risks– Interest Rate Risk– Foreign Currency Risk
• Tighter regulatory control– Some states require a detailed plan of usage
• Accounting considerations– Mark to market implications
• Derivatives strategies can be complicated – Some of the benefits can be replicated through a well
structured investment portfolio away from derivatives
Summary
• Ideal Investment Policies include....
– Clearly defined portfolio goals, objectives, and constraints
– Defined responsibilities
– Diversification implied through allocation maximums
– Portfolio benchmark to measure performance
– Stated review period

Questions??
Greg Curran, CFAVice President, Business [email protected]
Who Are We?
Michael Kelch, CFAPortfolio [email protected]
AAM – Insurance Investment Management30 N LaSalle, Suite 3500Chicago, IL 60602
Reproduction or use of these materials for any other purpose or by or for any individuals is strictly prohibited. The information contained in this presentation has been obtained from sources that AAM believes to be reliable, but AAM does not represent or warrant that it is accurate or complete. The views in this presentation are those of AAM and are subject to change, and AAM has no obligation to update its opinions or the information in this presentation. Neither AAM, nor any of their respective officers, directors, members, or employees accepts any liability whatsoever for any direct or consequential loss arising from any use of this presentation or its contents. The securities discussed in this presentation may not be suitable for all investors. The value of and income from any investment may fluctuate from day to day as a result of changes in relevant economic markets (including changes in market liquidity). The information in this presentation is not intended to predict actual results, which may differ substantially from those reflected. Past performance is not necessarily indicative of future results.
AAM is a SEC-registered investment advisor that exclusively manages fixed income investment portfolios
for insurance companies. AAM manages 100 insurance client relationships with $15.5 billion in assets
under management. In addition to consistent investment performance, AAM offers exceptional value to
insurance companies with services such as Dynamic Tax Analysis, Dynamic ALM modeling, and Schedule
D Reporting. AAM is also committed to delivering the highest level of proactive client service to our
insurance clients.