ias 2011_ abstract # wepdb0102 sustained efficacy and tolerability of raltegravir after 240 weeks of...
TRANSCRIPT

IAS 2011_ Abstract # WEPDB0102
Sustained Efficacy and Tolerability Sustained Efficacy and Tolerability of Raltegravir after 240 Weeks of of Raltegravir after 240 Weeks of Combination ART in Treatment-Combination ART in Treatment-Naive HIV-1 Infected Patients: Naive HIV-1 Infected Patients: Final Analysis of Protocol 004Final Analysis of Protocol 004
E. Gotuzzo, B.-Y. Nguyen, M. Markowitz, F. Mendo, W. Ratanasuwan, C. Lu, S. Bhanja,
H. Teppler, and the Protocol 004 Part II Study Team
Prepared by Merck Sharp & Dohme Limited02-15 INFC-1022441-0001
Date of preparation: February 2013
Prescribing information can be found on the final slide.

IAS 2011_ Abstract # WEPDB0102
2
BACKGROUNDBACKGROUND
• Raltegravir (RAL), an inhibitor of HIV-1 integrase, is licensed for use in combination regimens for the treatment of HIV infection1.
• Week 156 data from Phase III studies in treatment-naïve2 and treatment-experienced3 patients have demonstrated potent efficacy and good overall tolerability.
• Protocol 004 (P004) is a Phase II study of RAL vs efavirenz (both with tenofovir/3TC) in treatment-naïve patients that has demonstrated sustained efficacy and good general tolerability up to Week 1924.
• This poster presents final data from P004, through 240 weeks (5 years) of treatment, including:– Exploratory analysis: relationship between early viral
load decline and long-term change in CD4 counts

IAS 2011_ Abstract # WEPDB0102
3
METHODSMETHODS

IAS 2011_ Abstract # WEPDB0102
4
Study DesignStudy Design
• Key inclusion criteria– No prior ART– HIV RNA ≥ 5000 copies/mL and susceptible to EFV,
TDF, 3TC– CD4 ≥ 100 cells/mm3
• Dosing:– Weeks 0-48 were dose ranging:
• RAL given at 100, 200, 400 or 600 mg BD *• Doses could not be differentiated at 48 weeks
– After Week 48, all RAL groups received 400 mg BD – All RAL data post-48 weeks shown as single group
(N=160)
* Licensed indicated dose = 400mg BD

IAS 2011_ Abstract # WEPDB0102
5
Overall AnalysisOverall Analysis
• Hypothesis: RAL + TDF/3TC will be generally well tolerated, with antiretroviral activity similar to EFV + TDF/3TC
• Endpoints:– HIV RNA, CD4 counts, adverse events– Exploratory: change in serum lipids
• Time points: – Week 24 primary, Weeks 48 and 96 secondary– Weeks 144 and 192 exploratory– Week 240 is the final, end-of-study time point

IAS 2011_ Abstract # WEPDB0102
6
Exploratory AnalysisExploratory Analysis
• Rationale: earlier HIV suppression by RAL vs EFV was observed in P004 and P0215; impact of early suppression on long-term outcomes is of interest
• Relationship between early decrease in vRNA and later increase in CD4-cell count was explored using observed failure (OF) approach– Linear regression model of CD4 cell count at each
annual time point through Week 240 included the following among model predictors:
• Baseline CD4 cell count• Week 8 HIV RNA log decrease• Treatment group

IAS 2011_ Abstract # WEPDB0102
7
RESULTSRESULTS

IAS 2011_ Abstract # WEPDB0102
8
Baseline Characteristics / Patient StatusBaseline Characteristics / Patient StatusRAL + TDF/3TC EFV + TDF/3TC
Baseline Characteristics
# Patients Treated N = 160 N = 38
Mean age, yrs 36 36
% Male 80 76
% Non-White 69 68
HIV RNA, copies/mL† (log10cp/mL) 55266 (4.7) 67554 (4.8)
Mean CD4 count, cells/uL 305 280
% with AIDS ‡ 34 37
Patient Status (Week 240)
Completed study 116 (72%) 26 (67%)
Discontinued study 44 (27%) 12 (31%)
Lack of efficacy 4 (3%) 2 (5%)
Adverse event 4 (3%) 1 (3%)
Withdrew consent 10 (6%) 4 (11%)
Lost to follow-up 8 (5%) 3 (8%)
Other reasons 18 (11%) 2 (5%)† geometric mean, ‡ Defined as history of clinical diagnosis of AIDS at baseline.

IAS 2011_ Abstract # WEPDB0102
9
160 160 160 160 159 159 158 159 160 159 16038 37 38 38 38 38 38 38 38 38 38
llmk0518p4Hit400ncCombinewk240 June 8, 2011
MK-0518 CombinedEfavirenz 600 mg q.d.
0 24 48 72 96 120 144 168 192 216 240
Weeks
0
20
40
60
80
100
Percent of P
atients with
HIV
RN
A <400 C
opies/mL
Number of Contributing Patients
*
Week 240 (OF approach):RAL 93% EFV 81%
Patients with HIV RNA < 400 copies/mL (NC=FPatients with HIV RNA < 400 copies/mL (NC=F††))
*After Week 48 patients in all RAL groups continued at 400 mg BD. All patients received TDF/3TC.† Non-completer equals failure (NC=F) approach treats all discontinuations as failures.
65.8%
71.9%

IAS 2011_ Abstract # WEPDB0102
10
160 160 160 160 159 159 158 159 160 159 16038 37 38 38 38 38 38 38 38 38 38
llmk0518p4Hit50ncCombinewk240_color June 8, 2011
MK-0518 CombinedEfavirenz 600 mg q.d.
0 24 48 72 96 120 144 168 192 216 240
Weeks
0
20
40
60
80
100
Percent of P
atients with
HIV
RN
A <50 C
opies/mL
Number of Contributing Patients
*
Patients with HIV RNA < 50 copies/mL (NC=FPatients with HIV RNA < 50 copies/mL (NC=F††))
Week 240 (OF approach): RAL 89% EFV 77%
*After Week 48 patients in all RAL groups continued at 400 mg BD. All patients received TDF/3TC.† Non-completer equals failure (NC=F) approach treats all discontinuations as failures.
63.2%
68.8%

IAS 2011_ Abstract # WEPDB0102
11
Number of Contributing PatientsNumber of Contributing Patients(NC=F(NC=F†† Approach) Approach)
† Non-completer equals failure (NC=F) approach treats all discontinuations as failures.
Week 0 24 48 72 96 120 144 168 192 216 240
160 160 160 160 159 159 158 159 160 159 16038 37 38 38 38 38 38 38 38 38 38
llmk0518p4Hit400ncCombinewk240 June 8, 2011
MK-0518 CombinedEfavirenz 600 mg q.d.
0 24 48 72 96 120 144 168 192 216 240
Weeks
0
20
40
60
80
100
Percent of P
atients with
HIV
RN
A <400 C
opies/mL
Number of Contributing Patients

IAS 2011_ Abstract # WEPDB0102
12
0
50
100
150
200
250
300
350
Ch
an
ge
fro
m B
ase
line
in C
D4
Ce
ll C
ou
nt
0 24 48 72 96 120 144 168 192 216 240
Weeks
-3
-2
-1
0
Change f
rom
Baselin
e
in H
IV R
NA
(Log
10 C
opie
s/m
L)
Change from Baseline: CD4 and HIV RNAChange from Baseline: CD4 and HIV RNA (OF(OF‡‡))
*After Week 48 patients in all RAL groups continued at 400 mg b.i.d. All patients also received TDF/3TC.‡ Observed Failure (OF) approach: only discontinuations due to lack of efficacy are counted as failures.
*
Weeks160 155 153 146 143 138 134 129 129 121 12338 38 36 36 35 33 34 32 32 31 31
llmk0518p4CD4obsCombinewk240_color June 8, 2011
MK-0518 CombinedEfavirenz 600 mg q.d.
0 24 48 72 96 120 144 168 192 216 240
Weeks
0
50
100
150
200
250
300
350
Change from
Baseline
in CD
4 Cell C
ount
Number of Contributing Patients
301.7
275.6
-2.29
-2.07

IAS 2011_ Abstract # WEPDB0102
13
Treatment-Emergent Mutations Treatment-Emergent Mutations in Patients with Virologic Failurein Patients with Virologic Failure
• Virologic failure occurred in 10 (6%) of RAL patients and 5 (13%) of EFV patients
• Integrase genotype data available for 8 RAL patients with virologic failure– Known RAL resistance mutations in 3 of 8 (38%):
• N155H (n=2) and Y143C (n=1)• All 3 also resistant to 3TC; one also resistant to TDF
– No evidence of RAL resistance in 5 of 8 (62%):• 4 had no evidence of resistance to 3TC or TDF• One showed resistance to 3TC only

14
Most Common* Drug-Related Adverse EventsMost Common* Drug-Related Adverse Events
Since week 192, one new report of abnormal dreams in RAL group; no changes in EFV group.
RAL (N=160)
%
EFV (N=38)
%
Diarrhoea 6.9 10.5
Nausea 12.5 10.5
Dizziness 8.1 26.3
Headache 8.8 23.7
Abnormal Dreams 6.9 18.4
Insomnia 8.1 13.2
Nightmares 0 10.5
RAL taken twice daily; EFV taken once daily; both with TDF/3TC.
* Incidence at least 10% in either treatment group; all intensity levels included.
IAS 2011_ Abstract # WEPDB0102
15
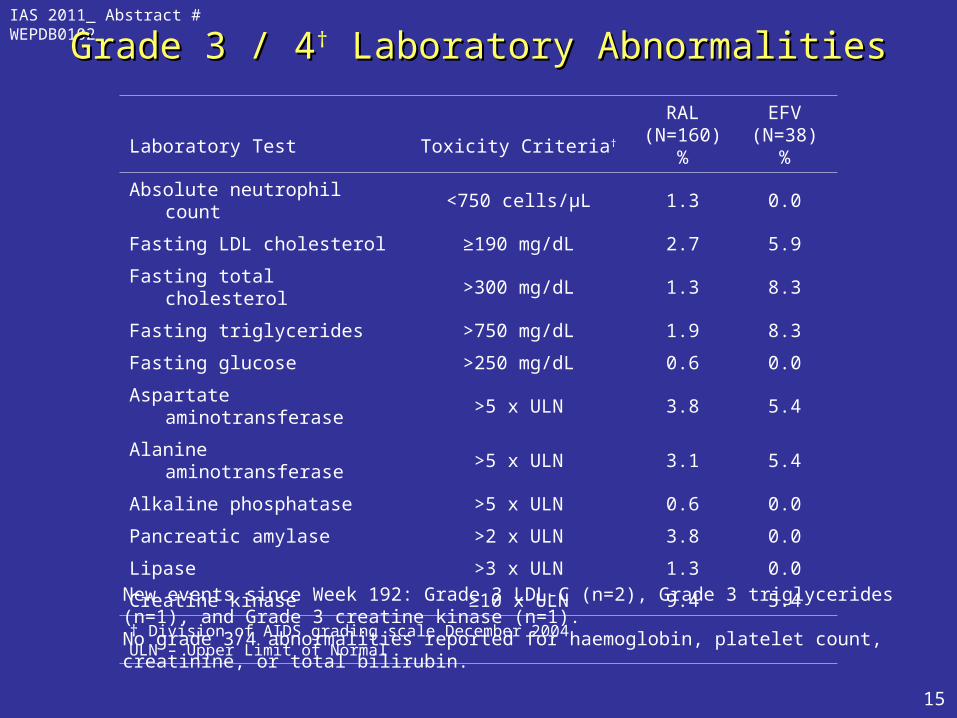
Grade 3 / 4Grade 3 / 4† Laboratory Abnormalities Laboratory Abnormalities
Laboratory Test Toxicity Criteria†
RAL(N=160)
%
EFV(N=38)
%
Absolute neutrophil count <750 cells/µL 1.3 0.0
Fasting LDL cholesterol ≥190 mg/dL 2.7 5.9
Fasting total cholesterol >300 mg/dL 1.3 8.3
Fasting triglycerides >750 mg/dL 1.9 8.3
Fasting glucose >250 mg/dL 0.6 0.0
Aspartate aminotransferase >5 x ULN 3.8 5.4
Alanine aminotransferase >5 x ULN 3.1 5.4
Alkaline phosphatase >5 x ULN 0.6 0.0
Pancreatic amylase >2 x ULN 3.8 0.0
Lipase >3 x ULN 1.3 0.0
Creatine kinase ≥10 x ULN 9.4 5.4
† Division of AIDS grading scale December 2004ULN – Upper Limit of Normal
New events since Week 192: Grade 3 LDL-C (n=2), Grade 3 triglycerides (n=1), and Grade 3 creatine kinase (n=1).No grade 3/4 abnormalities reported for haemoglobin, platelet count, creatinine, or total bilirubin.

16
Serum Lipids: Mean Change from Baseline Serum Lipids: Mean Change from Baseline (mg/dL) at Week 240(mg/dL) at Week 240
RAL* (N=160) EFV (N=38)
Baseline Mean
Mean Change
(SD)Baseline
Mean
Mean Change
(SD)RAL vs
EFV
Cholesterol 4.29 0.30 (0.95) 4.45 0.68 (0.62) P=0.014
LDL-C 2.7 0.05 (0.82) 2.89 0.19 (0.54) P=0.302
HDL-C 0.98 0.19 (0.26) 1.01 0.37 (0.35) P=0.024
Triglycerides 1.46 0.05 (1.23) 1.28 0.26 (0.62) P=0.213
Total: HDL ratio 4.38 -0.4 (1.4) 4.41 -0.69 (1.1) P= 0.722
* All RAL dose groups combined; all patients also received TDF/3TC.
Greater increase in total cholesterol and HDL-C in EFV group than in RAL group.

IAS 2011_ Abstract # WEPDB0102
17
Safety Summary: Week 240Safety Summary: Week 240
• Overall adverse event (AE) profiles generally similar for RAL and EFV– Similar frequencies reported at Weeks 1924 and 240
• Drug-related clinical AEs – less common with RAL than EFV: 55% vs 76%
(p=0.017)
• Neuropsychiatric symptoms*– Most occurred by Week 48– At Week 240: 38% for RAL vs 63% for EFV
*Abnormal dreams, adjustment disorder with depressed mood, depressed mood, depression, dizziness, insomnia, nightmare, psychotic disorder, somnolence, suicidal ideation, suicide attempt.

IAS 2011_ Abstract # WEPDB0102
18
Safety Summary (cont.)Safety Summary (cont.)
• Malignancies† – 3.1% (5/160 pts) in RAL group, none considered
drug-related – 2.6% (1/38 pts) in EFV group, 1 event (GI carcinoma)
possibly drug-related
• Grade 3 / 4 lab abnormalities uncommon– Similar frequencies reported at Weeks 1924 and 240
• Minimal effect of RAL on serum lipids† Cases included: in RAL group: 1 pt with B-cell lymphoma, 2 pts with Kaposi’s sarcoma, 1 pt with basal cell carcinoma and squamous cell carcinoma (SC), and 1 pt with non-small cell lung carcinoma; in EFV group: 1 pt with gastrointestinal carcinoma (possibly drug-related) and SC.

19
Exploratory Analysis: Prognostic Factors Associated Exploratory Analysis: Prognostic Factors Associated With CD4 Cell Count at Yearly Time PointsWith CD4 Cell Count at Yearly Time Points
Prognostic FactorP-value†
Wk 48 Wk 96 Wk 144 Wk 192 Wk 240
Baseline CD4 cell count (cells/mm3)
<0.0001 <0.0001 <0.0001 <0.0001 <0.0001
Week 8 HIV RNA decline (log10 copies/mL)
0.0005 <0.0001 <0.0001 <0.0001 <0.0001
Treatment Group 0.2887 0.3592 0.9778 0.6421 0.6057
† p-Value calculated from a linear regression model with CD4 cell count separately at each time point as the dependent variable adjusted for baseline CD4 cell count (c/mm3), Week 8 HIV RNA decline (log10 copies/mL) and treatment group.
Significant predictors for CD4 cell count (at 0.05 critical value) at each time point were: (1) baseline CD4 count and (2) log HIV RNA decline at week 8.
20
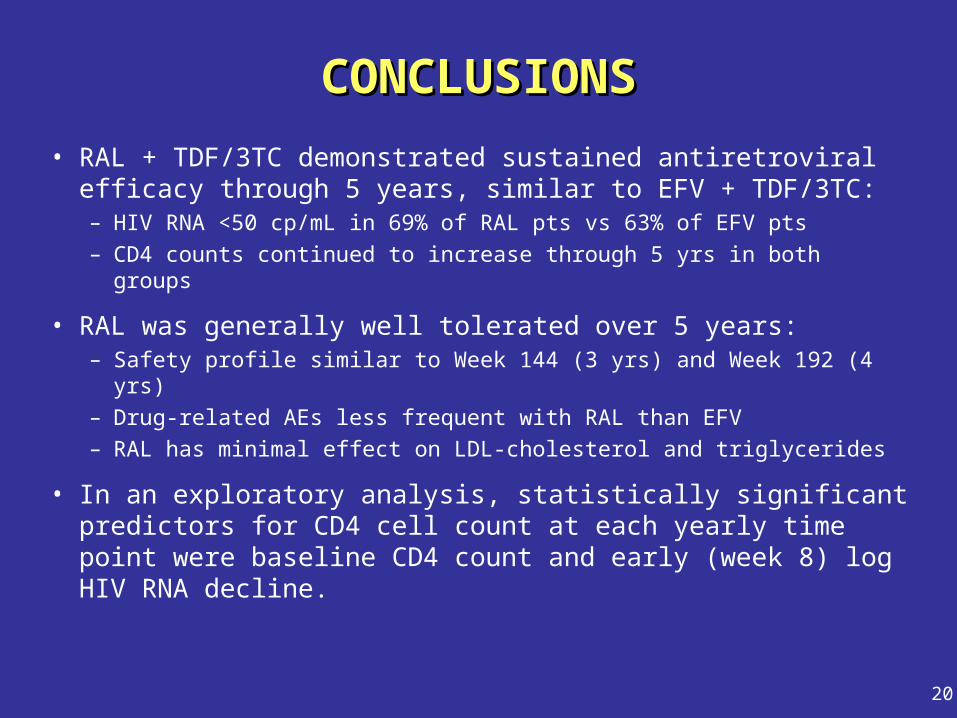
CONCLUSIONSCONCLUSIONS
• RAL + TDF/3TC demonstrated sustained antiretroviral efficacy through 5 years, similar to EFV + TDF/3TC:– HIV RNA <50 cp/mL in 69% of RAL pts vs 63% of EFV pts– CD4 counts continued to increase through 5 yrs in both groups
• RAL was generally well tolerated over 5 years:– Safety profile similar to Week 144 (3 yrs) and Week 192 (4 yrs)– Drug-related AEs less frequent with RAL than EFV– RAL has minimal effect on LDL-cholesterol and triglycerides
• In an exploratory analysis, statistically significant predictors for CD4 cell count at each yearly time point were baseline CD4 count and early (week 8) log HIV RNA decline.

21
ReferencesReferences
(1) ISENTRESS (raltegravir) Prescribing Information, 2010.
(2) J. Rockstroh et al., 18th Conference on Retroviruses and Opportunistic Infections, Feb 2011, Abstract #K-135.
(3) J. Eron et al., 17th Conference on Retroviruses and Opportunistic Infections, Feb 2010, Abstract #K-128.
(4) E. Gotuzzo et al., 17th Conference on Retroviruses and Opportunistic Infections, Feb 2010, Abstract #K-127.
(5) J. Lennox et al., Lancet 2009;374:796-806.