ian walker - university of bathopus.bath.ac.uk/37890/1/walker_2013.pdf · ian walker department of...
TRANSCRIPT
The influence of a bicycle commuter’s appearance on drivers’ overtaking proximities: An
on-road test of bicyclist stereotypes, high-visibility clothing and safety aids in the United
Kingdom
Ian Walker
Department of Psychology, University of Bath
Ian Garrard
Felicity Jowitt
Brunel Institute for Bioengineering, Brunel University
Revised following peer review
Accepted for publication in Accident Analysis and Prevention. If you want to cite this paper in
an academic publication, please check a literature database, or contact Ian Walker
([email protected]), to get the proper citation
1

ABSTRACT
This study looked at whether drivers overtaking a bicyclist changed the proximities of their passes
in response to the level of experience and skill signalled by the bicyclist’s appearance. Five outfits
were tested, ranging from a stereotypical sport rider’s outfit, portraying high experience and skill, to
a vest with ‘novice cyclist’ printed on the back, portraying low experience. A high-visibility
bicycling jacket was also used, as were two commercially available safety vests, one featuring a
prominent mention of the word ‘police’ and a warning that the rider was video-recording their
journey, and one modelled after a police officer’s jacket but with a letter changed so it read
‘POLITE’. An ultrasonic distance sensor recorded the space left by vehicles passing the bicyclist on
a regular commuting route. 5690 data points fulfilled the criteria for the study and were included in
the analyses. The only outfit associated with a significant change in mean passing proximities was
the police/video-recording jacket. Contrary to predictions, drivers treated the sports outfit and the
‘novice cyclist’ outfit equivalently, suggesting they do not adjust overtaking proximity as a function
of a rider’s perceived experience. Notably, whilst some outfits seemed to discourage motorists from
passing within 1 metre of the rider, approximately 1-2% of overtakes came within 50 cm no matter
what outfit was worn. This suggests there is little riders can do, by altering their appearance, to
prevent the very closest overtakes; it is suggested that infrastructural, educational or legal measures
are more promising for preventing drivers from passing extremely close to bicyclists.
Keywords: bicyclists, bicycling, overtaking, proximity, stereotypes, experience, high-visibility
2
The influence of a bicycle commuter’s appearance on drivers’ overtaking proximities: An
on-road test of bicyclist stereotypes, high-visibility clothing and safety aids in the United
Kingdom
Bicycling is a generally safe activity, providing increases in fitness and life expectancy thanks to the
regular integrated exercise it provides (Andersen, Schnor, Schroll & Hein, 2000; British Medical
Association, 1992; Tuxworth, Nevill, White & Jenkins, 1986; World Health Organization, 2013).
However, avoidable collisions do occur when bicyclists must mix with motorists on the road.
Although the most likely type of collision to befall a bicyclist involves being hit by a motorist who
is turning their vehicle into or out of a junction (Stone & Broughton, 2003), collisions where
bicyclists are struck by an overtaking motorist are disproportionately dangerous to riders – probably
because, unlike at junctions, vehicles are often travelling at higher speeds (McCarthy & Gilbert,
1996; Pai, 2011; Stone & Broughton, 2003; Transport for London, 2005). In addition, even when
overtaking drivers do not collide with riders, close-passing motor vehicles can create a subjective
experience of being unsafe that is a disincentive to travel by bicycle (Guthrie, Davies & Gardner,
2001; Parkin, Wardman & Page, 2007). Given these two issues, the topic of what affects the space
left by passing drivers, and what bicyclists, drivers or policy-makers might do about this, is an
important field of study.
Walker (2007) used an ultrasonic distance sensor to measure the space left by motorists as
they overtook a bicycle in two United Kingdom cities. That study showed effects of the bicyclist’s
lateral road position, helmet wearing and gender on the space left by passing drivers – drivers left
less space when the bicyclist rode towards the centre of the lane or was wearing a helmet, and left
more space when he wore a long wig so that he appeared to be a woman (an effect later replicated
with real women by Florida Department of Transportation, 2011, and Chuang, Hsu, Lai, Doong &
Jeng, 2013, in the United States and Taiwan respectively). Walker’s study also showed that longer
vehicles – buses and heavy goods vehicles – tended to get closer on average when passing the
bicycle, a finding replicated by Parkin and Meyers (2010). Given this last finding, it is notable that
Pai (2011) recently found long vehicles were particularly associated with bicycle overtaking
collisions in United Kingdom police accident records, as did Kim, Kim, Ulfarsson and Porello
(2007) with American data, suggesting indirectly that closer proximities measured on the road
(Parkin & Meyers, 2010; Walker, 2007) might indeed translate into real collisions (Pai, 2011).
Chuang et al.’s (2013) finding of decreased rider stability during a lengthy overtake even hints at
one possible mechanism for this. Since Walker’s study, there has been a certain amount of interest
in the subject of how bicycle helmets affect bicyclists’ and non-bicyclists’ perceptions of risk
3
(Curnow, 2008; Fyhri, Bjornskau & Backer-Grondahl, 2012; Pucher & Buehler, 2008) and how
close drivers will pass bicyclists on the road (Chapman & Noyce, 2012; Chuang et al., 2013; Love
et al., 2012; Parkin and Meyers, 2010) – an issue which has even been expanded to drivers passing
horse riders (Chapman & Musselwhite, 2011).
To explain the closer passing proximities seen when wearing a helmet, Walker (2007)
referred to a study of bicyclist stereotypes from Basford, Reid, Lester, Thomson and Tolmie (2002),
which found people often took helmets to be a sign of a bicyclist’s experience and control. Quotes
from their qualitative study included “Pictures of cyclists wearing helmets were generally
considered to be more serious and sensible on the road than those without” (p. 9), “it was felt that
people who had arranged appropriate and/or specialist cycling equipment and clothing were more
likely to have also the experience and/or training to employ correct cycling behaviour” (p. 9) and
“The ‘proper kit’ [for a responsible cyclist] was deemed to include wearing a helmet” (p. 9). Based
on these claims, Walker hypothesized that motorists in his study might have taken the helmet as a
sign of experience, control or skill, and accordingly felt able to pass closer when the rider was
helmeted. It is this notion of perceived rider ability, as judged from a rider’s appearance, that is
explored further here.
This question of how drivers might use a bicyclist’s appearance to judge their abilities fits
nicely with two recent studies of stereotypes, which both suggest that many people recognize only a
few broad and visually distinctive categories of rider. Gatersleben and Haddad (2010) gave
participants a large set of attributes about bicyclists and asked them to rate the attributes for how
characteristic they were of the typical bicyclist they encountered on the road. The attributes referred
to bicyclists’ appearances or behaviour (‘wears Lycra’, ‘abides by the rules of the road’),
motivations (‘bicycles to keep fit’), demographics (‘is male’, ‘is young’) and personalities (‘worries
a lot’). Factor analysis of these responses, to examine which attributes were rated similarly by
participants, revealed four fairly clear (Chronbach α = .72 – .83) stereotypes of bicyclists:
(1) a ‘responsible’ bicyclist type, defined primarily by their courtesy to others, strong adherence
to the rules of the road and traffic signals, and their use of lights and helmets;
(2) a ‘lifestyle’ bicyclist type, who wears a helmet and Lycra, who belongs to a bicycling club
and who rides an expensive bicycle for the adrenaline rush and to keep fit;
(3) a ‘commuter’ bicyclist type who is probably a well-educated man cycling for utilitarian
purposes whatever the weather; and
(4) a ‘hippy-go-lucky’ bicyclist type who is likely to be a sociable woman who uses a bicycle
with a basket on the front for shopping.
These are clearly broad stereotypes, but as Gatersleben and Haddad’s methodology seems
4
sound, they likely reflect some reality of bicyclist types understood or recognized by road users in
the United Kingdom – they are likely, in other words, to represent shared mental models,
prototypes, or stereotypes of bicyclists. (Although given the factor structure for their ‘responsible’
bicyclist shows no significant loadings for motivational or demographic items, and therefore says
nothing about who these people are or why they cycle, it is tempting to suggest that this reflects an
idealized meek cyclist who will stay out of people’s way more than a class of people actually
encountered in real settings!)
The idea that people understand broad stereotypes of bicyclists is further supported by
Musselwhite et al.’s (2010) qualitative study of road safety discussions. Musselwhite et al.’s
participants described three classes of bicyclist – professionals (such as couriers), commuters and
leisure riders – although discussions about these classes showed some nuances: it was recognized,
for example, that amongst the commuters there will be a difference between those who cycle all
year round and ‘fair-weather’ bicyclists who might have less riding experience. Musselwhite et al.
cited an earlier sociological study by Jensen (1999) which similarly grouped bicyclists into three
categories, although this time based on their reasons for bicycling rather than other people’s
perceptions: users of the heart, users of convenience and users of necessity. As Musselwhite et al.
note, it might be possible to map Jensen’s groups onto the kind of stereotypes being described here,
which is an interesting exercise as it reveals the extent to which there might be concordance
between bicyclists’ motives and the motives recognized by observers. Jensen’s ‘users of the heart’
map very clearly onto Musselwhite’s leisure riders and Gatersleben and Haddad’s ‘lifestyle’ type –
these are the people passionate about bicycling and who do it for pleasure in a serious manner; and
her ‘users of convenience’ map onto Musselwhite’s and Gatersleben and Haddad’s ‘commuter’
categories quite clearly. However, Jensen’s final category – ‘users of necessity’, which involves
people bicycling because they lack alternatives – are not really seen in either Musselwhite et al.’s or
Gatersleben and Haddad’s studies. This potentially reveals an interesting mismatch between the
reasons people really cycle and the reasons attributed to them by observers.
In summary, then, the literature shows that some shared ideas might exist about bicyclist
stereotypes. Given that Walker (2007) previously showed that the simple visible cue of wearing a
helmet, which is a component of some of these stereotypes, was associated with changes in
motorists’ passing behaviour – and given studies such as Davies (2009), which showed the
influence of stereotypes on people’s judgements in other traffic situations – the present study
explored a range of bicyclist outfits with the aim of more clearly signalling different ‘types’ of rider.
The intention was to see whether, as Walker (2007) predicted, this might affect the space left by
passing drivers, with less space afforded to a bicyclist whose outfit made them look more
5
experienced or skilled. The underlying framework is one in which stereotypes are used as fast
short-cuts to behavioural selection (McGarty, Yzerbyt & Spears, 2002), with drivers rapidly
recognizing the bicyclist as belonging to one of relatively few categories, making inferences about
their level of experience and likely behaviour based on this, and adjusting their overtaking
manoeuvre accordingly. This is not to say motorists’ perceptions will necessarily be accurate or
their responses appropriate – in reality it is unlikely a rider’s level of experience or control could
ever be gauged accurately from their appearance, nor that all riders fall neatly into a small number
of types – but rather is simply to suggest that overtaking behaviour will be modified to some extent
based on the rider’s appearance in a way that is consistent with shared beliefs.
METHOD
Design
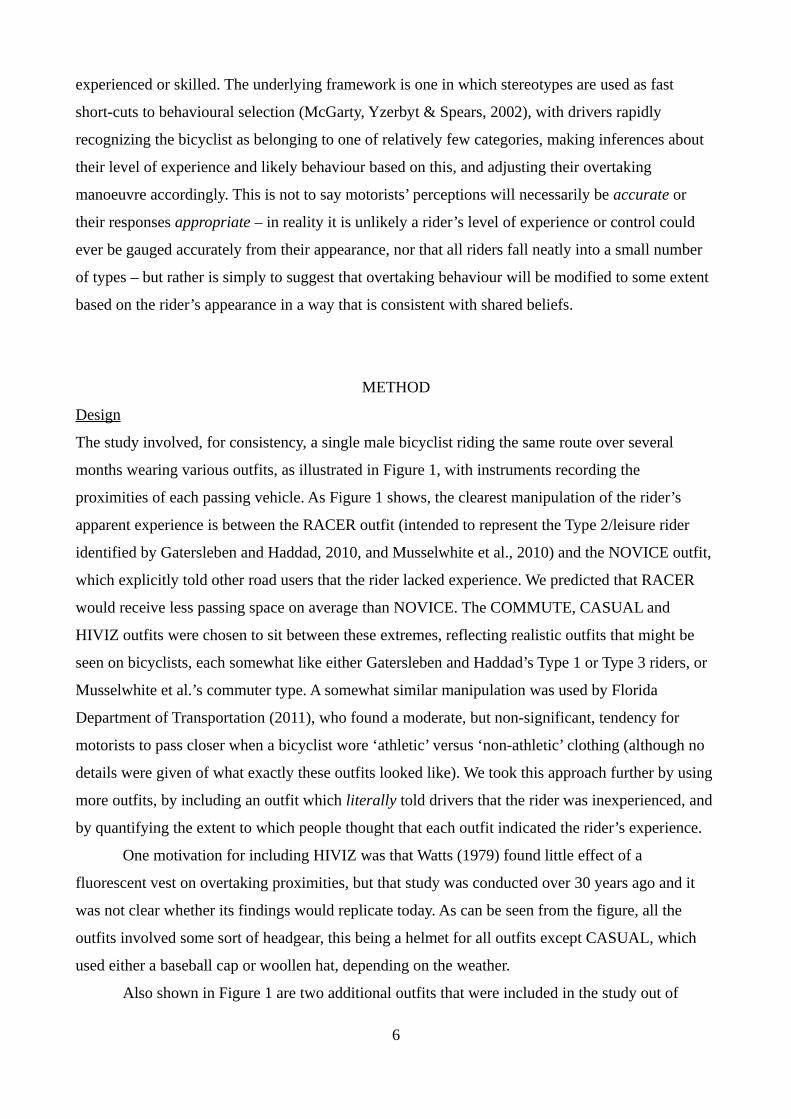
The study involved, for consistency, a single male bicyclist riding the same route over several
months wearing various outfits, as illustrated in Figure 1, with instruments recording the
proximities of each passing vehicle. As Figure 1 shows, the clearest manipulation of the rider’s
apparent experience is between the RACER outfit (intended to represent the Type 2/leisure rider
identified by Gatersleben and Haddad, 2010, and Musselwhite et al., 2010) and the NOVICE outfit,
which explicitly told other road users that the rider lacked experience. We predicted that RACER
would receive less passing space on average than NOVICE. The COMMUTE, CASUAL and
HIVIZ outfits were chosen to sit between these extremes, reflecting realistic outfits that might be
seen on bicyclists, each somewhat like either Gatersleben and Haddad’s Type 1 or Type 3 riders, or
Musselwhite et al.’s commuter type. A somewhat similar manipulation was used by Florida
Department of Transportation (2011), who found a moderate, but non-significant, tendency for
motorists to pass closer when a bicyclist wore ‘athletic’ versus ‘non-athletic’ clothing (although no
details were given of what exactly these outfits looked like). We took this approach further by using
more outfits, by including an outfit which literally told drivers that the rider was inexperienced, and
by quantifying the extent to which people thought that each outfit indicated the rider’s experience.
One motivation for including HIVIZ was that Watts (1979) found little effect of a
fluorescent vest on overtaking proximities, but that study was conducted over 30 years ago and it
was not clear whether its findings would replicate today. As can be seen from the figure, all the
outfits involved some sort of headgear, this being a helmet for all outfits except CASUAL, which
used either a baseball cap or woollen hat, depending on the weather.
Also shown in Figure 1 are two additional outfits that were included in the study out of
6

curiosity, rather than specifically to test perceived experience, labelled here POLICE and POLITE.
The POLICE outfit was the same as COMMUTE but with the addition of a vest that had been sold
with a video camera marketed to bicyclists by a company called policewitness.com. As can be seen
in Figure 1, this carried a message to approaching drivers saying ‘POLICEwitness.com – move over
– camera cyclist’. We were interested to see whether this invocation of the term ‘police’, and the
implied threat of evidence gathering, would affect drivers’ behaviour. The final condition used a
commercially available vest which carried the message ‘POLITE notice – please slow down’. The
intention of this vest, particularly with its characteristic blue and white checked bands, is clearly to
invoke an image of the police, and we were interested to see what effect this would have.
COMMUTE CASUAL HIVIZ RACER NOVICE POLICE POLITE
Experience 5.04 (1.26) 4.15 (1.25) 4.83 (1.37) 5.82 (1.20) 2.09 (1.12) 5.24 (1.48) 4.72 (1.38)
Skill 4.85 (1.21) 4.02 (1.20) 4.58 (1.27) 5.69 (1.20) 2.42 (1.07) 4.94 (1.46) 4.56 (1.40)
Wobble 3.11 (1.42) 3.81 (1.37) 3.49 (1.40) 2.62 (1.61) 5.25 (1.57) 3.10 (1.59) 3.44 (1.53)Figure 1 – The seven outfits used in this study, with 269 participants’ mean ratings out of 7
(and standard deviations) for how experienced, skilful and likely to wobble the riders
appeared to be
7

This study gathered data during one of the experimenters’ regular commutes, thereby
studying genuine driver behaviour on real roads. As such, it is important to note that, whilst care
was taken to keep as many variables constant as possible, the study is not a laboratory experiment.
There might be variation in factors such as road width, weather, etc. from one data point to another,
as well as variations that cannot be known, such as driver characteristics. The study does not
attempt to remove these sources of variance, and instead seeks to capture the range of overtaking
proximities that might realistically be seen on a bicycle commute in the south-east of England
during peak traffic hours and, critically, how this range of proximities might change with the rider’s
appearance. To work otherwise would involve studying drivers who are not naïve to the purpose of
the study, and whose behaviour might therefore change to be unrepresentative of their behaviour in
real settings (Walker, 2010).
Equipment
A MaxBotix MB1200 XL-MaxSonar-EZ0 temperature-compensated ultrasonic distance sensor,
which is accurate to within 1 cm, was used to record, at 10 Hz temporal resolution, the closest
object to the right of the bicycle (this study took place in the United Kingdom, where traffic travels
on the left and overtakes on the right). This sensor fed into an Arduino Uno prototyping computer
running specially written software which recorded to an SD card, 10 times per second, the date and
time, the proximity reading from the sensor, and a record of whether or not a button mounted on the
bicycle’s handlebars was pressed (see below). Researchers wishing to conduct a similar experiment
can construct such a unit for approximately €100, and the plans and software needed to do this can
be obtained from the authors, as can software automatically to extract the closest passing proximity
for each vehicle.
The sensor, Arduino and batteries were housed in a small grey plastic box mounted on the
bicycle’s luggage rack, intended to be as inconspicuous as possible. The sensor and software were
calibrated by holding targets at known distances and checking that the proximities recorded were
correct – systematic discrepancies were adjusted in the software before data collection began. After
data collection was complete, a constant was subtracted from all the readings so each measurement
gave the distance between the passing vehicles and the outermost point of the bicycle’s handlebars,
rather than the sensor itself.
Conditions
The outfits used in this study – viewed from behind by overtaking drivers – are illustrated in Figure
1. In more detail, they consisted of:
8
COMMUTE: Plain cycling jersey, plain trousers, reflective cycle clips, Bell commuting
cycle helmet, cycle gloves.
CASUAL: Rugby shirt, plain trousers tucked into socks, woollen hat or baseball cap, plain
gloves, small rucksack.
HIVIZ: Bright yellow reflective cycle commuting jacket, plain trousers, reflective cycle
clips, Bell commuting cycle helmet, cycle gloves.
RACER: Colourful, skin-tight, Tour de France cycle jersey with sponsor logos, Lycra cycle
shorts or tights, sleek race-fitting cycle helmet, cycle gloves.
NOVICE: Yellow reflective vest with words “Novice Cyclist, Pass Slowly”, plain trousers,
reflective cycle clips, Bell commuting cycle helmet, cycle gloves.
POLICE: Yellow reflective vest with words “POLICEwitness.com – Move Over – Camera
Cyclist”, plain trousers, reflective cycle clips, Bell commuting cycle helmet, cycle gloves.
POLITE: Yellow reflective vest with blue and white checked banding and the words
“POLITE notice, Pass Slowly” looking similar to a police jacket, plain trousers, reflective cycle
clips, Bell commuting cycle helmet, cycle gloves.
To check that people saw these outfits as indicating different levels of experience and skill,
an online survey was carried out after the main study was finished, showing the drawings from
Figure 1, one outfit at a time, to 269 participants recruited opportunistically through social media
(Twitter) and snowball sampling. The sample was 67% male with a mean age of 41.17 (SD =
10.19); the general UK population of licensed drivers at that time was 55% male with a mean age of
47.8 (whatdotheyknow, 2013), which is slightly older and less male than our sample, but the sample
nevertheless seems broadly comparable to the wider population. Participants were asked to rate, on
7-point Likert scales, how experienced, skilled and likely to wobble each rider appeared. Higher
ratings indicated greater experience, skill or likelihood of wobbling. These data are shown in Figure
1, where it is clear that, as planned, RACER was judged more experienced (t263 = 38.12, d = 3.26, p
< .001), more skilled (t261 = 33.58, d = 2.87, p < .001) and less likely to wobble (t261 = –18.68, d =
–1.69, p < .001) than NOVICE. The means of the other conditions sit between these two extremes.
Procedure
One of the researchers (IG) collected the data on his usual 26 km (each way) commuting route
between Cookham (Berkshire, United Kingdom) and Uxbridge (outer western London). The route
included a range of road types, with 16% of its length through villages and small towns; 6% on
narrow country lanes used heavily as a ‘rat run’ by commuting drivers; 44% on wider country
roads, similarly used by motor commuters; 6% through quiet residential streets; 19% on busy main
9
roads; and 9% through a busy mixed industrial and housing estate. The journey was made at peak
traffic hours of the morning and evening each day (typically beginning at around 0815 in the
morning and 1730 in the evening) and the time of each ride was deliberately jittered by up to an
hour from day to day in the hope of avoiding encountering the same motorists in the same places.
The same bicycle, a Giant X1200 hybrid, was used for all rides – in part because its appearance was
judged typical for a commuting bicycle.
On each day, the researcher chose one of seven shuffled cards at random to determine which
outfit would be worn for the commute that day. As noted above, the aim was to work in vivo and
record the range of overtakes a commuter in that part of the world might experience, rather than to
carry out a laboratory study, but nevertheless various aspects of the ride were kept within realistic
parameters as listed below. The data recording device included a button on the bicycle handlebars
so the researcher could indicate which overtakes were suitable for analysis with a button-press as a
vehicle passed. The button would insert a flag into the data file next to current readings and would
not be pressed, thereby excluding an overtake from analysis, if the experimenter was riding
unusually or if traffic conditions meant an overtake could be affected by extraneous factors.
Specifically, the button would only be pressed if all the following criteria, decided in advance of the
study, were met:
• The bicycle was travelling at between 16 and 28 kilometres per hour1
• The bicycle was riding in a consistent path at a distance from the kerb between 0.5 and 0.8
metres
• Visibility was good, with daylight, no rain and no fog
• The rider was sitting in the saddle, not standing on the pedals
• There were no nearby on-road complications such as parked cars or an intersection ahead.
The distance from each overtaking event used in the analysis was the lowest proximity reading
within 1 second either side of the moment the button was pressed.
Data were collected between December 2012 and May 2013. There were a few occasions
where technical difficulties or bad weather meant data were only collected on one leg of the return
journey, which is why some conditions have data from odd numbers of rides. Data were analysed
using R version 2.15.1 (R Core Team, 2012).
RESULTS
A total of 5690 overtaking events were suitable for analysis (COMMUTE n = 857 from 11 rides,
1 Sixteen to 28 is relatively broad, but note that the range had to allow for realistic uphill and downhill riding. When not riding on hills speed was usually close to 20 kph.
10

CASUAL n = 779 from 9 rides, HIVIZ n = 737 from 9 rides, RACER n = 852 from 10 rides,
NOVICE n = 807 from 8 rides, POLICE n = 790 from 10 rides, POLITE n = 868 from 10 rides).
The overall mean proximity was 117.50 cm (SD = 30.00, range = 2 cm to 274 cm), which is lower
than the 133 cm mean found by Walker (2007). Although we cannot be certain, it is likely this
difference in part comes about because the 2007 study used almost exclusively urban streets,
whereas the roads here were more mixed. It is also possible there are regional variations between
the south-western cities used in the 2007 study and the outer-London areas studied here. However,
we can be reasonably sure the difference was not an effect of concentrating on peak commuter
hours in this study. We explain this by noting that Walker (2006) found that overtaking proximities
increased linearly across the day, such that evening peak-time overtakes were substantially more
distant than morning peak-time overtakes (see also Kim et al., 2007). This would suggest that
focusing on peak times would not necessarily decrease mean passing proximities, provided both
evening and morning peaks were included, as the tendency for morning overtakes to be close will
be balanced by the tendency for evening overtakes to be more distant.
Incidentally, over 30 years earlier, Watts (1979) measured drivers overtaking bicyclists in the
same area as we did in this study (Berkshire) and found a mean passing distance of 179 cm. It
seems that drivers might have started passing closer to bicyclists over the past few decades.
Speculatively, this could be a result of greater traffic volumes since the 1970s, or reduced levels of
bicycling which mean that the average motorist is less likely to have experience of bicycling
themselves, and so is less understanding of a bicyclist’s needs.
Effects of bicyclist outfits
The mean passing proximities for each condition, raw data points and kernel density plots to show
the distribution of passing events, are presented in Figure 2.
11

Figure 2 – mean overtaking proximities (black lines) and kernel density plots for each
bicyclist outfit, with individual data points shown in rugs. The dotted vertical line is the
overall mean for all data (117.50 cm)
Analysis of variance showed the seven outfits were associated with significantly different
passing distances, albeit with a small effect size (F6,5683 = 6.51, MSE = 895, p < .001, f = .08)2.
Pairwise t-tests corrected for multiple comparisons with Holm’s (1979) method showed that the
effect was carried by drivers affording more space to POLICE, as shown in Table 1, with
comparable amounts of space left to each of the other outfits. Contrary to our predictions, there was
2 The distributions shown in Figure 2 are somewhat platykurtic, but repeating the ANOVA with a log transform on the data changes the result very little (F6,5683 = 6.94, p < .001), suggesting this did not affect the analysis overmuch.
12
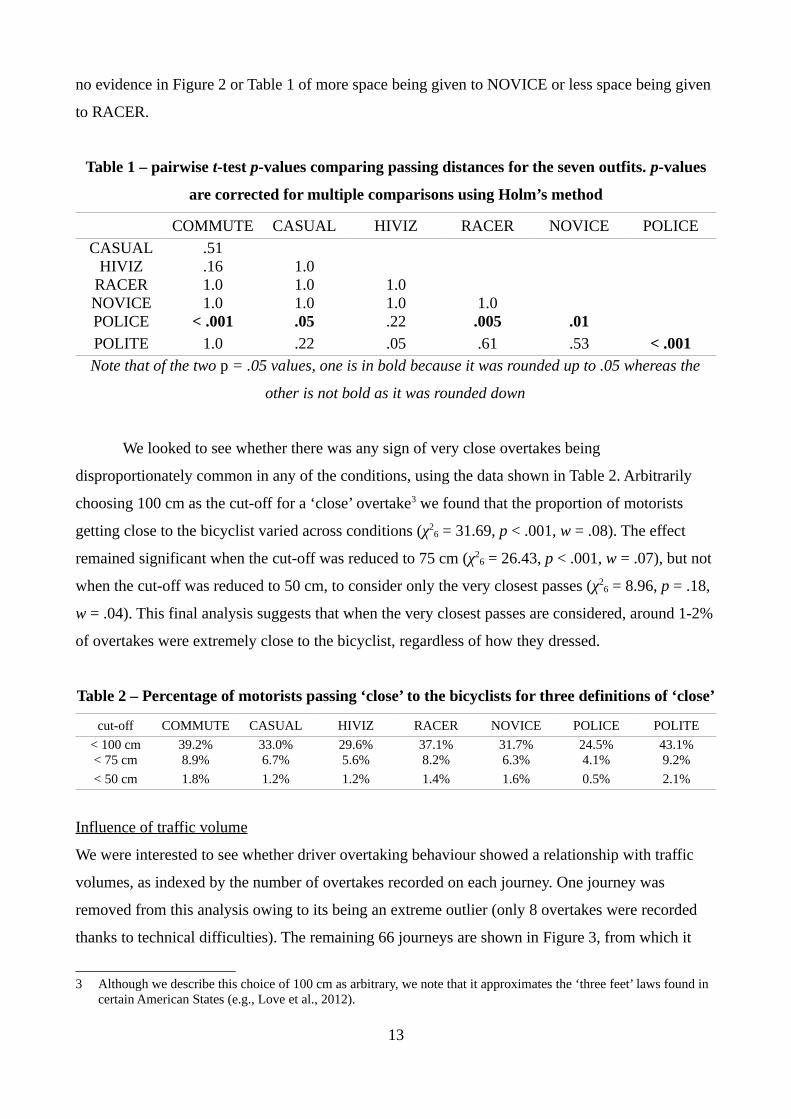
no evidence in Figure 2 or Table 1 of more space being given to NOVICE or less space being given
to RACER.
Table 1 – pairwise t-test p-values comparing passing distances for the seven outfits. p-values
are corrected for multiple comparisons using Holm’s method
COMMUTE CASUAL HIVIZ RACER NOVICE POLICECASUAL .51
HIVIZ .16 1.0RACER 1.0 1.0 1.0NOVICE 1.0 1.0 1.0 1.0POLICE < .001 .05 .22 .005 .01POLITE 1.0 .22 .05 .61 .53 < .001Note that of the two p = .05 values, one is in bold because it was rounded up to .05 whereas the
other is not bold as it was rounded down
We looked to see whether there was any sign of very close overtakes being
disproportionately common in any of the conditions, using the data shown in Table 2. Arbitrarily
choosing 100 cm as the cut-off for a ‘close’ overtake3 we found that the proportion of motorists
getting close to the bicyclist varied across conditions (χ26 = 31.69, p < .001, w = .08). The effect
remained significant when the cut-off was reduced to 75 cm (χ26 = 26.43, p < .001, w = .07), but not
when the cut-off was reduced to 50 cm, to consider only the very closest passes (χ26 = 8.96, p = .18,
w = .04). This final analysis suggests that when the very closest passes are considered, around 1-2%
of overtakes were extremely close to the bicyclist, regardless of how they dressed.
Table 2 – Percentage of motorists passing ‘close’ to the bicyclists for three definitions of ‘close’
cut-off COMMUTE CASUAL HIVIZ RACER NOVICE POLICE POLITE
< 100 cm 39.2% 33.0% 29.6% 37.1% 31.7% 24.5% 43.1%< 75 cm 8.9% 6.7% 5.6% 8.2% 6.3% 4.1% 9.2%
< 50 cm 1.8% 1.2% 1.2% 1.4% 1.6% 0.5% 2.1%
Influence of traffic volume
We were interested to see whether driver overtaking behaviour showed a relationship with traffic
volumes, as indexed by the number of overtakes recorded on each journey. One journey was
removed from this analysis owing to its being an extreme outlier (only 8 overtakes were recorded
thanks to technical difficulties). The remaining 66 journeys are shown in Figure 3, from which it
3 Although we describe this choice of 100 cm as arbitrary, we note that it approximates the ‘three feet’ laws found in certain American States (e.g., Love et al., 2012).
13
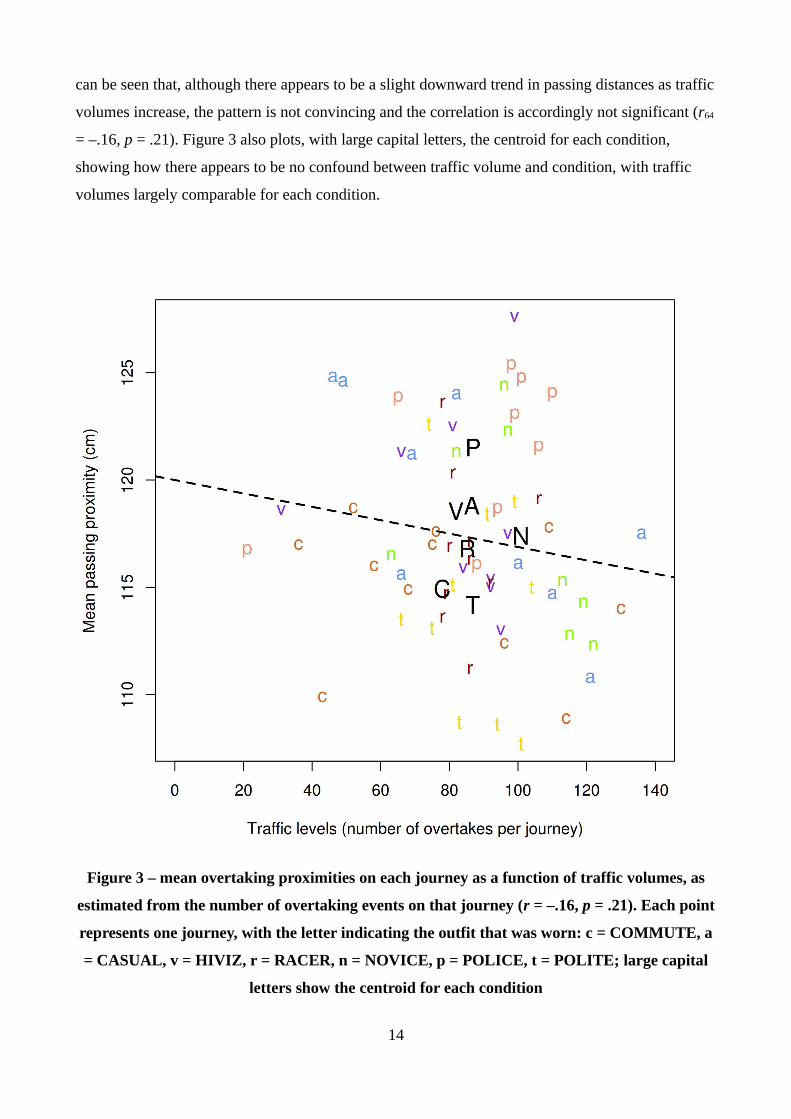
can be seen that, although there appears to be a slight downward trend in passing distances as traffic
volumes increase, the pattern is not convincing and the correlation is accordingly not significant (r64
= –.16, p = .21). Figure 3 also plots, with large capital letters, the centroid for each condition,
showing how there appears to be no confound between traffic volume and condition, with traffic
volumes largely comparable for each condition.
Figure 3 – mean overtaking proximities on each journey as a function of traffic volumes, as
estimated from the number of overtaking events on that journey (r = –.16, p = .21). Each point
represents one journey, with the letter indicating the outfit that was worn: c = COMMUTE, a
= CASUAL, v = HIVIZ, r = RACER, n = NOVICE, p = POLICE, t = POLITE; large capital
letters show the centroid for each condition
14
Patterns in successive overtakes
We addressed an additional question of interest, namely whether, when two or more drivers
overtake the bicyclist in rapid succession, they influence one another’s behaviour such that drivers
behind the first might follow the vehicle in front rather than judge the manoeuvre themselves. In
other words, is the overtaking proximity of a second or subsequent driver related to the proximity of
the driver in front (showing they follow one another) or are their proximities independent? To the
best of our knowledge, this issue has not been explored before, so any insights we can extract from
these data are likely to be useful.
Any overtaking events that took place within 5 seconds of the previous event were
identified, giving 1551 events4. Across the whole dataset, the mean distance left by a driver who
was not following another was 117.03 cm (SD = 30.36) and the mean distance left by a driver who
was within 5 seconds of the vehicle in front was 116.38 cm (SD = 28.72). This difference of 0.65
cm was not significant (95% CI = –2.43 to 1.13, t5133 = 0.71, d = 0.02, p = .48). This lack of any
difference between following and ‘independent’ drivers remained when each condition was
considered separately: COMMUTE t725 = 0.07, p = .94; CASUAL t738 = 0.42, p = .67; HIVIZ t691 =
0.13, p = .89; RACER t846 = 1.52, p = .13; NOVICE t756 = 1.02, p = .31; POLICE t661 = 0.49, p = .63;
POLITE t704 = 0.75, p = .45 – all p-values uncorrected.
Having seen no overall difference in proximity we then, for each overtaking event,
calculated the difference in overtaking proximity from the event immediately before it in the
dataset. If a driver’s passing proximity were determined by that of the driver in front, the mean of
this value should be close to zero. In fact, on average a driver who was close behind another driver
passed the bicyclist 2.28 cm closer (SD = 36.28) than the driver in front, and a one-sample t-test
showed this was significantly different to zero (95% CI = –0.47 to –4.09, t1543 = –2.47, p = .01). As
such, a driver following close behind another tended to pass slightly closer to the bicyclist than the
leading driver. In contrast, drivers who were not travelling behind other vehicles passed the bicycle
0.92 cm (SD = 41.49) further away than the preceding vehicle and this was not significantly
different from zero (95% CI = –0.44 to 2.28, t3585 = 1.33, p = .18) – which is entirely to be expected
4 We chose to treat close following as a binary variable, rather than use following distance as a continuous preditor ina regression analysis, because when one driver is following another with a gap of more than a few seconds, particularly when the gap is such that one driver is likely out of sight of the other as it frequently was in the data, there is no plausible mechanism by which the behaviour of the vehicle in front could affect a following driver’s behaviour. Recall that this was an additional analysis to explore a question not previously studied; future studies might usefully explore the process of how drivers are influenced by the actions of other drivers they see – both in the short term (how an instantaneous behaviour such as passing a bicyclist is influenced by seeing other driver do the same) and in the long term (how informal driving practices [e.g., Björklund & Åberg, 2005] are transmitted through a population of motorists).
15
as the ‘preceding vehicle’ in this second analysis could be anything from 6 seconds to many minutes
in front and so should have shown no relationship.
The findings from the analyses here, then, are that overall, drivers following close behind
other drivers left similar amounts of space in absolute terms as drivers not following close to
another, and this was the same regardless of what the bicyclist wore. However, at a more individual
level, a given driver overtaking the bicyclist within 5 s of their ‘leader’ tended to get 2.28 cm closer
on average than the driver immediately in front. The mechanism underpinning this is not clear at
present.
Power analysis
As this study found non-significant differences between most (but not all) of its outfit conditions, it
is important to consider statistical power. A power calculation showed that, had all the groups been
as small as the smallest here (n = 737), the study could still have detected an ANOVA effect size as
small as f = .05 with power of .80. As such, we can safely conclude that the lack of significant
differences between most of the outfits here was probably because motorists did not respond
differentially to the bicyclist’s various appearances, rather than because the study lacked power.
DISCUSSION
This study, based on earlier research suggesting that people recognize different levels of experience
in bicyclists, using cues that include helmets and clothing (Basford et al., 2002; Gatersleben &
Haddad, 2010; Musselwhite et al., 2010), looked at whether a rider’s appearance could influence
drivers’ overtaking proximities. We found that dressing a rider in outfits signalling different levels
of experience and skill did not affect the mean amount of space left by passing motorists. The
exception was a high-visibility vest whose back carried a prominent reference to the police and
suggested the rider was video-recording the journey, which was allowed significantly more space by
passing drivers.
A motive for this study was to test Walker’s (2007) hypothesis that the reduced passing
proximities seen when a bicyclist wore a helmet might have been caused because, as Basford et al.
(2002) suggested, drivers take helmeted riders to be more experienced or in control. However,
outfits like RACER and NOVICE, which suggested very different levels of experience (as shown in
Figure 1), did not lead to changes in mean driver overtaking proximities or in the proportion of very
close passes. It is therefore possible that (1) something other than perceived experience or control
underpinned the reactions of drivers to the bicycle helmet in the 2007 study, (2) there are regional
differences in driver attitudes or behaviour (the current study was in south-east England whereas the
16

previous was in the south-west), or (3) driver attitudes and behaviours have changed over the past
few years such that motorists no longer respond to perceived experience as they did when Walker
(2007) collected data. At present, we cannot say for certain which of these explanations is likely to
be correct and further research could usefully address this question.
The finding that the POLICE condition led to significantly more space from passing
motorists in this study is useful both because it confirms that the methodology was sensitive enough
to detect responses to the outfits when these occurred, and because it shows there is at least one way
that bicyclists might influence the proximity of passing motorists through what they wear. Speaking
of which, it is interesting to note that, whilst the mean proximities did not change much as a
function of the rider’s outfit, there were substantial differences between outfits in the proportion of
motorists’ passes that came within 100 cm of the rider, as shown in Table 2 – with the greatest
difference between POLICE (24.5%) and POLITE (43.1%). Whilst this does not necessarily mean a
rider is more likely to be struck by a passing vehicle in one outfit rather than another, as differences
were not significant in the 50 cm analysis, the finding could be useful for advising people how they
might try to avoid some of the subjectively unpleasant close passes which can be a disincentive to
bicycling in traffic (Guthrie, Davies & Gardner, 2001; Parkin, Wardman & Page, 2007).
However, having said this, we suggest, based on the data presented here, that it is unlikely
bicyclist outfits could ever provide a sustainable solution to rider safety. Given that Table 2 shows
that around 1-2% of overtakes were within 50 cm of the rider regardless of what he wore, it looks as
though a small proportion5 of motorists’ passes will always be very close regardless of what a
bicyclist wears. If this suggestion is correct, an important corollary is that the optimum solution to
the closest overtakes, which must surely carry the greatest risk to the rider, will not lie with
bicyclists: instead we might look to infrastructural (segregated cycleways), educational (improved
driver training) or legal (strict liability laws, stronger policing of dangerous driving – Voelcker,
2007) interventions to prevent the most dangerous passes. These latter approaches would also offer
a more sustainable, long-term solution to bicyclist safety than any approach which involves
bicyclists manipulating drivers’ judgements through what they wear, as the widespread adoption by
bicyclists of any outfit which successfully influenced drivers would likely reduce its effect on driver
behaviour as it became more familiar.
The question that naturally arises from the extra space given to POLICE is why drivers
responded to this outfit more than the others. The vest, which had been supplied with a
commercially available video camera, was included in the study because one of the experimenters
5 Although we describe this as a ‘small’ proportion, it should be noted that this could reflect 1-2% of many millions of overtaking events each day, such that even a small proportion will probably matter in real terms.
17

owned it and we were curious to see whether it would have any effect. Arguably it had two
components that might have influenced driver behaviour: it might have made motorists think the
rider was affiliated with the police thanks to the prominent emphasis given to that word on the back
(see Figure 1); or perhaps its phrase ‘camera cyclist’ might have made motorists aware that their
actions could be recorded. It is impossible to know for certain whether one or both of these
components led to the behaviour seen here, and a proper experimental test would be difficult as it
would be illegal for an experimenter to wear a vest that unambiguously identifies its wearer as a
police officer. But it is striking that driver behaviour to POLICE was so different to POLITE given
the key word differed by just one letter. Not only was passing much closer on average with
POLITE, but subjectively the experimenter reported feeling much more at risk, and encountered
overt acts of aggression from several drivers, when wearing POLITE. Critically, the difference
between POLICE and POLITE (d = .26) suggests that motorists were not simply making a quick
and crude visual evaluation of the bicyclist, as otherwise we would expect these two outfits to be
treated the same. A positive message that can therefore be taken from these data is that motorists
seem able to read quite carefully what is written on the back of a bicyclist’s clothes, even if their
subsequent behaviour is not necessarily what would be desired. Similarly, the fact drivers were
apparently able to distinguish POLICE from POLITE and adjust their behaviour in response,
especially in the context of earlier findings that drivers respond to a rider’s gender (Chuang et al.,
2013; Florida Department of Transportation, 2011; Walker, 2007), might argue against any claims
that dangerous overtakes are in some sense inevitable or the product of ‘carelessness’ – the data
suggest drivers are quite able to adjust their behaviour based on relatively subtle changes in the
situation.
We were also interested in this study to see the effects of the HIVIZ condition, given that
such clothing is often recommended to bicyclists for its safety benefits. Watts (1979) found only a
very small effect of a high-visibility vest on overtaking proximities in his study, and we similarly
found no overtaking proximity advantage from wearing a high-visibility bicycling jacket, or most of
the high-visibility vests, over casual clothing or an ordinary commuter cycling outfit. The finding
that high-visibility clothing did not change overtaking proximity does not necessarily mean that
such clothing has no value – it is intended primarily to make riders less likely to be overlooked,
rather than influence the behaviour of people who have already seen them (Hoque, 1990). However,
we must acknowledge a body of evidence that is emerging to suggest that high-visibility clothing
might not be as good at increasing conspicuity as is often supposed (and, indeed, might lead to a
false sense of security – Wood, Lacherez, Marszalak & King, 2009). Certainly, there is one study
which supports its use: Thornley, Woodward, Langley, Ameratunga and Rodgers (2008) in New
18

Zealand found from a relatively large sample that time taken off work to recover from bicycle
crashes was lower in users of high-visibility outfits. However, as that study included single-vehicle
crashes in its data, where conspicuity is irrelevant, and as single-vehicle crashes are by far the most
common type to befall bicyclists (Walker & Jones, 2005), the effects in that study can most likely
be explained by the users of high-visibility outfits being the subset of more risk-averse bicyclists
who ride more cautiously (an interpretation that would be supported by, for example, Bolen,
Kresnow and Sacks, 1998, and Bolen, Sacks and Bland, 1999, whose American data strongly
suggest users of bicycle safety equipment are risk-averse across multiple aspects of their lives).
Moreover, against the findings of Thornley et al. must be set several studies which suggest
high-visibility outfits may be of more limited use. Gershon, Ben-Asher and Shinar (2012) showed
with motorcyclists that the contrast between rider and background was more important than the
colour of the rider’s clothing per se, such that against light backgrounds, dark clothing increased
conspicuity more than ‘high visibility’ items (see also Helman, Weare, Palmer &
Fernandez-Medina, 2012). Outside the laboratory, the large-scale case-control MAIDS study of
motorcyclist accidents (ACEM, 2009 – see particularly Table 8.13) found that dark clothing seemed
to impair conspicuity more often than bright clothing enhanced it. With bicyclists specifically,
Miller (2012), in a case-control study of high-visibility clothing, found no association between
wearing high-visibility clothing and reduced crash risk (indeed, there was a small tendency for
people with high-visibility outfits to experience more collisions than people without such aids,
possibly suggesting a risk-compensation mechanisms is at work). At present, then, the literature
suggests that the safety benefits of so-called high-visibility clothing in daylight are likely smaller
than is widely believed (although the night-time benefits of retroreflective clothing might be
another matter).
Limitations of this study include not having data on the characteristics of the drivers
themselves – it is possible there are systematic differences in passing behaviour associated with
such variables as driver attitudes or experiences (particularly experiences with other transport
modes such as bicycling or motorcycling). This could be a useful area for future study, although the
risk of changing driver behaviour by informing them of the study’s aims (Walker, 2010) means this
could be a difficult area to study in practice. Thanks to our wanting to use a cheap, easily replicated
data collection device, we also had no data on the type of vehicle used for each overtake. However,
the relationship between vehicle type and passing proximity is already quite well understood
(Chuang et al., 2013; Kim et al., 2007; Pai, 2011; Parkin & Meyers, 2010; Walker, 2007) and we did
not want to explore this further, looking instead at the overall range of proximities on a typical
commuting journey, including whatever was the typical mixture of vehicles seen on such a journey.
19

The study was also conducted in the United Kingdom, and it is not clear at this stage to what
extent its findings would apply to other locales – although we note that, as described in the
Introduction, gender effects found in the United Kingdom by Walker (2007) have been replicated in
other countries (Florida Department of Transportation, 2011; Chuang et al., 2013). Speculatively,
we might expect driver passing behaviour to become safer in countries with higher levels of bicycle
use as, in a country where bicycling is more common, the typical driver is more likely to have
experienced riding on the road and therefore is more likely to know how it feels to have cars pass
closely (this relates to our earlier suggestion about why our mean passing distance might be
different to that of Watts, 1979). Moreover, it is possible that differences between countries in
infrastructure might lead to differences in passing behaviour. We note in particular the Dutch system
of having no centre-line on many rural roads, as it seems drivers sometimes steer by reference to
markings rather than the needs of other road users (e.g., Parkin & Meyers, 2010). At present,
however, the extent to which the effects seen here are specific to the infrastructure and culture of the
United Kingdom is moot, and international research would be welcomed to investigate this further.
It could also be suggested that as the researcher collecting data in this study was not blind to
the purpose of the study or the condition under test on a given day, their behaviour might have
changed and so influenced the motorists under study. Of course, it is always possible that this
criticism is valid, as it is hardly possible to blind a bicyclist from the outfit they are wearing and it is
conceivable (as one reviewer of this paper suggested) that the rider might have felt more visible or
safer in some conditions. However, against such a suggestion we would note that the rider took
considerable efforts to ride consistently throughout the study – he focused each day on maintaining
his riding position, style and speed within relatively narrow limits, as described in the Method
section, and we are confident that this was accomplished. With speed, position and riding style kept
within narrow and consistent boundaries, it is not clear to us what else the rider might do, as a
function of his outfit, to influence the behaviour of passing motorists. As such, although we agree
that the rider was not blind to the condition and agree that this is not ideal, we cannot identify a
reasonable mechanism by which this might have introduced systematic bias into the data6.
Finally, this study could measure only one aspect of driver reaction to the outfits – their
passing proximity – but it is possible that other behaviours might have changed in response to the
rider’s appearance, such as passing speed, or the tendency to hold back and wait for clear
overtaking possibilities. There is also a small possibility that differences in conspicuity between the
outfits in Figure 1 could have had some effect. Again, these would be very useful areas for future
6 More anecdotally, we note that the rider-experimenter did not look at any data until the study was complete, and upon doing so was surprised by what the data showed, commenting that in many cases his subjective experience of driver behaviour in response to given outfits was not matched by the objective data.
20

study.
CONCLUSIONS
The amount of space left by motorists as they overtook a bicycle was not related to the rider’s
apparent level of experience, as signalled by the outfit being worn. The only substantial change in
drivers’ behaviour was seen in response to a high-visibility vest which invoked the name of the
police and suggested the rider was video-recording the journey, although at present it is not clear
which of these components was responsible for the effect. Given that a small proportion (1-2%) of
overtaking drivers passed within 50 cm of the rider no matter what was being worn, we suggest that
there is little riders can do, by altering their appearance, to prevent the very closest overtakes. We
suggest that the optimum solution to the very closest overtakes will not lie with bicyclists
themselves, and instead we should look to changes in infrastructure, education or the law to prevent
drivers getting dangerously close when overtaking bicyclists.
AUTHOR NOTE
The authors have no affiliation with the manufacturers of any of the products used in this study, and
received no specific funding for this project. They would like to thank Edward Varney for writing
the software to extract passing measures from the raw data, Michael Garrard for his advice on
improving the measurement device used here, and Charles Musselwhite for his helpful comments
on a draft of this paper.
REFERENCES
ACEM (2009). MAIDS: Motorcycle Accident In-depth Study. Downloaded 21 May 2013 from
http://www.maids-study.eu
Andersen, L.B., Schnor, P., Schroll, M., Hein, H.O. (2000). All-cause mortality associated with
physical activity during leisure time, work, sports and cycling to work. Archives of Internal
Medicine, 160, 1621-1628.
Basford, L., Reid, S., Lester, T., Thomson, J., Tolmie, A. (2002). Drivers’ Perceptions of Cyclists
(TRL Report 549). Transport Research Laboratory, Wokingham, UK.
Björklund, G.M. & Åberg, L. (2005). Driver behaviour in intersections: Formal and informal traffic
rules. Transportation Research Part F, 8, 239-253.
Bolen, J.R., Kresnow, M.J., Sacks, J.J. (1998). Reported bicycle helmet use among adults in the
United States. Archives of Family Medicine, 7, 72-77.
Bolen, J.C., Sacks, J.J., Bland, S.D. (1999). Injury prevention behaviors: A report card for the
21

nation, 1995. Preventative Medicine, 29, 195-201.
British Medical Association (1992). Cycling: Towards Health and Safety. Wiley-Blackwell.
Chapman, C., Musselwhite, C.B.A. (2011). Equine road user safety: Public attitudes,
understandings and beliefs from a qualitative study in the United Kingdom. Accident Analysis
and Prevention, 43, 2173-2181.
Chapman, J.R., Noyce, D.A. (2012). Observations of driver behavior during overtaking of bicycles
on rural roads. Transportation Research Record, 2321, 38-45.
Chuang, K.-H., Hsu, C.-C., Lai, C.-H., Doong, J.-L., Jeng, M.-C. (2013). The use of a
quasi-naturalistic riding method to investigate bicyclists’ behaviors when motorists pass.
Accident Analysis and Prevention, 56, 32-41.
Curnow, W.J. (2008). Bicycle helmets and public health in Australia. Health Promotion Journal of
Australia, 19, 10-15.
Davies, G.M. (2009). Estimating the speed of vehicles: The influence of stereotypes. Psychology,
Crime & Law, 15, 293-312.
Florida Department of Transportation (2011). Operational and Safety Impacts of Restriping Inside
Lanes of Urban Multilane Curbed Roadways to 11 Feet or Less to Create Wider Outside Curb
Lanes for Bicyclists (Report BDK82 977-01).
Fyhri, A., Bjornskau, T., Backer-Grondahl, A. (2012). Bicycle helmets – a case of risk
compensation? Transportation Research Part F, 15, 612-624.
Gatersleben, B., Haddad, H. (2010). Who is the typical bicyclist? Transportation Research Part F,
13, 41-48.
Gershon, P., Ben-Asher, N., Shinar, D. (2012). Attention and search conspicuity of motorcycles as a
function of their visual context. Accident Analysis and Prevention, 44, 97-103.
Guthrie, N., Davies, D.G., Gardner, G. (2001). Cyclists’ assessments of road and traffic conditions:
The development of a cyclability index (TRL Report 420). Transport Research Laboratory,
Wokingham, UK.
Helman, S., Weare, A., Palmer, M., Fernandez-Medina, K. (2012). Literature Review of
Interventions to Improve the Conspicuity of Motorcyclists and help avoid ‘Looked by Failed
to See’ Accidents (TRL report PPR638). Transport Research Laboratory, Wokingham, UK.
Holm, S. (1979). A simple sequentially rejective multiple test procedure. Scandinavian Journal of
Statistics, 6, 65-70.
Hoque, M. (1990). An analysis of fatal bicycle accidents in Victoria (Australia) with a special
reference to nighttime accidents. Accident Analysis and Prevention, 22, 1-11.
Jensen, M. (1999). Passion and heart in transport – a sociological analysis on transport behaviour.
22

Transport Policy, 6, 19–33.
Kim, J-K., Kim, S., Ulfarsson, G.F., Porello, L.A. (2007). Bicyclist injury severities in
bicycle-motor vehicle accidents. Accident Analysis and Prevention, 39, 238-251.
Love, D.C., Breaud, A., Burns, S., Margulies, J., Romano, M., Lawrence, R. (2012). Is the
three-foot bicycle passing law working in Baltimore, Maryland? Accident Analysis and
Prevention, 48, 451-456.
McCarthy, M., Gilbert, K. (1996). Cyclist road deaths in London 1985-1992: Drivers, vehicles,
manoeuvres and injuries. Accident Analysis and Prevention, 28, 275-279.
McGarty, C., Yzerbyt, V.Y., Spears, R. (2002). Social, cultural and cognitive factors in stereotype
formation. In C. McGarty, V.Y. Yzerbyt & R. Spears (Eds), Stereotypes as Explanations.
Cambridge, UK: Cambridge University Press.
Miller, P. (2012). The use of conspicuity aids by cyclists and the risk of crashes involving other road
users: a population based case-control study. PhD thesis, University of Nottingham.
Musselwhite, C., Avineri, E., Susilo, Y., Fulcher, E., Bhattachary, D., Hunter, A., Stockley, R.
(2010). Understanding Public Attitudes to Road Safety (Road Safety Research Report 111).
London: Department for Transport.
Parkin, J., Wardman, M., Page, M. (2007). Models of perceived cycling risk and route acceptibility.
Accident Analysis and Prevention, 39, 364-371.
Parkin, J., Meyers, C. (2010). The effect of cycle lanes on the proximity between motor traffic and
cycle traffic. Accident Analysis and Prevention, 42, 159-165.
Pai, C-W. (2011). Overtaking, read-end, and door crashes involving bicycles: An empirical
investigation. Accident Analysis and Prevention, 43, 1228-1235.
Pucher, J., Buehler, R. (2008). Making cycling irresistible: Lessons from the Netherlands, Denmark
and Germany. Transport Reviews, 28, 495-528.
R Core Team (2012). R: A Language and Environment for Statistical Computing. R Foundation for
Statistical Computing, Vienna, Austria. ISBN 3-900051-07-0, URL http://www.R-project.org/
Stone, M., Broughton, J. (2003). Getting off your bike: Cycling accidents in Great Britain in
1990-1999. Accident Analysis and Prevention, 35, 549–556.
Thornley, S.J., Woodward, A., Langley, J.D., Ameratunga, S.N., Rodgers, A. (2008). Conspicuity
and bicycle crashes: Preliminary findings of the Taupo Bicycle Study. Injury Prevention, 14,
11-18.
Transport for London (2005). Pedal Cyclist Casualties in Greater London. London: Transport for
London.
Tuxworth, W., Nevill, A.M., White, C., & Jenkins, C. (1986). Health, fitness, physical activity and
23

morbidity of middle aged male factory workers. British Journal of Industrial Medicine, 43,
733-753.
Voelcker, J. (2007). A Critical Review of the Legal Penalties for Drivers who Kill Cyclists or
Pedestrians. Master’s Thesis: University of Bristol. Downloaded 20 May 2013 from
www.jake-v.co.uk/cycling
Walker, I. (2006). Time of day effects in drivers’ overtaking of bicycles. PHILICA.COM Article
number 24.
Walker, I. (2007). Drivers overtaking bicyclists: Objective data on the effects of riding position,
helmet use, vehicle type and apparent gender. Accident Analysis and Prevention, 39, 417-425.
Walker, I. (2010). In-vivo sampling of naive drivers: Benefits, practicalities and ethical
considerations. In B. Fincham, M. McGuinness, L. Murray (Eds), Mobile Methodologies.
Basingstoke, UK: Palgrave Macmillan.
Walker, I., Jones, C. (2005). The Oxford and Cambridge Cycling Survey: A large-scale study of
bicycle users in two major UK cycling cities. Oxford, UK: Oxfordshire County Council.
Watts, G.R. (1979). Bicycle Safety Devices – Effects on Vehicle Passing Distances. Transport and
Road Research Laboratory Supplementary Report 512.
whatdotheyknow (2013). Licensed driver statistics: UK and London. Retrieved 24 July 2013 from
https://www.whatdotheyknow.com/request/licensed_drivers_statistics_uk_a
Wood, J.M., Lacherez, P.F., Marszalak, R.P., King, M.J. (2009). Drivers’ and cyclists’ experiences
of sharing the road: Incidents, attitudes and perceptions of visibility. Accident Analysis and
Prevention, 41, 772-776.
World Health Organization (2013). Quantifying the health benefits of cycling and walking.
http://www.euro.who.int/en/what-we-do/health-topics/disease-prevention/physical-activity/act
ivities/quantifying-the-health-benefits-of-cycling-and-walking
24