(iaea - qucosa: startseite€¦ · · 2010-03-315. comparison of relap- and athlet-calculations...
TRANSCRIPT

FORSCHUNGSZENTRUM ROSSENDORF e.v. FZR
L. Szabados, Gy. k z s ö l , L. Pernec tky ,
E; Krepper , H.-M. Prasser u n d F. Schu fer
Two-phase flow beliaviour
during a medium size cold leg LOCA test
on PMK-2 (IAEA - SPE-4)

Forschungszentrum Rossendorf e.V. Postfach 51 01 19 . D-01314 Dresden Bundesrepublik DeutschIand Telefon (0351) 591 2067 Telefax (0351) 591 2383 E-Mail krepperafz-rossendorf.de
TWO-PHASE FLOW BEHAVIOUR DURING A MEDIUM SIZE COLD LEG LOCA TEST
ON PMK-2 (IAEA - SPE-4)
Szabados, L., ~zsö l , Gy., Perneczky, L. ') Krepper, E., Pracser, H.-M., Schäfer, F. 2,
') KFKl Atomic Energy Research Institute, P.O.Box 49, H-1 525 Budapest, Hungary
*) Research Center Rossendorf inc., P.O.Box 51 01 19, 0-01 314 Dresden, Germany
Edited by Eckhard Krepper

Abstract
The experiment to the IAEA standard problem exercise No. 4 was carried out in April 1993 on the integral test facility PMK-2 in Budapest. It was a 3.2 mm break on the downcomer head. The high pressure injection cooling was assumed to be not available. As an accident management measure bleed and feed on the secondary side of the steam generator was applied. Research Center Rossendorf contributed to the experiment of SPE-4 by supplying needle shaped conductivity probes for the measurement of local void fractions in the primary circuit of the PMK-II test facility. In the Course of the standard problem exercise No. 4 RCR contributed with posttest calculations using the thermalhydraulic code ATHLET.
The report comprises a description of the initial and boundary conditions of the test (chapter 3) and a phenomenological description of the thermalhydraulic events during the transient (chapter 4). The void fraction probe signals yields valuable information for deeper understanding of the thermalhydraulic occurrences and for code validation. This was the case particularly for correction of the level measurement.
In chapter 5 a description of the thermalhydraulic occurrences from the viewpoint of code verification is given and the results of RELAP5 (KFKI-AEKI) and of ATHLET- calculations (RCR) are compared. Referring to this description, the sensitivity of the result to main influences is investigated using the ATHLET-code.
Kurzfassung
Das Experiment zum IAEA-Standardproblem SPE-4 wurde im April 1993 an der integralen Versuchsanlage PMK-2 in Budapest durchgeführt. Es handelte sich um ein 3,2 mm Leck am Kopf des Downcomers. Das Versagen der Hochdruckeinspeisung wurde angenommen. Als Notfallmaßnahme wurde sekundäres Bleed und Feed vorgesehen. Das FZ-Rossendorf war am Experiment durch den Einsatz nadelförmiger Leitfähigkeitsonden zur Messung des lokalen Dampfgehaltes beteiligt. Im Rahmen des Standardproblems wurden Posttestrechnungen mit dem Programm ATHLET durchgeführt.
Der vorliegende Bericht enthält die Beschreibung der Anfangs- und Randbedin- gungen des Versuches (Kapitel 3) und eine phänomenologische Beschreibung des Versuchsablaufs aus der Sicht des Experimentes (Kapitel 4). Die Signale der Nadelsonden lieferten wertvolle Informationen zum tieferen Verständnis der thermohydraulischen Vorgänge. Das traf insbesondere bei der Einschätzung der Meßwerte der Höhenstände zu.
tn Kapitel 5 wird eine Beschreibung der Vorgänge wahrend des Versuchs aus der Sicht der Codeverifikation gegeben und die Ergebnisse der Rechnungen mit RELAPS (KFKI-AEKI) und ATHLET (FZ-Rossendorf) werden verglichen. Ausgehend von der Versuchsbeschreibung wird die Empfindlichkeit des Ergebnisses gegenüber den Haupteinflußgrößen mittels des ATHLET-codes ausführlicher untersucht.

0. Contents
1. lntroduction
2. The needle shaped conductivity probes
3. Experiment description 3.1. Initial conditions 3.2. Sequence of events
4. Results of the test by using informations getting from the needle probes 4.1. Description of the transient 4.2. Comparison between probes and collapsed levels 4.3. Summary of the experimental results
5. Comparison of RELAP- and ATHLET-calculations with experiment 5.1. Description of the occurrences from the viewpoint of the code verification 5.2. Plots of the final results of the RELAP and the ATHLET-calculations 5.3. lnvestigation of some influences on the modelling of the transient during the
second period (30 - 160 s) by means of the ATHLET code 5.3.1. lnfluence of the pump coast down 5.3.2. influence of the nodaliation of the downcomer head 5.3.3. lnfluence of the hydroaccumulator injection
6. References
A. Additional comments to the experimental results of SPE-4 A. 1. Level measurement A.2. Secondary steam relief valve PV23 A.3. Primary and secondary pressure

1. lntroduction
Assessing the safety of nuclear installations requires a number of high- ly specialized tools including experi- mental facilities and sophisticated computer codes. An effective way to increase confidence in the results of code calculations is to perform Inter- national Standard Problem Exercises.
Based on the positive experience of OECD-CSNI [ I ] IAEA has deemed it necessary to organize Standard Pro- blem Exercises (SPE). Up till now the IAEA has organized and conducted four SPEs in cooperation with the KFKI Atomic Energy Research Institute (AEKI) of the Hungarian Academy of Sciences. The aim of the Exercises is to extend the data base available for nuclear power plants of VVER- 440N213-type, and to offer a unique opportunity to validate computer codes, as well as to facilitate the exchange of information on sophisticated thermal- hydraulic system code applications among Member States.
The first Exercise was conducted Figure 1-1
The PMK2-facility during 1984-86 (IAEA-SPE-1) [2]-[4]. It was foltowed by the second Exercise (IAEA-SPE-2) [4]-[8] in 1987-88 and by the third one (IAEA-SPE-3) [9]-[I 21 during 1989-90. The experimental basis of these Exercises was the PMK-NVH integral-type test facility at the KFKI Atomic Energy Research Insti- tute, Budapest-Hungary.
The facility is a full-pressure, 1 :2070 scaled model of the Paks Nuclear Power Plant and designed mainly to investigate processes following small and medium size breaks in the primary circuit and to study the natural circulation behaviour of VVER-440 type PWRs. Such reactors are sfightly different from PWRs of western design and have a number of special features, viz.: horizontal steam generators (SG), loop seal in both hot and cold fegs, safety injection tank (SIT) setpoint pressure higher than secondary pressure, etc. As a cansequence of the differentes, the transient behaviour should be different from fhe usual PWR Systems.
The first two Standard Problem Tests (SPT) were a 3mm cold leg break - modeffing a 7.4% intermediate break loss of coolant accident (LOCA) in the VVER-440 type nucfear reaetor - fram full power covering the bfowdown phase of the transient

with one of the three high pressure injection systems (HPIS) and without (SPT-1) and with (SPT-2) three of the four hydroaccumuiators (SIT) in action.
For the IAEA-SPE-3 an LOCA with a leak from the primary to the secondary circuit namely the steam collector rupture was chosen. The SPE-3 was an experiment on the PMK-NVH-facility with loss of primary coolant through a 3.8mm break on the upper head of the SG hot collector. From the emergency core cooling systems (ECCS) 2 HPlS and 3 SlTs were in operation.
In accordance with the high interest of countries having VVER-type nuclear power plants and other Member States participated in the three Exercises. IAEA decided to organize the FOURTH Standard Problem Exercise (IAEA-SPE-4) ([I 31 - [ I 91).
The Final Workshop of the SPE-3 accepted a proposal for the test. In accordance with the proposal the SPE-4 is a 7.4% cold leg break with hydroaccumulator injection and without HPlS in action. In the case of this experiment the point in question is not whether the process will lead to dry-out in the core since it is expected (the unavailability of HPlS leads to a beyond design basis accident), but the point is whether the primary pressure drops to or below the setpoint pressure of the low pressure injection system (0.7MPa), without or with operator action in the secondary system.
The final decision of conducting the SPE-4 was made in a meeting of lAEA TC RERl91004 project (Safety Assessment of VVER-4401213 type NPPs) held in Vienna 14-1 8 September 1992.
The test for the SPE-4 was again performed at the AEKl on the PMK-2 facility, which is an upgraded version of the PMK-NVH in order to extend the capability of the loop in modelling of transient processes including accident sequences in support of accident management (AM).
As a part of the cooperation between the KFKI Atomic Energy Research Institute and the Research Center Rossendorf needle shaped conduetivity probes from Rossendorf have been applied to various experiments at PMK in order to obtain information about the void fraction and the structure of the two-phase flow. Two probes were located in the region of the hot leg ioop-seal for the investigation of the effect of loop-seal clearing.
During the SPE-4 experiment the probes were placed practicalfy around the whole circuit (with exception of the core simulator and the downcomer) and for the first time they have provided data, which characterise the overall pbase distribution witbin the primary circuit. The probe data are included in the specification of the standard problern [I 31.

2. The needle shaped conductivity probes
The needle shaped conductivity probes (see Fig. 2-1) are local void fraction Sensors. Their function is based on the interruption of the electrical cur- rent between the tip of the probe and the conducting fluid by the gas fraction. The void fraction is determined by integrating the time of the gas contact divided by the measuring time. As a second cha- racteristic of the two-phase flow, the average frequency of the phase changes at the probe tip can be
ceramic insulator tube, AI2O3 , bearing tube
t
\ \mnducting tip
Figure 2-1 Principle of the needle shaped
conductivity probe
measured. probe inputs (1 -1 6) :
Beside the probes the measuring system consists of a network of preamplifier modules equipped with micro- com~uters and a central I I - -
data acquisition perso- nal computer (sec Fig.
data acquisition 2-2, [15]). The modules tledorm a data pre- brocessing and control Figure 2-2 a digital interface, which Data aquisition system is necessary to manage the high electrical disturbance levels typical for integral test faciiities. As a result the time behaviour of the void fraction and the frequency of the phase changes (bubble frequency) are recorded with a sampling time of 1 s.
lt has to be underlined that the probes provide useful information about the time of structural changes of the flow. This includes the time of the transition from one- phase to two-phase flow and back, the time of significant changes of void fraction and of the passing of the mixture level.
The local character of the void fraction measurement has to be taken into consideration when the obtained experimental data are used for the computer code validation. In the case of the SPE-4 experiments all the probes were placed into the centre of the primary circuit sections with the only exception of probe LV32, the tip of which was Iocated by 12mm below the axis of the tube while the axial position was similar to probe LV37. In all cases deviations between the measured local void fraction in the centre of the tube and the calculated average void fractions are expected due to the existente of a radial void fraction distribution within the tube.
The character and the magnitude of these deviations depend on the orientation of
the tube segment. In the case of a veriical segment of the circuit as for example the steam generator collectors or the upper plenum of the reactor the local void fraction follows the same changes as the average fraction, both values are rather close to each other if the velocities are not too high. The latter condition holds for small and intermediate break LOCAs. As a rule the local void fraction is higher then the average value. If the probes are located in horizontal or inclined park of the circuit the differences between the local and the average void fraction can be higher due to stratification effects.
An additional source of uncertainty is connected with the orientation of the probe in relation to the flow direction. The highest accuracy of the void fraction measurement can be achieved, when the tip of the probe is directed against the flow. At the PMK facility the low diameter of the nozzles for the probes allows only a radial orientation, i.e. the probes are orientated at right angles to the fiow direction. For this case preliminary investigations in an air-water flow have shown that the void fraction is underestimated by several percent. The error reaches maximum values at medium void fractions and disappears when the void fraction reaches OoA or 100%.
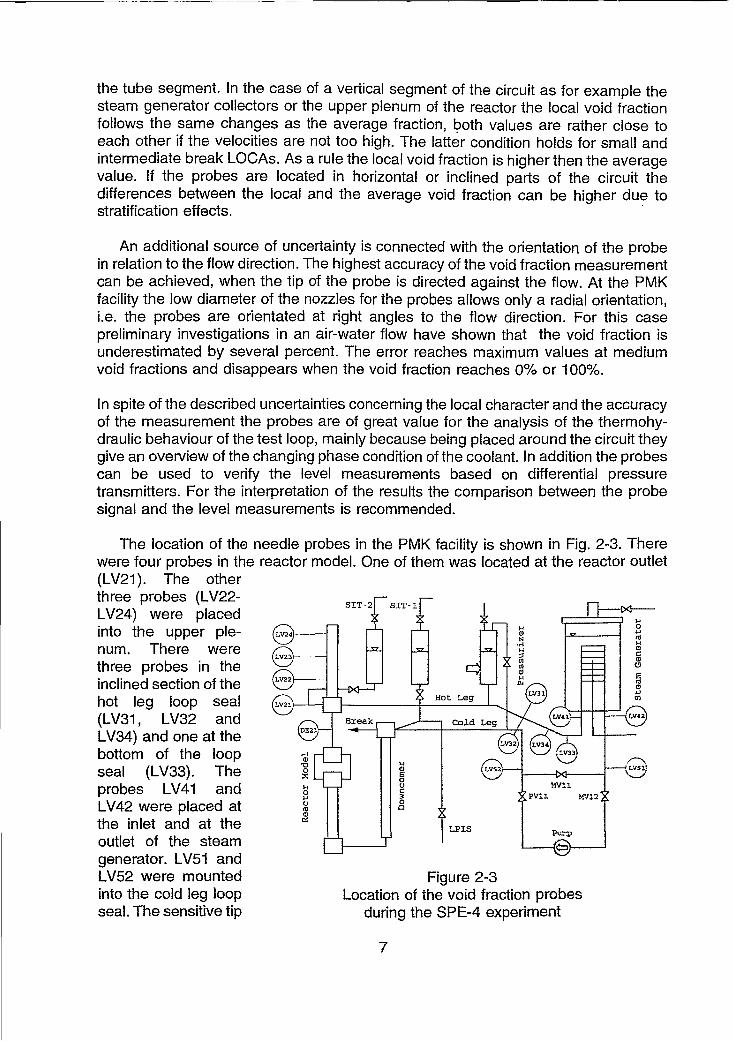
In spite of the described unceriainties concerning the local character and the accuracy of the measurement the probes are of great value for the analysis of the thermohy- draulic behaviour of the test loop, mainly because being placed around the circuit they give an overview of the changing phase condition of the coolant. In addition the probes can be used to verify the level measurements based on differential pressure transmitters. For the interpretation of the results the comparison between the probe signal and the level measurements is recommended.
The location of the needle probes in the PMK facility is shown in Fig. 2-3. There were four probes in the reactor model. One of them was located at the reactor outlet (LV21). The other three probes (LV22- LV24) were placed into the upper ple- num. There were three probes in the inclined section of the hot leg loop seal (LV31, LV32 and LV34) and one at the bottom of the loop seal (LV33). The probes LV41 and LV42 were placed at the inlet and at the outlet of the steam generator. LV51 and LV52 were mounted Figure 2-3 into the cold leg loop Location of the void fraction probes seal. The sensitive tip during the SPE-4 experiment

of all probes with exception of LV32 had been located at the axis of the component the probes were placed into. LV32 was at the Same axial position as LV31, but while LV31 was measuring the void fraction at the axis of the main circulation pipe, LV32 was placed on a half pipe radius below LV31. The aim of this measure was to investigate possible stratification effects in the inclined part of the loop seal.
3. Experiment description
The experiment is started from full power and from nominal operating parameters. The break nozzle has a diameter of 3.2 mm modelling a 7.4 % cold leg break in the NPP and it is located on the upper head of the downcomer (see Fig. 2-3). The total Ioss of high pressure injection system (HPIS) is considered, while one low pressure system (LPIS) is available. Activation of three of the four SlTs in the plant is modelled in the experiment by use of two SIT vessels as shown in Fig. 2-3. The transient is initiated at t=O s by opening of the break valve. The secondary side is isolated after the transient initiation by closing the steam- and the feedwater supply valve. The secondary side bleed procedure for the prevention of the core damage is initiated by opening of the steamgenerator relief valve, while for the feed the emergency feed water is used.
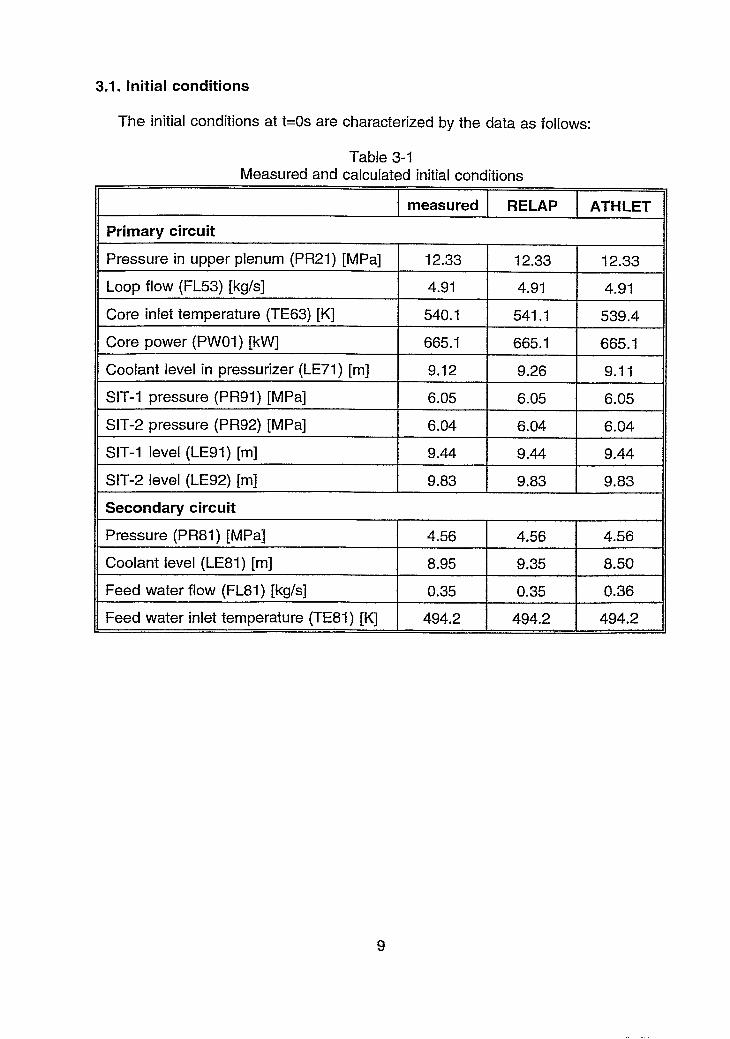
3.1. Initial conditions
The initial conditions at t=Os are characterized by the data as follows:
11 Secondarv circuit
Table 3-1 Measured and calculated initial conditions
measured
Pressure (PR81 ) [MPa]
Coolant level (LE81) [m]
Feed water flow (FL81) [kgls]
Feed water inlet temperature (TE81) [K]
RELAP ATHLET
Primary circuit
4.56
8.95
0.35
494.2
Pressure in upper plenum (PR21) [MPa]
Loop flow (FL53) [kgls]
Core inlet temperature (TE63) [K]
Core power (PWOI) [kW]
Coolant level in pressurizer (LE71) [m]
SIT-I pressure (PR91) [MPa]
SIT-2 pressure (PR92) [MPa]
SIT-1 level (LE91) [m]
4.56
9.35
0.35
494.2
SIT-2 level (LE92) [m] 1 9.83 1 9.83 1 9.83
12.33
4.91
540.1
665.1
9.12
6.05
6.04
9.44
4.56
8.50
0.36
494.2
1 2.33
4.91
541 .I
665.1
9.26
6.05
6.04
9.44
12.33
4.91
539.4
665.1
9.1 1
6.05
6.04
9.44

3.2. Sequence of events
The transient is characterized by the boundary conditions as follows:
Table 3-2 Sequence of events
Break valve starts to open
Secondary side isolation starts (closing time 6 s)
I
' SIT-I empty at
0.0 s
0.0 s
Break valve open
Transient for power is initiated at
Modelling of the pump coast down is initiated at
SIT-1 and SIT-2 are actuated at
P
SIT-2 empty at
0.1 s
PR21 = 11.15 MPa
PR21 = 9.21 MPa
PR21 = 5.90 MPa
11 Total mass through the break at 1800 s I 154.19 kg
Secondary bleed is initiated at
Secondary emergency feed is initiated at
LPlS initiation
PR21 = 9.21 MPa + 150s
PR81 = 0.93 MPa
PR21 = 1.04 MPa
The test is terminated at 1800 s

4. Results of the test by using informations getting from the needle probes
An overview of the signals of the needle T probes is given by Fig. 4-1. The figure %
includes the signal of a gamma-densitometer (DE21) at the upper plenum below the reac- tor outlet. Because of the failure of probe LV21 at the reactor outlet, the signal of the Same probe originates from a preliminary expe- riment has been added 0 100 200 300 400 500
t .s - to the data set. The Figure 4-1 preliminary test was Signals of the void fraction probes carried out at the Same initial conditions as SPE-4. The data sets obtained at the two tests are in good agreement so that the combination of the two signals can be accepted.
4.1. Description of the transient
The general chronology of events can be described in the following way: The first event is a short flashing within the hot leg of the primary circuit at t = 13 - 31 s caused by the pressure drop. The flashing was not observed in the cold leg (see probes LV42, LV51, LV52). After some seconds it was suppressed by the injection of the emergency core coolant tanks (hydroaccumulators). After that the level dropping in the upper plenum of the reactor model took place indicated by the probes LV22 - LV24. At approximately the Same time (t = 40 s) the evaporation started in the cold leg behind the main circulation pump (probe LV52), probably caused by the pressure drop of valve PV11. The valve was successively throttled in order to model the pump down and the pressure drop was forced by the leak flow. The wave of flashing moved through the cold leg and was reaching subsequently the probes LV51 (t = 118 S) and LV42 (t = 131 s).
During the Same period the first steam generation was indicated at the reactor outlet (t = 72 s). Simultaneously an increasing void fraction was meacured by the gamma device. The fact that the void fraction LV21 was lower than the value suppiied by DE21 showed that a Counter current flow timitation prevented the injected ECG water from flowing down towards the core. The void fraction reached a first rnaximum (probe LV21) between t = 126 and 132 s. This peak was also detected by the probes LV31 and LV32 (t = 128 - 135 s) in the inclined part of the hot leg, but a loop seal clearing did not occur (see probe LV33, LV34 and LV41).

After this first attempt to loop seal clearing the void fraction at the reactor outlet dropped back at a value of almost Zero. At t = 162 s the void fraction rose again and a first real loop seal clearing occurred, indicated by the probes LV31 - LV34 and LV41. The moment corresponds with the opening of valve MV11 after PVI I was closed completely. This is the end of the pump coast down procedure. In the test results, there was a short increase of flow rate in the circuit. The probe LV41 showed the first steam bubbles rising in the vertical part of the hot leg at the side of the steam generator's hot collector at t = 167 s.
Subsequently the steam in the hot leg was partially condensed by the ECC water, partially driven into the steam generator and condensed there. As a result the pressure decrease was intensified and as indicated by level LE91 the injection rate also was increase (Fig. 5-2-1 1).
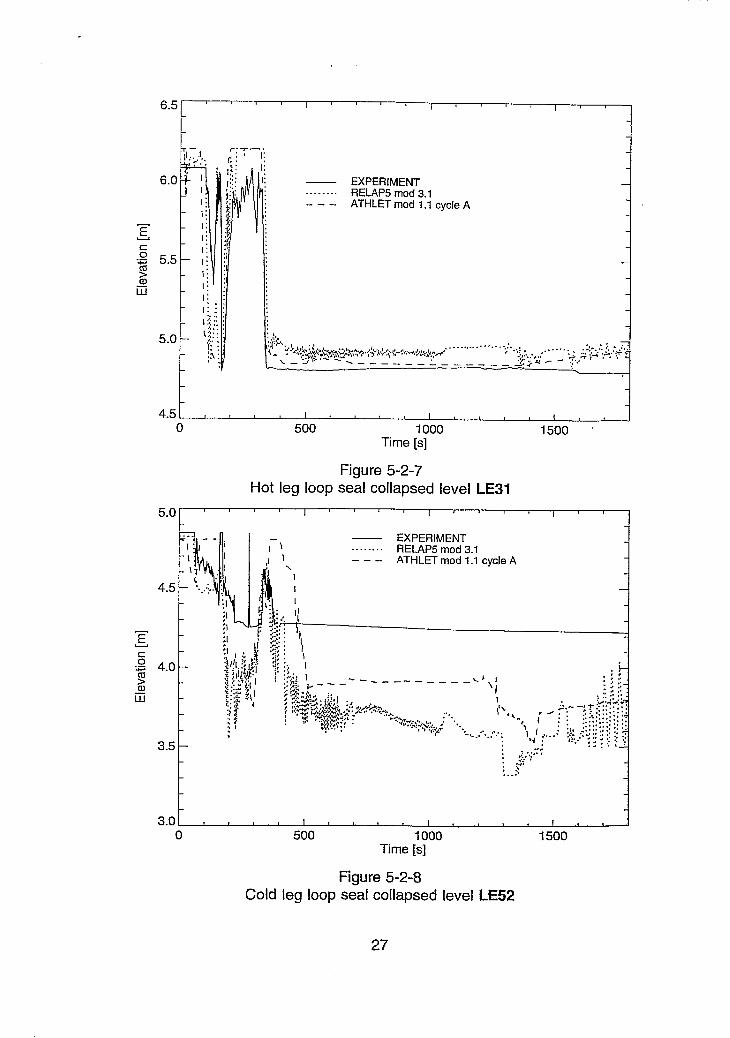
As a result the hot leg was refilled with subcooled water at approximately t = 180 s (Fig.4-I, Fig. 5-2-7). The steam at probe LV41, for example, disappeared exactly, when the subcooling reached the thermocouple near the probe (TE41, Fig. 5-2-1 7). The void fraction at the reactor outlet decreased very soon, too (t = 175 s).
When the primary pressure became lower than the secondary, the level in the cold collector started to decrease (Fig. 5-2-1 0). A subcooling like that in the hot leg was not observed (Fig. 5-2-18). The level decrease was first indicated by probe LV42 at t = 193 s. The mixture level crossed the position of the probe LV51 at t = 218 s. Some seconds later (t = 222 s) the cold leg loop seal clearing occurred, which was shown by probe LV52.
After the hydroaccumulators had stopped the injection (t = 308 s) the second and final clearing of the hot leg loop seal took place. The level crossed the positions of the probes LV31, LV32, LV34 and LV33 successively (t = 337, 337. 341 and 343 s respectively, Fig 4-1). The probe LV41 detected the first steam bubbles at t = 345 s. Due to the entering of steam the hot collector of the steam generator certain quantity of water was pressed through the steam generator heat exchange tubes and slumped into the cold collector. The water was indicated by probe LV42, showing two short decreases of the void fraction in the region between 320 and 355 s (Fig. 4-1).
A few seconds before the hot leg loop seal was cleared there was a temporary drop back of the void fraction within the cold leg of the circuit caused by water flowing back from the downcomer into the cold leg. It was detected by probe LV52 at t = 343 s. The void fraction increased again in the opposite order (LV51 at t = 364 s and LV51 at approximately t = 380 s).
After that, in both the hot (LV41) and cold (LV42) collector sides of the circuit and in the cold leg loop seal (LV52) a two-phase flow with a void fraction of about 80 - 90 % was established. This flow was created by steam flowing in the direction of the leak and passing through the rest of water that had remained in the hot collector and in the upgoing pipe behind the cold leg loop seal. Only for the period between 1200 and 1380 s probe LV41 was dry.

The flow at the reactor outlet turned to one-phase steam flow at t = 565 s. The appearance of the two-phase flow at the reac- tor outlet was the result of the actuation of the low pressure injection System (LPIS), which took place at t = 1591 s (see Fig. 4-4). At the Same time the probes in the inclined pat-t of the hot leg and at the bottom of the hot leg loop seal started to indi- cate steam-water mixture (LV32 and LV34) or at least a few droplets of water (LV31 and LV33).
At the end of the experiment the probes in the hot and cold leg loop seals showed that both loop seals were not yet refilled. That means, a natural circula- tion of water was not reestab- lished at t = 1800 s. The low pressure injection had been directed mainly to the reactor and had caused a level increase in the reactor vessel.
4.2. Comparison between pro- bes and collapsed levels
The cold leg loop seal is formed by the steam generator cold collector, the downgoing vertical Part of the cold leg, the horizontal tube segment with the valve simulating the pump and the upgoing vet-tical tube seg- ment. The probes were located in the downgoing pat-t (LV42, LV51) and in the upgoing patt (LV52).
Fig. 4-2 shows the signals of the probes LV42 and LV51 in comparison wifh the collapsed
I I I I 0 100 200 300 400
Time (s)
Figure 4-2 Void fractions below the steam generator outlet
in comparison with the collaised levels
Time (s)
Figure 4-3 Void Sractions in the reactor model in comparison wlth cottapsed levels
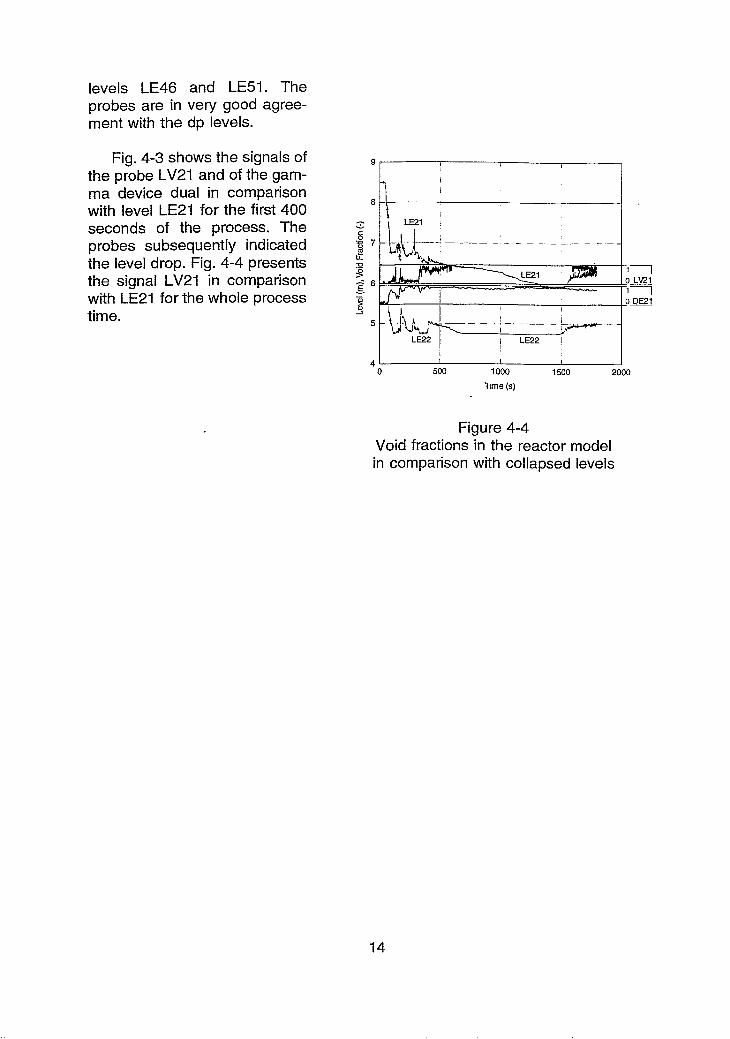
levels LE46 and LE51. The probes are in very good agree- ment with the dp levels.
Fig. 4-3 shows the signals of the probe LV21 and of the gam- ma device dual in comparison with level LE21 for the first 400 seconds of the process. The probes su bsequently indicated the level drop. Fig. 4-4 presents the signal LV21 in comparison with LE21 for the whole process time.
I I I 0 500 1000 1500 2000
Time (s)
Figure 4-4 Void fractions in the reactor model in comparison with collapsed levels
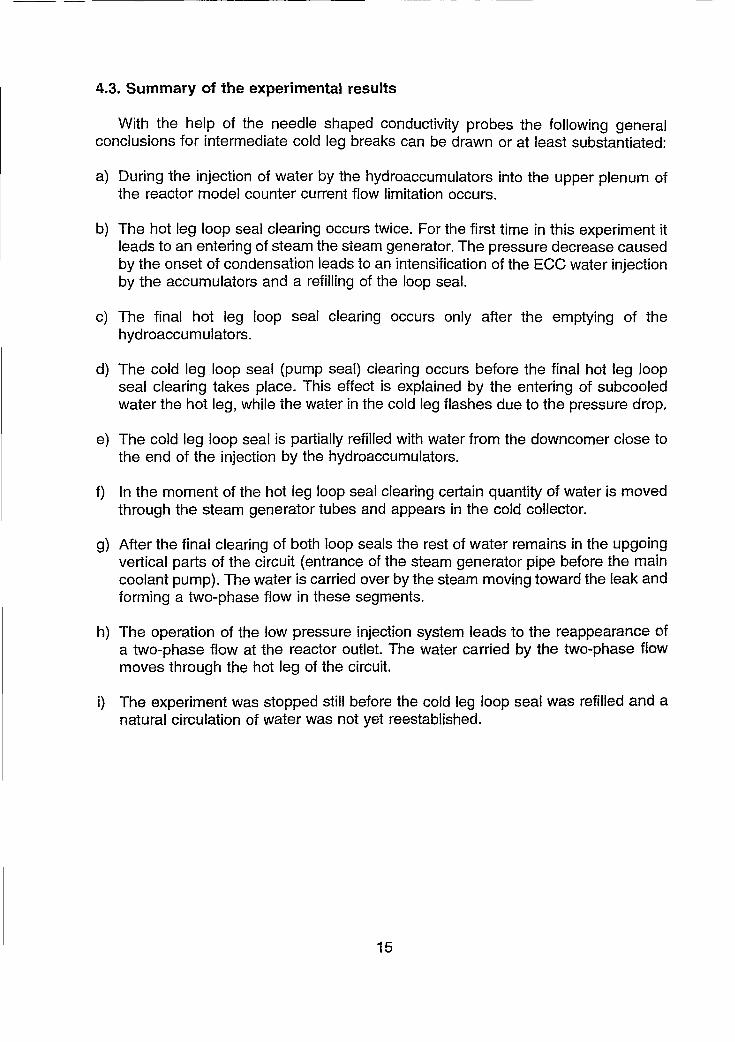
4.3. Summary of the experimental results
With the help of the needle shaped conductivity probes the following general conclusions for intermediate cold leg breaks can be drawn or at least substantiated:
a) During the injection of water by the hydroaccumulators into the upper plenum of the reactor model counter current flow limitation occurs.
b) The hot leg loop seal clearing occurs twice. For the first time in this experiment it leads to an entering of steam the steam generator. The pressure decrease caused by the onset of condensation leads to an intensification of the ECC water injection by the accumulators and a refilling of the loop seal.
C) The final hot leg loop seal clearing occurs only after the emptying of the hydroaccumulators.
d) The cold leg loop seal (pump seal) clearing occurs before the final hot leg loop seal clearing takes place. This effect is explained by the entering of subcooled water the hot leg, while the water in the cold leg flashes due to the pressure drop,
e) The cold leg loop seal is partially refilled with water from the downcomer close to the end of the injection by the hydroaccumulators.
f) In the moment of the hot leg loop seal clearing certain quantity of water is moved through the steam generator tubes and appears in the cold collector.
g) After the final clearing of both loop seals the rest of water remains in the upgoing vertical parts of the circuit (entrance of the steam generator pipe before the main coolant pump). The water is carried over by the steam moving toward the leak and forming a two-phase flow in these segments.
h) The operation of the low pressure injection system leads to the reappearance of a two-phase flow at the reactor outlet. The water carried by the two-phase fbw moves through the hot leg of the circuit.
i) The experiment was stopped still before the cold leg loop seal was refilled and a natural circulation of water was not yet reestablished.

5. Comparison of RELAP- and ATHLET-calculations with experiment
In the KFKI-AEKI, RELAP-calculations and in FZ Rossendorf ATHLET-calculations were carried out. In the following chapters, a comparison of the calculations and the experiment is given. The first chapter contains a shortened description of events comprising only major occurrences, which are desirable to predict with the codes. Therefore, this compact description of events is more suitable for this purpose of code validation. In this context, the subdivision in time periods was found very useful. ln the next chapter 5.2, plots of the main results are shown. In the last chapter 5.3 some influences on the ATHLET-results are discussed.
5.1. Description of the occurrences from the viewpoint of code verification
Phase 1: 0 - 30 sec Subcooled fluid in the primary circuit
During the first thirty seconds of the experiment, the primary pressure PR21 decreases quite fast. In this period at 11.4 MPa the core power starts to decrease according the decay heat curve. At 9.5 MPa the pump coast down starts, which is modelled in the PMK facility by gradually closing the valve PV11. At a pressure PR21 of 5.9 MPa the hydroaccumulators start to inject cold fluid into the primary circuit.
In this phase of subcooled fluid in the primary circuit, the prediction of the main events by the codes is quite good (see Table 5-1).
Phase 2: 30 - 160 sec Pump coast down
Achieving saturation conditions, the further primary pressure decreasing stagnates. To discuss possible reasons for deviations of the calculations from experiment it has to realize, that the Course of the transient is determined by several overlaying occur- rences:
a) Due to the pump coast down, the mass flow decreases. This induces a higher fluid temperature at core outlet and enhanced flashing in the primary circuit. The pressure is increased and the core level LEI 1 is remarkably decreased.
Calculations with different characteristics of the closing pump valve PVI I show, that the exact modelling of the gradually closing pump valve has a large influence on the accuracy of the calculation. This is shown in chapter 5.3.3 for the ATHLET- calculations. Calculation difficulties arise, because the pump Sees two phase flow during the coast down period. For the calculation of the pump behaviour under two- phase conditions, no data were available. In the calculation the pump difference pressure DP16 from the experiment was used. Doing this, a very good agreement of the calculated with the measured mass flow FL53 in the first 200 s of the test is achieved.

b) The continuing break mass flow decreases the primary pressure.
In the ATHLET calculation during this test period the break mass flow is calculated something too low (see Fig. 5-2-3). The calculated mass flow depends not only from the applied discharge model, but also from the thermohydraulic conditions, particularly the void fraction and the liquid temperature, in the discharge volume. Difficulties in the calculation may arise, since the discharge volume on the top of the downcomer is simultaneously influenced by the cold fluid from the hydro- accumulator and three-dimensional effects might play a growing role. In chapter 5.3.1 the influence of a more detailed nodalization of the downcomer head on the break mass flow is investigated for the ATHLET-calculations.
C) The cold fluid, which is injected by the hydroaccumulators, induces conden- sation of the steam in the primary circuit and the pressure is decreased. There exists strong response, because the amount of the injected water is governed by the decreasing primary pressure. The effect of the hydroaccumulator injection depends from the direction of the injected water. In the case of SIT-I, the cold water may flow into the downcomer, into the hot leg or even through the break. In the case of SIT-2, the water may flow towards the core or into the hot leg.
Figure 5-1-1 Void fraction in upper plenum
ATHLET mod 1.1 cycle A

In the ATHLET calculation the Stagnation of the pressure decrease is overestimated. Because of the streng response to the hydroaccumulator injection, this effect is enhanced. The injection is stopped at t = 30 s and the pressure increases. In the chapter 5.3.2 the influence of the hydroaccumulator injection is shown in more detail by further ATHLET-calculations.
Phase 3: 160 - 400 sec pump valved off, secondary bleed, hydroaccumulators emptied
150 s after start of the pump coast down at about t = 160 s the bleed valve at the secondary steam generator is opened. Simultaneously the pump valve PV11 is completely closed and the bypass valve MV1 1 is opened. This causes a loop seal clearing in the! hot leg (see the void fraction probe signals LV31-LV41) and a sudden increasing of the core collapsed level (LEI 1). From this time the primary pressure decreases faster again and the accumulator injection is enhanced. During the next period the following processes are essential:
a) The continued steam produced in the core blows the cold hydroaccumulator fluid towards the hot leg. This is shown by comparison of the void fraction signals LV21 and DE21 (see Fig. 5-1-1 for the ATHLET-calculation and Fig. 4-1 for the experiment). In the hot leg the steam is condensed and the loop seal is refilled. After refilling the hot leg loop seal the subcooled fluid is blown into the steam gene- rator.
b) The cold fluid causes a back flow of heat from the secondary to the primary circuit.
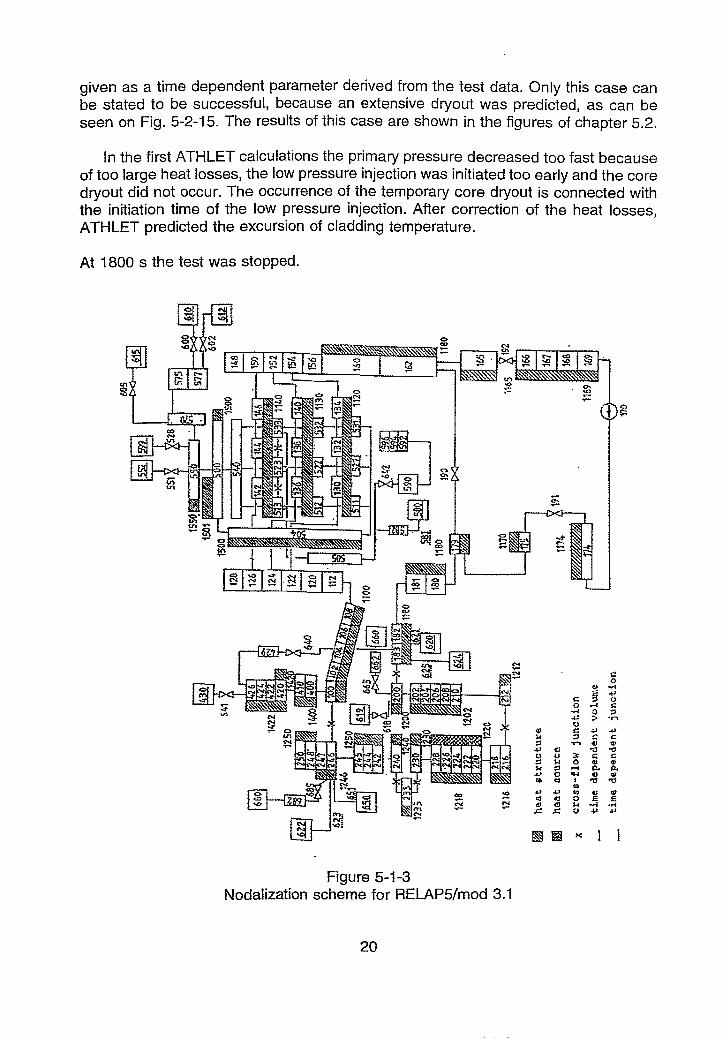
For appropriate description of the inverse heat transfer, the steam generator was modelled both in the RELAP and in the ATHLET calculation in detail (see nodalization schemes Fig. 5-1-3 and 5-1 -4). The 82 primary U-tubes are described by three (RELAP) respective four (ATHLET) clusters. On the secondary side, in both calculations fluid circulation is considered by appropriate modelling of a closed loop.
The effect of reverse heat transfer in this test period was able to be reproduced by both codes. Fig. 5-1-2 shows the calculated primary and secondary pressure (ATHLET).
At t = 308 s the hydroaccumulators are depleted. Then the power transferred from the secondary side is too low for evaporation and the cold fluid is blown through the steam generator to refill the cold leg loop seal. In the next period the loop seals of the hot leg (t = 340 s) and the cold leg (t = 385 s) are finally cleared (see void fraction probe signals LV41, LV51 and LV52 in the Fig. 4-1). At t = 400 s the natural circulation in the primary circuit is interrupted.
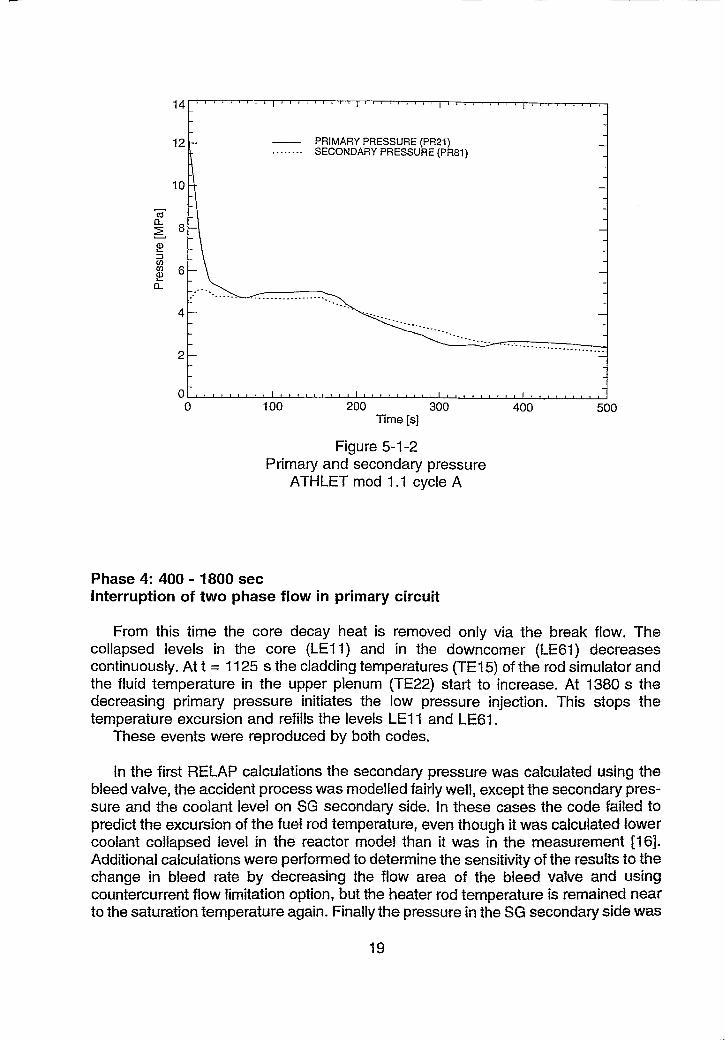
Figure 5-1-2 Primary and secondary pressure
ATHLET mod 1.1 cycle A
Phase 4: 400 - 1800 sec Interruption of two phase flow in primary circuit
From this time the core decay heat is removed only via the break flow, T h e collapsed levels in the core (LEII) and in the downcomer (tE61) decreases continuously. At t = 1125 s the cladding temperatures (TE15) of the rod simulator and the fluid temperature in t he upper plenum (TE22) start to increase. At 1380 s the decreasing primary pressure initiates the low pressure injection. This s tops the temperature excursion and refills the levels LEI 1 and LE61.
These events were reproduced by both codes.
In the first RELAP calculations the secondary pressure was caiculated using the bleed valve, the accident process w a s modelled fairly weil, except the secondary pres- Sure and the coolant ievel on SG secondary side. In these cases the code faiied to predict the excursion of t h e fuei rod temperature, even though it w a s calculated Iower cootant collapsed ievel in the reactor modet than it w a s in the measurement j161. Additional calculations were performed to determine the sensitivity of the results to the change in bleed rate by decreasing the flow area of the bleed valve and using countercurrent flow limitation option, but the heater rod temperature ic remained near to the saturation temperature again. Finally the pressure in the SG secondarjr side w a s
given as a time dependent Parameter derived from the test data. Only this case can be stated to be successful, because an extensive dryout was predicted, as can be Seen on Fig. 5-2-15. The results of this case are shown in the figures of chapter 5.2.
In the first ATHLET calculations the primary pressure decreased too fast because of too large heat losses, the low pressure injection was initiated too early and the core dryout did not occur. The occurrence of the temporary core dryout is connected with the initiation time of the low pressure injection. After correction of the heat losses, ATHLET predicted the excursion of cladding temperature.
At 1800 s the test was stopped.
Figure 5-1-3 Nodalization scheme for RELAP5lrnod 3.1


Table 5-1 Main events and comparison of the calculated results with the experiment
Occurrences [SI
Phase 1: 0 - 30 s Subcooled fluid in the primary circuit
break opening initiation of transient for power initiation of pump coast down
Phase 2: 30 - 160 s Pump coast down
initiation of accumulator injection first steam in the hot leg loop seal pump operation in two phase regime reactor level at hot leg elevation reactor level at top of the core
Phase 3: 160 - 400 s Pump valved off, secondary bleed, hydroaccumulators emptied
opening of the pump bypass valve opening of secondary bleed valve first hot leg loop seal clearing (LV33) first cold leg loop seal clearing (LV51) termination of accumulator injection cold leg loop seal refilled (LV51) second hot leg loop seal clearing second cold leg loop seal clearing
Phase 4: 400 - 1800 s Interruption of two phase flow in pri- mary circuit
start of clad-temperature increasing initiation of low pressure injection initiation of secondary injection
EXP RELAP ATHLET

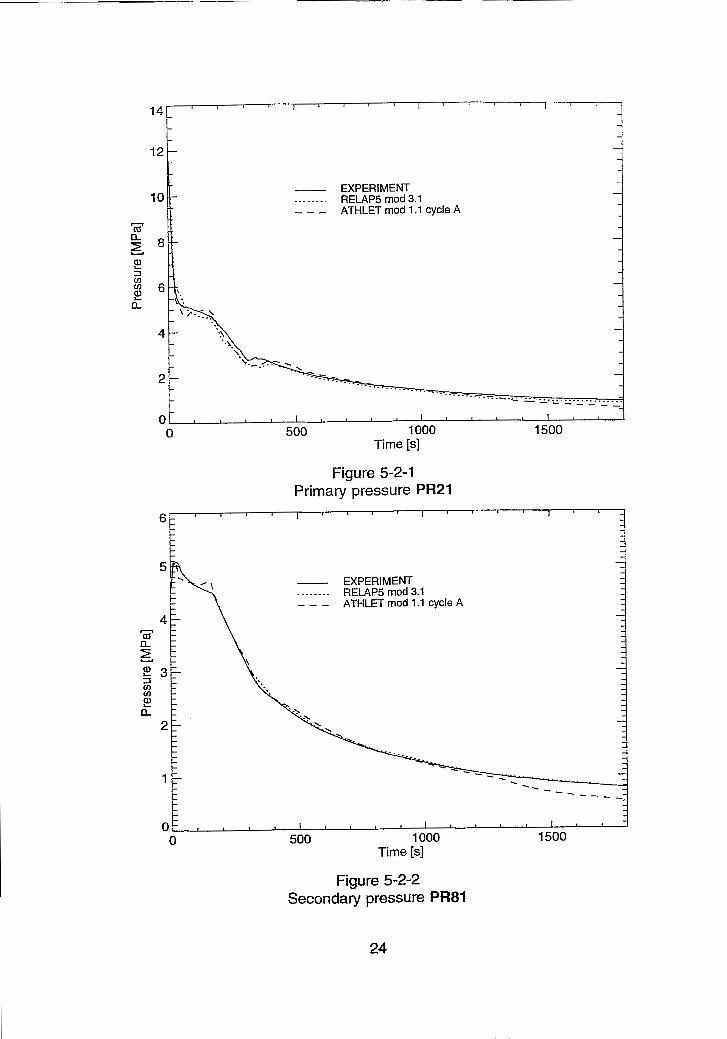
5.2. Plots of the final results of the RELAP and the ATHLET-calculations
List of plots
Figure 5-2-1 : Primary pressure PR21 . . . . . . . . . . . . . . . . . . . . . . . . . . . . . . . 24 Figure 5-2-2: Secondary pressure PR81 . . . . . . . . . . . . . . . . . . . . . . . . . . . . . 24 Figure 5-2-3: Break mass flow FLOI . . . . . . . . . . . . . . . . . . . . . . . . . . . . . . . . 25 Figure 5-2-4: Integral break mass flow MAOI . . . . . . . . . . . . . . . . . . . . . . . . . 25 Figure 5-2-5: Reactor model collapsed level LEI 1 . . . . . . . . . . . . . . . . . . . . . . 26 Figure 5-2-6: Downcomer collapsed level LE61 . . . . . . . . . . . . . . . . . . . . . . . . 26
. . . . . . . . . . . . . . . . . . . . Figure 5-2-7: Hot leg loop seal collapsed level LE31 27 . . . . . . . . . . . . . . . . . . . Figure 5-2-8: Cold leg loop seal collapsed level LE52 27
. . . . . . . . . . . . . Figure 5-2-9: Hot leg loop seal SG side collapsed level bE45 28 . . . . . . . . . . . . Figure 5-2-10: Cold leg loop seal SG side collapsed level LE46 28
. . . . . . . . . . . . . . . . Figure 5-2-1 1 : Hydroaccumulator (downcomer) level LE91 29 . . . . . . . . . . . . . . Figure 5-2-1 2: Hydroaccumulator (upper plenum) level LE92 29
. . . . . . . . . . . . . . . . . . . . . . . Figure 5-2-1 3: Pressurizer collapsed level LE71 30 . . . . . . . . . . . . . . . . . . . . . . . . . . . . . Figure 5-2-14: Cold leg mass flow FL53 30
. . . . . . . . . . . . . . . Figure 5-2-15: Rod cladding temperature at 3.464 m TE15 31
. . . . . . . . . . . . . . . Figure 5-2-16: Fluid temperature at hot leg elevation TE22 31 . . . . . . . . . . . . . . . . . . . . . Figure 5-2-17: Fluid temperature at SG inlet TE41 32 . . . . . . . . . . . . . . . . . . . . Figure 5-2-1 8: Fluid temperature at SG outlet TE42 32
. . . . . . . . . . . . . . . Figure 5-2-19: Fluid temperature at downcomer head TE61 33 . . . . . . . . . . . . . . . . . . . . . Figure 5-2-20: Fluid temperature at core inlet TE63 33
- EXPERIMENT . . - - . . - . RELAPS mod 3.1 - - - ATHLET mod 1.1 cycle A
14L ' I ' " I " I "
L - - - - - - - - - - - - - - - - - - - - - - -
- ---....___ - - - T . . _ - . C . ; - - - - - -.................. - - - - - - - _ _
0 1 1 1 1 I , , , 1 I I
-
0 500 1000 1500 Time [SI
Figure 5-2-1 Primary pressure PR21
- EXPERIMENT . - . . - - - . RELAPS mod 3.1 - - - ATHLET mod 1.1 cycle A
Figure 5-2-2 Secondary pressure PR81

- EXPERIMENT . . . . . . . . RELAP5 mod 3.1 - - - ATHLET mod 1.1 cycle A
Time [s]
Figure 5-2-4 Integral break mass ffow MAU1
Figure 5-2-3 Break mass flow FLOI
200
150
I I I ~ ' ~ ' I " - - - - - - - - - ...._...----
.__.___.....--- ._I.____.-...-..--- ___..I--
____._.--- _ _ - _ _ - - - - - - - _ _ _ _ - - - - - _ _ _ - - - - -
- - -
- EXPERIMENT - . . . . . . - . RELAP5 mod 3.1 - - - ATHLET mod 1 .I cycle A -
- - -
- l . . , . l , ,
0 500 1000 1500 Time [s]

I O I I I I I , ,
0 500 1000 1500 Time [s]
Figure 5-2-5 Reactor model collapsed level LEI 1
o t # . % l f ~ t p t l l v I r , I 0 500 1000 1500
Time [s]
C 0 - .- - a 5 - 3 . . I .
Figure 5-2-6 Downcomer collapsed level LE61
2 ._ I ..- . ...
- - EXPERIMENT . - :. . - .. . . .--..-.. RELAP5 mod 3.1 '- .... : .> . . - - - ATHLET mod 1 . I cycle A . . - . . -
- EXPERIMENT . . . . . . - . RELAPS rnod 3.1 - - - ATHLET rnod 1.1 cycle A
Figure 5-2-7 Hot leg loop seal collapsed level LE31
0 500 1000 1500 Time [SI
Figure 5-2-8 Cold leg loop seal collapsed level E 5 2

- EXPERIMENT . . . . . . . . RELAPS mod 3.1 - - - ATHLET mod 1.1 cycle A
Figure 5-2-9 Hot leg loop seal SG side collapsed level LE45
9
8 - EXPERIMENT -.--.- - - RELAPS mod 3.1 - - - ATHLET mod 1 . l cycle A
7
E - 6 I= 0 .- -c-.
3 2 5 W
4
3
2 0 500 1 000 1500
Time [SI
Figure 5-2-1 0 Cold leg ioop seal SG side colfapsed level LE46

- EXPERIMENT . . . . - . - . RELAPS mod 3.1 - - - ATHLET rnod 1.1 cycle A
0 500 1000 1500 Time [s]
Figure 5-2-1 1 Hydroaccumulator (downcomer) level LE91
- EXPERIMENT . . . . . - . . RELAPS mod 3.1 - - - ATHLET rnod 1.1 cycle A
0 500 1000 Time [SI
Figure 5-2-1 2 Hydroaccumulator (upper plenum) level LE92

- EXPERIMENT - . - - - - - . RELAP5 mod 3.1 - - - ATHLET mod 1 .I cycle A
500 1000 Time [s]
Figure 5-2-1 3 Pressurizer collapsed level LE71
Figure 5-2-14 Cold leg mass flow FL53

Figure 5-2-1 5 Rod cladding temperature at 3.464 m TE15
600
Figure 5-2-1 6 Fluid temperature at hot leg elevation f E22
I I ~ I ~ I I
- - , -. . .
- . . . . - . . . . . - -
- 400 - 0
-
-
-
0
- - - - _ - - EXPERIMENT . . - - . . . . RELAP5 mod 3.1 - - - - - ATHLET mod 1.1 cycle A
- -
I 1 1 1 1 1 1
0 500 1000 1500 Time [s]

-
- EXPERIMENT - - - - - - - RELAPS mod 3.1
-
- - - ATHLET mod 1.1 cycle A - -
- - -
- - -
- . . - 150 I , I I
0 500 1000 1500 Time [s]
Figure 5-2-1 7 Fluid temperature at SG inlet TE41
280 - ' I " " I ' I " - - - - EXPERIMENT -
-----.- . RELAPS rnod 3.1 - - - ATHLET mod 1 .l cycle A
- - - - - - - -
- - C - 2
-
a, - -
E 200 - - - z - - - - -
180 - -
160
140
- - . - - - - - - .- - . - - - - -
I , ~ , , I , ~ ~ ~ I
0 500 1000 1500 Time [s]
Figure 5-2-1 8 Fluid temperature at S G outlet TE42
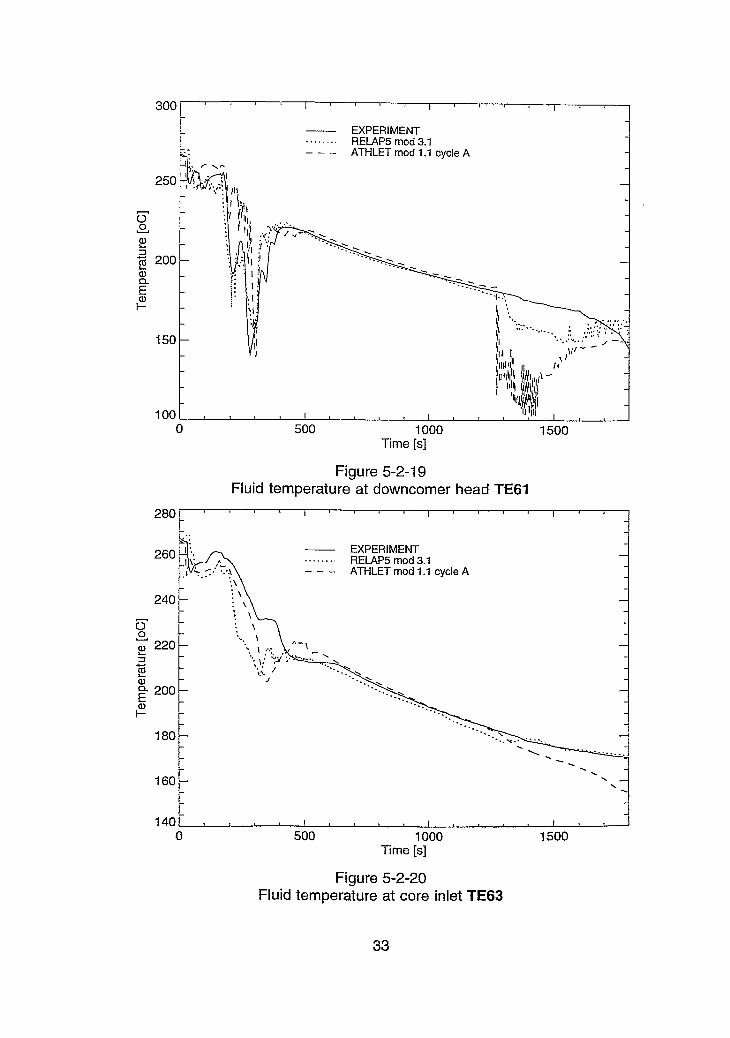
Figure 5-2-1 9 Fluid temperature at downcomer head TE61
300
- EXPERIMENT . . . . - . - , RELAPS mod 3.1
ATHLET mod 1 .I cycle A
0 500 1000 Time [s]
I " " I ' 1 8 ' 1 1 ' - - - - EXPERIMENT - . . . . . - - . RELAP5 mod 3.1 -. - - -
Figure 52-20 fluid temperature at core inlet TE63
ATHLET mod 1 .I cycle A - - - -
9 - - -
U - L! -
G 200 - L a,
- -
n -
i - - I- -
- 150 -
- - - - - -
100 0 500 1000 1500
Time [s]

5.3 Investigation of some influences on the modelling of the transient during the second period (30 - 160 s) by means of the ATHLET code
In the ATHLET calculations, the primary pressure PR21 decreases too fast (30 - 50 s) and then the pressure reincreases (50 - 160 s, See Fig. 5-2-1). This leads to an interruption of the hydroaccumulator injection, which was not observed in the experiment. To investigate the reasons for this deviation, some influences on the transient during this period were studied in more detail. These additional calculations are compared with the final calculation, which was presented in the chapter 5.2.
5.3.1. lnfluence of the pump coast down
To investigate this influence, some different regimes of closing the pump valve PV11 were compared. Fig. 5-3-1 - shows some closing regimes of PV11. 0.4 - Case A corresponds to the test calcu- . - CASEA . : . .
CASE B . i . . . . . . . . lation under consideration of the found . . 0.2 - - - - CASE C . : .: -
relationship between time, closing cur- %
. . . . . . . . - rent, mass flow and valve opening ratio. 0.0- . . . . V . . . . # l t 0 50 100 150 200
The cases B and C corresponds to Time [SI
faster valve closing. The during the test Figure 5-3-1 Cross section ratio of valve PV11
Time [SI
Figure 5-3-2 Mass flow FL53 at different closing regimes of PV11

observed break down of the pump difference pressure DP16 after 70 s shows, that after this time the pump obviously Sees two-phase flow. This corresponds also to the calculated void fractions. For the calculation of the pump behaviour under two-phase conditions, no pump data were available. In the final calculation the closing regime of PV11 according to case A and the pump difference pressure DP16 from the experiment were used. Doing this, a very good agreement of the calculated with the measured mass flow FL53 in the first 200 s of the test is achieved (see Fig. 5-3-2).
Figure 5-3-3 PR21 at different closing regimes of valve PV11
5.3.2. lnfluence of the nodalization of the downcomer head
A reason for the deviation of the Accu- Accu-
pressure decrease during the second injection hjection period was the too low calculated break mass flow (see Fig. 5-2-3). This is not caused by the discharge model, but by the thermohydraulic conditions in the discharge volume, particularly the void fraction and the liquid temperature.
@Eid These parameters strongly depend from Break Break the nodalization of the modelled facility al One volume b) Nodalized head near the break. To investigate this effect, the downcomer head was nodalized in Figure 5-3-4
more detail (see Fig. 5-3-4). lnstead Top view of dowtIC0mer head
modelling it as one volume, it was divi-

ded in three volumes for the break, the hydroaccumulator injection and the cold leg. The influence on the calculated results are Seen in the following Figures.
With the nodalized downcomer head, the discharge volume is stronger influenced by the operation of the hydroaccumulators than in the reference calculation. During the period of enhanced accumulator injection (t = 24 to 50 s), the break mass flow is increased (see Fig. 5-3-5) because of the lower liquid temperature in the discharge volume (see Fig. 5-3-6). During this time the calculated primary pressure PR21 matches better with the observed value. Nevertheless PR21 reincreases also in this calculation and the accumulator injection and also the influence of the cold accumulator water on the break mass flow are stopped. During the time of the second injection peak (t = 200 ... 300 s) the effect of the accumulators on the break flow is overestimated.
1.0 " " " " ' i " " " " " " " " " ' i " " " " " " " " " '
- - - EXPERIMENT -
- . . - . . . . FINAL CALCULATION - - - - NODALIZED DOWNCOMER HEAD 0.8 \ -
Time [s]
Figure 5-3-5 Break mass flow FLO1

Figure 5-3-6 Liquid temperature in the discharge volume
300
- EXPERIMENT - . . . - - . . FINAL CALCULATION - - - NODALIZED DOWNCOMER HEAD
~ " " " " ~ ~ " " " " ~ " ' ~ " " ~ ~ ~ ' ~ " ' ~ ~ ' ~ ~ ~ " ~ ~ " ' - - FINAL CALCULATION -
. . - - . - . . NODALIZED DOWNCOMER HEAD - - - - F FORCED ACCUMULATOR INJECTION
Figure 5-3-7 Primary pressure PR21

5.3.3 lnfluence of the hydroaccumulator injection
lf the cold fluid of the hydroaccumulator reacts with steam in the facility, the steam condenses and the primary pressure is decreased. There exists strong response, because the amount of injected water is governed by the decreasing primary pressure. There were performed additional ATHLET calculations also with nodalized downcomer head, but with a forced injection of cold accumulator water according to the levels LE91, LE92 observed in the test. It is Seen, that during the first 200 s the calculated primary pressure corresponds very close to the experiment. During the period t = 200 ... 300 s also in this case the influence of the accumulators on the break is overestimated.
- EXPERIMENT . . - . - - - . FINAL CALCULATION - - - FORCED ACCUMULATOR INJECTION
0 100 200 300 400 500 Time [s]
Figure 5-3-8 Break mass flow FLO1

- EXPERIMENT . - . . . . . . FINAL CALCULATlON - - - FORCED ACCUMULATOR INJECTION
Figure 5-3-9 Primary pressure PR21

6. References
R. Caruso, E. Hicken lnternational Standard Problems NUCSAFE 88. Avignon, 2-7 October 1988. Proceedings Vol. 2. p 421.
Simulation of a Loss-of-Coolant Accident: Reslults of a Standard Problem Exercise on the Simulation of a Loss-of-Coolant Accident Organized by the lnternational Atomic Energy Agency IAEA-TECDOC-425, Vienna, 1987.
L. Perneczky, G. ~zsö l , L. Szabados, C. Almeida IAEA-SPE-1: A SBLOCA Standard Problem Exercise on the PMK-NVH Test Facility. Jahrestagung Kerntechnik 1987. Karlsruhe, 2 - 4 June 1987. Proceedings p 203.
M. Belliard, E. Laugier CATHARE2 V1.3E Post-Test Calculations of SPE-1 and SPE-2 Experiments at PMK-NVH Facility. Int. Conference on New Trends in Nuclear System Thermohy- draulics. Pisa, 30 May - 2 June 1994. Proceedings Vol. 1. p 81 1.
Simulation of a Loss-of-Coolant Accident with Hydroaccumulator Injection: Results of the Second Standard Problem Exercise on the Simulation of a Loss-of-Coolant Accident Organized by the lnternational Atomic Energy Agency. IAEA-TECDOC-477, Vienna, 1988.
L. Perneczky, G. ~zsö l , L. Szabados, C. Almeida IAEA-SPE-2: The Second IAEA SBLOCA Standard Problem Exercise on the PMK-NVH Test Facility. Jahrestagung Kerntechnik 1988. Travemünde, 17 - 1 9 May 1988. Proceedings p 283.
S. M. Sloan, Y. A. Hassan A Comparison of RELAP5/MOD2 Results to the Data of a Small-Break Loss-of-Coolant Accident Experiment in an IAEA Standard Problem Exercise Nuclear Technology, Vol. 89. p 177 (1 990).
B. Mavko, I. Parzer, S. Petelin A Modeling Study of the PMK-NVH Integral Test Facility Nuclear Technology, Vol. 105. p 231 (1 994).
Simulation of a Loss-of-Coolant Accident with Ruprure in the Steam Generator Hot Coliector: Results of the Third Standard Problem Exercise on the Simulation of a Loss-of-Coolant Accident IAEA-TECDOC-586, Vienna, 1991.
[I 01 L. Perneczky, G. ~zsöl , L. Szabados IAEA SBLOCA Standard Problem Exercises on the PMK-NVH Test Facility. Jahrestagung Kerntechnik 1991. Bonn, 14 - 16 May 1991. Proceedings p 151.

[I11 Y. A. Hassan, P. Salim Simulation of the Primary-Secondary Leak Experiment of IAEA's Third Standard Problem Exercise Using the RELAP5lMOD2 and RELAP5lMOD3 Computer Codes. Nuclear Technology, Vol. 96. p 139 (1991).
[I21 1. Parzer, B. Mavko, S. Petelin IAEA-SPE-3 Simulation with RELAP5. Int. Conference on New Trends in Nuclear System Thermohydraulics. Pisa, 30 May - 2 June 1994. Proceedings Vol. 1. p 81 9.
[ I 31 L. Szabados et al Specification for the Fourth IAEA Standard Problem Exercise. IAEA, Safety Assesment of VVER-4401213, TC REW91004, KFKl Atomic Energy Research Institute, Budapest, 1993.
[I41 Simulation of a Beyond Design Basis Accident with Bleed and Feed Preventive Measures Results of the Fourth Standard Problem Exercise. Project TC REW91004, IAEA-TECDOC- , Vienna, 1995 (in preparation)
[I51 H.-M. Prasser, W. Zippe, D. Baldauf, L. Szabados, G. ~zsö l , G. Baranyai, I. Nagy Two-Phase Flow Behaviour during a Medium Size Cold Leg LOCA Test on PMK-II (SPE-4). Jahrestagung Kerntechnik 1994. Stuttgart, 17 - 19 May 1994. Proceedings p 77.
[I61 L. Szabados, G. ~zsö l , L. Perneczky Experiments in Support of Accident Management for the Paks NPP of VVER-4401213 Type. 3rd World Conf. on Experimental Heat Transfer, Fluid Mechanics and Thermodynamics, Honululu, Hawaii, October 1993.
1171 L. Szabados, G. ~ z s ö l Assessment of RELAP5lMOD2 for a Beyond Design Basis Accident Sequence. Int. Conference on New Trends in Nuclear System Thermohydraulics. Pisa, 30 May - 2 June 1994. Proceedings Vol. 1. p 365.
1181 P. Cebull, Y. A. Hassan Simulation of the SPE-4 Small Break Loss-of-Coolant Accident tlsing RELAP5lMOD3.1. Int. Conference on New Trends in Nuclear System Thermoby- draulics. Pisa, 30 May - 2 June 1994. Proceedings Voi. 1. p 825.
[I91 P. Cebull, Y. A. Hassan I Simulation of the IAEA's Fourth Standard Problem Exercise Small Break
Loss-of-Coolant Accident Using RELAP51MOD3. I Nuclear Technology, Vot. 109. p 327 (1995).

Appendix Additional comments to the experimental results of SPE-4
Comparing the released experimental results and the void fraction measurement signals, some inconsistencies were detected. Their identification could give a deeper understanding of the processes and could help, to improve the quality of further experiments on the PMK facility.
A.l Level measurement
The determination of the levels is based on the measurement of the differential pressure. Because of the location of the measuring lines of some differential pressure transducers, during the SPE4-experiment in some cases the fluid in the lines was completely evaporated and the measurement of the differential pressures was disturbed. From the time of measuring line evaporation the measured levels are indicated too high. This effect occurred on the level measurement on the steam generator primary side hot and cold collector (LE45, LE46) in that cases, when the secondary pressure is higher than the primary pressure. In the reactor vessel this effect occurred on the level LE21 and as a result LEI 1, when the primary pressure has reached saturation conditions. Comparing the first experimental results of October 1993 with the void fraction probe signals, this deviations were detected and in the final release of the experimental results in December 1993 these levels were corrected by shifting of the values from the time of measuring line fluid evaporation (see Fig. A-1-1 to A-1-4). Figures A-1-3 and A-1-4 shows, that the level peaks (LE45, LE46) at t = 245 s, which are not Seen in the void fraction signals, have no physical reason.

Figure A-1-1 Level in the upper plenum LE21
- FINAL RELEASE DECEMBER 93 ....-.. ~ RELEASE OCTOBER 93
Figure A-1-2 Level in the core sirnulator LEI I

- FINAL RELEASE DECEMBER 93 - - - - - - - . RELEASE OCTOBER 93
0 500 1000 1500 Time [s]
Figure A-1-3 Level on steam generator hot collector LE45
Figure A-1-4 Level on steam generator cold coliector LE46

A.2 Secondary steam relief valve PV23
The opening pressure of the secondary side of steam generator valve PV23 is given as 5.3 MPa. At no time of the SPE4-test this pressure was exceeded. Neveriheless, steam must have passed the valve during the first 50 seconds. The differential pressure measuring points of the secondary level LE81 are located on the bottom of the secondary steam generator and in a volume of the steam line. Because of the hydraulic resistance between the measuring points, the differential pressure indicates not only the level but also a steam flow. The effect of enhanced steam flow is Seen in the case of opening the bleed valve at t = 160 s (see Fig. A-2-1). The behaviour of the level seems to show, that steam was released from 12 to 34 s and from 47 to 57 s. During the ATHLET calculation, the opening pressure of PV23 was reduced to 5.0 MPa and PV23 releases from 9 to 31 s about 4.4 kg steam. Almost all SPE4 pariicipants calculated the pressure PR81 during the period before opening the bleed valve at t = 160 s something too high.
- EXPERIMENT . . - . . . . . CALCULATION (COLLAPSED LEVEL LEBI) - - - CALCULATlON (MIXTURE LEVEL)
Figure A-2-1 Coilapsed level of the secondary steam generator LE81

A3. Primary and secondary pressure
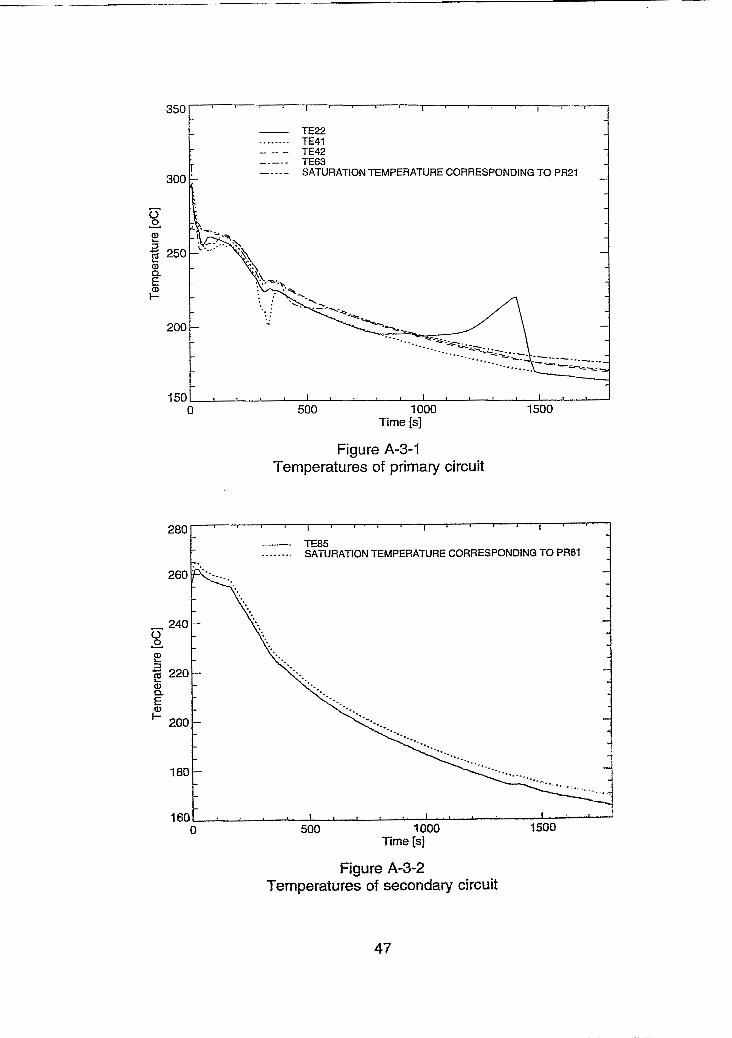
Calculating the saturation temperatures corresponding to the primary and secondary pressure TS21 and TS81 and comparing them with the other fluid temperatures in the circuit, some doubts occurred, if the given accuracy of the pressure measurement is correct. In the later periods of the test the temperatures TE41, TE42 and TE63 should correspond to the saturation temperature TS21 (see Fig. A-3-1). The Same should apply to the secondary side with TE83, TE85, TE87 'and TS81. As a test TS21 and TS81 were shifted by some degrees corresponding to the other temperatures in later test periods and the new pressures PR2lc and PR8lc were calculated. Comparing them (see Fig. A-3-3), the period of lower primary than secondary pressure, which indicates an inverse heat flux from the secondary to the primary side, is much longer and corresponds very good to the scenario of events described in chapter 5.1. The very good agreement of the primary and secondary pressure during the time later than 400 s shows, that the heat exchange during this time goes to Zero.
L - - TE22 - . . - - - . . TE41 - - - - - TE42
r TE63 - SATURATION TEMPERATURE CORRESPONDING T 0 PR21 -
- - - - -
- - - -
150 I ~ ~ , , I , , , , ~ , , 0 500 1000 1500
Time [s]
Figure A-3-1 Temperatures of primary circuit
FIgure A-3-2 Temperatures of secondaay circuit

Figure A-3-3 Primary and secondary pressure (Release December 93)
Time [s]
Figure A-3-4 Corrected primary and secondary pressure