i technical report standard title pace i · technical report standard title pace 1. repo,. ... time...
TRANSCRIPT
TECHNICAL REPORT STANDARD TITLE PACE
1. Repo,. No. REVISED I" 0'''''·'"' ." ..... " N •. 3. Reclpl.nt'. Co'olog No.
I FHWA/TX-89/371-1 4. T ttle and Sub.; .Ie S. R.po,' Do'.
. ..,
I Environmental Effects on the Physical Properties October 19B7 I I
I of Concrete the First 90 Days 6. Performing OrgO'1I lOlton Code
!
17 Author's; 8. Perform,nll O'lIonllo'"on Reoor! No.
Man Yop Han and Mikael P. J. Olsen Research Reporl 171-1 f
R V SED 9. Perlormlnt Orgon'la',on Nome and Add,en 10. Wo,k Un,! No.
I Texas ransportation Institute The Texas A&M University System 11. ConHOC' or Gront No.
I I College Station, Texas 77843-3135 Stlldv No 2-R-Rfi-371
13, Type 01 R.po" ond P."od Cove,.d
I I 12. Soono",,"g Ag"ncy Nome and Add,e .. Interim _ September 1984 Texas State Department of Highways and Public I
Transportation; Transportation Planning Division October 1987 I I i P.O. Box 5051 14. Sponoo"nll Ag.ncy Cod. i Austin, Texas 78763
15. Supplemen'a,y NOHU
Research performed in cooperation with DOT, FHWA. Research Study Title: Env i ronmenta 1 Effects on the Physical Properties
of Concrete the First 90 Days 16, Ab.ltoct
This report includes an extensive literature review and laboratory investigations for selected physical properties of concrete mixtures used in the construction of continuously reinforced concrete pavement (CRCP). Nine test parameters were investigated in thi's study: temperature, relative humidity, and wind speed; concrete temperature, type of aggregate, amount of mixing water and replacement of fly ash; and mixing time and consolidation effort. A total of 116 tests were performed in three categories: strength tests such as compressive, pullout, flexural and modified compressive strength; volume and weight change tests such as shrinkage and weight loss of bar specimen, moisture content, and loss measurements of cube specimen; and other tests such as time of setting and abrasion resistance.
An evaporometer developed by SDHPT was used to measure evaporation rates for several env i ronmenta 1 condtions, and to congregate the environmental factors into one variable. The results showed good correlations with the PCA evaporation chart within the ranges tested and were found to be a very promising single parameter which can predict most of the physical properties of concrete, such as strength development and shrinkage characteristics. Design curves were developed based on the evaporation rate measured by the Evaporometer for 7 day flexural strength, half time shrinkage, and ultimate shrinkage. A procedure for correcting the strength and shrinkage with respect to the duration of the env i ronmenta 1 condition is also presented.
17. Key Wo,d. IS. Di,tribution Stot.",ent
Continuously Reinforced Concrete No restrictions. This document is Pavement, Strength, Shrinkage, Moistur available to the public through the Change, Time of Setting, Abrasion, National Technical Information Service Env i ronmenta 1 Factors, Mixing Time, 5285 Port Royal Road Consolidation Effort, Fly Ash. Springfield, Virginia 22161
19. S.curo ty CloII;l. (of thi' ,.porl) 20. S.cu'ity Clolli f. (of thi, POll.) 21. No. of P ag.' 22. P"c;e
Unclassified Unclassified 220
Form DOT F 1700.7 18-61)

Environmental Effects on the Physical Properties of Concrete, the First 90 Days
by
Man Yop Han Mikael P. J. Olsen
Research Report 371-1 Research Study 2-8-85-371
Sponsored by
The Texas State Department of Highways and Public Transportation in cooperation with
The U.S. Department of Transportation Federal Highway Administration
October, 1987
Texas Transportation Institute The Texas A&M University System
College Station, Texas 77843

METRIC (51*) CONVERSION FACTORS APPROXIMATE CONVERSIONS TO SI UNITS APPROXIMATE CONVERSIONS TO SI UNITS
Symbol When You Know Multiply 8y To find Symbol Symbol When You Know Multiply 8y To Find Symbol
LENGTH LENGTH
In inches 2.54 millimetres mm mm millimetres 0.039 inches in ft feet 0.3048 metres m m metres 3.28 feet ft yd yards 0.914 metres m m ~etres 1.09 yards yd ml miles 1.61 kilometres km km kilometres 0.621 miles mi
"-
AREA AREA _
mm' millimetres squared 0.0016 square inches in'
In2 square inches 645.2 millimetres squared mm' m' metres squared 10.164 square feet ft' ft> square feet 0.0929 metres squared m' km· kilometres squared 0.39 square miles mi· yd. square yards 0.836 metres squared m> '" ha hectores (10 000 mi) 2.53 acres ac mi· square miles 2.59 kilometres squared km2
ac acres 0.395 hectares ha - MASS (weight)
g grams 0.0353 ounces oz MASS (weight) kg kilograms 2.205 pounds Ib
Mg megagrams (1 000 kg) 1.103 short tons T oz ounces 28.35 grams 9 -Ib pounds 0.454 kilograms kg"'_ T short tons (2000 Ib) 0.901 megagrams Mg _ VOLUME
mL millilitres 0.034 fluid ounces fI oz L litres 0.264 gallons gal
VOLUME m' metres cubed 35.315 cubic feet ft·
fl oz fluid ounces 29.51 millilitres mL -m' metres cubed 1.308 cubic yards yd'
gal gallons 3.185 litres L -ft· cubic feet 0.0328 metres cubed m' _ TEMPERATURE (exact) yd' cubic yards 0.0165 metres cubed m' -
. • °C Celsius 9/5 (then Fahrenheit OF NOTE: Volumes greater than 1000 L shall be shown In m . temperature add 32) temperature
OF OF 32 98.6 212
TEMPERATURE (exact) :; - -f'i 'I? '.' ,I "f I I,' ~, bo'l~O, I 11~'1' 1,2?O" l -.010 -20 0 20 60 80 100 .. - "C 37 "C
OF Fahrenheit 5/9 (after Celsius °C temperature subtracting 32) temperature These factors conform to the requirement of FHWA Order 519O.1A .
• SI Is the symbol for the International System of Measurements


DISCLAIMER
The information contained herein was developed on Research Study 2-8-85-
371 titled "Environmental Effects on the Physical Properties of Concrete, the First
90 Days" in a cooperative research program with the Texas State Department of
Highways and Public Transportation and the U.S. Department of Transportation,
Federal Highway Administration.
The contents of this report reflect the views of the authors who are responsible
for the facts and the accuracy of the data presented herein. The contents do not nec
essarily reflect the official views or policies of the Federal Highway Administration.
This report does not constitute a standard, specification, or regulation.
11

ACKNOWLEDGEMENTS
The authors wish to acknowledge the contributions of the Texas State Depart
ment of Highways and Public Transportation, as exhibited by the Departmental
personnel who collaborated on this cooperative research effort. In particular, James
M. Sassin and James L. Brown of the Highway Design Division, Fred Schindler and
William E. Elmore of the Materials and Tests Division, and Steven H. Golding of the
Transportation Planning Division provided direction, data, critique, and support in
the research efforts throughout the duration of this project.
Special thanks are further extended to the members of the project advisory
committee, Donald B. Muchaw and Kenneth D. Hankins, District 12, Houston,
Clinton B. Bond, District 20, Beaumont and Harold 1. Surratt, District 24, El Paso
for their time, help and assistance with the identification of construction information
important to this project.
Thanks are also due to the 15 student workers for their invaluable assistance
in the following project tasks: batching and casting concrete; measuring, recording
and calculating data; and making tables and figures for the report.
Finally, thanks go to Bill Parker III and Jimmy Smith of Parker Brothers Co.
Houston, Texas, for the donation of limestone and river gravel to the project and
TXI Cement Manufacturing Co. for the donation of cement to the project.
111
SUMMARY AND IMPLEMENTATION
In order to improve the current design and construction guidelines for a
continuously reinforced concrete pavement (CRCP) that is maintenance free for
at least 20 years, an extensive literature review and laboratory investigations for
physical properties of concrete at early age (less than 90 days) were performed. The
tests conducted can be classified into three categories: strength tests, volume and
weight changes, and other tests. The strength tests include compressive, pullout,
flexural and modified compressive strength; the volume and weight change tests
include shrinkage and weight loss measurements of prisms and moisture content
and moisture loss measurements of cubes. The remaining category of tests include
time of setting test and abrasion resistance by sandblasting.
The nine test parameters investigated in this study are divided into three
categories: environmental factors, material variations and quality control. Since the
full factorials of these parameters are too large to accomplish within a reasonable
time, the total number of tests were therefore reduced to 116, based on typical
materials used and environmental conditions encountered in Texas.
An evaporometer developed by. the Texas State Department of Highways
and Public Transportation was used to measure evaporation rates for several
environmental conditions, and to congregate the environmental factors such as air
and concrete temperatures, relative humidity and wind speed into one variable. The
results showed good correlations with a chart developed by the Portland Cement
Association (PCA) within the ranges investigated and were found to be of great
value in predicting most of the physical properties of concrete, such as strength
development and shrinkage characteristics.
The type of aggregate affects flexural strength, shrinkage and moisture loss
characteristics quite significantly; however, strength and abrasion resistance are not
affected by the type of aggregate. The differences in the results are mainly due to
the differences in porosity and surface texture of the aggregate. Even though some
data scatter was observed, the increase in water content decreases the concrete
quality. In this study, a 1:1 replacement of fly ash was used, which resulted in a
slight strength reduction and different shrinkage and moisture loss characteristics.
Finally, the mixing time was found to be an important factor which affects
selected test results significantly. The extended mixing in hot and dry weather
IV
reduced strength and increased shrinkage and water loss. The consolidation
methods employed did not affect the physical properties of concrete significantly.
In general, however, the vibrating method yielded slightly higher strength, when
compared to the other two methods of consolidation.
v
TABLE OF CONTENTS
DISCLAIMER .......... .
ACKNOWLEDG EMENTS
SUMMARY AND IMPLEMENTATION
LIST OF TABLES
LIST OF FIGURES
I. INTRODUCTION
1.1 General
1.2 Objectives .
1.3 Scope
II. LITERATURE REVIEW
2.1 General ..... .
2.2 Curing of Concrete
2.3 Strength Development and Measurement
Pullout Strength . . . . . .
2.4 Shrinkage and Shrinkage Cracking
Shrinkage ........ .
Shrinkage Cracking
2.5 Factors Affecting Concrete Properties
2.5.1 Environmental Factors
Air Temperat ure .
Relative Humidity
Wind Speed ...
2.5.2 Material Variability
Concrete Temperature
Aggregate Type
Water Content
Mix Design
2.5.3 Quality Control
Time between Mixing and Placement
Consolidation Effort
2.6 Summary
Vl
Page
• 11
111
lV
. x
Xl
1
1
1
2
3
3
3
7
9
12
12
15
17 17 17 19
19
21
21
21
24
24
25
25
25
26
III. EXPERIMENTAL METHODS AND PROCEDURES
3.1 General .............. .
3.2 Development of the Concrete Batch Design
3.3 Development of the Testing Program
3.4 The Batch Process .... .
3.5 Concrete Testing ..... .
IV. DISCUSSION OF THE RESULTS
4.1 Introduction
4.2 Evaporation .....
4.2.1 Evaporation Rate
4.2.2 Conclusion
4.3 Strength Development .
4.3.1 Compressive Strength and Pullout Strength
Moist Cured Condition . . . . . . . .
4.3.2 Flexural Strength and Modified Compressive Strength
Moist Cured Condition
4.3.3 Conclusion
Compressive and Pullout Strength
Flexural and Modified Compressi ve Strength
4.4 Shrinkage and Moisture Variation
4.4.1 Shrinkage and Weight Loss
Moist Cured Condition
4.4.2 Moisture Content and Moisture Loss
Moist Cured Condition
4.4.3 Conclusion
Shrinkage and Weight Loss
Moisture Content and Moisture Loss
Vll
• 28 28
29
37
40 42
· 43
· . 43
· 43
· . 43
· . 47
· 50
• 50
• • 64
68
78 78 78 81
· 83
· 83 102
109
127
131
131
133
4.5 Time of Setting and Abrasion
4.5.1 Time of Setting
4.5.2 Abrasion
Moist Cured Condition
4.5.3 Conclusion
Time of Setting
Abrasion
4.6 Summary
Procedure
Example
V. CONCLUSIONS AND RECOMMENDATIONS
5.1 Conclusions
5.2 Recommendations
REFERENCES
APPENDIX A.
Table AI.
Table A2.
Table A3.
Table A4.
APPENDIX B.
Table BI.
Table B2.
APPENDIX C.
Table CI.
Aggregate Test Results
Coarse aggregate information
Sieve analysis of coarse aggregate
Fine aggregate information . . .
Sieve analysis of fine aggregate
Chemical and Physical Properties of Cement
Chemical analysis of cement
Physical properties of cement . . . . . . .
Water Content and Adjustment for Each Batch
SSD water content and adjustment
for trial batch ........ .
APPENDIX D. Test Result Summary
Table DI. Compressive strength and pullout strength
test results . . . . . . . . . . . . . .
Table D2. 7 day Flexural strength and modified compressive
strength test results . . . . . . . . .
Table D3. Shrinkage and weight loss test results
Table D4. Moisture content and moisture loss test
134
134
138
150
150
150
153
154
161
161
163
163
163
165
173
173
173
174
174
175
175
175
176
176
177
.... 178
181
182
results . . . . . . . . . . . . . . . . . . . . . . . 188
Vl11
Table D5. Time of setting test results 191
Table D6. Sandblasting test results 192
Table D7. Standard test summary 193
APPENDIX E. Average Standard Deviations 195
APPENDIX F. Concrete Mix Data 196
IX
Table 1.
2.
3.
4.
5.
6.
7.
8.
9.
LIST OF TABLES
Experiments and selected material temperatures
Average SSD water content for each test
Experimental design for the effect of air temperature, relative humidity, concrete temperature, wind velocity, aggregate type, and moisture content . . . . . . . .
Experimental design for the effect of aggregate type, moisture content, mixing time, and methods of consolidation on plain and fly ash concrete. . . . . .
Selected SDHPT specifications for CRCP
Conducted tests
Evaporation rate by Evaporometer
Comparison of evaporation rate
Values of half time shrinkage, N 8, and ultimate shrinkage, t~, for the reference
Page 31
. 32
. . 33
34
36
38
44
48
condition of 50°F, 65% RH, and 9 mph wind .... 160
10. Values of 7 day flexural strength for thestan:dard moist curing condition of 73°F and 95% RH. . . . . . . .
x
.... 160
LIST OF FIGURES
Figure 1. Curing effect on compressive strength
2. PCA chart to calculate the rate of evaporation of water from freshly placed concrete . . . . . .
3. Stress and moment of inertia variations at crack
Page .. 5
. 6
position . . . . . . . . . . . . . 8
4. Schematic drawing of pullout test 10
5. Effect of specimen size on drying shrinkage 13
6. Effect of temperature on the compressive strength of type I cement . . . . . . . . . . . . . . . . . . . . 18
7. Water taken up by drying cement exposed for six months to different vapor pressures . . . . . . . . . . .. ..... 20
8. Effect of concrete temperature on slump and on water required to change slump . . . . 22
9. Schematic drawing of evaporometer 39
10. The correlation between evaporometer measurement and PCA chart reading . . . . . . . . . . . . . . . . . . . . . . 46
11. Concrete surface temperature vs time after placement . . . . . . . . . . . . . . . . ......... 48
12. The environmental effects on the compressive strength of 1.5 inch slump concretej a) River gravel b) Limestone ................ . . . . . 51
13. The effect of mixing time and fiy ash on the compressive strength of 1.5 inch slump concrete under severe evaporation conditions (104°F, 30% RH, and 6 mph wind)j a) River gravel b) Limestone . . . . . . 52
14. The effect of aggregate type and slump on compressive strength at 50°Fj a) 65% RH and 9 mph wind b) 30% RH and 6 mph wind . . . . . . . . . . . . . . . . . . 53
15. The effect of aggregate type and slump on compressive strength at 73°Fj a) 65% RH and 9 mph wind b) 30% RH and 6 mph wind . . . . . . . . . . . . . . . . . . 54
16. The effect of aggregate type and slump on compressive
Xl
strength at 104°F; a) 65% RH and 9 mph wind b) 30% RH and 6 mph wind . . . . . . . . . . ....... 55
17. The effect of moist curing and controlling concrete temperature on the compressive strength of 1.5 inch slump concrete. For 30%, 65%, and 95% RH, wind speed 6, 9, and 0 mph respectively; a) River gravel b) Limestone ................ . . . . . 57
18. The effect of consolidation method on compressive strength; a) 3 days b) 7 days ................. 59
19. The effect of consolidation method on compressive strength; a) 28 days b) 90 days ................ 60
20. The correlations between compressive strength and pullout strength; a) 50°F b) 73°F ............... 62
21. The correlations between compressive strength and pullout strength at 104°F . . . . . . . . . . . . . . . . . . . 63
22. The effect of mixing time on compressive strength in moist cured condition for 1.5 inch slump concrete . . . . . . . 65
23. The effect of consolidation method on compressive strength in moist cured condition for 1.5 inch slump concrete. . . . . . . . . . . . . . . . . . . . . . . . 66
24. The correlations between compressive strength and pullout strength in moist cured condition . . . . . . . . . . . . 67
25. The environmental effects on the flexural strength; a) Ri ver gravel b) Limestone ......... ....... 69
26. The effect of mixing time and fly ash on the flexural strength for 1.5 inch slump concrete; a) River gravel b) Limestone ................ .
27. The effect of consolidation method on flexural strength for 1.5 inch slump concrete with river gravel or limestone
. ..... 71
aggregate . . . . . . . . . . . . . . . . . . . . . . . . . . 72
28. The effect of moist curing and controlling concrete temperature on the flexural strength. For 30%, 65%, and 95% RH, wind 6, 9, and 0 mph respectively; a) River gravel b) Limestone ........... ..... 74
29. The correlations between flexural strength and modified compressive strength; a) River gravel b )Limestone . . . . . . 76
Xll
30. The correlations between flexural strength and modified compressive strength at 104°F · · · · · · · · 77
31. The effect of consolidation method on flexural strength in moist cured condition for 1.5 inch slump concrete · · · · · 79
32. The correlations between flexural strength and modified compressive strength in moist-cured condition . · · · · 80
33. The environmental effects on the shrinkage of river gravel concrete with 1.5 inch slump · · · · · 84
34. The environmental effects on the shrinkage of limestone concrete with 1.5 inch slump · · · 85
35. The effects of mixing time and fly ash on the shrinkage of river gravel concrete with 1.5 inch slump · · · · · · 86
36. The effects of mixing time and fly ash on the shrinkage of limestone concrete with 1.5 inch slump · . · · · · · 87
37. The effect of slump and type of aggregate on shrinkage, at 50°F and 65% RH . · . · · · · · · · 89
38. The effect of slump and type of aggregate on shrinkage, at 50°F and 30% RH · · 90
39. The effect of slump and type of aggregate on shrinkage, at 73°F and 65% RH . · · · · · · 91
40. The effect of slump and type of aggregate on shrinkage, at 73°F and 30% RH . · · · · · 92
41. The effect of slump and type of aggregate on shrinkage, at 104°F and 65% RH . · · · 93
42. The effect of slump and type of aggregate on shrinkage, at 104°F and 30% RH · · · · · 94
43. The effect of controlling material temperature on the shrinkage of river gravel concrete with 1.5 inch slump · · · · · 96
44. The effect of controlling material temperature on the shrinkage of limestone concrete with 1.5 inch slump . · · · 97
45. The effect of consolidation method on the shrinkage of river gravel concrete with 1.5 inch slump · · · · 98
46. The effect of consolidation method on the shrinkage of limestone concrete with 1.5 inch slump · · · · 99
47. The correlations between shrinkage and weight loss for
Xlll

different environmental conditions and 1.5 inch slump concrete. For 30% and 65% RH, wind speed 6 and 9 mph respectively; a) River gravel b) Limestone . . . . .. . .... 100
48. The correlations between shrinkage and weight loss for different mixing time and fly ash and 1.5 inch slump concrete in the environment with 104°F, 30% RH, and 6 mph; a) River gravel b) Limestone ... " ...... 101
49. The correlations between shrinkage and weight loss for different type of aggregate at 50°Fj a) 65% RH and 9 mph wind b) 30% RH and 6 mph wind ..... 103
50. The correlations between shrinkage and weight loss for different type of aggregate at 73°Fj a) 65% RH and 9 mph wind b) 30% RH and 6 mph wind ..... 104
51. The correlations between shrinkage and weight loss for different type of aggregate at 104°Fj a) 65% RH and 9 mph wind b) 30% RH and 6 mph wind ..... 105
52. The effect of mixing time on shrinkage in moist cured condition for 1.5 inch slump concrete . . . . . . . . . . . . . . 106
53. The effect of consolidation method on shrinkage in moist cured condition for 1~5 inch slump concrete; a) 7 minutes mixing b) 60 minutes mixing. . . . . . . . . . . . . . . 107
54.
55.
The correlations between shrinkage and weight loss for moist cured condition . . . . . . . . . . .
The environmental effects on moisture contents for 1.5 inch slump concrete; a) River gravel b) Limestone
56. The effect of mixing time and fly ash on moisture contents for 1.5 inch slump concrete; a) River gravel
. 108
.110
b) Limestone ........................ 113
57. The effect of moist curing and controlling concrete temperature on moisture content for 1.5 inch slump concrete; a) River gravel b) Limestone ............. 115
58.
59.
The effect of temperature and slump on the moisture contents at different ages, 65% RH and 9 mph wind
The effect of temperature and slump on the moisture contents at different ages, 30% RH and 6 mph wind
60. The effect of consolidation method and fly ash
XIV
.117
.118
61.
on the moisture content . . . . . . . . . . . . . .
The environmental effects on moisture loss for 1.5 inch concrete; a) River gravel b) Limestone ..... .
62. The effect of mixing time and fly ash on the moisture loss for 1.5 inch slump concrete; a) River gravel
.119
. 121
b) Limestone ............... ........ 122
63. The effect of moist curing and controlling concrete temperature on moisture loss for 1.5 inch slump concrete; a) River gravel b) Limestone . . . . . . . . . .. ..... 124
64. The effect of temperature and slump on the moisture loss at different ages, 65% RH and 9 mph wind . . . . . . . 125
65. The effect of temperature and slump on the moisture loss at different ages, 30% RH and 6 mph wind . . . . . . 126
66. The effect of consolidation method, fly ash, and slump
67.
68.
69.
on the moisture loss at different ages . . . . . . . . . . . . . . 128
The effect of mixing time on moisture change in moist cured condition for 1.5 inch slump concrete; a) moisture content b) moisture loss
The effect of consolidation method on moisture content in moist cured condition for 1.5 inch slump concrete; a) 7 minutes mixing b) 60 minutes mixing ....
The effect of consolidation method on moisture loss in moist cured condition for 1.5 inch slump; a) 7 minutes mixing b) 60 minutes mixing ....
...... 129
. ..... 130
. .. 132
70. The effect of temperature on setting time, for 1.0 inch slump sealed concrete. . . . . . . . . . . . . . . . . . . .. . 135
71. The effect of temperature on setting time, for 1.5 inch slump sealed concrete . . . . . . . . . . . . . . . . . . . .. . 136
72. The effect of temperature on setting time, for 2.0 inch slump
73.
sealed concrete . . . . . . . . . . . . . . . . . . . . 137
The effect of mixing time and fly ash on the setting time, for 1.0 inch slump . . . . . . . . . . . . . . . . . .139
74. The effect of mixing time and fly ash on the setting time, for 1.5 inch slump '. . . . . . . . . . . . . . . • . . . . . . 140
75. The effect of mixing time and fly ash on the setting time, for 2.0 inch slump . . . .. .......... . . . . . 141
xv
76. The effect of slump and aggregate type on the setting time for different temperatures . . . . . . . . . . . . .. .... 142
77. The environmental effects on 90 day abrasion coefficients; a) River gravel b) Limestone. . . . . . . . . . . . . . . . . . 143
78. The effects of mixing time and fly ash on 90 day abrasion coefficients; a) River gravel b) Limestone . . . . .. ..... 145
79. The effects of consolidation methods on 90 day abrasion coefficients; a) River gravel b) Limestone . . .. ...... 146
80. The effects of moist curing and controlling concrete temperature on 90 day abrasion coefficients. For 30%, 65%, and 95% RH, wind speed 6, 9, and 0 mph respectively; a) River gravel b) Limestone. . . . . . . . . . . .. .... 147
81. The correlations between the 28 day and 90 day abrasion coefficients; a) River gravel b) Limestone . . . . .. ..... 149
82. The effect of mixing time and consolidation method on 90 day abrasion coefficients in moist cured condition for 1.5 inch slump concrete ..... . . . . . .. ..... 151
83. The correlatiQnsbetween the 28 day and 90 day abrasion coefficients fbr- moist cured concrete.. . . . .. . . ..... 152
84. Normalized flexural strength versus Evaporometer reading for limestone and river gravel concrete. The reference environmental condition is 73°F, 95% RH, and no wind, and the results represent the average for 1 to 2 inch slump concrete. . . . . . . . . ... ...... 155
85. Normalized half time shrinkage, N 8, versus Evaporometer reading for limestone and river gravel concrete. The results represent the average for 1 to 2 inch slump concrete. The reference environmental condition is 50°F, 65% RH, and 9 mph wind which has the same evaporation rate as the ASTM standard condition of 73°F, 50% RH, and no wind, according to the peA chart (2.) ... . . . . . . . . . 156
86. Normalized ultimate shrinkage, f.~, versus Evaporometer reading for limestone and river gravel concrete. The results represent the average for 1 to 2 inch slump concrete. The reference environmental condition is 50°F, 65% RH, and 9 mph wind which has the same evaporation rate as the ASTM standard
XVI
condition of 73°F, 50% RH, and no wind, according to the PCA chart (~) ....
87. Normalized flexural strength versus Evaporometer reading for limestone and river gravel concrete exposed to 104°F, 30% RH, and 6 mph wind. The results represent the
..... 157
average for 1 to 2 inch slump concrete ..... . . . . . 158
88. Initial and final setting time versus air temperature for sealed limestone and river gravel concrete. The results represent the average for limestone and river gravel concrete with 1 to 2 inch slump concrete ............ 159
XVll
1. INTRODUCTION
1.1 General
Concrete pavements are generally subjected to natural weathering and repeated
traffic loading during their service life. The performance of concrete pavements
depends on the concrete quality, especially on tensile strength, bonding strength,
and shrinkage properties. Proper mixing, placing, and curing are essential in the
production of high quality concrete.
The development of shrinkage cracks at early ages is an important factor in
the durability of concrete. Inadequately controlled cracking generally accelerates
deterioration of a pavement. Moisture control during construction and the curing
period is very important for the development of crack spacing within a reasonable
range.
The loss of moisture depends on an intricate relationship of environmental con
ditions such as temperature, humiditYl and wind speed. Besides those parameters,
length of time between mixing and placement, concrete temperature at placement,
degree of consolidation, and aggregate type will influence the physical properties of
concrete significantly. Major findings in the above areas over the past few years are
presented in the next chapter.
1.2 Objectives
The objectives of this study are to examme the factors that influence the
development of the physical properties of concrete pavements during the first
90 days, and to develop procedures for using these physical properties to more
accurately predict the performance of those pavements. Specifically, the following
were investigated:
1. W'ays to assure retention of sufficient moisture to develop the full potential
of strength and durability, and
2. Shrinkage crack development as a function of changes in moisture condition
brought about by changes in the envirullment.
1
1.3 Scope
In this research, the effect of most of the possible factors which affect the
development of early physical properties of concrete was investigated. The majority
of those factors are believed to influence the concrete properties by influencing the
moisture movement, hydration and density.
The variables which are considered in this research have many combinations.
The research effort was therefore divided into the following three parts:
The first part of the laboratory study investigated the effect on strength, shrink
age, moisture content, weight loss, and abrasion resistance of nine combinations of
air temperature, relative humidity, wind speed, and concrete temperature '",hich
are commonly encountered in Texas. These nine environmental combinations were
combined with varying water content and aggregate type for a total of 54 test
conditions in this step.
The second step investigated the effect of a severe Texas environmental condi
tion and 30 different combinations of aggregate type, water content, mixing time,
mix design, and method of consolidation. The severe environmental condition was
one of the nine combinations in the initial part. The total number of test conditions
in this step was also 54.
The final step investigated the concrete properties under a standard environ
mental condition. This standard condition was also one of the nine environmental
combinations above for reference purposes. The effect of consolidation effort and
mixing time was also investigated in this step for a total of nine tests.
Compressive strength, flexural strength, shrinkage, water loss characteristics,
abrasion, and pullout strength were measured for each test. Unit weight, air content,
slump, and time of setting were measured for each batch for quality control purposes.
In connection with the measurement of water loss, the Evaporometer developed by
the Materials and Tests Division CD-g) of the Texas State Department of Highways
and Public Transportation for measuring evaporation rates (1) was used and the
results were calibrated with actual water loss values, and the PCA Evaporation
Chart (.f.).
2
II. LITERATURE REVIEW
2.1 General
Like any other type of concrete structure, the performance of concrete pave-
ments is influenced by factors that can be classified into the following categories:
1. Environmental factors
2. Construction
3. Materials selection and design, and
4. Magnitude and frequency of loading.
The material response to the above factors is of a combined nature, thus making an
exact analysis of this response complex. A careful consideration and understanding
of how each factor affects the concrete individually is, however, imperative. In
addition, some of the complexity can be reduced by first examining the factors
indi vid ually.
In the case of CRC pavements, a careful examination of the following phenom-
ena IS necessary:
1. Concrete Curing
2. Strength development, and
3. Shrinkage and shrinkage cracking
since these three items have been shown to influence the performance of CRC pave
ments (3., 1, ~). While they can be viewed as strictly materials properties by them
selves, they can (and should) also be viewed as a result of the construction pro
cedures, quality control employed, materials variability, and environmental factors
existing at the time of construction. To investigate the causes of poor pavement
performance and to improve the current design and construction procedures, the
following summary of the State-of-the-Art provides a basis for this study.
2.2 Curing of Concrete
Proper curing by maintaining adequate moisture and temperature is very
important for the production of good quality concrete. If proper curing is not
3
applied, strength, impermeability, dimensional stability, and wear resistance of
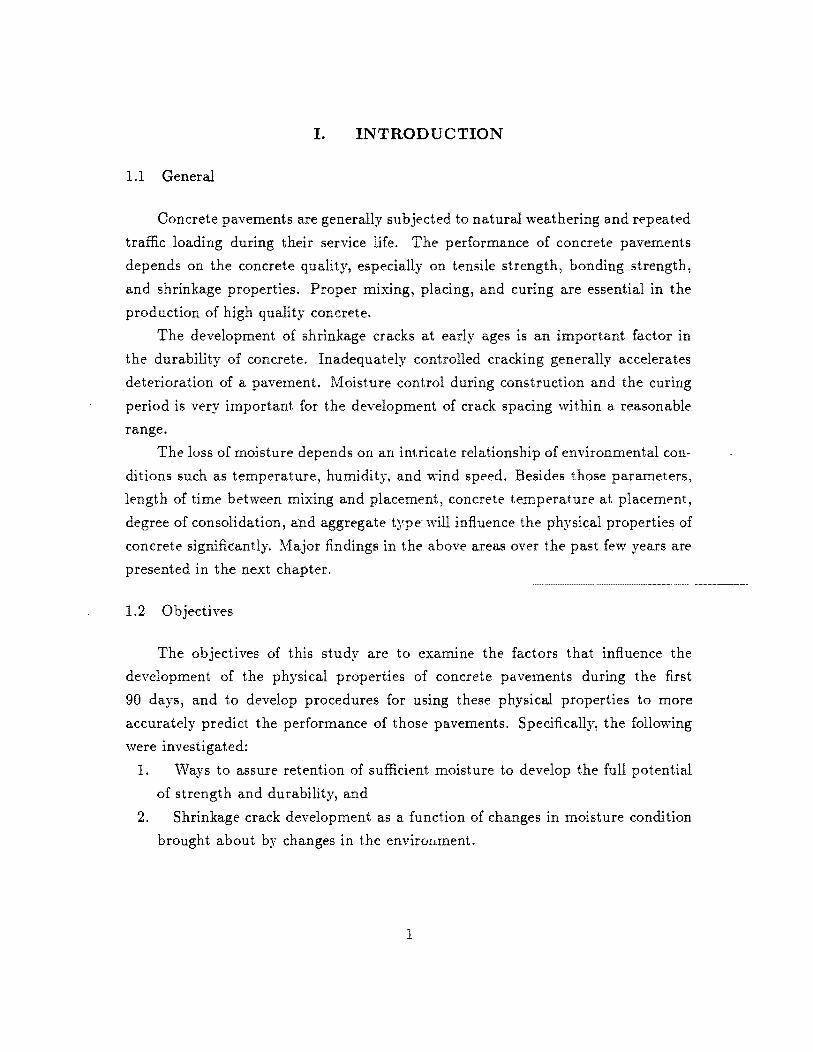
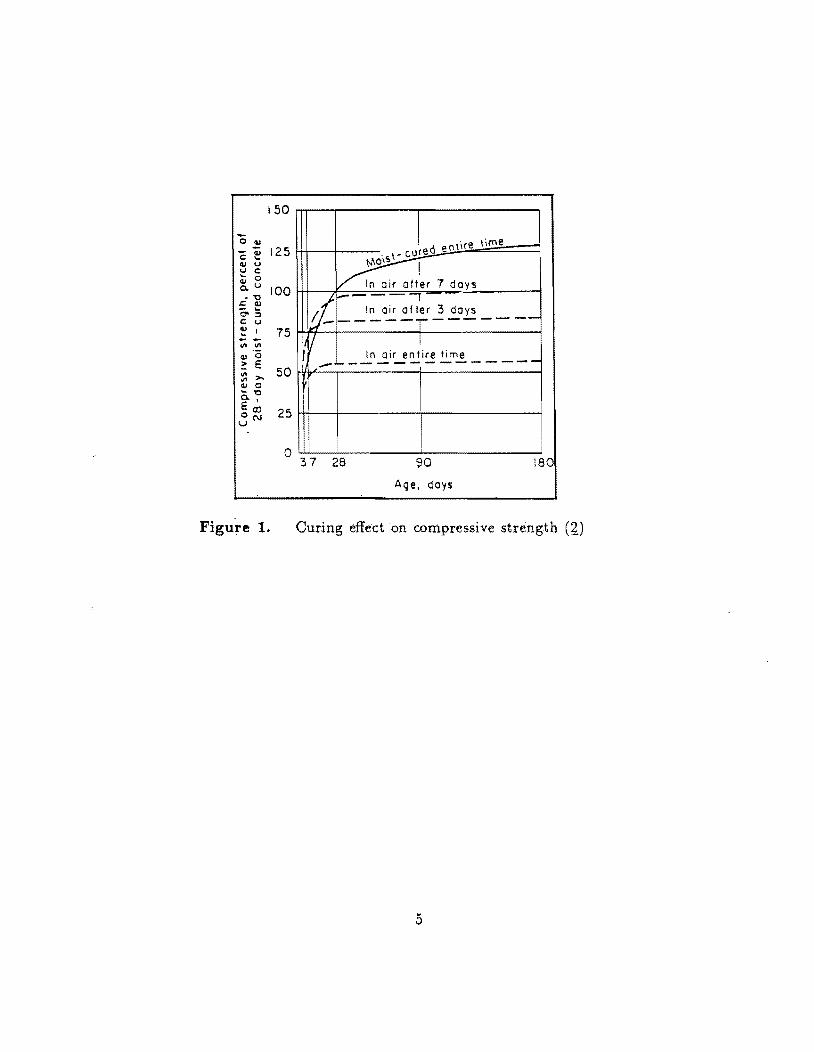
pavement are affected adversely (§). The effect of curing on compressive strength
is shown in Figure 1 (~). The figure shows that once the specimens are exposed in
air, the compressive strength development virtually ceases. Although an increase
in early strength gain can be observed, the ultimate strength of the specimens is
significantly lower than for a moist cured specimen. If the specimens are exposed
in air throughout their lives, their ultimate strengths are less than half that of the
moist cured specimen.
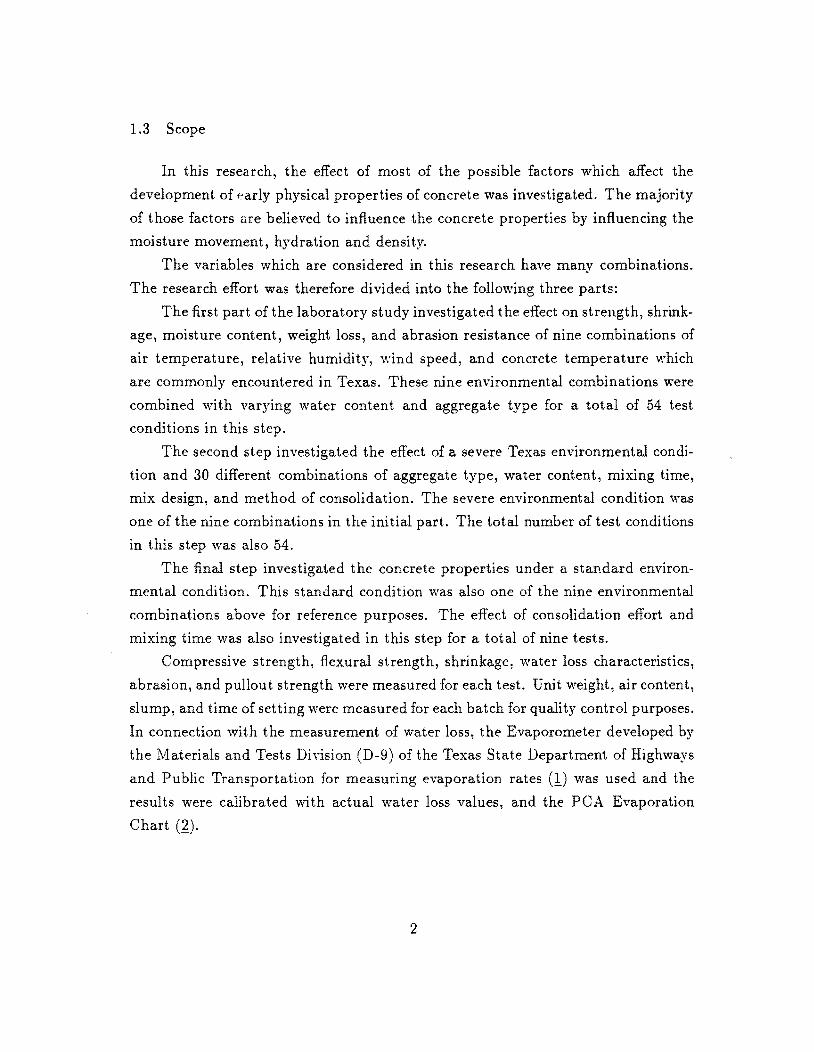
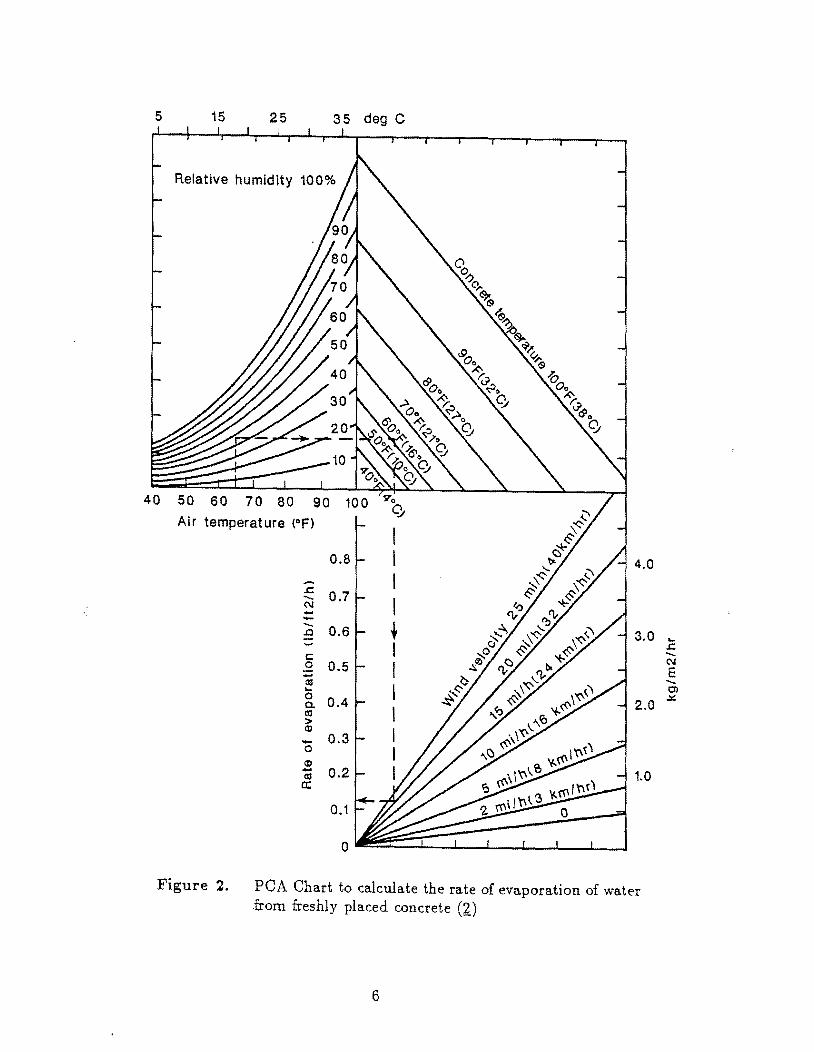
Surface properties of portland cement concrete are significantly affected by
evaporation, the degree of which is a function of environmental factors such as air
temperature, relative humidity, and wind speed (§). The environmental factors
are not generally easy to control. Many attempts have been made to predict
the combined effect of environmental factors (~, §). Figure 2 (~) is a fairly well
known chart which can predict the evaporation rate under a given environmental
condition. A study performed by Texas Transportation Institute (TTl) (Q, §)
revealed contradictory findings and the validity of Figure 2 was questioned. The
contradictory findings have, however, not been repeated in this present study and
explanations are offered for their presence in the previous TTl study (See Section
4.2).
Excessive moisture loss should be prevented in order to allow complete hydra
tion. Some curing compounds have been developed to retard evaporation and to
ensure continuous hydration under low relative humidity conditions. The effects
of curing compounds such as monomolecular film (MMF), water soluble linseed oil
(WSLO), white pigmented compound (WPC), and their combinations in retaining
the moisture in concrete have been investigated (§). These curing compounds were
effective in the laboratory test. However, field observations en indicate that curing
compounds are not as effective there as in the laboratory in allowing full devel
opment of the strength and modulus of elasticity of concrete. Continuous moist
curing, if possible, is the best method for curing concrete (1).
It is reported that plain concrete requires at least 3 to 4 days curing (~).
Another report suggests that 5-day curing is adequate for warm and hot weather,
and 7-day curing for cold weather C~). However, some PCC overlays have been
4
150
125
100
75
50
25
o
Figure 1.
I'd """ lime
~ \,<\01 I
In air after 7 days 1--- ""1 I. In air after 3 days -·-----T-------In aIr entIre tIme li/.L . I, ,
i~ - -------------
t\
II 37 29 90
Age, days
180
Curing effect on compressive strength (f.)
5
5 15 25 35 deg C
Relative humidity 100%
Ai r temperat ure (OF)
0.8 4.0
--.s= 0.7 ...... (\./ --"'-
0.6 3.0 .Q
c: 0 0.5 :: al ... 0 0.4 2.0 a. al > Q)
-0 Q)
1.0 -al a:
Figure 2. PCA Chart to calculate the rate of evaporation of water from freshly placed concrete (2.)
6
... .s= ..... (\./
E ...... en .:.::
put into service immediately following a 24-hour curing period by using high early
strength concrete (10).
2.3 Strength Development and Measurement
The strength of hardened concrete is considered to be the most important
property of concrete, although in many practical cases other properties, such as
durability, volume stability, and impermeability may be more significant (ll). It
is also generally accepted that an improvement of strength will improve the other
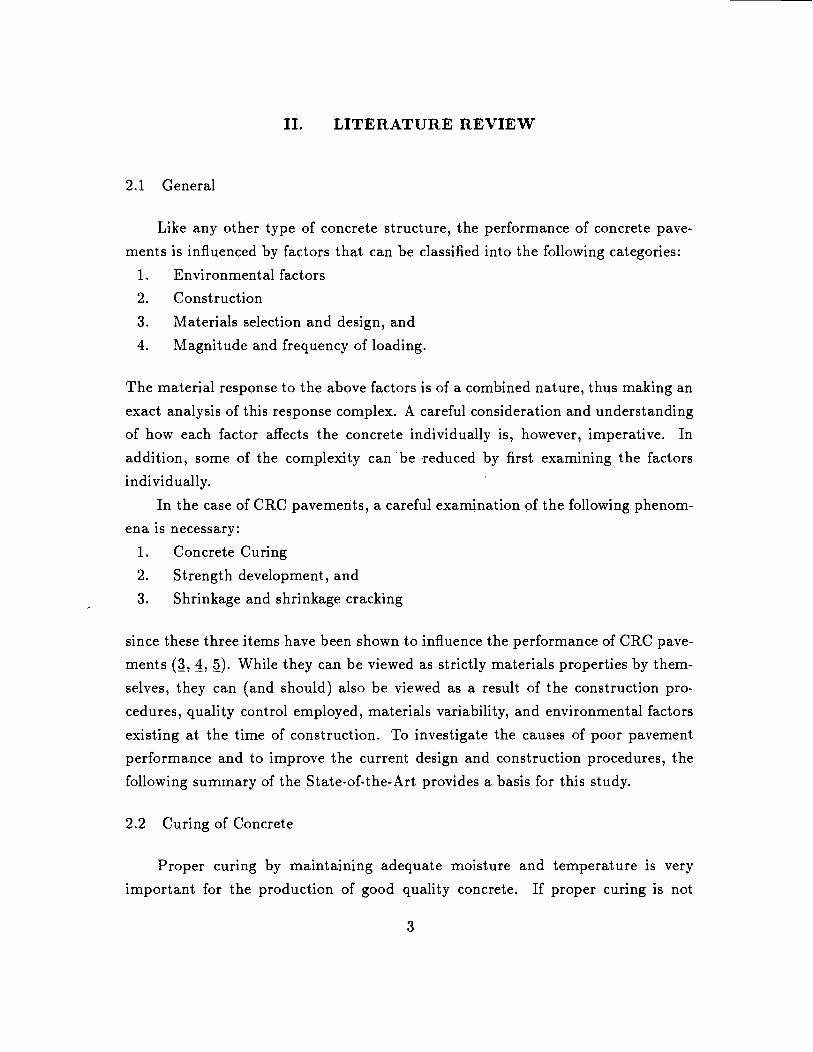
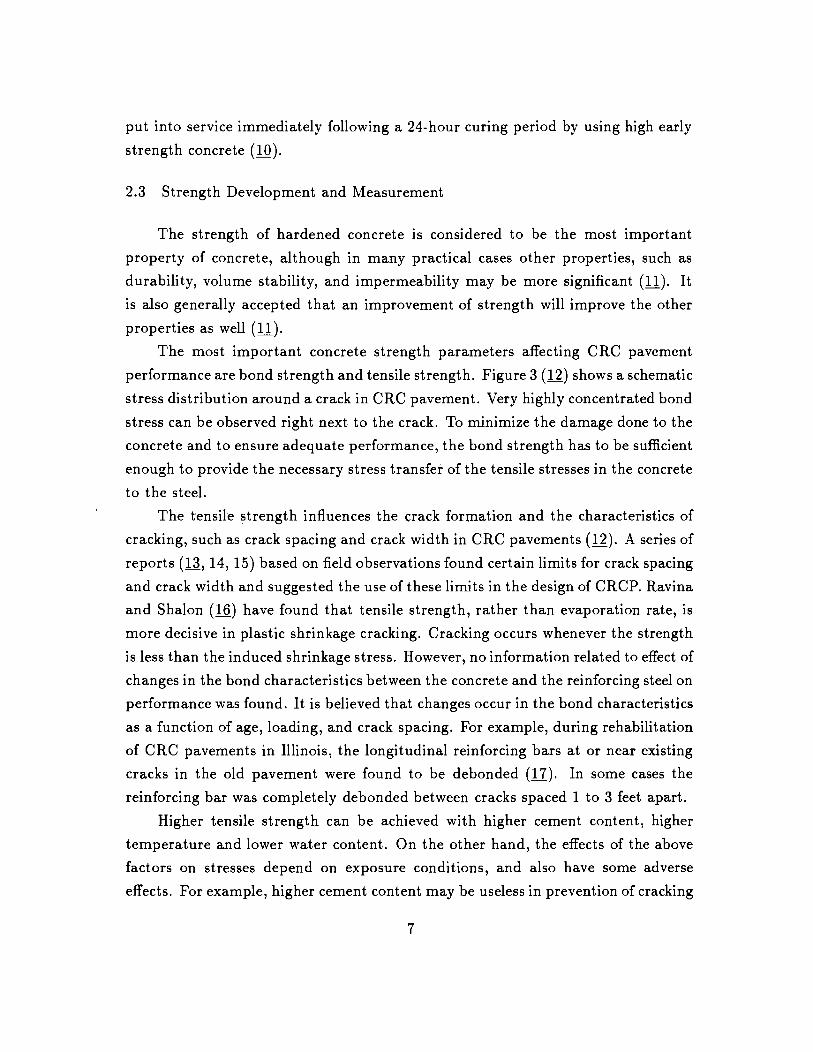
properties as well (ll). The most important concrete strength parameters affecting CRC pavement
performance are bond strength and tensile strength. Figure 3 (12) shows a schematic
stress distribution around a crack in CRC pavement. Very highly concentrated bond
stress can be observed right next to the crack. To minimize the damage done to the
concrete and to ensure adequate performance, the bond strength has to be sufficient
enough to provide the necessary stress transfer of the tensile stresses in the concrete
to the steel.
The tensile strength influences the crack formation and the characteristics of
cracking, such as crack spacing and crack width in CRC pavements (12). A series of
reports (13, 14, 15) based on field observations found certain limits for crack spacing
and crack width and suggested the use of these limits in the design of CRCP. Ravina
and Shalon (16) have found that tensile strength, rather than evaporation rate, is
more decisive in plastic shrinkage cracking. Cracking occurs whenever the strength
is less than the induced shrinkage stress. However, no information related to effect of
changes in the bond characteristics between the concrete and the reinforcing steel on
performance was found. It is believed that changes occur in the bond characteristics
as a function of age, loading, and crack spacing. For example, during rehabilitation
of CRC pavements in Illinois, the longitudinal reinforcing bars at or near existing
cracks in the old pavement were found to be debonded (17). In some cases the
reinforcing bar was completely debonded between cracks spaced 1 to 3 feet apart.
Higher tensile strength can be achieved with higher cement content, higher
temperature and lower water content. On the other hand, the effects of the above
factors on stresses depend on exposure conditions, and also have some adverse
effects. For example, higher cement content may be useless in prevention of cracking
7
tf ~r 1, M r---::::;:tHd xl+:b--J,::, ====:2j M
1-A. Cracked slab portion
1-8. Longitudinal tensile stress in the steel (schematic)
I
~ 1-C. Bond stress (schematic)
. Figure 3. Stress and moment of inertia variations at crack position (12)
8
because the stress may increase as much or more than the additional strength gain
under hot weather conditions (16). A rational computer model for the prediction
of crack spacing and strength development in CRC pavements is the subject for a
companion report, 371-2F, titled "A Rational Computer Model for Continuously
Reinforced Concrete Pavements."
In order to provide a reasonable level of serviceability of pavement, the
resistance to surface wear due to traffic vehicles has to be maintained together
with tensile strength. ACI Committee 201 (18), however, states that it is not
possible to set precise limits for abrasion resistance of concrete. Several factors
such as compressive strength, aggregate type, finishing and curing method affect
the abrasion resistance of concrete (18). Tests (19, 20) and field experience have
generally shown that compressive strength is by far the most important single factor
controlling the abrasion resistance of concrete.
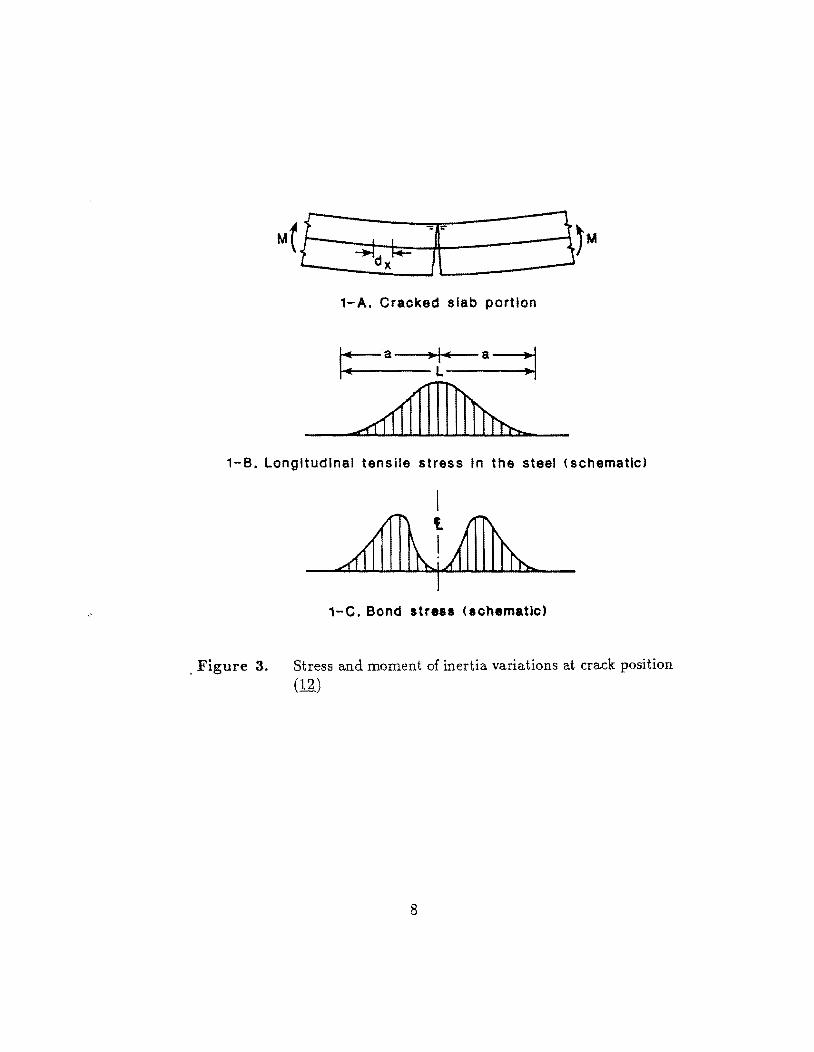
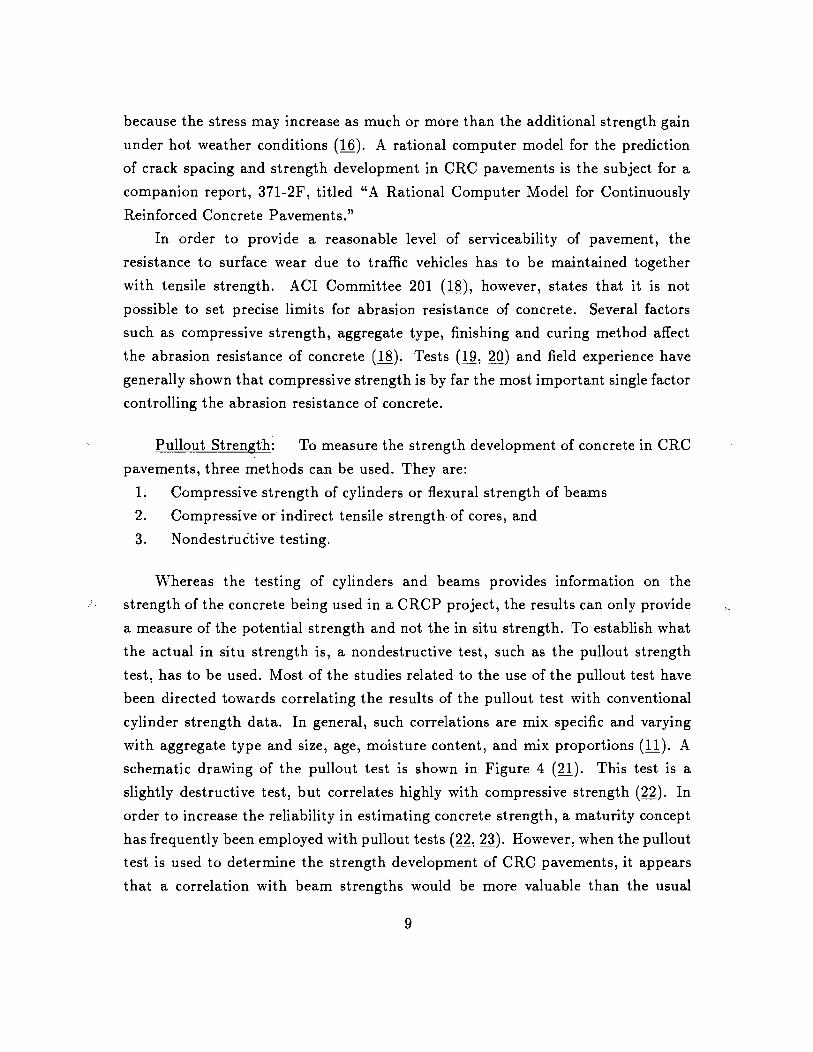
Pullout Strength: To measure the strength development of concrete in CRC
pavements, three methods can be used. They are:
1. Compressive strength of cylinders or flexural strength of beams
2. Compressive or indirect tensile strength of cores, and
3. NondestruCtive testing.
'Whereas the testing of cylinders and beams provides information on the
strength of the concrete being used in a CRCP project, the results can only provide
a measure of the potential strength and not the in situ strength. To establish what
the actual in situ strength is, a nondestructive test, such as the pullout strength
test, has to be used. Most of the studies related to the use of the pullout test have
been directed towards correlating the results of the pullout test with conventional
cylinder strength data. In general, such correlations are mix specific and varying
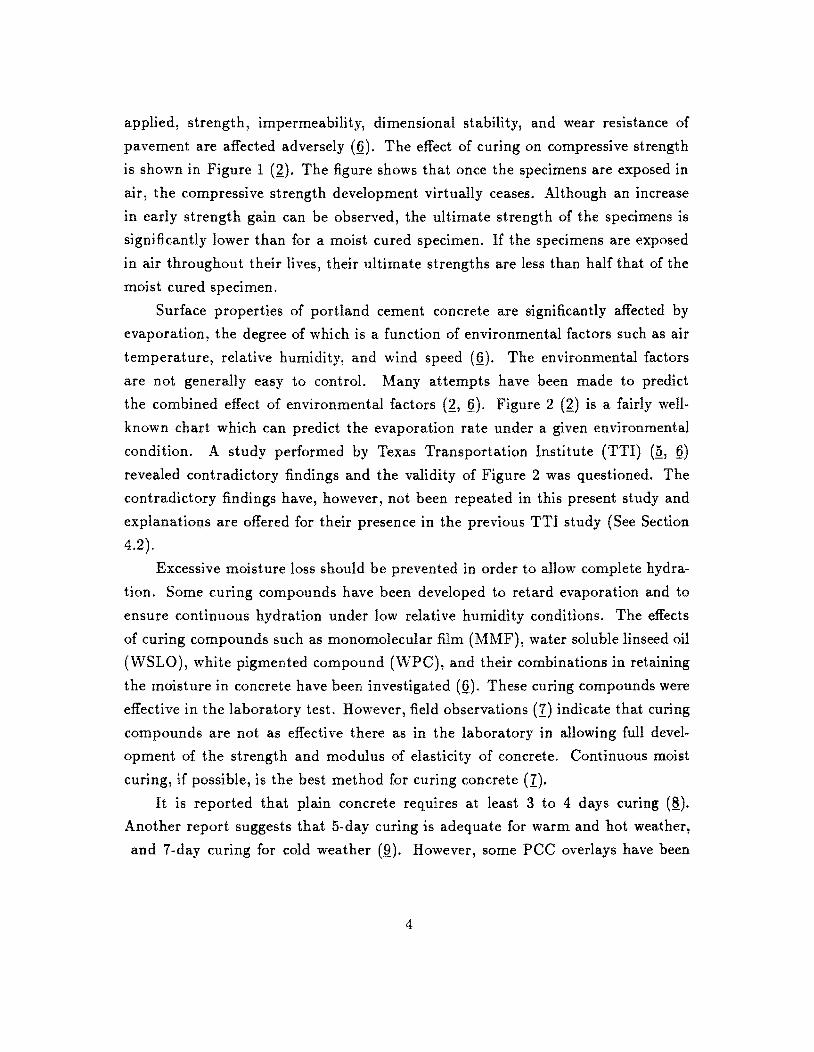
with aggregate type and size, age, moisture content, and mix proportions (11). A
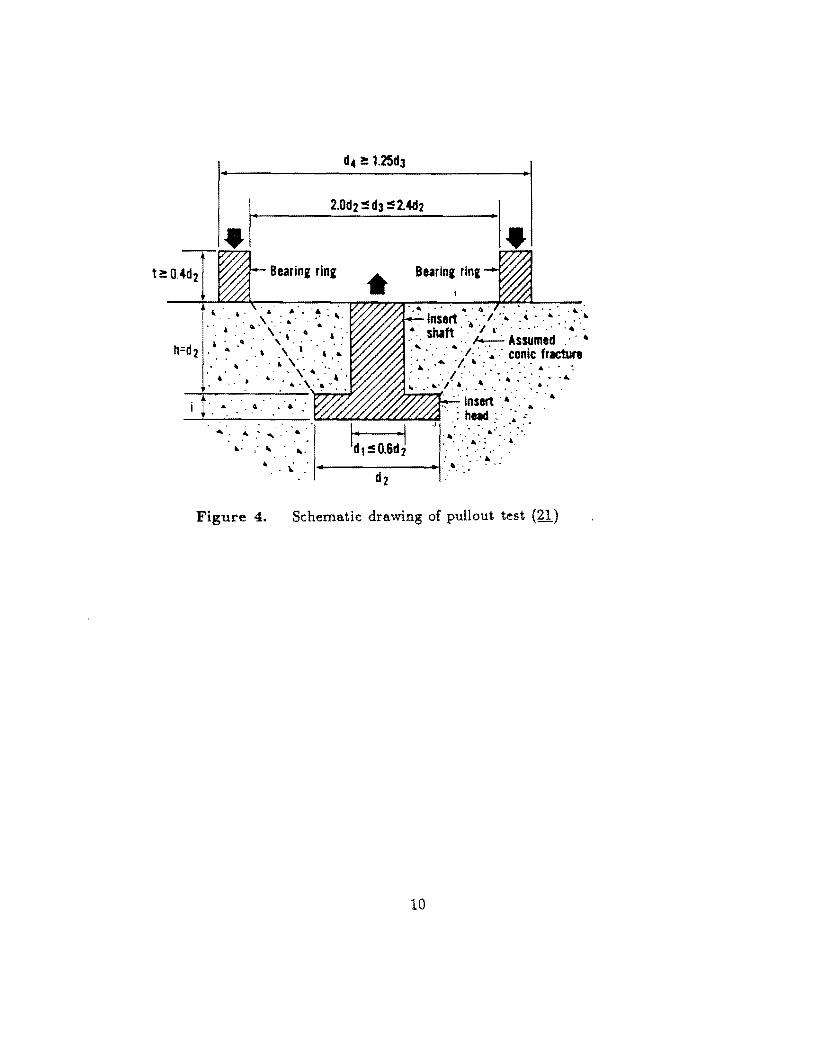
schematic drawing of the pullout test is shown in Figure 4 (21). This test is a
slightly destructive test, but correlates highly with compressive strength (22). In
order to increase the reliability in estimating concrete strength, a maturity concept
has frequently been employed with pullout tests (22, 23). However: when the pullout
test is used to determine the strength development of CRC pavements, it appears
that a correlation with beam strengths would be more valuable than the usual
9
•
t!: O.4d2 Bearina rina Bearina rina
.• ' 10' , •• ' '," ,.,.' ,-4' . . .. '-.' • ~' .... ,.,: .. , ' .. ~ .. ': . Insert ' .. '/ ....... ~ ....... :'
' .. , ... 4 &. '.' shaft ..•. , t·:·, ..... '., . • . .' " . .' '. " ~ Assumed .. ' 4
.. " \ I :'" .: .' ... I ... ~.: conic fracture . ' ~ : .:~ .. :< ... ~>': (":: ~~>:.:.~:: "'~ <>: .::~ ".~" t· .. ..... .' Insert .•.. ' .. ! . "' ... 6. .' ... • ". : had . : '''.. .
. . . .'. 1oI;.j""""'~:..L.o:~""'~"""".1 ':'. '.' .. ::.-: •... ~ .. .... .... ' ~ .' .' '. ... . . . . . .... . ... ,. :.. . ,. . .' .. .... : .... ~ : I---------J·.': ___ d2
Figure 4. Schematic drawing of pullout test (21)
10
correlation with the standard cylinder strengths since the beam strength is widely
used in Texas during pavement construction. Factors such as the geometry of the
pullout specimen, depth of embedment, and size of aggregates in the concrete remain
equally important when interpreting the pullout test results.
A series of tests was performed by Stone and Giza (24) to investigate the effect
of changes in geometry of the test apparatus and the effect of various concrete
aggregate properties on the reliability of the pullout test. They found that for a
fixed value of cylinder compressive strength, the average of the ultimate pullout
load decreased nonlinearly with increasing apex angles and with decreasing depth
of embedment. They also found that the aggregate located in the failure plane
played a significant role both in average and deviations of pullout load (24).
The variations of ultimate pullout load for concrete specimens are not sig
nificantly different for the apex angles between 58 and 86 degrees, but there are
significant differences between apex angles of 46 and 30 degrees (24). The apex
angle specified in the current ASTM spet:ification C-900 falls between 54 and 70
degrees (21).
The effect of embedment with a constant apex angle of 58 degrees has also
been studied, arid ther'esults indicate that the variati~ns of ultimate pullout load
for concrete increase with increasing depth of embedment beyond a depth of one
inch and with no significant difference detected aJ depths of one inch or less (24).
Concrete mixt ures containing aggregate sizes up to 3/4 inch have approximately
the same average ultimate pullout load. As for the deviation of the load, concrete
mixtures with an aggregate size of 3/4 inch have significantly higher variation than
mixtures with a smaller aggregate size (24). In general, a greater diameter of insert
is required for a greater aggregate size.
A number of investigations have proven the pullout tests performance for
evaluation of in situ concrete strength (24, 25). Sometimes inserts were placed
by hand on site, and it was concluded that more care and improvements for the
equipments and the techniques of placing and extracting the inserts were needed
(26).
11

2.4 Shrinkage and Shrinkage Cracking
Shrinkage: There are four types of shrinkage:
1) Plastic shrinkage which occurs within the first few hours after placing,
2) Autogeneous volume change which occurs because of hydration,
3) Carbonation shrinkage which occurs as a result of chemical reaction
between hydration products and carbon dioxide, and
4) Drying shrinkage which is associated with the loss of water.
The drying shrinkage which is measured in the laboratory includes both drying
shrinkage and autogeneous volume change (27).
The shrinkage of concrete is for the most part caused by the contraction of the
cement paste due to drying. As the cement paste dries and shrinks, its motion is
restrained by the aggregate embedded in it. The degree ofthis restraint to shrinkage
depends on the amount and the stiffness (modulus of elasticity) of the embedded
aggregate (28, 29, 30).
Hansen and Mattock (31) reported that a linear relationship exists between
shrinkage strain and the ratio of volume to surface area (vis) of the specimen.
Their results were verified under laboratory conditions, with 70°F and 50 % relative
humidity. Their experiment indicates that the shrinkage of small specimens is
generally greater than the shrinkage for the actual size of a structure. Similar
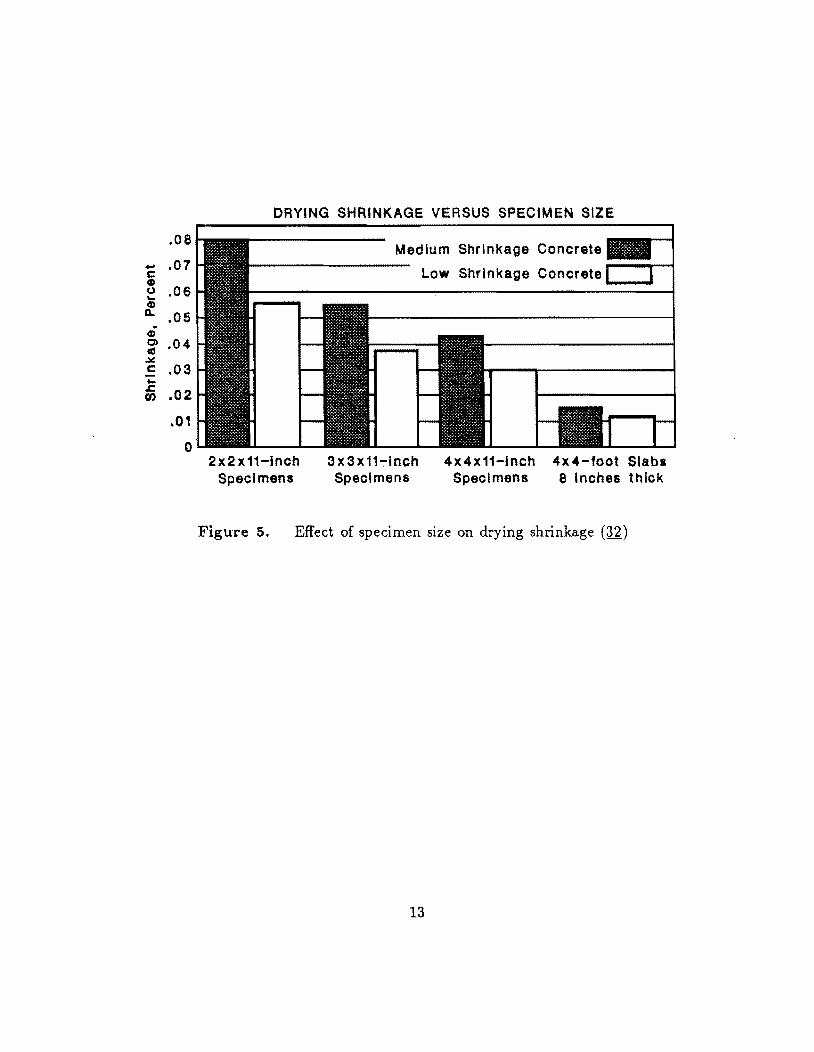
results were reported by Kraai (32) in 1984. He suggested that a 4-foot square
8-inch thick slab gave almost the same result as field measurements. The results of
Kraai's investigation (32) is summarized in Figure 5. It can be observed that the
shrinkage value of laboratory specimens can be two to six times greater than the
the shrinkage of a 4-foot square 8-inch thick slab depending on the specimen size.
The smaller the size, the greater the difference is. The comparisons are based on
tests of 4x 4x 11 - inch prisms and 4-foot square slabs 8 inches thick. The prisms
were tested according to ASTM C-157, but the slabs were 100 percent field cured.
Note that the highest shrinkage occurs with the smallest specimen (11, 33).
A similar study performed in Texas (34) found that shrinkage of specimens
stored in open air was smaller than that of companion specimens stored in the
laboratory at constant temperature and relative humidity, by a factor of 0.62 or
0.82, depending on the field location. The two factors were obtained from the
12
.08
- .07 c CD 0 .06 "-CD
CL .05 ~
CD C) .04 a:I .¥ c .03 ... s::. .02 UJ
.01
0
DRYING SHRINKAGE VERSUS SPECIMEN SIZE
Medium Shrinkage Concrete
--------- Low Shrinkage Concrete ,....-..---1
2x2x11-lnch Specimens
3x3x1171nch Specimens
4x4x11-lnch 4x4-foot Slabs Specimens 8 Inches thick
Figure 5. Effect of specimen size on drying shrinkage (32)
13
Dallas and Odessa areas, respectively.
Hansen and Mattock (31) also suggested that shrinkage can be estimated using
a hyperbolic function of time. The proposed function is:
where €II = shrinkage strain
€': = ultimate shrinkage strain
t = time in days since measurements begin
N II the time in days to reach half of €':
In the equation, the shape and size effect is included in the coefficient N 6 as
a volume/surface ratio (v / s). Both the final shrinkage strain and the coefficient
N II were found to be linearly proportional to the volume/surface ratio in semi
logarithmic plot (31).
However, there are several different ways to interpret the factors in the
equation. ACI committee 209 (35) used the equation to predict shrinkage as a
function of time. In their report several other factors such as initial moist curing,
ambient relative humidity and temperature, and the v /s ratio are considered in the
coefficient of the equation. The coefficient of shrinkage half time, N 8, is assumed to
be constant and only the ultimate shrinkage, €,:, is assumed to be affected by the
above factors. On the other hand, a more recent study (36, 37) claims that the size
and shape of specimen affects the shrinkage half time, N 6, rather than the ultimate
shrinkage, €,:. In order to reduce the rate of slump loss and water requirement, and to obtain a
uniform time of setting under hot weather conditions, retarders (type B) and water
reducing retarders (type D) specified in ASTM C-494 are often used. Retarders
(sodium ligno-sulphonate) tested by Shalon and others (16, 38, 39) showed, as
expected, a later transition time, and increased total early plastic shrinkage when
compared to plain mortar (1.3 % against 0.93 %) (38). The increased shrinkage is
due to the increased time in the plastic stage of paste and possible changes in paste
microstructure (39).
Sometimes shrinkage compensating cement concrete is used to reduce shrinkage
cracking. Fifty-nine investigated concrete structures were, on the average, rated
14

with very good performance in reducing drying shrinkage cracks (40). However, the
use of this type of cement has some side effects which stem mainly from the control
of the initial expansion.
When the shrinkage data are analyzed and used for predicting time dependent
variations, three types of errors can be involved (40): 1) variations of material
properties, 2) variations in environmental conditions, and 3) variations of shrinkage
mechanism. A statistical process called the Bayesian method, which can eliminate
the variations of material properties, has been suggested and its performance has
been proven. This approach is based on the short term data and extrapolation
method (41, 42, 43). Another study (44) based on spectral analysis of a stochastic
process tried to eliminate the randomness of shrinkage and to calculate the random
shrinkage stress.
Shrinkage Cracking: Plastic shrinkage without cracking is not objectionable
(45). During the service life of the concrete, however, it is possible for the plastic
shrinkage cracks to join each other and form cracks that extend through the concrete
section. Initial cracks (microcracks) cannot be observed until the cracks grow large
enough and become macro cracks (42). However, their influence on the strength
properties of the concrete specimen cannot be neglected. Short term preloading
may change the test results significantly due to micro cracking (45, 46).
Cracking is unavoidable for freshly placed concrete in most cases. Although
cracking is unavoidable, it will not be detrimental to concrete serviceability if the
cracking can be controlled within a reasonable range (Q., 21). Lerch (45) reported
that plastic shrinkage cracks are not usually progressive, even though they have
considerable depth.
The evaporation rate, which is a function of environmental factors, is the
most important factor affecting plastic shrinkage and plastic shrinkage cracking
of concrete (Q, 38). It is believed that cracking takes place whenever the rate
of evaporation is greater than the rate at which water rises to the surface of
the recently placed concrete (bleeding) (~). Moisture migration from concrete to
the environment is a very important phenomenon for shrinkage and creep, but
unfortunately, also a very complex phenomenon to analyze. Moisture movement
in concrete takes place in two basic phases, vapor and liquid phases, through a
combination of several mechanisms which vary as the moisture content of concrete
15
varies (47). Heat transfer, occurring in combination with moisture transfer, makes
the phenomenon even more complex. Siang (47) has constructed a computer
program which can consider the combined effect of heat and mass transfer through
concrete. The main problem with this program is that it requires knowledge of
physical constants that are difficult to determine experimentally for some specific
mIxes.
The type of cement also affects the moisture migration and shrinkage of
concrete. A study (48) on the correlations between moisture and shrinkage
characteristics of paste and concrete concluded that the type of cement affects
the moisture migration properties and shrinkage. The rate of hydration and micro
structure of the concrete are other factors which influence the plastic shrinkage and
plastic shrinkage cracking by changing the diffusivity of concrete (38).
The Portland Cement Association (PCA) (2, ~) recommends that if the rate
of evaporation exceeds 0.2 lbjsqftjhr, the following special treatments are needed
to minimize the possibility of plastic shrinkage cracking (~):
1) Dampening of subgrade and formwork,
2) Placement of the concrete at the lowest practical temperature,
3) Erection of windbreaks and sunshades,
4) Reduction of the time between placement and start of curing,
5) Minimization of evaporation, particularly during the first few hours
subsequent to placing concrete, by a suitable means such as applying
moisture by fog spraying.
Ravina and Shalon (49), however, reported that short-time bleeding mortar
did not crack under a highly evaporable condition which generated heavy shrinkage
cracking in long-time bleeding mortar. Even though long-time bleeding mortar
showed a delay of subsurface evaporation at the onset of shrinkage, the total
shrinkage was more than double that of the short-time bleeding mortar. They
found no correlation between bleeding and cracking and concluded that the above
bleeding hypothesis was incorrect for total plastic shrinkage and plastic shrinkage
cracking (49).
In the same study Ravina and Shalon (49) also found that direct exposure
to solar radiation may not cause plastic shrinkage cracking despite the increase in
evaporation. The reason for this is that the consistency of the concrete affects
16
the rate of strength development and that a reduction in the rate of strength
development may be more decisive than the reduction of stress and restraint
obtained by increasing the consistency of the concrete. Other laboratory results
support their conclusions (50).
Presetting cracking, which depends on differential settlement rather than on
the magnitude or rate of bleeding, is often coupled indiscriminately with plastic
shrinkage cracking, thus causing erroneous conclusions. Differential settlement, a
result of flash set due to a very low gypsum content, is the cause of the presetting
cracking (49).
A computer program, which can calculate deflections and stresses in an
unreinforced concrete pavement slab that is subjected to variable temperature and
humidity, was used to analyze the thermal properties, elastic properties and time·
dependent properties. The results suggested that the following methods would be
helpful for reducing cracking (51):
1) Increase the thickness of slab,
2) Decrease the plan dimensions of the slab,
3) Reduce soil stiffness, and
4) Maintain a low concrete temperature.
2.5 Factors Affecting Concrete Properties
2.5.1 Environmental Factors
Air Temperature: It is generally accepted that high temperatures have, in
many respects, only detrimental effects on concrete properties. High temperatures
during the curing period, resulting in significant shrinkage, have been reported as the
cause of erratic and closely spaced crackings of CRC pavement (52, 53, 54). When a
pavement is cured under lower temperatures and more humid conditions, desirable
crack spacing and crack patterns can be developed (55, 56). Similarly, a pavement
placed and cured under a lower differential temperature between placement and
curing periods would be expected to develop more uniform crack spacings (57, 58).
The environmental conditions primarily affect the top of the slab and not the
bottom (ft). The concrete in high temperatures develops high early strength, but
will have lower ultimate strength. Figure 6 (59) shows the dependency of strength
17

II)
> II) 160 II) "0 II) II)
~ -a. as E £ 0 "0 120 u c
U- ti • Q C') < .... eo ~ - 0 0 .c II) -QQ as c - II) 40 c "-II) -Q C/) ~
II)
Cl.
0 '1
Figure 6.
TYPE 1 CEMENT
NO CaCI 2
105°F
120°F
All at 73°F, 100% Relative Humidity
3 7 28 90 365 Age of Test (Daya)
Effect of temperature on the compressive strength of type I cement; Air content, 4 ± t percent; cement
content, 5.5 sacks per cubic yards (59).
18
development on the temperature.
Undesirable hot weather effects on fresh concrete include (~, 16):
1) Increased water demand,
2) Increased rate of slump loss,
3) Increased tendency for shrinkage cracking, and
4) Increased difficulty in controlling entrained air content.
Undesirable hot weather effects on hardened concrete include:
1) Decreased strength because of high water demand,
2) Decreased durability, and
3) Decreased uniform surface appearance.
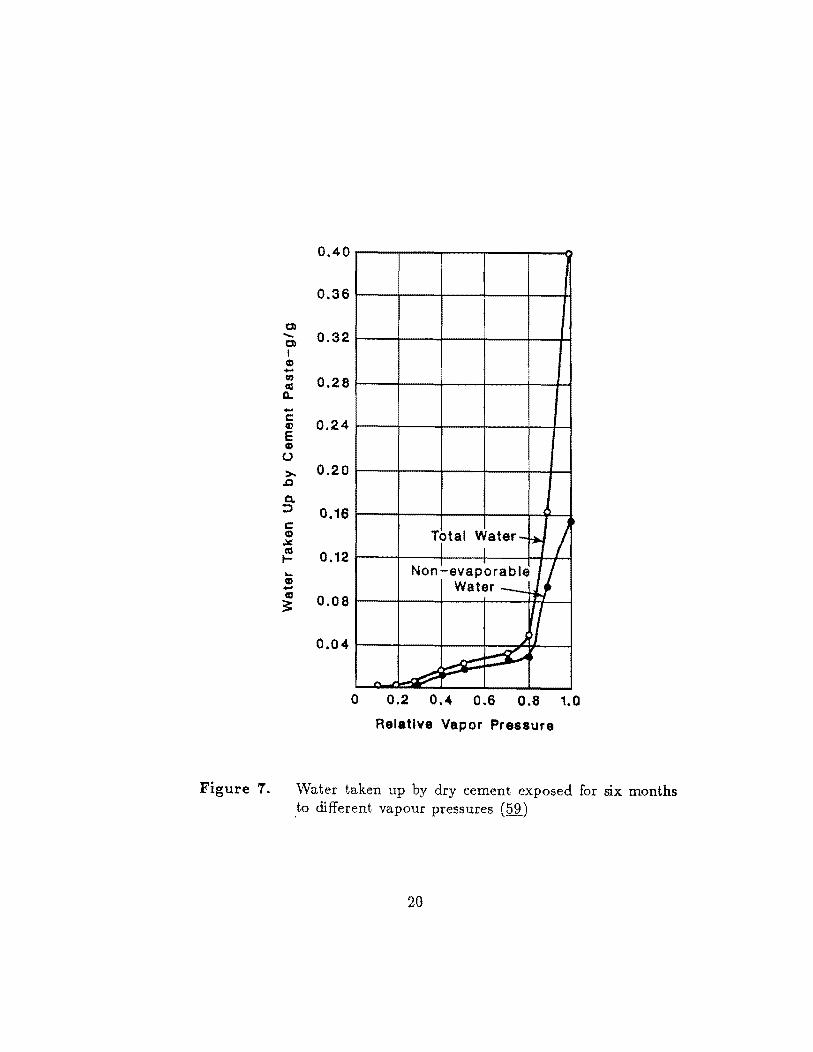
Relative Humidity: If the relative humidity is below 80 percent, the rate of
hydration decreases rapidly and, as a result, further improvement of concrete quality
virtually ceases (59). Figure 7 (59) shows the degree of saturation of cement after
six months of storage at different relative humidities. At vapor pressures below 0.8,
the degree of hydration is low, and is negligible at vapor pressures below 0.3. Figure
7 also shows that only about one half of the water present in the paste can be used
for chemical combination when'no water is lost, i.e., when the vapor pressure is 1.0.
Another problem, which is related to evaporation is that plastic shrinkage
cracking occurs very often in low relative humidity conditions and especially when
it is combined with high temperature and high wind speed (Q, 16 60). An
evaporometet, which can measure the rate of evaporation on a surface of free water,
has been developed and is used in this project (1). This apparatus is easy to use
both in the field and in the laboratory and considers the direct effect of different
combinations of environmental conditions. However, the evaporation rate measured
with this apparatus is not an absolute value and needs to be calibrated in order to
determine the actual evaporation rate from a concrete surface.
Wind Speed: Wind is another important factor which affects the evaporation
rate significantly. Therefore, many studies have recommended the use of wind
breakers when strong wind is expected (~). In a laboratory test (61), there was
little difference in weight change, shrinkage and creep of hardened cement mortar
between specimens exposed to 5 m/s wind (11.3 mph) and specimens stored in no
wind. Therefore, wind effects on creep and drying shrinkage of structural concrete
19
0.40
0.36
a - 0.32 a I Q) -0 0.28 aI
Q.. -c: 0.24 II)
E Q)
(J
>- 0.20 .s:J
Q. :J 0.16 c: G) .x (tI
0.12 I-.... G) -aI 0.08 :=
0.04
Tltal ~atef-fi. /. I I
Non-evaporable~ Water _
JI ..L'I"""'" ~~
- ~ .-a 0.2 0.4 0.6 0.8 1.0
Relative Vapor Pressure
Figure 7. Water taken up by dry cement exposed for six months ,to different vapour pressures (59)
20
members are concluded to be insignificant (27). However, the above conclusion
is only valid for hardened concrete. As for fresh concrete, wind has a prominent
effect on evaporation rate, and, hence, induces plastic shrinkage. Using a curing
compound is a very useful and practical method to improve the protection against
evaporation. However, research by Texas Transportation Institute (Q) showed that
concrete specimens covered with a single application of curing compound, and
exposed to windy conditions with a temperature of 140°F and a relative humidity
of 25 %, can have the same or higher evaporation rate than concrete specimens
exposed to no wind and not treated with a curing compound during the first several
hours. This illustrates the strong influence of wind on drying, even when a single
application of curing compound is applied (Q).
2.5.2 Material Variability
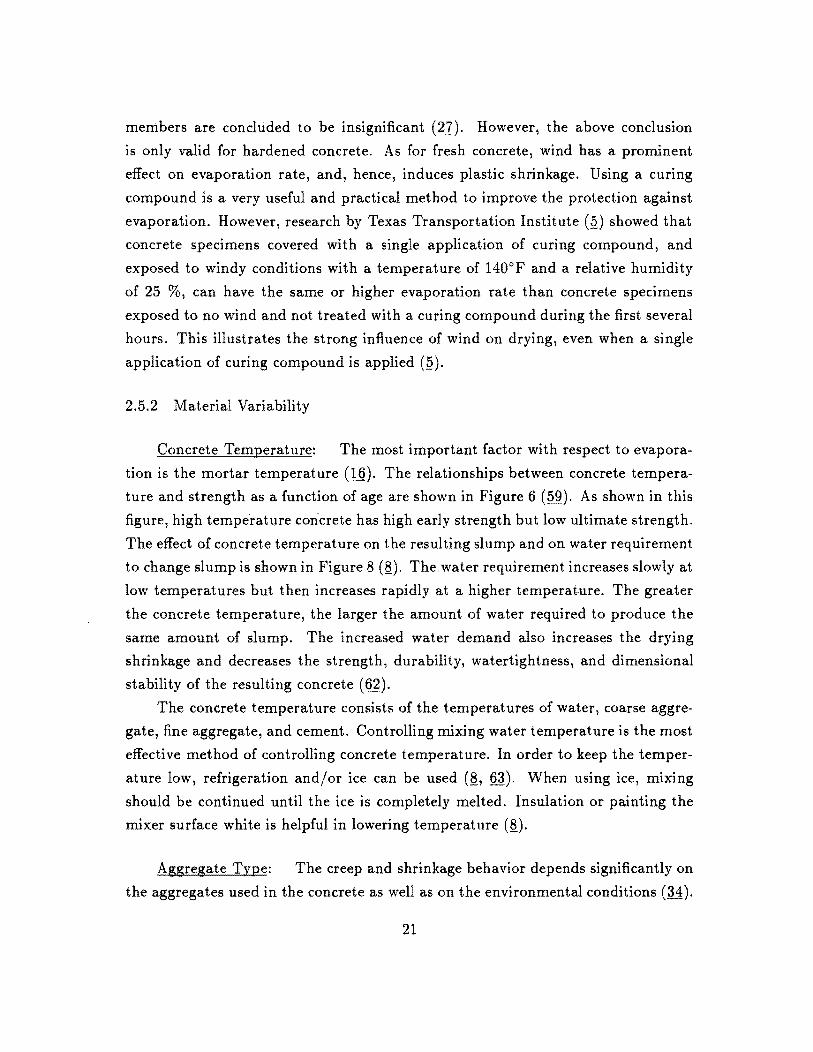
Concrete Temperature: The most important factor with respect to evapora-
tion is the mortar temperature (16). The relationships between concrete tempera
ture and strength as a function of age are shown in Figure 6 (59). As shown in this
figure, high temperatl}.re concrete has high early strength but low ultimate strength.
The effect of concrete temperature on the resulting slump and on water requirement
to change slump is shown in Figure 8 (~). The.water requirement increases slowly at
low temperatures but then increases rapidly at a higher temperature. The greater
the concrete temperature, the larger the amount of water required to produce the
same amount of slump. The increased water demand also increases the drying
shrinkage and decreases the strength, durability, watertightness, and dimensional
stability of the resulting concrete (62).
The concrete temperature consists of the temperatures of water, coarse aggre
gate, fine aggregate, and cement. Controlling mixing water temperature is the most
effective method of controlling concrete temperature. In order to keep the temper
ature low, refrigeration and/or ice can be used (~, 63). When using ice, mixing
should be continued until the ice is completely melted. Insulation or painting the
mixer surface white is helpful in lowering temperature (~).
Aggregate Type: The creep and shrinkage behavior depends significantly on
the aggregates used in the concrete as well as on the environmental conditions (34).
21
flO - 6 c:: II> E ~ a. 5 ::s E cr ::s II> Ci5 a: "II>
c:: 4
- II> • CI 3: c • c.r: 3
o II> .r:
\
deg C
10 .... 20 30 40 50 I I
Water Requirement \ ) \.
'\ V " .."
~ r-' -Cl o c:: c:: 2 I"'-" '<oc «I _
.r:1 0 .... II> ~ 01(1) «I a. 1 -c:: II) o "CD
Q. o 40
" , " Slump
I 60 80 100 120
Concrete Temperature, deg F
6 15
5
4 10 . E c:: 0 . ..
Sa. a. E E ::s
. .: Ci5 (/)
2 5
1
0
Figure 8. Effect of concrete temperature on slump and on water required to change slump. Cement content: 517 Ib/yd3 ; 4~ ± ! percent air; maximum size of aggregate,
1! in; average of data for type I and II cement (SJ
22
The physical properties and gradations of the aggregate also affect the concrete
durability and air entrainment characteristics, but the amount of aggregate used in
concrete is more significant than the size and gradation of aggregate with respect
to the shrinkage achieved (27, 64).
Although aggregate generally restricts the shrinkage of concrete, a large amount
of clay increases shrinkage significantly. It has been reported that concrete made
with unwashed sand and gravel gave 70 to 100 percent more shrinkage than concrete
made using completely washed materials (27).
A concrete slab made with a mixture of round silicious gravel and crushed
limestone has higher strength than concrete made with either round or crushed
coarse aggregate (12). No difference in strength was found between concrete with
silicious gravel and crushed limestone aggregate (12). The type of aggregate does,
however, have a significant effect on the drying shrinkage, thermal expansion and
contraction, modulus of elasticity, ultimate tensile strain capacity, and extensibility
(65). The crushed limestone concrete has greater shrinkage and ultimate tensile
strain than the silicious gravel concrete (28, 64). The coefficient of expansion
and contraction and the modulus of elasticity of crushed limestone concrete were
smaller than those of the sand and gravel concrete. In field studies, crushed
limestone concrete shows less spalling, for a similar crack spacing, than silicious
gravel concretes (55, 56, 66). A possible explanation is that the limestone concrete
has lower modulus of elasticity, lower thermal conductivity, and better bonding
characteristics than the silicious gravel concrete (66). Another possible cause is that
the limestone concrete has a greater ultimate tensile strain and therefore gives better
performance than the silicious gravel concrete, in spite of the greater shrinkage (66).
Neither type nor texture of subbase affects the strength of concrete slabs. In a
Texas study (12), researchers found that placing fresh concrete on a dry subbase even
at 140°F did not affect the strength of the concrete slab significantly and concluded
that the subbase conditions are not critical to the concrete strength development.
In other words, dampening the subbase does not necessarily provide any differences
in concrete strength development, but it is still recommended, to minimize the
possibility of plastic shrinkage cracking, cracking in hot weather, and to minimize
the removal of water from the concrete to the subbase.
23
';Yater Content: The presence of internal pores in the aggregate particles
influences the properties of concrete by changing the water content. There is no
clear-cut relation between the strength of concrete and the water absorption of
the aggregate used: the pores at the surface of the particle are believed to affect
the bond between the aggregate and the cement paste, and may thus exert some
influence on the strength of concrete (67).
If the aggregate is batched in a dry condition, it is assumed that sufficient water
will be absorbed from the mix to completely saturate the aggregate. However, if
the particles are coated with cement paste which prevents further absorption, the
actual w / c ratio is greater than the expected value. This effect is significant mainly
in rich mixes (67).
A coating of aggregate particles with cement paste takes place within approx
imately 15 minutes from the time of initial mixing. This causes the absorption of
water to slow down or stop with time. It is therefore often useful to use the quan
tity of water absorbed after about 15 minutes instead of the total water absorption,
which may never be achieved in practice (67).
Mix Design: The relative strength at early age of high cement content con-
crete is greater than that of low cement content concrete. However, this difference
decreases with time. Furthermore, high cement contents increase shrinkage (27,
28). Entrained air reduces the concrete strength by up to about 5 percent (28). It
has been reported that there exists an optimum gypsum content which minimizes
concrete shrinkage. The optimum proportion of gypsum can reduce the shrinkage
up to 30 percent compared to cement without gypsum. The addition of gypsum
retards setting of concrete and is a necessary ingredient for the control of the setting
time (27).
In recent years the use of fly ash as an admixture or a partial replattment
for the cement in concrete has become more popular in pavement construction
(68). In the past 10 years in Texas, the State Department of Highways and Public
Transportation has conducted research in the use of fly ash in concrete and is
now allowing the use of preapproved sources of fly ash in special provisions (68).
However, no data is available on the shrinkage and strength of fly ash concrete
mixtures for CRC pavements exposed to severe environmental conditions. This data
is needed for use in the CRCP design procedure, and for quality control purposes
24
during construction.
Fly ash is the incombustible residue from the combustion of coal. It is classified
as a pozzolan which is a silicious and aluminous material possessing no cementitious
value, but which reacts with Ca(OHh to form calcium silicate hydrates. This
generally improves durability, strength, and impermeability of hardened concrete
(69). The use of fly ash will lower the heat of hydration, and can cause a low rate
of early strength gain, depending on the chemical composition of the fly ash (70).
Two distinctive classes are defined in ASTM: Class F and Class C which are based
on coal sources. They have slightly different chemical compositions and as a result,
differ in usage (71). Class C fly ash may be added in amounts up to 35 percent by
weight of cement; the additional rate depends on the particular applications as well
as individual fly ash quality (11).
2.5.3 Quality Control
Time between Mixing and Placement: It is generally accepted that the
longer the delay between initial mixing and placement of concrete, the greater the
strength reduction. This effect is more critical in hot weather than in cold weather.
Slump loss and requirement for retempering are other factors that will increase in
hot weather. Retempering significantly increases shrinkage and decreases strength
and durability. The time between mixing and placing should therefore be minimized,
and retempering should not be performed unless otherwise specified. Generally it
is required that placement of the concrete should commence immediately after the
delivery of concrete. In order to avoid hot, arid and windy conditions, it is suggested
that placement occur in the late afternoon or evening (~).
Consolidation Effort: Many reports indicate that proper placement and
consolidation are the most important factors in producing a good quality concrete
(§., Q., 12, 53, 72). Most pavement failures in the state of Ohio have been attributed
to insufficient concrete consolidation around the steel and the lower portion of the
slab (12). In an Illinois study (57), poor consolidation was also sited as a possible
cause for disintegration.
Mechanical vibration improves the strength and surface properties of concrete.
A great difference in durability can be observed with differences in consolidation
and void content. Excessive vibration increases the settlement of solid particles.
25
Fines are worked to the surface and as a result, the surface region becomes more
consolidated than the region immediately underneath. The surface region will settle
when the vibration ceases. If setting of the concrete occurs before the surface
zone reaches underlying matter, this causes surface deterioration in the form of
flaking (Q). However, the effectiveness of vibration depends on the frequency,
amplitude, and the duration. The effectiveness of vibration increases as amplitude
and duration increase. Also, there exists an optimum frequency which provides
maximum consolidation effort for a given concrete mix design. These optimum
frequencies, amplitudes, and durations should be determined by tests to secure
adequate degree of consolidation (Q, 72). During construction the amount of
evaporation is of great importance, since it affects the concrete workability and
thereby the degree of consolidation achieved. Such variations can influence both
the strength and durability of the CRC pavement (72).
2.6 Summary
The previous sections summarize the State-of-the-Art in the areas of concrete
curing, strength development, shrinkage, and shrinkage cracking. Concrete curing,
strength development, shrinkage, and shrinkage cracking are very important in
establishing material behavior during the life of CRC pavements and have been
partially or fully incorporated into design and construction procedures for CRCP.
The literature review, however, has also shown that only limited data is available
regarding the combined influence of the environmental factors and the material
variability during and after construction. During construction, the air temperature,
relative humidity, and wind speed vary depending on the season of the year. The
concrete temperature during the initial hardening and curing stages of the concrete
varies depending on the air temperature and amount of evaporation. The response
of the concrete also depends on the particular mix design used, i.e., the use of
fly ash or other admixtures, as well as the aggregate type. During construction,
the amount of water retained in the concrete will vary according to the amount
of evaporation, the total mixing time, and time of transportation of the concrete
from the batch plant to the job site. This variation in water content affects the
workability of the concrete and the ability of the particular consolidation effort to
adequately liquify the concrete. This in turn will determine how well the concrete
26
will be consolidated. In the following chapter an experiment is described that was
designed to provide more detailed data on the effect of the environment on concrete
strength development, shrinkage, shrinkage cracking, changes in moisture content
and moisture loss, and abrasion resistance.
27


III. EXPERIMENTAL METHODS AND PROCEDURES
3.1 General
In the review of the literature regarding the critical variables responsible for
the behavior of the concrete in CRC pavements during and after construction,
and therefore ultimately the performance of the pavement, it was found that the
environmental factors air temperature, relative humidity, and wind speed interact
with the type of mix design and construction parameters. Among the construction
parameters, the total time between the initial addition of the cement to the concrete
and the placement of the concrete is important. In general, the interaction can
be characterized by the amount of evaporation potential existing in the concrete
from the time of transportation to the job site until the final application of curing
compound. At this point, the evaporation is reduced but still affected by the
environmental conditions. Only continously moist curing provides an environment
where no evaporation occurs from the concrete.
Consequently, if the amount of evaporation can be measured for typical
environmental conditions in Texas and for commonly used concreFe mixtures, the
influence of these environmental conditions can be assessed for the critical material
parameters, shrinkage and strength, which are known to influence performance of
CRC pavements. The variations in these material properties will also produce
a range of material property values that can be used by existing CRCP models
to check the expected crack spacing and thus the performance under typical
environmental conditions in Texas.
To adequately establish the effect of the environmental conditions on strength
development, shrinkage, and abrasion, a minimum of 2 beams, 12 cylinders, 3
shrinkage bars, and 12 moisture content specimens are necessary. This number
allows the specimens to be tested differently as well as the establishment of
correlations and testing errors. However, in order to manage the large amount
of data, a systematic approach is needed for the batching and testing procedures,
and data collection.
28

The variables selected in this investigation can be classified as follows:
A. Environmental Factors
b.
c.
1.
2.
3.
Air Temperature:
Relative Humidity:
Wind Speed:
Material Variability
4. Concrete Temperature:
5. Aggregate Type:
6. Water Content:
7. Mix Design:
Quality Control
8. Mixing Time:
9. Consolidation Effort:
50° F, 73° F, &104° F
30%, 63%, & 95%
o mph, 6 mph, & 9 mph
50°F, 73°F, & 104°F
River Gravel & Limestone
Required amount to produce
I" Slump, 1.5" Slump, & 2/1 Slump
Plain & Fly Ash Concrete
7 min, 20 min, & 60 min
Spading, Rodding, & Vibrating
A more detailed description and justification of the variables chosen is given in
the following sections.
3.2 Development of the Concrete Batch Design
Typical environmental conditions chosen have been selected according to the
annual weather reports for Texas. In these reports the average yearly temperature
for Houston is shown to vary from 50°F to 95°F, and the typical average values of
relative humidity and wind speed are shown to be 65% and 9 mph, respectively.
The average temperature conditions in EI Paso vary from 40°F to 104°F, and the
average relative humidity and wind speed are 25% and 6 mph, respectively. The
standard curing conditions of 73°F, 95 % relative humidity, and 0 mph wind speed
specified by ASTM standards were used as a reference. Based on this climatic
information, test condition temperatures of 50°F, 73°F, and 104°F were selected.
The relative humidity and wind speeds selected were 25% and 65%, and 6 and 9
mph, respectively. Due to difficulties in maintaining 25% relative humidity, this
value was later changed to 30%. Based on the climatic combinations from the
weather records, two coupled sets of climatic conditions were selected, 30% relative
humidity with 6 mph wind speed and 65% relative humidity with 9 mph wind speed;
29
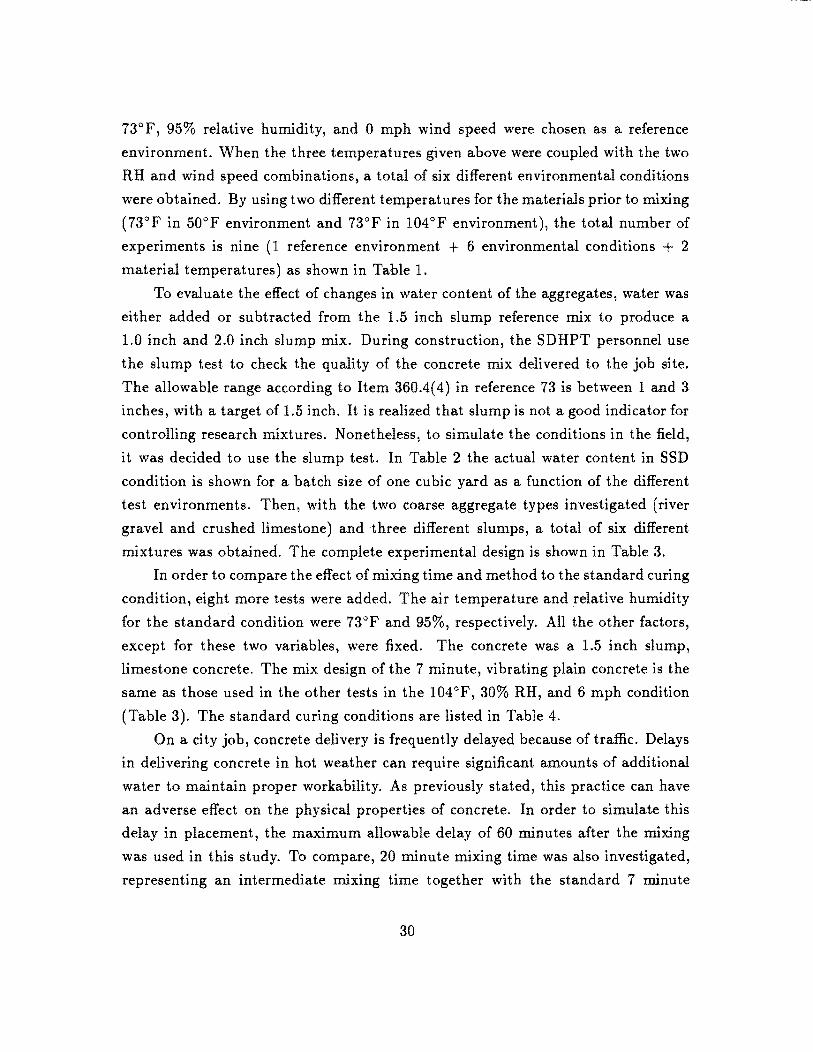
73°F, 95% relative humidity, and 0 mph wind speed were chosen as a reference
environment. When the three temperatures given above were coupled with the two
RH and wind speed combinations, a total of six different environmental conditions
were obtained. By using two different temperatures for the materials prior to mixing
(73°F in 50°F environment and 73°F in 104°F environment), the total number of
experiments is nine (1 reference environment + 6 environmental conditions + 2
material temperatures) as shown in Table 1.
To evaluate the effect of changes in water content of the aggregates, water was
either added or subtracted from the 1.5 inch slump reference mix to produce a
1.0 inch and 2.0 inch slump mix. During construction, the SDHPT personnel use
the slump test to check the quality of the concrete mix delivered to the job site.
The allowable range according to Item 360A( 4) in reference 73 is between 1 and 3
inches, with a target of 1.5 inch. It is realized that slump is not a good indicator for
controlling research mixtures. Nonetheless, to simulate the conditions in the field,
it was decided to use the slump test. In Table 2 the actual water content in SSD
condition is shown for a batch size of one cubic yard as a function of the different
test environments. Then, with the two coarse aggregate types investigated (river
gravel and crushed limestone) and three different slumps, a total of six different
mixtures was obtained. The complete experimental design is shown in Table 3.
In order to compare the effect of mixing time and method to the standard curing
condition, eight more tests were added. The air temperature and relative humidity
for the standard condition were 73°F and 95%, respectively. All the other factors,
except for these two variables, were fixed. The concrete was a 1.5 inch slump,
limestone concrete. The mix design of the 7 minute, vibrating plain concrete is the
same as those used in the other tests in the 104°F, 30% RH, and 6 mph condition
(Table 3). The standard curing conditions are listed in Table 4.
On a city job, concrete delivery is frequently delayed because of traffic. Delays
in delivering concrete in hot weather can require significant amounts of additional
water to maintain proper workability. As previously stated, this practice can have
an adverse effect on the physical properties of concrete. In order to simulate this
delay in placement, the maximum allowable delay of 60 minutes after the mixing
was used in this study. To compare, 20 minute mixing time was also investigated,
representing an intermediate mixing time together with the standard 7 minute
30
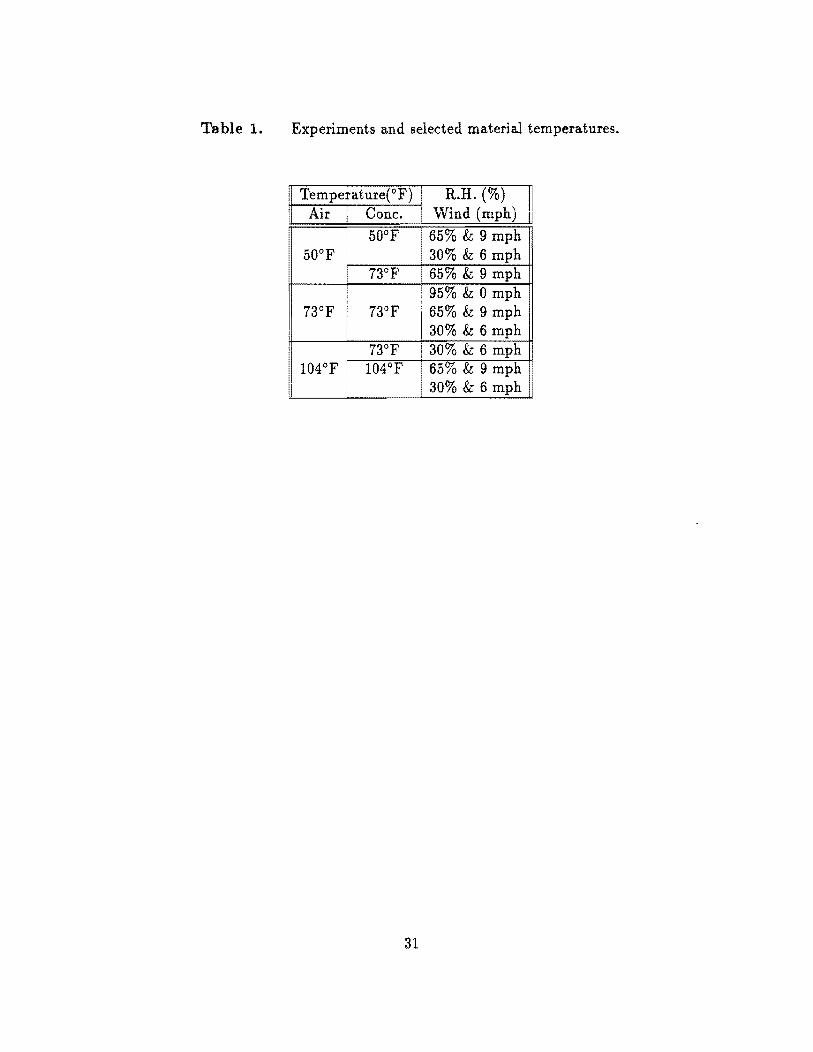
Table 1. Experiments and selected material temperatures.
Temperature{OF) R.H. (%) Air Cone. 'Wind (mph)
50°F 65% & 9 m 50°F 30% & 6
73°F 65% & 9 mph 95% & 0 mph
73°F 73°F 65% & 9 mph 30% & 6 mph
73°F 30% & 6 mph 104°F 104°F 65% & 9 mph
30% & 6 mph
31

I
i
Table 2. Average SSD water content for each test (lb/cy).
Temperature rl Air Concre 1" Slump
50° F 50° F 208
73°F 104°F
MIX Design
Plain
Fly Ash
73°F 218 73°F 207 73°F 209 104° F 232 ..
MIxmg II Time
7 min. 232 20 min. 230 60 min. 242 7 min. 217
20 min. 229 60 min. 237
River Gravel Limestone 1.5" Slump 2" Slump I" Slump 1.5" Slump
213 213 215 214 221 223 210 215 214 214 212 215 223 223 225 227 232 243 215 213
232 243 215 213 231 243 229 223 250 253 229 225 221 222 214 224 213 223 217 206 229 233 221 221
32
2" Slump 220 221 218 233
i 230
II 230 248 248 212 225 239
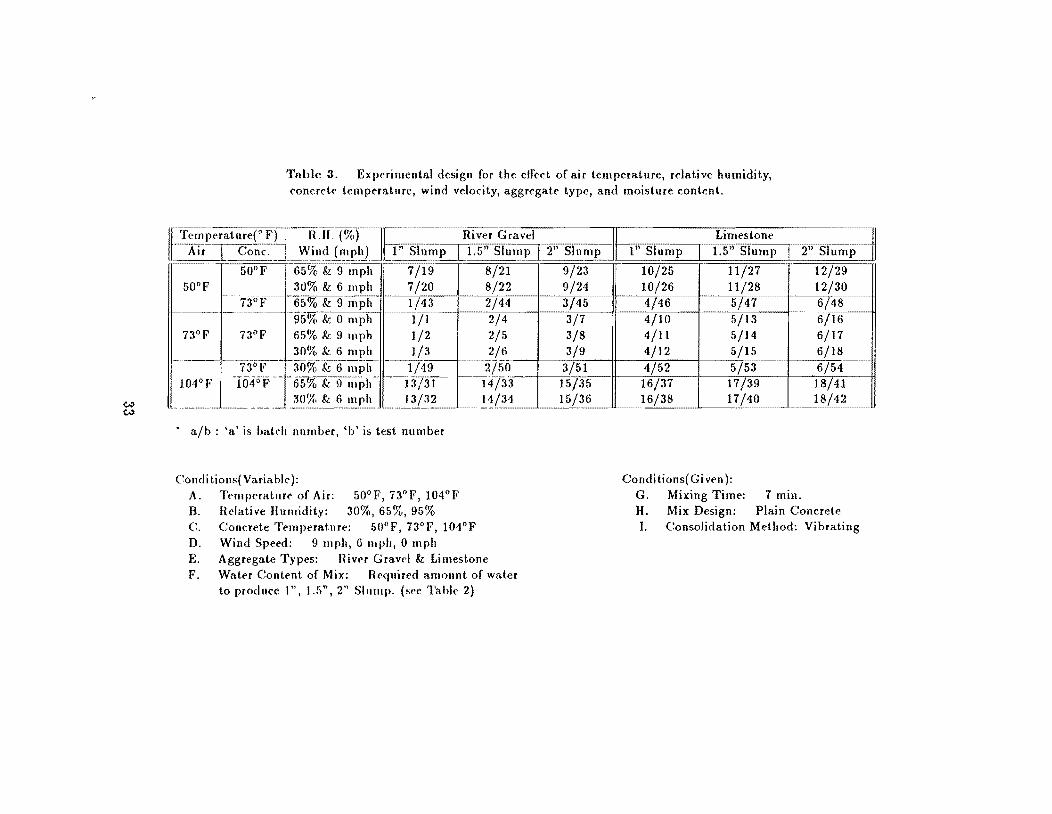
~ ~
Table 3. Expnilllental design for the elTect of air temperature, relative humidity, eoncret(' t.emperature, wind velocity, aggregate type, and moisture content.
vel 1/ Limestone
~u_._"':_u~._:_JJ_1" SlnmLL1.5" Slump 12" Slump II I" Slump 1.S" Slump I 2"Srll .
50°F
--
73°F
-~---~
104°[<,
50°F
i3°};' -
73°F
--73°F-104°,,--'
5% & 9 mph 7/19 6
3 "6
6 3 3 6
3
0% & 6 mph )% &. 9 mph ------,-)% &. 0 mph >% &. 9 mph )% &. 6 mph )0/;& 6mph ~&91liph-)(}\' &. 6 mph
7/20 1/43 T/i 1/2 1/3
~9-'--:~-.. --
13/31 13/32
'a' is hakh number, 'b' is test number
Conditiolls(Variabl(, }:
8/21 8/22 2/44 2/4 2/5 2/6
~~~~~2750
--.-~-~.
14/33 11/31
A. Tt"llIperature of Air: 50°F, 73°F, 104°F R Rdative Humidity: 30%, 65%, 95% C. Concrete Temperat.ure: 50°F, 73°F, 101°F D. Wind Speed: 9 mph, 6 mph, 0 mph E. Aggregate Types: !liver Gravel & Limestone F. Wat.er Content of Mix: R(~qllired alllollnt of water
to produce 1", 1.5",2" SllIlIIp. (s('e Table 2)
9/23 10/25 11/27 12/29 9/24 10/26 11/28 12/30 3/45 4/46 5/47 6/48 3/7 4/10 5/13 6/16 3/8 4/11 5/14 6/17 3/9 4/12 5/15 6/18
-----
3/51 4/52 5/53 6/54 15/35 16/37 17/39 18/41 15/36 16/38 17/40 18/42
~~~- ~~--~~~~-
Conditions{ Given): G. Mixing Time: 7 min. II. Mix Design: Plain Concrete I. Consolidation Metbod: Vibrating
I
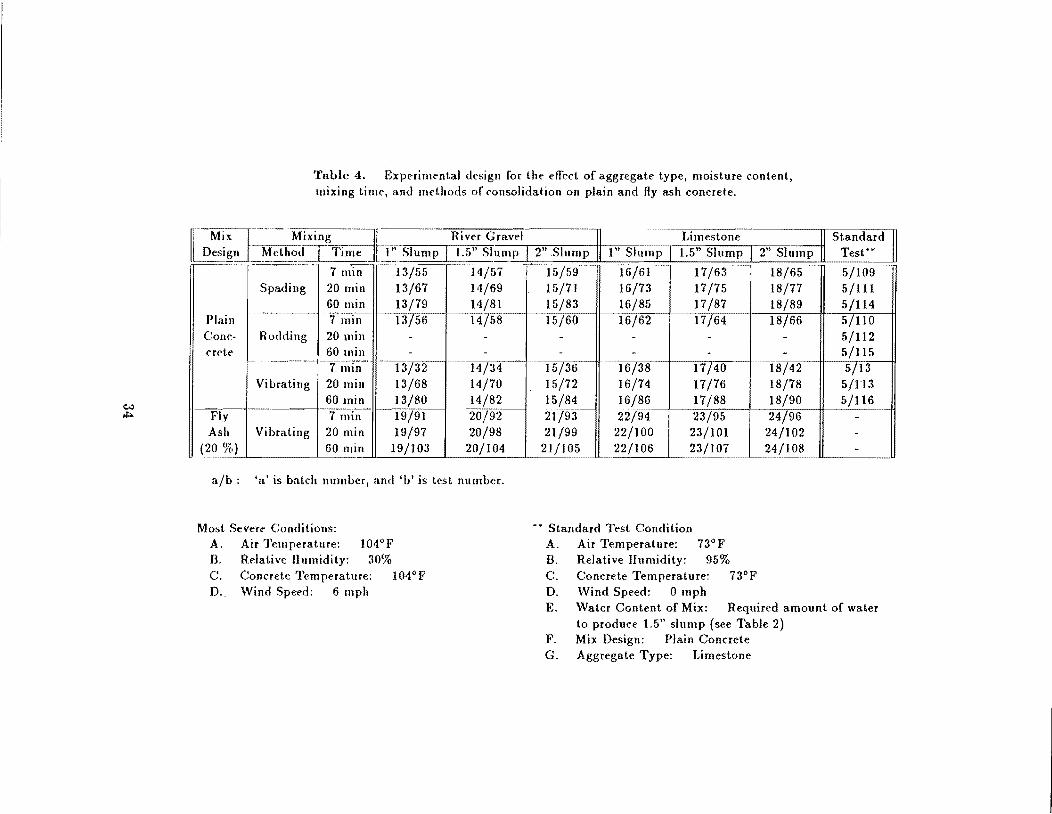
Table 4. Experimental design for the effect of aggregate type, moisture content, mixing tim!", and methods of consolidation on plain and fly ash concrete.
~l River Gravel II [imestone II Standard II ~_I :.Slump I 1.5" SI~IIllP 2" SllImp II 1" Slump L5" Slump 2" Slump" Test"" _. ...
13/55 14/57 IS/59 16/61 17/63 18/65 5/109 Spading I 13/67 14/69 15/71 16/73 17/75 18/77 5/111
Plain ~~~--~- --,.,--
I 13/79 14/81 15/83 16/85 17/87 18/89 5/114 13/5-6-~4/58 15/60 16/62 17/64
...
18/66 5/110 Conc- Rodding I - - - - - - 5/112 ('rl"te I - - - - - - 5/115 _.
13/32 14/34 15/36 16/38 17/40 18/42 5/13 Vibrating I 13/68 14/70 15/72 16/74 17/76 18/78 5/113
w ~l H:>. Fly I 13/80 14/82 15/84 16/86 17/88 18/90 5/116
19/91 20/9~ .. 21/93 22}94 23/95 24/96 --
Ash Vibrating I 19/97 20/98 21/99 22/100 23/101 24/102 -(20 %) I 19/103 20/104 21/105 22/106 23/107 24/108 -
............ __ ..
a/b: 'a' is batch number, and 'b' is test number.
Most Severe Conditions: -. Standard Test Condition A. Air Temperature: 104°F A. Air Temperature: 73° F n. Relative Humidity: 30% B. Relative Humidity: 95% C. Concrete Temperature: 104°F C. Concrete Temperature: 73°F D.. Wind Speed: 6 D. Wind Speed: 0 mph
E. Water Content of Mix: Required amount of water to produce 1.5" slump (see Table 2)
F. Mix Design: Plain Concrete G. Aggregate Type: Limestone
mixing time. During the simulated 20 and 60 minute delays, the mixing continued
after the initial mixing for the standard 7 minutes. Twenty and 60 minutes after
the addition of the cement, the concrete was remixed for an additional 2 minutes
and retempered with water to obtain the desired slump prior to placement.
In many cases, insufficient consolidation is reported as the cause of unexpected
early failure. In order to compare the effect of consolidation effort, three different
consolidation methods were considered. Vibrating concrete until the sheen appeared
on the whole surface was assumed to represent 100 percent consolidation effort,
and spading the concrete 25 times per sq.ft. was assumed to represent 85 percent
consolidation effort. The method of rodding, which was assumed to represent 95
percent consolidation effort was also employed to investigate the differences between
the laboratory test and variations in consolidation effort in the field.
Due to the increase in the use of fly ash as partial replacement for cement in
concrete pavement mixtures, a concrete mix with 20% replacement with a type C
fly ash available in Texas was investigated under the most severe environmental
condition of 104°F temperature, 6 mph wind speed, and 30% relative humidity.
By combining the effect of mixing time, consolidation effort, and the use of
fly ash, nine testing parameters were selected. These parameters were combined
with the combinations of the aggregate type and water content (slump). The
resulting experimental design is summarized in Table 4. The 7 minute vibrating
plain concrete tests appearing in this table were the same as the tests of 104°F,
30% RH, and 6 mph shown in Table 3. As for the rodding method, only 7 minute
mixing was considered because the delay of placement will not occur in ordinary
laboratory procedures.
As mentioned earlier, two different coarse aggregates - river gravel and crushed
limestone - were used in this study. The coarse aggregate was obtained from Parker
Brothers Co. in Houston, Texas, and the fine aggregate from Bryco, Inc., in Bryan,
Texas. The results of the unit weight, specific gravity, absorption capacity, and
gradation of the coarse and fine aggregate are presented in Appendix A.
For the total of 24 different mix designs, which were necessary for the conduc
tion of the total of 116 tests previously described, basic design values were selected
from the Texas State Highway Department's "Standard Specifications for Construc
tion of Highways, Streets and Bridges" (73), and summarized in Table 5.
35
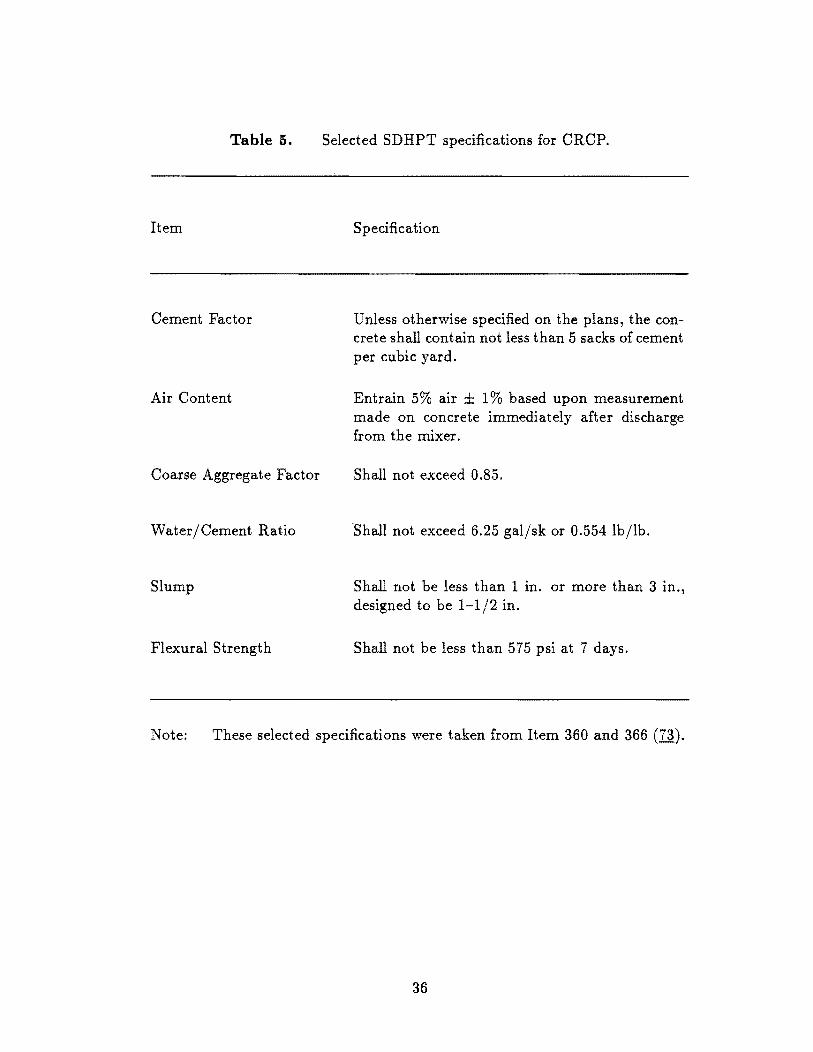
Table 5. Selected SDHPT specifications for CRCP.
Item Specification
Cement Factor Unless otherwise specified on the plans, the concrete shall contain not less than 5 sacks of cement per cubic yard.
Air Content Entrain 5% air ± 1% based upon measurement made on concrete immediately after discharge from the mixer.
Coarse Aggregate Factor Shall not exceed 0.85.
Water/Cement Ratio Shall not exceed 6.25 gal/sk or 0.554 lb/lb.
Slump Shall not be less than 1 in. or more than 3 in., designed to be 1-1/2 in.
Flexural Strength Shall not be less than 575 psi at 7 days.
Note: These selected specifications were taken from Item 360 and 366 (73).
36
For the initial mix design, a cement factor of 5.5 sk/yd3 and a total air content
of 5.0%, using an air entraining agent, were used. With this information, the test
results contained in Appendix A, and the design process contained in the Texas
State Highway Department's "Construction Bulletin C-ll ," the initial mix design
was developed. The tolerance for each slump was set at 0.25 inch, resulting in the
slump between 0.75 inch and 1.25 inch to be considered as 1 inch slump, the slump
between 1.25 inch and 1.75 inch to be considered as 1.5 inch slump, and the slump
between 1.75 inch and 2.25 inch to be considered as 2 inch slump.
To determine whether the mix designs met the SDHPT's specifications for
CRCP concrete, 1.5 cu.!t. trial batches were used. During the mixing process,
attempts were made to produce concrete that had a 5.0% air content and a 1.5
inch slump. The amount of water to change the slump and the amount of air
entraining agent were recorded. One beam and three cylinders were cast, followed
by curing under 95% relative humidity and 73°F. After 7 days, the beam was tested
for Modulus of Rupture by the center point method (ASTM C-293) and the three
cylinders for compressive strength test (ASTM C-39). The broken pieces of the
beam were subjected to the modified compressive strength test according to ASTM
C-1l6. The tests conducted and the number of replica tests are summarized in
Table 6.
3.3 Development of the Testing Program
Among the most important variables in this research is the evaporation rate
for each environmental condition. It significantly affects the moisture movement
behavior in concrete, and thereby the shrinkage of the concrete, as well as the
strength development of concrete. The Evaporometer developed by the Materials
and Test Division (D-9) of Texas State Department of Highways and Public
Transportation (1) was used to measure the evaporation rate .. A schematic drawing
of the equipment is shown in Figure 9. First, the filter paper on top was soaked
and the capillary column filled with water. Next, as time passed, the water in
the column was drawn upward due to the evaporation from the filter paper. The
drying time for every half inch increment of water column was measured, and the
amount of evaporated water determined. Finally, the amount of evaporated water
was compared with the values obtained from the PCA Chart (Figure 2).
37
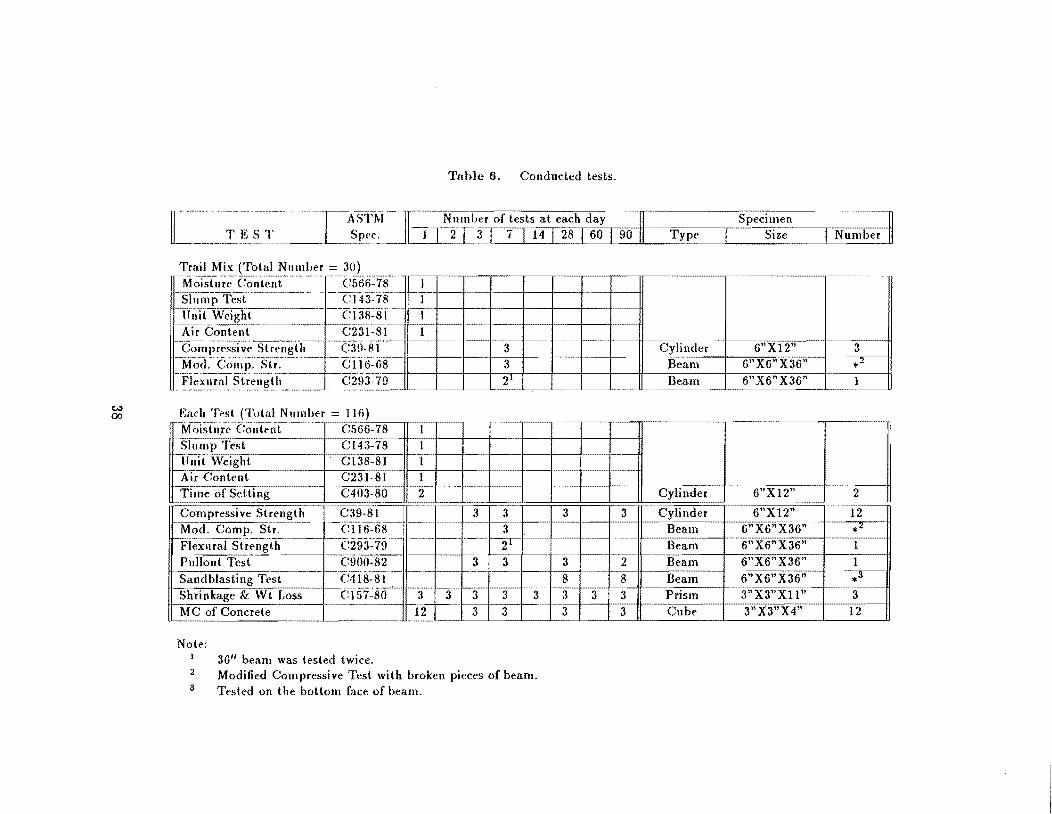
Tahle 6. Conducted tests.
II T EST ~-------~------.-- -------
Trail Mix (Tot.al Numher = 30) -Moi~illr~(:o~tent --- ----(:566=7 -sIiillip Test--------- - - --- CT43~7 -TfnTI-W~igli-t ------ ---[: 138--':8 . Air -ConIell-f------·· 'c:2:H=s -·COIII pr~s~i;e-St r--;;-;;-gtIJ --M~)-a.-C:oll; I>:-s-j:i.-·--- .----'Fi;~~al st;;;'gtll--- C293-7
<--,.- --"'-,-,
~ I~a("h Test (Total NlIllli>(:'r = lIti)
1 f------
I I 1
-
--
Moistu.re Cont(:'nt C566-78 I STmnp-Test C143-78 1 ITJllt-WeTght .. C138-~ 1 .AirContent C231-81 1 Time of Setting C403-80 2
---
-----
~ -----------------
-,= =-:: ----
3 3 21
Compressive Strength C39-81 3 3 -------_.- ------- --
Mod. Compo Str. e1l6-68 3 -- ..... --- .----.---.-----.-- --.-. - -- .--.... --.. -- .----.-- ----- -----;)t'
Flexural Str(:'ngth C293-79 2 Plillollt Test C9()O:82 3 3 Sand blasti ng~~t-·--- I -- ,---
Shrinkage &, Wt Loss C157~80 3 3 3 3 -- -_. --MC of Concrete 12 3 3
Note: 36// beam was t.(:'sted twice.
3
Modified Compressive Test with broken pieces of beam. 3 Tested on the bottom face of beam.
...... -
..... '---------_ ..
3 3
3 2 8 8 3 3 3 3 3
Specimen Type Size
Cylinder 6"X12" 3 Beam 6"X6"X36" *-Beam 6"X6"X36" 1
-------- --------
!
Cylinder 6"XI2" ~
Cylinder 6"XI2" 12 Beam 6"X6"X36" *l Beam 6"X6"X36" 1 Beam 6"X6"X36" 1 Beam 6"X6"X36" *3
Prism 3,iX3" Xl 1 ,,------ ----------
3 Cube 3"X3"X4" 12
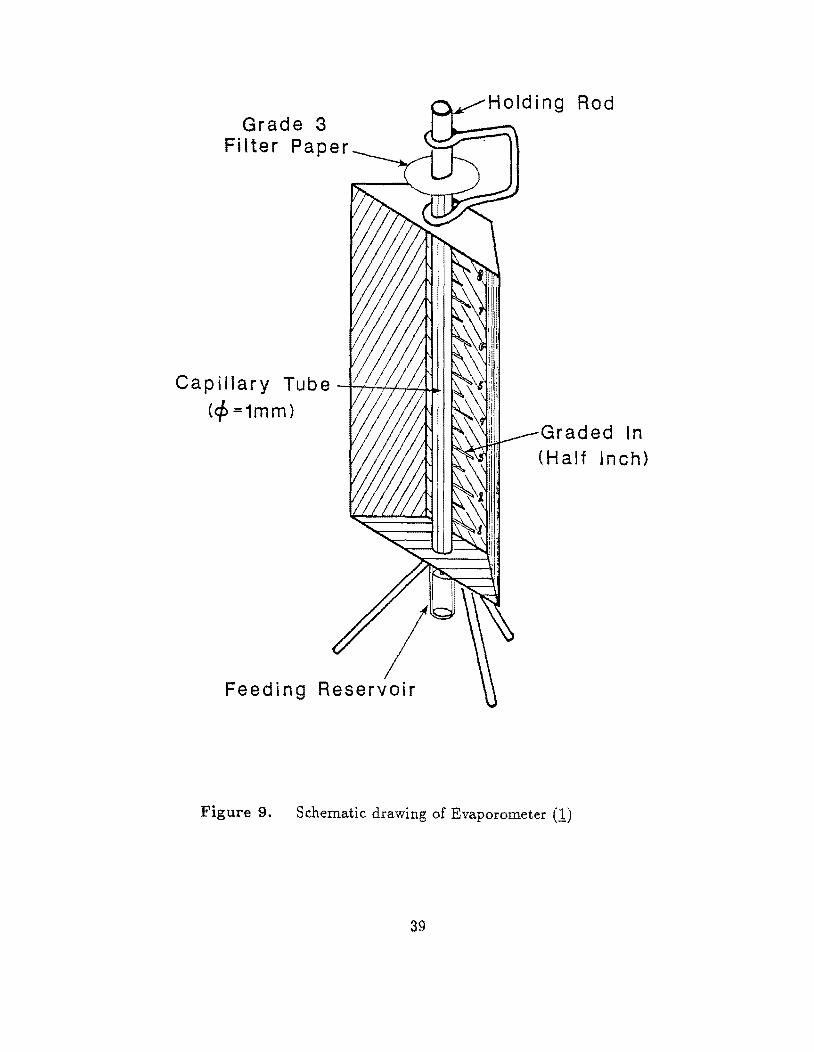
Grade 3 Filter Paper
Cap i II a r y Tub e -;--''-f-f-+-I--.~ (</>=1mm)
Feeding Reservoir
Rod
Graded In (Half Inch)
Figure 9. Schematic drawing of Evaporometer (1)
39
A set of metal forms which has six or five holes on the side panels was used
to place the pullout inserts for the pullout test (ASTM C-900). The diameter and
the depth of the inserts was 9/16 inch. The inner diameter of the reaction ring
was 1-11/32 inch, thus producing an apex angle of 70 degrees. In order to have
adequate clearance between each of the pullout tests, these inserts were spaced 6
inches apart. One side panel had six inserts and the other side panel five inserts,
arranged in an alternate order. A total number of eleven inserts was placed on one
beam. Three inserts were pulled out at each test age, except for the 90 days, when
only two pullout tests were performed. The pullout hydraulic jack was calibrated
before the test, and on a regular basis every month.
The sandblasting test was performed on the bottom side of the pullout beam
at 28 days and 90 days according to ASTM C-418. The test was performed at eight
different locations as specified by ASTM, with the exception that the specimen was
notSSD condition during the test, but in air dry condition. Only the reference
specimens stored in the moisture room were tested in the SSD condition and used
as a reference.
A total of three shrinkage specimens per test condition and age was cast.
Weight change was measured in conjunction with the length change of these
specimens. An electronic balance with an accuracy of plus or minus one-tenth
of one gram was used to measure the weight changes. Some of the loosely attached
material was removed on the first day right after the removal of the form in order
to reduce the possibility of losing this material during the duration of the test.
Four small cubes were made from each of the sixteen-inch long bar molds by
inserting nonabsorbant dividers right after the consolidation. These specimens were
used to measure the moisture content and moisture loss. Initial weights and weight
changes were recorded at certain ages (see section 3.5). To determine the moisture
content, the specimens were oven dried at 110°C for 24 hours. The complete testing
program is shown in Table 5 for each of the total of 116 tests.
3.4 The Batch Process
The maximum size of the two coarse aggregates ordered for this study was
1-1/2 inches. However, the size of the shrinkage molds was 3x3x11.2 inches which
restricts the maximum size of coarse aggregate to 1 inch. The aggregates which
40
pass the 1 inch sieve and are retained on the # 8 sieve were therefore collected and
stored together with the sand in an environmental room at least one day before the
bat ching of the concrete took place. This allowed the aggregates time to reach the
desired temperature. Similarly, the mixers and other equipments were stored in the
same environmental room at least one day before the batching. When the material
temperature was different from the air temperature, a different temperature room
was used during batching.
The volume for making one complete test was 5.4 cu.ft.; however, only a 3
cu.ft mixer was able to fit in the environmental rooms. The batch was therefore
divided into two portions. One beam, six cylinders and three shrinkage specimens
or twelve cube specimens were made from each batch. The concrete was mixed for
3 minutes, rested for 3 minutes, mixed again for 4 minutes, and then discharged
to wheel barrows for casting of specimens. Slump was the controlling factor in the
bat ching process, and water was added to achieve the specified slump. Air content
and unit weight were measured after mixing and temperature and relative humidity
of the room were recorded before, during and after mixing.
The specimens were consolidated on a vibrating table until a sheen appeared on
the whole surface. The duration time depended on the size of the specimens. Surface
was finished by hand troweling after the consolidation. The shrinkage specimens
were made at the same time as the pullout beam specimen, and the cubes for
moisture content measurements were cast together with the other plain beam for
the flexural strength test. Plastic molds were used for the cylinder specimens instead
of steel molds. A curing compound was applied to the top of the specimens as soon
as the surface sheen had disappeared from the surface. The time of setting test was
performed for each batch.
The specimens were stored in the specified environmental conditions for 24
hours. At the end of this 24 hour period, all the specimens were demolded and curing
compound applied on the newly exposed surfaces. For the shrinkage and moisture
content specimens, the first measurement of lengths and weight was performed
after the curing compound had dried. The specimens remained in the specified
environmental room until they reached the age of 90 days.
41
3.5 Concrete Testing
There were four main test ages: 3, 7, 28 and 90 days. At these ages, a
compressive strength test, a pullout test, a shrinkage and weight loss test, and
a test for moisture variations were performed. Flexural strength test and modified
compressive strength test were only performed at 7 days. Additional measurements
were made for the shrinkage specimens on the first, second, 14th and 60th days.
The proposed tests, together with the ASTM specifications, the number of tests per
age, and the specimens used in this research, are summarized in Table 6.
42

IV. DISCUSSION OF THE RESULTS
4.1 Introduction
This chapter presents the results of the testing and analysis program conducted
as part of the laboratory investigation. The results are categorized according to the
types of the tests: strength tests, shrinkage and moisture variations, and time of
setting and abrasion. The complete tabulated data obtained from this investigation
is presented in Appendices D and E. Only the most pertinent data is presented
here.
4.2 Evaporation
4.2.1 Evaporation Rate
Environmental conditions investigated in this study have different levels of
effect on moisture movement in concrete. Their primary effects on the movement
of moisture in concrete are based on two distinct aspects: temperature effect on the
rate of hydration, which affects diffusivity, and relative humidity and wind effects
on the rate of moisture loss. Temperature also affects the rate of drying by changing
the mobility of water molecules, which is a function of the internal energy of water.
Evaporation rate in each different environmental condition was measured with
the Evaporometer developed by the Materials and Tests Division of the Texas State
Department of Highways and Public Transportation (1). The evaporation time for
a half inch column of water was measured, and the evaporation rate was calculated.
Table 7 shows the Evaporometer test results together with the PCA chart readings
for the six different environmental conditions employed. The six environmental
conditions are arranged in increasing order of the evaporation rates. The PCA
chart gives values from 0.030 to 0.250 Ib/sq.ft./hr, and measured evaporation rates
were found to be between 0.066 and 0.340 Ib/sq.ft./hr. In Table 7, the wind speed
measurements are also summarized. The concrete specimens were exposed to wind
generated by an electric fan. The measured wind speeds ranged between lOA and
7.0 mph for 9 mph, and between 7.5 and 4.5 mph for 6 mph. Most of the concrete
specimens were placed between 1 and 4 feet from the fan, and between 2 and 5
43
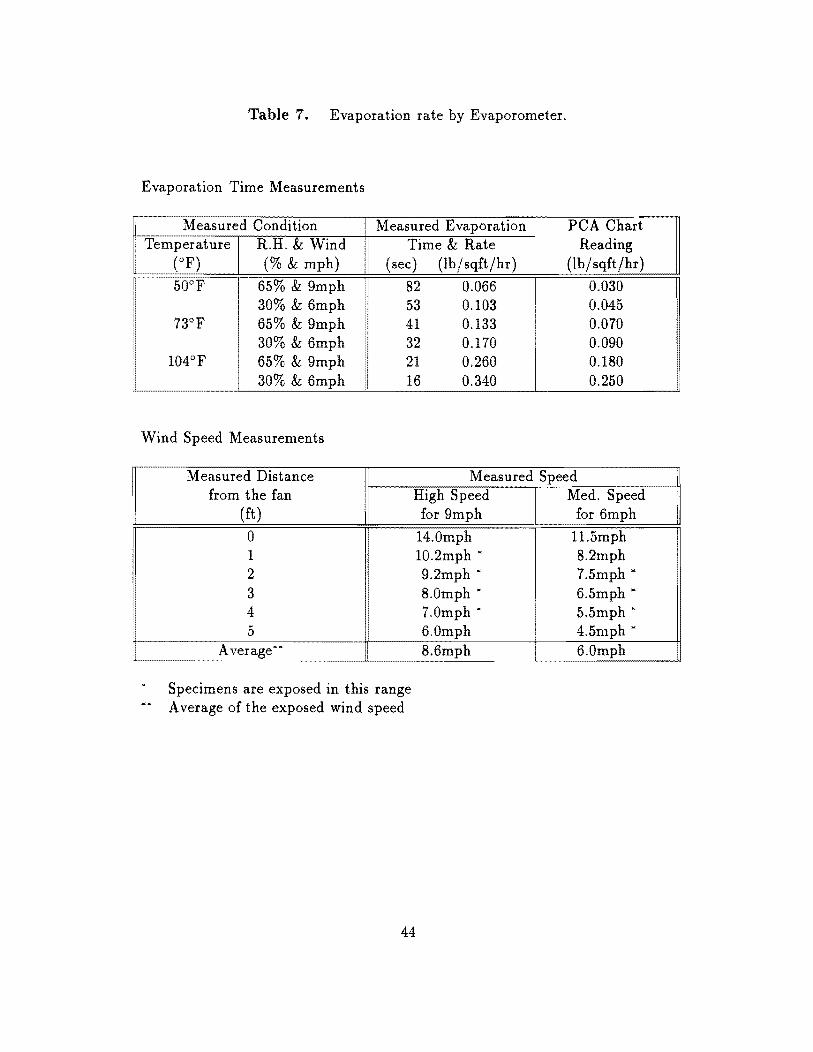
I
Table 7. Evaporation rate by Evaporometer.
Evaporation Time Measurements
Measured Condition I Measured Evaporation PCA Chart Temperature R.H. & Wind Time & Rate Reading
(OF) (% & mph) (sec) (lb j sqft jhr) (lbjsqft/hr)
50°F 65% & 9mph 82 0.066 0.030 30% & 6mph 53 0.103 0.045
73°F 65% & 9mph 41 0.133 0.070 30% & 6mph 32 0.170 0.090
104°F 65% & 9mph 21 0.260 0.180 30% & 6mph 16 0.340 0.250
Wind Speed Measurements
Measured Distance Measured Speed from the fan
(ft)
0 1 2 3 4 5
AverageXX
Specimens are exposed in this range Average of the exposed wind speed
High Speed for 9mph
14.0mph 10.2mph k
9.2mph k
8.0mph ~ 7.0mph ~ 6.0mph 8.6mph
44
Med. Speed for 6mph
1l.5mph 8.2mph 7.5mph ~ 6.5mph ~ 5.5mph ~ 4.5mph ~ 6.0mph
feet, depending on the test conditions. Evaporation measurements were taken at
appropriate distances from the fan to achieve the specified wind speed.
The measured values represent evaporation from a filter paper and not from
a concrete surface, and the drying water was transported through a 0.05 inch
diameter capillary glass tube and not through a tortuous pore system with variable
crossectional areas. The mechanism governing the rate of evaporation in the
Evaporometer and concrete is, however, the same. This is illustrated in Figure
10 by the linear correlation between the evaporation rate from the Evaporometer
and the PCA chart. As seen from Figure 10 and Table 7, the Evaporometer values
are greater than the PCA chart values. This is to be expected, since the internal
capillary pore structure in concrete involves tortuosity that decreases the flow of
water to the surface.
For all temperatures, the environmental condition of 65% relative humidity
with 9 mph wind shows lower evaporation rate than that of 30% relative humidity
with 6 mph wind. For the two environmental conditions, the difference i~ evapo
ration rate between the PCA chart and the Evaporometer values increases with an
increase in temperature. This is also attributed to the presence of a tortuous pore
system in the concrete as previously mentioned.
The value recommended by PCA of 0.2 lb/sq.ft./hr as the critical level for the
evaporation rate corresponds to a value of 0.29 Ib/sq.ft./hr for the Evaporometer.
In evaluating the influence of the climatic conditions in the field during placement,
the Evaporometer can be used to measure the evaporation. This measured value
can then be corrected to actual concrete evaporation from the PCA chart using
either Figure 10 or the following equation (r2=0.989):
peA = -0.1376 + 0.8307· E
where
PCA evaporation from PCA chart
E = evaporation from Evaporometer
The differences between the evaporation rate for the two climatic conditions increase
with an increase in temperature. The least severe condition is found to be 50°F,
65% and 9 mph, and the most severe condition is 104°F, 30% and 6 mph.
Even though the correlation plot shows slightly non-linear configuration, the
validity of the PCA chart is not reduced. The contradictory findings reported in
45

~ a..
0.30
~ 0.25~ 104(F),30%
..-...... 0-m
'" ..0 0.20 '--'" 1 04(F),65% rn c - 0.15 -0 0 a>
0::
+- 0.10 l.... 73(F),30% 0 /e .c 73(F),65% '->
« 0.05 u y. 50(F),30% 0....
50(F),65% 0.00 I
0.00 0.05 0.10 0.15 0.20 0.25 0.30
Measured Evaporation Rate (Ib/sqft/hr)
Figure 10. The correlation between Evaporometer measurement and peA chart reading.
e
0.35 0.40
the prevIOUS TTl study (Q, fi) have not been verified in the present study. By
reviewing Table 8 from the previous TTl report (fi), a large discrepency among the
evaporation rates can be found for the following three environmental conditions:
73°F, 10 mph and 20 mph, and 100°F, 20 mph. Figure 11 (Q) shows the measured
changes in concrete surface temperature. According to this temperature plot, the
surface temperatures at 73°F did not change significantly, and remained below
80°F. On the other hand, the surface temperatures at 100°F varied between 80°F
and 120°F. The footnote in Table 8 states that the material temperature is assumed
to be 80° when the reading is taken from the PCA chart. Obviously this assumption
does not correspond to the actual measurements. If PCA chart readings are taken
with an average temperature of 75°F, the evaporation rate for 73°F, 10 mph is very
close to the PCA chart reading.
Mixing and batching procedures were performed in the same environmentally
controlled room for the present and the previous studies. \Vhat was discovered
during the batching process was a rapid increase in relative humidity and a slight
decrease in temperature due to the unavoidable evaporation during the mixing and
batching procedure. Because of the narrow and confined space of the room, the
environmental conditions were changed quite rapidly from the planned condition.
If these two factors a wrong assumption for concrete temperature and a rapid
change on environmental condition - are considered, the substantially lower
evaporation rate at high wind speed reported earlier (fi) can be explained.
4.2.2 Conclusion
The following conclusions regarding the evaporation rate are based on the
results of the laboratory tests:
1. Measurements taken with the Evaporometer developed by the Materials and
Tests Division of the Texas State Department of Highways and Public Trans
portation show very good correlations with values obtained from the PCA
chart.
2. The rate of evaporation, which is a function of the environmental condition,
can reliably and conveniently be measured in the field with the Evaporometer
during construction.
47
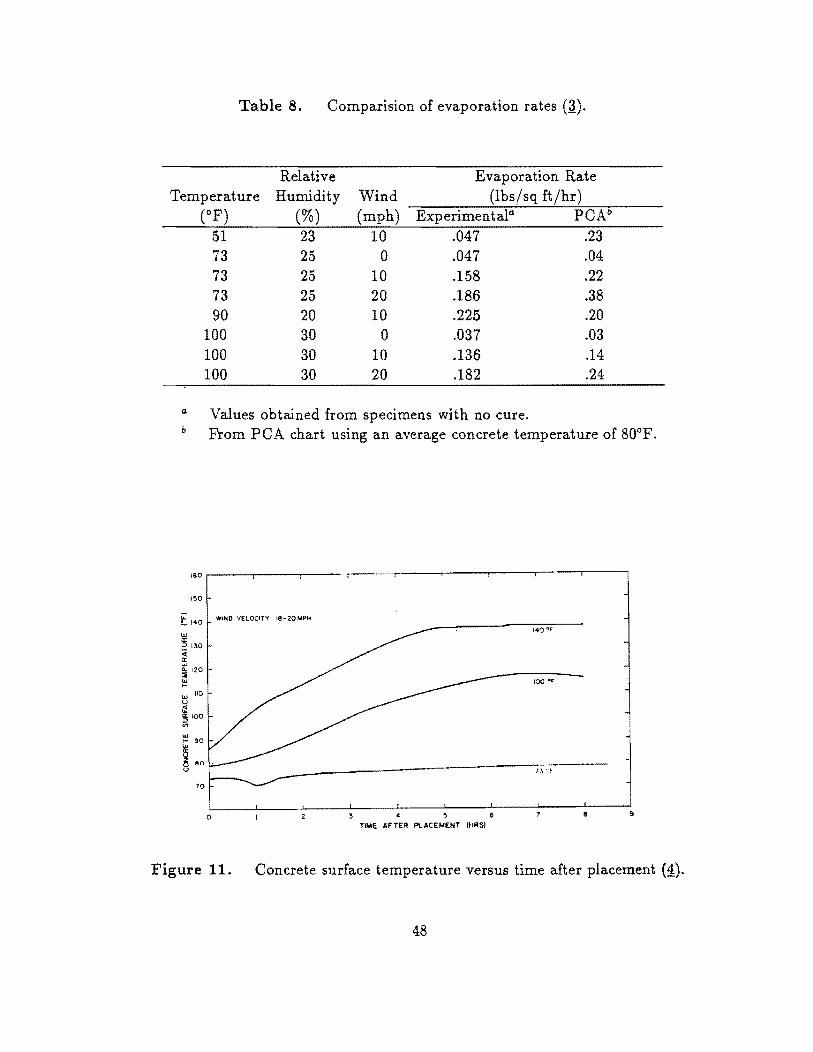
Table 8. Comparision of evaporation rates (3.).
Relative Evaporation Rate Temperature Humidity Wind (lbsjsq ftjhr)
(OF) (%) (mph) ExperimentalG PCAl)
51 23 10 .047 .23 73 25 0 .047 .04 73 25 10 .158 .22 73 25 20 .186 .38 90 20 10 .225 .20
100 30 0 .037 .03 100 30 10 .136 .14 100 30 20 .182 .24
<1 Values obtained from specimens with no cure. b From PCA chart using an average concrete temperature of 80°F.
150
w ~ I~O ~ a: OJ ~ 120 OJ 0-
w 110 U
It ~ 100
'" OJ
WINO VELOCITY IB ... 20MPH
140"'"
~ :: "
_--------------:I~"~ u
10
o 4 5 6 TIME AFTER P\.ACEMENT (HRS)
Figure 11. Concrete surface temperature versus time after placement (~J.
48
3. The PCA chart, whose validity was challenged in a previous study (Q,§'), was
found to be valuable in estimating the evaporation rate from concrete.
4. The use of the PCA chart requires special care in selecting the input parame
ters.
5. An equation has been developed that corrects the rate of evaporation measured
with the Evaporometer to the rate of evaporation of the concrete.
49
4.3 Strength Development
4.3.1 Compressive Strength and Pullout Strength
Figure 12 illustrates the effect of environmental conditions on the compressive
strength development of concrete between 3 and 90 days of age. Figure 12a is
for river gravel and Figure 12b is for limestone as the coarse aggregate type.
Both types of concrete mixtures had a slump of 1.5 inches. The evaporation
rate increases from left to right in the figure. The 3 day compressive strengths
increase as evaporation rate increases. The tendency disappeared for the 7 day
strength for river gravel concrete and 28 day strengths for both types of aggregates.
Finally, slightly decreasing compressive strengths can be observed after 90 days. The
specimens stored at 50°F increased their strength continuously, and almost doubled
the strength between 3 and 90 days. The specimens stored in 104°F experienced
only a 25% increase between 3 and 90 days. With the exception of the 3 day
results, this shows that, under low evaporation conditions, moisture remains in the
concrete for a long time; as a result, the concrete is able to hydrate continuously.
At a high evaporation condition, however, the rapid removal of moisture causes the
strength development to be significantly retarded. As observed earlier, the 3 day
compressive strength increases as the evaporation rate increases. This is attributed
to the influence of temperature, which produces short-term strength increases at a
curing temperature above 73°F, but long-term strength reductions (59).
In general, longer mixing time is believed to reduce the compressive strength
of concrete at all ages. Figure 13 illustrates this effect for the most severe drying
condition. The longer the mixing time, the lower the compressive strength. The
statement is true regardless of the type of aggregate, the type of admixture, and
the age of the concrete.
In Figures 14 through 16, the influence of aggregate type and amount of mixing
water on the compressive strength is shown for different environmental conditions.
As expected, a definite decrease of the strength with an increase of slump is observed
regardless of the type of aggregate and exposure conditions. This is because of the
wi c ratio law that states when more water is introduced into the concrete mix, the
spaces occupied by the excess water create void spaces after drying. The amount
of void spaces determines the degree of strength reduction.
50
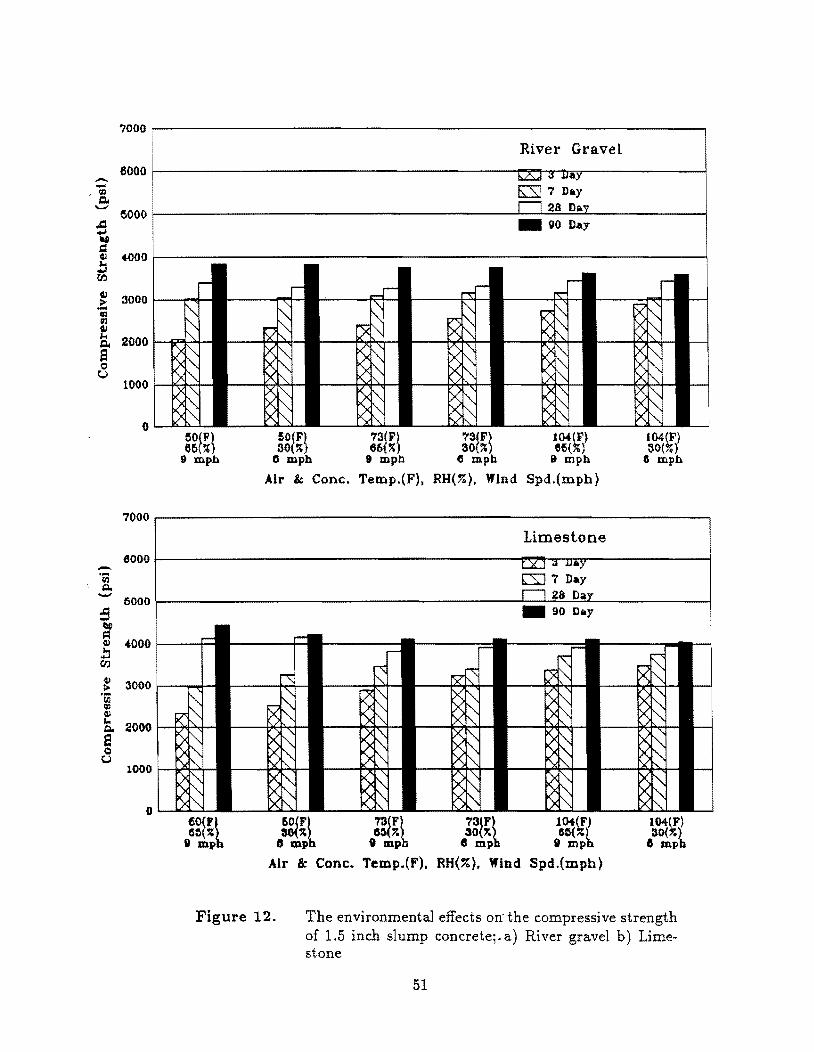
7000
eooo --'~ ......, 6000
.a .0.1 ItJ C ~ .000 l:t CI:I
f.I 3000 > .• m III f.I I-< 2000 C. a 0 u
1000
0
7000
6000 -'0; Q. - 5000 :3 :I ~ "000 .b (fJ
: 3000 '5 = ~ ...
2000 Q.
e 0 u
1000
0
River Gravel
I5:Sl 7 Day
_ 00 nay
~OfPl 65 !; 9 mph
~gl~l X:i~~ ~g~~) Je~~1 a mph 9 mpb e mph & mph
Air &: Cone. Temp.(F), RH(~). Wind Spd.(mph}
Limestone
L.lLl il JJa y [SJ 7 D_y rl28.~ _ 90 Day
rI r-'
~r=I r-- r--
:": ~ 7l" kX~
" t\ ~ " ~ ~ ~ " >(' 0- X ~ ~ tx "- ~
~ ~ ~ ~ ~ ~ X " 1<" ~ )<~
'" ~ ~ >< " ~~ ~ "- ~ ~ X ~ ~ K "- X 0- f'" t>< "-
!O(!l 73(F) 73(Ft IOf(F) .. 0(", G~(?') 30()I; ~(::;~
8 mp , mph e mp i mph
Air &: Cone. Temp.(F). RH(%), Wind Spd,(mph)
104(F) 30(%}
II mph
:-<: t--
X~ X ~ [ X ~
x: " X" X " .~ ~
104(F) :J0(l':) e mph
r--
L....-
Figure 12. The environmental effects on' the compressive strength of 1.5 inch slump concrete;. a) River gravel b) Limestone
51
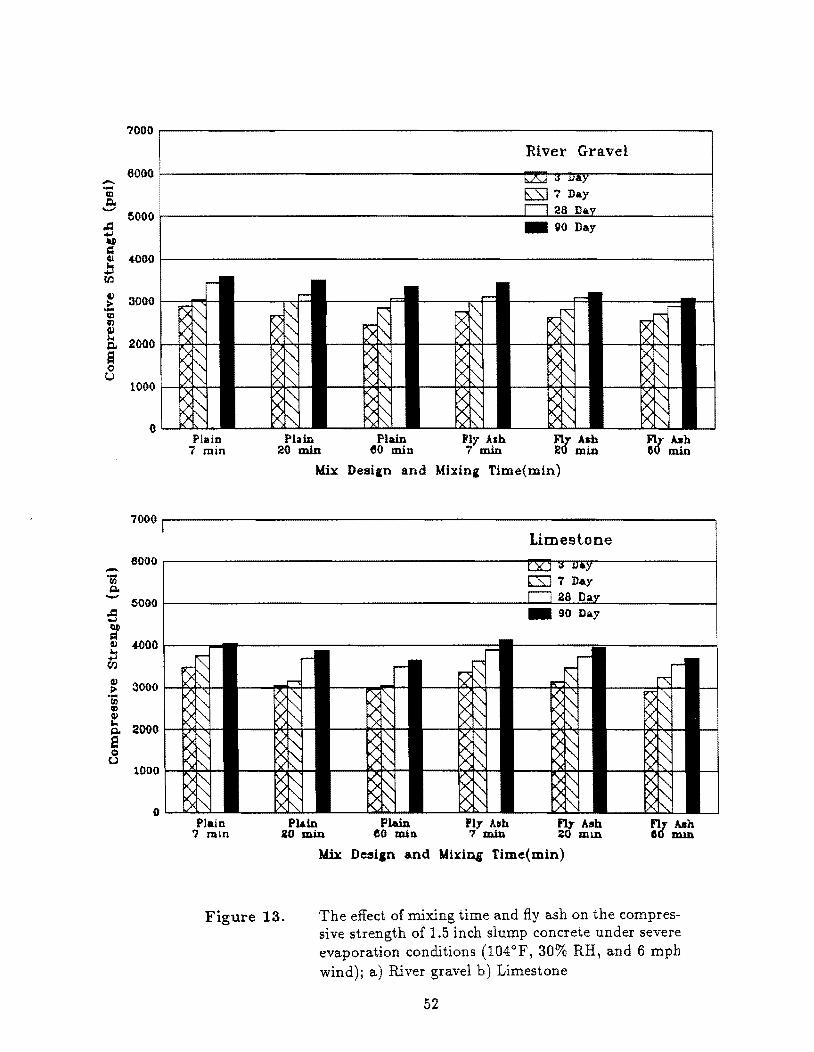
.t:l .... ~
7000r---------------------------------------------------------------~
River Gravel 6000~------------------------------------~~_.r~,_----------~
5:Sl 7 Day
~OOOr_----------------------------------------L-~2~8~~------------~ _ QO Day
.: b ~00r_--------------------------------------------------------~ CfJ
tJ .e; 3000 f--_~-I Q:l Gl tJ So 2000 I--~~-8 Q U
1000 I--~"""'+-
Plain 7 min
Plain Plain 'ly Ash Fly Ash 20 min eo min 7 min 20 min
Mix Desiln and Mixini Tim~(min)
Fl:r Alh 6 min
7000r-------------------------------------------------------------~
d :t
Limestone eooor_-----------------------------------------4~~~~------------~
(SJ 7 nay
5000r_----------------------------------------~--~~~~----------~ _ 90 Day
CJ .wOO 1----__
1:1 CfJ
g! 3000 I--~~--fD Q:l tJ
l5. 2000 I--~""""S o u
1000 I--~~-
PI.in 7 nun
Plain Plain Ply Alh fly Asb .20 min eo min 7 min 20 ml..D.
Mix DesiCn and Mixing Time(min)
fly Ash GO min
Figure 13. The effect of mixing time and fiy ash on the compressive strength of 1.5 inch slump concrete under severe evaporation conditions (104°F, 30% RH, and 6 mph wind); a) River gravel b) Limestone
52
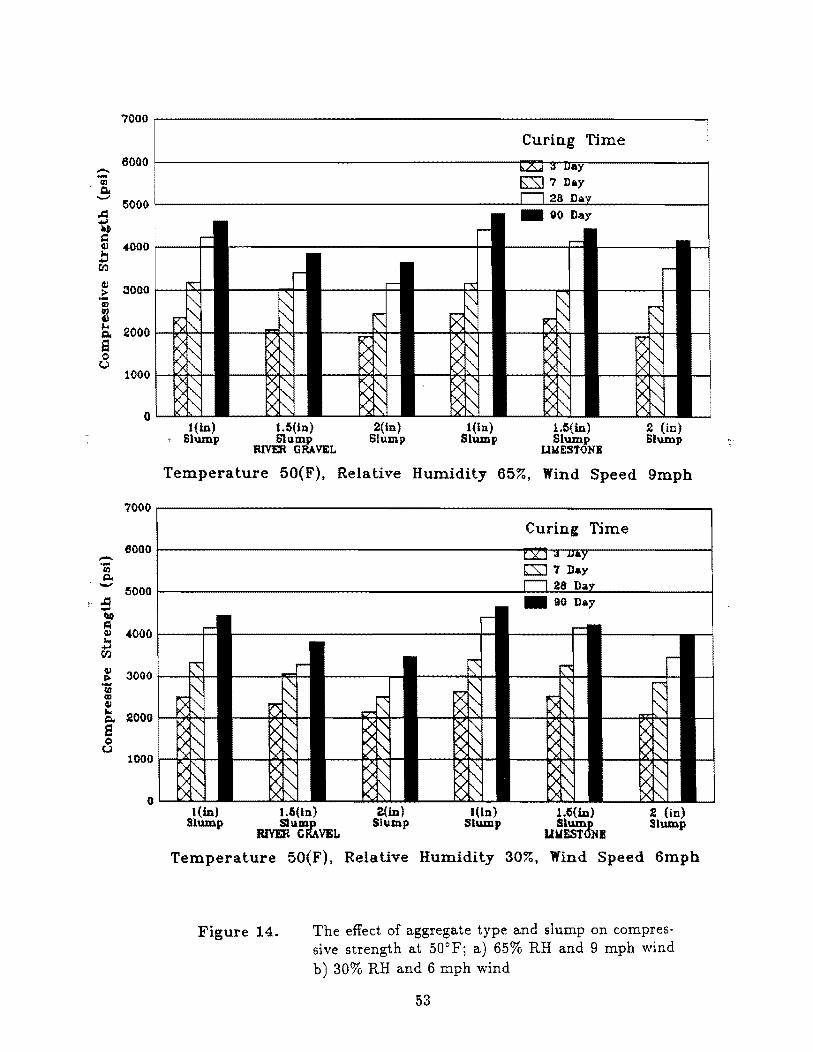
7000,-----------------------------------------------------------~
Curing Time 6000~--------------------------------------~~~~r_----------~
ES]7 Day
:9 5000r---------------------------------------~~~~~----------~ _ QO Day
IIJ) C \lJ 4000 i----t-b t:ll
~ 3000 ~~"d-.... II:) 9) G.l
~ 2000 .......,~"'+a o (.)
-.. III Q. -
t(in) ~ Slump
t.6(in) Sll1mp
RIVER ORA VEL
2(in) Slump
(in) Slump
Ul(in) Slump
Ut.lESTONB
2 (in) Slump
Temperature 50(F), Relative Humidity 65%, Wind Speed 9mph
7000,------------------------------------------------------------. Curin£ Time
eooor---------------------------------------~~~~r_----------~
5000~--------------------------------------~~~~~----------~
:3 ~ .; 4000 til
~ 3000 l--~-+-1ii II:)
\lJ
So 2000 ~~-..I-e c u
1000
I(in) Slump
1.6(1n} Slllm])
RIVER GRAVEL
2(in) Slump
I (iII) Slump
l.Ci(in) Slump
UUESTON!
2 (in) Slump
Temperature 50(F), Relative Humidity 30%, Wind Speed 6mph
Figure 14. The effect of aggregate type and slump on compressive strength at 50 0 Pi a) 65% RH and 9 mph wind b) 30% RH and 6 mph wind
53
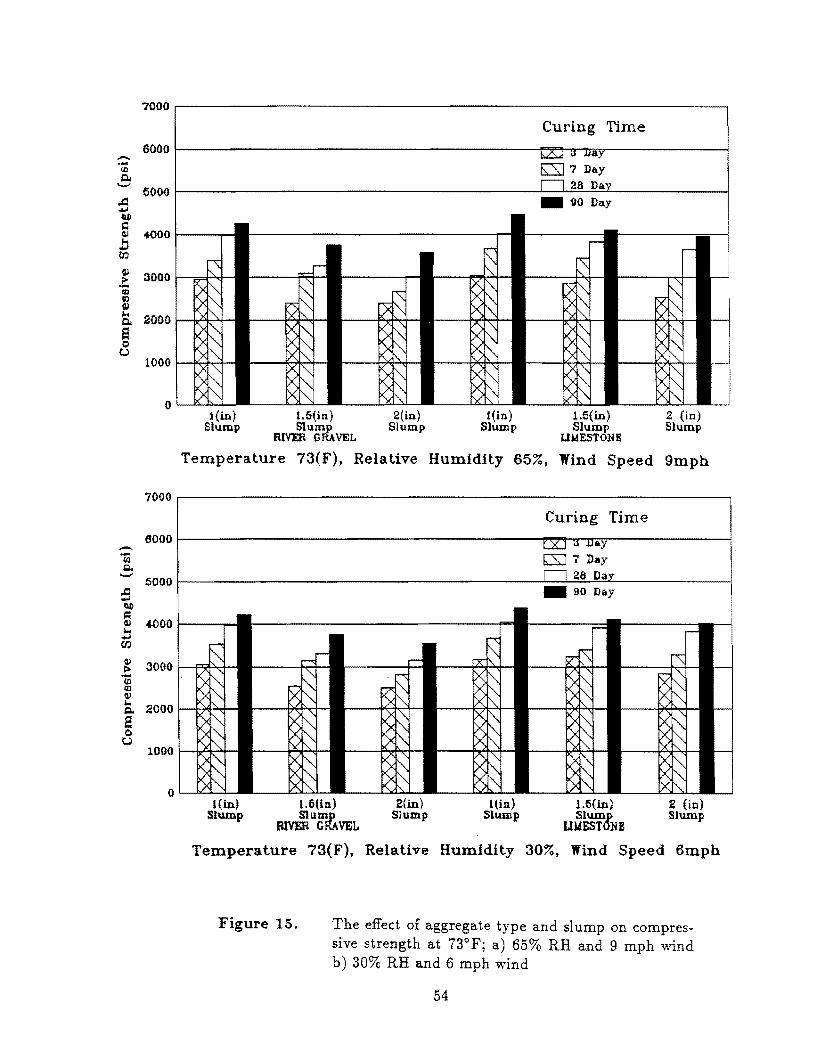
-,-CD c..
"-"
..c:I ... ~ C Q)
!l CI'l
CP ~
CD Vl CP H c.. S c t,.)
-'iij Q. -:l ~ f,:I
7000
Curing Time 6000 bL:..d \J .uay
[S] 7 Day
5000 Ll~I)a,y _ 00 Day
+000 ,.--r-
3000
2000
1000
0
~ -
r\ ~ ....- I\c <--
~ "" ~ [IR ~ ~ ~ ~ ~ 0-~ K rQ '" '" r>< I'\. I--
~ ~ ~ ~ ~ ~ R ~ ~ K ~ r" ~ l> '" IX '"
t>< ~ ['\ t>< r'\.
~ ~ ~ "" ~ ~ ~ f'\ ~ " ~ ~ [ "" ~ ~ t>< 0- '" t'x' ['\ ~ '" i(in) 1.5(in) 2(in} l(in) 1.5{in) 2 (in)
Slump Slump Slump Slump Slump Slump RIVER GRAVEL WdESTONB
Temperature 73(F), Relative Humidity 65%, Wind Speed 9mph
7000~--------------------------------------------------------
Curing Time 6000~------------------------------------~~~~------------
CSJ 7 Day
5000~------------------------------------L-~~~----------~ _ 90 Day
Q) .000 1---...,.... !l CI'l
~ 3000 I----l~~ 10
CD Q)
~ 2000 f---l~"<'Ie Q tJ
l(in) Slump
1.6(in) Slump
RIVER GRAVEL
2(in) Slump
Hin) Slump
l,6(in) Slump
IJtdESTONE
~ (ill) Slump
Temperature 73(F). Relative Humidity 30%, Wind Speed 6mph
Figure 15. The effect of aggregate type and slump on compressive strength at 73°F; a) 65% RH and 9 mph wind b) 30% RH and 6 mph wind
54
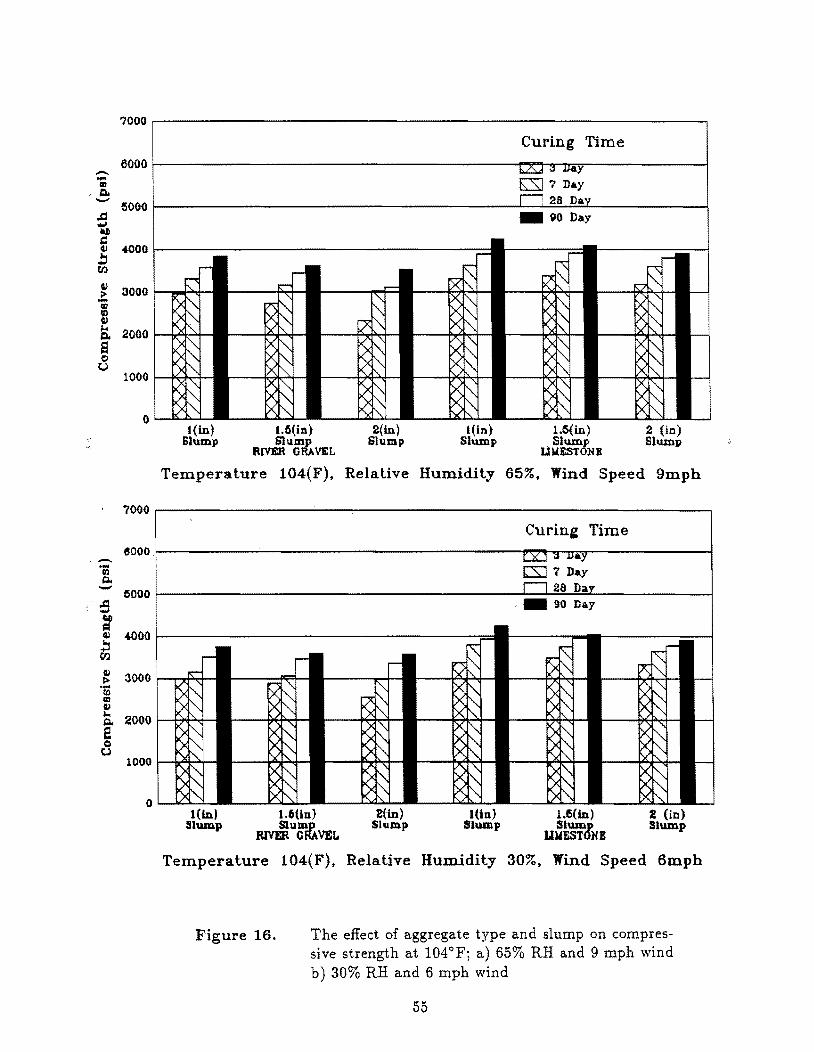
.-. -GI Q., ........,
~ III ~
70oor-----------------------------------------------------------~
Curing Time 6000~--------------------------------------~~~rnw~----------~
[S] 7 Day
~OOO~--------------------------------------~~~~~----------~ _ gO Da.y
~ ~OO~----------------------------------~ b Cf.l
~ 3000 f---l~"<.l-Ui IJ a. 2000 r---i,..<+-,+-
a (:I
t,)
:S &'
(in) Slump
1.5(10) Shamp
RIVER GRAVEL
2(in) Slump
(in) Slump
1.5(in) Slump
UWESTONB
2 (io) Slump
Temperature 104(F), Relative Humidity 65%, Wind Speed 9mpb
7000r---------------~----~------------~----------------------_.
Curing Time eooo~--------~----------------------------~~_r~~----------~
l:SJ 7 nay
5000~--------------------------------------~~~~~----------~ . _ 90 Da.y
~ ~OO~----------------------------------~ !l tr.i
~ 3000 f---l~-n--to GI f,I a 2000 I--l~'-d-e c t.J
1 000 I--lr:ol:-~
1.6(in} Slum])
RIVER GRAVEL
2(in) Slump
IUn} Slump
1.6(in) Slump
UlofESTONB
! (in) Slump
Temperature 104(F), Relative Humidity 30%. Wind Speed 6mpb
Figure 16. The effect of aggregate type and slump on compressive strength at 104°Fj a) 65% RH and 9 mph wind b) 30% RH and 6 mph wind
55
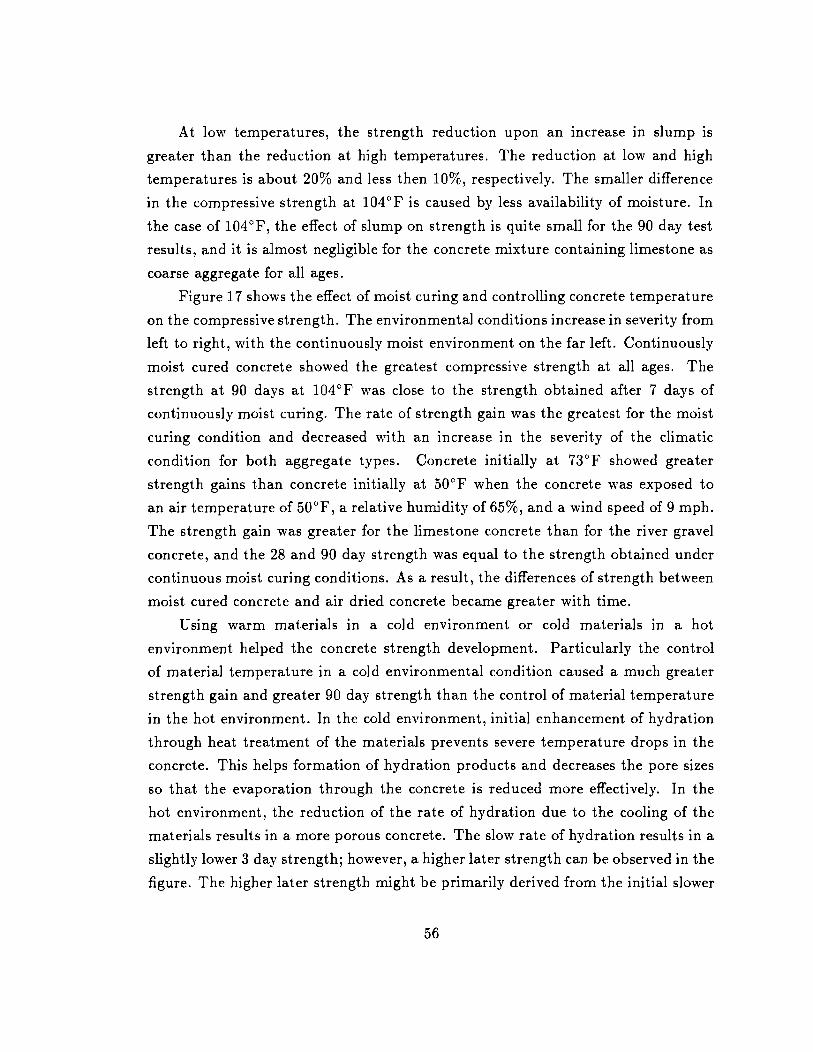
At low temperatures, the strength reduction upon an increase in slump is
greater than the reduction at high temperatures. The reduction at low and high
temperatures is about 20% and less then 10%, respectively. The smaller difference
in the compressive strength at 104°F is caused by less availability of moisture. In
the case of 104 of, the effect of slump on strength is quite small for the 90 day test
results, and it is almost negligible for the concrete mixture containing limestone as
coarse aggregate for all ages.
Figure 17 shows the effect of moist curing and controlling concrete temperature
on the compressive strength. The environmental conditions increase in severity from
left to right, with the continuously moist environment on the far left. Continuously
moist cured concrete showed the greatest compressive strength at all ages. The
strength at 90 days at 104°F was close to the strength obtained after 7 days of
continuously moist curing. The rate of strength gain was the greatest for the moist
curing condition and decreased with an increase in the severity of the climatic
condition for both aggregate types. Concrete initially at 73°F showed greater
strength gains than concrete initially at 50°F when the concrete was exposed to
an air temperature of 50°F, a relative humidity of 65%, and a wind speed of 9 mph.
The strength gain was greater for the limestone concrete than for the river gravel
concrete, and the 28 and 90 day strength was equal to the strength obtained under
continuous moist curing conditions. As a result, the differences of strength between
moist cured concrete and air dried concrete became greater with time.
U sing warm mat.erials in a cold environment or cold materials III a hot
environment helped the concrete strength development. Particularly the control
of material temperature in a cold environmental condition caused a much greater
strength gain and greater 90 day strength than the control of material temperature
in the hot environment. In the cold environment, initial enhancement of hydration
through heat treatment of the materials prevents severe temperature drops in the
concrete. This helps formation of hydration products and decreases the pore sizes
so that the evaporation through the concrete is reduced more effectively. In the
hot environment, the reduction of the rate of hydration due to the cooling of the
materials results in a more porous concrete. The slow rate of hydration results in a
slightly lower 3 day strength; however, a higher later strength can be observed in the
figure. The higher later strength might be primarily derived from the initial slower
56
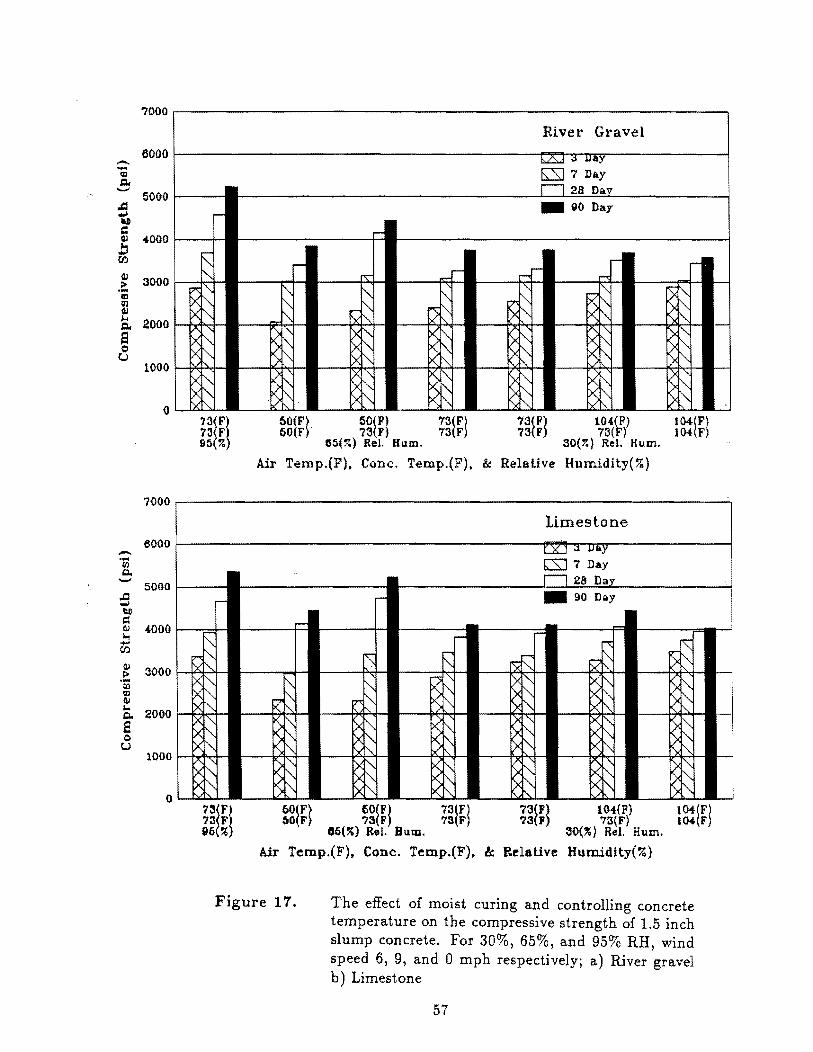
7000
6000 -IZl s::w ......,
5000 .:l ..,; ~ .: tl .000 b rt.J
tl 3000 ;> .... IZl !Il tl ~ 2000 s::w S c U
1000
()
7000
6000 -'iii Q. - 5000 .:l .-~ ~
4000 Qj
"" ..... rt.J
Qj 3000 t> .... CD IZl Qj
"" 20{)O Q.
S 0
U 1000
0
,.....
F:: f',
1:"'1'\ XI" IX I"
X'" IX",,-
X""-X'" rx""-73~F1 ?:J F 95 7.
r-
I" ~ :>"'<:
IV , K I'\. K I'\. XI'\. X, x""-IX'"
X" lXl"
?3~Fi 73 F 96 ~
River Gravel
~ ;:) JJay
&:Sl 7 DAy II 2B Dav _ go Day
-r-- r-
r- r-1'1:" ..... r- r<
1'\ t'\ 1'\ I" R
1'\ I' I" ~ I"-I"
r-~ 611' I" l"-I'x
~~ I>~ R "- ~'" ~ "-tx~ "-txl'\. k' "- >'" ,
'\
.~ I" x'\
~ ,
~~ R '\ )<~ "- , "'. X~ K "- ~~ y
~81H ~gaJ ~glB ~g~H 1~:(~) 155(70) Rei. Hum. 30(:Q Rei. Hum.
Air Terop.(F), Cone. Temp.(F), &. Relative Humidity(%)
Limestone
[}LJ il .uAY
(SJ 7 Day II 28 Day
.- _ 90 Day
r-r-
,..... r::
" ~
"Xc::: " I'\. R '\ "- '" ~ I'\. >""- ~ t'\ R~
",,,, >< I'\. >""- '" >:'" >< '" K' ~~ R , ><".
~ I" K~ )<1'\. "-, xI" K I, I'll, 6(
~~ Xt'-, ~
, ~~ R , X~ ,
X~ K " K 1'\
" 60(F} 60(F) 73(F) 73(F) 1{)4(P) 60(F) 73(F) 7S(F) 73(F) 73{F}
06(%) Rei. Bum. SO(r.} ReI. Hum.
Air Temp.(F). Cone. Temp.(F). &. Relative Humidity(70)
,....
r> f'\, R f'\,
f'\,
~~ >'" ~'" >'"
104(Fl 104(F
r::: f>" >'" >'" ~~ f>.1"
~~ J04{F) 104(F)
Figure 17. The effect of moist curing and controlling concrete temperature on the compressive strength of 1.5 inch slump concrete. For 30%, 65%, and 95% RH, wind speed 6, 9, and 0 mph respectively; a) River gravel b) Limestone
57
I--
I--
f--
L.....:.
~
-
i ~
U

strength development. The faster rate of hydration in the hot temperature causes
a weaker matrix structure to be formed as a result of a nonuniform distribution of
hydration products (11).
When comparing the effect of aggregate type, the following can be observed
from Figure 17. In general, the strength of the river gravel mixtures is less than for
the limestone concrete mixtures. In particular, the strengths for the 50°F and 104°F
environment with the materials heated or cooled to 73°F, respectively, increased
more for the limestone mixture than the river gravel mixture when compared to the
strengths obtained under continuous moist cure. This is attributed to the presence
of larger amounts of water in the limestone aggregates and therefore a greater
source of heating or cooling in the 50°F and 104°F environmental temperatures,
respecti vely.
Figures 18 and 19 illustrate the effect of consolidation method on the compres
sive strength development for four different ages. The three different consolidation
methods, spading, rodding and vibrating, were considered in this experiment. In
most cases the vibrating method resulted in the greatest strength, followed by rod
ding and spading in that order. However, for the river gravel mixtures with 1.0 and
1.5 inch slump, the three consolidation methods produced about the same strength.
For the 2 inch slump river gravel concrete, little difference in strength between the
consolidation methods was observed at 3 days of curing. At the later ages, however,
the previously stated trend is observed. For the limestone concrete mixtures, the
difference in strength between the three consolidation methods appears to be the
same for the different slumps. A similar pattern is seen for the river gravel mixtures.
Furthermore, since the surface texture of the limestone concrete requires a larger
energy to obtain liquefaction when compared to that of river gravel, a greater differ
entiation between the three consolidation methods is obtained with the limestone
concrete.
The addition of fly ash to the concrete affected the compressive strength in two
ways, depending on the aggregate type. With the exception of the results at 7 days,
the fly ash mixtures with river gravel aggregates produced slightly lower strength
than the plain concrete. For the limestone aggregate mixtures, the fly ash mixtures
generally produced greater strength when compared to the strength obtained with
the plain concrete. This difference in performance may be attributed to the greater
58
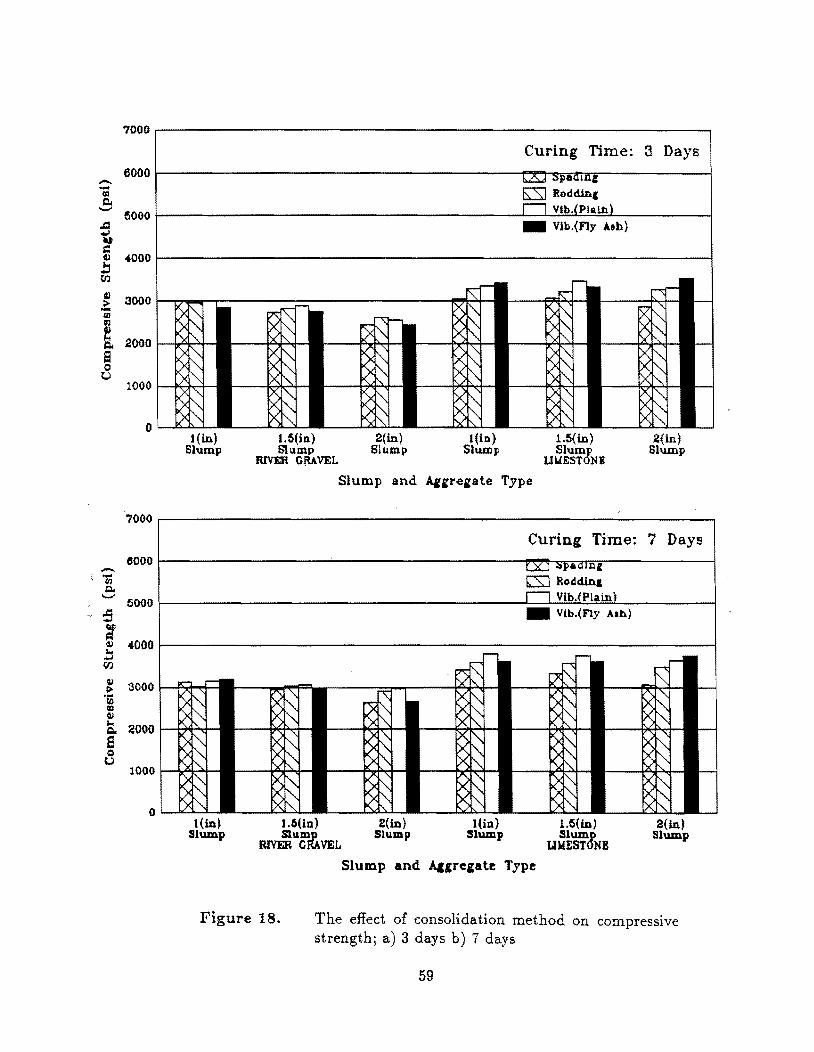
.Q .oJ U
7000~------------------------------------------------------------~
Curing Time: :3 Days 60001-----------------------------------------P~~~~----------~
D:Sl Roddin,
~OOO~---------------------------------------~-L~~~~--------~ _ Vlb.(ny Ash)
~ ~ ~OO~------------------------------------------------------------~ b
tIj
~ 3000 I--....... __ -r--------------------------~M_ -Gl
t! 1:'1.0 2000 I--Ior"'+~ S o U
--(/l Q.
l(in) Slump
1.5(ln) 2(in) 1(in} Slamp Slump Slump
RIVER QfUVEL
Slump and .t\&'rrerate Type
1.5(in) Slump
U~ESTONI
2(in) Slump
7000~-----------------------------------------------------------~
Curing Time: 7 Days 6000~----------------~-------------------~~~~~---------~
(SJ Roddlna
5000~----------------------------------------~~~~~~--------~ _ Vib.(Fly A.h) :3
:t ~ 4000~------------------------------------------------------------~ b
CfJ
: 3000 f--IC>.ri-~ 'ij) Gl ~
5. 2000 f--I~o.d-S <:> u
1000 f--I~~
Hin' Slump
1.6(i1l) Slumj)
RIVER eRA VEL
2(in) Slump
Hill) Slump
Slump and A,lIreiate Type
1.I5(in) Slump
UWESTONB
2(in) Slump
Figure 18. The effect of consolidation method on compreSSIve strength; a) 3 days b) 7 days
59
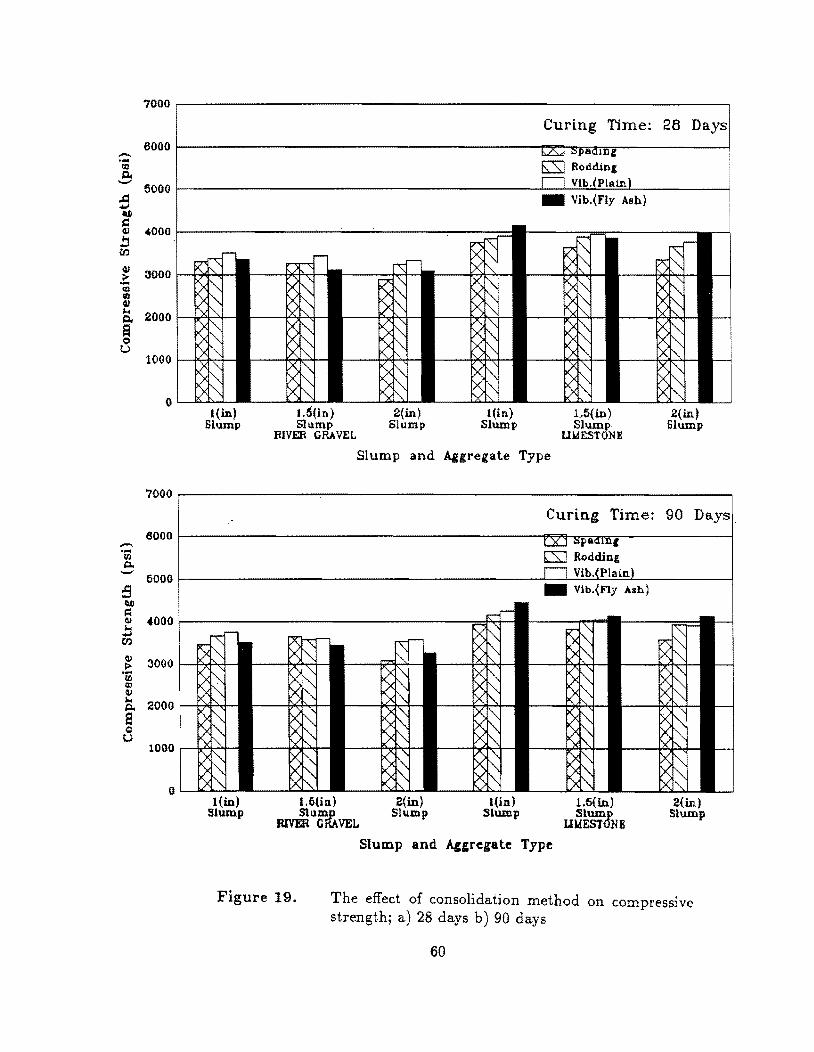
..c:I ,.; II.!)
7000~-------------------------------------------------------------,
Curing Time: 28 Days 6000~--------------------------------------~~~~~----------~
ESl Rodding
~OOQ~------------------------------------~~~~~~---------_ Vib.(Fly Ash)
~ b .ooo~----------------~--~------~----~ {£J
~ :'1000 ___ ~"d-.... CD fl Q,)
}1 2000 I---iir"'l:--'+-
a <:> U
'iii Q, -
I(in) Slump
1.5(in) 2(in) l(in) Slump Slump Slump
RIVER GRAVEL
Slump and Aggregate Type
L5(in) Slump
Ul.fESTONIl
2(in) Slump
70QQ~--------------~-------------------------------------------,
Curing Time: 90 Days.
eooo~--------------------------------------~(tBm~lI'-----------l (SJ Rodding
5000~----------------------------------------~~~~~~~------~ _ Vib.(Fly Ash) :9
: b '000 ~----------------------------=~f-CfJ
2000 >-: ----H<~-
1000 ~i -Ir'~-
I(in) Slump
1.6(in) Slumjl
RIVER GRAVEL
2(in) Slump
l(in) Slump
Slump and Aggregate Type
Ui(in) Slump
LUdESTONB
2(in) Slump
Figure 19. The effect of consolidation method on compressive strength; a) 28 days b) 90 days
60
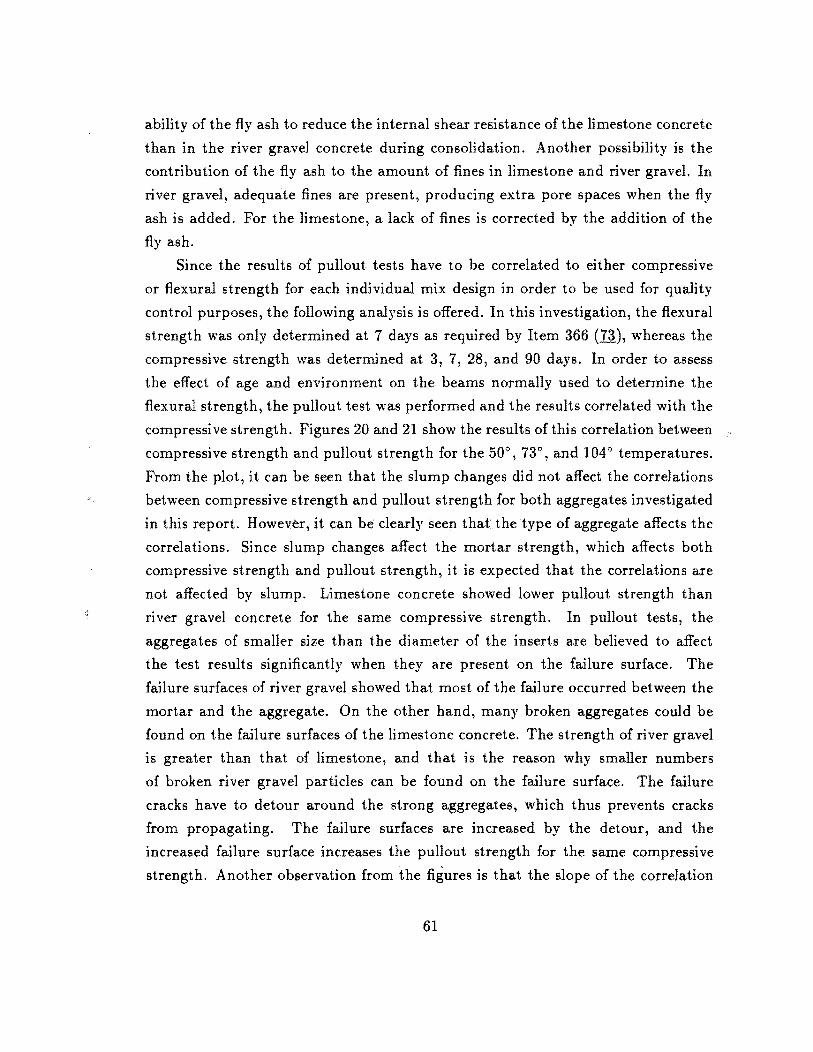
ability of the fly ash to reduce the internal shear resistance of the limestone concrete
than in the river gravel concrete during consolidation. Another possibility is the
contribution of the fly ash to the amount of fines in limestone and river gravel. In
river gravel, adequate fines are present, producing extra pore spaces when the fly
ash is added. For the limestone, a lack of fines is corrected by the addition of the
fly ash.
Since the results of pullout tests have to be correlated to either compressive
or flexural strength for each individual mix design in order to be used for quality
control purposes, the following analysis is offered. In this investigation, the flexural
strength was only determined at 7 days as required by Item 366 (73), whereas the
compressive strength was determined at 3, 7, 28, and 90 days. In order to assess
the effect of age and environment on the beams normally used to determine the
flexural strength, the pullout test was performed and the results correlated with the
compressive strength. Figures 20 and 21 show the results of this correlation between
compressive strength and pullout strength for the 50°, 73°, and 104° temperatures.
From the plot, it can be seen that the slump changes did not affect the correlations
between compressive strength and pullout strength for both aggregates investigated
in this report. However, it can be clearly seen that the type of aggregate affects the
correlations. Since slump changes affect the mortar strength, which affects both
compressive strength and pullout strength, it is expected that the correlations are
not affected by slump. Limestone concrete showed lower pullout strength than
river gravel concrete for the same compressive strength. In pullout tests, the
aggregates of smaller size than the diameter of the inserts are believed to affect
the test results significantly when they are present on the failure surface. The
failure surfaces of river gravel showed that most of the failure occurred between the
mortar and the aggregate. On the other hand, many broken aggregates could be
found on the failure surfaces of the limestone concrete. The strength of river gravel
is greater than that of limestone, and that is the reason why smaller numbers
of broken river gravel particles can be found on the failure surface. The failure
cracks have to detour around the strong aggregates, which thus prevents cracks
from propagating. The failure surfaces are increased by the detour, and the
increased failure surface increases the pullout strength for the same compressive
strength. Another observation from the figures is that the slope of the correlation
61
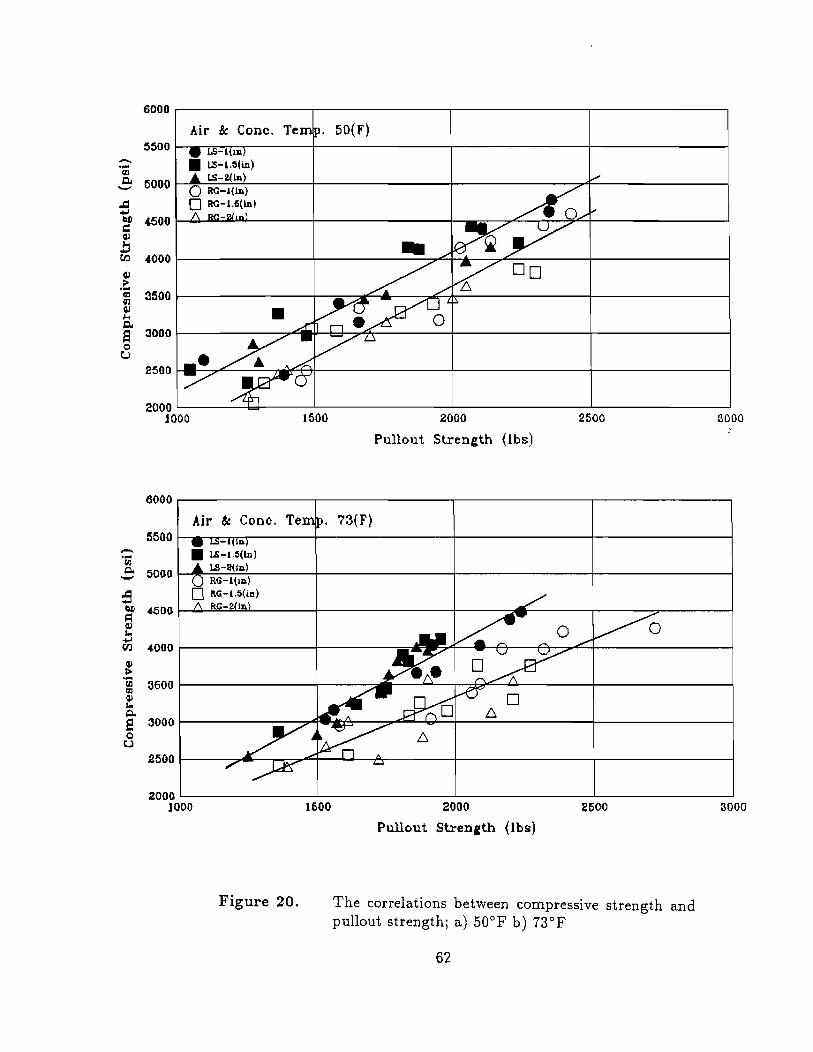
6000
5500 Uj-l In - • US-I.5(in) -III LS-2{In) c.. (5000 ....... o RC-l{ln)
.CI o RC-I.6(ln) ... ~ .(500 s:: ¢l
b tr.J "000 4l .:: rD 3500 III 4l ,.... c.. S :)000 (;)
t..)
2500
2000 1000
6000
5500 - • Ui:-t.5(ln) 'iii Q. 5000
UH!{ln) - RG-1(ln)
.CI o RG-l.5(in) -' RG- I ~ 4500 I=t ¢l 100 ...
t;f.l 4000 ¢l I> 'iii 3600 III ¢l 100 Q.
e 3000 0 tJ
2500
2000 1000
Figure 20.
1500
1600
50(F)
2000 2500
Pullout Strength (Ibs)
73(F}
0
/:).
2000 2600
Pullout Strength (Ibs)
The correlations between compressive strength and pullout strength; a) 50°F b) 73°F
62
3000
3000

lines decreases as the temperature is increased from 50°F to 104°F. This indicates
that the pullout strength is more sensitive to the change in temperature than the
compressive strength and that the observed decrease in strength with temperature
might be attributed to weak zones between the hydration products, as previously
mentioned (11).
Moist Cured Condition The effects of mixing time on compressive strength
are plotted in Figure 22 for 1.5 inch slump concrete. As the mixing time increased
from 7 to 60 minutes, no significant changes in compressive strength occurred. Thus,
the results indicate that the compressive strength was not affected by the extended
mixing time for the standard conditions. A possible explanation for this observation
is that the curing conditions after initial mixing provided adequate conditions for
continued hydration.
Figure 23 shows the effect of consolidation method on compressive strength for
different mixing times and a slump of 1.5 inches. The experiment was designed with
the intention that the vibrating method had the highest consolidation energy and
the spading method had the lowest consolidation energy. It was expected that the
specimens that received the greatest amount of consolidation effort would yield the
greatest strength. For 7 minutes mixing, this expectation was not met; even though
the strengths at 3 and 90 days were the highest, the strengths at 7 and 28 days were
not the highest values. Generally, the strengths were about the same. However, for
60 minutes mixing, the vibrating method showed the highest strength consistently,
and almost the same strength was observed for the other two methods. The spading
method gave slightly higher strength than the rod ding method but not significantly
higher. From these observations, we can conclude that the consolidation method
did not affect the test results for 7 minutes mixed concrete, but the consolidation
method affected the test results for 60 minutes mixed concrete. The 7 minutes
mixed concrete had higher strength than the 60 minutes mixed concrete for most
cases shown in Figure 23. The extended mixing time magnified the consolidation
effects on the compressive strength.
Figure 24 illustrates the correlations between compressive strength and pullout
strength. The vibrating and rod ding methods show almost the same correlations.
The spading method, however, showed a slightly different correlation from the other
two methods. Both the spading and rodding methods show very good correlations
64
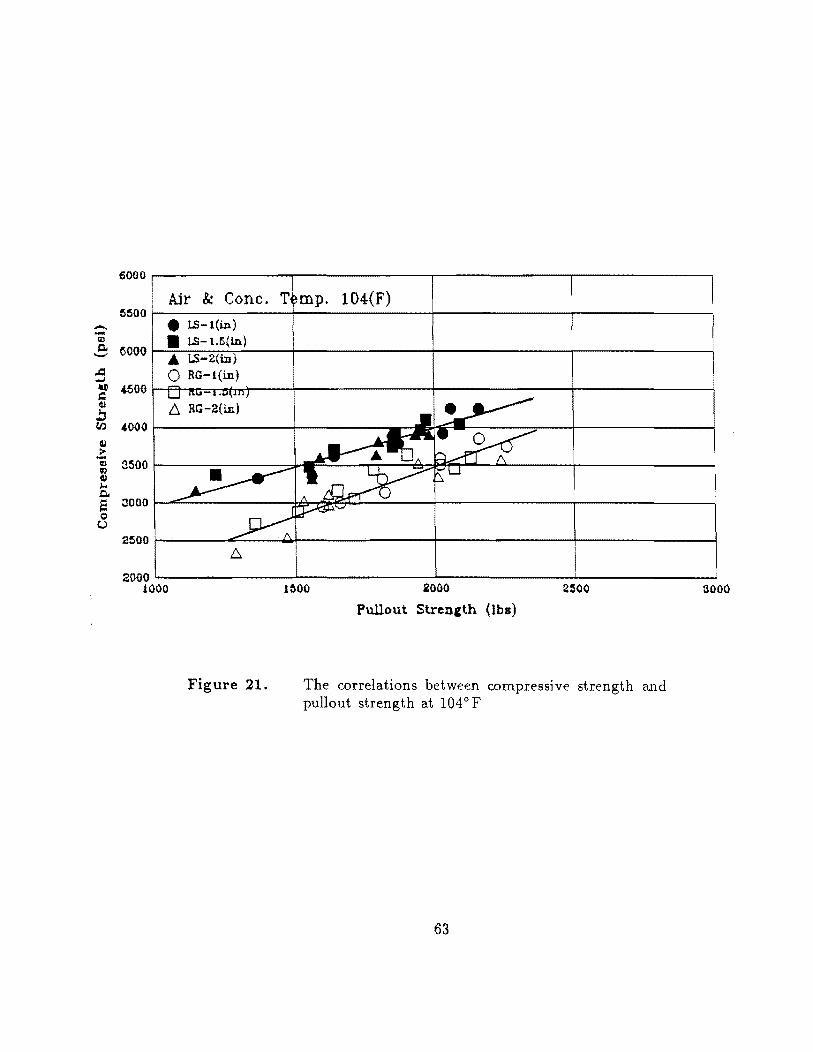
--QJ c. '-'
A
--III ~ QJ
l:! tr.l
~
~ QJ CJl ~ I-< Q.
S <;)
u
6000
Air & Cone. !s!soo
• !.S-l(in) • !.S-l.ti(ln)
(SOOO .. !.S-2(in) o RG-t(in)
.soo t::. RG-2(in)
,(,000
3500
:1000
2!SOO
2000 JOOO
Figure 21.
T mp. lO4(F)
1600 2000 2500
Pullout StrCDcth (Ibs)
The correlations between compreSSIve strength and pullout strength at 1040 F
63
aooo
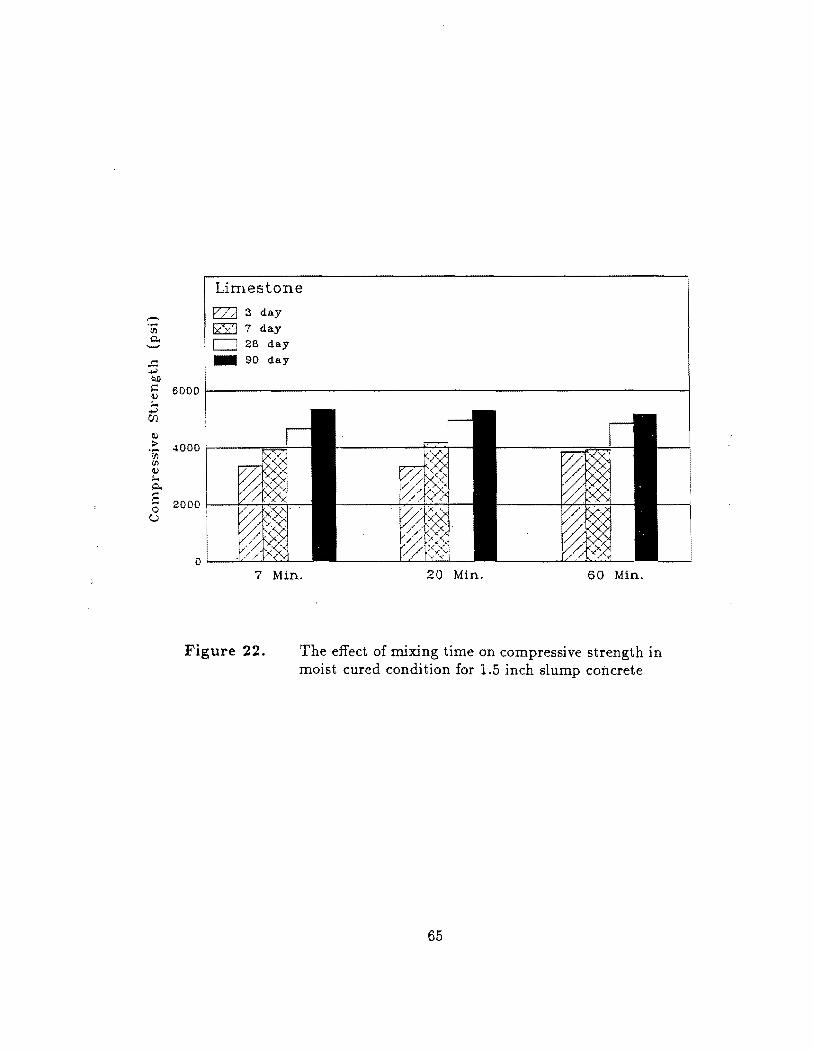
,-. ..... III ~
..c: ..., ~ >: ~
.:1 r.tl
(I,)
> .-'fI II> 11)
r.... ~ ,.. ~ 0
U
Limestone
EZa 3 day
IXvl 7 day
c:: 2B day -90 day
6000
4000
2000
o· 7 Min. 20 Min. 60 Min.
Figure 22. The effect of mixing time on compressive strength in moist cured condition for 1.5 inch slump concrete
65
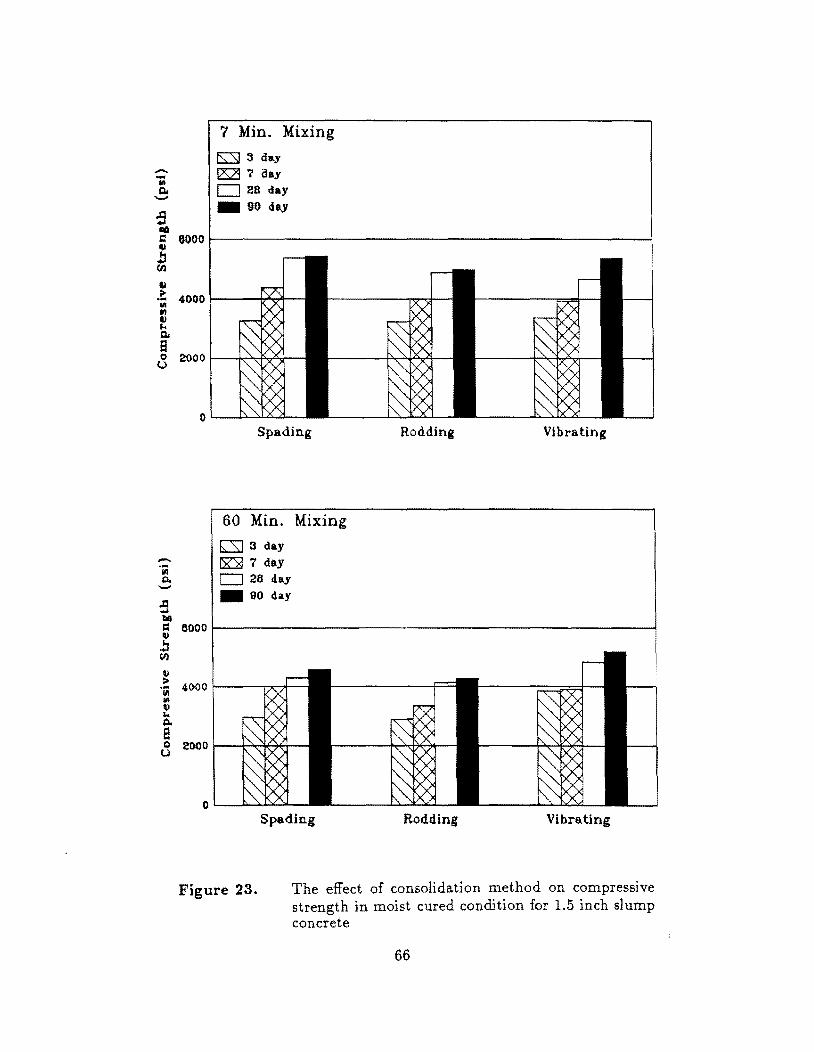
-.. -1/1 g. -.l:I ~
'1 Min. Mixing
rs::::Sl 3 day I2S2l ? Clay
o 28 day _ 90 day
IIG ; 6000r-------------------------------------------------~ b CIl
II ~ 4000 1------~,:lI_-III III GJ ,.. g.
a 8 2000 1----+~f>.,;,.2I.d_-
-"iii Q, -
.l:I -till ~ I) ... ~ (I.J
II ~
"iii III II
'" Q. e 0 u
Spading Rodding Vibrating
60 Min. Mixing
[S] 3 day
~ 7 day 026 day _ 90 clay
6000
4000
~ooo
Spading Rodding Vibrating
Figure 23. The effect of consolidation method on compressive strength in moist cured condition for 1.5 inch slump concrete
66
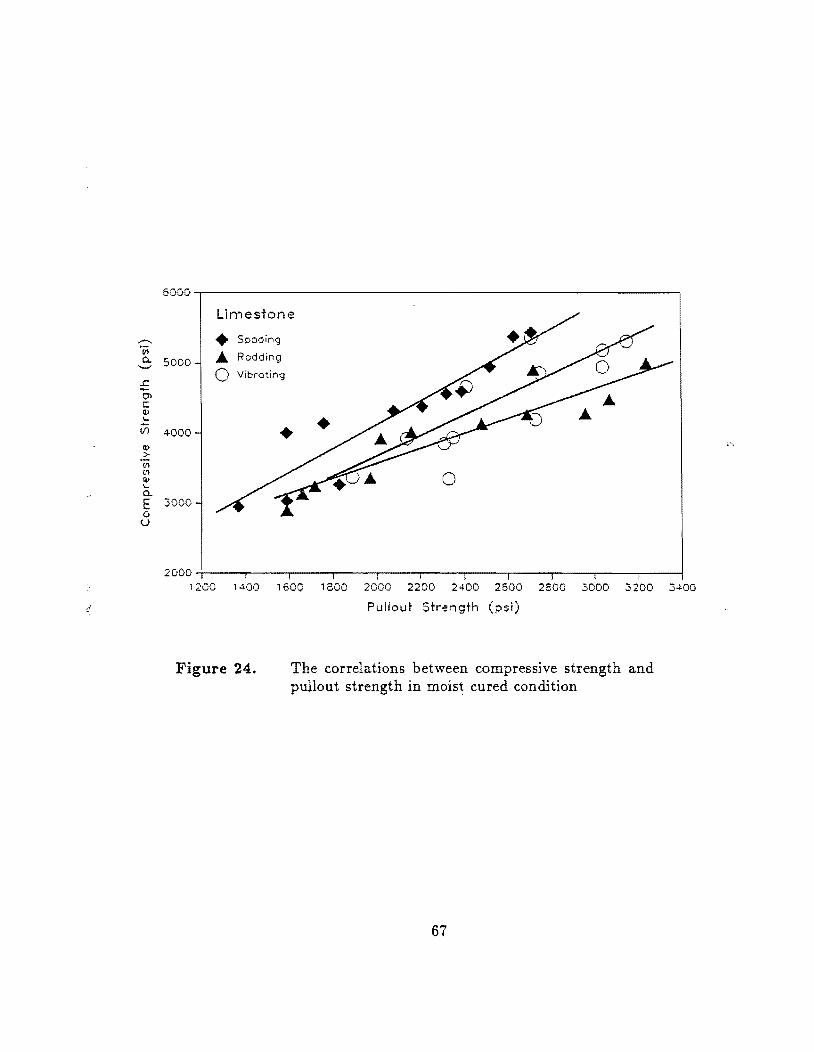
,.-.., 'iii Q.
.r:. en t: Q) l-
if)
Q)
>
'" t~ Q) I-Q.
E 0 u
5000
Limestone
• Spading
5000 ... Rodding
0 Vibrating
4000 • • 0
3000
2DOO~----.----.-----r----.-----.----'-----r----.----'r----.----~
1200 1400 1600 1EOO 2000 2200 2400 2600 2800 3000 3200 3400
Figure 24.
Pullout Strength (psi)
The correlations between compressive strength and pullout strength in mois~ cured condition
67
-~ '-.,
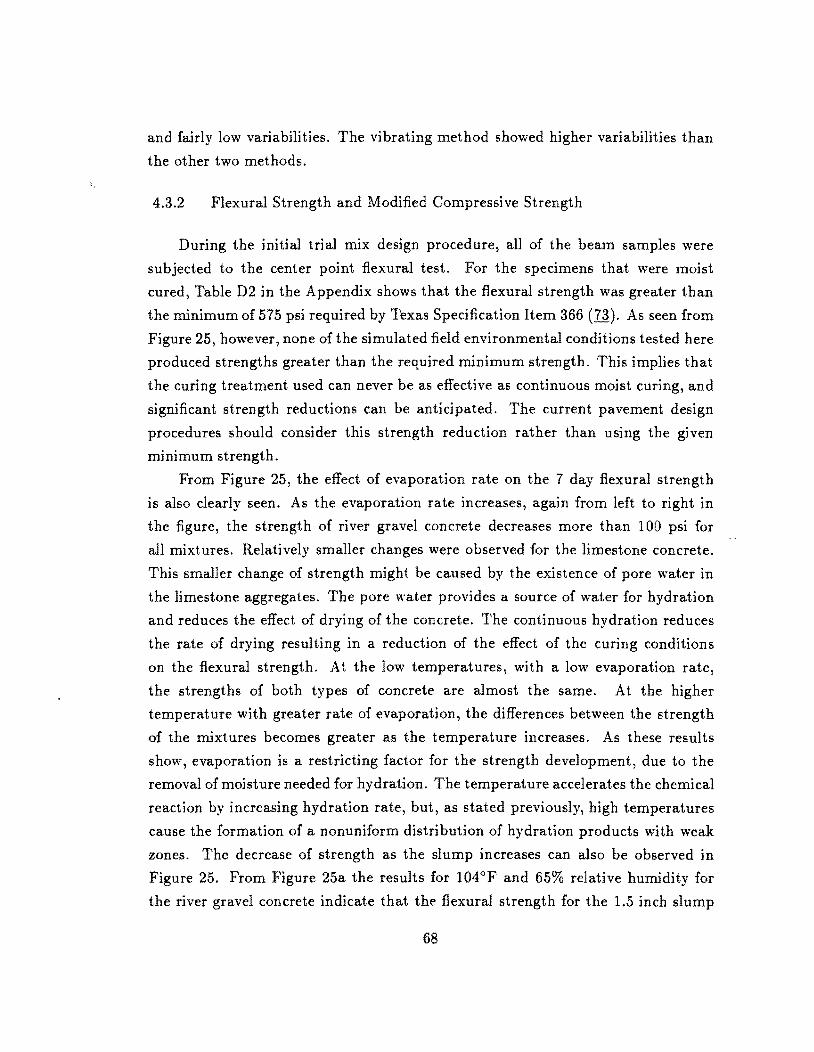
and fairly low variabilities. The vibrating method showed higher variabilities than
the other two methods.
4.3.2 Flexural Strength and Modified Compressive Strength
During the initial trial mix design procedure, all of the beam samples were
subjected to the center point flexural test. For the specimens that were moist
cured, Table D2 in the Appendix shows that the flexural strength was greater than
the minimum of 575 psi required by Texas Specification Item 366 (73). As seen from
Figure 25, however, none of the simulated field environmental conditions tested here
produced strengths greater than the required minimum strength. This implies that
the curing treatment used can never be as effective as continuous moist curing, and
significant strength reductions can be anticipated. The current pavement design
procedures should consider this strength reduction rather than using the given
minimum strength.
From Figure 25, the effect of evaporation rate on the 7 day flexural strength
is also clearly seen. As the evaporation rate increases, again from left to right in
the figure, the strength of river gravel concrete decreases more than 100 psi for
all mixtures. Relatively smaller changes were observed for the limestone concrete.
This smaller change of strength might be caused by the existence of pore water in
the limestone aggregates. The pore water provides a source of water for hydration
and reduces the effect of drying of the concrete. The continuous hydration reduces
the rate of drying resulting in a reduction of the effect of the curing conditions
on the flexural strength. At the low temperatures, with a low evaporation rate,
the strengths of both types of concrete are almost the same. At the higher
temperature with greater rate of evaporation, the differences between the strength
of the mixtures becomes greater as the temperature increases. As these results
show, evaporation is a restricting factor for the strength development, due to the
removal of moisture needed for hydration. The temperature accelerates the chemical
reaction by increasing hydration rate, but, as stated previously, high temperatures
cause the formation of a nonuniform distribution of hydration products with weak
zones. The decrease of strength as the slump increases can also be observed in
Figure 25. From Figure 25a the results for 104°F and 65% relative humidity for
the river gravel concrete indicate that the flexural strength for the 1.5 inch slump
68
800
700
-'(ji 600 Q. '-'
.c 500 ..-bfI ~ OJ
",00 ... .... Cll -CIl 300 ... =' :04 OJ 200 ~
100
0
600
700
-.... 600 I:D Q. -~ 500 ~ bb C QI
.00 1:1 CI.l
"; 300
~ QI 200 ~
100
0
_ 1.6" Slump
IZ21 2" Slump
5°fP\ 65 ~ 50t~ 30 % 73~F~ 60 % 73~F~ 30 % JQ4.~) 6fi( )
104~) 30{ 0)
9 mph 6 mph 9 mph 6 mph I) mph CS mph
Air &: Cone. Temp.(F). RH(70). Wind Spd.(mpb)
5°fF~ 60~FL 7a~F~ 73t~ lCU{F) 104(F) 1S5 ~ SO ~ 65 ~ 30 x ~(?h 3O(Yol
II mph 6 mp g mph e mph 9 mp e mp'
Air & Cone. Temp.(F). RH(%). Wind Spd.(mph)
Figure 25. The environmental effects on the flexural strength; a) River gravel b) Limestone
69
,~.
mixture is lower than expected. This is attributed to the variability of the test, since
only one beam was tested per data point. The decreases of strength due to slump
changes are smaller than the changes due to the environmental changes investigated
in this research. The observations imply that 7 days of evaporation is long enough
to differentiate the effect of environmental changes on the flexural strength.
The delay of placement requires additional water to achieve proper workability,
and causes a decrease in flexural strength. This is illustrated in Figure 26 where,
for the same slump, the flexural strength decreases as the mixing time increases.
However, this reduction in flexural strength can be avoided by controlling the initial
slump. Even for 60 minute mixing, if the additional water is closely controlled
within one inch slump, the flexural strength can be greater than that of 7 or 20
minute mixed concrete of higher slump. Reducing the initial slump, if delays in
concrete placement are anticipated, can be helpful for recovering flexural strength.
In other words, high slump has a worse effect on flexural strength than the
delay of placement. Note that these results were achieved when retempering was
administered after the end of the mixing time. If retempering is not administered,
a permanent reduction in slump exists at the time of placement and difficulties in
consolidating and finishing of the concrete will most likely occur.
The replacement of part of cement with fly ash slightly reduces the 7 day
flexural strength. However, the effects of delays in placement and slump on flexural
strength were not changed by the presence of fly ash. In this research, 20 % replacement of fly ash was used with a 1:1 ratio by weight of cement. If a 1:1.2
replacement ratio was used instead, the strength reduction might be reduced or
eliminated.
For the limestone concrete, the absolute strength is about 100 psi greater than
for the river gravel concrete. However, no large differences for the effect of mixing
time and slump changes can be observed. Limestone concrete is more stable for the
changes of the factors shown in Figure 26. The possible reasons for this phenomenon
might be twofold: the rough surface of limestone might provide better bonds than
river gravel concrete, or the greater absorption of the limestone compared to the
river gravel might provide additional water for continuous hydration.
Figure 27 shows the effect of the consolidation method for both aggregate types
for 1.5 inch slump concrete. The spading method is expected to yield the lowest
70
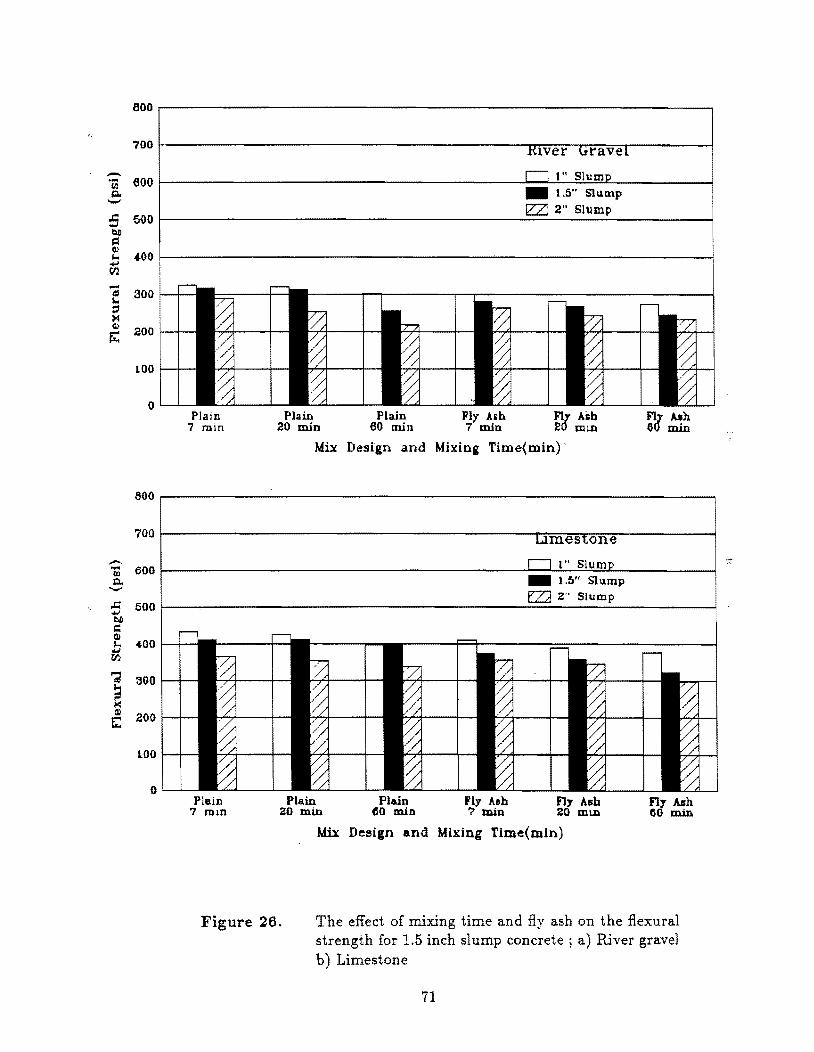
800
700
-.;; 600 Q. -~ 500 ~ ~ Ql
.... 00 ... +' til -(II 300 L. ;:J ><I Ql
200 -r... 100
0
800
700
---..... 600 III Q. --..t:: 500 ..., til) C r»
400 '"' -.J V'J
~ 300
~ r» 200 t::
100
0
_ 1.5" Slump
tzZl 2" Slump
Plain Plain Plain Illy A5h Fll Alb Fll Ash 7 min 20 min 60 min 7 min 2 min e min
Mbc Design and Mixing Time(min)
1.5" Slump EZ3 2" Slump
Plain Plain Plain Fly Aeh Fly Ash Fly Alh 7 mm 20 min em min '7 min 20 mm ISO min
Mix Deeign and Mixing Time(min)
Figure 26. The effect of mixing time and fly ash on the flexural strength for 1.5 inch slump concrete; a) River gravel b) Limestone
71
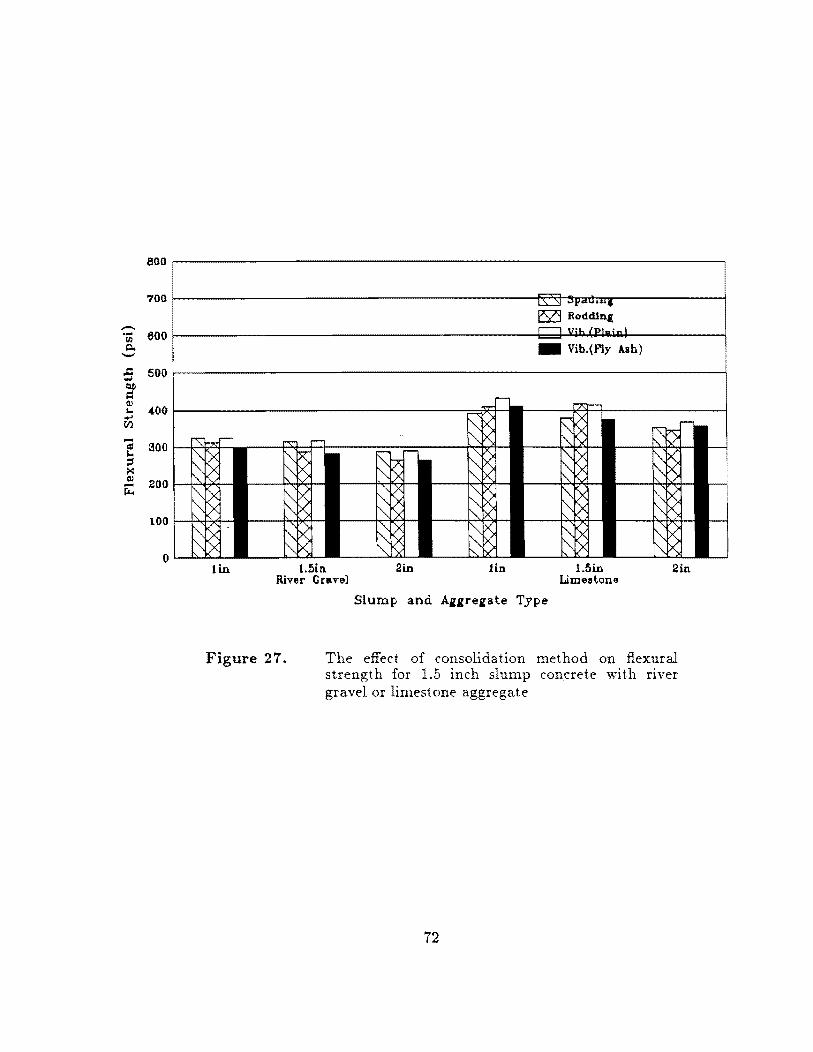
800
700
-"ai 600 c. --..c 500 ..-b() 1::1 III I- 400 .... en -CIj 300 "" :s ~ III 200 ~
100
0
,""r-,.,-
~ "-~ ~ ~ '"
5< 1"-
'" :x lin
...,.. ..-
~ ~ ~ ./
~ ~ ~ '" ~ 1.5in
River Crav!.'!]
-""'"
~ ~ f': - ~ ~ ~~ ~
~ ~ 1\ S ~ X I~
~ ~ ~ R "'-rx l', IX 2in 1ln
.--:=-! ..
~ . .. t3Z:l RC)dd1ng rI Vi" (PI .. ;., I
_ Vib.(Fly Ash)
""-\: ~ ~ v l~ ~ ~
~ ~ '" ~ ~ .~
1.5 in Limelltone
-l'V
r--
~~ ~~'-i -~R -
2m
Figure 27. The effect of consolidation method on flexural strength for 1.5 inch slump concrete with river gravel or limestone aggregate
72
strength among the three methods because this method has the lowest consolidation
energy. However, some of the spaded concrete showed higher strength than the
rodded concrete and almost the same strength as the vibrated concrete. More than
expected degree of consolidation must therefore have occurred with the achieved
spading method. Even though the consolidation energy is not as high as the rodding
method, the shape of the trowel used to consolidate the concrete by spading might
have improved the efficiency of the consolidation. A long and narrow cross section of
the trowel improves the penetration into the concrete mix and provides consolidation
over a more wide area per stroke. Spading of the concrete with rounded river
gravel particles appears to be as effective as vibration, but less effective for the
crushed limestone concrete. In this case, the angular shape of limestone produced
significantly lower strength for both the rod ding and spading method compared to
the vibrating method. The interlocking nature of angular aggregate particles thus
limits the level of consolidation so that the vibrating method becomes more effective
with angular limestone than the rounded river gravel in consolidating the concrete.
Figure 28 shows the effect of moisture curing and temperature control on the
flexural strength. Moist cured concrete showed distinctly higher strength than
the concrete exposed to other enviroI\mental conditions. All of the continuously
moist cured samples resulted in greater flexural strengths than required by the
Specifications of the Texas State Department of Highways (73). Most of the previous
studies have reported that curing compounds were effective in retaining the moisture
in concrete. Although the use of a curing compound generally has been found to be
more effective than no treatment at all (Q), Figure 28, however, clearly shows that
the flexural strengths are significantly lower than for the continuous moist cured
concrete. When a material temperature of 73°F was used instead of 50°F during
the mixing in the 50°F environment, a significant increase in flexural strength was
observed for the river gravel concrete. When this same temperature of the materials
was used under the 104°F condition, a similar increase was observed. As in the case
of the compressive strength, using warm materials in cold temperatures and cool
materials in hot temperatures affects the flexural strength of the rivel gravel concrete
beneficially. This is also the case for the limestone concrete, but to a lesser extent.
These two observations indicate that controlling the material temperature is an
effective way to overcome extreme temperature conditions for both river gravel and
73

-'iii Q. -.c .... QI)
~ CII
'"' +' en -~ L.
=' ~ CII -IL.
-.... III Co ---
,.Q ..., btl &: Q) I-<
oW ('f.)
';;
~ III
&:
mID~-------------------------------------------------------------,
700
eoo
5iK)
400
300
200
100
0
800
700
600
500
400
300
200
100
0
'13~Fi 73 F 95 ~
5fl(F) 50(P) 75(F) 60(F} 73{P) 73(F)
G5(?o) Rei. Bum.
Air Temp.(F). Cone. Temp.(F).
73~Fl 73F 96 "
60(F) 60(F) 73(F) 60(F) 73(F) 73(F)
06(ro) Rei. Bum.
Air Temp.(F). Cone. Temp.(F).
73(P) 104{F) 73(P) 73(F)
30(") ReI. Hum.
&. RelaUve Hurrudity(%)
_ I.S" Slump
E:Z3 2" Slump
73(P) l04(F) 73(F) 7a(F)
30('") ReI. Hum.
&. RelaUve Humidity(%)
I W(F) 10+(F)
100(F) l04{F)
Figure 28. The effect of moist curing and controlling concrete temperature on the flexural strength. For 30%, 65%, and 95% RH, wind 6, 9, and 0 mph, respectively; a) River gravel b) Limestone
74
crushed limestone concrete. The beneficial effects are true regardless of the slump.
Figure 29 shows the correlations between flexural strength and modified
compressive strength for different environments and types of aggregate. It can
be recognized that the curing condition affects the correlations between the two
strengths for the river gravel concrete and, to a lesser extent, for the limestone
concrete. It can be seen that the dryer 104°F environment affects the flexural
strength more significantly than the modified compressive strength. It is well
known that when specimens are exposed to a dry environment, such specimens
always have a nonhomogeneous moisture distribution, which produces nonunifom
residual stress distributions across the cross section. As a result, tensile stresses are
developed around the surface and compressive stresses in the center. The tensile
stress in the surface layer decreases the flexural stength and helps to increase the
compressive strength. Another possible explanation is that the flexural strength
primarily depends on the bonding strength of the binder material, and that the
compressive strengths are affected by bonding strength as well as shear friction
between the constituents. As a result, compressive strengths are not as sensitive as
flexural strength to changes in the distribution of residual stresses. As the specimens
are exposed to drier conditions, this phenomenon becomes more distinct.
Figure 30 shows how the type of aggregate and the fly ash affect the correlations
between the two different strengths. Limestone has higher flexural strength than
river gravel for the same compressive strength. This is evidence of the advantage
that the rough surface texture of limestone has over the rounded river gravel for
flexural strength. The angular shape of limestone also may be increasing the
bonding area. The flexural strength primarily depends on the bonding strength
of the binder material, so the increase of the strength is more greatly affected by
the bond strength than is compressive strength.
For both river gravel and limestone, the use of fly ash decreases flexural strength
more significantly than compressive strength. The changes of correlations between
the two strengths are due to the reduction of the bonding strength. For the same
reason stated in the above paragraph, a decrease of bond strength decreases the
flexural strength more significantly. The influence of the fly ash on the flexural
strength, however, is less for the river gravel concrete, since the river gravel particles
are well rounded, as are the fly ash particles.
75
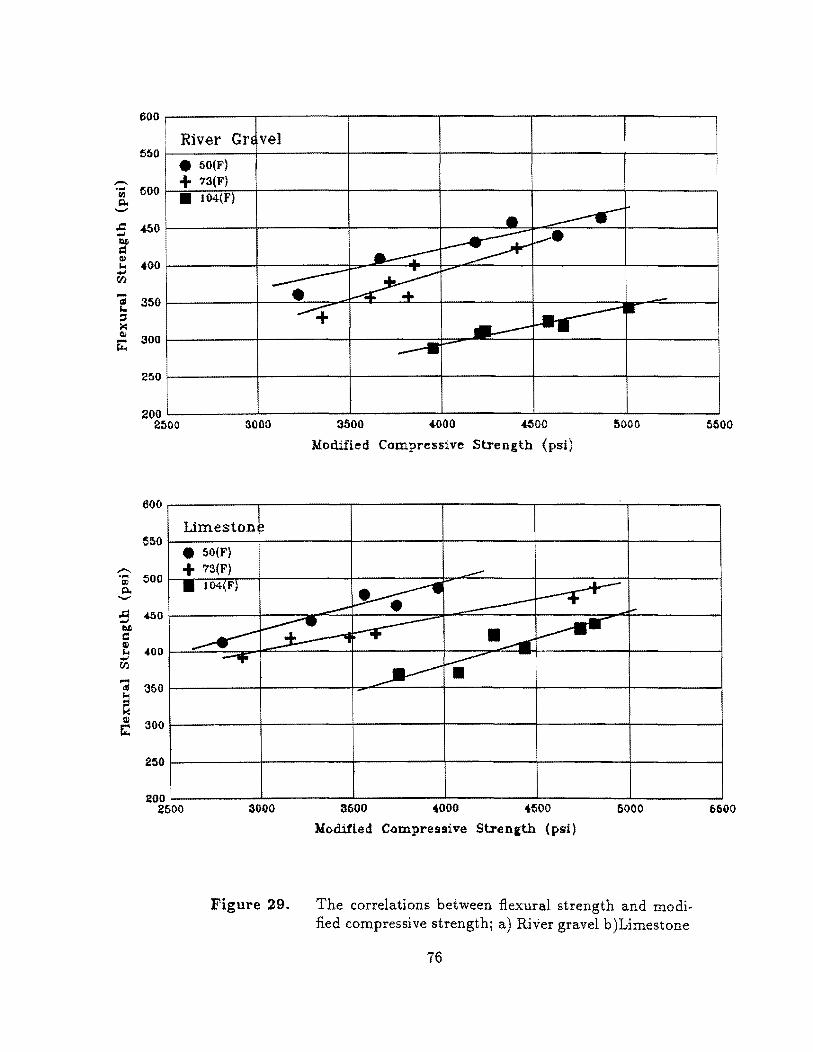
-iii "" --,Q .... ~ = Q) 100 ......
Cf.l -as 1.0
=' ~ <II -r...
---.... II)
"" ---,Q .... I:'lli C <II M ....
CI:I
";;l
e <II t::
600
River Grt vel 5()0
• 60(F)
()OO + 73(F) • l04(F)
450 • ~ ~ v·
~ 4-00
350 --.---~ ~ -300
250
200 2500
600
550
500
3000
Limestonp
• 50(F)
+ 73(F) • lO4(F)
----+ ~ ~ III- --
...--II r-
3500 4-000 ~oo 5000
Modified Compressive Strength (psi)
------~ ~
~ I--4A)0
400 -----~4 -..----- -.--If ~ 350
300
250
200 2600
--If""
3000
Figure 29.
------v.--
3600 +000 4~OO 5000
Moditied C~mpre9Sive Strena:th (psi)
The correlations between flexural strength and modified compressive strength; a) River gravel b )Limestone
76
5500
6600
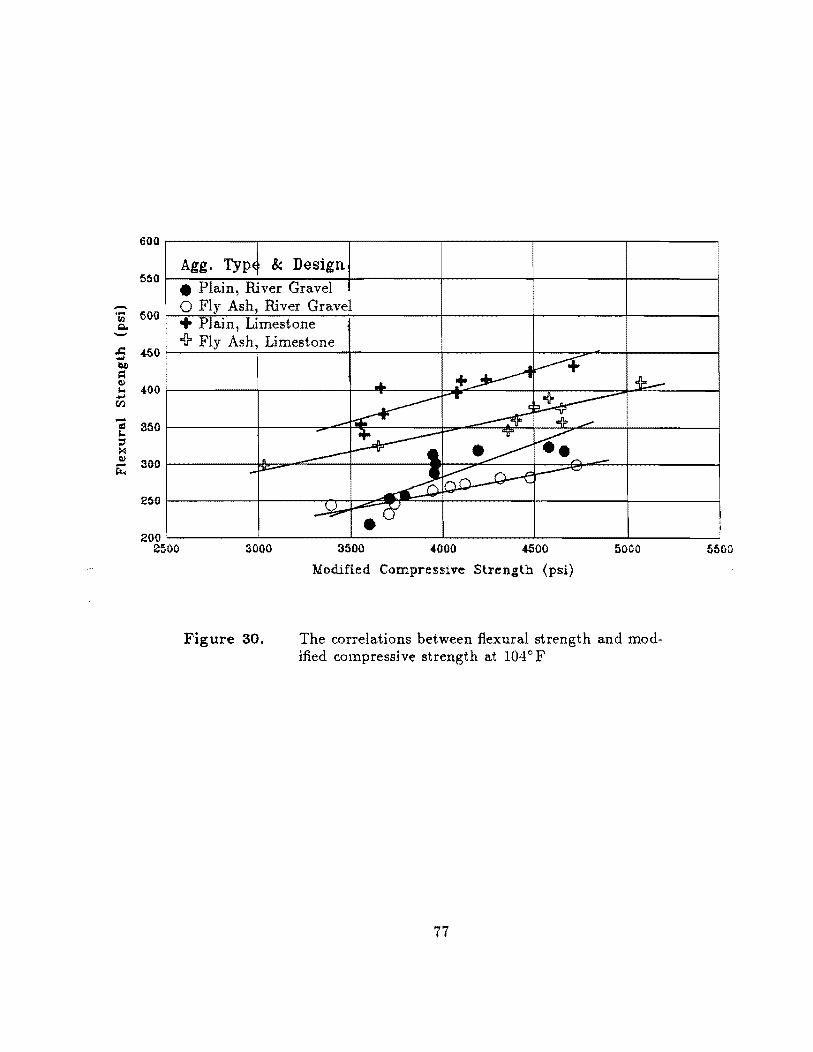
'iii Q, -.c ... t:IO ~ CI>
'"' .. r.n
-~ L.
=' M CI>
~
600
Agg. Typ & Design 550
• Plain, River Gravel
000 o Fly Ash, River Gravel + Plain, Limestone
460 c{}o Fly Ash, Limestone
400
350
300
250
200~--------~--------~----------~--------~--------~--------~ 2500 3000
Figure 30.
3500 4000 4-GOO 5000
Modified Compressive Strength (psi)
The correlations between flexural strength and modified compressive strength at 1040 F
77
5500
Moist Cured Condition The effects of mixing time and consolidation meth-
ods on flexural strength are plotted on Figure 31 for 1.5 inch slump concrete. All
the flexural strengths were consistently greater than the construction requirement
of 575 psi. An insignificant decrease of flexural strength can be observed with the
increase of mixing time. However, the effect of consolidation is not as significant as
mixing time.
Figure 32 shows the correlations between flexural strength and modified
compressive strength for different consolidation methods. Both the rod ding and
vibrating methods showed good correlations, but the spading method showed odd
correlations. More data points are needed to establish a better correlation for this
method. Both the rodding and vibrating methods give almost the same correlations,
whereas spading shows a different relationship.
4.3.3 Conclusion
The following conclusions are based on the results of the laboratory tests for the
concrete strength. The conclusions are divided into two sections that refer to the
results of the compressive and pullout strength data and the flexural and modified
compressive strengths.
Compressive and Pullout Strength:
L The strength at 3 days increases as the evaporation rate ofthe curing conditions
investigated in this test increases; however, the amount of strength developed
at 90 days decreases as the evaporation rate increases.
2. Extending the mixing time up to 60 minutes reduces the strength, regardless
of the type of aggregate, the type of admixture and the age.
3. In the severe environment, the concrete mixtures containing fly ash developed
about the same strength properties as the control mixture without fly ash.
4. The effect of fly ash addition on the compressive strength depends on the type
of aggregate and aggregate gradation used in the mix.
5. With a few exceptions, as the amount of mixing water was increased, a strength
reduction was observed, regardless of the type of aggregate and exposure
conditions.
78
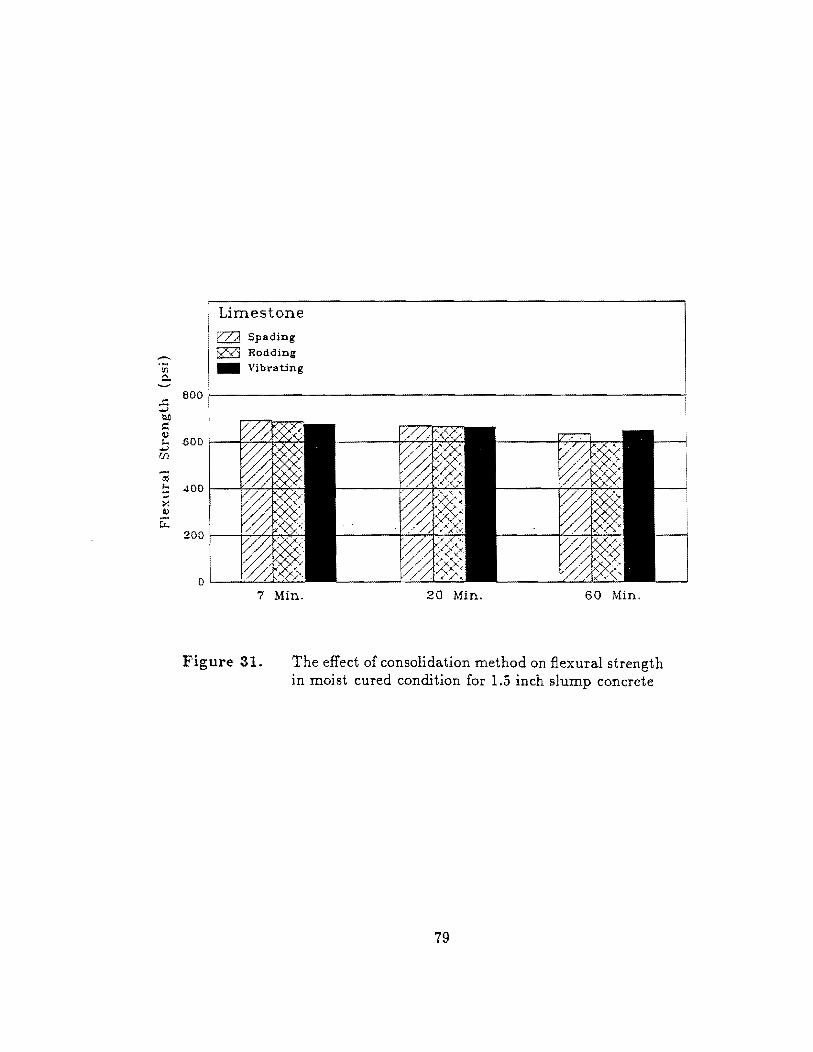
,.... =:; ~ ~ (1.J
Limestone
m Spading E2Sa Rodding _ Vibrating
BOO~--------------------------------------------------------~
b 600 f----f'--T7"74;1"TT-' Ul
-(';l ; 400r---f~~~~ x (1.J
[:
7 Min. 20 Min. 60 Min.
Figure 31. The effect of consolidation method on flexural strength in moist cured condition for 1.5 inch slump concrete
79
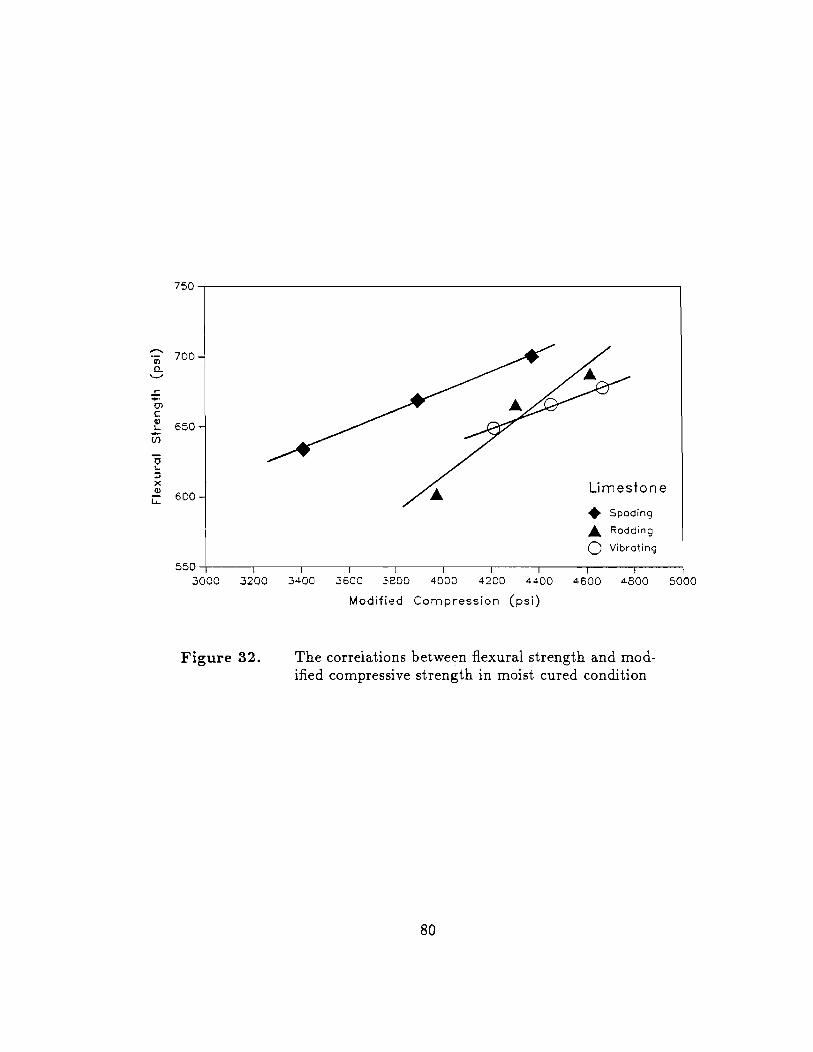
....... en 0... '-'
.!:.
.po
U> C v ~ ....
f./)
0 '-:::J x Gl
i::
750,-------------------------------------------------------------~
700
650
600 limestone
• Spading
.A Rodding
0 Vibrating
550~-----.----_.----_,----_,----_.------._----._----~----,_----~
3000 3200 3400 3600 3800 4000 4200 4400 4600 4800
Figure 32.
Modified Compression (psi)
The correlations between flexural strength and modified compressive strength in moist cured condition
80
5000
6. The effect of controlling the amount of mixing water was found to be more
critical at the cold temperatures than at the hot temperatures within the
temperature ranges investigated in this test.
7. The use of a curing compound produced concrete with lower strength than
moist cured concrete at early ages. This strength difference increased with
age.
8. Controlling the material temperature in a cold environment was found to be
more effective than in a hot environment in increasing the compressive strength.
9. The effect of consolidation method on the compressive strength was not found
to be significant. Although not statistically proven, the vibrating method
produced the highest strength, and the rod ding and spading methods produced
the lowest strength.
10. The correlations between compressive strength and pullout strength are not
affected by the slump changes, but are primarily affected by the type of
aggregate and by the influence of the aggregate on the failure mechanism.
Flexural and Modified Compressive Strength:
1. All of the specimens treated with curing compound showed approximately 35%
lower flexural strength than the specified 575 psi. For this reason, the value of
575 psi should not be used in the design procedure for CRC pavements unless
the pavement is continously moist cured.
2. Continuously moist cured beams showed flexural strengths about 15% higher
than the State's 575 psi minimum.
3. The 7 day flexural strength is affected by the evaporation rate. As the
evaporation rate increases, the flexural strength decreases. The amount of
reduction depends on other factors, such as type of aggregate.
4. The extended mixing time up to 20 minutes did not reduce the flexural
strength; however, the 60-minute extended mixing reduced the flexural strength
significantly for the river gravel concrete.
5. The limestone concrete has significantly higher flexural strength than river
gravel concrete.
6. For the particular source of fly ash, a replacement of 1:1 by weight of cement
with 20% fly ash causes a slight reduction in flexural strength.
81
7. The vibrating method gives the highest flexural strength in most cases. No
significant difference in flexural strength was found between the rodding and
spading compaction methods.
8. Controlling the material temperature in a cold environment produces greater
strengths than in a hot environment.
9. The correlations between flexural strength and modified compressive strength
are affected by the environmental conditions and type of aggregate. At high
temperatures, slightly lower flexural strength can be observed for the same
modified compressive strength.
10. Limestone concrete has higher flexural strength than river gravel concrete for
the same modified compressive strength, but has almost the same range of
modified compressive strength as river gravel concrete.
82
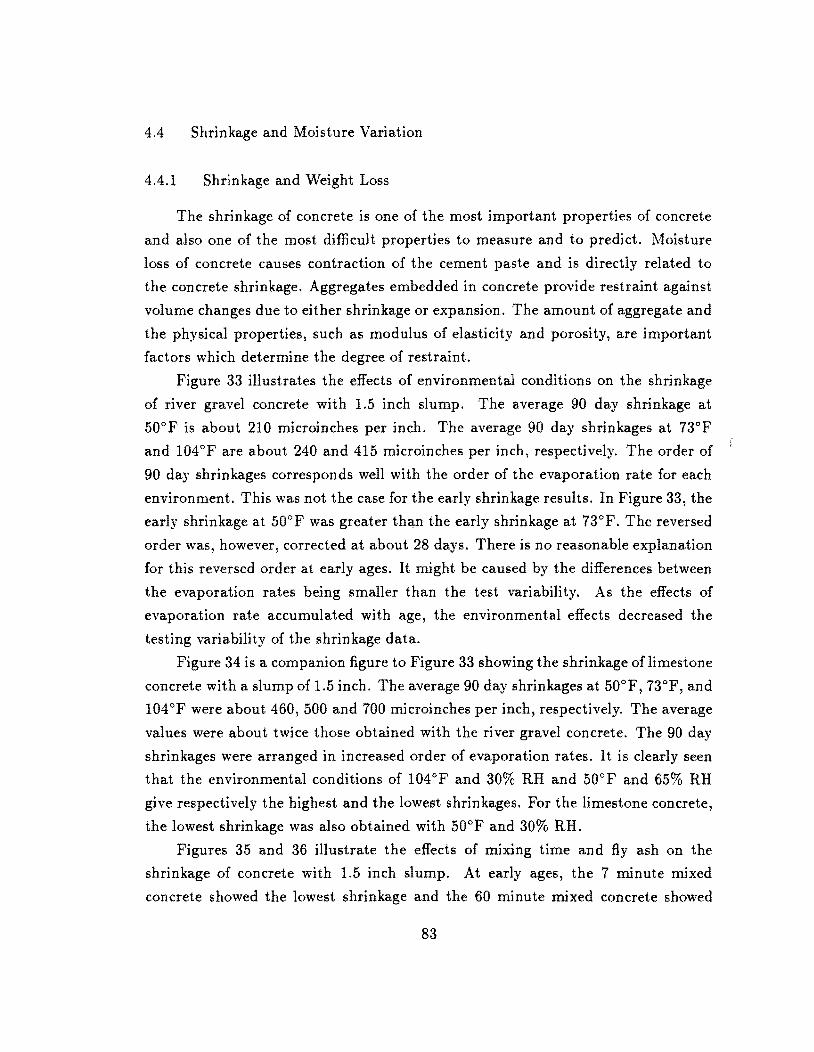
4.4 Shrinkage and Moisture Variation
4.4.1 Shrinkage and Weight Loss
The shrinkage of concrete is one of the most important properties of concrete
and also one of the most difficult properties to measure and to predict. Moisture
loss of concrete causes contraction of the cement paste and is directly related to
the concrete shrinkage. Aggregates embedded in concrete provide restraint against
volume changes due to either shrinkage or expansion. The amount of aggregate and
the physical properties, such as modulus of elasticity and porosity, are important
factors which determine the degree of restraint.
Figure 33 illustrates the effects of environmental conditions on the shrinkage
of river gravel concrete with 1.5 inch slump. The average 90 day shrinkage at
50c F is about 210 microinches per inch. The average 90 day shrinkages at 73c F
and 104c F are about 240 and 415 microinches per inch, respectively. The order of
90 day shrinkages corresponds well with the order of the evaporation rate for each
environment. This was not the case for the early shrinkage results. In Figure 33, the
early shrinkage at 50c F was greater than the early shrinkage at 73c F. The reversed
order was, however, corrected at about 28 days. There is no reasonable explanation
for this reversed order at early ages. It might be caused by the differences between
the evaporation rates being smaller than the test variability. As the effects of
evaporation rate accumulated with age, the environmental effects decreased the
testing variability of the shrinkage data.
Figure 34 is a companion figure to Figure 33 showing the shrinkage of limestone
concrete with a slump of 1.5 inch. The average 90 day shrinkages at 50c F, 73 c F, and
104°F were about 460, 500 and 700 microinches per inch, respectively. The average
values were about twice those obtained with the river gravel concrete. The 90 day
shrinkages were arranged in increased order of evaporation rates. It is clearly seen
that the environmental conditions of 104C F and 30% RH and 50°F and 65% RH
give respectively the highest and the lowest shrinkages. For the limestone concrete,
the lowest shrinkage was also obtained with 50c F and 30% RH.
Figures 35 and 36 illustrate the effects of mixing time and fly ash on the
shrinkage of concrete with 1.5 inch slump. At early ages, the 7 minute mixed
concrete showed the lowest shrinkage and the 60 minute mixed concrete showed
83
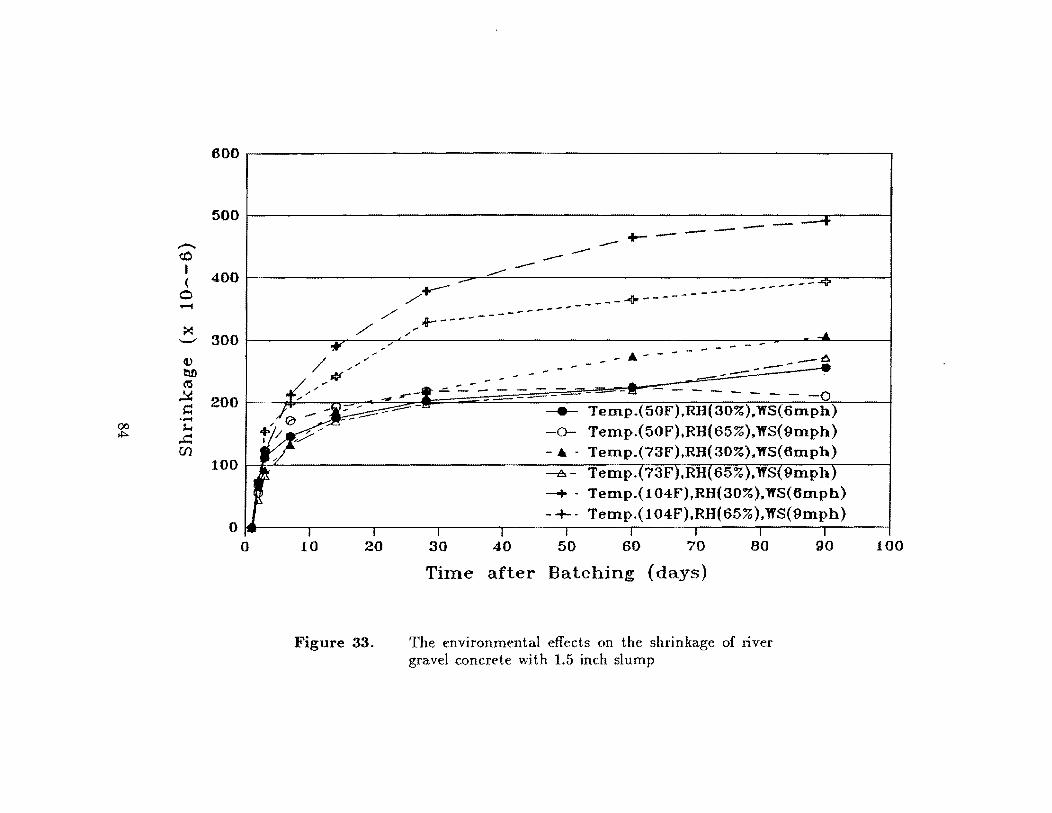
-<:0 I (
0 .......
~ '-"
V t'JD c:s
..!:I:: ~ .~
00 ~ t+:- ~
lfJ
600~1----------------------------------------------------------------~
500
400
300
200
100
-+--------.---/~
/ ~ ,+--------------------~------------------/
'" / ............
,:.' ~
-",-=:;::::::::::-
-
-. - - - - - - - - -~------o
=-=--!! - --0 __ Temp.(50F),RH(30%).WS(6mph)
-0- Temp.(50F).RH(65%).1fS(9mph) -. - Temp.(73F),RH(30%).WS(6mph)
-i!l. - Temp.(73F).RH( 65%).1fS( 9mph -+ . Temp.(104F),RH(30%);WS(6mpb)
Temp.(104F).RH(65%).1fS(9mpb) o It. I I i I
o 10 20
Figure 33.
30 40 50 60 70 80
Time after Batching (days)
The environmental effects on the shrinkage of river gravel concrete with 1.5 inch slump
90 100
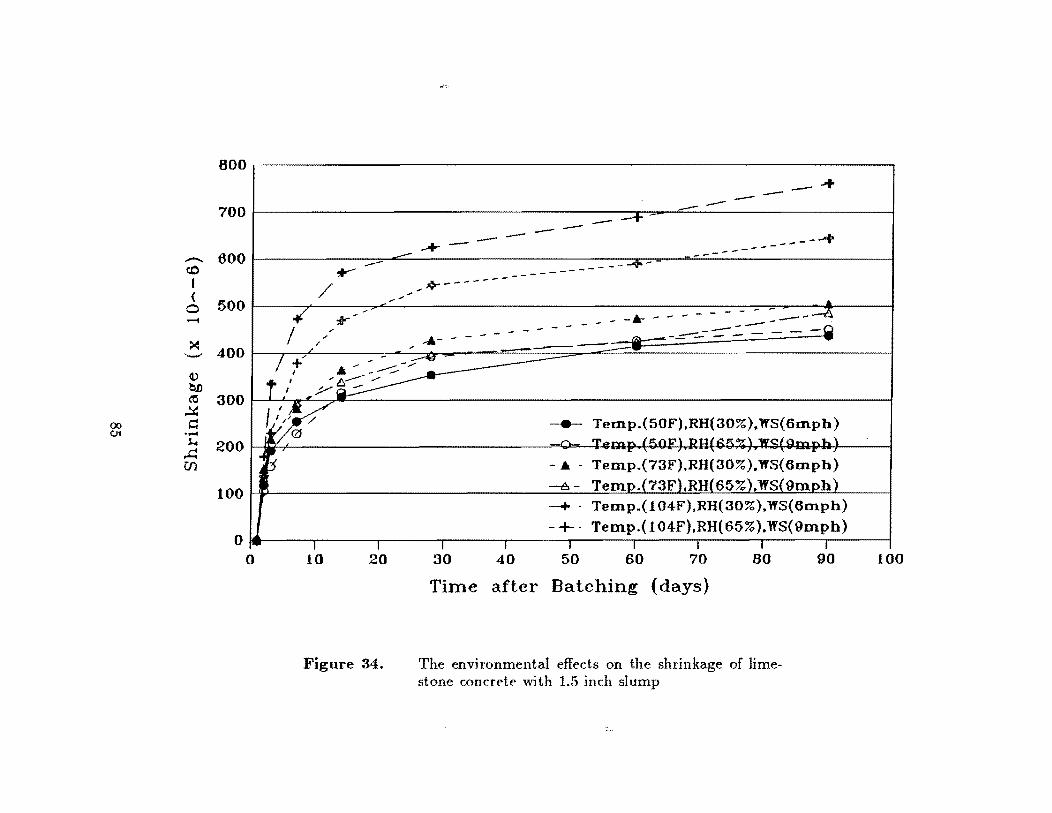
-<0 I (
0 --t
>: "-'
V ~ ~
~ 00 c: Ot .-
~
..c: (J)
800
700
600
500
400
300
200
100
0 0
/ +"
/
" /
10
"
-....-
;t-/
20
Figure 34.
";,t
------+ --+------ ---------------+
,~-------
~- - - - - - - - - ----- - - -~ - - - - - ----------- - --
___ TeIllp.(50F).RH(30%).WS(6I1lph)
-. ----8 -
-+ --+-
30 40 50 60 70 80
Time after Batching (days)
The environmental effects on the shrinkage of limestone concrete with 1.5 inch slump
90 100
-<.0 I <
0 ....-4
~ '-"
{) !:U) (!!3
~
00 r::
C/) .~
~ ~ 00
600 rl ---------------------------------------------------------------------------.
500
400
300
200
100
~ -" .... -". ,/'
,c.- "/ " "/
,/ /1-4 I " _
/"
,.e--",.
- --:-- ------
___ 7min. 1tfixing. Plain Co DC.
-A- 20min. Mixing. Pla.in Cone. - + . 60min. Mixing, Plain CODC.
-e - 7min. Mixing. Fly Ash Cone. -6 . 20min. Mixing, Fly Ash Conc.
-+. 60min. Mixing. Fly Ash Cone. o ~I~~--~,_----._----_,------._----_.--- I I I I I I
o 10 20 30 40 50 60 70 80 90
Time after Batching (days)
Figure 35. The effects of mixing time and fly ash on the shrink-age of river gravel concrete with inch slump
I 100
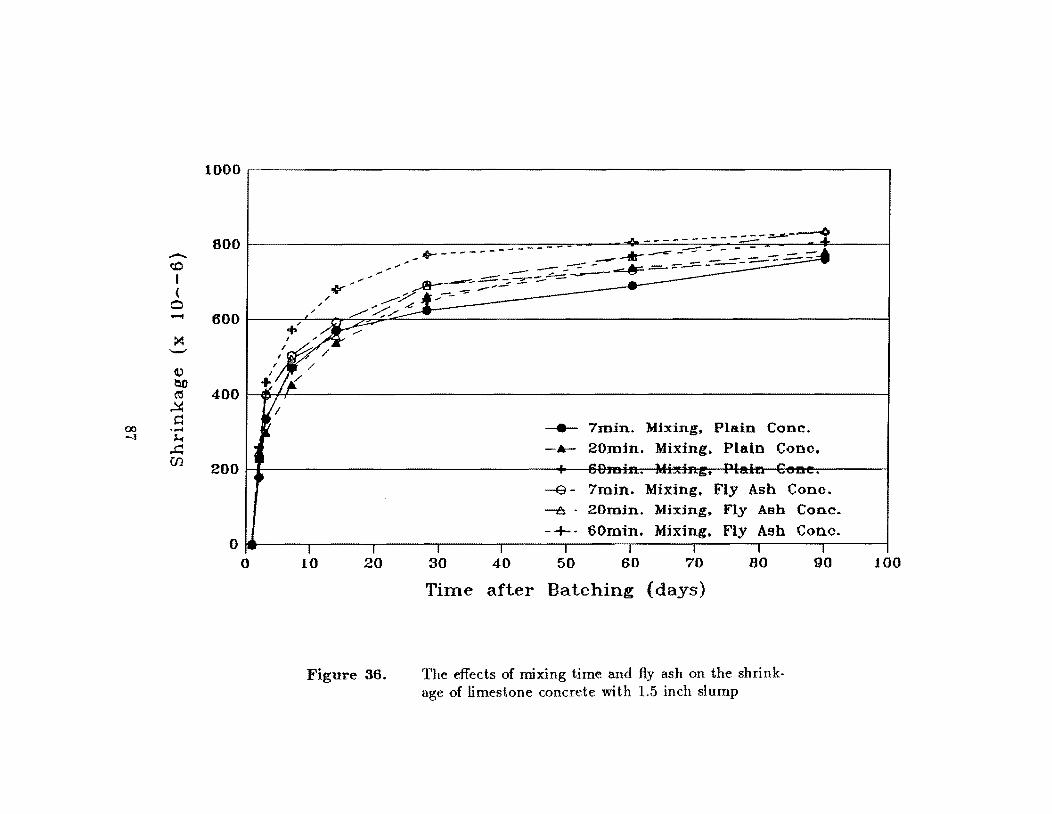
-<:.0 I (
0 -X
'-"
V tw ('l(S
~ ~
00 .~
-.l
""' ..c:: en
1000rl--------------------------------------------------------~
800 I ,...~
600
400
II 200
I-
01· I I 0 10 20
Figure 36.
____ =----....0. - - .....&. - - - - - - - - -- ~
-+-----------
__ 7min. Mixing, Plain Conc.
-A- 20min. Mixing. Plain Cone •
-e - 7min. Mixing, Fly Ash Cone. -6 . 20min. Mixing, Fly Ash Conc.
- +. 60min. Mixing. Fly Ash Cono. I I I I I I I
30 40 50 60 70 80 90
Time after Batching (days)
The effects of mixing time and fly ash on the shrinka.ge of limestone concrete with 1.5 inch slump
100
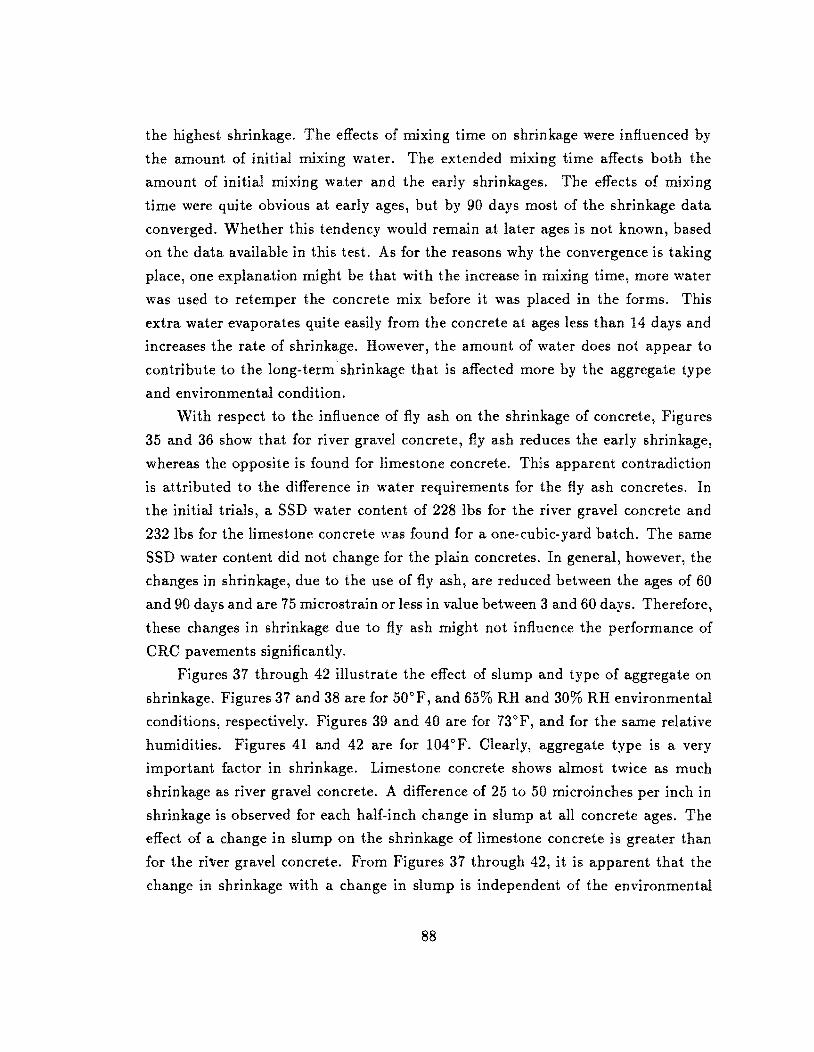
the highest shrinkage. The effects of mixing time on shrinkage were influenced by
the amount of initial mixing water. The extended mixing time affects both the
amount of initial mixing water and the early shrinkages. The effects of mixing
time were quite obvious at early ages, but by 90 days most of the shrinkage data
converged. Whether this tendency would remain at later ages is not known, based
on the data available in this test. As for the reasons why the convergence is taking
place, one explanation might be that with the increase in mixing time, more water
was used to retemper the concrete mix before it was placed in the forms. This
extra water evaporates quite easily from the concrete at ages less than 14 days and
increases the rate of shrinkage. However, the amount of water does not appear to
contribute to the long-term'shrinkage that is affected more by the aggregate type
and environmental condition.
With respect to the influence of fly ash on the shrinkage of concrete, Figures
35 and 36 show that for river gravel concrete, fly ash reduces the early shrinkage,
whereas the opposite is found for limestone concrete. This apparent contradiction
is attributed to the difference in water requirements for the fly ash concretes. In
the initial trials, a SSD water content of 228 lbs for the river gravel concrete and
232 lbs for the limestone concrete ,"as found for a one-cubic-yard batch. The same
SSD water cont,ent did not change for the plain concretes. In general, however, the
changes in shrinkage, due to the use of fly ash, are reduced between the ages of 60
and 90 days and are 75 microstrain or less in value between 3 and 60 days. Therefore,
these changes in shrinkage due to fly ash might not influence the performance of
eRe pavements significantly.
Figures 37 through 42 illustrate the effect of slump and type of aggregate on
shrinkage. Figures 37 and 38 are for 50°F, and 65% RH and 30% RH environmental
conditions, respectively. Figures 39 and 40 are for 73°F, and for the same relative
humidities. Figures 41 and 42 are for 104°F. Clearly, aggregate type is a very
important factor in shrinkage. Limestone concrete shows almost twice as much
shrinkage as river gravel concrete. A difference of 25 to 50 microinches per inch in
shrinkage is observed for each half-inch change in slump at all concrete ages. The
effect of a change in slump on the shrinkage of limestone concrete is greater than
for the ri\Ter gravel concrete. From Figures 37 through 42, it is apparent that the
change in shrinkage with a change in slump is independent of the environmental
88
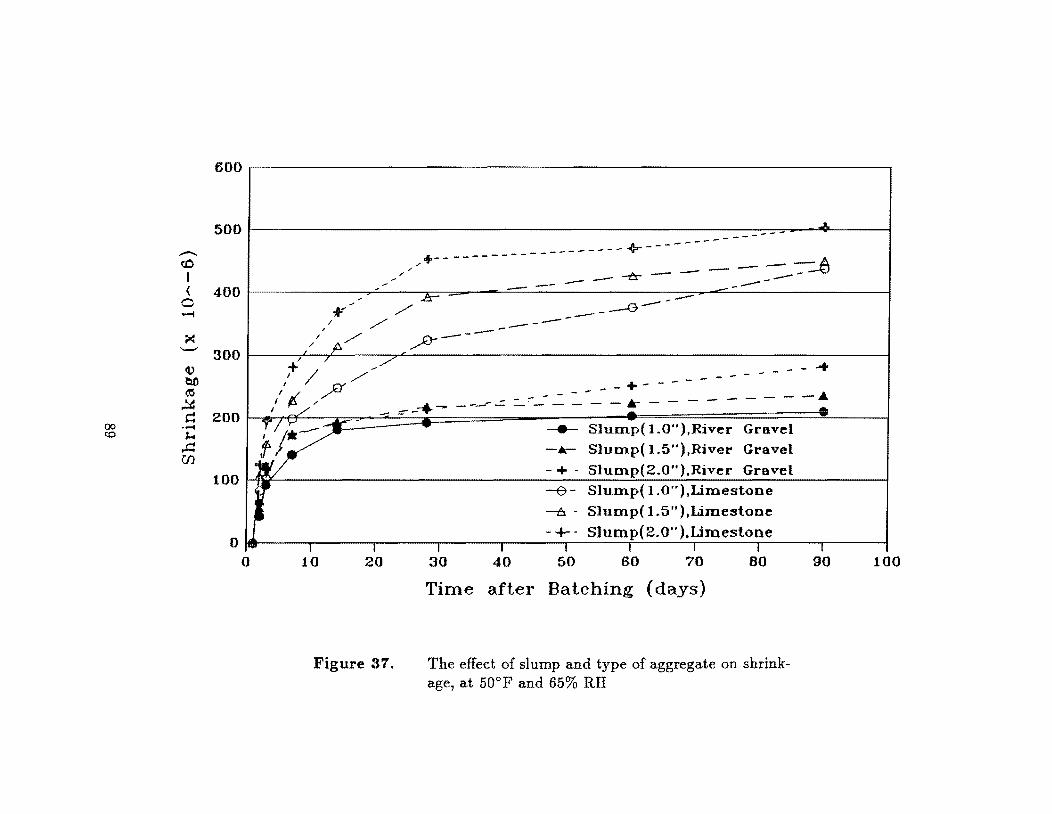
-. ~ I (
0 .......
>:': '-'
4> tlD (IS
.!t:: r::
00 .~
~ ~
..c:: en
600
500
400
300
200
100
.A
----------~---------------+---------- ~ " --" --",.. ,. .--- ___ ---0- --- ---- _ ~ -
"'..... .-- -- --...-----~ A- __
~ - --0-+"' --
I /" _---
, --I /" _-
If:> ft 1/,..-
+/ ... ' ----+ I /' _---I /' _+-----
I CY _ -,'"''''''- --,..--- ------- .... P," __ -~-------*- • I./' _ ::::""'_-"" ~
If -.A- SluDlp( L5"),River Gravel ;.v·/j .---......:: - ___ SluDlp(1.0"),River Gravel
. t -+ - SluDlp(2.0"),River Gravel , -e- SluDlp( 1.0"),Limestooe
-0 - SlUDlp( 1.5"),Limestooe
- + - SJump(2.0"),Umestone o ... I I I I , I I I I
o 10 20
Figure 37.
30 40 50 60 70 80
Time after Hatching (days)
The effect of slump and type of aggregate on shrinkage, at 50°F and 65% RH
90 100
-<.0 I (
0 ..-4
~ '--"
v ~ C':5
.!t: to ~ 0
..... ~
...c:: Ul
600
500
400
300
200
100
-----+ .-------------
_--------- _A ___ - - __ _..:-=-~-1::1 .. ---- ~ ---- ----------' - -- ~-----:f----- --~-;:.--
.... ,/ ~..---" ~
~" ~ , tII~
, .,,4 ______ - - - - ..... "1""/ ____ - - - +- -
f y- + ___ --- _ .... f ,- - -
/, ---- ... ------ ..... If',+ .t._ _ - -
" ,,' ..... - - - _ ___ Slump( LO"),River Gravd ~Jy/.
<1 I''''' -- -k- Slllmp( 1.5").River Gravel 4 t:, - + . Slump(2.0"),River Gravel
( -€I - Slllmp( LO").Limestone
~ -6 . Slump( L5"),Limestone
.I - +. S1ump(2.0").Umestone o o
.. I I I I I I I I I
10 20
Figure 38.
30 40 50 60 70 80
Time after Batching (days)
The effect of slump and type of aggregate on shrinkage, at 50°F and 30% RH
90 100
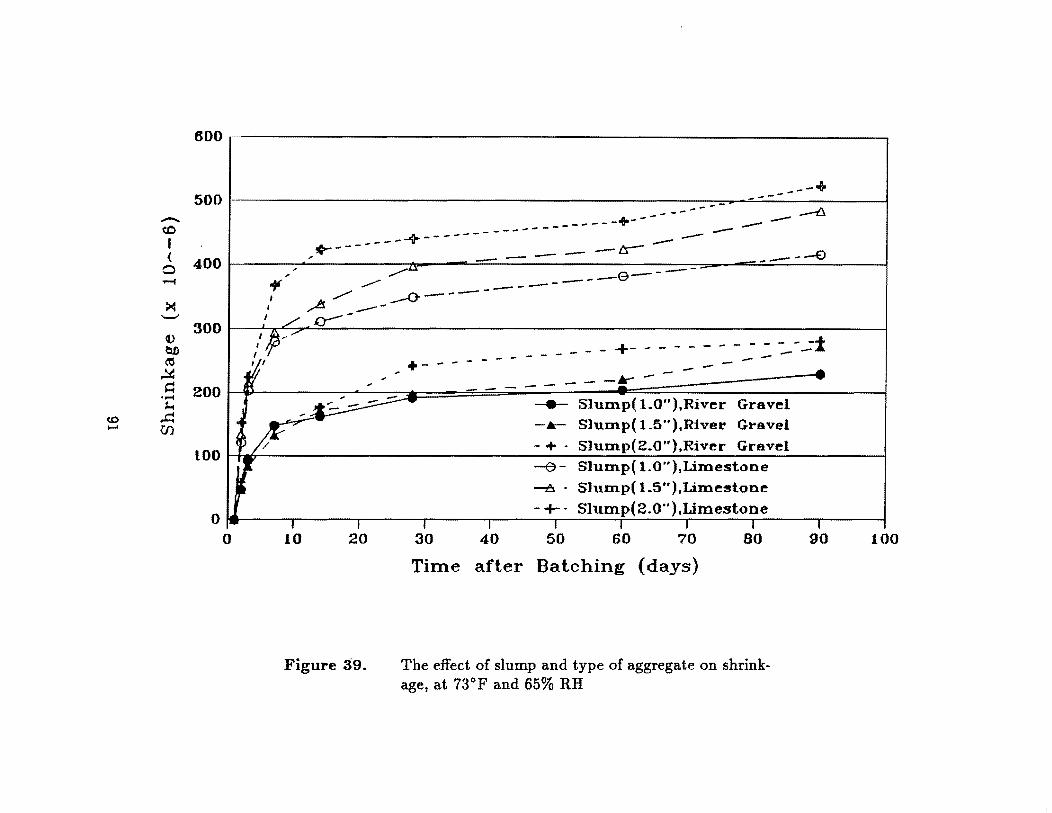
-<:.0 I (
0 ....-t
>1 '--'
v e.o (\5
~ ~
'.-4
~ (0 ..c: ....... C/)
600 r ---------------------------------------------------------------------,
500
400
300
200
tOO
-------+
.--------~--------------------+---------- ~ - ---------~- ------€)
¥" ~Lr I /' ~ : ~ _--<>------------e----L.o---
/ I»~ "" if'
+ _____________ ~- - - - - - - - - - - -i - ----- - - - -~ - - - . ~ f
__ Slump( 1.0").River Gravel
-&- Slump( L5"),River Gravel
- + - Slump(2.0").River Gravel -e - Slump( LO"),Ul'Ilestone
-0. . Slump( L5").Lil'Ilestone
o ,_ -+. Slump(2.0").Umestone I I I I
o 10 20
Figure 39.
30 40 50 60 70
Time after Batching (days)
60
The effect of slump and type of aggregate on shrinkage, at 73°F and 65% RH
90 100
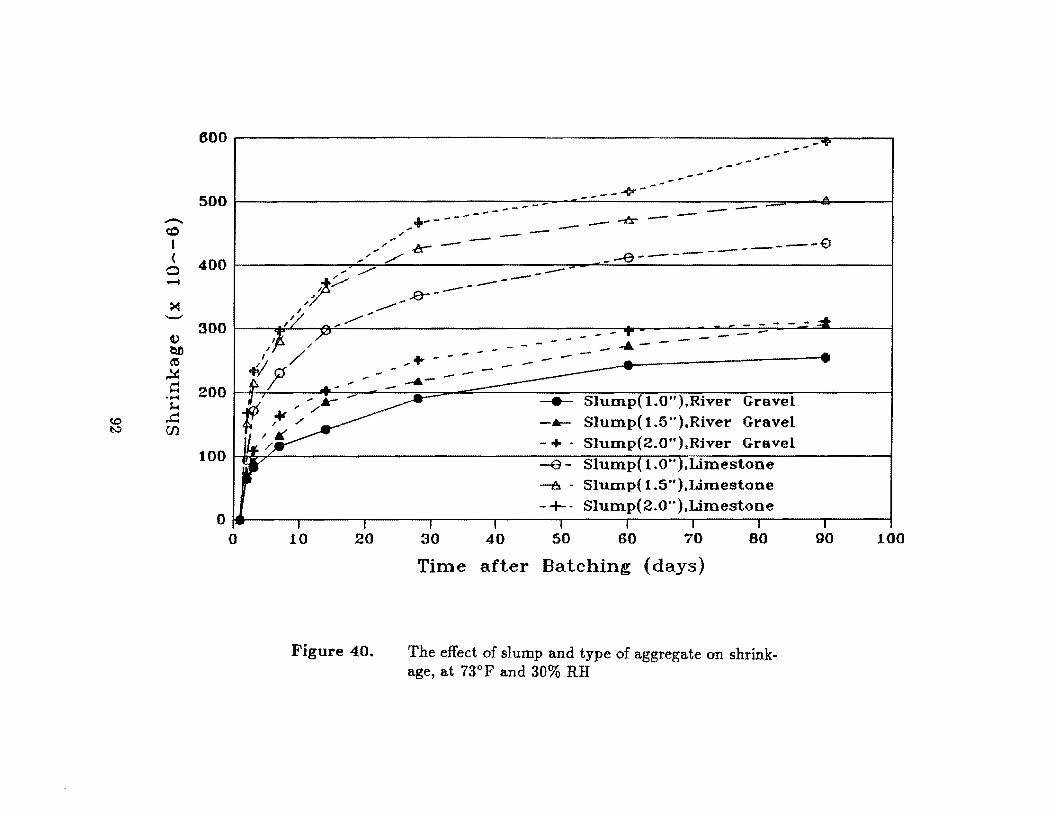
600
500 -~ I ( 400 0 ..... ~ '-"
300 v ~ ~
~ ~ 200 ..... ~
c:o ..c: ~ I./}
100
o o
---",,--",,---------*--------- -- -- --+----- --- ~ --- ---'" --"" ---€I '" .a- ---
" /' -~------------ / J/ " ......--
/ "" /' ",,/
10 20
Figure 40.
--------_..e----- - - - ------4.------".,.,...
""+ - - - - -- -- -SluDlp( 1.0").River Gravel
-6- Slump( 1.5"),River Gravel - + - SluDlp(2.0"),River Gravel
-e- Slump 1.0" ,limestone -0 - SluDlp( 1.5").Limestone - +. Slump(2.0"),limestone
30 40 50 60 70
Time after Batching (days)
80
The effect of slump and type of aggregate on shrinkage, at 730 F and 30% RH
90 100
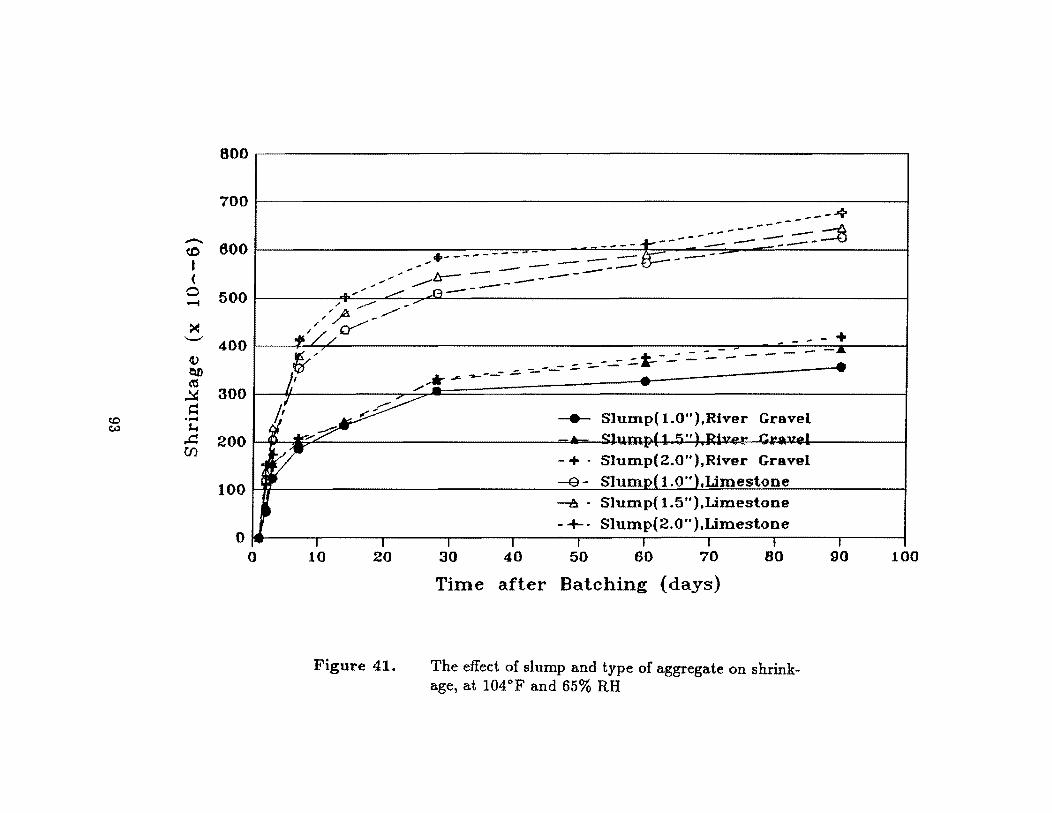
600
700
-<0 600 I (
0 500 .......
~ '-" 400 V tW ('0
~ 300 ~
~ '.-1 c,..:I ~
..c: 200 r:n
100
0 o
_-4' --------:,:..-:.:.. :::e
---- ..... --- - - ---+------ - ------- e:::-- --- .---. -- -.-.--. "'" ,. t:r-- -- ---- - ----
/-~ --:8------.... -" --- _/
"".fo ----f-'; /if- - - - - + ~" t----- ----- --..a
l k .... ---- -...::. -::-- - - ~-....::'" - - - - -
/," -I.' ~.-,I ~ 'l .?~ .~
I I
10 20
Figure 41.
-e- Slump(1.0").River Gravel JIo.. c::!h ............... /1 ".,,\ ...,.~. (! ......... ,I -,.-
- + - Slump(2.0"),River Gravel
---B - S]ump( 1.0").Limestone ---0 - Slump( 1.5").Limestone
-+. S]ump(2.0").Limestone I I I I I I
30 40 50 60 70 80
Time after Batching (days)
The effect of slump and type of aggregate on shrinkage, at l04°F and 65% RH
I
90 100
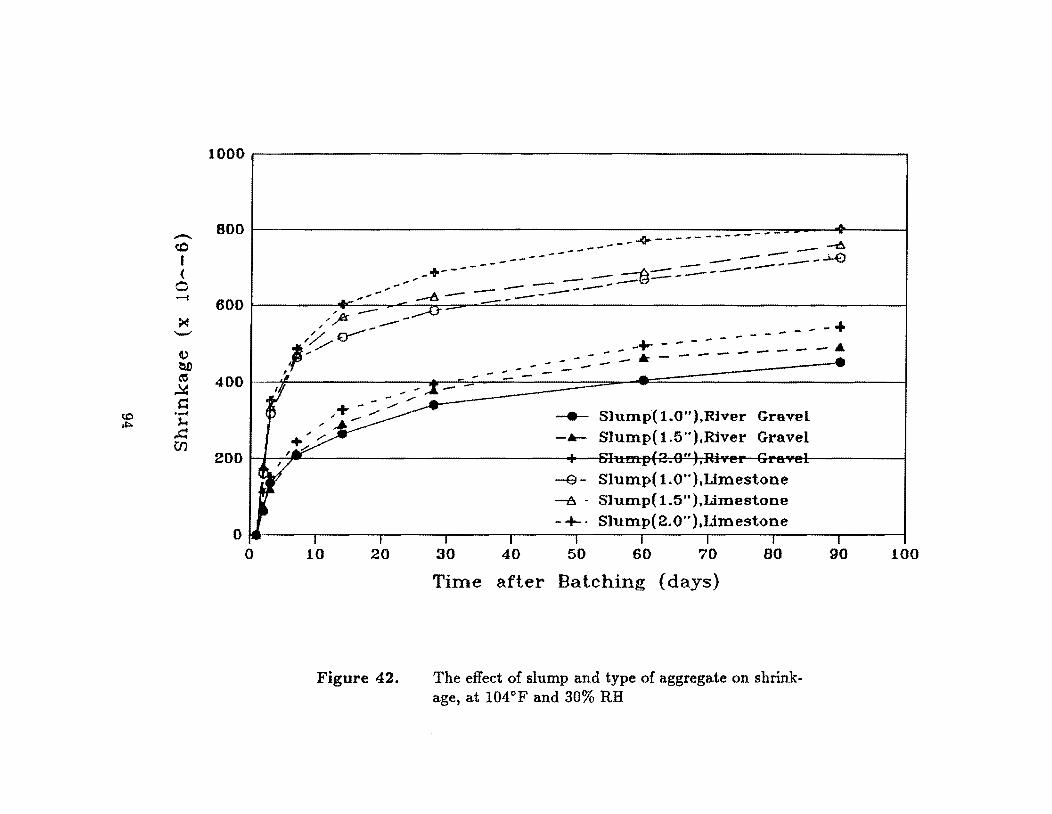
-u:> I (
0 ..... ~ ---V t:l.O <e ~ ~
ItO ...... ~
,.. ..c: en
1000ri ----------------------------------------------------------------~
800
+---,,--'
600 -"
" --6-
,~ ---
400 I /; 0------
11"/
200
-----------------~-------------
-------<>-----_ ..... _--------8-----------4) - - - +
- -+-- - - - -- __ - _._ --.6.
-- ------ -__ Slump( 1.0").River Gravel
-6- Slump( 1.5").River Gravel
-e- Slump( 1.0"),Umestone Slump( 1.5" ).Limestone
Slump(2.0"),Umestone °l~·~--~----~----~----~----~----~--~~--~----~----~
o 10 20
Figure 42.
30 40 50 60 70 80
Time after Batching (days)
The effect of slump and type of aggregate on shrinkage, at 104°F and 30% RH
90 100

conditions. This behavior is to be expected since the change in slump is primarily
influenced by the aggregate type and initial amount of water in the cement paste.
Figures 43 and 44 illustrate the effect of initial material temperature on
shrinkage of concrete with 1.5 inch slump. As the figures show, using warm
material in cold temperatures or cool material in hot temperatures did not affect the
shrinkage significantly. This can be attributed to the small changes in the amount
of initial mixing water.
Figures 45 and 46 illustrate the effect of consolidation method on shrinkage
of concrete with 1.5 inch slump. This effect is not large enough to be distinctly
observed in the shrinkage test results for either the limestone concrete or the river
gravel concrete.
Figure 47 shows the effects of environmental conditions on the correlations be
tween shrinkage and weight loss for 1.5 inch slump concrete. Different environmental
conditions investigated in this study are designated with different symbols shown
in the figure. Almost linear correlations between shrinkage and weight changes can
be observed for both river gravel and limestone concretes. The line of correlation
for limestone concrete shows a steep slope, whereas that for river gravel concrete
shows a shallow slope. For the same amount of weight loss, which is primarily
caused by moisture loss, limestone concrete shrinks more than river gravel concrete.
The greater shrinkage of limestone concrete for the same amount of moisture loss is
caused by the lower stiffness of aggregate used in the concrete; that is, the limestone
has a lower modulus of elasticity so that it shrinks more than river gravel when it is
subjected to the same confining force. The data for all the environmental conditions
tested in this study fall in one line, which implies that the shrinkage depends on
the amount of moisture loss occurring in the curing conditions. The different pore
structures which might be developed in the different environmental conditions at
early ages are not significant enough to affect the correlations.
Figure 48 shows the effects of mixing time and fly ash on the correlations
between shrinkage and weight loss for' concrete with 1.5 inch slump. The replace
ment of fly ash with cement affects the correlations and shifts the correlation curve
slightly. Fly ash concrete looks to be more stable to the deformations for the given
moisture changes than plain concrete. Fly ash differs from cement in two aspects:
particle size and chemical reactivity. Especially, different chemical reactivity affects
95

-<0 I (
0 -X --()
1:1.0 ~ ~ ~ .....
<0 0> 1-1
~ {f)
600~1------------------------------------------------------~
500
400
300
200
100
O. o
------+-------------~.:-- --
*--,--:::--+' - - -
" " I'
"/ .,.1'
10
_/"-_ -:7
"
20
Figure 43.
30
Time
------River Grovel
-+- A&C Temp.(50F.50F).RH(65%) __ ... .tl .... .-__ ~.~.4..~
emp.
- + - A&C Temp.(104F.73F).RH(30%) -+- A&C Temp.(104F.I04F),RH(30%)
I 40 50 60 70 80 90
after Batching (days)
The effect of controlling material temperature on the shrinkage of river gravel concrete with 1.5 inch slump
100
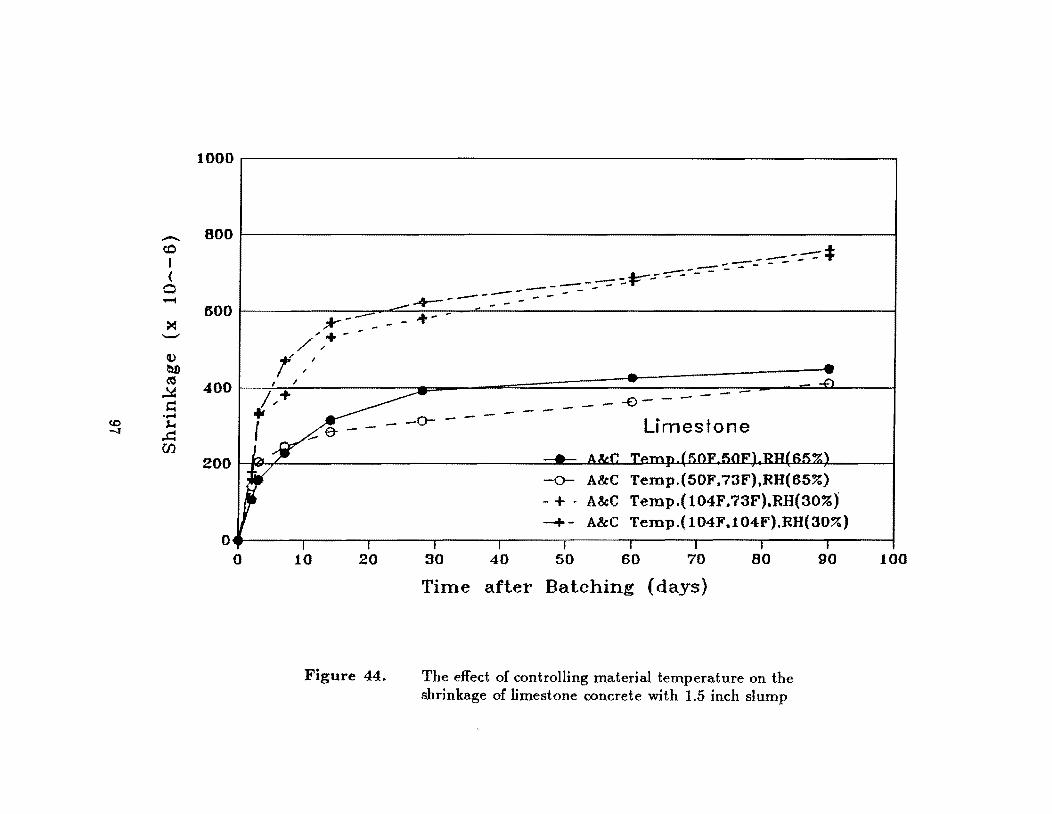
-c:o I (
0 ~
~ '-'
V ~ ~ ~ ~ .....
co ,... -.J ...c:
U)
1000rl------------------------------------------------------------------~
BOOrl ----------------------------------------------------~
600 I ~~-----------~----------* "...-- - - - - - - - - - - - - - - -
.L --------
/"'+ ____ - 7--
400 I l'" /,+~ i ~----~---------;- ~ Lim:st:n: - - I 200 I pC=-=- SOC" If:mp.,,)Ur.il,,r 1,,,nID,)/<)'
7 ? " >
O. o 10 20
Figure 44.
-0- A&C Temp.(50F.73F),RH(65%)
- + - A&C Temp.(104F.73F).RH(30%)' -+- A&C Temp.(104F.l04F),RH(30%)
30 40 50 60 70
Time after Batching (days)
80
The effect of controlling material temperature on the shrinkage of limestone concrete with 1.5 inch slump
90 100
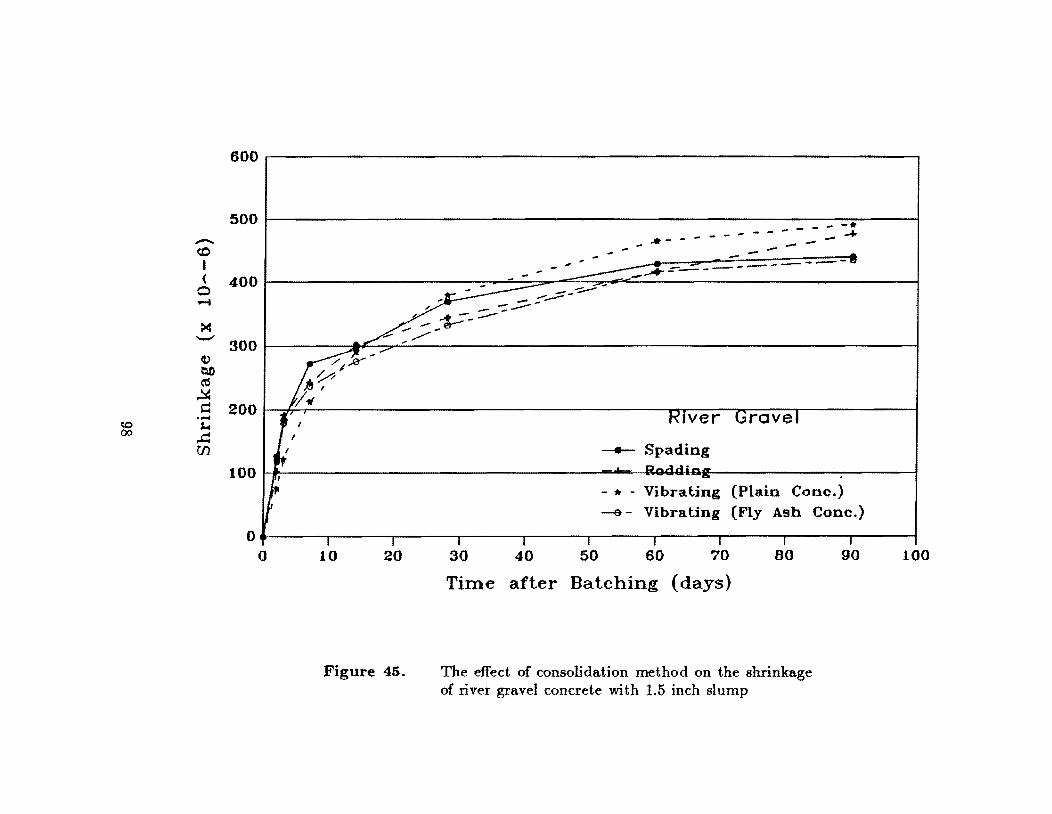
-<0 I (
0 ......
>f --v ~ «I
,!:s:: d .....
<0
""" 00 ~ rn
600
500
400
300
200
- - - - - - :: ,.J/It------ ..-- --..-"-- - ..- -----~~ --------~ - _ .... - .."". ........ ----
~-~-,. --::'...-""""'-,. -- -:;....,..--
" ... ---..... -_er-"
,,-/- --~ ....
~/ /;%
0 Jt, //-
, I l'<lver Gravel I
I -+- Spading rt D .... ..1..1: ... _
100 ,
f o I I
o 10 20
Figure 45.
... --- * - Vibrat.ing (Plain Cone.) --e - Vibrating (Fly Ash Cone.)
I I I I I I
30 40 50 60 70 80
Time after Batching (days)
The effect of consolidation method on the shrinkage of river gravel concrete with 1.5 inch slump
I
90 100
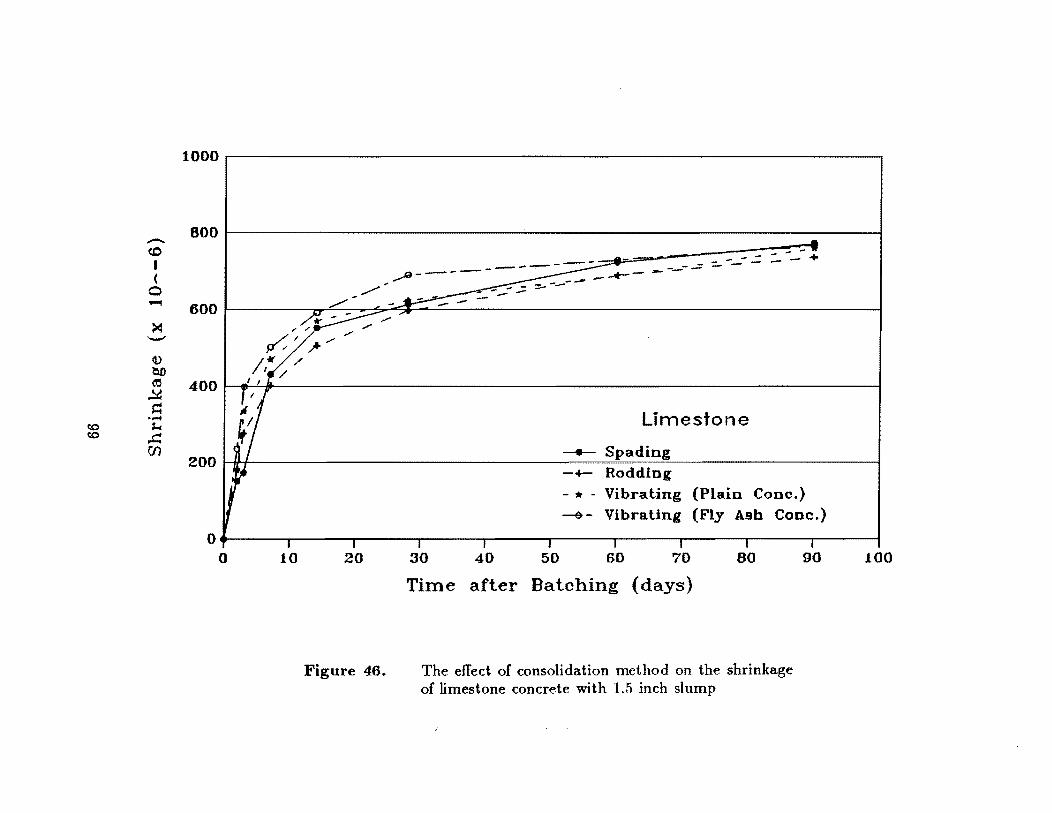
-c:.o I (
0
"""" >I --V ~ ~
~ d .~
co J.c co ...c:
en
1000rl---------------------------------------------------------------------.
800rl ------~------------------~------------------------------~
... .-:-..::; ::::- ---- -.....-- - --- -= =- ---..=. - +
600 I tT""'- .. :::!> -4"" ..- .
400 I • '"
Limestone
200 I IJ l ----e- Spading -+- Rodding - *' - Vibraling (Plain Conc.) -& - Vibrating (Fly Ash Cone.)
O •• -----..-----~----~----~------~----~----~------.-----.-----~ o 10 20
Figure 46.
30 40 50 60 70 80
Time after Batching (days)
The effect of consolidation method on the shrinkage of limestone concrete with IJ) inch slump
90 100
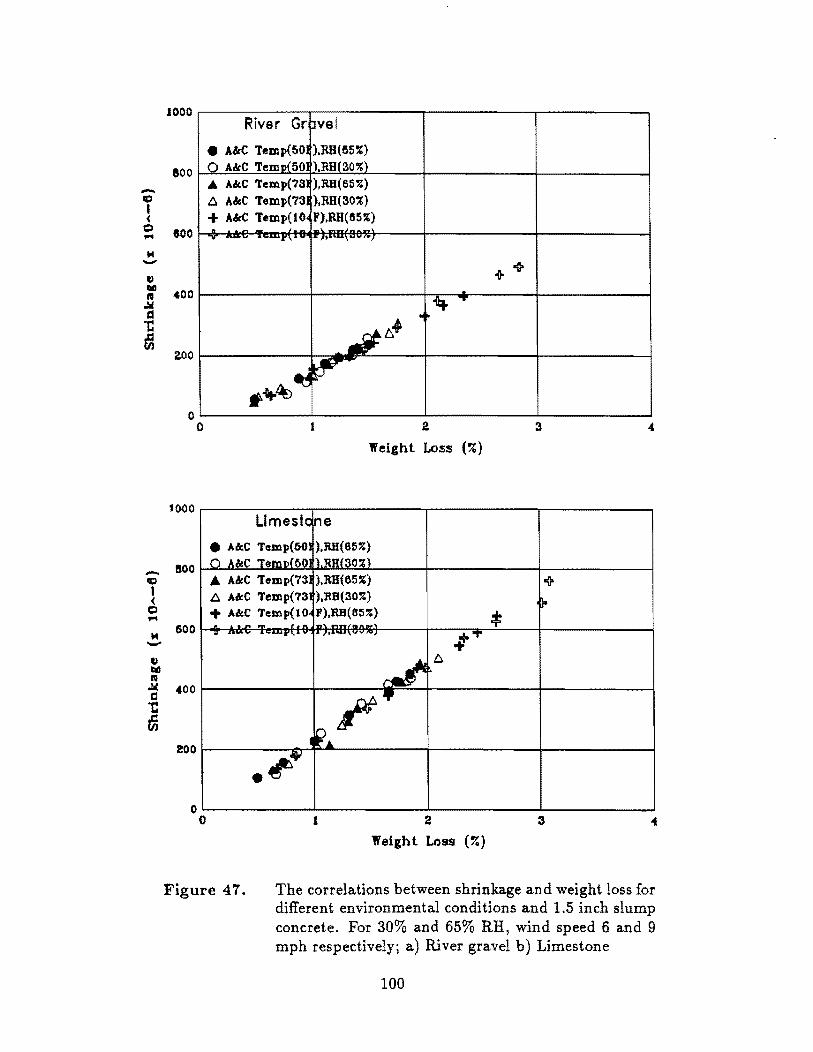
-CI I (
Q .... M -~ till
" .!II &:l
"C .c fI)
-CI I (
Q .... M -~ till
" .!II C
"C .c fI)
1000
800
'00
400
200
o o
1000
soo
600
400
200
o o
River Gr lvel
• AleC Temp(50 ).:&H(65%) o A&C Temp(50 '}.RH(30%) A AkC TClnp(73 ),RH(65~)
l::J. A&C Temp(73 ).:&H(30%) + AleC Temp(tO F),RH(ft5%)
A ....... __ ~ 6W_1",,6V • , ..... \VV .,
.. +
~~~ • ~ 'itt- ....
*it-~ ~ 2 3
Weight Loss (~)
Limestc ne • AkC TClnp(60 ).RH(65~) o A&C T$mJ>{()O 1).:&H(30%)
.. A&C Temp{73 ).:&H(65%) o{la
l::J. AkC Temp(73 ),RB(30~) ~ + AkC TClnp(lO~ F),RB(e:s~)
* ,... ... , ... .... .., ... "., ... u •• - ·~-r'·· ,. .. -\~ '} .tT
J 6.
.~ ... ,"
.~1fI
1 2 3
Weight lAss (~)
Figure 47. The correlations between shrinkage and weight 1055 for different environmental conditions and 1.5 inch slump concrete. For 30% and 65% RH, wind speed 6 and 9 mph respectively; a) River gravel b) Limestone
100
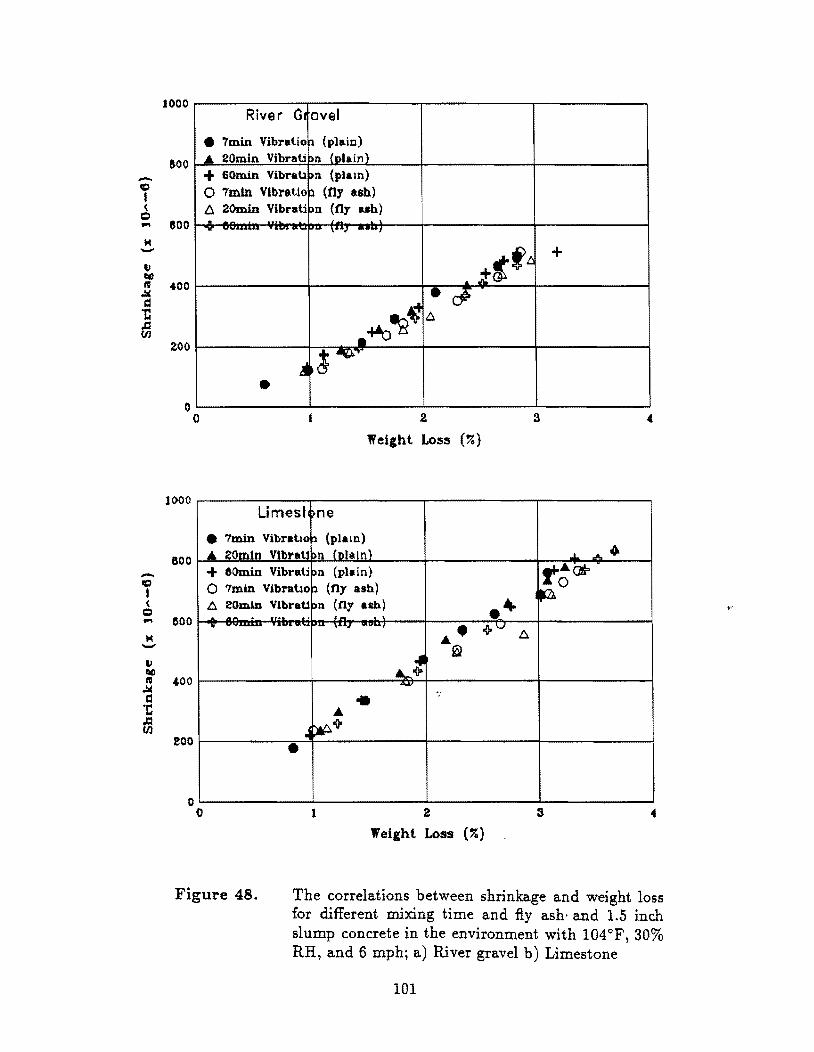
-CI I (
Q .... M -" .., ~
..w c::I
1: .a (IJ
-CI I (
Q .... M -" .., 1'0
..w c::I
·C .a (IJ
1000
800
800
"00
200
o o
1000
BOO
800
'00
200
a o
River 01 avel
• 7min Vibnlio [l (plain) • 20min Vibrati i>n (olain)
+ 60min Vibrall Dn (plam) o 7mln Vlbre.tlo p (Oy ash) I:l 20min Vibrat.i PIl (fiy a.h)
· ,... ' ..... , ... "" , ... \ .. ", •• ... 1
. ;.-tftJ +
~ .~
.~~ t:.
.. !~ . •
2
Weight. Loss (%)
Limesl ne
• 7m.in Vibral10 n (plain) .,1\,. • 20mln Vlbrat1 i>n CDlaln) ..L
+ &Omin Vibrati pn (plain) ~.~ o 7min Vibral10 p (ny ash) ~O t:. eOmln Vlbrat1 pn (ny am) .40 ... 1-"'V ~ n",.",", ~u; \ .. " ... "' ... , •• ~v t:.
.... ~ .@
--• • ~~+
•
1 2
Weight. Loss (%)
Figure 48. The correlations between shrinkage and weight loss for different mixing time and fly ash' and 1.5 inch slump concrete in the environment with 104°F, 30% RH, and 6 mph; a) River gravel b) Limestone
101
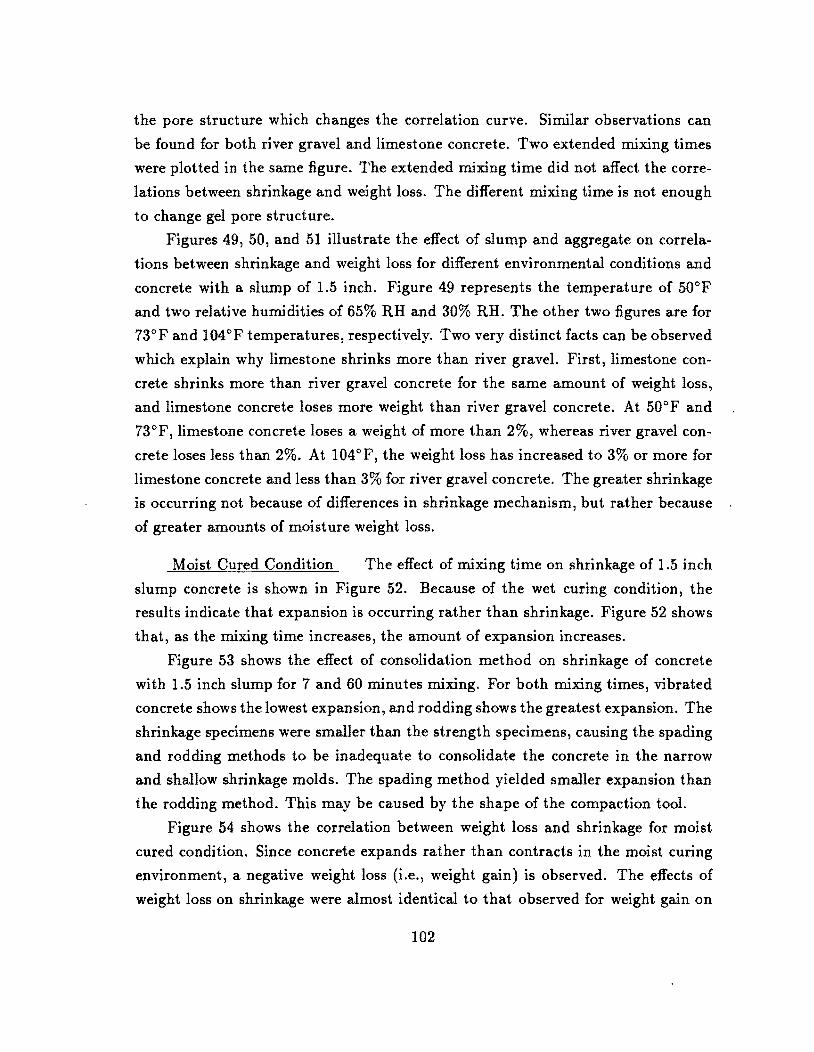
the pore structure which changes the correlation curve. Similar observations can
be found for both river gravel and limestone concrete. Two extended mixing times
were plotted in the same figure. The extended mixing time did not affect the corre
lations between shrinkage and weight loss. The different mixing time is not enough
to change gel pore structure.
Figures 49, 50, and 51 illustrate the effect of slump and aggregate on correla
tions between shrinkage and weight loss for different environmental conditions and
concrete with a slump of 1.5 inch. Figure 49 represents the temperature of 50°F
and two relative humidities of 65% RH and 30% RH. The other two figures are for
73°F and 104°F temperatures, respectively. Two very distinct facts can be observed
which explain why limestone shrinks more than river gravel. First, limestone con
crete shrinks more than river gravel concrete for the same amount of weight loss,
and limestone concrete loses more weight than river gravel concrete. At 50°F and
73°F, limestone concrete loses a weight of more than 2%, whereas river gravel con
crete loses less than 2%. At 104°F, the weight loss has increased to 3% or more for
limestone concrete and less than 3% for river gravel concrete. The greater shrinkage
is occurring not because of differences in shrinkage mechanism, but rather because
of greater amounts of moisture weight loss.
Moist Cured Condition The effect of mixing time on shrinkage of 1.5 inch
slump concrete is shown in Figure 52. Because of the wet curing condition, the
results indicate that expansion is occurring rather than shrinkage. Figure 52 shows
that, as the mixing time increases, the amount of expansion increases.
Figure 53 shows the effect of consolidation method on shrinkage of concrete
with 1.5 inch slump for 7 and 60 minutes mixing. For both mixing times, vibrated
concrete shows the lowest expansion, and rodding shows the greatest expansion. The
shrinkage specimens were smaller than the strength specimens, causing the spading
and rodding methods to be inadequate to consolidate the concrete in the narrow
and shallow shrinkage molds. The spading method yielded smaller expansion than
the rodding method. This may be caused by the shape of the compaction tool.
Figure 54 shows the correlation between weight loss and shrinkage for moist
cured condition. Since concrete expands rather than contracts in the moist curing
environment, a negative weight loss (Le., weight gain) is observed. The effects of
weight loss on shrinkage were almost identical to that observed for weight gain on
102
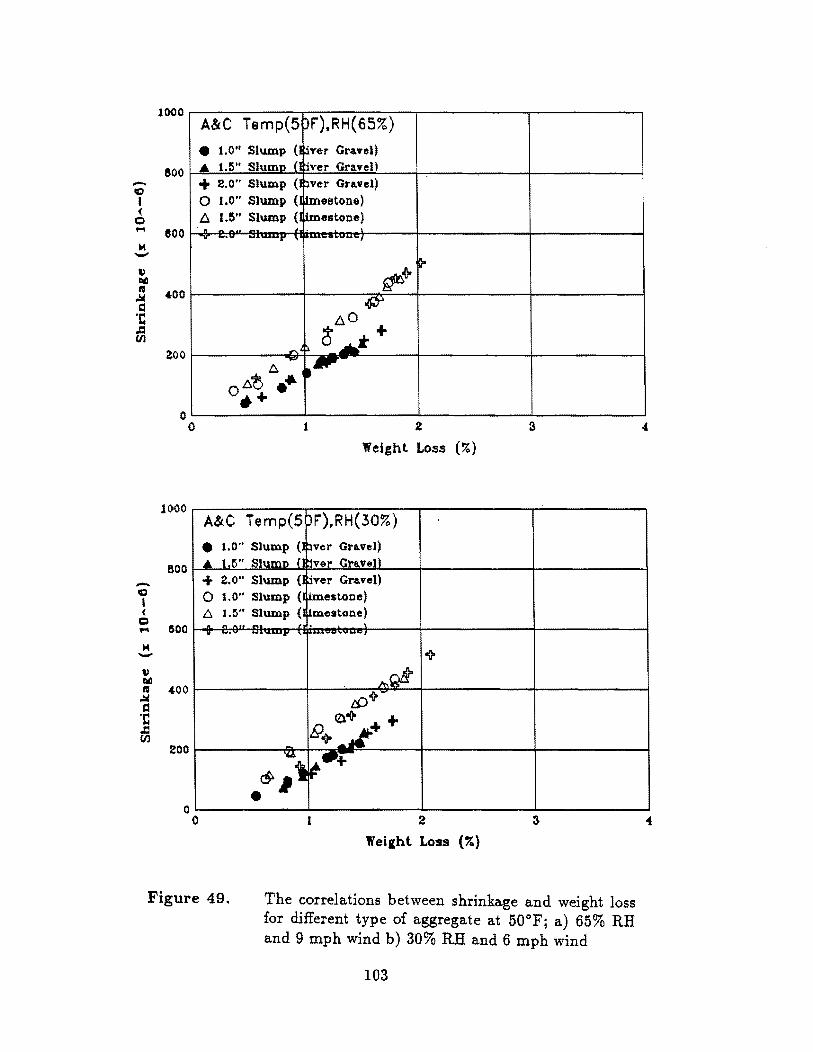
-'" I ( c ... .. -\) IICI CO
..w CI
·C .a Ul
-'" I (
C ... .. -\) IICI CO
..w CI ·C .a Ul
1000 A&C Temp(5 bF'),RH( 65%) • 1.0" Slump ( J.Ter Gravel)
&00 ... I.S" Siumn (J tiver GraveU + 2.0" Slump ( ~ver Gruel) ° 1.0" Slump ( ~eetoDe) I:::. 1.5" Slump ( limestone)
800 . n
400
200
o o
lOoOO
800
GOO
400
200
o o
" .- ----r
~+ po
O~ I:::. +
~ ~ 6 .. r
,..
."'" A A1) ...
0.+
2
Weight Loss (70)
A&'C Temp(5 )F"),RH(30%)
• 1.0" Slump (J ?ver Gravel) ... 1 l5" Siumn () tlver Gre.v~.Il + 2.0" Slump (J ~ver Gravel) o 1.0" Slump (I pnestoDe) I::. US" Slump ( ~me.toDe)
ft. """ f1 • . -III' , .-
"!I-
kQb ti)"i'
0."!I- + 1). .L+ +-
'U. ~.+
~ .I" • I 2
Weilhl Loss (70)
Figure 49. The correlations between shrinkage and weight loss for different type of aggregate at 50°Fj a) 65% Rli and 9 mph wind b) 30% Rli and 6 mph wind
103
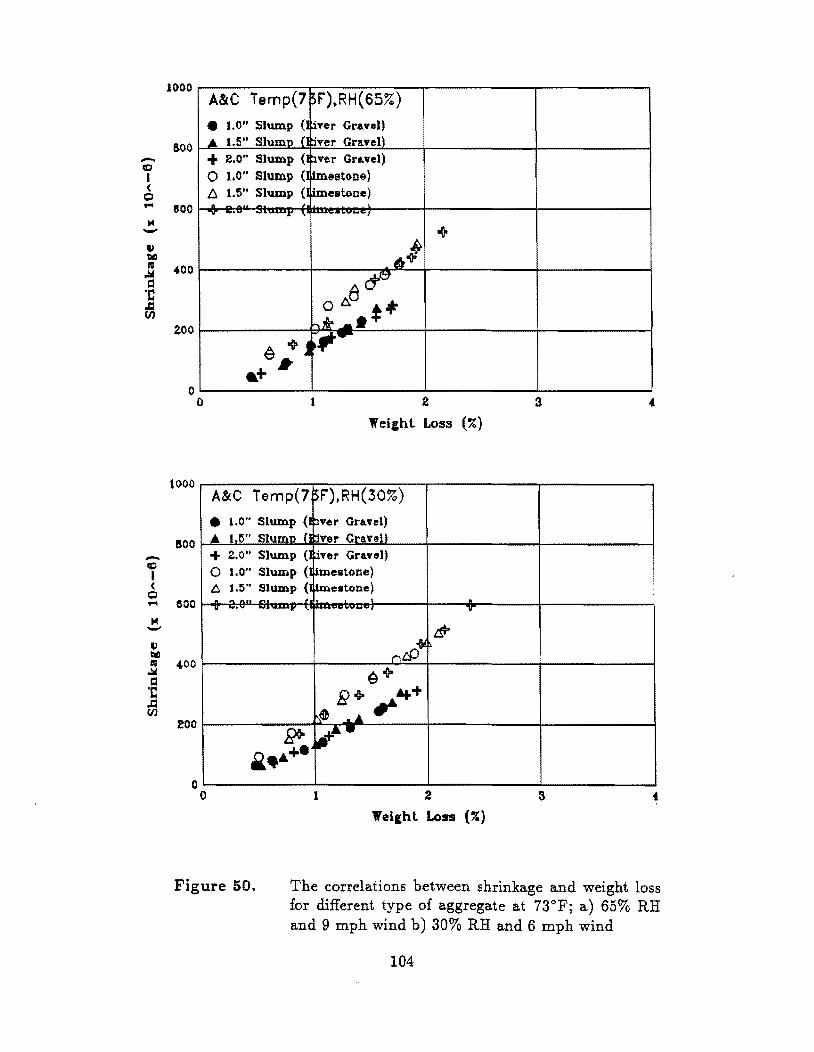
-'ID I (
(;) -H -" I':iI III
oW CI
·C .CI rn
-'ID I (
(;) -H -" I':iI III
oW CI ·C
.CI rn
1000
600
800
.00
200
o o
1000
800
&00
'00
200
o o
A&C Temp(7 ~F"),RH(65%)
• 1.0" Slump ( ~Ter Gra.vel) ... 1.5" Slumn f tiver Gra.vell + 2.0" Slump (I ~ver Gruel) o 1.0" Slump (J ~estoD&) fl 1.5" Slump (l limest.one) "V ..... -r \' ~I
+ 6 1
d'ff3 o t:.
A .f: .... lAo _.t
~ 0(10 J t~-"
.. + #'
1 2
Weight Loss (~)
A&'C Temp(7 ~F'),RH(30%)
• 1.0" Slump (I ~ver Gruel) A 1 15" Slumn {J :1ver Gl'aveU + 2.0" Slump (I ~ver Gravel) o 1.0" Slump (I fimclltone) C:. 1.:5" Slump ( ~e.tone) • ft" .... " . . w .... -&-r ,. r-- ' .. "I 'V
& ntP-t
eo(lo F;+ ..,+
e --'LA ..
~ .,,+& • -" .... +.
1 2 3
Weicht Loss (%)
Figure 50. The correlations between shrinkage and weight loss for different type of aggregate at 73°Fi a) 65% RH and 9 mph wind b) 30% RH and 6 mph wind
104
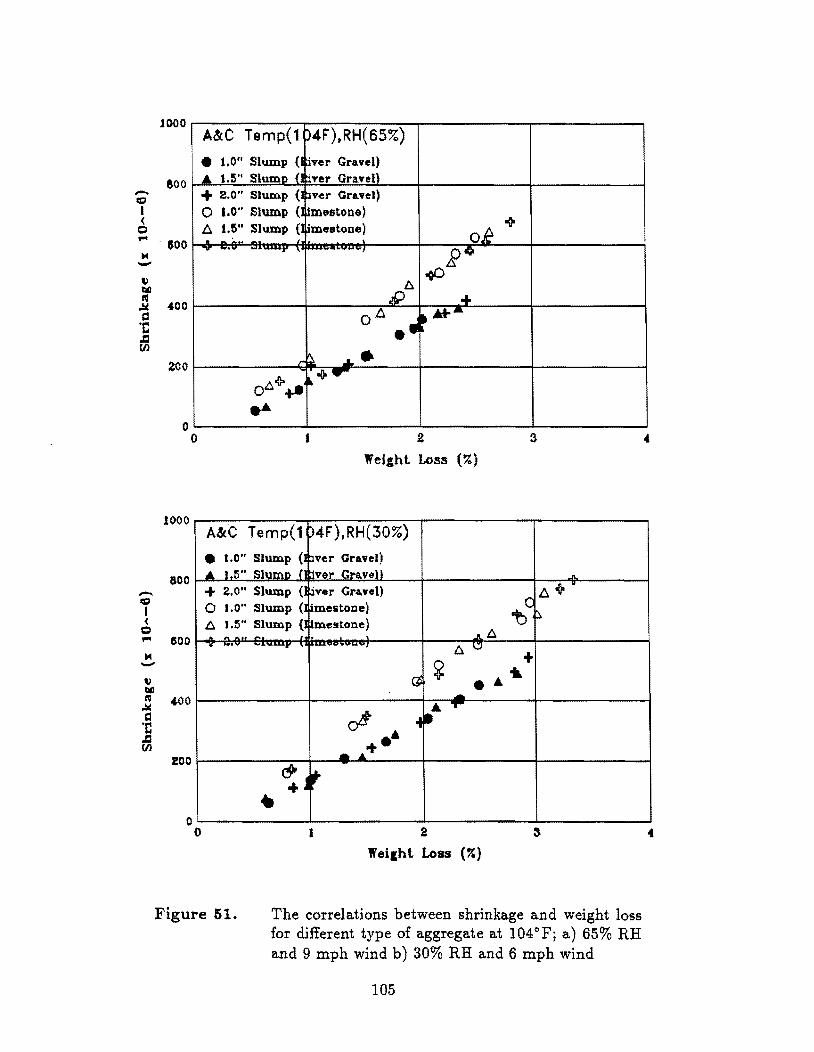
-c I (
Q
"" H -\) IiII! 10
.IItI c:I ·C .c (J)
-c I (
Q
"" H -\) IiII! 10
.IItI c:I ·C .c (J)
1000
&00
. SOO
"'DO
200
o o
1000
800
GOO
400
ZOO
o o
AtJ.C Temp(1 )4F').RH( 65%)
• 1.0" Slump ( ~Yer Gruel) .&. 1.5" Slump (] t:iver Graven + 2.0" Slump ( ~ver Gruel) o 1.0" Slump ( ~mestone)
Oe -00 D. U5" Slump (J ~me.toDe) . I •• .". ....... -~--..!' EO
.i)6. .gO
.+ 0.6
.Ii ~ .......
r~ .... Ol':.+,,- ~ clio .....
• .&.
1 2 a Weight Loss (~)
A&C Temp(1 P4F'),RH(30%)
• 1.0" Slump (J ~ver Gruel) .&. 1 15" Slumn () :iver Gravell .A
+ 2.0" Slump (1 :iYer Gravel)
"b0
D. + . o 1.0" Slump ( ~me.toDe) :::. t::. I.~" Slump ( ~mestoD.e) Jt.. "1\" ..... I •• \ .At::. . .• - ·r 6.0
~ +
G .. ~ -ryt • .. "..&. T
• .. ",+
'!J ,. •
1 2 3
Weicht Loss (")
Figure 51. The correlations between shrinkage and weight loss for different type of aggregate at 104°Fj a) 65% RH and 9 mph wind b) 30% RH and 6 mph wind
105
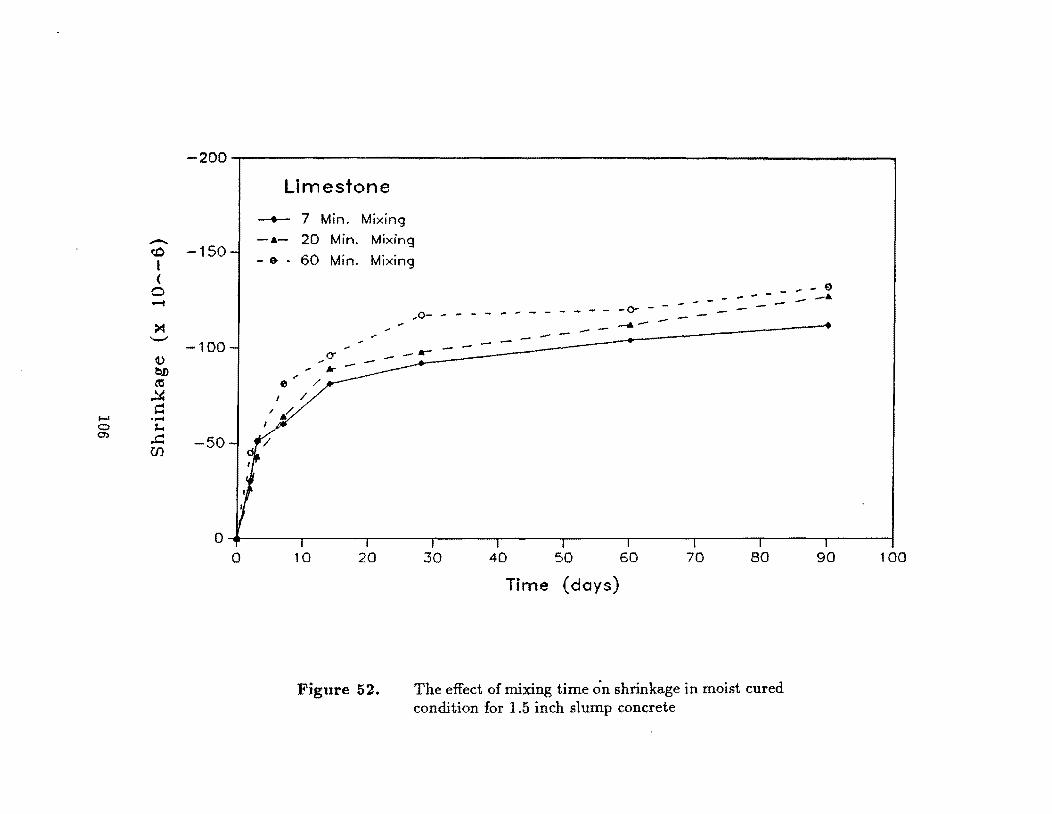
-<0 I (
0 ......
~ "--"
V b.O (!5
~ ~
~ ...... 0 ;.... CI) ...c::
{fl
-200~--------------------------------------------------------------~
Umestone
--+- 7 Min. Mixing
-150 -&- 20 Min. Mixing - & • 60 Min. Mixing
_ E)
______ - - -0- - - - - - _&
... 0- - - - - ---.,. - -----100 - -
... e
-50
O~'~----~----~------~----~----~------~----~------T-----~----~ o 10 20
Figure 52.
30 40 50 60 70 80
Time (doys)
The effect of mixing time on shrinkage in moist cured condition for 1.5 inch slump concrete
90 100

-200
7 Min. Mixing (Limestone)
-.- Spading
- -150 -... - Rodding
IC -0- Vibroting ....... I (
Q - ...... -... H - -0 - ~- - - - - - --100 - - - -l> r.l
" .:.c • a /
1:: .a en -50
O~---.~---r----r----r----.----r----~---r----~--~
o 10 20 30 40 50 60
Time (days)
70 80 90 100
-200~------------------------------------------------~
- -150 IC I (
Q
"'" H
- -100 l> r.l
" .:.c a ·c ~ -so
60 Min. Mixing (Limestone)
-+- Spading
-... - ROdding
- 0- Vibrotin9
/
..... ---... --./ - _~::-::-::~0- - -... _ _ __ - - - e
_. ---
O~----r---~----'-----~---r----~--~----~----~--~ o 10
Figure 53.
20 30 40 50 60
Time (days)
70 BO 90 100
The effect of consolidation method on shrinkage in moist cured condition for 1.5 inch slump concrete; a) 7 min. mixing b) 60 min. mixing
107
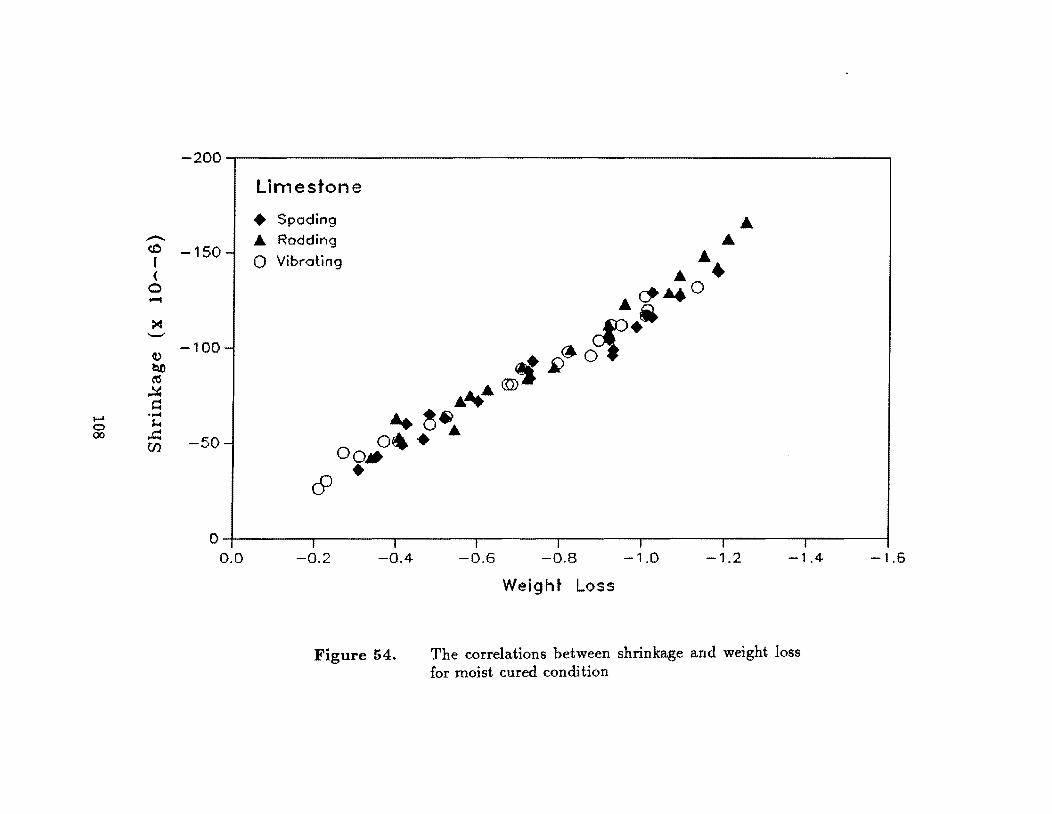
...... 0 00
-200~------------------------------------------------------------------~
Limestone
• Spading -<.0 -150-I
£. Rodding
o Vibroting
.A .A
.A .. .. ( o ..... ~
"-'
V t:U> (I!S
~ ~ ..... ~
..c= en
-100-
-50-
"'~ .... o r¥>.~
~i)~O. ...... em .. ~~
00 .. °"'. £.
& •
o I I I I I I I I 0.0 -0.2 -0.4 -0.6 -0.8 -1.0 -1.2 -1.4
Figure 54.
Weight Loss
The correlations between shrinkage and weight loss for moist cured condition
-1.6
expansion. Figure 54 shows that the correlation is not affected by the consolidation
method or the mixing time.
4.4.2 Moisture Content and Moisture Loss
Moisture is a constituent which is absolutely needed for hydration, since the
degree of hydration is determined by the availability of water. By measuring
the moisture content at different ages of the concrete, a qualitative idea of how
the hydration is progressing can be deduced. The moisture content can be
determined through drying at 105°C and one atmosphere of pressure (oven drying),
at ambient temperature and vacuum over dry ice at -78°C (D-drying), and at
ambient temperature and vacuum over a salt solution (P-drying). Of these three
methods, the first one is the most common and was therefore used in this research.
The other two methods are only used in more detailed pore structure studies, which
are beyond the scope of this study.
Higher levels of moisture content are needed to ensure continuous hydration,
and rapid changes of moisture content can result in either rapid hydration or rapid
loss of moisture, depending on the curing conditions. In conjunction with moisture
content, moisture loss measurements provide a means of differentiating between the
above changes. The moisture loss is, furthermore, directly related to the change in
shrinkage.
Figure 55 shows the moisture content at each different age and environmental
condition for the concrete mixtures with a slump of 1.5 inch. At 3 days, the moisture
content is almost the same for all conditions with a slight increase as the temperature
increases. The increase of moisture content with temperature is not caused by the
environmental conditions during curing but reflects the different amounts of mixing
water introduced during batching. As the temperature increased, more water was
required to achieve the same workability. This is a consequence of the increase of
moisture loss with an increase in evaporation rate as the environmental condition
becomes more dry. Both the increased amount of mixing water and the increased
water loss are the reasons why the 3 day moisture content increases slightly with
the severity of the environment.
In limestone concrete, the 3 day moisture content increases as the environ
mental condition becomes drier. This tendency is more distinct than for the river
109
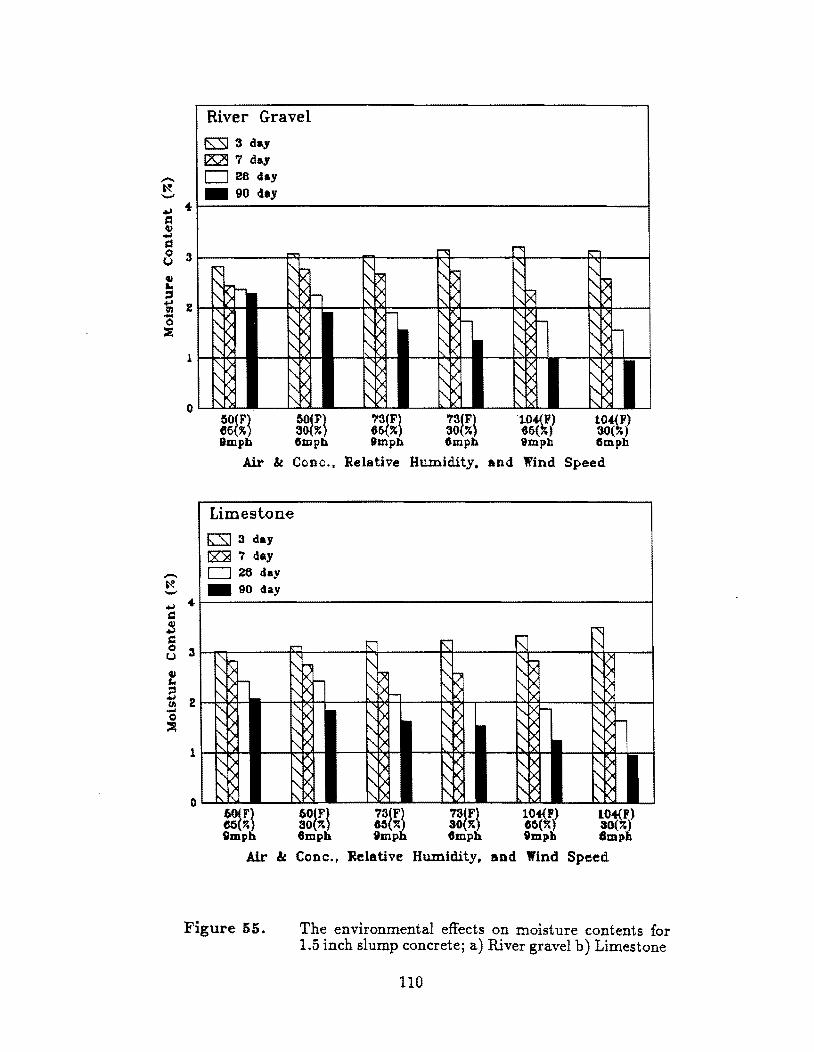
.., .. ::I ii 2 -o ::s
1
o
1
o
River Gravel
ts:SI :3 day ~"i day D 28 day _ 90 4ay
- '"'I r" I:""'
~ " ~)< I" " I"
~~~ f'- >< "R "r. ~~ " ><1- ,,> ~K ,,~
,,~ 0.>< 0.[> ~ ~R "IA II' t- ,,~ - i' ~t-~~ ~~ i'1>
t'-~ i't>< ~ ~~ ~I> ",I)< i' r>
~~ ~~ I"t>< I"L> ~
"'~ ~l> i'L> 1"1>< 1")
~R ~K ~C>< ,,~ "I>< ~R ll<: '--
gg1~} gg1~} x:~~~ ~1~~~061\11 \fo~l Bmph 6mph 'mph 6mph 'mph 6mph
Air &! Cone .• Relative Humidity. and Wind Speed
Limestone
t:SJ 3 day
~ 7 dey D 26 day _ 90 <lay
I:""' r I'\:' f': ~ ," > '-.. '""i '-.. " '"'r- ~~ '-..
~t- "'R 0.~ '-.. [>~ "- Rt- "-
"k' i"-~ i"-~
" !) " "- X b-,2-
~~ I,
i'l> ~< I" X- I" ~t-"R I"X f'-'-..> KK "v< '-..~ I"X I" )
" ~V< " I"x: lI" ,,~ '-..>< -
" '-..>< '-..X
'-.. '-..x: '-..X ,,)C '-..iI ~><
,,:x ~K '-..~ '-..>< '-..:x '-
:gl~} ~gl~} ~g~~~ ~t~~ ~~~l ~~Wi iIImph Omph 9mph Omph 9mph emph
Air & Cone .• Relative Humidity. and Wind Speed
Figure 55. The environmental effects on moisture contents for 1.5 inch slump concrete; a) River gravel b) Limestone
110
gravel concrete. The changes in moisture content with time, at all temperatures
investigated in this test, are greater in the limestone concrete than that in river
gravel concrete. Therefore, limestone concrete has a greater rate of moisture loss
than river gravel concrete. However, despite this greater rate of moisture loss, lime
stone concrete has a significantly higher initial moisture content because there is
more extra initial moisture in the pores of the aggregates. The extra moisture keeps
limestone concrete wetter than river gravel concrete at the age of 3 days even with
the faster moisture loss rate for the limestone concrete.
Seven-day data varies quite randomly. Drying at the age of 7 days is primarily
controlled by diffusion through the tortuous capillary pores formed in the concrete.
The moisture loss rate decreases exponentially and is primarily controlled by the
amount of remaining water in the concrete, rather than by a change in diffusivity.
Drying for 7 days is long enough to evaporate most of the excess water, but not
long enough to compensate for the increased initial mixing water. As a result, the
moisture contents at 7 days are quite variable and independent of the environmental
conditions.
The 28 and 90 day moisture contents are decreasing in order as the rate of
evaporation increases. The rate of evaporation at these ages is much smaller and
more stable than the rate of evaporation at early age. In the concrete specimens
with limestone, the change in water content between 28 and 90 days is slightly
larger than for the river gravel mixtures. The difference is attributed to the greater
porosity of the limestone, which can contain more water and continuously supply
water for evaporation.
At low temperatures, slow hydration helps to produce a dense and less porous
internal structure which decreases the rate of water loss. On the other hand, rapid
hydration at high temperature forms loose and more porous internal structures,
which enhance later loss of water. The amount of water which is present in concrete
depends on the size of the pores and the relative humidity. When concretes are
exposed to the same relative humidity and temperature, the internal water can be
assumed to have the same surface tension. The radius of meniscus formed in a
pore under the given relative humidity depends on the pore size. If the overall
size of pores is large, the number of pores which can hold water under the given
condition is reduced. The same is also true for the moisture contents. The long-
111
term, equilibrium water content depends on the size of pores formed in the concrete.
The moisture content in a low temperature environment is low but becomes larger
as the temperature of the environment increases. Drying for 90 days in the hot
and dry condition is long enough for the evaporation process to be considered to
have reached quasi-equilibrium; in that state the moisture content depends on the
internal pore structure of the concrete, and its values are an indication of the size
of the pores. A low moisture content at higher temperatures is caused by the
large and coarse pore structure formed in the concrete. Even though specimens
cured at low temperatures are moved to a higher temperature environment with
the same relative humidity, the moisture content will not be as low as in specimens
continuously cured under high temperatures. Because of different curing conditions,
different internal pore structures were formed. The difference of moisture content
is due to the difference of internal pore structure of the concrete mixtures.
The effects of mixing time and fly ash on moisture content for the mixtures with
a slump of 1.5 inches are shown in Figure 56. In general, the longer the mixing time,
the greater the moisture content is at later ages. The observation is valid for different
ages, different types of aggregates, and the presence of fly ash. The loss of water
due to evaporation reduced the workability of concrete. The degree of moisture
loss and the loss of workability depend on the mixing time. Some additional water
was introduced after the mixing time to restore the original workability. The added
amount was about equal to the amount of water loss. However, just compensating
the water loss is not enough to recover the workability. Additional water is needed
to compensate for the increase in viscosity and reduction in workability due to the
formation of cement hydration products. From Figure 56 it can furthermore be
observed that the increase in moisture content with an increase in mixing time is
present at all ages, even though the differences are reduced with age. The effect of
high initial moisture content lasts throughout the 90 day period investigated.
The effect of introducing fly ash on the moisture content can also be observed in
Figure 56. The fly ash concrete showed quite different moisture characteristics from
the plain concrete. The fly ash concrete had about 50 percent less moisture content
than plain concrete at all ages. Fly ash replacement slightly reduced the amount
of initial mixing water, as shown in Appendix C. In the opinion of the authors, the
shape and relative small size of the fly ash particles combined with the additional
112

River Gravel
rs::sI 3 d.y ~ 7 day
_ 28 day N ....... _ 90 4.y
~ 4r-----------------------------------------------~ ~ ~ /:l
8 3~~----_1~~--~~~--------------------------~ ~ ... =' ~ 2~~r_--~~~--~~~----~------~------~----~ '0 ::2
-~ '-'
~
Q ~ C c t..'l
~ Sol ;:I ~ CII .... C )l
7min 20m in 60min 20min dOmin
Plain Concrete Fly Ash Concrele
Limestone G 3 day ~ 7 da.y
26 day _ 90 day
" ....
:5
2
1
0
"'" """ ~i< " "..,.. \t
,,~ ,,>< ,,><
~~ "t>< f',[)< ,... "IX f',)<
....... r- i',
~ ~- "'-Ix .- l-f', i' [\..
f', ~x i',)<
~B i'~ t~ ~ "'-> [\..X , i',X ,> ,
~x ,,)< ,,~ I'-,X
l ~~-L " r-. ~>< 'll 'X ';X ~K "X ,,> K- ,t:x "i)<
7min 2Qmin eOmin 7min 20min 60min
Plain Concrete Fly Ash Concrete
Figure 56. The effect of mixing time and fly ash on moisture contents for 1.5 inch slump concrete; a) River gravel b) Limestone
113
chemical reactivity of the particular type C fly ash used are responsible for the
reduction in both initial mixing water content and subsequent moisture contents.
From the results shown in Figure 56, the internal pore structure of fly ash concrete
might not be drastically different from plain concrete because the moisture loss for
these mixtures remained almost in the same order as for the plain concrete mixtures
up to 28 days. This implies that the pores in the two types of concrete had almost
the same characteristics, same sizes and same distributions. During the first 28
days, most of the evaporable water in the fly ash concrete was lost, and therefore,
no further significant moisture losses occurred at ages greater than 28 days. This
observation implies that the fly ash concrete almost reached equilibrium after about
28 days of curing.
Figure 57 shows the effects of continuous moist curing and initial material
temperature on the moisture content of 1.5 inch slump concrete. Continuously moist
cured concrete has twice the amount of moisture content as any other concrete stored
in dry air. The specimens cured in the moist room showed an increase in moisture
content, whereas the specimens stored in dry air showed a decrease in moisture
content. If concrete is cured in sealed condition, thus preventing evaporation of
part of the moisture to the environment, the moisture content must be decreased
because the chemical reactions in concrete consume the water to form hydration
products. The increase in moisture content is an indication that the amount of
absorbed moisture is greater than the amount of hydrated water. The changes in
moisture content with age are, however, not as significant as the changes under dry
conditions.
When the material temperature is controlled to overcome the cold air temper
ature, a slightly higher moisture content can be observed at the age of 3 days, and
almost the same moisture content can be observed for the later ages. The high mois
ture content is a result of the high initial mixing water. At low air temperatures, the
warmer materials needed more water than the cooler materials, and the moisture
loss of the warm material was also greater than evaporation from the cool material
at the same air temperature. The initial mixing water was increased to compensate
for this loss, and the increased water affected the 3 day moisture content. However,
the effect of using warmer materials lasted for a short period - generally within a
day and the immediate decrease in temperature was observed during the mixing
114
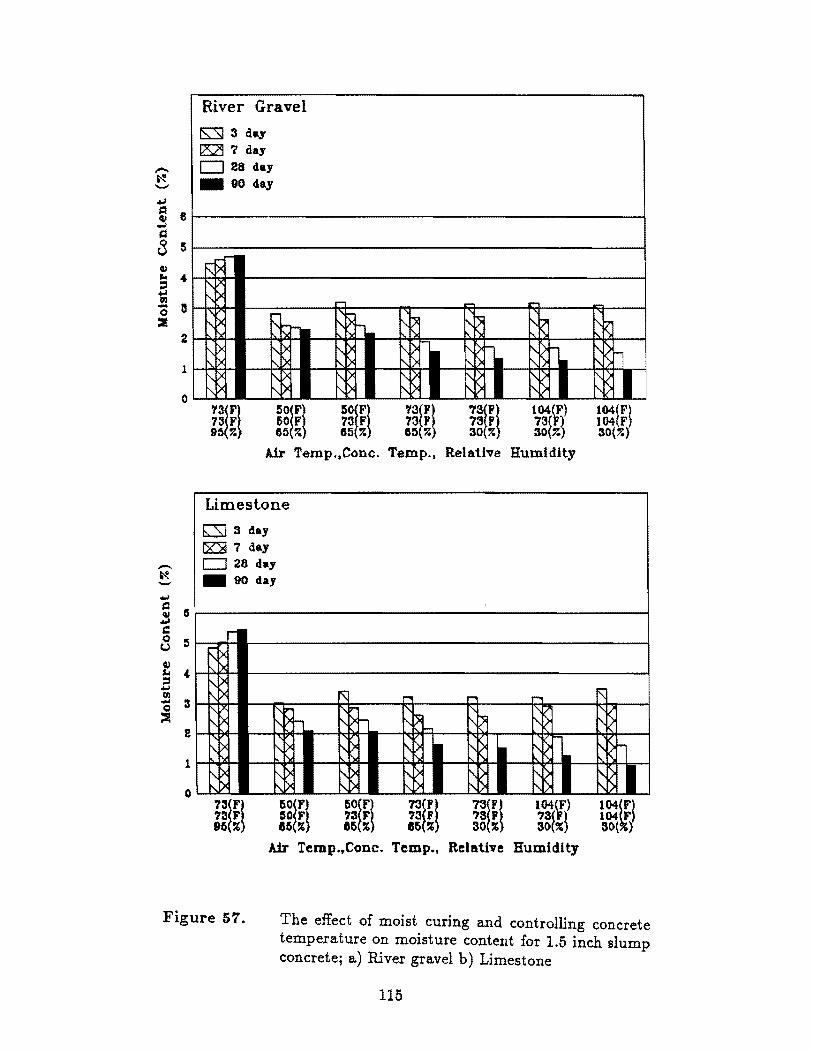
-~ ......, -.I S!1 8 .! J:1 Q 5 r..> GJ ... " :I ... l:II - " ()
::at 2
1
0
-~ -
2
1
o
River Gravel
IS:SJ 3 day ~ '1 day D 28 day _ 90 day
F:'; f\, 1'1> r- .... ...
I""" 1\> 1'\1)< ['\~ r-.D-1')< 1'\ - [}. ~ 1\
f\,l>< f\,V< r-.) '? r-.:>I- "'~-l>< f\,l>< )< ,[> r\) ,1\
I'l>< I'D< f\,l>< ,~ i\~ i\R f\,~ ['\1>' f\,[)c 1'> ['\v
'13~Ft 73 F 95 ~
50!Fi 73 F 65 ~
'13fFt 73 F
65 ~ "I3~Ft 73 P 30 ~
50~F! 50 F 65 ~
Air Temp.,Cone. Temp., Relative Humidity
Limest.one (;3J 3 day
~ 7 day 028 day _ 90 day
I"""
1'>< )<
f\,l>< ,I> r\ .... r-,
~[> ~l> I'~ ['\~ ,~ f\,[>
1'> i\l> ,) I'l> r--I> 1'[> J\ J\
1'1> f\,1> 1'> 1'[> 1'1> 1'1> "I> ('.1> f\,[> ""~ I'll r-.I)
73~F! 73 F 96'"
5O~F! 50 F &6'"
60fF! 73 F
85'" 73iF! 73 F 30'"
Air Temp.,Cone. Temp., Relative Humidity
I'\~ '>
i\l>r-r-.) ['\) I'~ I l04(F) l04(F) 30(~)
, V
,~
1')
'" f\,D I I' 104[l 104 F) 3(){ )
Figure 57. The effect of moist curing and controlling concrete temperature on moisture content for 1.5 inch slump concrete; a) River gravel b) Limestone
115
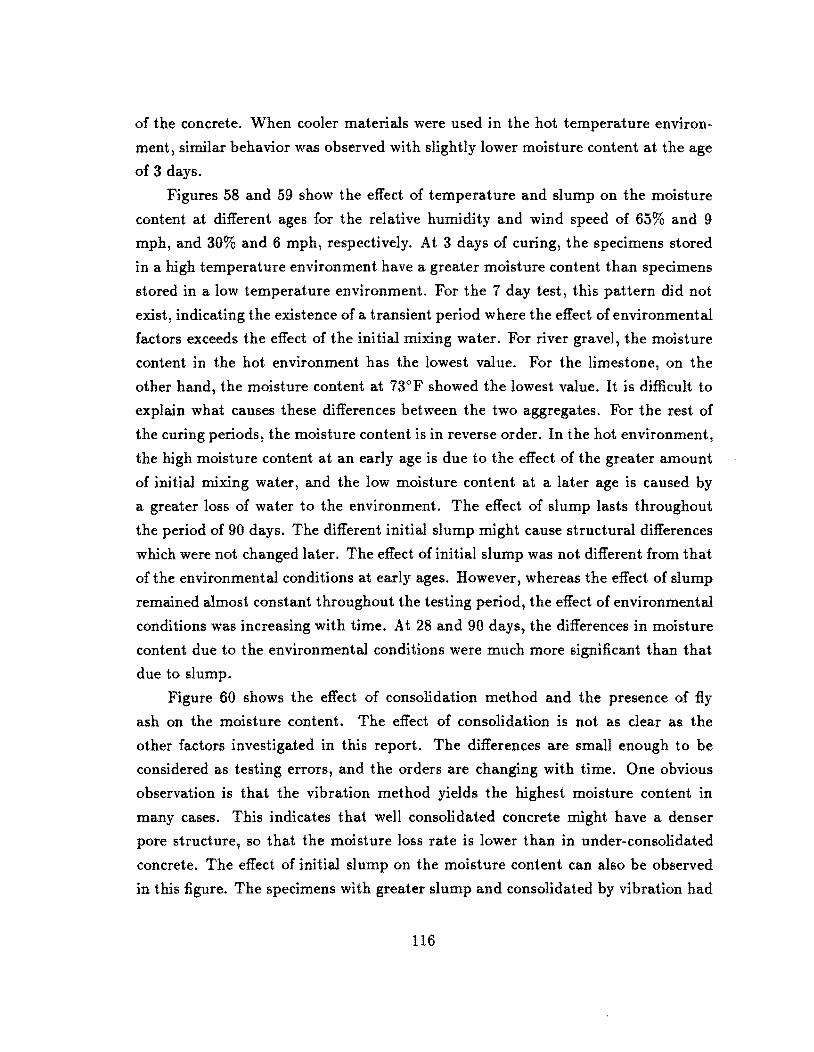
of the concrete. When cooler materials were used in the hot temperature environ
ment, similar behavior was observed with slightly lower moisture content at the age
of 3 days.
Figures 58 and 59 show the effect of temperature and slump on the moisture
content at different ages for the relative humidity and wind speed of 65% and 9
mph, and 30% and 6 mph, respectively. At 3 days of curing, the specimens stored
in a high temperature environment have a greater moisture content than specimens
stored in a low temperature environment. For the 7 day test, this pattern did not
exist, indicating the existence of a transient period where the effect of environmental
factors exceeds the effect of the initial mixing water. For river gravel, the moisture
content in the hot environment has the lowest value. For the limestone, on the
other hand, the moisture content at 73°F showed the lowest value. It is difficult to
explain what causes these differences between the two aggregates. For the rest of
the curing periods, the moisture content is in reverse order. In the hot environment,
the high moisture content at an early age is due to the effect of the greater amount
of initial mixing water, and the low moisture content at a later age is caused by
a greater loss of water to the environment. The effect of slump lasts throughout
the period of 90 days. The different initial slump might cause structural differences
which were not changed later. The effect of initial slump was not different from that
ofthe environmental conditions at early ages. However, whereas the effect of slump
remained almost constant throughout the testing period, the effect of environmental
conditions was increasing with time. At 28 and 90 days, the differences in moisture
content due to the environmental conditions were much more significant than that
due to slump.
Figure 60 shows the effect of consolidation method and the presence of fly
ash on the moisture content. The effect of consolidation is not as clear as the
other factors investigated in this report. The differences are small enough to be
considered as testing errors, and the orders are changing with time. One obvious
observation is that the vibration method yields the highest moisture content in
many cases. This indicates that well consolidated concrete might have a denser
pore structure, so that the moisture loss rate is lower than in under-consolidated
concrete. The effect of initial slump on the moisture content can also be observed
in this figure. The specimens with greater slump and consolidated by vibration had
116
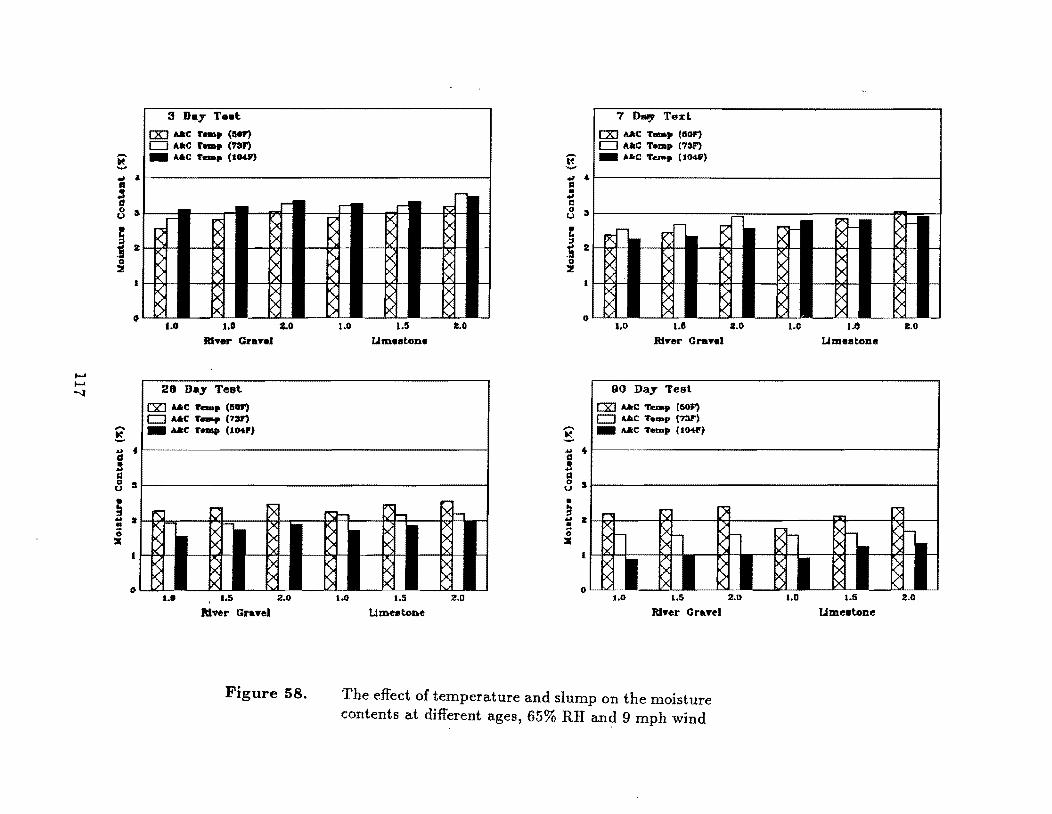
...... ...... ~
~ ..... -;; ..
:: a 8 I
j 2
~ I
I)
...... ~ ... f
~ c:I S II
; ~ . ;; :I
3 nay Test [X] A.lkC ,,_. (a.,., c:J A~ r ... ("~F) _ A6C ,. ..... (IOU)
-!---;:::
P"'" r> K ~ r-~~ t)(
>< ~ -~- >< [2< [><
-~- ~ [><
t •• u 1.0
River Gravel
28 Day Teal [Sl] A6C 1' ..... (IIIII')
c:J A6C " .... (73J') _ A.lkC "_p (I04P)
~ 1"\ ,....
'" R Ix: ~ Ix: I-~I- p!'; [)<
~BL- ~ [)< I)
I •• I.S 2.0
River Gruel
Figure 58.
r-r- r- "'"'
~ P<
r-
b rx ). rx 1-:
5 ~ IX )< >< L-
~ X
~ X -
1.0 I.!! 2.0
Um •• ton.
.... F"'\
1"':1- txl- ~ htt-
~ K [5<
l>< K I'x I-
~ K tx K tx
L
1.0 1.S 2.0
Um~.toDe
~ ....., -;; ... • 1i 8 I
~
~ 2
~
o
.....
7 D..,. Ted
CXJ A.lkC T_. (aol") c:J A"C Temp (7~F) _ A6C 'I'..-p (104lI')
i'\r-- R 7'
\( i? f--~f-
X ~ .>< >: ~~ r'> I-
~ J< K X L-t.:::l- .... •• 0 u
RlYer Gray.1
90 Day Teal
CXJ A6C """'p (50J') c:J .u..c T .... p (73P') _ A.lkC Temp (1041')
~-
~ k
~ '.0 1.0
-7'\_ D-I->< [> )< ~ rx r> t>< t>< ~
L-.... ~._ 1.0
Um •• toI18 2.0
,.....
-
'-
-
... 4LI------------------------------~ a !
~
S sLI----------------------------------------~ • 3 zlu ~ ~ ~ ~ • ;; :I
., '''I I I"xl
o 1.0 1.S 2.0 1.0 1.5 2.0
Ri't'er Gr.'t'~l Ume.tone
The effect of temperature and slump on the moisture contents at different ages, 65% RH and 9 mph wind
I
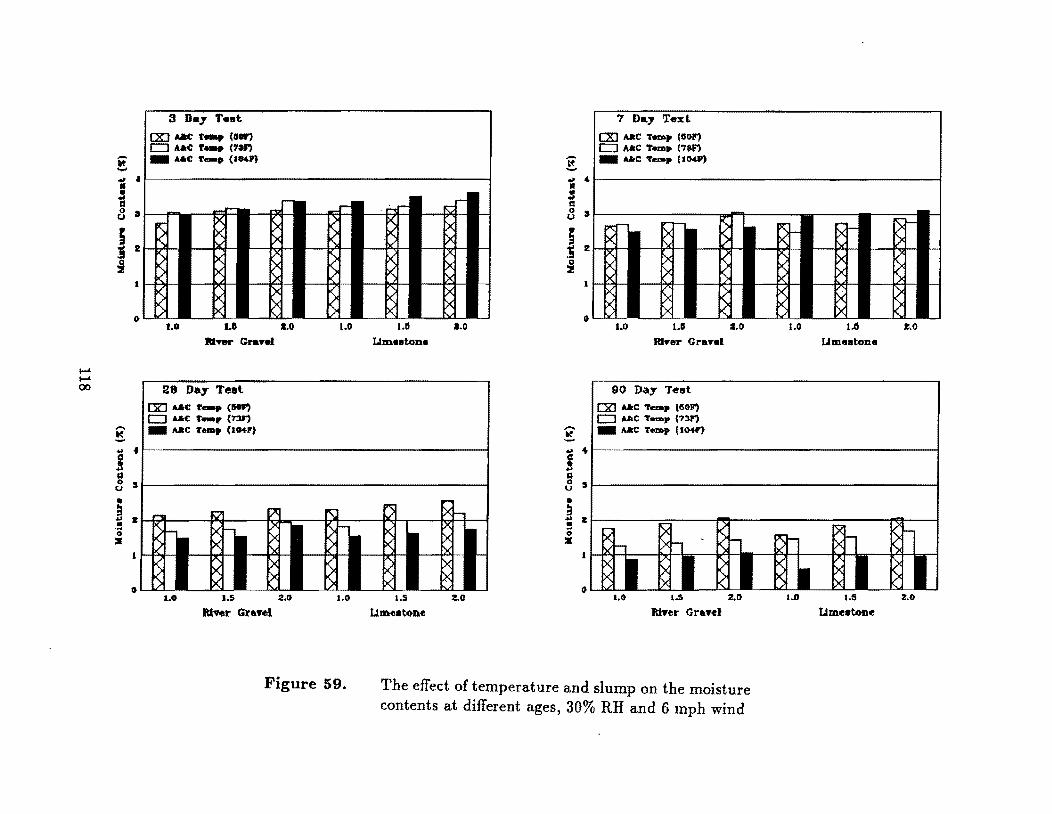
..... ..... 00
.. ....,
i ' 8 It
j 2
:i 1
I)
---!. ... f d .3
'" .3 5
• ~ . • '0 X
o
3 Oa,,. Test
[XJ Aac: 1'_, (II'" CJ A.ac r_. (',n _ AJlrC 1'_. (IMP)
-- r- ...,
5 ~
~ ~ -~- ~
~
< x: [)< .t X l>< K- )<
X K X >< '-~~ t .• 1.1
81 ....... Gram
28 D..,. Teet riJ AJlrC "-. (IIOJ') CJ AJIri: l'-r ('I3f') _ Aa«: 1' ... , (to.,,)
"'" ,..., PI
- ~!- ~ x: i')( ->< po: x: K >< )<
'-~'-
r- r-
~ B ~ >
:11.0 1.0
r:;: I--
~
,~-
><, ,~ >< ><
~ U
Llm.ston.
C5 x: ><
R
r-
X >< )< )<
>< X
'.0
,... XI-)<
)<
)< )<
f--
!-
~
-
I !
!-
~
t; .....
'" " = t: 8 :5
I 2
:i
I)
..... ~ -
7 Day 'I'e:d.
r:x:J AJlrC T_p (1101") CJ MtC T .... (7#F) _ UtC T_. (10411)
po;r- ~r- ~ ~I-- I\c !-
~ I>< [)<
'-~'-[>< ">
> ~ [><
-~-[)< '\.
1.0 1.0 mYer Granl
90 Day T~.,t
[XI AJlrC 'l'e.mp (/SoP') CJ AJiC T_p (?3l") _ A.l:C Temp (104f',
P;::!- Xl-- >'-P< )<
R )<
~ X- i><
~ ~ >< >< I\,.
:C.O 1.0 I..c! '.0 LImestone
! ~I[ ~~------------------------------------8 51 ~--~
1
1.0 1.5 2.0 1.0 1.5 Z.O 1.0 1.5 2.0 1.0 1.5 2.0
ltI:ver Grtlyel
Figure 59.
IJmeatone NYer Grayd
The effect of temperature and slump on the moisture contents at different ages, 30% RH and 6 mph wind
IJmeatone
,...
-
-
'-
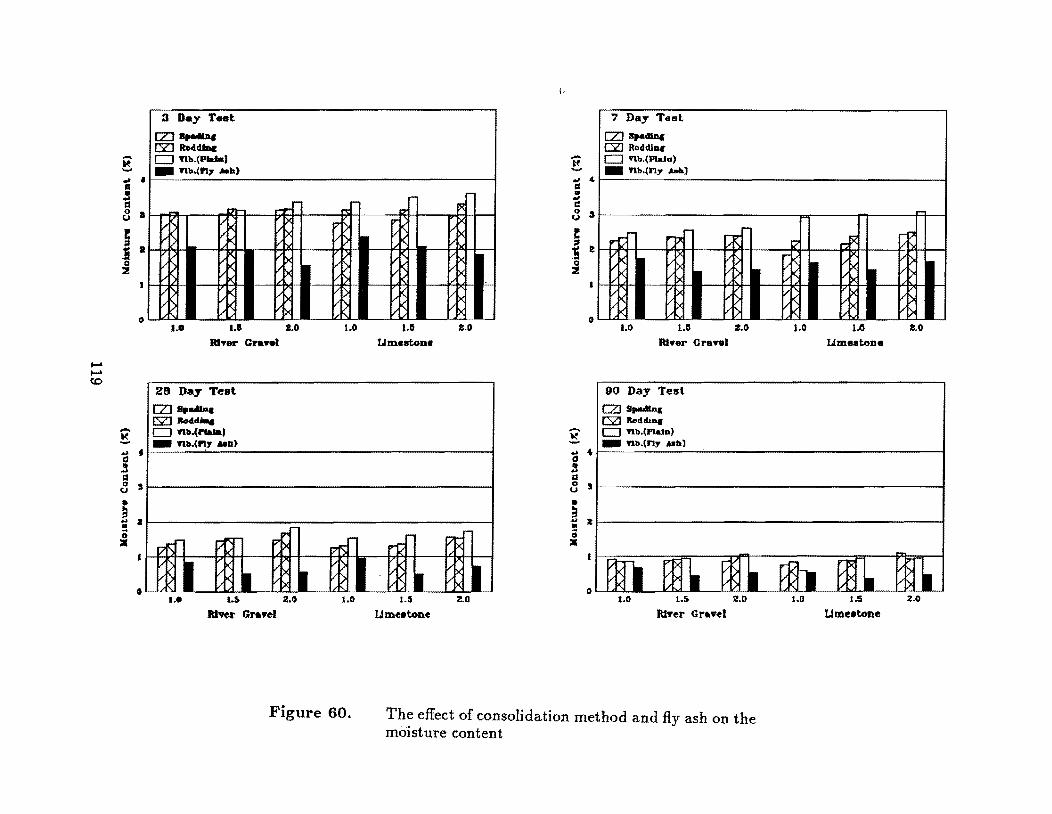
..... ..... <0
~ ....... ~ , ., a ~ . j a
~
o
E j 4
~
~ :I
5 -:: z j
o
3 nay T_t
0 ...... I:SZJ RoddJDc CJ I1b.(P .... ' _ Ylb.(Pl,. _h)
1\ V V V-
II< V ~
t>< v) K i><
1.8 u t.O
Ri"... Gl'1l'"
28 Day Teet [Z]8 ...... ~ .... .u.a CJ Ylll.(r ...... ' _ Ylll.(~,. Mil.
~ 17 V-V\
I k '/\ k I t:x
17\ \
I V V-v
1.0
17':. V>
I >
k'
!\
K V'
1.11 Lim •• ton.
"-1(
I . k' V-~ I '\
15':
X
v ,/
*.0
I><
VI><
><
j/
-
I
N '-'
~ '" !l a 8 Ii
~ t
~
o ,
7 Day Teal
[Z]~ C5ZJ RoddlDt" o ,"b.(Plala) _ ,"1:1.(1'17 .... It.)
~ ~ ~)< t:x V- lit><
V- I>< ~ III><
l_~ 1.0 1.0 a.o
RiYer Gray.l
90 Day Test
[ZJ !IpouII.D.a
v) !\
.t'
-< ~
1.0
r-: IX
V-x ~ I><
IX _V-
1.0 LiJDe.tone
'/
'/
'/
Y
u
(SZJ Itod.w... c:J Ylb.(l'IaIa) _ ftb.'trt- .... " ~ 41~--~;'-;-';'-~'J~~~ __________________________ ~
~ '1 [[========================::::=::~~~~~ 3 al • ;; :I
0"4)18 VM_ IV'_ 10,,_ Ybo_ YI_ 1.0 I.S 2.0 1.0 1.5 2.0 1.0 1.S 2.D 1.0 1.5
Rive.. Gruel
Figure 60.
IJmeetone River Gruel IJmeetone
The effect of consolidation method and fly ash on the moisture content
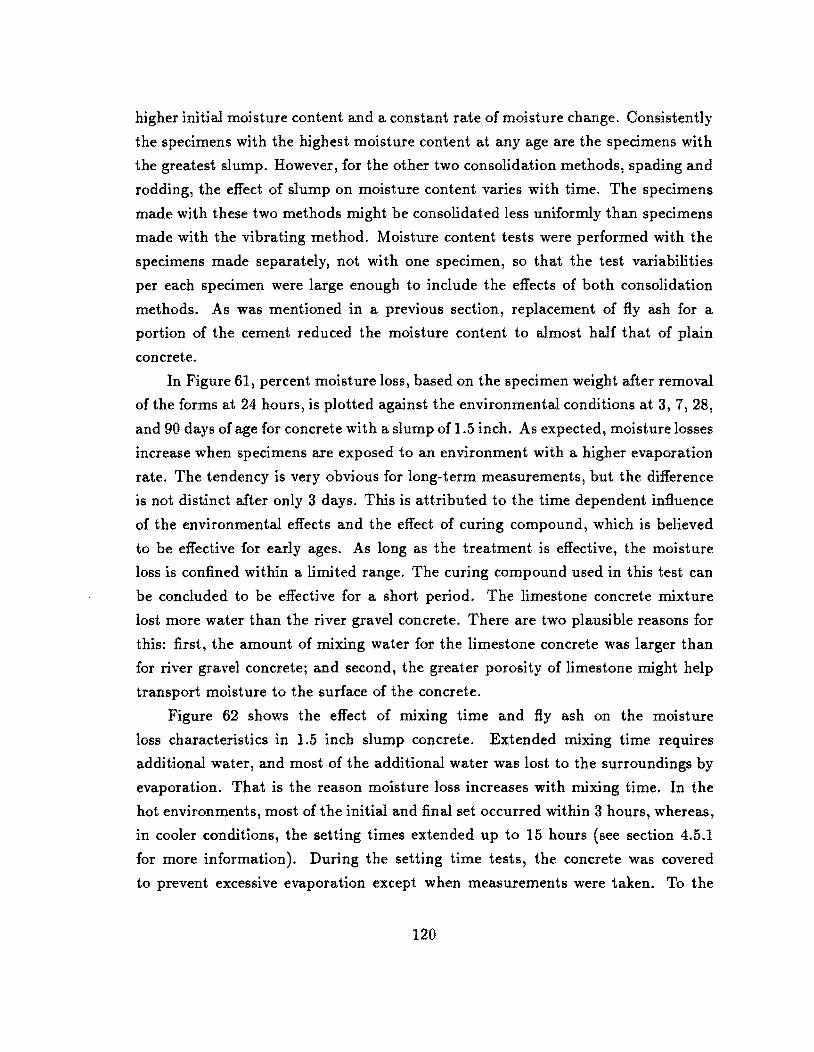
higher initial moisture content and a constant rate of moisture change. Consistently
the specimens with the highest moisture content at any age are the specimens with
the greatest slump. However, for the other two consolidation methods, spading and
rodding, the effect of slump on moisture content varies with time. The specimens
made with these two methods might be consolidated less uniformly than specimens
made with the vibrating method. Moisture content tests were performed with the
specimens made separately, not with one specimen, so that the test variabilities
per each specimen were large enough to include the effects of both consolidation
methods. As was mentioned in a previous section, replacement of fly ash for a
portion of the cement reduced the moisture content to almost half that of plain
concrete.
In Figure 61, percent moisture loss, based on the specimen weight after removal
of the forms at 24 hours, is plotted against the environmental conditions at 3, 7, 28,
and 90 days of age for concrete with a slump of 1.5 inch. As expected, moisture losses
increase when specimens are exposed to an environment with a higher evaporation
rate. The tendency is very obvious for long-term measurements, but the difference
is not distinct after only 3 days. This is attributed to the time dependent influence
of the environmental effects and the effect of curing compound, which is believed
to be effective for early ages. As long as the treatment is effective, the moisture
loss is confined within a limited range. The curing compound used in this test can
be concluded to be effective for a short period. The limestone concrete mixture
lost more water than the river gravel concrete. There are two plausible reasons for
this: first, the amount of mixing water for the limestone concrete was larger than
for river gravel concrete; and second, the greater porosity of limestone might help
transport moisture to the surface of the concrete.
Figure 62 shows the effect of mixing time and fly ash on the moisture
loss characteristics in 1.5 inch slump concrete. Extended mixing time requires
additional water, and most of the additional water was lost to the surroundings by
evaporation. That is the reason moisture loss increases with mixing time. In the
hot environments, most of the initial and final set occurred within 3 hours, whereas,
in cooler conditions, the setting times extended up to 15 hours (see section 4.5.1
for more information). During the setting time tests, the concrete was covered
to prevent excessive evaporation except when measurements were taken. To the
120
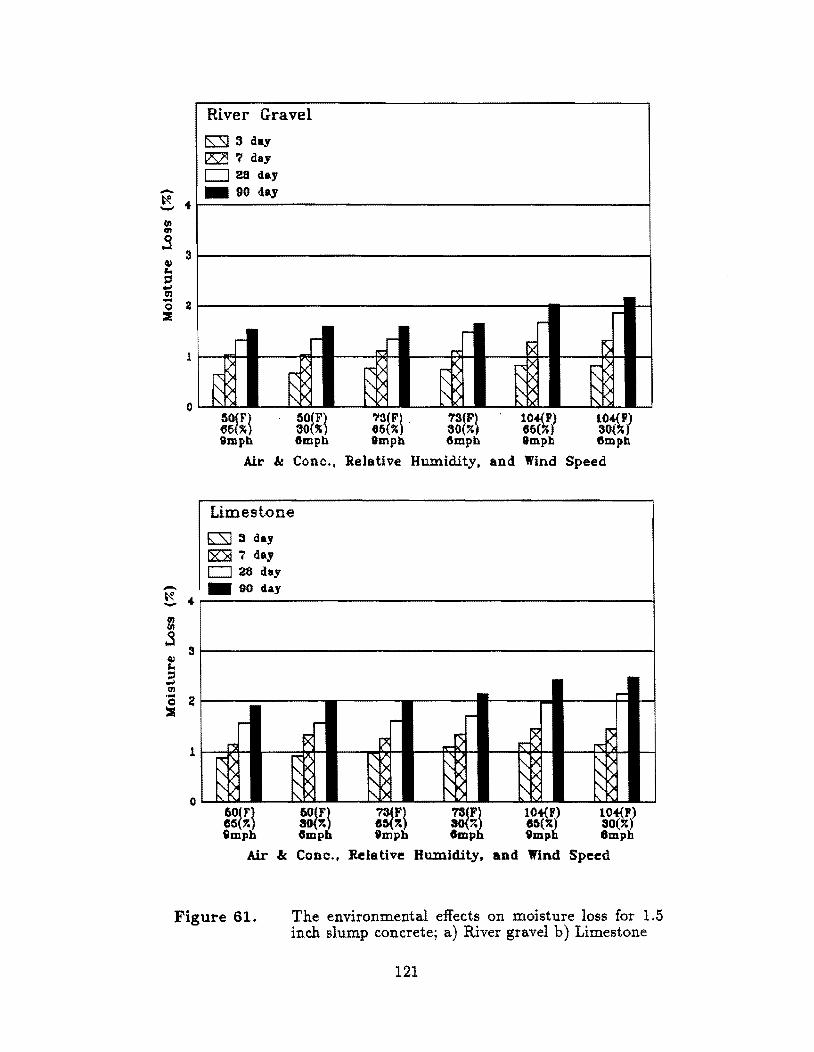
-~ - .. Ul en
oS
1
o
-~ ... -01 Ul
oS 3
41
'" 3 en '0 2 ::s
1
0
River Gravel
ts::SJ :) day ~ 7 day D 28 day _ 90 day
- -
~~ ~ ~~ ggl~) gg1~} 9mph Gmph
Air & Cone.,
Limest.one
!::Sl 3 day
~ 7 day D 26 day
• _ 90 day
~ r-
r".I X ""'> "'" ~~
j'\iX ['\f\<
i'\.~
~
~
-.;:
""'> ,~ ,,> ,,> ,,~ 73(F) 73(F) 66(%) 30(%) Imph Gmph
Relative Humidity.
--~ ~l5
" ['\.1 ~)<
~ ~> ~ ~>
-~
r-.::IX ~IX ~IX
[)('
10#11) 66(~J Imph
and Wind
>< !:'""y
f',.1X ~f>< ~IX
~
> F:~ ~~ 10#11) 30(~J Gmph
Speed
~
,K ~~ ['\~
-
'--
'--
-
-
'--
:g~~} :g~~} ~~\ ~~~ ~~1\11 ~~~l Gmph Gmph tmph Om ph tmph 8mph
Air &: Cone., Relative Humidity. and Wind Speed
Figure 61. The environmental effects on moisture loss for 1.5 inch slump concrete; a) River gravel b) Limestone
121
River Gravel
!S:SI :3 day ~ ? day o 28 day _ 90 4.y
- - r- -r- r-
1 ~ r; 5< R X ~ r-
~~ ~K ~> ~~ r"'X I'.
~~ ,,)< f',X !"-
~~ ,,> !"-~ !"-X ~k o 7min 20mm 60min 7min 20min dOmin
Plain Concrete Fly Ash Concrete
Limestone [S} 3 day ~ 7 day CJ 26 day -~ _ 4-_ 90 clay
gj .s
3 CII
'" r- ~
.3 01 - 2 0 :&
1
r-- - r-
V' -
>< 'r
K r:x: ~~ rs:~ ,~ "",>< r;X ~" rx: ,,1\
~~ "x ~R ~~ r-
,,> f',X ~x 0.l>< !"-X ,,> ,,>< ,,[)< ,,~ f',D< f',~ I\. '--o
7mi.n 20mm (lOmin 7m.in 20min 60min
Plain Concrete Fly Ash Concrete
Figure 62. The effect of mixing time and fly ash on the moisture loss for 1.5 inch slump concrete; a) River gravel b) Limestone
122
contrary, the concrete was mixed in open air, thus allowing for some evaporation
during mixing. Due to this difference in treatment of the concrete, evaporation from
the concrete during mixing was more severe than from the specimens used in the
time of setting tests. When the mixing time was extended to 60 minutes, hydration
proceeded and significant amounts of the mixing water were lost. This resulted in a
reduction in workability and required an addition of water, as previously mentioned.
The same tendencies can be observed for limestone concrete. The only difference is
that limestone concrete loses more water than river gravel concrete.
Figure 63 shows the effects of moist curing and of controlling the material
temperatures on the moisture loss characteristics for 1.5 inch slump concrete. When
the specimens were stored in moist condition, moisture gain rather than loss took
place. The amount of moisture gain varies with the type of aggregate, increasing
with an increase in aggregate porosity. The amount of moisture gain during the
first 3 days was very significant for limestone concrete and was greater than the gain
during the remainder of the curing period investigated. However, this observation
for river gravel is not as significant as for limestone (see also Table D4a in Appendix
D).
When warmer materials are used in the cold environment instead of materials
with the same temperature as the environment, slightly greater moisture loss is
observed at all ages. However, the increment of moisture loss remains almost
constant as a function of age, which means that the temperature difference affects
the test at an early age but not at a later age. The greater moisture loss was also
caused by higher initial mixing water needed due to the temperature difference.
Slightly lower moisture loss was observed when cooler material was used in the hot
environment. The low moisture loss might be caused by the small amount of mixing
water and by the relatively low temperature which produced less porous concrete.
Figures 64 and 65 show the effects of temperature and slump on the moisture
loss characteristics for two different constant relative humidities of 65% and 30%,
respectively. As the temperature increases, an increase of moisture loss is observed.
At the early ages, the effect of temperature on the moisture loss is not significant but
becomes greater with age. When the same tests were performed in a 65% relative
humidity condition, almost the same results were obtained for the entire 90 days,
the only difference being the smaller quantity of moisture loss at later ages. Again
123
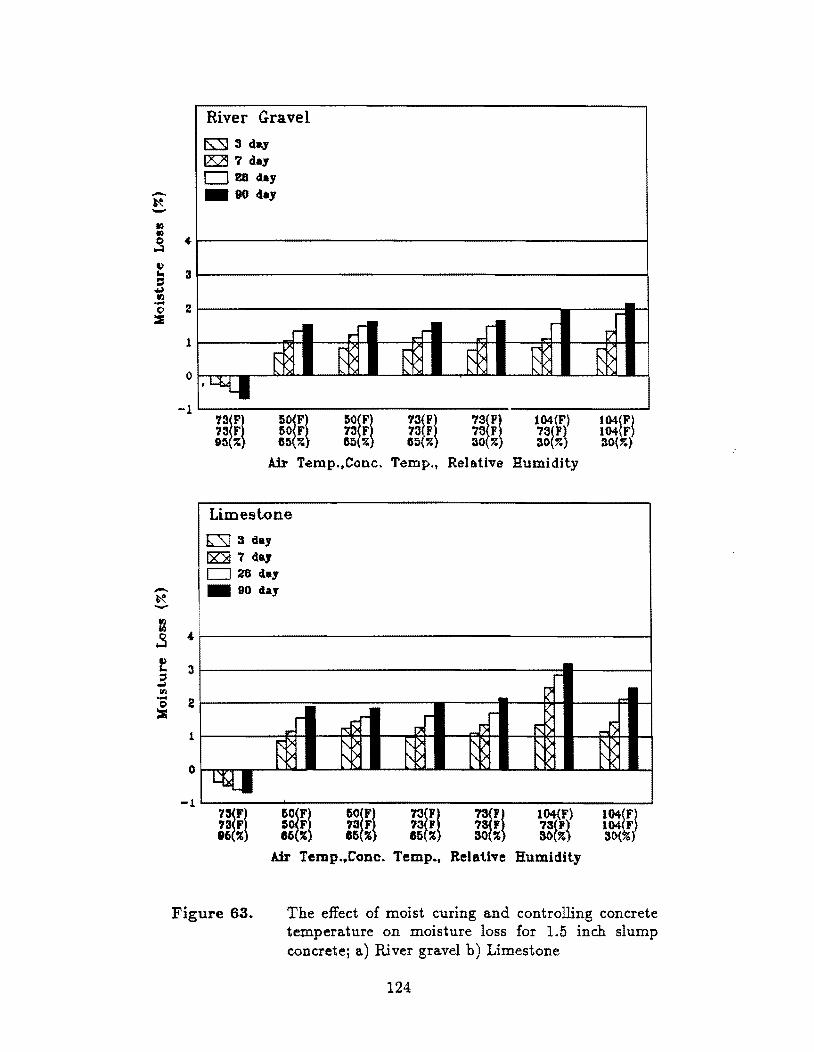
-~ -W) IJ.)
0 ~
II> .. " ~ II) -C> ::I
-~ -II) lI)
oS 11;1 r.. =' ..... III -0 :Jl
" :1
2
1
0
-1
4-
3
2
1
0
-1
River Gravel
rs:::sJ 3 .:lay I2S29 7 day CJ 28 lIay _ DO 46,
r-,...
fk E~ .~
50~Ft 7~ F 65 %
... &
'13{Ft 73 F 65 %
--tR
7siFt 73 F 30 %
r-
ER
lG4(F) 73{1') 30(~)
Air Temp.,Colle. Temp .• Relative Humidity
Limestone
h:SJ :I day ~ 7 <la, 0284 • .1 _ 90 d.ay
V'
r- - r-,~ ro::)( ~
~~ ~)<
~~ ~ 'II' ~)c ,~
T:fU 50~Ft 10 F 86 ~
104(F)
~f~J Air Temp.,Conc. Temp., Relative Humidity
t7
EK K
'> ~> r-.->
104~) 104 F) 3(){)
Figure 63. The effect of moist curing and controlling concrete temperature on moisture loss for 1.5 inch slump concrete; a) River gravel b) Limestone
124
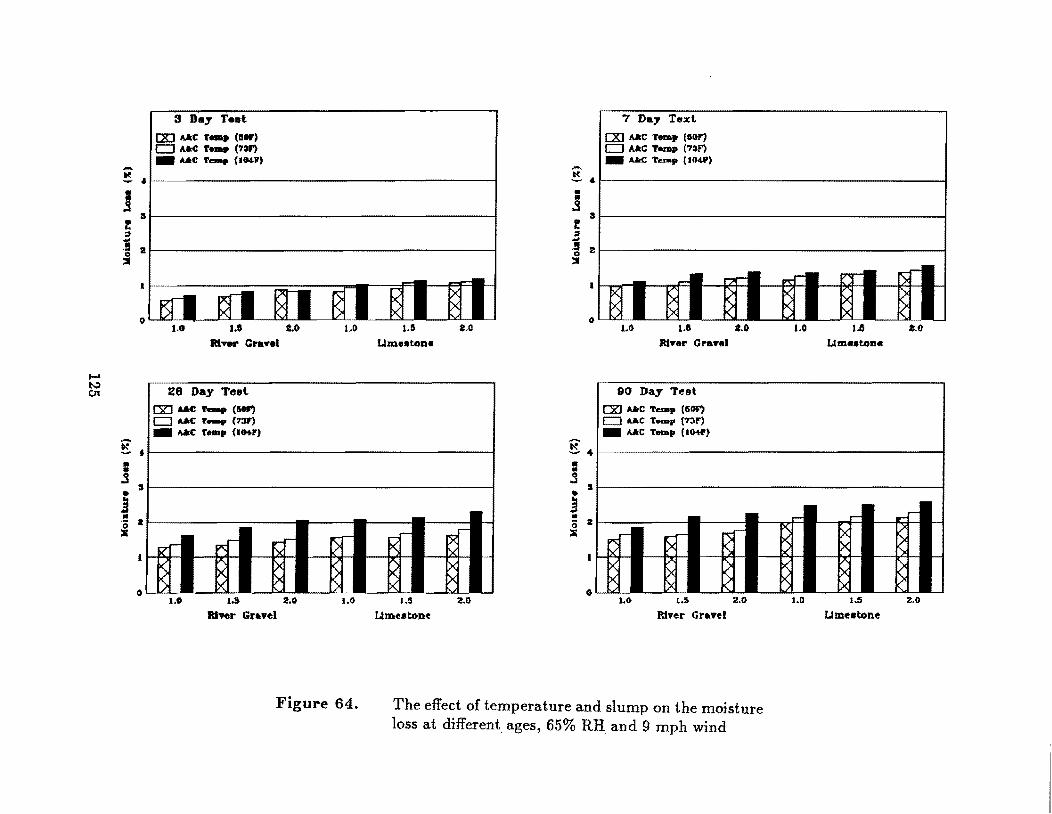
I-' ~ CJl
-
3 nay Te.t [Xl IUtC ,... (lIor) CJ Aloe ..... (73f') _ lUte ,_. (104.11)
~ '~I----------------------------------------------~
J r! .3
arl------------------------------------------~
j 21
o 1 •• 1.D t.o
River Cra .... l
28 Day Teet.
CiZJ AIr4l ...... (!OJ') CJ AAC 1'_. (?:sF) _ IUtC '.81" (11KI')
E f
• • .3 s j • 0 It :II
po;; , ,..' -r rx >< ><
>< >< L.... _ o 1.0 1.5 2.0
lti"Hlr Gn.yel
1.0
r:;' V
~ y
U lJmeatone
,-k fI\
~ 1.0 1.5
lJ mea tone
'.0
-[5<-
'X -X X
-2.0
7 Da, Text
CZlIUtC Tem. (001") CJ Aac hmp (73F) _ .... c T ..... ' (104It)
~ 4~1------------------------------------------------~ • •
oS I! .3
srl----------------------------------------~
.! 21 :r
o
~ ~4
• • .3 :It • 3 •
0 z :II
1.0 1.0
RI .... r Gra .....
90 Day Test
rn AlrC Tesap (C50F') CJ A.IlC T .... p (73") _ IUtC T_ .. (lOW)
.... .- (l' rc;r-t><
f-~I- 1\ [71:
~ I><
o L- ~L- I>< 1.0 L.S 2.0
River Gr .... el
x,
>< ~
X X
1.0
,...
lJJ lJmeatone
, t>< I>< II'-I>< I><
1.0 1.5
lJme.tone
•. 0
..... .-f-
~ :
t<> I-
~ '-
2.0
Figure 64. The effect of temperature and slump on the moisture loss at different, ages, 65% RH, and 9 mph wind
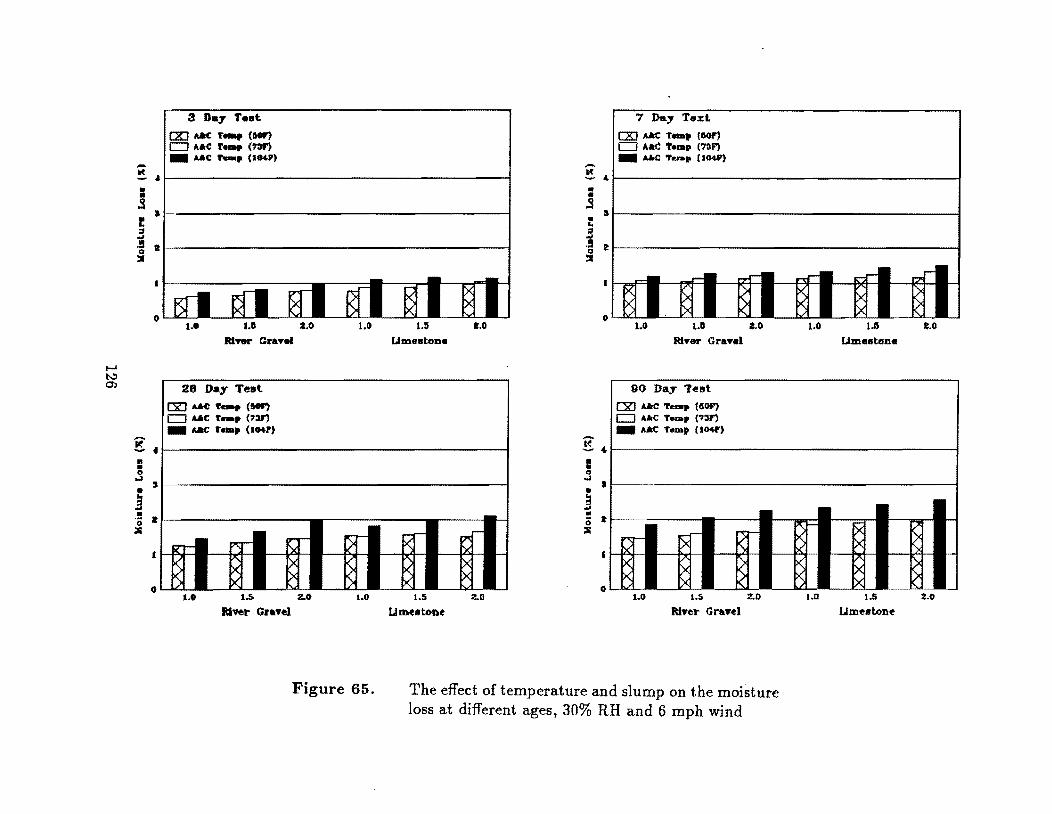
...... to..:) 0')
-3 D.,. Teat
(X] AAlC r.., (II'" c::J A"C r.,.. (7an _ AAC ....... (I04P)
~ '~I-------------------------------------------------------1 J I: ':I ....
I>
.~ 21 ::I
o
i( ..... " II • 0 ~ s • ! • 0 • :II
••• RI.., ... Gray"
28 Day Teet
00 AAC ....... (1101') c::J UC r_. {"~ _ AAIC r_. (IMP)
tr .....
-,= po::r- I'x
"" l>< ;-~ ::x _2;_ o
I •• •• 5 2.0
liver Gr.yel
1.0
c>r-
~
I.~
UmuatoD.
R ..... R x:
1.0 1.S
Llme.tone
1.0
'-
:;:'1-
IX ->< ><
-2.0
.-~" • •
oS :! .3
3
.S 2 Q
::I
o
~ ~<l
1:1 " ...:I
I • 3 • 0 • :II
o
7 Day Text
[XI /lAC 'hap (00P? c::J AIilC t.m. (73F? _ A.6rC '1'....... (10411)
[[ r- .,..-
~ ~ "-
1.0 u 2.0
RtYel" Craftl
90 Day Test
rn A.ltC ........ (50f? c::J A.ltC T...... (731") _ AAlC Temp (l04f')
r-- ~,-"",r-
~r-l>< r> /'
~ >< )<
'- .LL- )< •• 0 1.5 2.0
Rlye.r Crayel
Figure 65. The effect of temperature and slump on the moisture loss at different ages, 30% RH and 6 mph wind
.... r-
~ 1.0
p\r-K b<
~
r-
>< ><
I.e Umeatone
>< >< /'
>< ><
1.0 1.5
Llme.tone
,.,.r- ~ ~ '---
'.0
-~ 0- -~
,~~~ -2.0
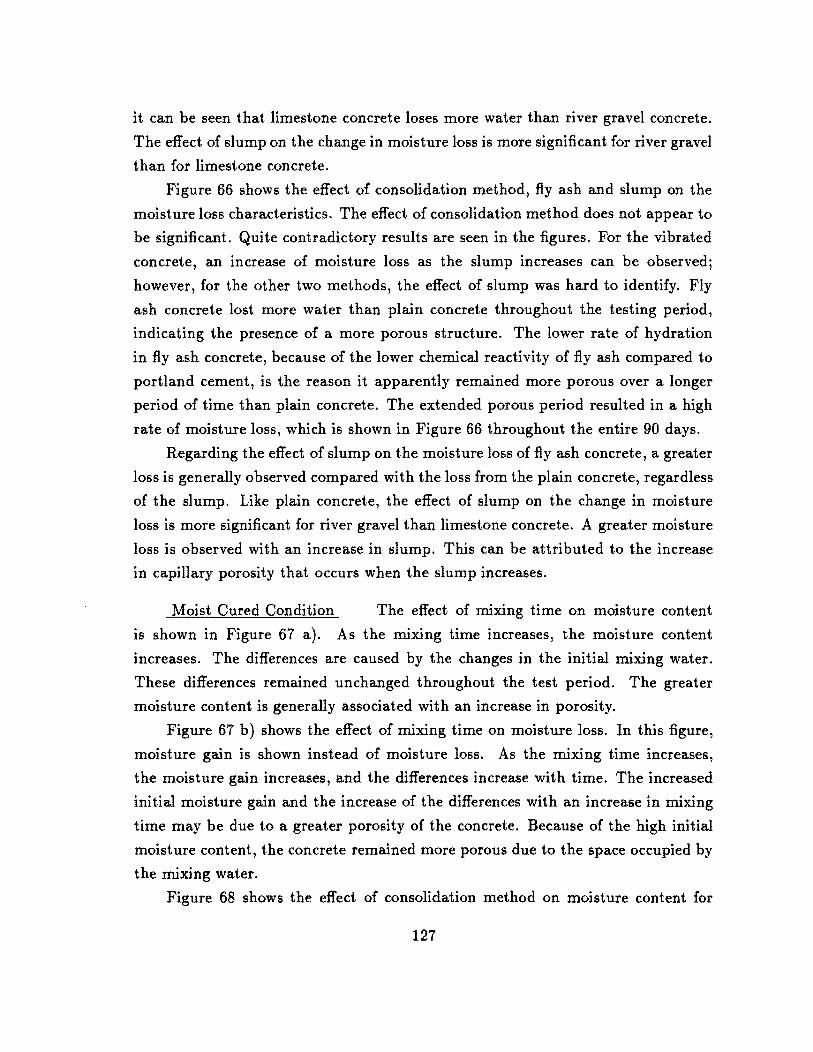
it can be seen that limestone concrete loses more water than river gravel concrete.
The effect of slump on the change in moisture loss is more significant for river gravel
than for limestone concrete.
Figure 66 shows the effect of consolidation method, fly ash and slump on the
moisture loss characteristics. The effect of consolidation method does not appear to
be significant. Quite contradictory results are seen in the figures. For the vibrated
concrete, an increase of moisture loss as the slump increases can be observed;
however, for the other two methods, the effect of slump was hard to identify. Fly
ash concrete lost more water than plain concrete throughout the testing period,
indicating the presence of a more porous structure. The lower rate of hydration
in fly ash concrete, because of the lower chemical reactivity of fly ash compared to
portland cement, is the reason it apparently remained more porous over a longer
period of time than plain concrete. The extended porous period resulted in a high
rate of moisture loss, which is shown in Figure 66 throughout the entire 90 days.
Regarding the effect of slump on the moisture loss of fly ash concrete, a greater
loss is generally observed compared with the loss from the plain concrete, regardless
of the slump. Like plain concrete, the effect of slump on the change in moisture
loss is more significant for river gravel than limestone concrete. A greater moisture
loss is observed with an increase in slump. This can be attributed to the increase
in capillary porosity that occurs when the slump increases.
Moist Cured Condition The effect of mixing time on moisture content
is shown in Figure 67 a). As the mixing time increases, the moisture content
increases. The differences are caused by the changes in the initial mixing water.
These differences remained unchanged throughout the test period. The greater
moisture content is generally associated with an increase in porosity.
Figure 67 b) shows the effect of mixing time on moisture loss. In this figure,
moisture gain is shown instead of moisture loss. As the mixing time increases,
the moisture gain increases, and the differences increase with time. The increased
initial moisture gain and the increase of the differences with an increase in mixing
time may be due to a greater porosity of the concrete. Because of the high initial
moisture content, the concrete remained more porous due to the space occupied by
the mixing water.
Figure 68 shows the effect of consolidation method on moisture content for
127

..... to..) 00
3 Day Tellt
[Z] apeAbl. CiZ] Ro4c1Jq D Ya1o.( ...... '
; I _ "".(Ply .AIIb) - ...
! r 3
.~I------------------------------------------;
.! 81 ::I
0' V''1 _ WI _ .I _ 1£1)4 _ I VI _ '# _ ,
• .e ... •• 0
Rl" .. en .....
28 Day Teat
CZJ· ....... (2] ltod.u.. c::J YaIl.(PIaIa,
iF ~ f
_ "1I.(Pl)' AlIIl)
I <:I ...,
s • ! • 0 It :Il V "'5 17 ~
v ~
v ;X I' / ;>< o
1.0 1.5 2.0
Riftr Gruel
I'
1.0 1.11
Llm •• tone
vI< K k
K
1.0 1.5
lJrne8tone
11.0
I
t><
I><
I><
2.0
.-t( - " • .' .3 • .. 3
a
~ 2
o
-. l( .... 4
• 3 ..., s •
.3 • 0 It :Il
t
0
7 Da,. Teal
CZJ SpadbIC CSll Ro4dJ.Jtc' c::J "b.(PW.) _ "b.(n7 .AII1l)
..... -~ ~ >
> 1.0 l.D a.o
RI'rer Gra"e.
90 Day Test
CZ! 9paMq [SCI ltodr.l.l.q c::J "b.(PJaJD) _ "b.(n,. Mil) --~
11"f-
R pc ~
K I>< ~
)< )< v v)<
k V\ 1.0 U. 2.0
Rlyer Gnnl
Figure 66. The effect of consolidation method, :fly ash, and slump on the moisture loss at different ages
v 0('
v' '\ 1.0
f.,
K ~
'\ <
v~ IX
VI>< V
1.0
Llm •• tone
~
Vi><
>< ><
1.0 1.5
lJm.e8ton.e
,...
V)c V)c
11.0
/bo-
I> I>
I> l>< 2.0
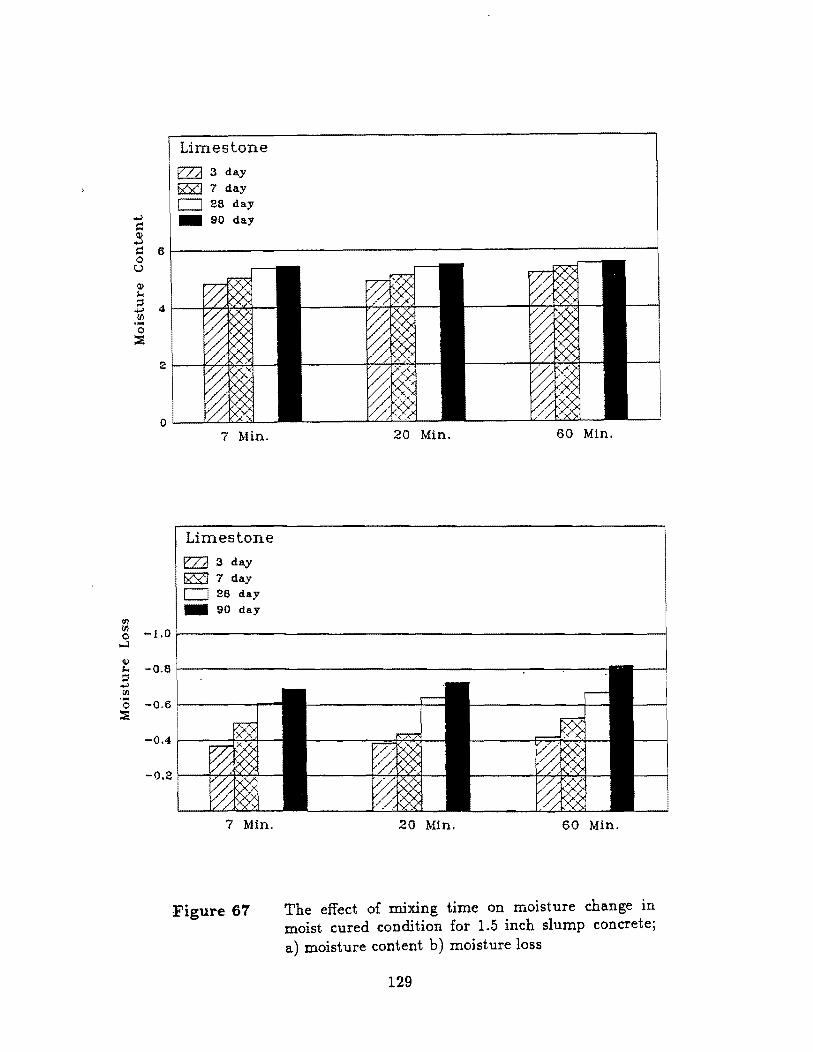
f/I f/I 0
...J
IV
""' :l ...., rtl .... 0
;:.:it
..,.J
=
Limestone
EZa 3 day
~ 7 day 28 day
_ 90 day
.s = 6r-------------------------------------------------------~ o c..>
'1l
""' .e 4 1-----4:.,L,4;4;4;l----'
.!!l o
;:.:it
-1.0
-0.8
-0.6
-0.4
-0.2
7 Min.
Limestone
EZA 3 day
fi2SCJ 7 day c::J 28 day _ 90 day
7 Min.
Figure 67
20 Min. 60 Min.
20 Min. 60 Min.
The effect of mixing time on moisture change in moist cured conclition for 1.5 inch slump concrete; a) moisture content b) moisture loss
129
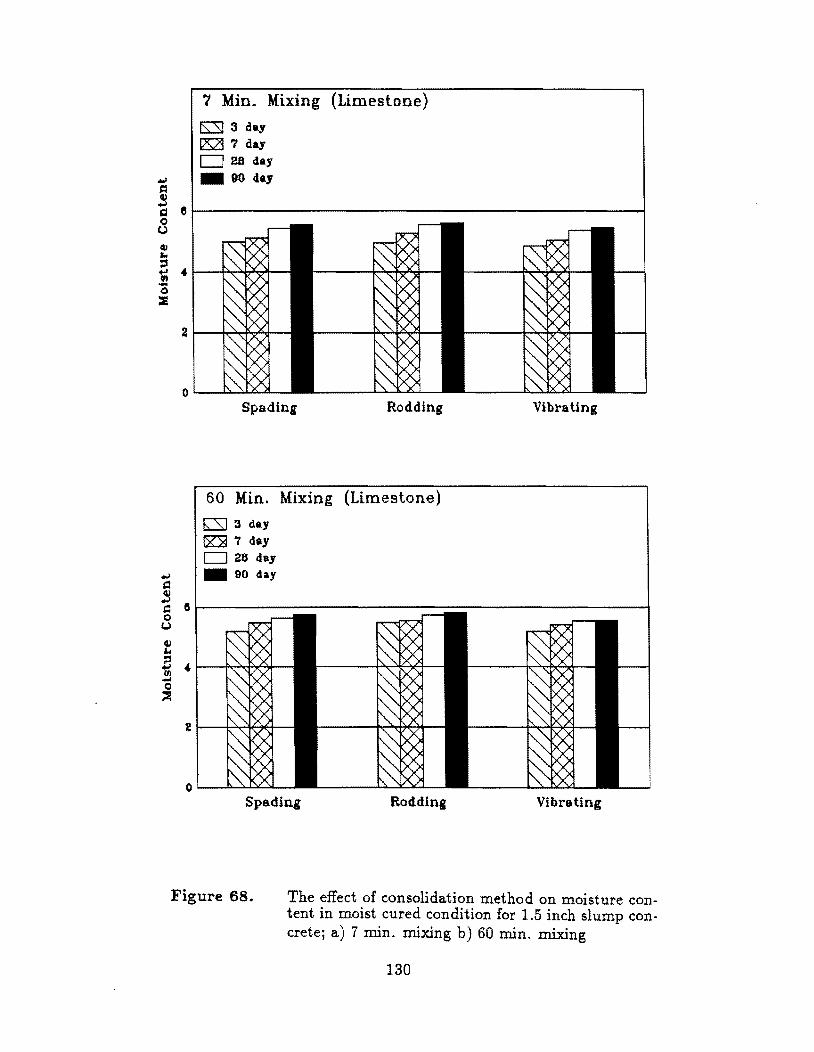
'( Min. Mixing (Limestone)
rs::::s! 3 d.y ~ "I day 028 day
~ III 90 day J:;
~ c 8~------------------------------------------------1 o c.J III ... =' ~ "I----j:.~~r__ -o :E
Spading Rodding
60 Min. Mixing (Limestone)
E:SJ 3 day
rR'2l 7 day o 28 day
~ III 90 day ,;= III
Vib:rating
~ e~------------------------~==~------------------1 o u III
" oS "I----f'~t?t_lor_-III .... o ~
Spading Rodding Vibrating
Figure 68. The effect of consolidation method on moisture content in moist cured condition for 1.5 inch slump con-cretej a) 7 min. mixing b) 60 min. mixing
130
7 and 60 minute mixing times. The vibrating method shows the lowest moisture
content. The rodding method shows slightly higher moisture content than the
spading method. The observations were true for both mixing times. Lower moisture
content means the concrete has less porosity. However, the effect of consolidation
method in this environment was not as distinct as the effect in the hot and dry
environment.
Figure 69 shows the effect of consolidation method on moisture loss for 7 and
60 minute mixing times. The smallest and greatest moisture gain occurred in the
vibrated and rodded concrete specimens. For the 60 minute mixing, the increase in
moisture gain was more distinct for the rod ding method.
4.4.3 Conclusion
The following conclusions are based on the results ofthe laboratory tests for the
shrinkage and weight loss of concrete. The conclusions are divided into two sections
that refer to the results of the shrinkage and associated weight loss experiments,
and the moisture content and moisture loss tests.
Shrinkage and Weight Loss:
1. The 90 day shrinkage values were found to be affected by the environmental
conditions, increasing in order of increased evaporation rate.
2. Limestone concrete showed significantly higher shrinkage than rIver gravel
concrete, because limestone concrete requires a greater initial water content
to produce the same slump. The higher water requirement may be due to
differences in surface texture and shape of the aggregate.
3. Next to aggregate type, water loss is the most important single factor affecting
shrinkage.
4. Extended mixing time affects early shrinkage slightly and has no affect on
long-term shrinkage.
5. For the particular source of fly ash used, there is no significant change in
shrinkage when fly ash replaces 20% by weight of the cement on a 1:1 basis.
6. The variations of shrinkage for limestone concrete are greater than that for
river gravel concrete.
7. Controlling material temperature did not change shrinkage significantly.
131
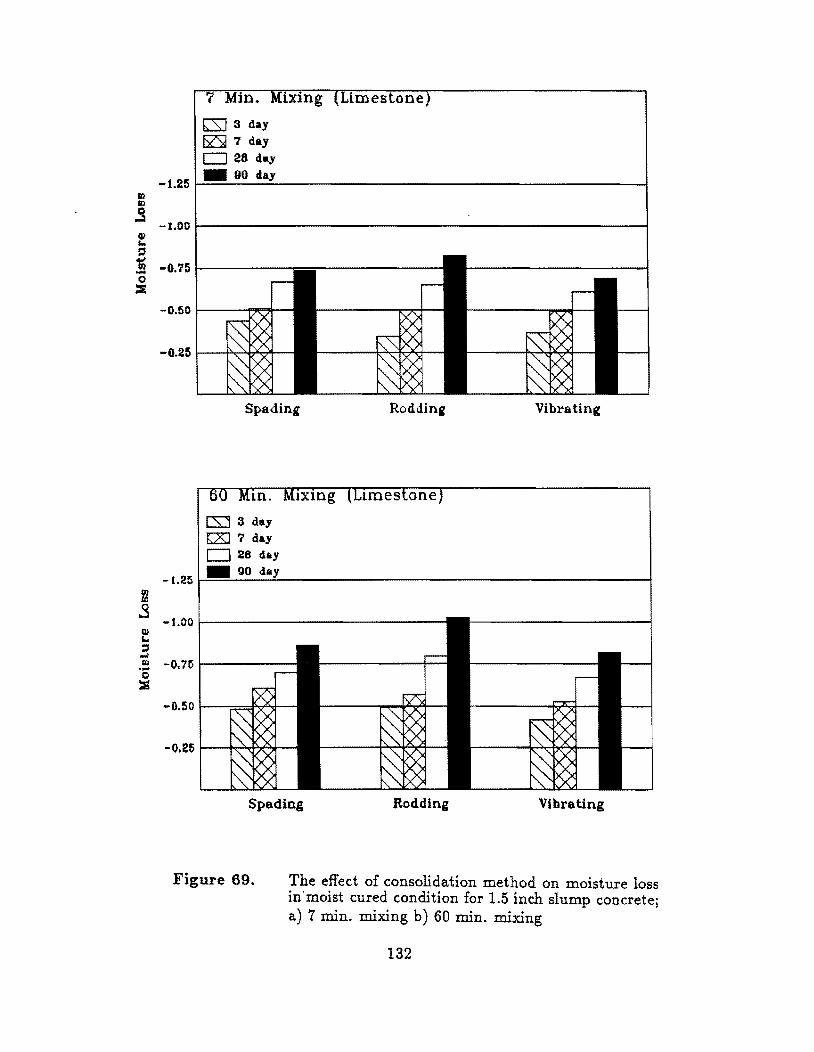
DI III
.3 ~ ... ~
[S] 3 day
EZSl 7 day CJ 28 day
-1.25 1-..!!!!!!!!!!!...=9.:.0 .....:cl::a!..y --------------------1
-1.001---------------------------1
:! -0.751-----o ::I
III rtl .s w s.. :s -III .... Q
~
-0.50 I---~,*--
-0.25 ~--+",<-,,~7"t--
Spading Vibrating
-1.25
-1.00
-0.7r>
-0.50
-0.25
Spading Vibrating
Figure 69. The effect of consolidation method on moisture loss in'moist cured condition for 1.5 inch slump concrete; a) 7 min. mixing b) 60 min. mixing
132
8. The different consolidation methods did not cause any significant change in
shrinkage.
9. The correlations between shrinkage and weight loss are almost linear and are
affected by the type of aggregate. The replacement of fly ash affects the
correlations slightly. However, the correlations are not affected by the curing
conditions.
Moisture Content and Moisture Loss:
1. The moisture content at early ages depends primarily on the initial amount of
mixing water which was increased slightly as the evaporation rate increased.
However, the moisture content at ages later than 28 days decreases significantly
as the evaporation rate increases because of the accumulative effect of drying.
2. The moisture content and the rate of moisture loss decrease with age, and
approach an equilibrium condition. This condition depends on the pore
structures generated during the specific curing condition.
3. The extended mixing time increases both the moisture content and moisture
loss and is proportional to the required increase of initial mixing water to
maintain slump.
4. Fly ash concrete seems to have almost the same pore structure as plain concrete.
Therefore, the rate of moisture loss for fly ash concrete up to the age of 28 days
remains almost equal to that for plain concrete.
5. Fly ash concrete appears to lose most of the evaporable water within 28 days,
causing the subsequent moisture changes to be insignificant.
6. The limestone concrete specimens have initially almost the same moisture
content as river gravel concrete. At later ages, however, the moisture content of
limestone concrete is lower than in river gravel concrete. Therefore, limestone
concrete appears to be more porous than river gravel concrete.
7. The effect of controlling material temperature on moisture content was not
observed to be significant. When material temperature is controlled in a
cold environment, moisture content is increased significantly, but moisture loss
characteristics are not changed. In a hot environment, moisture content and
moisture loss are not affected by the change in material temperature.
8. The effect of the consolidation methods on both the moisture content and
moisture loss characteristics is not significant enough to be clearly observed in
the tests conducted.
133
4.5 Time of Setting and Abrasion
4.5.1 Time of Setting
Time of setting is controlled by the rate of hydration, which is affected by the
temperature. The specimens for time of setting tests were covered to minimize
the effect of evaporation except during measurements, and therefore had almost
no chance of moisture loss due to evaporation. Under field conditions, however,
concrete might lose part of the mixing water through evaporation and cause an
acceleration of the setting time.
Figures 70 through 72 show the effect of temperature on time of setting for
different slumps and both aggregate types. Overall the setting times at 50°F ranged
from 9 to 11 hours for initial time of setting, and from 13 to 15 hours for final
setting, with the lowest values occurring for the lowest slump mixtures. At 73°F,
initial setting occured at 3 to 4 hours and final setting at 4 to 6 hours. At 104°F,
both setting times are shorter than for the lower temperature conditions. Initial and
final setting times were about 2~ and 3~ hours, respectively. The changes of setting
time from 50°F to 73°F are greater than the changes from 73°F to 104°F. The
difference between the two setting times decreased as the temperature increased and
the setting times decreased. The elapsed time between initial and final setting time
at 50°F was about 4 to 5 hours, whereas the elapsed time at a greater temperature
was 1 to 1.5 hours.
In the same figures, the effect of material temperature on setting time can
be seen. Warmer materials in a cold environment reduce both the initial and
final setting times. The shorter setting time is caused by a faster hydration due
to the increase in mix temperature. Correspondingly, cooler materials in a hot
environment decrease both setting times. However, the increase of setting time
in a hot environment is not as significant as the decrease of setting time in a
cold environment. In other words, controlling the material temperature in a cold
environment is more effective than in a hot environment in changing the setting
characteristics. Controlling material temperature significantly affects the setting
time. The concrete temperature eventually matches that of the environment. The
effect of controlling material temperature can last only a few hours or, at best,
a day. Time of setting is an early age property of concrete, and occurred within
134

1e~--------------------------------------------------,
115
D INITIAL _ FINAL
- 12
~ 0 .c iii -w .9 .... 6
o '----'-----~o 50 50 73 7a '13 104 "13 J04 104
Air Temperalure and Concrete Temperature (·F)
16
15 D tNmAL _ PINAL
,....... 12
" '"' , 0 .tl a ....... IU a ... i- S
3
o '----'-----60 60 60 13 13 73 104 73 10.. 104
Air TemperalUl"e and Concrete Temperature (-F)
Figure 70. The effect oftemperature on setting time, for 1.0 inch slump sealed concrete
135
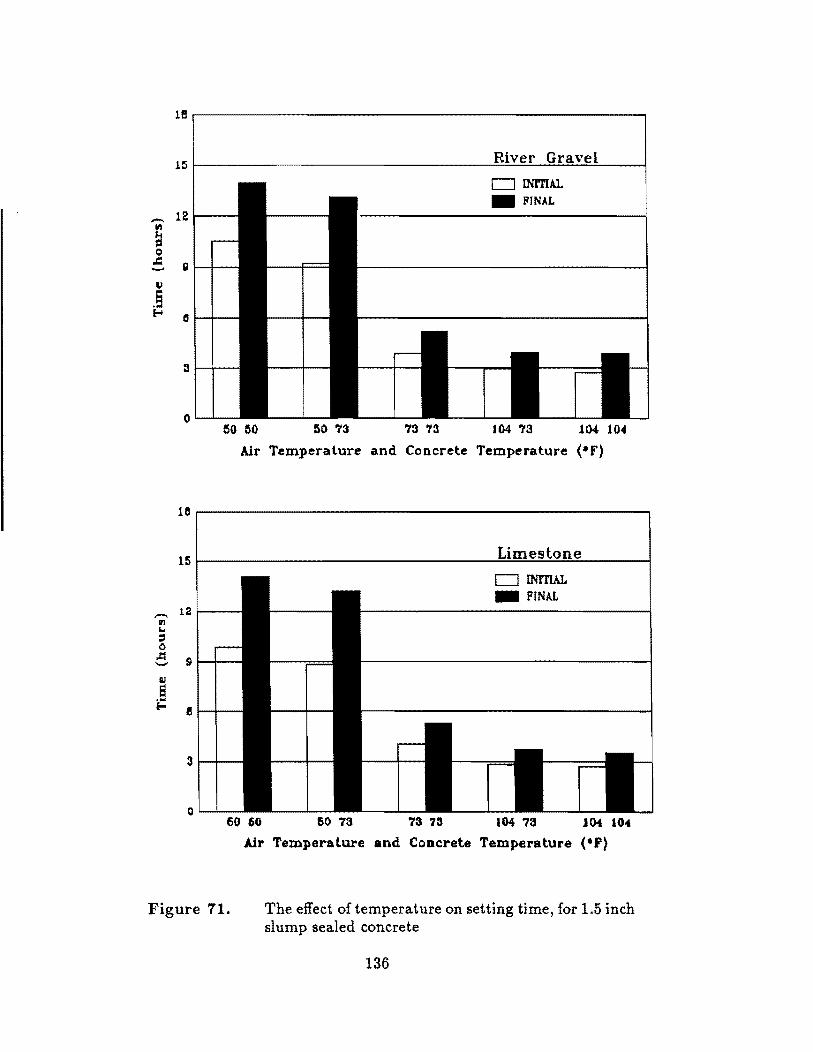
l~
Hi River 1
o INITIAl. _ FINAL
- 12 If!
a 0 .c: g -~
.§ f-i
" :5 1--1---
0'--'---50 50 50 73 73 '13 t04 73 104 to"
Air Temperature and Concrete Temperature (.F)
18
15 Limes
o INITIAL _ PINAL
,-.., 12 III ... ::l 0 .tI 9 '-'
QJ
a ... E- li
3
60 60 50 73 73 73 104 73 104 104
Air TemperalUl'e and Concrete Temperature (iF)
Figure 11. The effect of temperature on setting time, for 1.5 inch slump sealed concrete
136
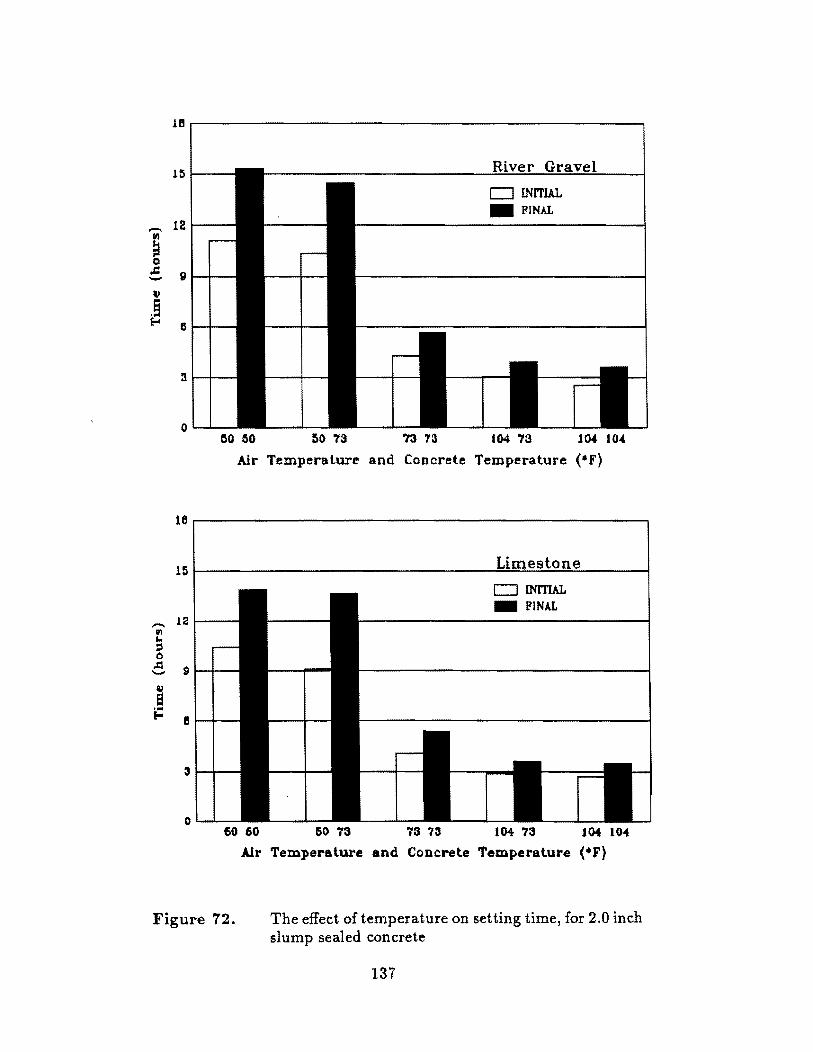
1Br-------------------------------------------------~
Hi
CJ INITIAL _ PINAL
-. 12 1/1
~ CI .c: 9 -" .§ t- IS
M 60 50 73 73 73 1()4 73 104 10.c
Air Temperature and Concrete Temperature (*F)
16
15 CJ INITIAL _ PINAL
....... 12 In ... ::l 0 A 9 '-'"
II a ... t- II
3 t--t---
o L..-L..-_
60 60 ~O 73 73 73 104: 73 104 104
Air Temperature and Concrete Temperature (*F)
Figure 72. The effect oftemperature on setting time, for 2.0 inch slump sealed concrete
137
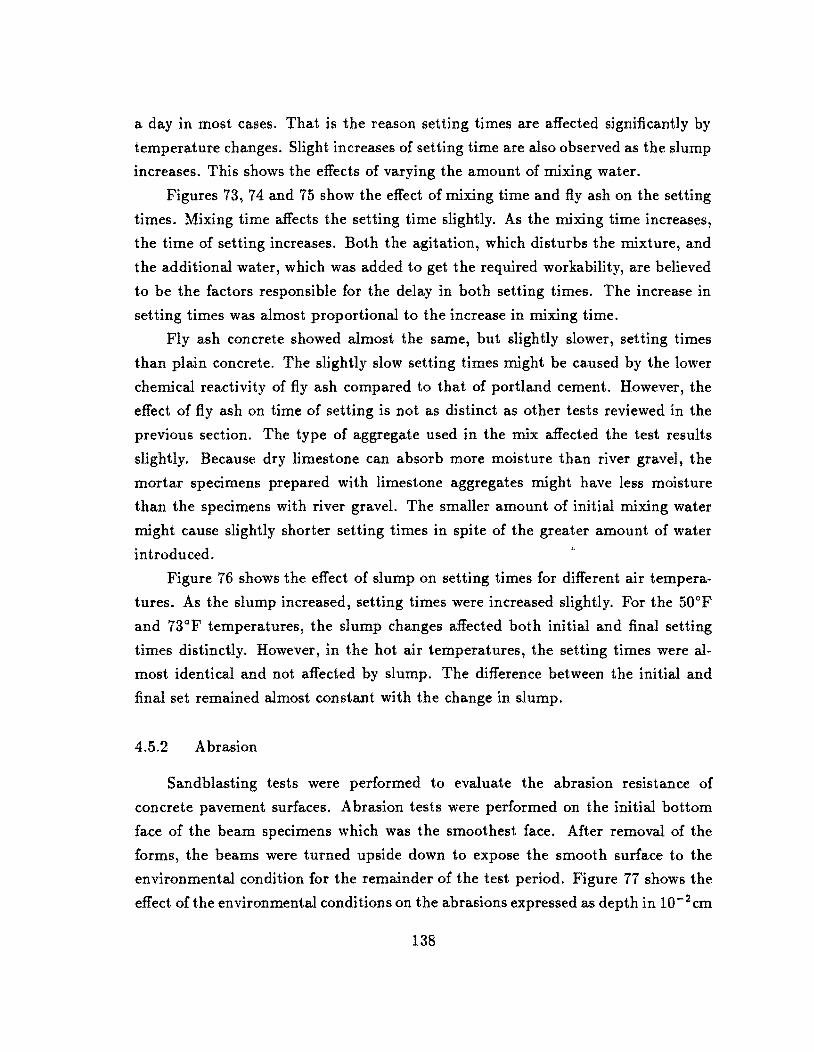
a day in most cases. That is the reason setting times are affected significantly by
temperature changes. Slight increases of setting time are also observed as the slump
increases. This shows the effects of varying the amount of mixing water.
Figures 73, 74 and 75 show the effect of mixing time and fiy ash on the setting
times. Mixing time affects the setting time slightly. As the mixing time increases,
the time of setting increases. Both the agitation, which disturbs the mixture, and
the additional water, which was added to get the required workability, are believed
to be the factors responsible for the delay in both setting times. The increase in
setting times was almost proportional to the increase in mixing time.
Fly ash concrete showed almost the same, but slightly slower, setting times
than plain concrete. The slightly slow setting times might be caused by the lower
chemical reactivity of fiy ash compared to that of portland cement. However, the
effect of fiy ash on time of setting is not as distinct as other tests reviewed in the
previous section. The type of aggregate used in the mix affected the test results
slightly. Because dry limestone can absorb more moisture than river gravel, the
mortar specimens prepared with limestone aggregates might have less moisture
than the specimens with river gravel. The smaller amount of initial mixing water
might cause slightly shorter setting times in spite of the greater amount of water
introduced.
Figure 76 shows the effect of slump on setting times for different air tempera
tures. As the slump increased, setting times were increased slightly. For the 50°F
and 73°F temperatures, the slump changes affected both initial and final setting
times distinctly. However, in the hot air temperatures, the setting times were al
most identical and not affected by slump. The difference between the initial and
final set remained almost constant with the change in slump.
4.5.2 Abrasion
Sandblasting tests were performed to evaluate the abrasion resistance of
concrete pavement surfaces. Abrasion tests were performed on the initial bottom
face of the beam specimens which was the smoothest face. After removal of the
forms, the beams were turned upside down to expose the smooth surface to the
environmental condition for the remainder of the test period. Figure 77 shows the
effect of the environmental conditions on the abrasions expressed as depth in 1O-2cm
138
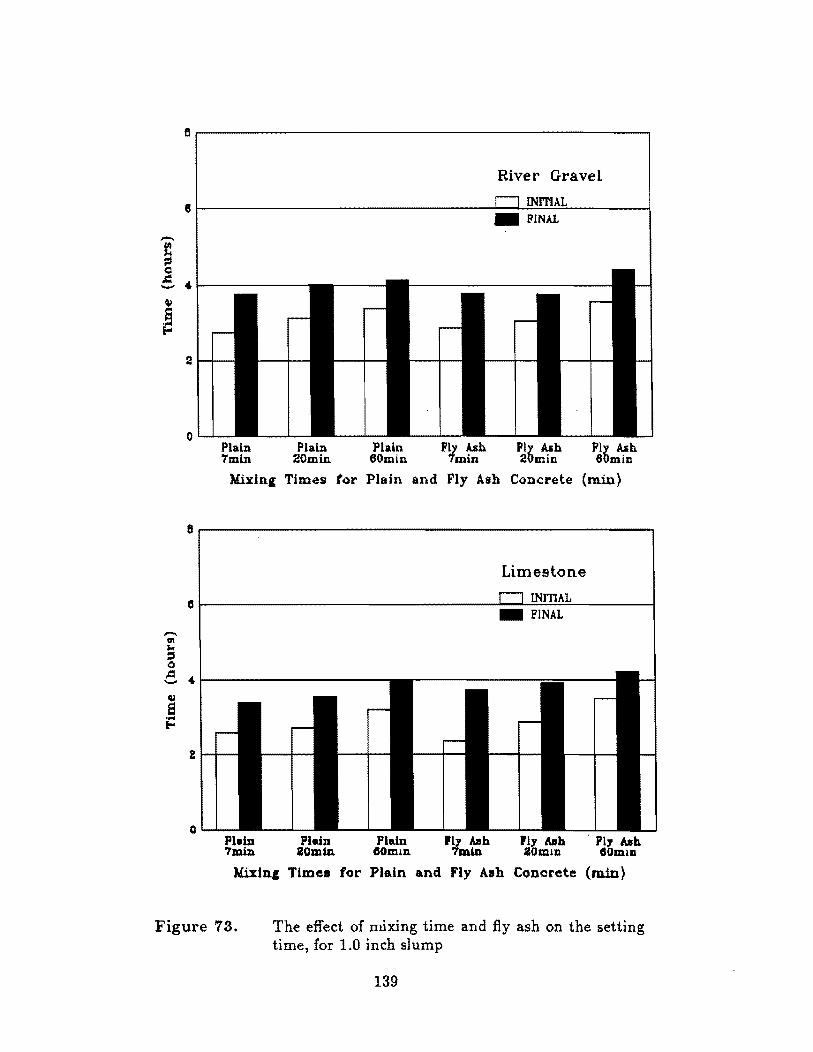
8~----------------------------------------------~
River Gravel
8~------------------------------~~~~~--------~ _ FINAL
-S Q
.:5...1----------\l
.§ r.o
,.... 1ft ... ::t 0
..c:! ...... w a -l-
o Plain Plain Plain Fly ~h Fly Alh Fly Alh 7min 20min eOmin 7mm 20min 60min
lfixin, Times tor Plain and Fly Ash Concrete (min)
e~------------------------------------------------~
e
"-
t
o Pl.in 7lDin
Plain 10m in
Pl.in eOmlD.
PLy Aab 7min
Limeslone
INmAL _ PINAL
PI, Alb aOmlD
Ply Alh GOmlD
lfi:xin, Times for Plain and Fly Alh Concrete (min)
Figure 73. The effect of mixing time and fly ash on the setting time, for 1.0 inch slump
139
-01
~ C .c -q)
.§ f-'
,-... en
'" ;l 0 .l:I '-'
(U
S -po
8
6
"
2
o Plain 7min
Plain 20min
Plain eOmin
FLy ~h 7mlD
River Gravel
_ FINAL
Fly Aah 20min
Fly Aah 60min
Mixinf Times tor Plain and Fly Ash Concrete (min)
8.-------------------------------------------------,
6
04-
2
o Plain 7min
Plain 20min
Pl.in GOmln
Fly ABh 7min
Limeslone
_ FINAL
Fly ABh 20mln
Fly AJlh GOmin
MixinC Times for Plain and Fly Alh Concrete (min)
Figure 14. The effect of mixing time and fly ash on the setting time, for 1.5 inch slump
140
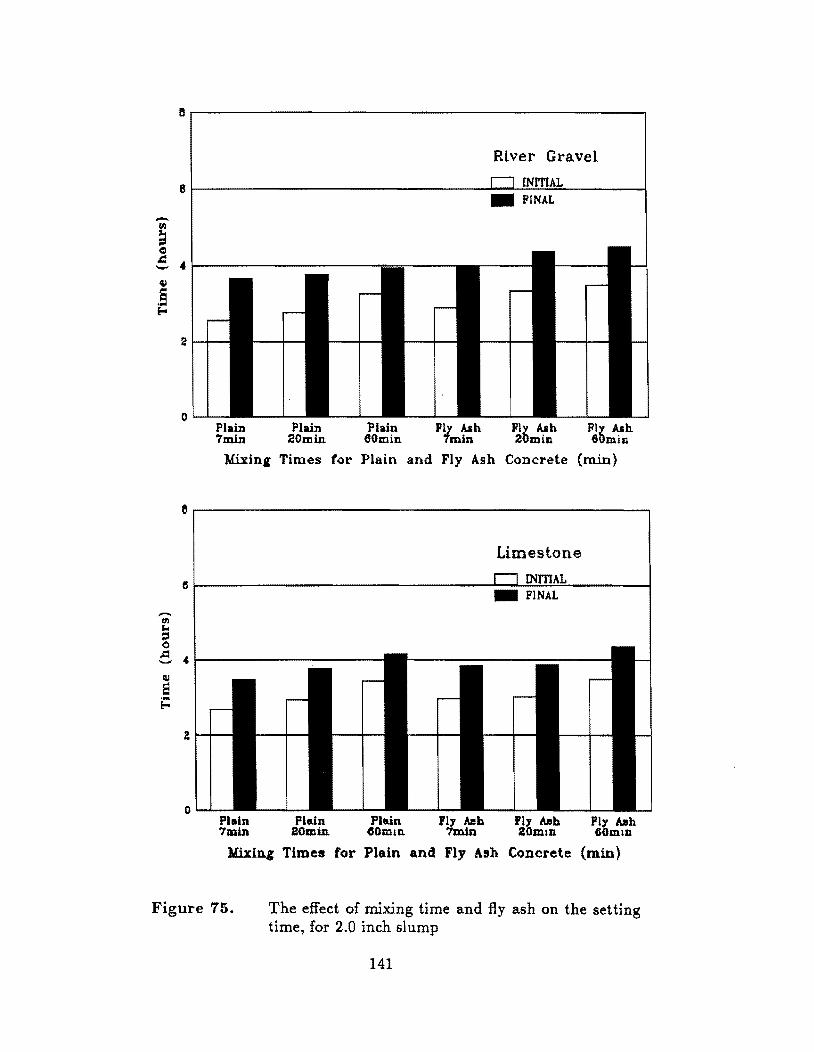
-UI
~ c ..: -41
.9 ~
,....... III
'" :::s c
B
Rlver GraveL
6 INrrlAL _ PINAL
4-
2
o Plain Plain Plain Ply ~h Ply Ash Fly Ash 7min 20m in 60min 7mm 20m in 60min
MiJl:in( Times tor Plain and Fly Ash Concrete (min)
e~--------------------------------------------------~
Limestone
a~--------------------------------~~~~~------~ _ PINAL
~ .~------------------~ Q.I
E E=
2
o PIIdn
GOm1ll 'ly hlh 7min
Fly AlIh 20mlD
Ply AlIh GOmlD
Mixing Times for Plain and Fly Ash Concrete (min)
Figure 75. The effect of mixing time and fly ash on the setting time, for 2.0 inch slump
141
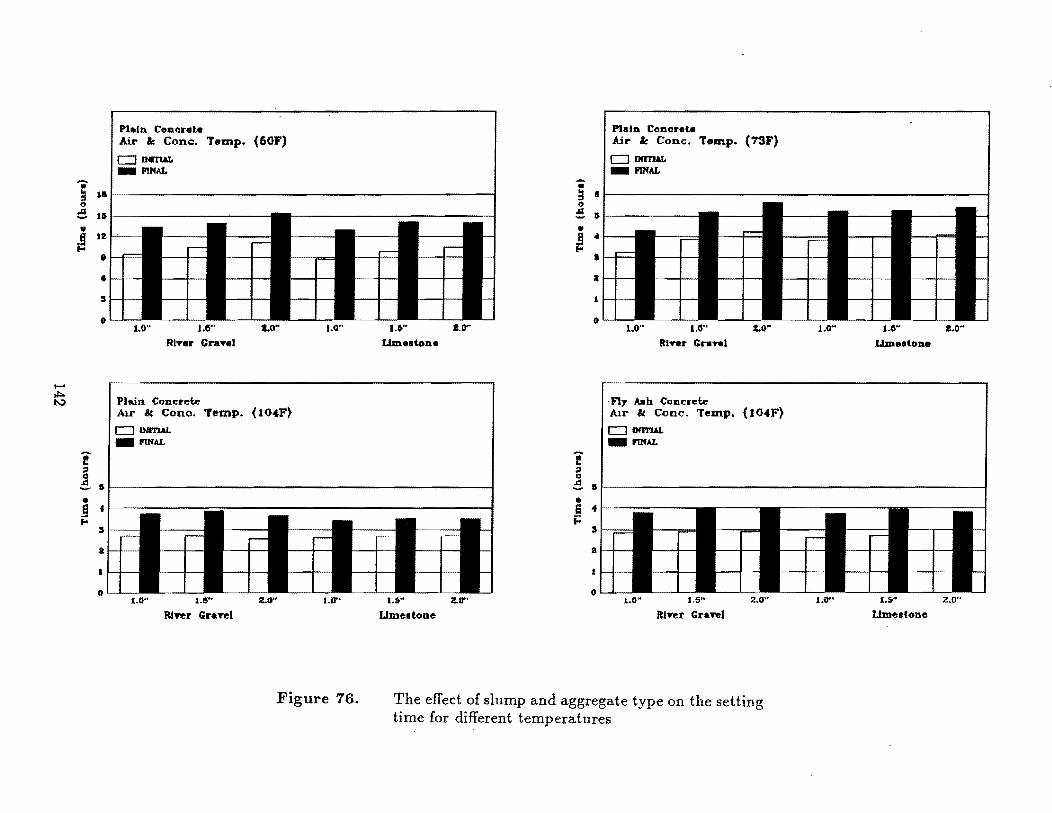
Pl-.lI1 Cont'lretAt Air " Cone. Ttllnp. (60F)
CJ lNITI&L _ PINAL -• ~ I .. 0 e " ~ •
• :s
.. U" 1.CS·· i.0'" 1.0"
RITer GraTe I
...... ~ I Plain Conc:reb: ~
AU" 08( Con~. Temp. (I O.F)
CJ INITIAL _ PINAL
e ~
! 5 e .§ f ..
s
a
lit 1.0" 1.51>' 2.0" 1.0"
RiTer Graftl
Figure 76.
Plall1 Cont'lretAt Air " Cone. Tem.p. (73F)
CJ llfIl'JAL _ PINAL
.-• ~ II 0 e Il
• ! ..
• II
.. I.C.'· i.1r 1.0" US" i.0"
Ume.tol1e RITer Gruel
. lily A..h Coneweb: AIr & Cone. Temp. {JO.F}
CJ OOTW. _ PINAL
e ~ 0 .e 5 e G " t::
s
a
.. 1.&" 2.0" 1.0" 1.5" 2.0"
L1me.tone Itlftr GraTeI
The effect of slump and aggregate type on the setting time for different temperatures
1.0" •. c." 2.0"
Um.st.olle
1 .. 0" 1.&" 2.0"
LImestone
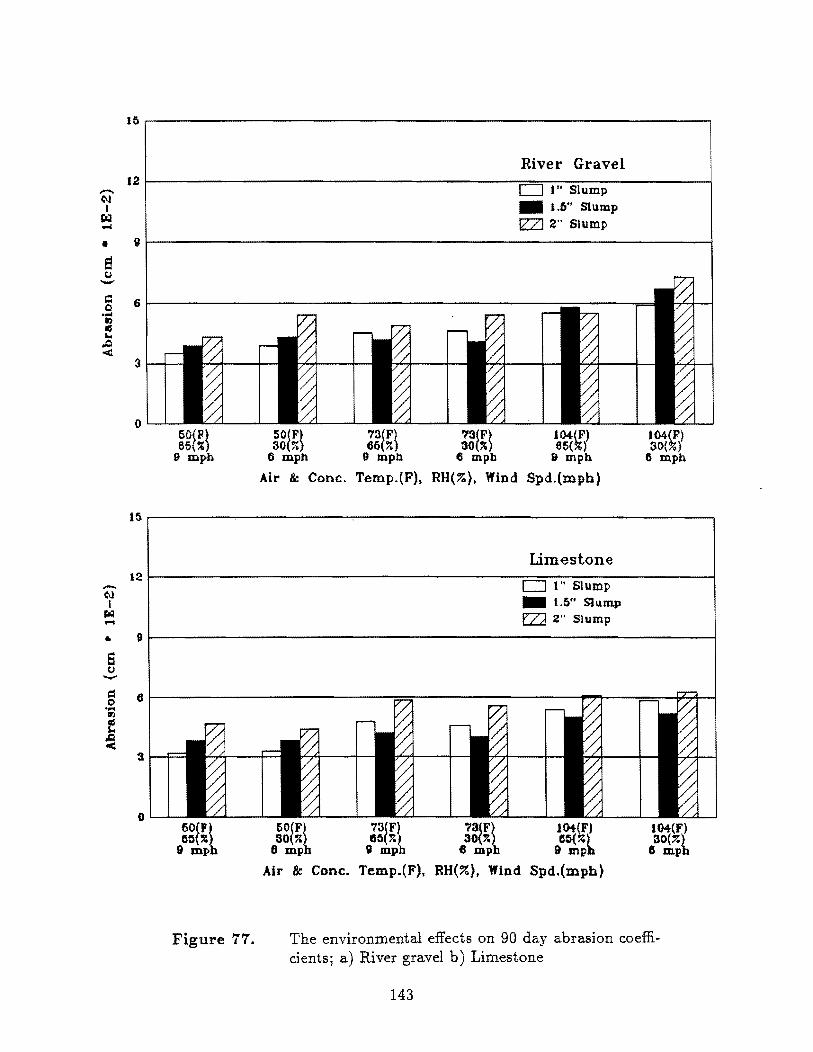
-C\l I
CIQ .... • S IJ -C 0 .... 0)
III ... ~ -<
-CIJ I
r.:l -
15
12
9
6
3
o 50(P) . 66{~)
9 mph
50(F) 30(%)
6 mph
Air & Cone.
'73(F) 66(~}
9 mpb
Temp.(F).
River Gravel
til Slump _ 1.:;" Slump
!ZZl 2" Slump
~gl~~ V~t~l ., mpb 9 mph
RH(%), Wind Spd.(mph)
l04(F) 30(%)
6 mph
t5r---------------------~--------------------------------------~
Limestone 12~--------------------------------------~~~----------------~ CJ I" Slump
_ 1.5" Slump
EZl 2" Slump
• 9~------------------------------------------------------------~
Ei () -= O~------------------------~~------------------~~--~=-~~~ I:) .... II')
f ~
o 60{Pl 6~('%
9 mp
Figure 77.
~g~~t 6 mph
Air & Cone.
73(F) 65('%}
g mph
Temp.(F).
73(F) JOol(F) 30('%) 1S5('%}
fl mph 9 mph
RH(%). Wind Spd.(mph)
104(F) 30(~}
6 mph
The environmental effects on 90 day abrasion coefficients; a) River gravel b) Limestone
143
(O.39x10- 2inch). Most of the abrasion occurred within the mortar, and embedded
aggregates were very resistant to abrasion. The test results varied significantly,
and depended on whether the target areas included aggregates or not. The test
results were not significantly different for 50°F and 73°F, but greater values were
observed at 104°F. The results generally show the expected trend of higher abrasion
resistance with a lower slump.
Figure 78 shows the effect of mixing time for plain and fly ash concrete on
the abrasion coefficient. The increase of abrasion resistance with an increase in
slump was observed for the plain concrete. The effect of slump on abrasion was
greater than the effect of mixing time. Fly ash concrete made with river gravel
shows significant improvement in abrasion resistance over plain concrete. However,
little changes can be observed for specimens made with limestone aggregates.
Significantly lower abrasion for limestone concrete was observed than for river gravel
concrete. Limestone is weaker than river gravel in strength, but the previously
discussed possibility of moisture being supplied from the aggregate pores for longer
periods apparently causes the mortar strength of limestone concrete to be greater
than the mortar strength for river gravel concrete. This is further evidence that
abrasion is not affected by the strength of the aggregate used in the specimen but
by the mortar strength. Slight increases of abrasion with increased mixing time
were observed for both the plain and fly ash concrete mixtures.
Figure 79 shows the effects of consolidation methods on abrasion. The rod ding
method gives the highest abrasion for all cases considered in this study. For the
vibrating method, the effect of slump on abrasion can be clearly seen for the
river gravel mixtures. The increase in abrasion with the increase in slump can
be observed. For the rodded specimens, some large honeycombs formed during the
batching procedure were observed. The honeycombs affected the test results and
increased the abrasion significantly. For the limestone mixtures, the fly ash concrete
showed slightly higher abrasion than plain concrete. The reverse was observed for
the river gravel mixtures with slumps of 1.5 and 2.0 inches.
Figure 80 shows the test results of using continuous moist curing and different
initial material temperature. Continuously moist cured concrete showed signifi~
cantly lower abrasion than all of the other test conditions. Moist cured concrete
specimens were tested in saturated surface dried condition, whereas all the other
144
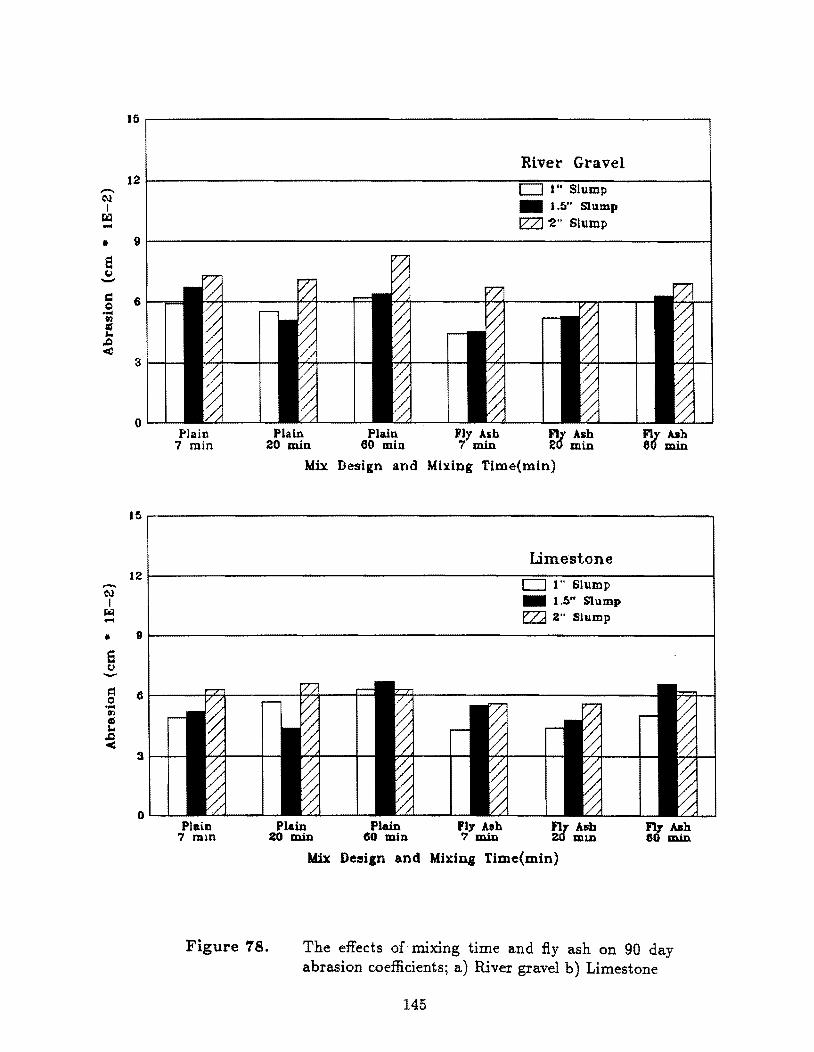
-.. CIl I
a::l -.. S Col --s: 0 .... ., IS ... ,I:l <
-~ I ~ -
J5
12
9
6
3
o Plain
7 min
River Gravel
o 1" Slump _ 1.5" Slump
IZZ]~" Slump
Plain Plain Ply .bh Flr Asb 20 min 60 min 7 min 20 min
Mix Design and Mixing Time(min)
Fly Ash 80 min
15~----------------------------------------------------------~
Umestone 12~----------------------------------------~==~I'~'~S~lu-m-p----------~
_ 1.6" Slump
02" Slump
.. 9~--------------------------------------------------------------~ 6 Col -= O~----~*--------h~---+-o .... I1l
f ~
3
o PlaiD
7 mm
Figure 78.
Plain 20 min
Plain GO min
Ply Alb 7 min
"7 Ash 20 111m
Mile De8i,n and Mixing Tlme(min}
The effects of'mixing time and fly ash on 90 day abrasion coefficientsj a) River gravel b) Limestone
145

15
12 ,.... CIl I
I'.Q -• V
S t.I -C 6 Q .... In IG
"" .. -<
3
lin I.Sin River Gravel
2in lin
IS:Sl SpadlDl
D Vib.(Plain) _ Vib.(Ply Ash)
1.5 in Limolltone
Slump and Aggregate Type
2in
Figure 79. The effects of consolidation methods on 90 day abrasion coefficients; a) River gravel b) Limestone
146
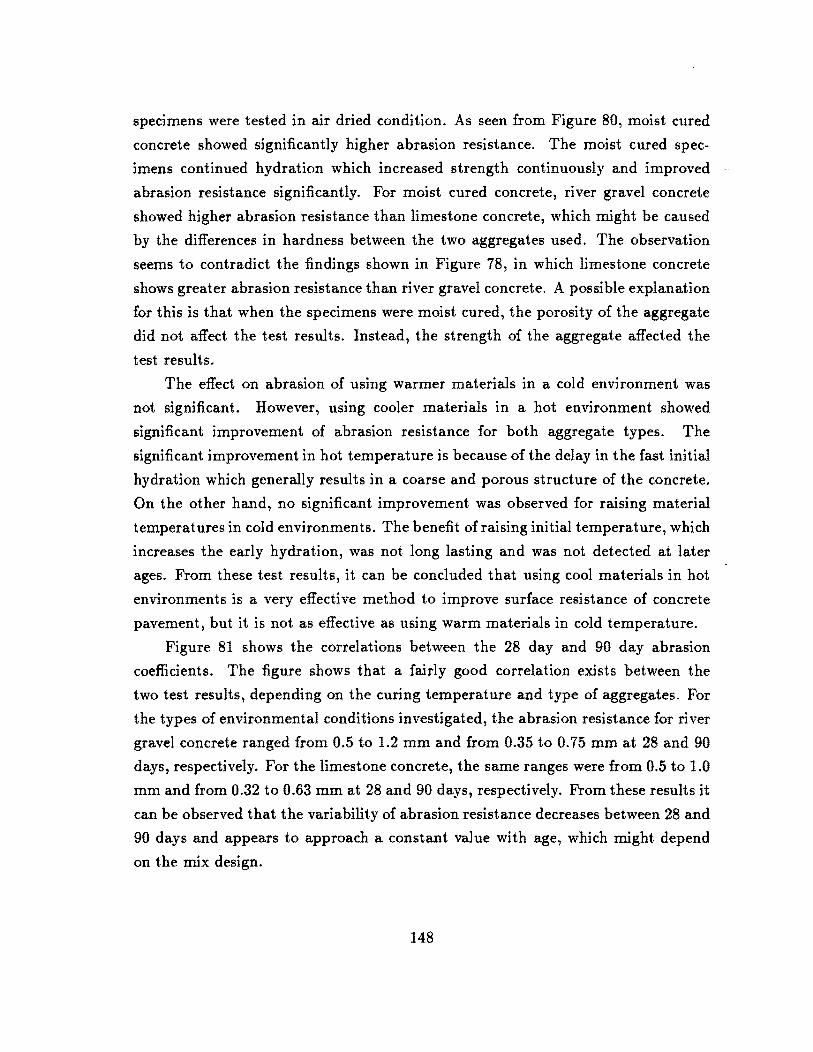
specimens were tested in air dried condition. As seen from Figure 80, moist cured
concrete showed significantly higher abrasion resistance. The moist cured spec
imens continued hydration which increased strength continuously and improved
abrasion resistance significantly. For moist cured concrete, river gravel concrete
showed higher abrasion resistance than limestone concrete, which might be caused
by the differences in hardness between the two aggregates used. The observation
seems to contradict the findings shown in Figure 78, in which limestone concrete
shows greater abrasion resistance than river gravel concrete. A possible explanation
for this is that when the specimens were moist cured, the porosity of the aggregate
did not affect the test results. Instead, the strength of the aggregate affected the
test results.
The effect on abrasion of using warmer materials in a cold environment was
not significant. However, using cooler materials in a hot environment showed
significant improvement of abrasion resistance for both aggregate types. The
significant improvement in hot temperature is because of the delay in the fast initial
hydration which generally results in a coarse and porous structure of the concrete.
On the other hand, no significant improvement was observed for raising material
temperatures in cold environments. The benefit of raising initial temperature, which
increases the early hydration, was not long lasting and was not detected at later
ages. From these test results, it can be concluded that using cool materials in hot
environments is a very effective method to improve surface resistance of concrete
pavement, but it is not as effective as using warm materials in cold temperature.
Figure 81 shows the correlations between the 28 day and 90 day abrasion
coefficients. The figure shows that a fairly good correlation exists between the
two test results, depending on the curing temperature and type of aggregates. For
the types of environmental conditions investigated, the abrasion resistance for river
gravel concrete ranged from 0.5 to 1.2 mm and from 0.35 to 0.75 mm at 28 and 90
days, respectively. For the limestone concrete, the same ranges were from 0.5 to 1.0
mm and from 0.32 to 0.63 mID at 28 and 90 days, respectively. From these results it
can be observed that the variability of abrasion resistance decreases between 28 and
90 days and appears to approach a constant value with age, which might depend
on the mix design.
148
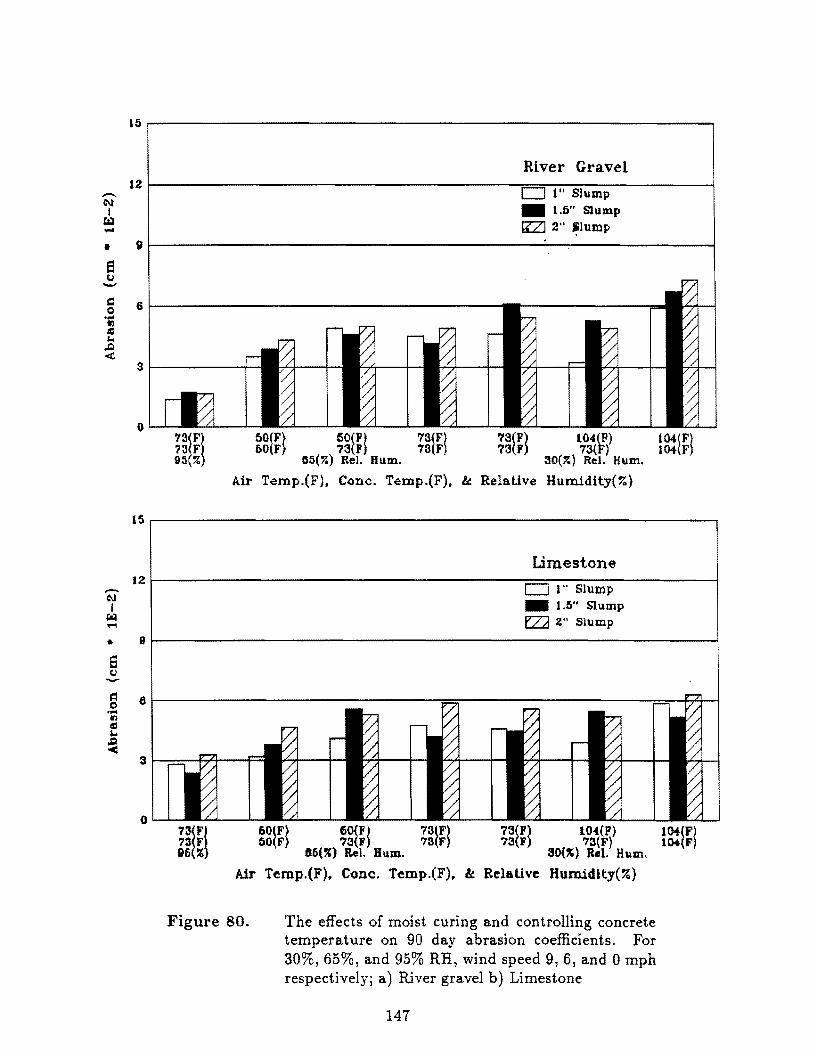
-CIl I
/:1:1 -• e! (,j ....... C 0 .... Il ~ ...
.Q
<
-CIl I
f,i:I ...
15
River Gravel 12
til Slump _ 1.5" Slump
llZl 2" ~Iump 9
6
3
o 73~F~ 73 F 95 ~
5O(F) 60(P) 73(F) 60(F} 73(F) 73(F)
D5(~) Rei. Bum. ~gt~l 1:3~~)
30(?o) Rei. Hum.
Ail' Temp.(F). Cone. Temp.(F). &! Relative Humidity(70}
15r-------------------------------------------------------------~
Limestone 12~--------------------------------------~~~----------------~ D I" Slump
_ 1.5" Slump
o Z" Slump
• 9~------------------------------------------------------------~
s (J --~ 6~----------------------------~~--------------------~~~~ o .,.. In CI ... ~
o 73~Ft '13 F 96 ~
60(F} 60(F) 73(F) 60(F) 73(') 73(F)
86(") Rei. Bum.
l04{P) 7:1(F)
30(~) Rei. Hum.
Air Temp.(F). CODe. Temp.(F). &. Relative Humidity(%)
Figure 80. The effects of moist curing and controlling concrete temperature on 90 day abrasion coefficients. For 30%,65%, and 95% RH, wind speed 9, 6, and 0 mph respectivelYi a) River gravel b) Limestone
147
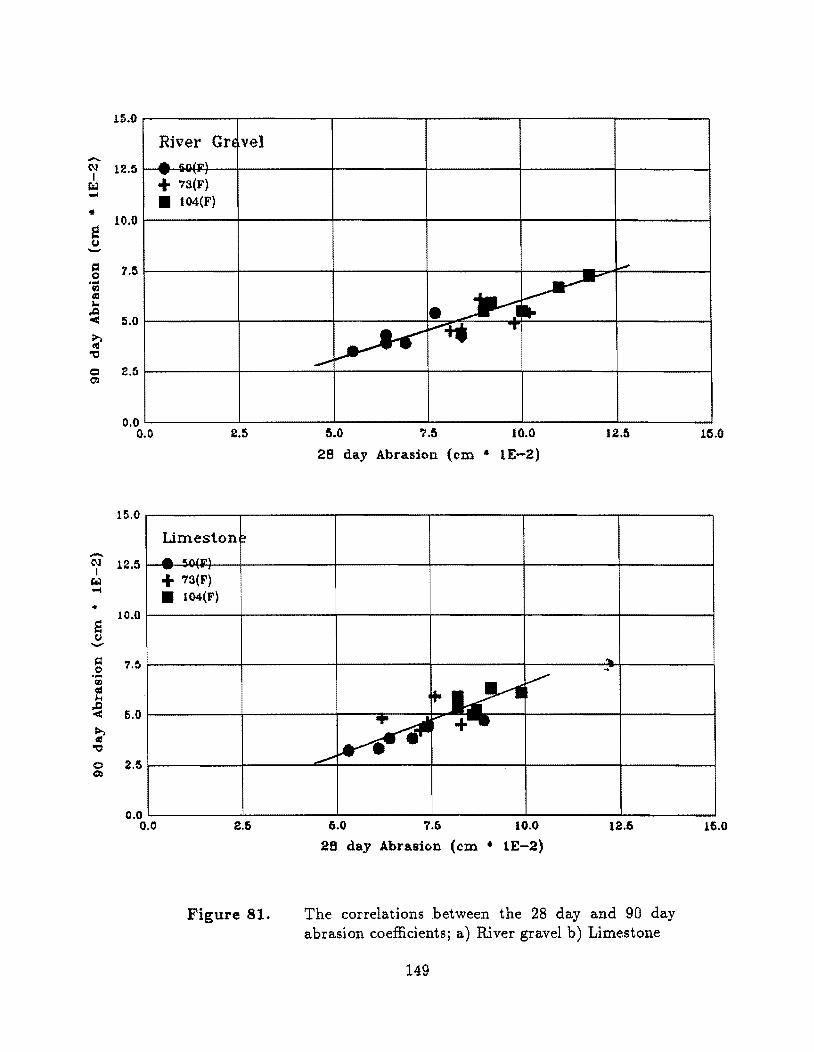
-t\l I
tLI ... .. e t.l -= 0 ... 9l «I ... .c -< ~ ~ 'tI
Q Col
-N I
j;.;I .... .. e t.l -~ .2
Q!l <II lot .c -< ~ «I 'tI
0 ~
15.0
12.5
10.0
7.5
5.0
2.5
0.0 0.0
15.()
12.5
10.0
'1.5
6.0
2.5
0.0 0.0
River GrE vel - <on/,.,\ - .,. + 73(F} • I04(F)
2.5
Umeston:> _ ",,11:-\ -+ 73(F} • l04(F)
2.6
Figure 81.
~
• --.-y ~
~ .... T
........
~.O '1.~ 10.0 12.5
2B day Abrasion (em .. 1 E-2)
.... V
~
~~ ~ -'
6.0 7.6 10.0 12.6
28 day Abrasion (em .. lE-2)
The correlations between the 28 day and 90 day abrasion coefficientsj a) River gravel b) Limestone
149
15.0
16.0
Moist Cured Condition The effects of mixing time and consolidation
method on the abrasion after 90 days are shown in Figure 82. The vibrating method
shows the lowest abrasion and the spading method showed the greatest abrasion.
As the mixing time increases, a significant increase of abrasion is observed for all
three consolidation methods. The abrupt increase for the spaded concrete after 60
minutes mixing might be due to the honeycombs observed in the concrete.
Figure 83 shows the correlations between the 28 and 90 day abrasion. Signifi
cantly higher abrasion was observed for early ages. Vibrating and rodding method
showed quite good correlations. For the two methods, the 90 day abrasion might
be predicted from the 28 day abrasion. The spading method did not show as good
a correlation as the other methods. A similar, odd observation was found with the
results for the flexural strength (Figure 32). The abnormality most likely is caused
by the honeycombing developed during the consolidation. The correlations of vi
brating method and rod ding method were distinctly different. This fact indicates
that the abrasion test is dependent on the consolidation method employed.
4.5.3 Conclusion
The following conclusions are based on the results of the laboratory tests for
setting time and abrasion. The conclusions are divided into two sections with
reference to the results for setting time and abrasion respectively.
Time of Setting:
1. Temperature is the main parameter influencing the time of setting test. In a
low temperature range, time of setting is quite slow, but increases at medium
to high temperature.
2. The coarse aggregate type was not found to affect the setting time.
3. The effect of slump on setting time is minor.
4. Controlling the material temperature and slump affect the setting time slightly.
5. A slight increase of setting time is observed as the mixing time is extended.
6. Fly ash replacement does not affect the setting time.
150
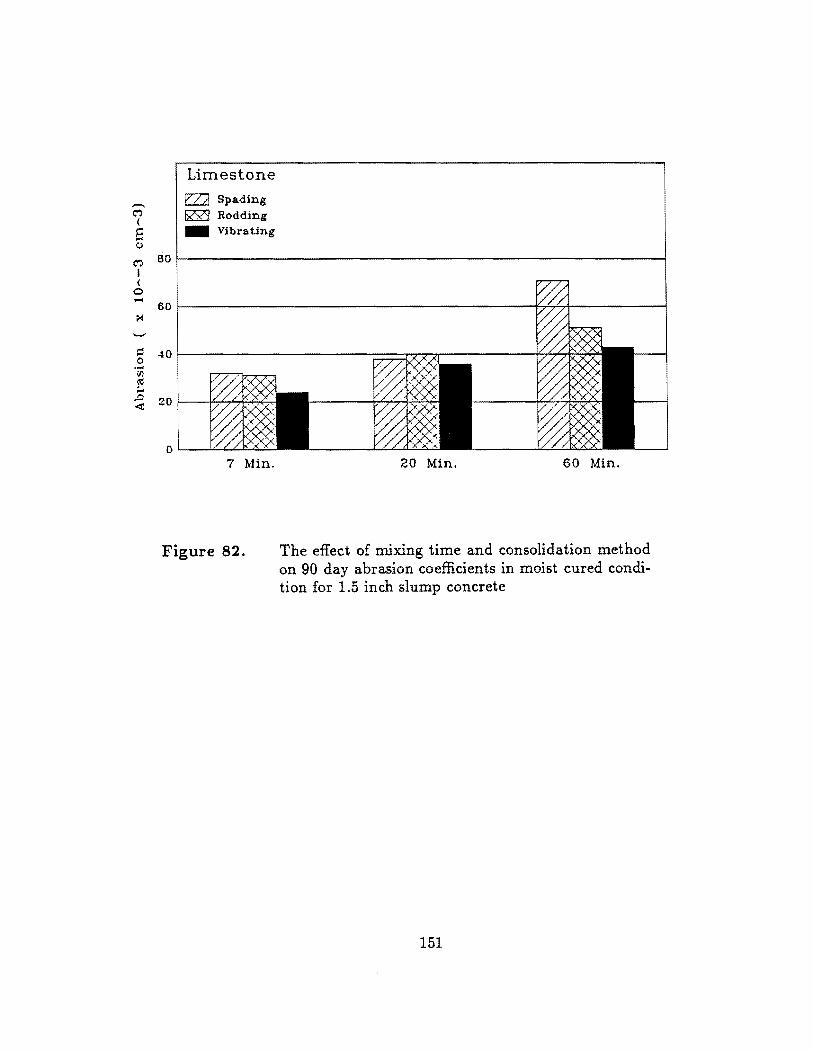
,.......
'" (
E C)
'" I <
0 -~
--~ 0 .-III <0 ;..
,!:l <t
Limestone
W SpadiDg
~ RoddiDg _ Vibrating
80
60
40
20
0 7 Min.
Figure 82.
20 Min. 60 Min.
The effect of mixing time and consolidation method on 90 day abrasion coefficients in moist cured condition for 1.5 inch slump concrete
151
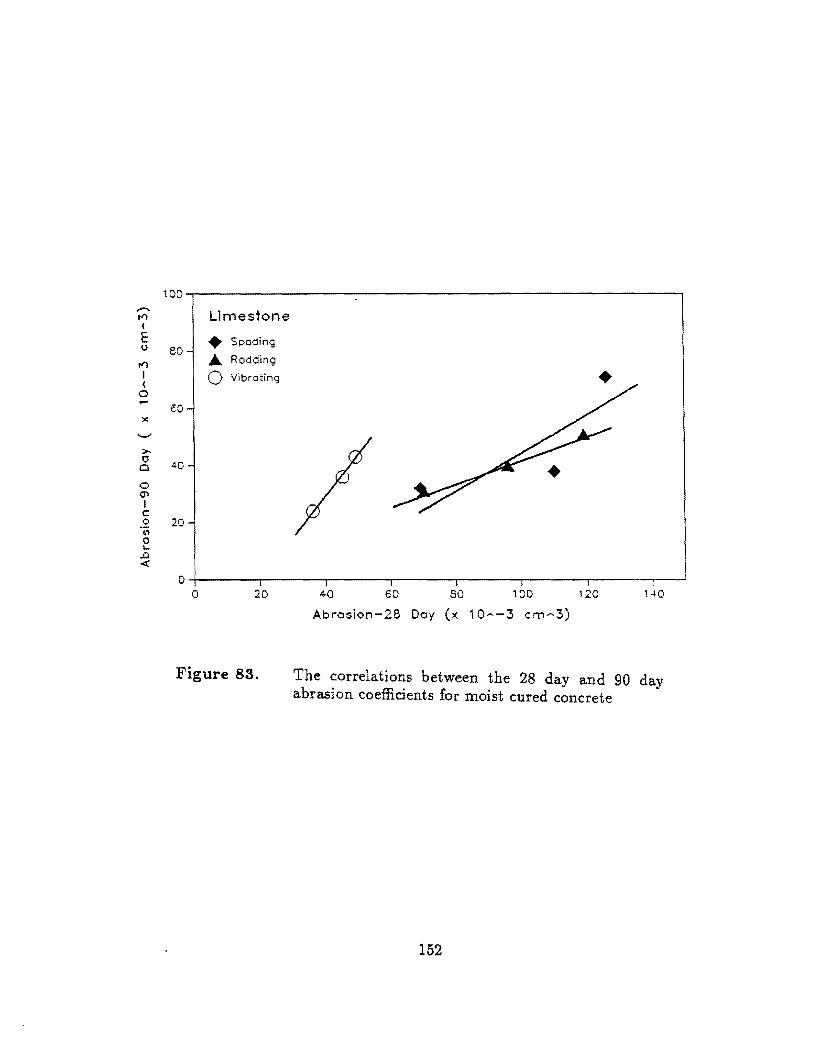
----t"}
(
E 0
"" I {
0
x
'-'
>-0 0
0 (J>
I c: 0 1/'1 0 ... .0 ~
100
Limestone
• Spading eo ... ROdding
0 Vibrating
60
40
20
0 0 2D
Figure 83.
40 60 80 lDO 120 140
Abrosion-28 Doy (x 10 ... -3 cm ... 3)
The correlations between the 28 day and 90 day abrasion coefficients for moist cured concrete
152
Abrasion:
L Most of the abrasion occurred within the mortar, and almost no abrasion
occurred on the surface of aggregate. As a result, quite large variations in
abrasion resistance were observed during the study.
2. The abrasion resistance decreases as the evaporation rate increases. The effect
of environmental conditions on the abrasion resistance is caused by the effect
of moisture retention within the concrete and results in an improvement in the
mortar quality.
3. Replacement of fly ash improves the surface properties slightly.
4. The abrasion resistance seems to decrease as the mixing time extends. However,
the effect of mixing time on abrasion resistance is not as significant as the effect
of slump or fly ash replacement.
5. Generally, the spading method of consolidation gives almost the same abrasion
resistance as the vibrating method.
6. The rodding method of consolidation showed the lowest abrasion resistance
due to the presence of honeycombs. Based on Item 5 above, the rodding is not
expected to influence the abrasion resistance to a great extent.
7. Moist cured specimens have the best surface resistance. They had only half
the abrasion of the other specimens cured in the dry condition.
8. Controlling the material temperature in a hot environmental condition has a
greater effect on the abrasion resistance than controlling the temperature in a
cold environment.
9. The variability of abrasion resistance decreases with age.
153
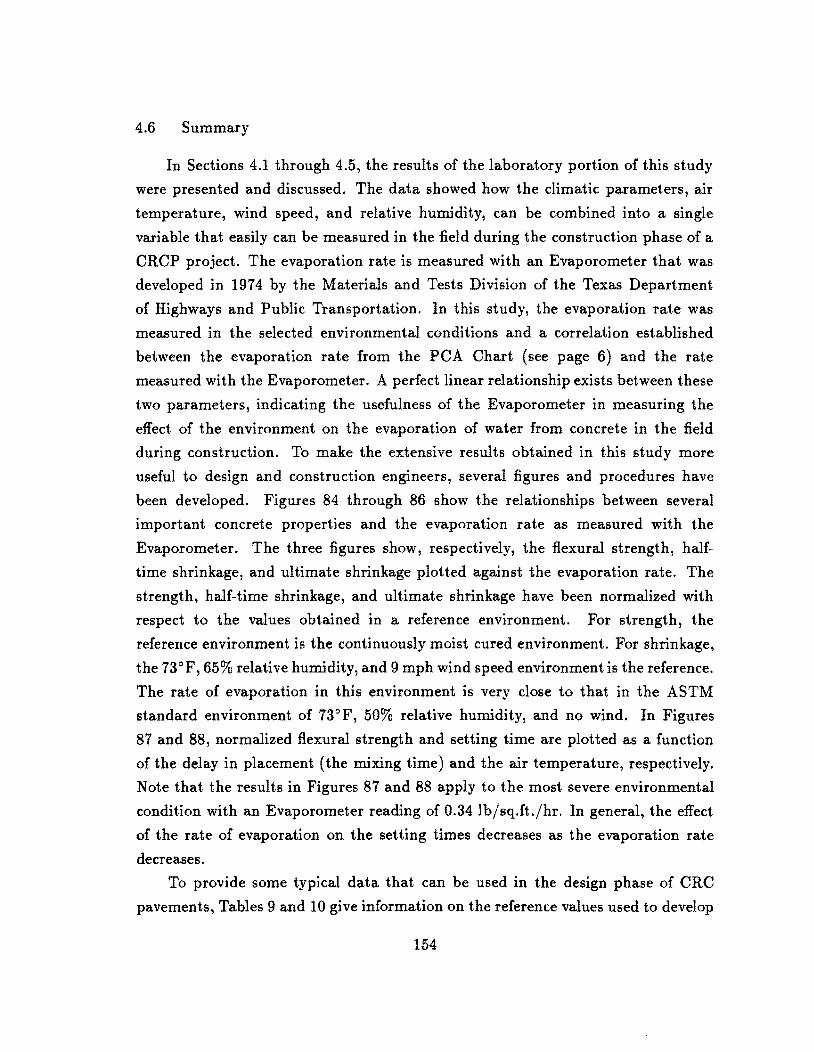
4.6 Summary
In Sections 4.1 through 4.5, the results of the laboratory portion of this study
were presented and discussed. The data showed how the climatic parameters, air
temperature, wind speed, and relative humidity, can be combined into a single
variable that easily can be measured in the field during the construction phase of a
CRCP project. The evaporation rate is measured with an Evaporometer that was
developed in 1974 by the Materials and Tests Division of the Texas Department
of Highways and Public Transportation. In this study, the evaporation rate was
measured in the selected environmental conditions and a correlation established
between the evaporation rate from the PCA Chart (see page 6) and the rate
measured with the Evaporometer. A perfect linear relationship exists between these
two parameters, indicating the usefulness of the Evaporometer in measuring the
effect of the environment on the evaporation of water from concrete in the field
during construction. To make the extensive results obtained in this study more
useful to design and construction engineers, several figures and procedures have
been developed. Figures 84 through 86 show the relationships between several
important concrete properties and the evaporation rate as measured with the
Evaporometer. The three figures show, respectively, the flexural strength, half
time shrinkage, and ultimate shrinkage plotted against the evaporation rate. The
strength, half-time shrinkage, and ultimate shrinkage have been normalized with
respect to the values obtained in a reference environment. For strength, the
reference environment is the continuously moist cured environment. For shrinkage,
the 73°F, 65% relative humidity, and 9 mph wind speed environment is the reference.
The rate of evaporation in this environment is very close to that in the ASTM
standard environment of 73°F, 50% relative humidity, and no wind. In Figures
87 and 88, normalized flexural strength and setting time are plotted as a function
of the delay in placement (the mixing time) and the air temperature, respectively.
Note that the results in Figures 87 and 88 apply to the most severe environmental
condition with an Evaporometer reading of 0.34 lb/sq.ft.jhr. In general, the effect
of the rate of evaporation on the setting times decreases as the evaporation rate
decreases.
To provide some typical data that can be used in the design phase of CRC
pavements, Tables 9 and 10 give information on the reference values used to develop
154

..c ...... OJ c Q) L.. ......
en
ro L..
::J x Q) -u. "0 ...... Q) (.It
(.It N
ro E L..
0 Z
1.1
1.0
0.9
0.8
0.7
I "- ------- Limestone 0.6
0.5 L ------ River Gravel
0.4 Y
01 f
o 0.05 0.1 0.15 0.2 0.25 0.3 0.35
Figure 84.
Evaporometer Reading (lb/sq. ft.lhr)
Normalized flexural strength versus Evaporometer reading for limestone and river gravel concrete. The reference environmental condition is 73°F, 95% RH, and no wind, and the results represent the average for 1 to 2 inch slump concrete.
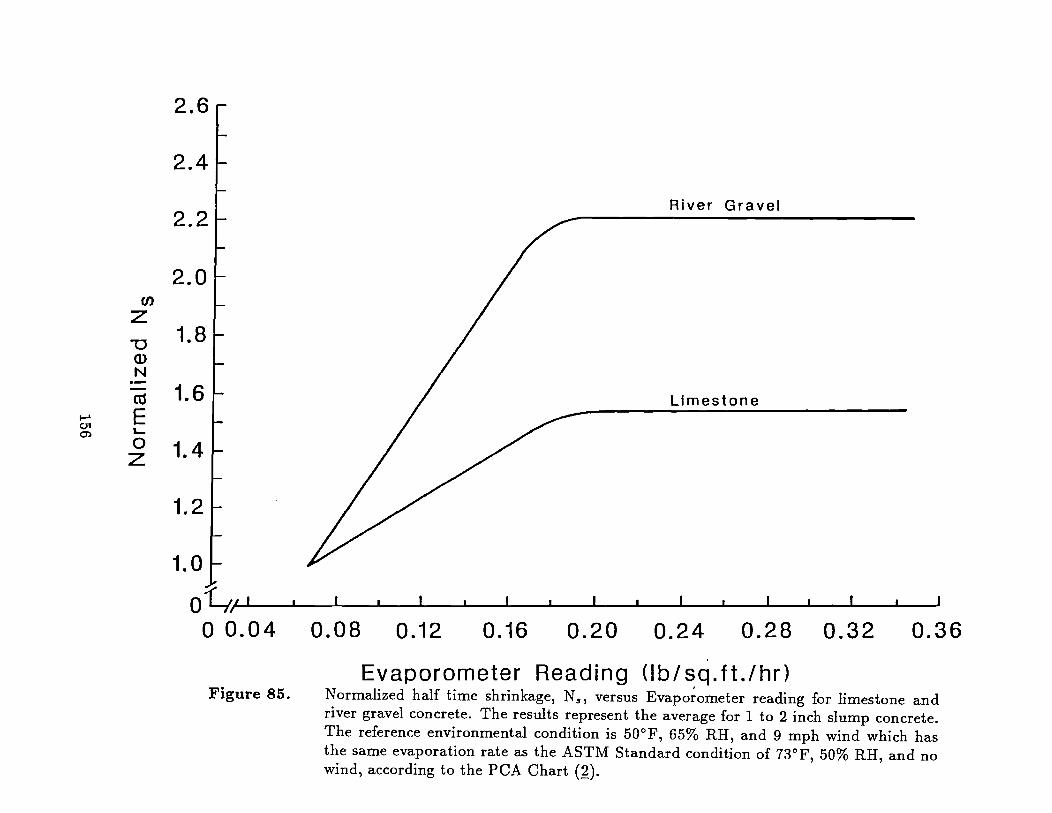
~ CJ1 0')
en Z
"0 Q) N
ro E L-
a z
2.6
2.4
2.2 River Gravel
2.0
1.8
1.6 Limestone
1.4
1.2
1.0 ..k 0~~11L-~~--~~~--L-~~--~~~--~~~--~~ o 0.04 0.08 0.12 0.16 0.20 0.24 0.28 0.32 0.36
Figure 85. Evaporometer Reading (Ib/~q.ft.lhr)
Normalized half time shrinkage, Ns , versus Evaporometer reading for limestone and river gravel concrete. The results represent the average for 1 to 2 inch slump concrete. The reference environmental condition is 50°F, 65% RH, and 9 mph wind which has the same evaporation rate as the ASTM Standard condition of 73°F, 50% RH, and no wind, according to the PCA Chart (~).
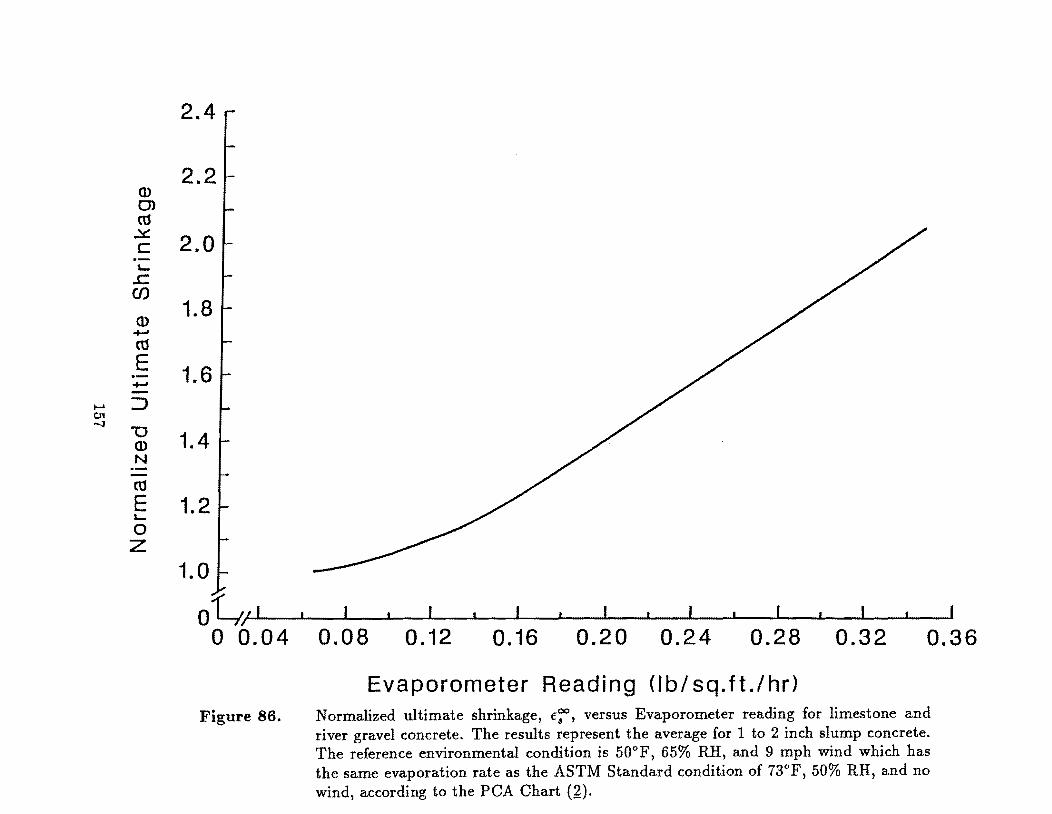
Q)
0> «J ~ c L-
..c (J)
Q) ...... «J E .-......
...... :J C1I -;J
"0 Q) N -«J E L-
a Z
2.4
2.2
2.0
1.8
1.6
1.4
1.2
1.0
* 01 " I I I I Y o 0.04 0.08 0.12 0.16 0.20 0.24 0.28 0.32 0.36
Figure 86.
Evaporometer Reading Ob/sq.ft.lhr) Normalized ultimate shrinkage, f~, versus Evaporometer reading for limestone and river gravel concrete. The results represent the average for 1 to 2 inch slump concrete. The reference environmental condition is 50°F, 65% RH, and 9 mph wind which has the same evaporation rate as the ASTM Standard condition of 73°F, 50% RH, and no wind, according to the PCA Chart (£).
.r: ...... 0> C Q) '-......
(J)
as '-:J X Q) -LL
..... "'0 c.rc 00 Q)
N
as E '-0 z
0.70
0.65
0.60 Limestone
0.55
0.50
0.45
0.40
0.35
0.30 01L------L-____ ~ ____ ~ ______ ~ ____ ~ ______ ~ ____ ~ o 10 20 30 40 50 60 70
Figure 87.
Mixing Time (min'>
Normalized flexural strength versus mixing time for limestone and river gravel concrete exposed to 104°F, 30% RH, and 6 mph wind. The results represent the average for 1 to 2 inch slump concrete.
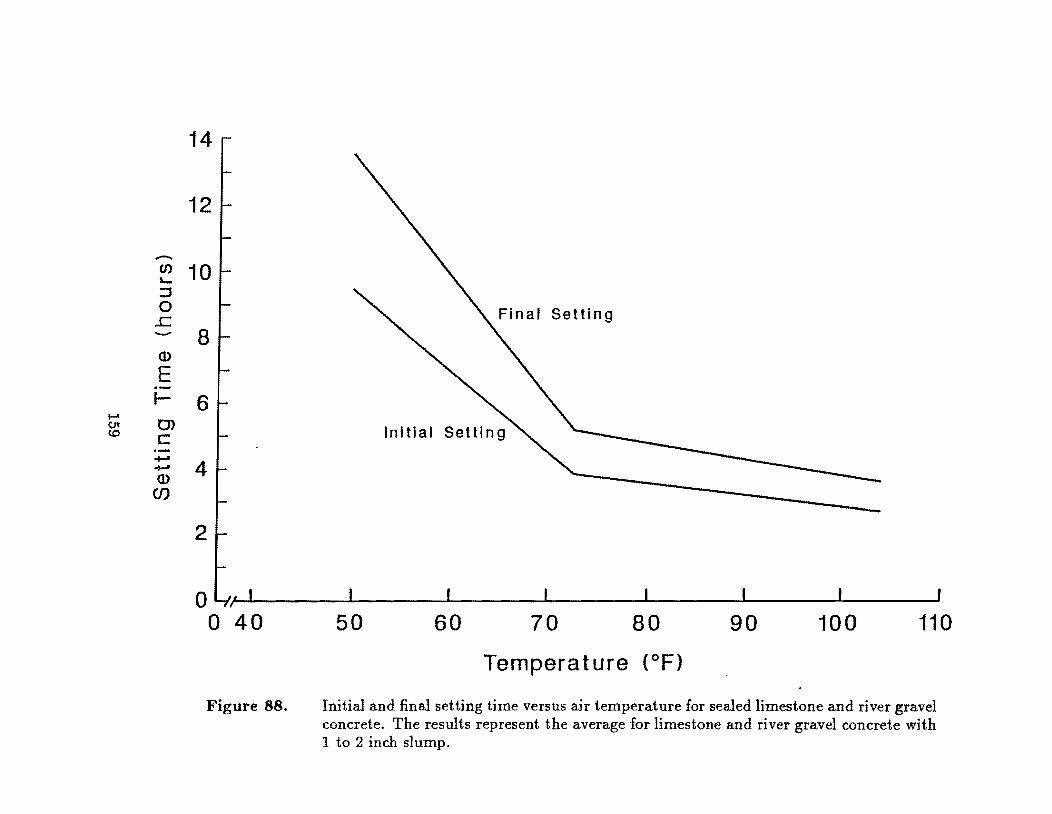
-(J)
'-::J 0 ..c -0.>
E I-
I-' Ol 01
co C ~ +-'
0.> U)
14
12
10
I " \.. Final Setting
8
6 I- Initial Setting
4
2
O~/~,~I------~----~----~------~----~----~~--~ o 40 50 60 70 80 90 100 110
Figure 88.
Temperature (OF)
Initial and final setting time versus air temperature for sealed limestone and river gravel concrete. The results represent the average for limestone and river gravel concrete with 1 to 2 inch slump.
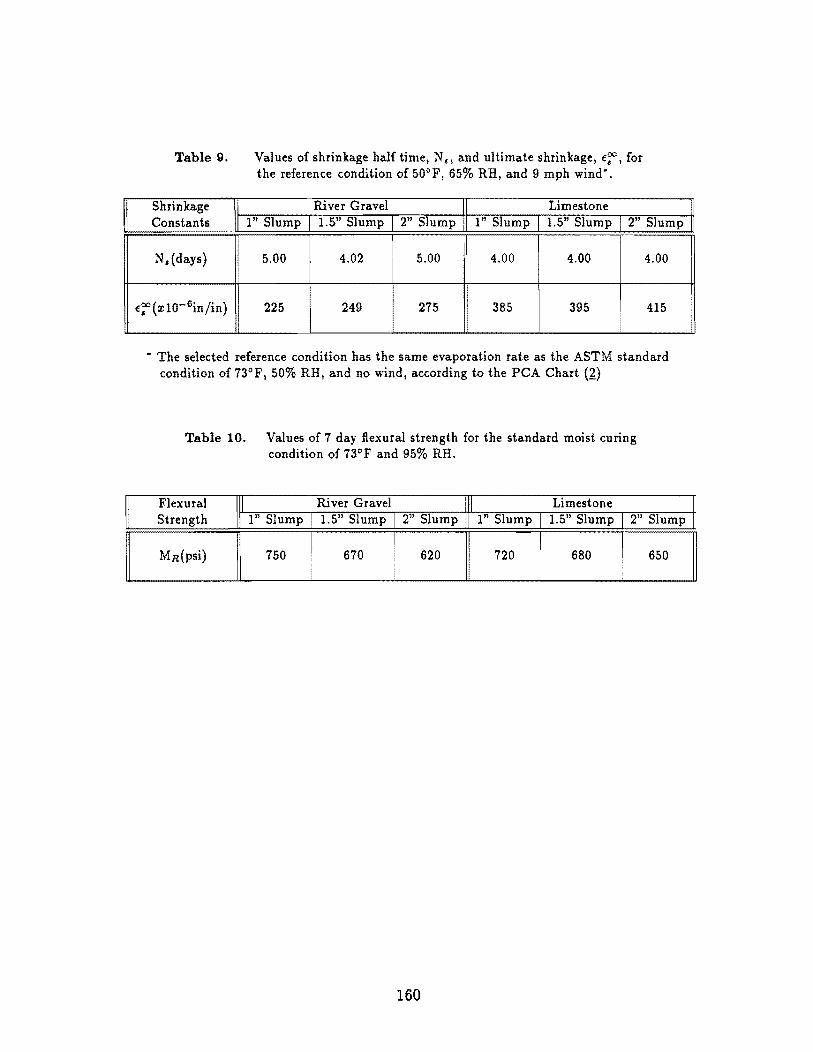
Table 9.
Shrinkage Constants
N,(days)
f.e:'(xl0- 6injin)
Values of shrinkage half time, N I, and ultimate shrinkage, f.e:', for the reference condition of 50°F, 65% RH, and 9 mph wind-.
River Gravel Limestone 1" Slump 1.5" Slump 2" Slump 1" Slump 1.5" Slump 2" Slump
i 5.00 4.02 5.00 4.00 4.00 4.00
225 249 275 385 395 415
.. The selected reference condition has the same evaporation rate as the ASTM standard condition of 73°F, 50% RH, and no wind, according to the PCA Chart (f.)
Table 10. Values of 7 day flexural strength for the standard moist curing condition of 73°F and 95% RH.
Flexural III River Gravel III Limestone Strength 1" Slump 1.5" Slump 2" Slump I" Slump I 1.5" Slump 2" Slump II
MR(psi) 750 670 620 720 I 680 650
160
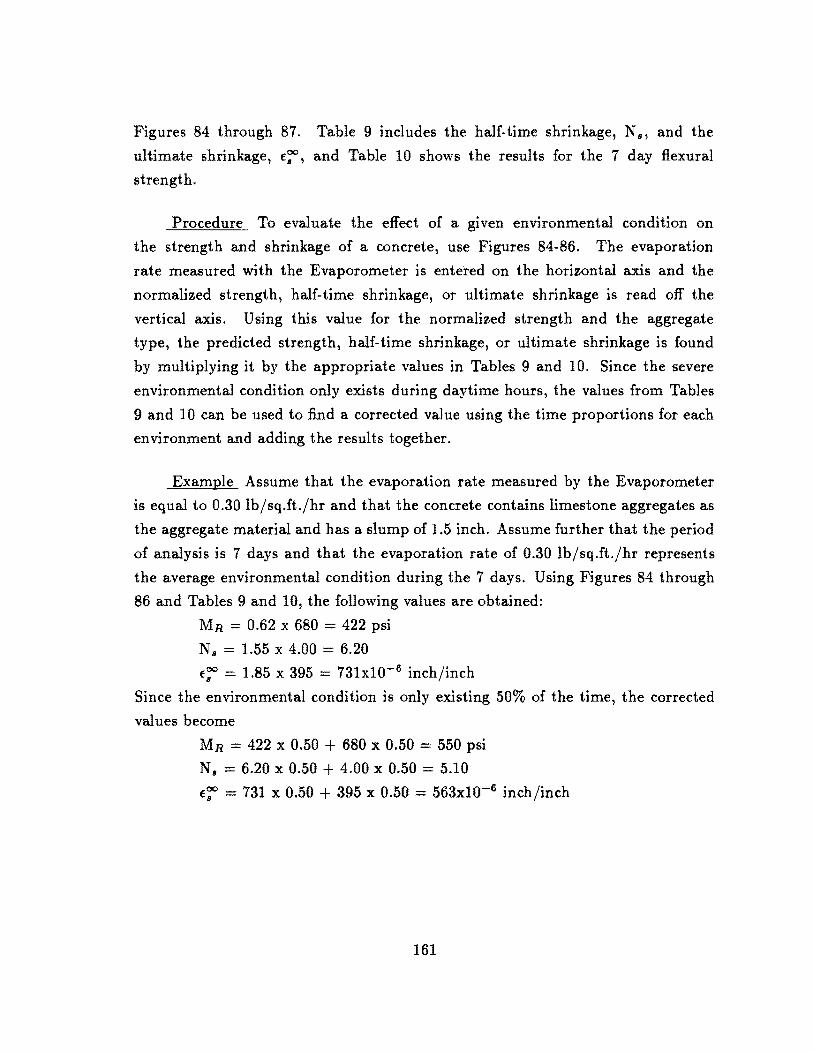
Figures 84 through 87. Table 9 includes the half- time shrinkage, N 8, and the
ultimate shrinkage, er::, and Table 10 shows the results for the 7 day flexural
strength.
Procedure To evaluate the effect of a gIven environmental condition on
the strength and shrinkage of a concrete, use Figures 84-86. The evaporation
rate measured with the Evaporometer is entered on the horizontal axis and the
normalized strength, half-time shrinkage, or ultimate shrinkage is read off the
vertical axis. Using this value for the normalized strength and the aggregate
type, the predicted strength, half-time shrinkage, or ultimate shrinkage is found
by multiplying it by the appropriate values in Tables 9 and 10. Since the severe
environmental condition only exists during daytime hours, the values from Tables
9 and 10 can be used to find a corrected value using the time proportions for each
environment and adding the results together.
Example Assume that the evaporation rate measured by the Evaporometer
is equal to 0.30 lb/sq.ft./hr and that the concrete contains limestone aggregates as
the aggregate material and has a slump of 1.5 inch. Assume further that the period
of analysis is 7 days and that the evaporation rate of 0.30 Ib/sq.ft./hr represents
the average environmental condition during the 7 days. Using Figures 84 through
86 and Tables 9 and 10, the following values are obtained:
MR = 0.62 x 680 = 422 psi
N 8 = 1.55 x 4.00 = 6.20
er:: = 1.85 x 395 731x10-6 inch/inch
Since the environmental condition is only existing 50% of the time, the corrected
values become
MR = 422 x 0.50 + 680 x 0.50 = 550 psi
NB = 6.20 x 0.50 + 4.00 x 0.50 = 5.10
er:: = 731 x 0.50 + 395 x 0.50 = 563x10-6 inch/inch
161

The values determined above can now be used as input to the design programs. To
find the shrinkage value at any time, t, of the curing process, the following equation
by Hansen and Mattock (31) is used:
where fs = shrinkage strain
xi fs = -=---
Ns+t
fC:: = ultimate shrinkage strain
t = time in days since measurements began
N 8 = the time in days to reach half of fC:: .
162

V. CONCLUSIONS AND RECOMMENDATIONS
5.1 Conclusions
The following presents a summary of the major conclusions based on an analysis
of the literature review and laboratory investigation conducted in this study.
1. A procedure has been developed that can quantify the effect of the environmen
tal condition existing during construction of a CRC pavement, on the strength
and shrinkage of the concrete.
2. The environmental parameters, air temperature, wind speed, and relative
humidity, can be combined into a single parameter: the evaporation rate.
3. The evaporation rate can be easily measured during construction of a CRC
pavement using the Evaporometer developed by the Materials and Tests
Division of the Texas Department of Highways and Public Transportation.
5.2 Recommendations
Based onthe results of thi~ laboratory investigation and analysis, the following
recommendations are made. These recommendations should help to assure that
well performing CRC pavements are constructed.
1. The Evaporometer developed by the Materials and Tests Division of the Texas
Department of Highways and Public Transportation should be used to measure
the evaporation rate in the field during the construction of CRC pavements.
This value for the evaporation rate can then be used to assess the influence
of the particular environment on the physical properties of the concrete (see
Items 2 and 3 below).
2. Whenever the concrete is exposed to a severe environmental condition with an
evaporation rate of more than O.29Ib/sq.ft./hr as measured by the Evaporom
eter, the concrete should be protected from excessive evaporation by covering
it with wet burlap or other similar means. The necessary period of covering
should be the smaller of 7 days and the duration of the severe climatic condi
tion.
3. Whenever the use of wet curing is not practical, the design flexural strength,
the half-time shrinkage, N 8, and the ultimate shrinkage, fr:' , should be adjusted
163
according to the environmental conditions in order to consider the difference
between continuously moist cured concrete and concrete cured using a curing
compound. The design curves presented in Chapter 4, Section 4.6, provide the
means for such an adjustment.
4. Whenever the concrete is exposed to a severe environmental condition with an
evaporation rate of more than 0.29 lb/sq.ft./hr as measured by the Evaporom
eter, the effect of delays in placement on the flexural strength can be assessed
by using Figure 87 and Table 10 in Chapter 4, Section 4.6.
5. The effect of the air temperature on initial and final setting time can be
determined from Figure 88 in Chapter 4, Section 4.6.
164
REFERENCES
[1] Edwards, David 1., "Instrumentation for Field Determination of the Rate of
Evaporation of Moisture from Portland Cement Concrete," Research Report
3-20-70-028, Texas Highway Department, July 1974.
[2] Portland Cement Association, Design and Control of Concrete Miztures. En
gineering Bulletin, 12th ed.: Skokie, IL, 1968.
[3] Noble, C.S., and McCullough, B.F., "Distress Prediction Model for CRCP,"
Research Report 177-21, Center for Transportation Research, The University
of Texas at Austin, March, 1981.
[4] Ma, J., and McCullough, B.F., "CRCP-2, An Improved Computer Program
for the Analysis of Continuously Reinforced Concrete Pavements," Research
Report 177-9, Center for Highway Research, The University of Texas at Austin, "
Aug. 1977.
[5] Wrbas, Ronald 0., Ledbetter, W.B., and Meyer, A.H., "Laboratory Study
of Effects' of Environment arid Construction Procedures on Concrete Pavement
Surfaces," Research Report 141-1, Texas Transportation Institute, Texas A&M
University, Nov. 1972.
[6] Groth, Larry D., Meyer, A.H., and Ledbetter, W.B., "Effects of Temperature,
Wind, and Humidity on Selected Curing Media," Research Report 141-3, Texas
Transportation Institute, Texas A&M University, Aug. 1974.
[7] Carrier, R.E., and Cady, P.D., "Evaluating Effectiveness of Concrete Curing
Compounds," Journal of Materials, JMLSA, Vol. 5, No.2, pp. 294-302, June,
1970.
[8] ACI Committee 305, "Hot Weather Concreting," Journal of A CI, Vol. 74,
pp. 317-322, Aug. 1977.
[9] Yeager, J .C., "Concrete Finishing," Concrete Construction, Vol. 24, No 4,
pp. 221-246, Apr. 4, 1979.
[10] Editor, "New York Tests First Cement Concrete Overlay," Engineering News
Records, Vol. 203, No 9, pp. 18-19, Aug. 30, 1979.
165

[11] Mindness, S., and Young, J.F., Concrete. Englewood Cliffs, NJ: Prentice-Hall,
Inc., 1981.
[12J Majidzadeh, Kamran, "Field Study of Performance of Continuously Reinforced
Concrete Pavements," Research Report OHIO-DOT-09-74, Ohio State Depart
ment of Transportation, Dec. 1973.
[13} Noble, C.S., McCullough, B.F., and Ma, J .C.M., "Nomographs for the Design
of CRCP Steel Reinforcement," Research Report 177-16, Center for Highway
Research, The University of Texas at Austin, Aug. 1979.
[14] McCullough, B.F., "Report on an Experimental CRCP in Walker County,"
Research Report TRR-632, Design and Performance of Pavement Overlays,
Center for Highway Research, The University of Texas at Austin, 1977.
[15] Ma, J.C.M., CRCP·1 and CRCP·2 User's Manual. Center for Highway Re
search, Technical Memorandum, The University of Texas at Austin: No. 177-
21, Mar. 1977.
[16] ShaJon, Rahel, "Concrete and Reinforced Concrete in Hot Countries - Report
on Behavior of Concrete in Hot Climates," RILEM, Materials and Structures,
Vol. 11:62, pp. 127-131, Mar.-Apr. 1978.
[17] Zollinger, D.G., "Investigation of Punchout Distress in Continuously Reinforced
Concrete Pavements," Ph.D. Thesis, University of Illinois, 1988.
[18] ACI Committee 201, "Guide to Durable Concrete," Journal of A CI, Vol. 74,
pp. 573-609, Dec. 12, 1977.
[19] Scripture, E.W., Jr., Bendict, S.W., and Bryant, D.E., "Floor Aggregate,"
Journal of ACI, Vol. 50, No.4, pp. 305-316, Dec. 1953.
[20} Witte, L.P., and Backstrom, J .E., "Some Properties Affecting the Abra
sion Resistance of Air-Entrained Concrete," Proceedings, ASTM, Vol. 51,
pp. 1141-1155, 1951.
[21} ASTM C-900, "Standard Test Method for Pullout Strength of Hardened Con
crete," Annual Book of ASTM Standards, Concrete and Mineral Aggregates,
Vol. 04.02, pp. 585·588, Philadelphia 1986.
166
[22] Dilly, Ronald L., and Ledbetter, William B., "Concrete Strength Based on Ma
turity and Pullout," ASCE Journal of Structural Engineering, Vol. 110, No.2,
pp. 354-364, Feb. 1984.
[23] Parsons, T.J., and Naik, T.R., "Early Age Concrete Strength Determination
By Pullout Testing and Maturity," In Situ, Nonde8tructive Testing of Concrete,
A CI Publication, Vol. SP-82, pp. 177-199, Detroit, Michigan, 1985.
[24] Stone, William C., and Giza, Bruce J., "The Effect of Geometry and Aggregate
on the Reliability of the Pull Out Test," Concrete International, Vol. 7, No.1,
pp. 27-36, Feb. 2, 1985.
[25J Khoo, L.M., "Pull Out Technique - An Additional Total for In-Situ Concrete
Strength Determination'" In Situ, Nondestructive Te8ting of Concrete, A CI
Publication, Vol. SP-82, pp. 143-159, Detroit, Michigan, 1985.
[26] Vogt, W.L., Beizai, V., and Dilly, R.L., "In-Situ Pullout Strength of Concrete
Determination," In Situ, Nonde8tructive Testing of Concrete, A CI Publication,
VoL SP-82, pp. 161-175, Detroit, Michigan, 1985.
[27] McKeen,R.G., and Ledbetter, W.B., "Evaluation of Shrinkage-Cracking Char
acteristics of Structural Lightweight Concrete," Research Report 81-11, Texas
Transportation Institute, Texas A&M University, Oct. 1969.
[28] Jones, Truman R. Jr., and Hirsch, T.J., "A Report on the Physical Properties
of Concrete at Early Ages," Research Report RP-19, Texas Transportation
Institute, Texas A&M University, Aug. 1961.
[29] Powers, T.C., "Mechanisms of Shrinkage and Reversible Creep of Hardened
Cement Paste," in International Conference on the Structure of Concrete,
London, 1965.
[30] Verbeck, G.J., and Helsmith, R.A., "Structure of Physical Properties of Cement
Paste," in 5th International Sympo8ium on the Chemi8try of Cement, Part III,
Tokyo, pp. 1-32, 1968.
[31] Hansen, Torben C., and Mattock, Alan H., "Influence of Size and Shape
of Member on the Shrinkage and Creep of Concrete," Journal of A CI,
Vol. 63, No.2, pp. 267-289, Feb. 1966.
167
[32] Kraai, Paul P., "Proposed Field Test for Drying Shrinkage of Concrete,"
Concrete Construction, Vol. 29, No.7, pp. 663-665, July 1984.
[33] Kraai, Paul P., "Concrete Drying Shrinkage: Facts or Fallacies," Design for
Creep and Shrinkage in Concrete Structures, A CJ Publication, Vol. SP-76,
pp. 25-51, Detroit, Michigan, 1982.
[34] Ingram, Leonard L., and Furr, Howard L., "Creep and Shrinkage of Concrete
Based on Major Variables Encountered in the State of Texas," Research Report
170-1F, Texas Transportation Institute, Texas A&M University, Aug. 1973.
[35] ACI Committee 209, "Prediction of Creep, Shrinkage, and Temperature Effects
in Concrete Structures," Designing for Creep and Shrinkage in Concrete
Structures, A CJ Publication, Vol. SP-76, pp. 193-300, American Concrete
Institute, Detroit, Michigan, 1982.
[36] Almudaiheem, Jamal A., and Hansen, Will, "Effect of Specimen Size and Shape
on Drying Shrinkage of Concrete," A CJ Materials Journal, Vol. 84, No.2,
pp. 130-135, Mar.-Apr. 1987.
[37] Almudaiheem, Jamal A., and Hansen, Will, "Ultimate Drying Shrinkage
of Concrete - Influence of Major Parameters," A CJ Materials Journal,
Vol. 84, No.3, pp. 217-223, May-June 1987.
[38] Portland Cement Association, Prevention of Plastic Cracking m Concrete.
Concrete Information Sheet, Structural and Railways Bureau: Chicago, Ill,
1955.
[39] Gowda, Hanume, "Effects of Retarding Admixtures on Plastic Shrinkage of
Portland Cement Paste," Research Report C-36-47L, Indiana State Highway
Commission, Aug. 1973.
[40] Randall, Frank A. Jr., "Field Study of Shrinkage-Compensating Cement Con
crete," Cedric Willson Symposium on Ezpansive Cement, A CJ Publication,
Vol. SP-64, pp. 239-257, Detroit, Michigan, 1977.
[41] Bazant, Zdenek P., and Chern, Jenn-Chuan, "Bayesian Statistical Prediction
of Concrete Creep and Shrinkage," Journal of ACJ, Vol. 81, No.4, pp. 319-330,
Jul.-Aug. 1984.
168
[42] Bazant, Z.P., Wittmann, F.H., Kim, J .K., and Alou, F., "Statistical Extrap
olation of Shrinkage Data - Part I: Regression," ACI Materials Journal,
Vol. 84, No.1, pp. 20-34, Jan.-Feb. 1987.
[43] Bazant, Z.P., Kim, J.K., Wittmann, F.H., and Alou, F., "Statistical Extrapola-
tion of Shrinkage Data Part II: Baysian Updating," ACI Materials Journal,
Vol. 84, No.2, pp. 83-91, Mar.-Apr. 1987.
[44] Bazant, Zdenek P., and Wang, Tong-Sheng, "Spectral Finite Element Analysis
of Random Shrinkage in Concrete," ASCE Journal, Structural Engineering
Div., Vol. 110, No.9, pp. 2196-2211, Sep. 1984.
[45] Lerch, W., "Plastic Shrinkage," Journal of ACI, Vol. 28, No.8, pp. 797-802,
1957.
[46] Isenberg J., "Properties of Concrete Change When Microcracking Occurs,"
Causes, Mechanism, and Control of Cracking in Concrete, A CI Publication,
Vol. SP-20, pp. 29-41, Detroit, Mechigan, 1968.
[47] Siang, Hwanghwei, Simultaneous Heat and Mass Transfer in a Porous Medium.
Ph. D. Thesis, Department of Mechanical Engineering, Kansas State Univer
sity: Manhattan, Kansas, 1981.
[48] Lankard, D.R., Walker, A.J., and Niesz, D.E., "Influence of Cement on Mois
ture Migration in Paste and Concrete as Related to the Durability of Concrete,"
Research Report FHWA-RD-74-54, U.S. Department of Transportation, Fed
eral Highway Administration, June 1974.
[49] Ravina, D., and Shalon, R., "Plastic Shrinkage Cracking," Journal of ACI,
Vol. 65, No.4, pp. 282-292, Apr. 1968.
[50] Van, Dijk J., and Boardman, V.R., "Plastic Shrinkage Cracking of Concrete," in
Proceedings of International RILEM Symposium on "Concrete and Reinforced
Concrete in Hot Countries, " BRS Institute of Technology, Haifa, Vol. 1, pp.
225-239, 1971.
[51] Illston, J .M., and Tajirian, A., "Computer Experiments on Environmentally
Induced Stresses in Unreinforced Concrete Pavement Slabs," Magazine of
Concrete Research, Vol. 29:101, pp. 175-190, Dec. 1977.
169
[52] Elkins, G.E., Robert R.L., and Kennedy, T.W., "Material Property Require
ments for Zero Maintenance of Continuously Reinforced Concrete Pavements,"
Transportation Research Record, No. 756, Concrete Pavements and Pavements
Overlays, Transportation Research Board, 1980.
[53J LaCourisere, Scott A., Darter, Michael L, and Smiley, Scott A., "Performance
of Continuously Reinforced Concrete Pavement in Illinois," Research Report
FHWA-IL-UI-172, Illinois State Department of Transportation, 1978.
[54] TRB, "Failure and Repair of Continuously Reinforced Concrete Pavement,"
Research Report NCHRP-SXN-60, Transportation Research Board, 1979.
[55] McCullough, B. Frank, Ma, J .C.M., and Noble, C.S., "Limiting Criteria for
the Design of Continuously Reinforced Concrete Pavements," Research Report
177-17, Center for Highway Research, The University of Texas at Austin, 1979.
[56J Gutierrez De Velasco, Manuel, and McCullough, B. Frank, "Summary Report
for 1978 Continuously Reinforced Concrete Pavement Condition Survey in
Texas," Research Report 177-20, Center for Highway Research, The University
of Texas 'at Austin, 1981.
[57J Dhamrait, Jagat Singh, "CRC Pavements in Illinois," Research Report FHWA
IL-PR-084, Illinois State Department of Transportation, 1978.
[58] Dhamrait, Jagat Singh, and Schwartz, Donald R., "Continuously Reinforced
Concrete Overlays on Existing Portland Cement Concrete Pavements," Re
search Report FHWA-IL-PR-80, Illinois State Department of Transportation,
1978.
[59J Powers, T.C., "A Discussion of Cement Hydration to the Curing of Concrete,"
Highway Research Board, Vol. 27, pp. 178-188, 1947.
[60] Gebler, Steven, "Predict Evaporation Rate and Reduce Plastic Shrinkage
Cracks," Concrete International, Vol. 5, No.4, pp. 19-22, Apr. 1983.
[61J , Hansen, T.C., "Effect of Wind on Creep and Drying Shrinkage of Hardened Ce
ment Mortar and Concrete," Materials Research and Standards, Vol. 6, No.1,
pp. 16-19, Jan, 1966.
170
[62] Klieger, P., "Effect of Mixing and Curing Temperature on Concrete Strength,"
Journal of ACI, Vol. 55, No. 54, pp. 1063-1981, June 1958.
[63] Mather, Bryant, "Case Histories of Unsatisfactory and Abnormal Field Per
formance of Concrete during Construction," Transportation Research Record,
No. 651, Transportation Research Board, 1977.
[64] Hester, Weston T., "Contracters and Production of Durable Air-Entrained
Concrete," ASCE Journal, Construction Dit1ision, Vol. 104: No 2, pp. 167-178,
June 1978.
[65) Rasoulian, M., "Evaluation of Various Coarse Aggregate Concrete," Research
Report FHWA-LA-83-166, Louisiana State Department of Transportation, Dec.
1983.
(66) McCullough, B.F., Abou-Ayyash, A., Hudson, W.R., and Randall, J.R., "De
sign of Continuously Reinforced Concrete Pavements for Highways," Research
Report NCHRP 1-5, Center for Highwity Research, The University of Texas at
Austin, Aug. 1975.
[67) Neville, A.M., Properties of Concrete. 3rd ed., Pitman Publishing Inc.: London,
1981.
[68] Halstead, N.J., "Use of Fly Ash in Concrete," National Cooperate Highway
Research Program, No. 127, Transportation Research Board, National Research
Council, Washington, D.C., Oct. 1986.
[69] McKerall, W.C., Ledbetter, W.B., and Teague, D., "Analysis of Fly Ashes
Produced in Texas," Research Report 240-1, Texas Transportation Institute,
Texas A&M University, 1981.
[70) McKerall, W.C., and Ledbetter, W.B., "Variability and Control of Class C
Fly Ash," Cement, Concrete, and Aggregate, ASTM, Vol. 4, No.2, pp. 87-95,
Winter, 1982.
[71] ACI Committee 209, "Effects of Concrete Constituents, Environment, and
Stress on the Creep and Shrinkage of Concrete," Symposium on Creep, Shrink
age, and Temperature Effects, ACI Publication, Vol. SP-27, pp. 1-42, Detroit,
Michigan, 1971.
171
[72} Winn, Dan P., Olsen, M.P.J., and Ledbetter, W.B., "Consolidation of Concrete
Pavement," Research Report 341-1F, Texas Transportation Institute, Texas
A&M University, 1984.
[73] Texas State Department of Highways and Public Transportation, Standard
Specification for Con8truction of Highways, Streets, and Bridges. SDHPT:
Austin, Sep. 1982.
172
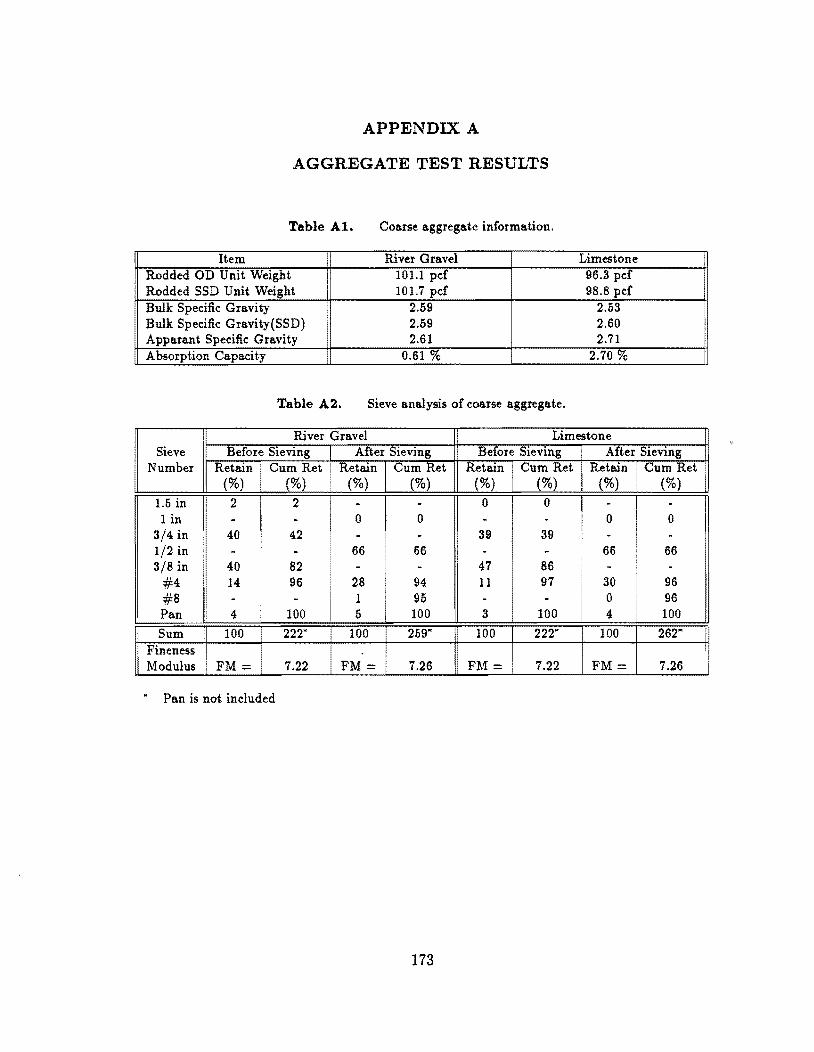
APPENDIX. A
AGGREGATE TEST RESULTS
Table AI. Coarse aggregate information.
Item River Gravel Limestone Rodded OD Unit Weight 101.1 pcf 96.3 pef Rodded SSD Unit Weight 101.7 pcf 98.8 pcf Bulk Specific Gravity 2.59 2.53 Bulk Specific Gravity(SSD) 2.59 2.60 Apparant Specific Gravity 2.61 2.71 Absorption Capacity 0.61 % 2.70 %
Table A2. Sieve analysis of coarse aggregate.
River Gravel Limestone Sieve Before Sieving After Sieving Before Sieving Aft
Number R(~:Jn Qrt • Retain Cum Ret Retain Cum Ret Retain Cum Ret·
(%) (%) (%) (%) (%) (%) 1.5 in 2 2 - - 0 0 - -1 in - - 0 0 - - 0 0
3/4 in 40 42 - - 39 39 - -1/2 in - - 66 66 - - 66 66 3/8 in 40 82 - - 47 86 - -
#4 14 96 28 94 11 97 30 96
I
#8 - - 1 95 - - 0 I
96 Pan 4 100 5 100 3 100 4 100
Sum 100 222- 100 259- 100 222- 100 262-Fineness
FM= I
!
Modulus FM = 7.:l:l I FM = 7.26 7.22 FM= 7.26
• Pan is not included
173
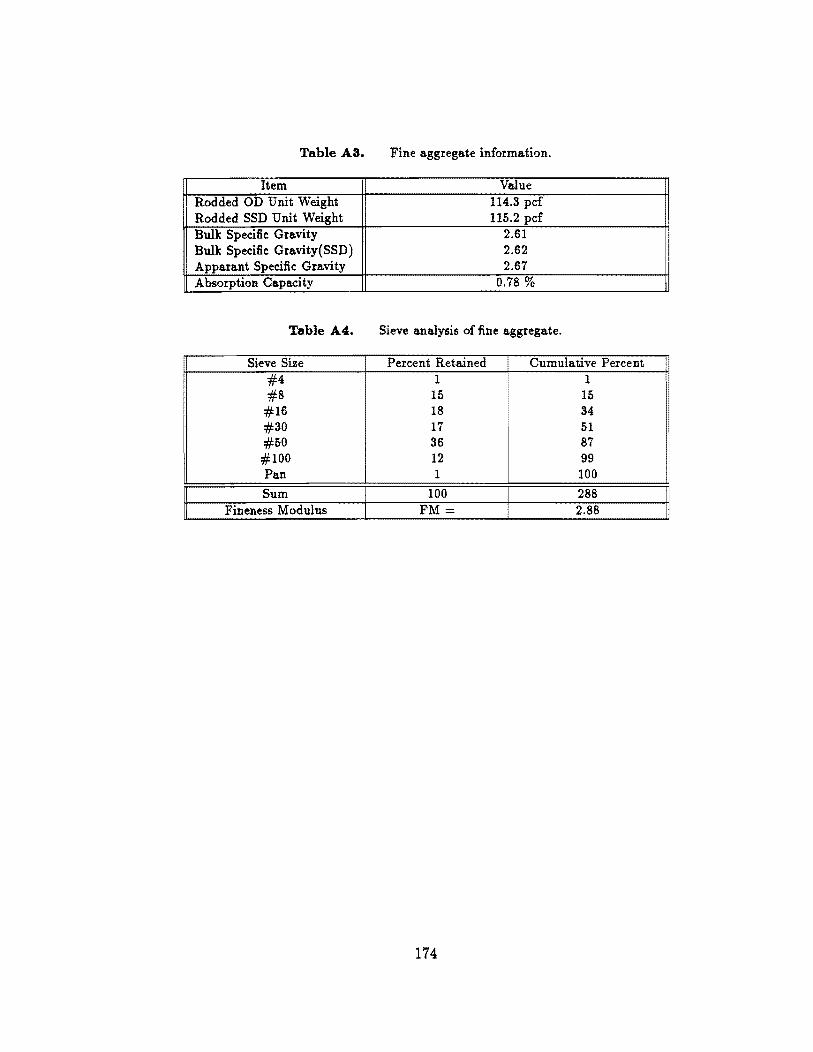
Table A3. Fine aggregate information.
Item Value Rodded OD Unit Weight 114.3 pc! Rodded SSD Unit Weight 115.2 pcf Bulk Specific Gravity 2.61 Bulk Specific Gravity(SSD) 2.62 Apparant Specific Gravity 2.67 Absorption Capacity 0.78 %
Table A4. Sieve analysis of fine aggregate.
Sieve Size Retained Cumulative Percent #4 #8 #16 #30 #50 #100 Pan
Sum Fineness Modulus
1 15 18 17 36 12 1
100 FM =
174
1 15 34 51 87 99 100
288 2.88

APPENDIX B
CHEMICAL AND PHYSICAL ,PROPERTIES OF CEMENT
Table B1. Chemical analysis of cement.
Chemical Component Weight Percent Calcium oxide \CaO~ 64.17 Silicone dioxide (Si02 ) 20.47 Aluminum oxide (AhOs) 5.31 Ferric oxide (Fe20s) 3.02 Magnesium oxide (MgO) 0.98 Sulfur trioxide (SOs) 2.82 Alkalies Na20 0.29
K20 0.61 Others 0.70 Loss 1.53 Total 96.50
Compounds Weight Percent Tricalcium Sillicate CsS 56.75 Dicalcium Silicate C2S 15.95 Tricalcium Aluminate CsA 9.82 Tetracalcium Alumino Ferrite C4AF 9.28 Gypsum CaS04 4.70 Total 99.00
Table B2. Physical properties of cement.
Physical Test
Surface Area: Blaine Surface Area: Wagner Turbidimeter
• -325
Type I Cement Finish mill # 1
175
Results 324 m2/kg 1941 cm2 /g
92.4 %

Table Cl.
Temperature Air
50°F
73°F 104°F
MIX Design
Plain
Fly Ash
Concrete 50°F 73°F 73°F 73°F 104°F ..
MIXIng Time
7 min 20 min 60 min 7 min
20 min 60 min
APPENDIX C
SSD water content and adjustment for trial batch (lb/cy).
River Gravel Limestone 1" Slump 1.5" Slump 2" Slump 1" Slump 1.5" Slump 2" Slump
-5.4 202 +5.4 -3.6 205 +3.6 -6.0 210 +6.0 -4.2 217 +4.2 -6.1 214 +6.1 -4.7 218 +4.7 -6.9 221 +6.9 -5.8 234 +5.8 -8.5 244 +8.5 -6.3 245 +6.3
II -8.5 244 +8.5 -6.3 245 +6.3 -11.9 251 +11.9 -10.1 247 +10.1 -10.5 293 +10.5 -11.6 298 +11.6 -10.6 228 +10.6 -12.6 232 +12.6 -12.7 237 +12.7 -15.3 238 +15.3 -14.4 289 +14.4 -16.5 297 +16.5
176
APPENDIX D
TEST RESULT SUMMARY
177

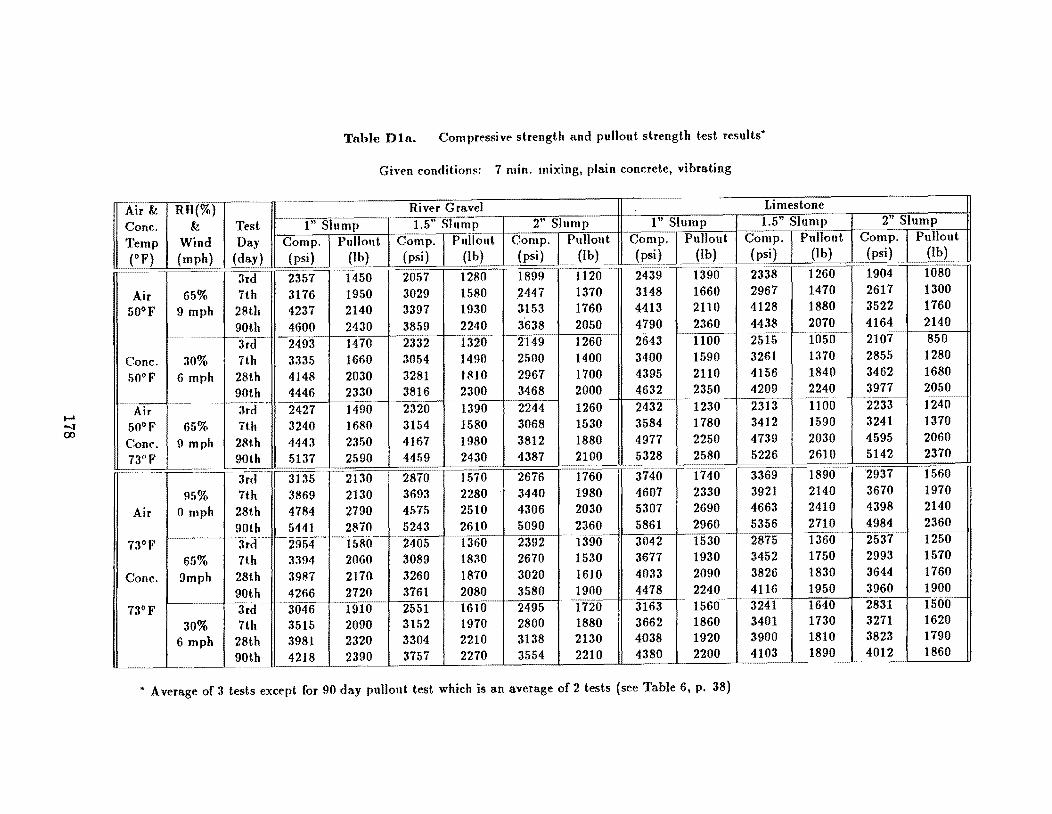
..... -r 00
Tnhle DIn. Comprt'ssivt' strength and pullout strength test results·
Given conditions: 7 min. mixing, plain concrete, vibrating
-------
Air k RU(%) River Gravel Limestone
Cone. k Test 1" Slump 1.5" Slump 2" Slump 1" Slump 1.5" Slump
Temp Wind Day Compo Pullout Compo PIlHollt Compo Pullout Compo Pullout Compo Pullout
(OF) (mph) (day) (psi) (Ib) (psi) (lb) (psi) (Ib) (psi) (lb) (psi) (Ib) cc=,'~~~c-
~~-- -==':,~ ~~~~~~~~,-"- ~_='''' ~~~::='cc
3rd 2357 1450 2057 1280 1899 ]]20 2439 1390 2338 1260
Air 65% 7th 3176 1950 3029 1580 ~2447 1370 3148 1660 2967 1470
50°F 9 mph 28th 4237 2140 3397 1930 3153 1760 4413 2110 4128 1880
90th 4600 2430 3859 2240 3638 2050 4790 2360 4438 2070 f---~ ~ ~ ~ -----
3rd- 2193 1320 2643 ~~--I-~~~c~
1470 2332 2149 1260 1100 2515 1050
Conc. 30% Hh 3335 1660 3054 ]490 2500 1400 3400 1590 3261 1370
50°F 6 mph 28th 4148 2030 3281 1810 2967 1700 4395 2110 4156 1840
90th 4446 2330 3816 2300 3468 2000 4632 2350 4209 2240 -~~ ;~
~ ------~ ~ ~ ~ ~ ~~
3~;r" ~------~~ -
f 1390 Air 2427 ]490 2320 2244 1260 2432 1230 2313 1100
50°F 65% nh 3240 1680 3154 1580 3068 1530 3584 1780 3412 1590
Con('. 9 mph 281.h 4443 2350 4167 1980 3812 1880 4977 2250 4739 2030
73°F 9mh 5137 2590 4459 2430 4387 2100 5328 2580 5226 2610 =cc, -----;:~ -
3740 3rd 3135 2130 2870 1570 2676 1760 1740 3369 1890
95% 7t.h 3869 2130 3693 2280 3440 1980 4607 2330 3921 2140
Air o mph 28th 4784 2790 4575 2510 4306 2030 5307 2690 4663 2410
90th 5441 2870 5243 2610 5090 2360 5861 2960 5356 2710
73°F f----- -'3rcC" 1------_.-
2954 --1580--~--
2405 1360 2392 1390 3042 1530 28~ 1360
65% 7th 3394 2060 3089 1830 2670 1530 3677 1930 3452 1750
Cone. 9mph 28t.h 3987 2170 3260 1870 3020 1610 4033 2090 3826 1830
90th 4266 2720 3761 2080 3580 1900 4478 2240 4116 1950
73°F 3rd 1560-~ ~ ~ ~~-----~~
3046 1910 2551 1610 2495 1720 3163 3241 1640
30% 7th 3515 2090 3152 1970 2800 1880 3662 1860 3401 1730
6 mph 28th 3981 2320 3304 2210 3138 2130 4038 1920 3900 1810
90th 4218 2390 3757 2270 3554 2210 4380 2200 4103 1890 --------
• Average of 3 tests except for 90 day pullout test which is an average of2 tests (see Table 6, p. 38)
2" Slump Compo Pullout (psi) (Ib)
1904 1080 2617 1300 3522 1760 4164 2140 2107 850 2855 1280 3462 1680 3977 2050
~~-
2233 1240 3241 1370 4595 2060 5142 2370
2937 1560 3670 1970 4398 2140 4984 2360 2537- I 12~~jj ~~~
2993 1570 3644 1760 3960 1900 2831 1500 3271 1620 3823 1790 4012 1860
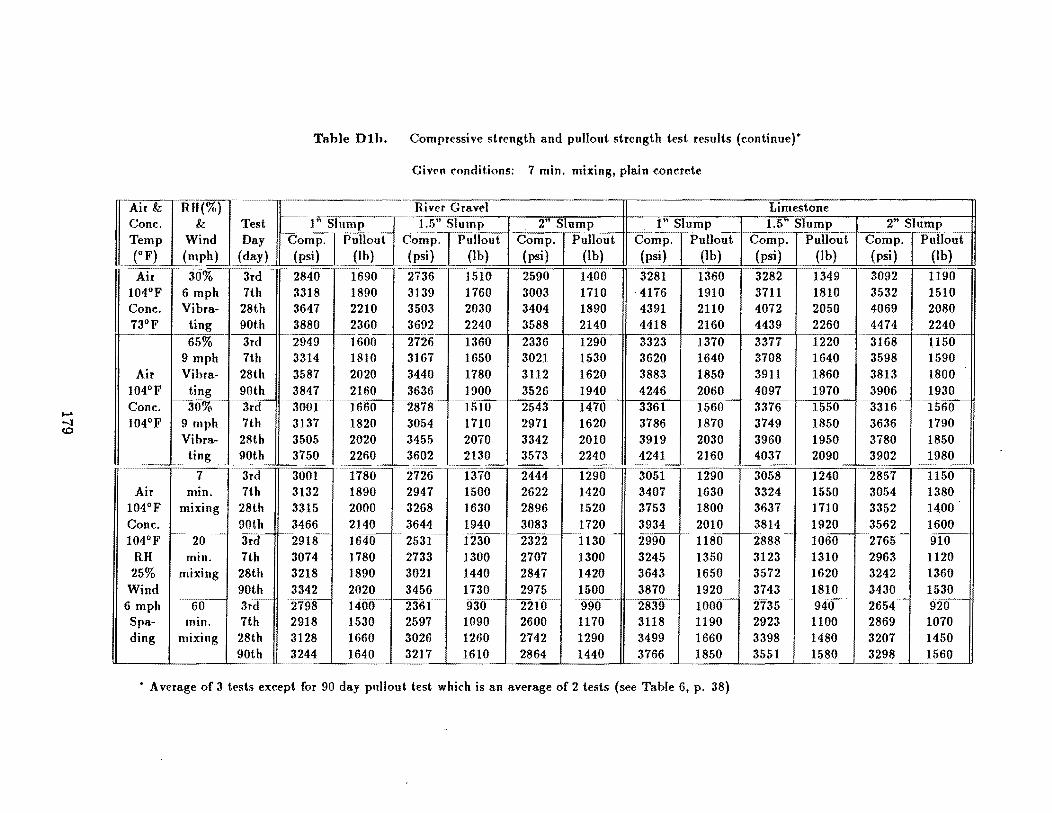
..... -.J co
Table DIb. Compressive strength and pullout strength test results (continue)"
Givf'n condit.ions: 7 min. mixing, plain concrete
Air & Rlf(%) River Gravel Limestone -~
Cone. & Test I" Slump 1.5" Slump 2" Slump I" Slump 1.5" Slump Temp Wind Day Compo Pullout Compo Pullout Compo Pullout Compo Pullout Compo Pullout (OF) (mph) (day) (psi) (Ib) (psi) (I b) (psi) (Ib) (psi) (Jh) (psi) (Ib)
Air 30% 3rd 2840 1690 2736 1510 ----
2590 1400 3281 1360 3282 1349 104°F 6 mph 7th 3318 1890 3139 1760 3003 1710 ·4176 1910 3711 1810 Cone. Vibra- 28th 3647 2210 3503 2030 3404 1890 4391 2110 4072 2050 73°F ting 90t.h 3880 2360 3692 2240 3588 2140 4418 2160 4439 2260
65% 3r<1 [-2949 1600- '2726 1360 2336 1290 3323 1370 3377 1220 9 mph 7th 3314 18]0 3167 1650 3021 1530 3620 1640 3708 1640
Air Vi bra- 28th 3587 2020 3440 1780 3112 1620 3883 1850 3911 1860 104°F ting 90th 3847 2160 3636 1900 3526 1940 4246 2060 4097 1970 Cone. 30% 3rcl 3001 fT660 2878~ 1510 2543 1470 3361 1560 3376~ 1550 104°F 9 mph 7th 3137 1820 3054 1710 2971 1620 3786 1870 3749 1850
Vi bra- 28th 3505 2020 3455 2070 3342 2010 3919 2030 3960 1950 t.ing 90th 3750 2260 3602 2130 3573 2240 4241 2160 4037 2090
,---~~
7 3rd 3001 1780 2726 0-
1370 2444 1290 3051- 1290 3058 1240 Air min. 7th 3132 1890 2947 1500 2622 1420 3407 1630 3324 1550
104°F mixing 28th 3315 2000 3268 1630 2896 1520 3753 1800 3637 1710 Cone. 90th 3466 2140 3644 1940 3083 1720 3934 2010 3814 1920 104°F
1---20
~~ ~~-',-
3rd '--2918- 1640 2531- ~1230 2322 i:i30~ 2990 1180 288-8- -1060 RH min. 7th 3074 1780 2733 1300 2707 1300 3245 1350 3123 1310 25% mixing 28th 3218 1890 3021 1440 2847 1420 3643 1650 3572 1620
Wind 90th 3342 2020 3456 1730 2975 1500 3870 1920 3743 1810 6 mph
-~~
3rd 279B ~ 1400 2361 930 2210 990 2839 ~~
1000 2735 940 60 Spa- min. 7th 2918 1530 2597 1090 2600 1170 3118 1190 2923 1100 ding mixing 28th 3128 1660 3026 1260 2742 1290 3499 1660 3398 1480
90th 3244 1640 3217 1610 2864 1440 3766 1850 3551 1580 --~ ,~~ --~ ~~
• Average of 3 tests except for 90 day pullout test which is an average of 2 tests (see Table 6, p. 38)
2" Slump Compo Pullout (psi) (lb) 3092 1190 3532 1510 4069 2080 4474 2240 3168 1150 3598 1590 3813 1800 3906 1930 3316 ~1560
3636 1790 3780 1850 I
3902 1980
2857 1150 3054 1380 3352 1400 3562 1600
~2i65~ -9f()
2963 1120 3242 1360 3430 1530 2654 920 2869 1070 3207 1450 3298 1560
~-'----

...... 00 o
c------ --------------
Mix Mixing Test Design Time Day
(min.) (day)
Tnble DIe. compr("ssive strf'ngt.h and pullout strength test results (continue)"
Givf'n conditions: Air & concrete temperatures 104°F, relative humidity = 30%, wind sp!"ed = 6 mph
River Grav!"l Limestone 1" Slump 1.5" SJunlp 2" Slump 1" Slump
---------1.5" Slump -; :fl-~~ (~:rTP~:~)1\t Compo Pullout Compo Pullout Compo Pullout Compo Pullout
(psi) __ (Ib) (psi) (Ib) (psi) (Ib) (psi) (Ib)
@l 3rd- r 2965 1430 2815 1360 2611 1320 328911400
,-----3218 1360
30% Rod- 7th 3003 1430 3027 1540 2894 1480 3598 1540 3568 1680 6 mph ding 28th 3375 1690 32M 1780 3241 1630 3841 1970 3893 1950
90th 3665 2140 3580 2000 3516 1910 4156 2140 4014 2020 ~~ ... ---------
20 lrd 2761 1600 2665 1670 2325 1290 3203 1450 3040 1370 min. 7th 2827 1620 2997 1790 2570 1460 3509 1580 3156 1540
mixing 28th 2959 1700 3154 2000 2973 1720 3845 1750 3691 1870 Plain 90th 3182 1950 3508 2260 3424 2030 4208 1970 3890 1910 Con- 60 3r(j- ---------=-- ~6() 2434
--1400 2180 1150 3069 1320 2950 1220 2556
crete min. 7th 2652 1600 2838 ]750 2370 1450 3391 1450 3025 1410 mixing 28th 2731 1670 3065 1900 2807 1690 3846 1720 3485 1680
90th 2984 1860 3356 1980 3154 1980 4084 1910 3643 1850
3n1 _-_-_= _-_-_=c _____ "--
2851 1700 2750 1580 2449 1320 3427 1680 3344 1580 7 min. 7th 3187 1850 2995 1710 2647 1640 3614 1810 3617 1750 mixing 28th 3363 2020 3110 1780 3088 - 4156 1980 3882 1830
Con- 90th 3502 2010 3440 2160 3260 2060 4435 2080 4124 1940 crete 20 lrd 2727 1560 2630 1470 2371 1510 333i 1540 3134 1480 with mm. 7th 2970 1680 2825 1690 2599 1550 3534 1650 3467 1660 Fly mlxmg 28th 3130 1950 3088 1790 2858 1670 3952 1890 3719 1830 Ash 90th 3381 2080 3214 1980 3142 2020 4271 2080 3940 2000
60 3rd 2693 1430 2544 ~40 1974 1080 3225 1430 2910 1310-mm. 7th 2811 1540 2700 1610 2168 1140 3378 1560 3236 1640
mixing 28th 2978 1680 2885 1750 2720 1630 3705 1880 3552 1730 90th 3162 1980 3086 1970 2990 1880 4311 2080 3712 1850
" A verage of 3 tests except for 90 day pullout test which is an average of 2 tests (see Table 6, p. 38)
2" Slump Compo Pullout (psi) (1~)
3261 1380 3480 1540 3679 1750 3929 2060
2691 1030 3020 1180 3391 1420 3558 1610 2582 930 2856 1020 3187 1270 3365 1340
3542 1630 3751 1820 3980 1910 4120 2010 3390 1630 3518 1790 3791 1930 4047 2030 3122 1560 3388 1680 3573 1740 3788 1890
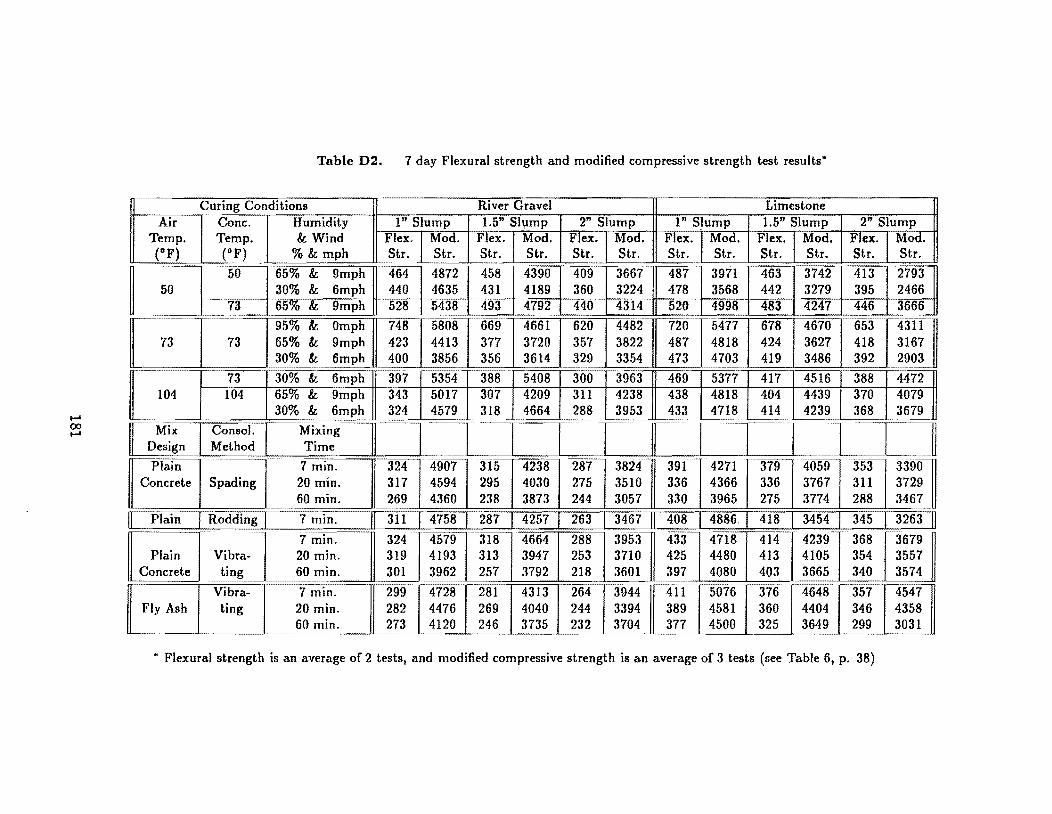
...... 00 ......
Table D2. 7 day Flexural strength and modified compressive strength test results·
r-~~
Curing Conditions River Gravel Limestone Air Cone. Humidity I" Slump 1.5" Slump 2" Slump I" Slump 1.5" Slump 2" Slump
Temp. Temp. & Wind Flex. Mod. Flex. Mod. Flex. Mod. Flex. Mod. Flex. Mod. Flex. Mod. (OF) (OF) %&mph Str. Str. 5tr. 5tr. 5tr. 8tr. 5tr. Str. 8tr. Str. 8tr. 5tr.
-487
~ 50 65% & 9mph 464 4872 458 4390 409 3667 3971 463 3742 413 2793
50 30% & 6mph 440 4635 431 4189 360 3224 478 3568 442 3279 395 2466 73 65% & 9mph 528 5438 493 4792 440 4314 520 4998 483 4247 446 3666 I
173 95% & Omph 748 5808 669 4661 620 4482 720 5477 678 4670 653 43\L 73 65% & 9mph 423 4413 377 3720 357 3822 487 4818 424 3627 418 3167 30% & 6mph 400 3856 356 3614 329 3354 473 4703 419 3486 392 2903
[104 73 30% & 6mph 397 5354 388 5408 300 3963 469 5377 417 4516 388 4472 104 65% & 9mph 343 5017 307 4209 311 4238 438 4818 404 4439 370 4079
30% & 6mph 324 4579 318 4664 288 3953 433 4718 414 4239 368 3679 ------
"Mix Con sol. IMrxrl1g~l ~ 1/ Design Method I Time I I r ~TrTLI I ~~ J
Plain 7 min. 324 4907 315 4238 287 3824= 391c- 4271 379 4059 ··353·· . 3390 ~ Concrete Spading 20 min. 317 4594 295 4030 275 3510 336 4366 336 3767 311 3729
60 min. 269 4360 238 3873 244 3057 330 3965 275 3774 288 3467
n Plain I Rodding I 7 min. II 311 I 4758 I 287 I 4257 I 263 I 3467 II 408 I 4886~ I 418 I 3454 I 345 I 3263 II 7 min. 4579 318 4664 288 3953 ~rn 4718 414 ·4239=·· 368 =3679
Plain Vibra- 20 min. 319 4193 313 3947 253 3710 425 4480 413 4105 354 3557 Concrete ting 60 min. 301 3962 257 3792 218 3601 397 4080 403 3665 340 3574
------
~·FIY A.h Vibra- t-n;;"n 299 14mT281 4313 264 3944 411 5076 376 464813TI454n Ling 20 min. 282 4476 269 4040 244 3394 389 4581 360 4404 346 4358
60 min. 273 4120 246 3735 232 3704 377 4500 325 3649 299 3031
• Flexural strength is an average of 2 tests, and modified compressive strength is an average of 3 tests (see Table 6, p. 38)
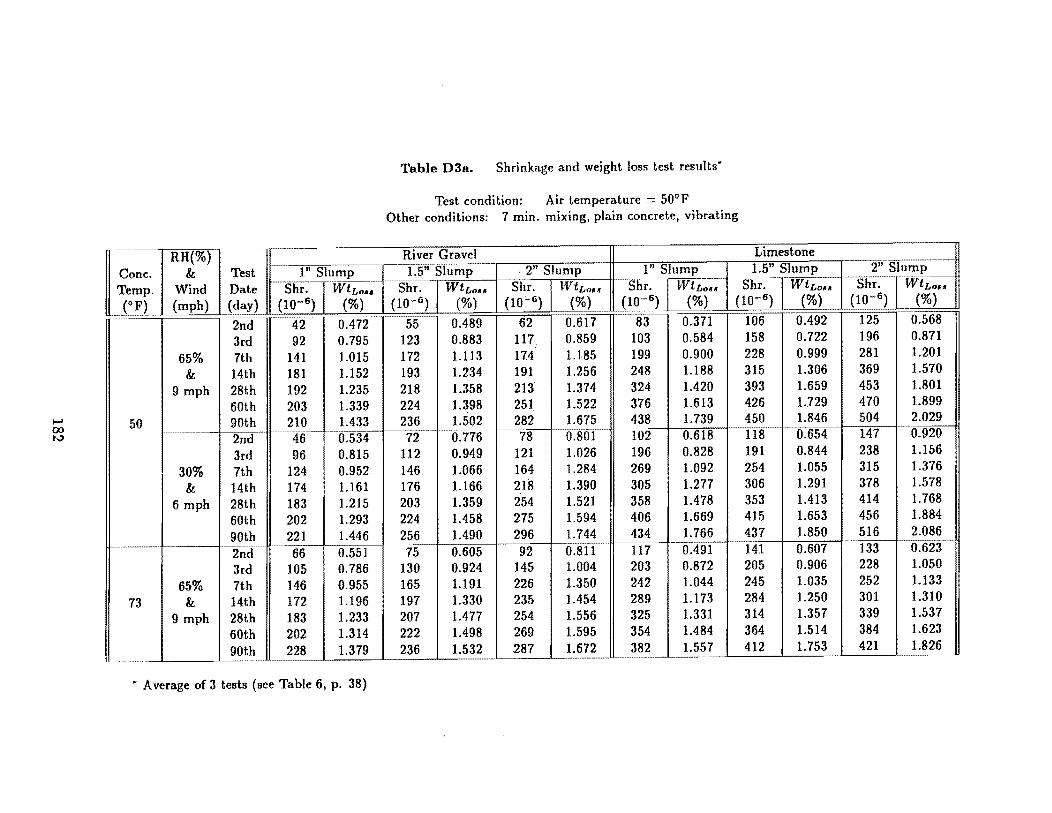
~
00 I'..:>
~n', RH(%)
& Test I" Slump WtL~ .. Temp. Wind Date Shr.
«IF) (mph) (day) (10-6 ) (%)
2nd 42 0.472 3rd 92 0.795
65% 7th 141 1.015 & 14th 181 1.152
9 mph 28th 192 1.235 60th 203 1.339
50 90th 210 1.433 2nd 46 0.534 3rd 96 0.815
30% 7th 124 0.952 & 14th 174 1.161
6 mph 28th 183 1.215 60th 202 1.293 90th 221 1.446 2nd 66 0.551 3rd 105 0.786
65% 7th 146 0.955 73 & 14th 172 1.196
9 mph 28th 183 1.233 60th 202 1.314 90th 228 1.379
• Average of 3 tests (see Table 6, p. 38)
Table D3a. Shrin~age and weight loss test results·
Test condition: Air temperature = 50°F Other conditions: 7 min. mixing, plain concrete, vibrating
River Gravel Limestone
1.5" Slump . 2" Slump 1" Slump 1.5" Slump 2" Slump .. -
Shr. Shr. WtLou Sbr. Shr. WtL(,.. WtLou WtLo .. Shr. WtLou
(10-6 ) (%) (10'-6) (%L (10- 6 ) (%) (10-6 ) (%) (10- 6 ) (%)
55 0.489 62 0.617 83 0.371 106 0.492 125 0.568
123 0.883 117 0.859 103 0.584 158 0.722 196 0.871
172 1.113 174 1.185 199 0.900 228 0.999 281 1.201
193 1.234 191 1.256 248 1.188 315 1.306 369 1.570
218 1.358 213 1.374 324 1.420 393 1.659 453 1.801
224 1.398 251 1.522 376 1.613 426 1.729 470 1.899
236 1.502 282 1.675 438 1.739 450 1.846 504 2.029 ~~~~~
72 11:776 78 .......... ,,-;;--
0.801 102 0.618 118 0.654 147 0.920
112 0.949 121 1.026 196 0.828 191 0.844 238 1.156
146 1.066 164 1.284 269 1.092 254 1.055 315 1.376
176 1.166 218 1.390 305 1.277 306 1.291 378 1.578
203 1.359 254 1.521 358 1.478 353 1.413 414 1.768
224 1.458 275 1.594 406 1.669 415 1.653 456 1.884
256 1.490 296 1.744 434 1.766 437 1.850 516 2.086
75 0.605 92 0.811 117 0.491 141 0.607 133 0.623
130 0.924 145 1.004 203 0.872 205 0.906 228 1.050
165 1.191 226 1.350 242 1.044 245 1.035 252 1.133
197 1.330 235 1,454 289 1.173 284 1.250 301 1.310
207 1.477 254 1.556 325 1.331 314 1.357 339 1.537
222 1.498 269 1.595 354 1.484 364 1.514 384 1.623
236 1.532 287 1.672 382 1.557 412 1.753 421 1.826
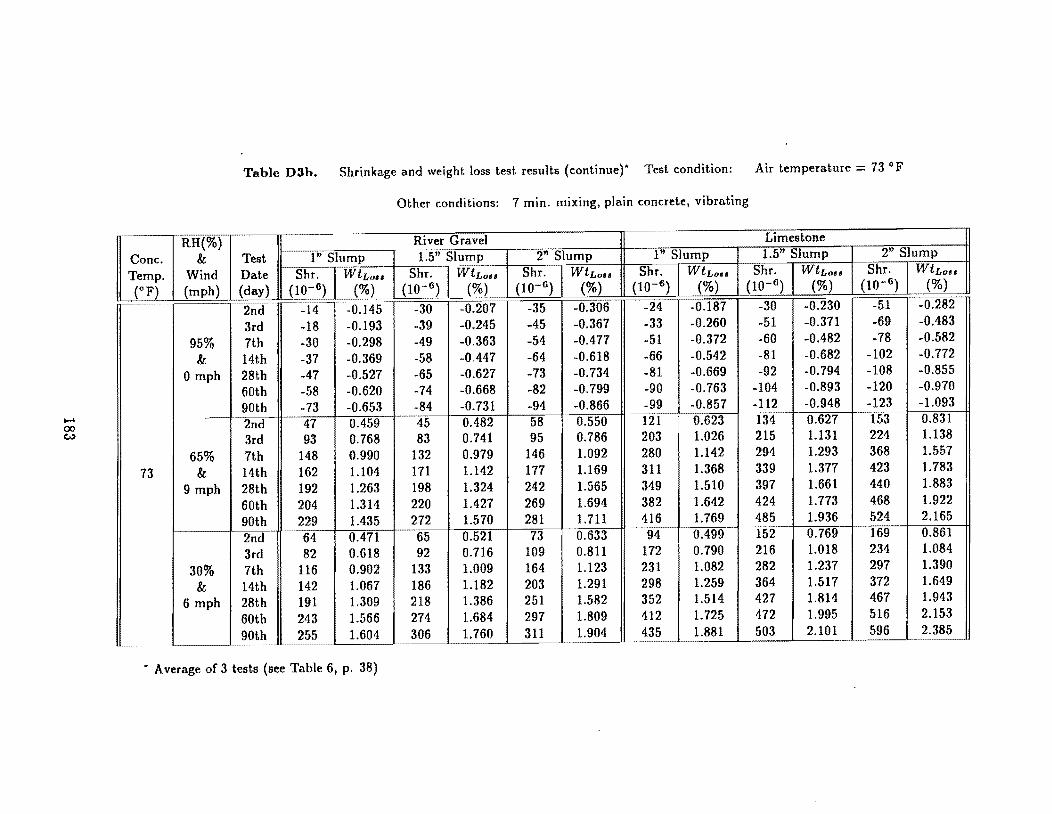
..... 00 (..)
Table D3b. Shrinkage and weight loss test results (continue)" Test condition: Air temperature = 73 of
Other conditions: 7 min. mixing, plain concrete, vibrating
RH(%) River Gravel Limestone
Cone. &; Test I" Slump 1.5" Slump 2" Slump I" Slump 1.5" Slump 2" Slump
Temp. Wind Date Shr. WtLou Shr. WLLo .. Shr. I WLLou Shr. WtLou Shr. WtLou Shr. WLLo ..
(OF) (mph) (day) (10- 6 ) (%) (10-~) (%) (10-6 ) (%) (10-6 ) (%) (10-6 ) (%) (to-6 ) (%)
2nd ~~~-
-0.145 -30 -0.207 -35 -0.306 -24 -0.187 -30 -0.230 -51 -0.282 -14 3rd -18 -0.193 -39 -0.245 -45 -0.367 -33 -0.260 -51 -0.371 -69 -0,483
95% 7th -30 -0.298 -49 -0.363 -54 -0,477 -51 -0.372 -60 -0.482 -78 -0.582
&; 14th -37 -0.369 -58 -0.447 -64 -0.618 -66 -0.542 -81 -0.682 -102 -0.772
o mph 28th -47 -0.527 -65 -0.627 -73 -0.734 -81 -0.669 -92 -0.794 -108 -0.855
60th -58 -0.620 -74 -0.668 -82 -0.799 -90 -0.763 -104 -0.893 -120 -0.970
90th -73 -0.653 -84 -0.731 -94 -0.866 -99 -0.857 -112 -0.948 -123 -1.093 -----
2nd 47 0.459 45 0.482 58 0.550 121 0.623 134 0.627 153 0.831
3rd 93 0.768 83 0.741 95 0.786 203 1.026 215 1.131 224 1.138
65% 7th 148 0.990 132 0.979 146 1.092 280 1.142 294 1.293 368 1.557
73 &; 14th 162 1.104 171 1.142 177 1.169 311 1.368 339 1.377 423 1.783
9 mph 28th 192 1.263 198 1.324 242 1.565 349 1.510 397 1.661 440 1.883
60th 204 1.314 220 1.427 269 1.694 382 1.642 424 1.773 468 1.922
90th 229 1.435 272 1.570 281 1.711 416 1.769 485 1.936 524 2.165
2nd 64 0.471 65 0.521 73 0.633 94 0.499 152 0.769 169 0.861
3rd 82 0.618 92 0.716 109 0.811 172 0.790 216 1.018 234 1.084
30% 7th 116 0.902 133 1.009 164 1.123 231 1.082 282 1.237 297 1.390
&; 14th 142 1.067 186 1.182 203 1.291 298 1.259 364 1.517 372 1.649
6 mph 28th 191 1.309 218 1.386 251 1.582 352 1.514 427 1.814 467 1.943
60th 243 1.566 274 1.684 297 1.809 412 1.725 472 1.995 516 2.153
90th 255 1.604 306 1.760 311 1.904 435 1.881 503 2.101 596 2.385 ~~~~~-
-~~~
• Average of 3 tests (see Table 6, p. 38)
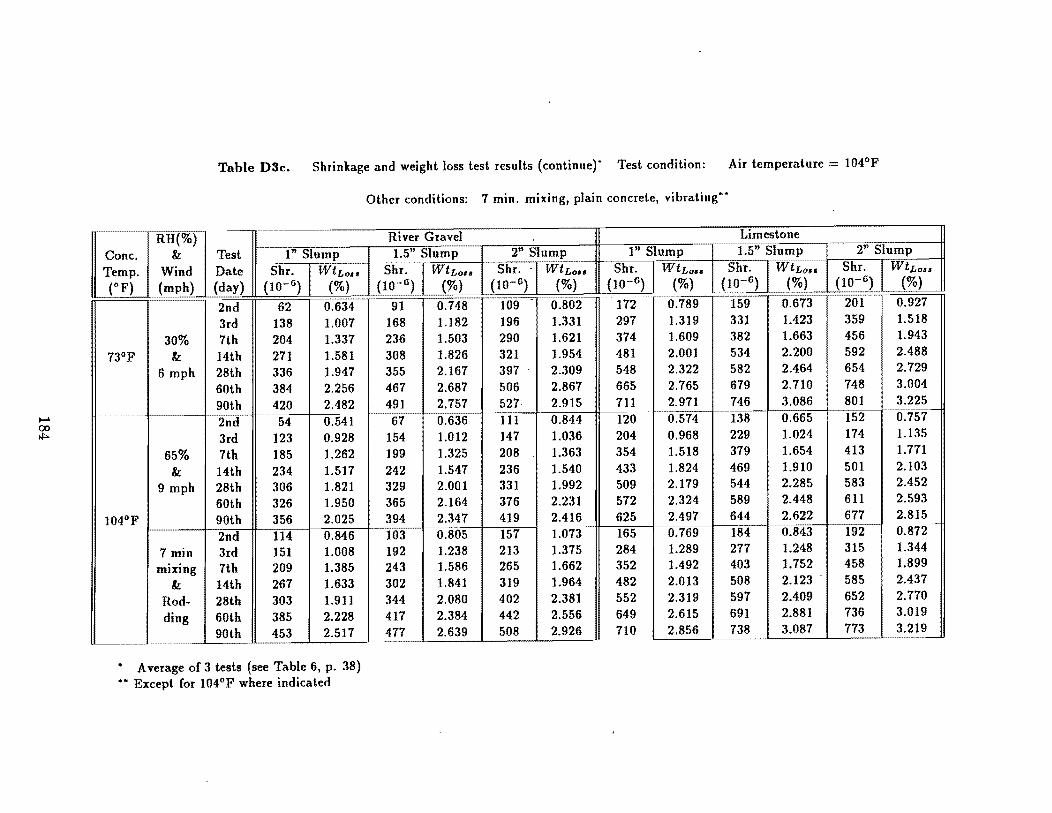
I-' 00 t$>.
Table D3c. Shrinkage and weight loss test results (continuer Test condition: Air temperature = 104°P
-RH(%)
Cone. &. Test 1" Slump Temp. Wind Date Shr. I WtLou (OF) (mph) (day) (10-6) (%)
2nd 62 0.634 3rd 138 1.007
30% 7th 204 1.337 73°P &. 14th 271 1.581
6 mph 28th 336 1.947 60th 384 2.256 90th 420 2.482 2nd 54 0.541 3rd 123 0.928
65% 7th 185 1.262 &. 14th 234 1.517
9 mph 28th 306 1.821 60th 326 1.950
104°P 90th 356 2.025 2nd 114 0.846
7 min 3rd 151 1.008 mixing 7th 209 1.385
&. 14th 267 1.633 Rod- 28th 303 1.911 ding 60th 385 2.228
90th 453 2.517
• Average of 3 tests (see Table 6, p. 38) •• Except for 104°P where indicated
Other conditions: 7 min. mixing, plain concrete, vibrating··
River Gravel Limestone
1.5" Slump 2" Slump I" Slump 1.5" Slump 2" Slump
Shr. WtLou Shr. - WtLou Shr. WtL066 Shr. WtLou Shr. WtLou
(lo~6L (%) (10-6) (%) (10-6 ) (%) (10-6 ) (~l (10-6 ) (%)
91 0.748 109 0.802 172 0.789 159 0.673 201 0.927
168 1.182 196 1.331 297 1.319 331 1.423 359 1.518
236 1.503 290 1.621 374 1.609 382 1.663 456 1.943
308 1.826 321 1.954 481 2.001 534 2.200 592 2.488
355 2.167 397 2.309 548 2.322 582 2.464 654 2.729
467 2.687 506. 2.867 665 2.765 679 2.710 748 3.004
491 2.757 527· 2.915 711 2.971 746 3.086 801 3.225 -----------------
67 lf636 111 0.844 120 0.574 138 0.665 152 0.757
154 1.012 147 1.036 204 0.968 229 1.024 174 1.135
199 1.325 208 1.363 354 1.518 379 1.654 413 1.771
242 1.547 236 1.540 433 1.824 469 1.910 501 2.103
329 2.001 331 1.992 509 2.179 544 2.285 583 2.452
365 2.164 376 2.231 572 2.324 589 2.448 611 2.593
394 2.347 419 2.416 625 2.497 644 2.622 677 2.815 ----------
103 0.805 151 1.073 165 0.769 184 0:843 192 0.872
192 1.238 213 1.375 284 1.289 277 1.248 315 1.344
243 1.586 265 1.662 352 1.492 403 1.752 458 1.899
302 1.841 319 1.964 482 2.013 508 2.123 - 585 2.437
344 2.080 402 2.381 552 2.319 597 2.409 652 2.770
417 2.384 442 2.556 649 2.615 691 2.881 736 3.019
477 2.639 508 2.926 710 2.856 738 3.087 773 3.219 -
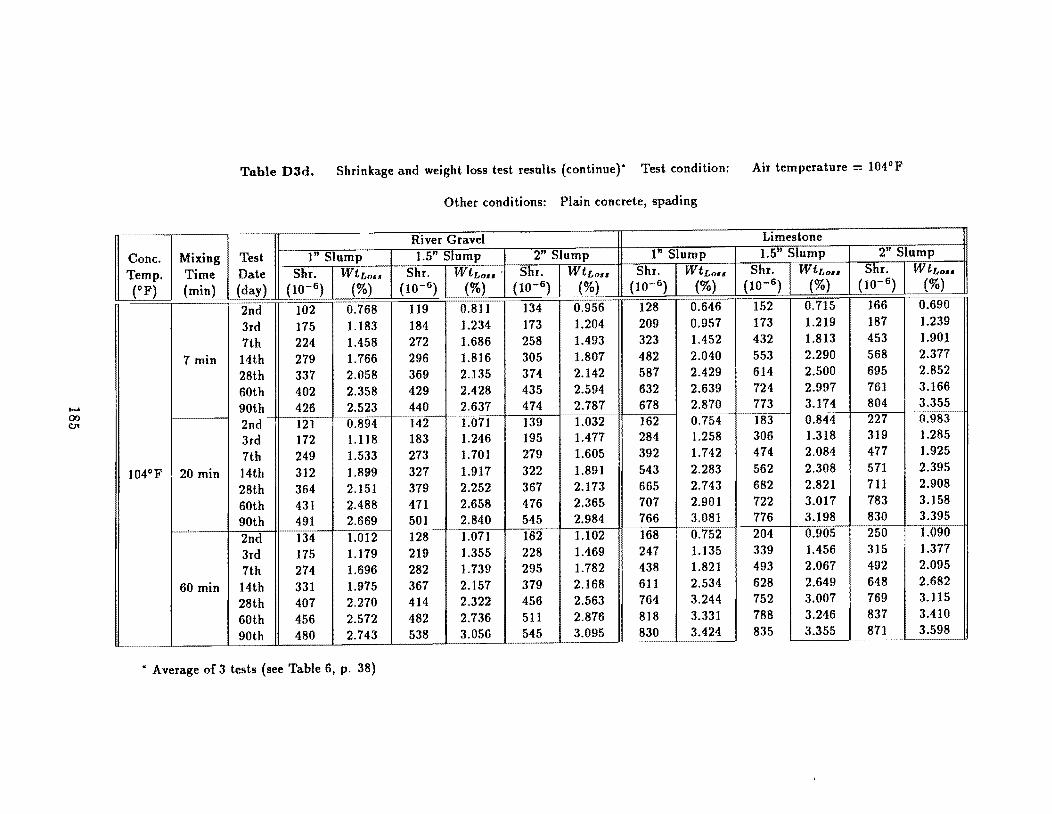
...... 00 CTc
Table D3d. Shrinkage and weight loss test results (continue)· Test condition: Air temperature = 104°F
Other conditions: Plain concrete, spading
River Gravel Limestone
Cone. Mixing Test 1" Slump 1.5" Slump 2" Slump 1" Slump 1.5" Slump 2" Slump
Temp. Time Date Shr. WtL" .. Shr. WtLolI . Shr. WtLou Shr. WtLou Shr. WtLou Shr. WtLou
(OF) (mitt) (day) (10-6 ) (%) (10-6 ) (%) (to-6 ) (0/«» (10-6 ) (%) (10-6 ) (%) (10- 6 ) (%)
2nd 102 0.768 119 0.811 134 0.956 128 0.646 152 0.715 166 0.690
3rd 175 1.183 184 1.234 173 1.204 209 0.957 173 1.219 187 1.239
7th 224 1.458 272 1.686 258 1.493 323 1.452 432 1.813 453 1.901
7 min 14th 279 1.766 296 1.816 305 1.807 482 2.040 553 2.290 568 2.377
28th 337 2.058 369 2.135 374 2.142 587 2.429 614 2.500 695 2.852
60th 402 2.358 429 2.428 435 2.594 632 2.639 724 2.997 761 3.166
90th 426 2.523 440 2.637 474 2.787 678 2.870 773 3.174 804 3.355
2nd 142 ~ ........
1.032 O:ts.r-121 0.894 1.071 139 162 183 0.844 227 0.983
3td 172 1.118 183 1.246 195 1.477 284 1.258 306 1.318 319 1.285
7th 249 1.533 273 1.701 279 1.605 392 1.742 474 2.084 477 1.925
104°F 20 min 14th 3]2 1.899 327 1.917 322 1.891 543 2.283 562 2.308 571 2.395
28th 364 2.151 379 2.252 367 2.173 665 2.743 682 2.821 711 2.908
60th 431 2.488 471 2.658 476 2.365 707 2.901 722 3.017 783 3.158
90th 491 2.669 501 2.840 545 2.984 766 3.081 776 3.198 830 3.395
2nd 134 1.012 128 1.071 162 1.102 168 0.752 204 0.905 250 1.090
3rd 175 ].179 219 1.355 228 1.469 247 1.]35 339 1.456 315 1.377
7th 274 1.696 282 1.739 295 1.782 438 1.821 493 2.067 492 2.095
60 min 14th 331 1.975 367 2.157 379 2.168 6)] 2.534 628 2.649 648 2.682
28th 407 2.270 414 2.322 456 2.563 764 3.244 752 3.007 769 3.115
60th 456 2.572 482 2.736 511 2.876 8]8 3.331 788 3.246 837 3.4 to
90th 480 2.743 538 3.056 545 3.095 830 3.424 835 3.355 871 3.598
* Average of 3 tests (see Table 6, p. 38)
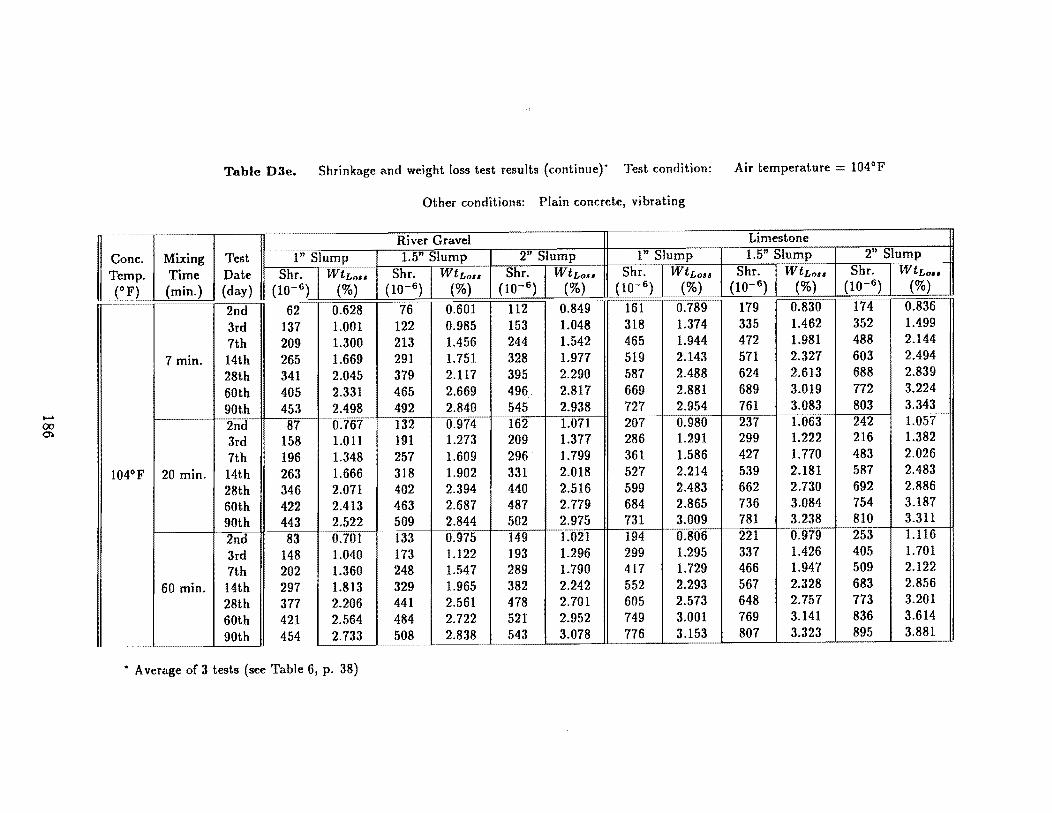
...... 00 0)
Table D3e. Shrinkage and weight loss test results (continuer Test condition: Air temperature = 104°F
Other conditions: Plain concrete, vibrating
River Gravel Limestone
Cone. Mixing Test I" Slump 1.5" Slump 2" Slump 1" Slump 1.5" Slump 2" Slump
Temp. Time Date Shr. ~WtLM6 Shr. WtLou Shr: WtLo .. Shr. WtLou Shr. WtLou Shr. WtLo ..
(OF) (min.) (day) (10-6) (%) ( 10-6) (%) (10-6 ) (%) (1O~6L J%) (10-6 ) (%) (10- 6 ) (%) ,--~
2nd 62 0.628 76 0.601 112 0.849 161 0.789 179 0.830 174 0.836
3rd 137 1.001 122 0.985 153 1.048 318 1.374 335 1.462 352 1.499
7th 209 1.300 213 1.456 244 1.542 465 1.944 472 1.981 488 2.144
7 min. 14th 265 1.669 291 1.751 328 1.977 519 2.143 571 2.327 603 2.494
28th 341 2.045 379 2.117 395 2.290 587 2.488 624 2.613 688 2.839
60th 405 2.331 465 2.669 496. 2.817 669 2.881 689 3.019 772 3.224
90th 453 2.498 492 2.840 545 2.938 727 2.954 761 3.083 803 3.343
2nd 87 0.767 132 0.974 162 1.071 201 0.980 237 1.063 242 1.0-gr
3rd 158 1.011 191 1.273 209 1.377 286 1.291 299 1.222 216 1.382
7th 196 1.348 257 1.609 296 1.799 361 1.586 427 1.770 483 2.026
104°F 20 min. 14th 263 1.666 318 1.902 331 2.018 527 2.214 539 2.181 587 2.483
28th 346 2.071 402 2.394 440 2.516 599 2.483 662 2.730 692 2.886
60th 422 2.413 463 2.687 487 2.779 684 2.865 736 3.084 754 3.187
90th 443 2.522 509 2.844 502 2.975 731 3.009 781 3.238 810 3.311
2nd 83 0.701 133 0.975 149 1.021 194 0.806 221 0.979 253 1.116
3rd 148 1.040 173 1.122 193 1.296 299 1.295 337 1.426 405 1.701
7th 202 1.360 248 1.547 289 1.790 417 1.729 466 1.947 509 2.122
60 min. 14th 297 1.813 329 1.965 382 2.242 552 2.293 567 2.328 683 2.856
28th 377 2.206 441 2.561 478 2.701 605 2.573 648 2.757 773 3.201
60th 421 2.564 484 2.722 521 2.952 749 3.001 769 3.141 836 3.614
90th 454 2.733 508 2.838 543 3.078 776 3.153 807 3.323 895 3.881 - ~~~~~~- ~~~~~-~~~~
* Average of 3 tests (see Table 6, p. 38)
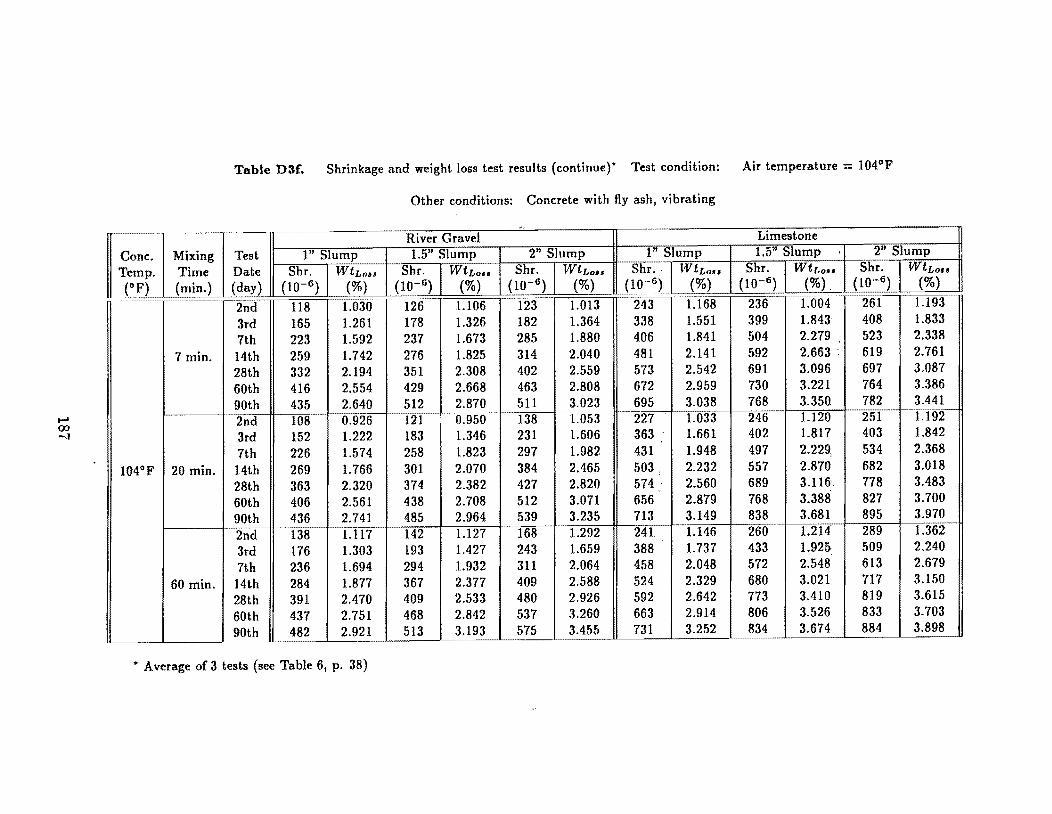
.... 00 -1
Table D3£. Shrinkage and weight loss test results (continuer Test condition: Air temperature = 104°F
Other conditions: Concrete with fly ash, vibrating
~------r-- -River Gravel Limestone
Cone. Mixing Test I" Slump 1.5" Slump 2" Slump I" Slump 1.5" Slump 2" Slump
Temp. Time Date Shr. WtLou Shr. WtLou Shr. WtLou Shr .. lVtLou Shr. WtLo .. Shr. WtLou
(OF) (min.) (day) (10- 6 ) (%) (10-6 ) (%) (10-6 ) (%) (10-6 ) (%) (10-6 ) (%). (10- 6 ) (%)
2nd 118 1.030 126 1.106 123 1.013 243 1.168 236 1.004 261 1.193
3rd 165 1.261 178 1.326 182 1.364 338 1.551 399 1.843 408 1.833
7th 223 1.592 237 1.673 285 1.880 406 1.841 504 2.279 523 2.338
7 min. 14th 259 1.742 276 1.825 314 2.040 481 2.141 592 2.663 . 619 2.761
28th 332 2.194 351 2.308 402 2.559 573 2.542 691 3.096 697 3.087
60th 416 2.554 429 2.668 463 2.808 672 2.959 730 3.221 764 3.386
90th 435 2.640 512 2.870 511 3.023 695 3.038 768 3.350 782 3.441
2nd 108 0.926 121 0.950 138 1.053 227 1.033 246 1.120 251 1.192-
3rd 152 1.222 183 1.346 231 1.606 363 . 1.661 402 1.817 403 1.842
7th 226 1.574 258 1.823 297 1.982 431 1.948 497 2.229, 534 2.368
104°F 20 min. 14th 269 1.766 301 2.070 384 2.465 503. 2.232 557 2.870 682 3.018
28th 363 2.320 374 2.382 427 2.820 574 . 2.560 689 3.116 778 3.483
60th 406 2.561 438 2.708 512 3.071 656 2.879 768 3.388 827 3.700
90th 436 2.741 485 2.964 539 3.235 713 3.149 838 3.681 895 3.970
2nd 138 1.117 142 1.127 168 1.292 241 1.146 260 1.214 289 1.362
3rd 176 1.303 193 1.427 243 1.659 388 1.737 433 1.925- 509 2.240
7th 236 1.694 294 1.932 311 2.064 458 2.048 572 2.548 613 2.679
60 min. 14th 284 1.877 367 2.377 409 2.588 524 2.329 680 3.021 717 3.150
28th 391 2.470 409 2.533 480 2.926 592 2.642 773 3.410 819 3.615
60th 437 2.751 468 2.842 537 3.260 663 2.914 806 3.526 833 3.703
90th 482 2.921 513 3.193 575 3.455 731 3.252 834 3.674 884 3.898
.. Average of 3 tests (see Table 6, p. 38)
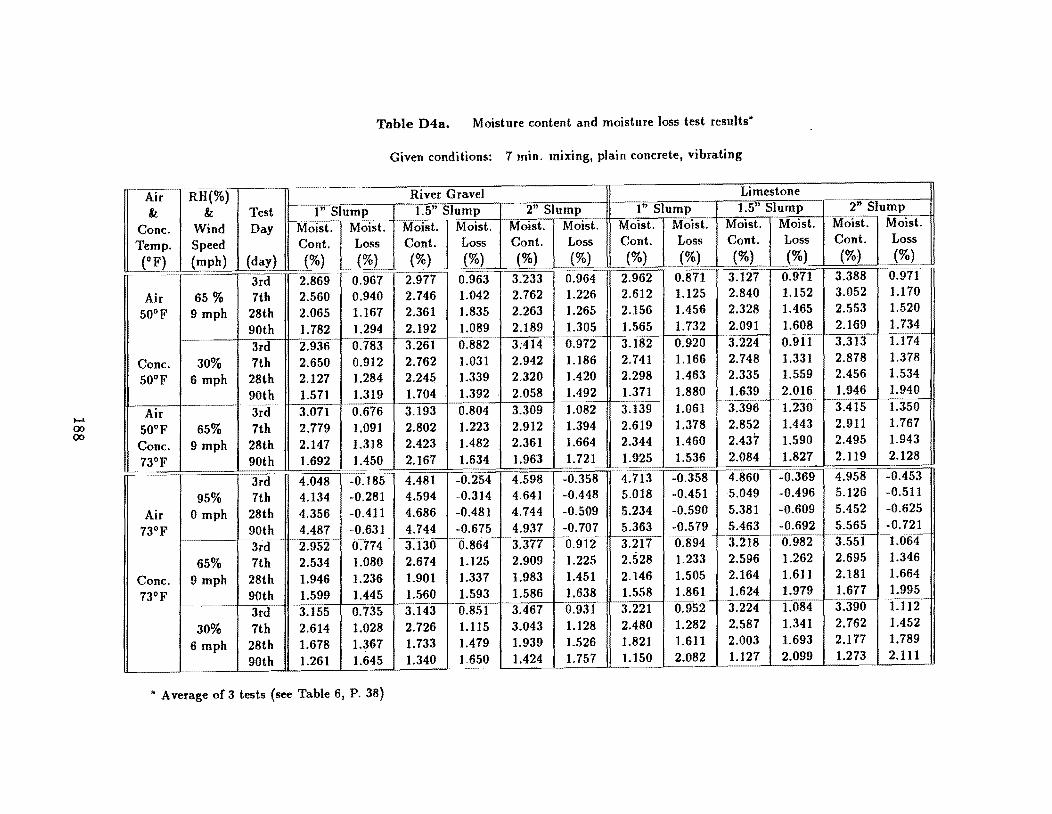
...... 00 00
Table D4a. Moisture content and moisture loss test results·
Given conditions: 7 min. mixing, plain concrete, vibrating
Air RH(%) Rivet Gravel Limestone
& & Test I" Slump 1.5" Slump 2" Slump 1" Slump 1.5" Slump
Cone. Wind Moist. MOist. Moist. Moist. Moist. Moist. Moist. Moist. Moist. Moist. Day Temp. Speed Cont. Loss Cont. Loss Cont. Loss Cont. Loss Cont. Loss
(OF) (mph) (day) (%) (%) J~}~ (%) (%) (%) (%) (%) (%) (%) ~~~
~,,~~~~c:-
3rd 2.869 0.967 2.977 0.963 3.233 0.964 2.962 0.871 3.127 0.971
Air 65 % 7th 2.560 0.940 2.746 1.042 2.762 1.226 2.612 1.125 2.840 1.152
50°F 9 mph 28th 2.065 1.167 2.361 1.835 2.263 1.265 2.156 1.456 2.328 1.465
90th 1.782 1.294 2.192 1.089 2.189 1.305 1.565 1.732 2.091 1.608 -~~
3rd 2.936 0.783 3.261 0.882 3:414 ~-~~-
-:J.182 0.972 0.920 3.224 0.911
Cone. 30% 7th 2.650 0.912 2.762 1.031 2.942 1.186 2.741 1.166 2.748 1.331
50°F 6 mph 28th 2.127 1.284 2.245 1.339 2.320 1.420 2.298 1.463 2.335 1.559
90th 1.571 1.319 1.704 1.392 2.058 1.492 1.371 1.880 1.639 2.016
Air 3rd ~~
3.071 ~~~ 3.-396
0.676 3.193 0.804 3.309 1.082 3.139 1.061 1.230
50°F 65% 7th 2.779 1.091 2.802 1.223 2.912 1.394 2.619 1.378 2.852 1.443
Cone. 9 mph 28th 2.147 1.318 2.423 1.482 2.361 1.664 2.344 1.460 2.437 1.590
73°F 90th 1.692 1.450 2.167 1.634 1.963 1.721 1.925 1.536 2.084 1.827 L~~ ~ ~C=~~
3rd 4.048 -0.185 4.481 -0.254 4.598 -0.358 4.713 -0.358 4.860 -0.369
95% 7th 4.134 -0.281 4.594 -0.314 4.641 -0.448 5.018 -0.451 5.049 -0.496
Air o mph 28th 4.356 -0.411 4.686 -0.481 4.744 -0.509 5.234 -0.590 5.381 -0.609
73°F 90th 4.487 -0.631 4.744 -0.675 4.937 -0.707 5.363 -0.579 5.463 -0.692
3rd 2.952 0.774 '3:130-'<i:864 "-3.377 0.912 3.217 0.894 3.218 0.982
65% 7th 2.534 1.080 2.674 1.125 2.909 1.225 2.528 1.233 2.596 1.262
Cone. 9 mph 28th 1.946 1.236 1.901 1.337 1.983 1.451 2.146 1.505 2.164 1.611
73°F 90th 1.599 1.445 1.560 1.593 1.586 1.638 1.558 1.861 1.624 1.979
3rd 3.155 0.735 3.143 0.851 3.467 0.931 .3.221 0.952 3.224 1.084
30% 7th 2.614 1.028 2.726 1.115 3.043 1.128 2.480 1.282 2.587 1.341
6 mph 28th 1.678 1.367 1.733 1.479 1.939 1.526 1.821 1.611 2.003 1.693
90th 1.261 1.645 1.340 1.650 1.424 1.757 1.150 2.082 1.127 2.099 --'----
• Average of 3 tests (see Table 6, P. 38)
~2" Slump ~~-~ ~~----
Moist. Moist. Cont. Loss (%) (%)
3.388 0.971 3.052 1.170 2.553 1.520 2.169 1.734 3.313 1.174 2.878 1.378 2.456 1.534 1.946 1.940 3.415 1.350 2.911 1.767 2.495 1.943 2.119 2.128
4.958 -0.453 5.126 -0.511 5.452 -0.625 5.565 -0.721 3~551 T.064 2.695 1.346 2.181 1.664 1.677 1.995 ~~~
3.390 1.112 2.762 1.452 2.177 1.789 1.273 2.111

...... 00 <0
Table D4b. Moisture content and moisture Joss test results (continue)*
Given conditions: 7 min. mixing, plain concrete, vibrating
Air RH(%) River Gravel Limestone & & Test I" Slump 1.5" Slump 2" Slump 1" Slump 1.5" Slump
Cone. Wind Day ------;~
Moist. Moist. Moist. Moist. Moist. Moist. Moist. Moist. Moist. Moist. Temp. Speed Cont. Loss Cont. Loss Cont. Loss Cont. Loss Cont. Loss (OF) (mph) (day) (%) (%) (%) (%) (%) (%) (%) (%) (%) (%) Air 3rd '-----"'197 0:775 :U64 0.834 3.438 1.430 3.029 1.092 3.228 1.350
104°F 30% 7th 2.752 1.027 2.631 1.103 3.058 1.343 2.786 1.275 2.930 2.483 Cone. 6 mph 28th 1.560 1.737 1.696 1.576 1.889 2.048 1.463 1.924 1.901 2.857 73°F 90th 0.946 2.138 1.287 2.007 1.155 2.363 0.749 2.794 1.271 3.193
3rd 3.107 0.732 3.195 0.822 3.351 0.988 3.274 1.117 3.330 1.170 Air 65% 7th 2.271 1.189 2.344 1.284 2.560 1.406 2.805 1.337 2.829 1.445
104°F 9 mph 28th 1.556 1.450 1.731 1.663 1.874 1.963 1.712 1.811 1.864 1.970 90th 0.867 1.846 0.993 2.042 1.012 2.235 0.984 2.518 1.334 2.425 3rd 2.988 0.716 3.120 0.827 ,3.366 0.853 3.348 1.012 3.499 1.150
Cone. 30% 7th 2.494 1.117 2.562 1.334 2.633 1.395 2.941 1.373 3.011 1.446 104°F 6 mph 28th 1,495 1.629 1.550 1.862 1.860 2.051 1.538 2.069 1.635 2.133
90th 0.857 1.851 0.952 2.161 1.054 2.246 0.679 2.561 0.955 2.582
Air 3rd 3.022 0.830 ~;---
3.019 0.723 3.117 0.854 2.772 0.735 2.844- 0.971 104°F 7 min. 7th 2.247 1.001 2.374 1.085 2.436 1.131 1.879 1.448 2.183 1,402 Cone. mixing 28th 1.283 1.764 1.464 1.786 1.495 2.041 1.265 2.096 1.310 2.074 104°F 90th 0.922 1.991 0.911 2.015 0.861 2.330 0.752 2.524 0.886 2.587
RH 3rd 3--:-198 0.951 3.109 0.894 3.177 0.962 3.027 0.797 3.017 1.524 30% 20 min. 7th 2.357 1.39] 2.440 1.351 2.557 1.273 1.976 1.468 2.041 2.354
Wind mixing 28th ].799 1.901 1.913 1.856 2.082 2.333 ].312 2.745 0.768 3.218 6 mph 90th 1.117 2.322 1.127 2.514 1.003 2.546 0.724 3.093 0.597 3.354
3rd 3.368 0.960 3.343 0.976 3,468 1.028 3.361 0.843 3.582 1.738 Spa- 60 min. 7th 2.466 1.513 2.559 1.518 2.674 1.315 2.695 1.573 2.837 2.467 ding mixing 28th 2.054 2.023 2.033 2.053 2.188 2.390 1.403 2.999 1.652 3.406
90th 1.286 2.636 1.254 2.674 1.161 2.622 0.814 3.201 0.941 3.638
• Average of 3 tests (see Table 6, P. 38)
2" Slump Moist. Moist. Cont. Loss (%) (%)
3.267 1.365 2.948 2.532 2.115 2.988 0.837 3.465 3,454 1.147 2.897 1,498 1.959 2.100 1.317 2.543 3.610 1.185 3.109 1.586 1.750 2.296 0.940 2.675
2.963 0.936 2.453 1.432 1.575 2.101 1.091 2,433 3.055 1.129 2.564 1.262 1.737 1.781 1.006 2.556 3.503 1.022 2.916 1.506 1.829 1.902 1.09] 2.649
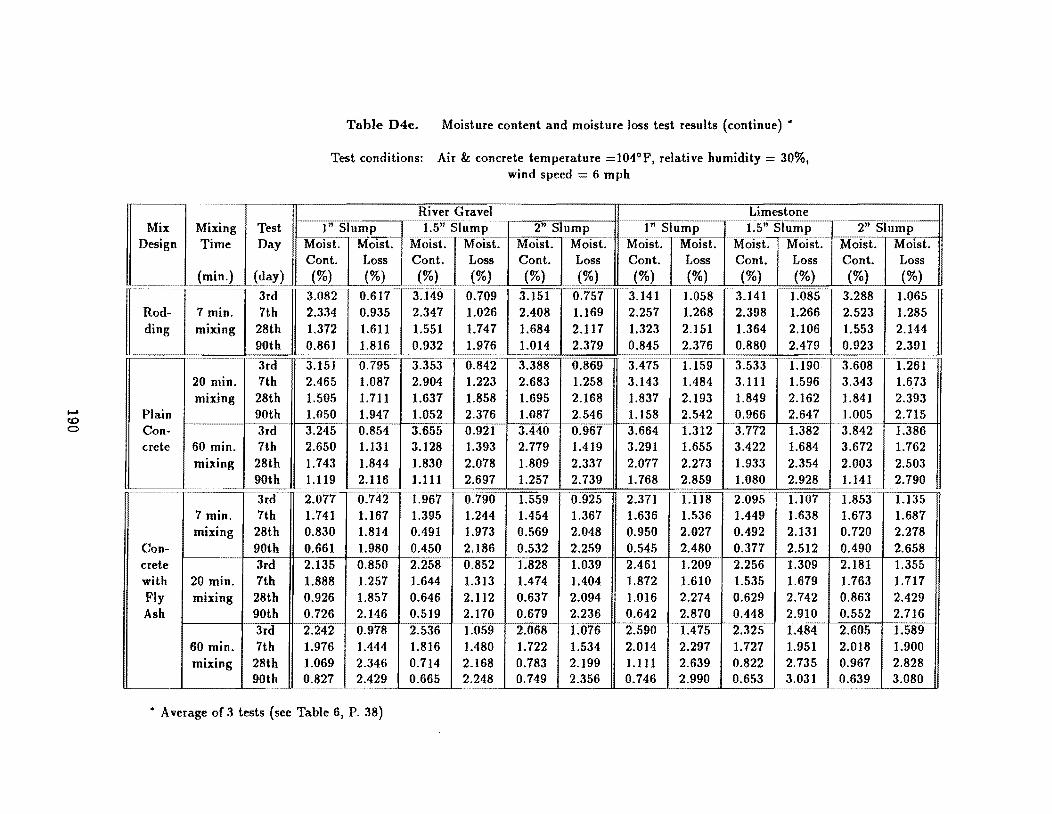
~
co o
Tahle D4e. Moisture content and moisture loss test results (continue) •
Test conditions: Air &. concrete temperature =104°F, relative humidity 30%, wind speed 6 mph
River Gravel Limestone Mix Mixing Test I" Slump 1.5" Slump 2" Slump 1" Slump 1.5" Slump
Design Time Day Moist. Moist. MOi,t'IMOi" Moist. Moist: r--..-,~~~~
:MoIse Moist. Moist. Moist. Cont. Loss Cont. Loss Cont. Loss Cont. Loss Cont. Loss
~~~~
(min.) (day) (%) (%) ~~ (%) (~) (%) ('Yo) (%) (%) (%) (%) 3rd 3.082 0.617 3.149 0.709 3.151 0.757 3.141 1.058 3.141 1.085
Rod- 7 min. 7th 2.334 0.935 2.347 1.026 2.408 1.169 2.257 1.268 2.398 1.266 ding mIXIng 28th 1.372 1.611 1.551 1.747 1.684 2.117 1.323 2.151 1.364 2.106
90th 0.861 1.816 0.932 1.976 1.014 2.379 0.845 2.376 0.880 2.479
3rd 3.151 0.795 3.353 0.842 3.388 0.869 3.475 1.159 3.533 1.190 20 min. 7th 2.465 1.087 2.904 1.223 2.683 1.258 3.143 1.484 3.111 1.596 mixing 28th 1.505 1.711 1.637 1.858 1.695 2.168 1.837 2.193 1.849 2.162
Plain 90th 1.050 1.947 1.052 2.376 1.087 2.546 1.158 2.542 0.966 2.647 Con- 3rd 3.245 0.854 3.655 0.921 3.440 0.967 3.664 1.312 3.772 1.382 crete 60 min. 7th 2.650 1.131 3.128 1.393 2.779 1.419 3.291 1.655 3.422 1.684
mixing 28th 1.743 1.844 1.830 2.078 1.809 2.337 2.077 2.273 1.933 2.354 90th 1.119 2.116 1.111 2.697 1.257 2.739 1.768 2.859 1.080 2.928 3rd ~~ 'T077- 0.742- r
•• 967 0.790 1.559 0.925 2.371 1.118 2.095 1.107 7 min. 7th 1.741 1.167 1.395 1.244 1.454 1.367 1.636 1.536 1.449 1.638 mixing 28th 0.830 1.814 0.491 1.973 0.569 2.048 0.950 2.027 0.492 2.131
Con- 90th 0.661 1.980 0.450 2.186 0.532 2.259 0.545 2.480 0.377 2.512 crete 3rd 2.135 0.850 2.258 0.852 1.828 1.039 2.461 1.209 2.256 1.309 with 20 min. 7th 1.888 1.257 1.644 1.313 1.474 1.404 1.872 1.610 1.535 1.679 Fly mixing 28th 0.926 1.857 0.646 2.112 0.637 2.094 1.016 2.274 0.629 2.742 Ash 90th 0.726 2.146 0.5]9 2.170 0.679 2.236 0.642 2.870 0.448 2.910
3rd 2.242 0.978 2.536 1.059 2.068 1.076 2.590 1.475 2.325 1.484 60 min. 7th 1.976 1.444 1.816 1.480 1.722 1.534 2.014 2.297 1.727 1.951 mixing 28th 1.069 2.346 0.714 2.168 0.783 2.199 1.111 2.639 0.822 2.735
90th 0.827 2.429 0.665 2.248 0.749 2.356 0.746 2.990 0.653 3.031 ~~~- .~~~. ------ ~~~-,~~
• Average of 3 tests (see Table 6, P. 38)
2" Slump Moist. Moist. Cont. Loss (%) (%)
3.288 1.065 2.523 1.285 1.553 2.144 0.923 2.391
3.608 1.261 3.343 1.673 1.841 2.393 1.005 2.715 3.842 1.386 3.672 1.762 2.003 2.503 1.141 2.790
1.853 1.135 1.673 1.687 0.720 2.278 0.490 2.658 2.181 1.355 1.763 1.717 0.863 2.429 0.552 2.716 2.605 1.589 2.018 1.900 0.967 2.828 0.639 3.080
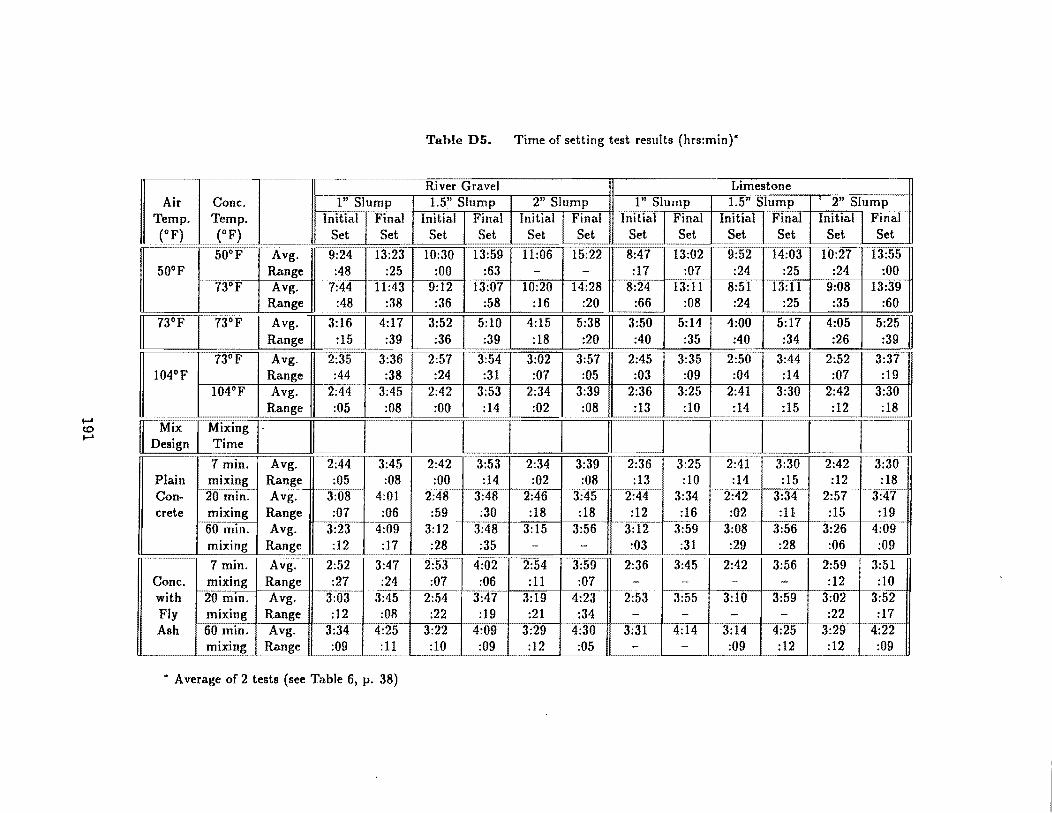
...... co ......
tr"l-----Air I" Slump Temp. Initial Final (OF) Set Set
50°F Avg. 9:24 --
13:23 50°F Range :48 :25
73°F Avg. 7:44 11:43 Range :48 :38
73°F 73°F Avg. 3:16 4:17 Range :15 :39
--73°F Avg. 2:35 3:36
104°F Range :44 :38 104°F Avg. 2:44 - 3:45
Range :05 :08
[ M~xml Mi.xing I-DeSIgn TIme II J 1
7 min. Avg. 2:44 3:45 Plain mixing Range :05 :08
~~~~
Can- 20 min. Avg. 3:08 4:01 erete mixing Range :07 :06
60 min. Avg. 3:23 4:09 mixing Range : 12 :17
7 min. Avg. 2:52 3:47 Cone. mixing Range :27 :24 with 20 min. Avg. 3:03 3:45 Fly mixing Range :12 :08 Ash 60 min. Avg. 3:34 4:25
mixing Range :09 :11
• Average of 2 tests (see Table 6, p. 38)
Table D5. Time of setting test results (hrs:min)*
River Gravel Limestone 1.5" Slump 2" Slump I" Slump 1.5" Slump , 2" Slump
Initial Final Initial Final Initial Final Initial Final Initial Final Set Set Set Set Set Set Set Set Set Set
10:30 13:59 ---
11:06 15:22 8:47 13:02 9:52 14:03 10:27 13:55 :00 :63 - - :17 :07 :24 :25 :24 :00
9:12 13:07 10:20 14:28 8:24 13:11 8:51 13:11 9:08 13:39 :36 :58 :16 :20 :66 :08 :24 :25 :35 :60
3:52 5:10 4:15 5:38 3:50 5:14 4:00 5:17 4:05 5:25 :36 :39 :18 :20 :40 :35 :40 :34 :26 :39
2:57 3:54 3:02 3:57 2:45 3:35 2:5(l 3:44 2:52 3:37 :24 :31 :07 :05 :03 :09 :04 :14 :07 :19
2:42 3:53 2:34 3:39 2:36 3:25 2:41 3:30 2:42 3:30 :00 :14 :02 :08 :13 :10 :14 :15 :12 :18
Ii I II -------,
--
2:42 3:53 2:34 3:39 2:36 3:25 2:41 3:30 2:42 3:30 . I
:00 :14 :02 :08 :13 :10 :14 :15 :12 :18 I
2:48 3:48 2:46 3:45 2:44 3:34 2:42 3:34 2:57 3:47 :59 :30 :18 :18 :12 :16 :02 :11 :15 :19
3:12 3:48 3:15 3:56 3:12 3:59 3:08 3:56 3:26 4:09 :28 :35 - - :03 :31 :29 :28 :06 :09
2:53 4:02 2:54 3:59 2:36 3:45 2:42 3:56 2:59 3:51 :07 :06 :11 :07 - - - ~ :12 :10
2:54 3:47 3:19 4:23 2:53 3:55 3:10 3:59 3:02 3:52 :22 : 19 :21 :34 - - - :22 :17
3:22 4:09 3:29 4:30 3:31 4:14 3:14 4:25 3:29 4:22 :10 :09 :12 :05 - - :09 :12 :12 :09
---------- -----~
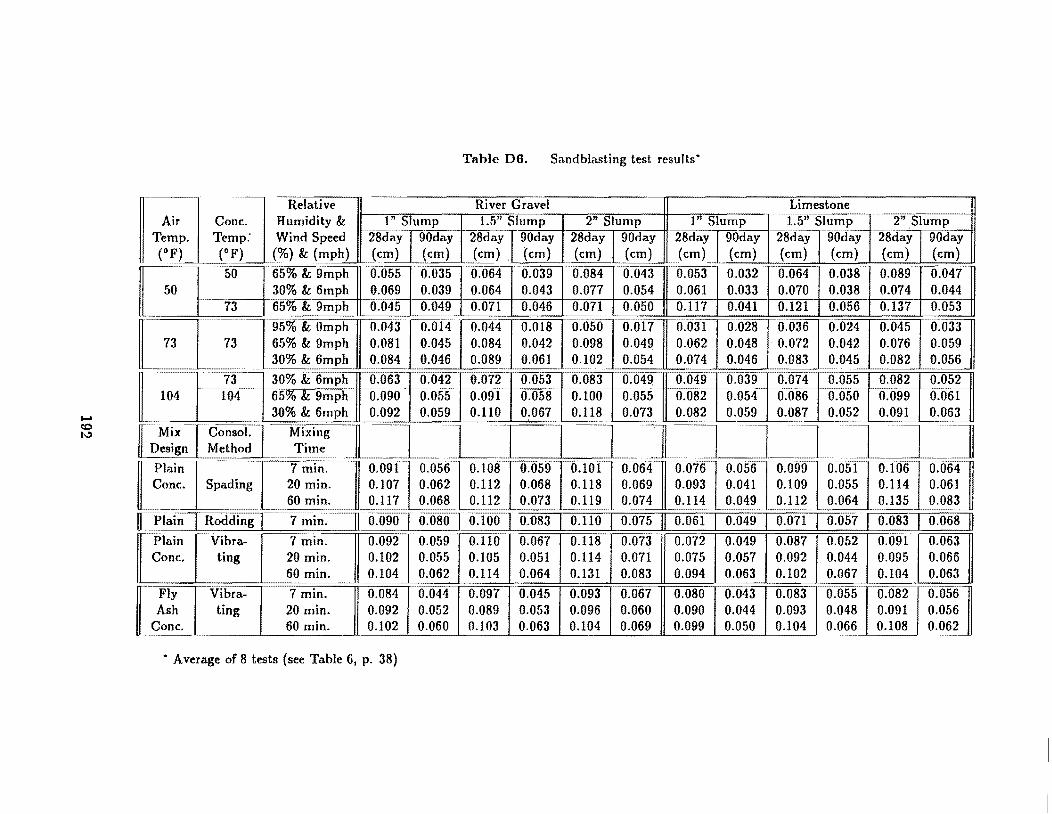
..... co t.,)
Tahle DO. Sandblasting test results"
L ..~ .' ... __ L- - - n __ ------::-- n ____ .---:;-__ n __ n -
73 30% & 6mph 0.063 0.042 0.072 0.053 0.083 0.049
.
1.0. 4 104 65% & 9mph 0.090 0Jj55 0.091 0.058 0.1()OO-05S 30% & 6mph 0.092 0.059 0.110 0.067 0.118 0.073
rMix -Consol. Mixing II ---, -, I I
~l?esign Method Time
~-pra:"nl . 7 min.
Cone. Spading 20 min. 60 min.
0.091 0.056 0.107 0.062 0.117 0.068
0.108 0.059 0.112 0.068 0.112 0.073
0.101 0.064 0.118 0.069 0.119 0.074
().049 0.039 c-0.074 0.055 0.082 0.052 II
0.082 0.054 0.086 0.050 0.099 0.061 0.082 0.059 0.087 0.052 0.091 0.063
~~~~
0.076 0.093 0.114
0.056 0.041 0.049
0.099 0.109 0.112
0.051 0.055 0.064
0.106 0.114 0.135
0.064 0.061 0.083
~Plain r Rodding I 7 min. II 0.090 I 0.080 I 0.100 I 0.083 I 0.110 I 0.075 II 0.061 I 0.049 I 0.071 I 0.057 I 0.083 I 0.068 II ----= Vlbra~ 7 min. 0.092 0.059 0.067 0.118 0.073
--0.072 0.049 0.087 0.052 0.091 0.063 Plain 0.110
Cone. ting 20 min. 0.102 0.055 0.105 0.051 0.114 0.071 0.075 0.057 0.092 0.044 0.095 0.066 60 min. 0.104 0.062 0.114 0.064 0.131 0.083 0.094 0.063 0.102 0.067 0.104 0.063
Fly Vibra- 7 min. 0.084 ().044 0.097 0.045 0.093 ().067 0.080 ._-
0.043 0.083 1l.055 r 0.082 0.0561 Ash ting 20 min. 0.092 0.052 0.089 0.053 0.096 0.060 0.090 0.044 0.093 0.048 0.091 0.056
Cone. 60 min. 0.102 0.060 0.103 0.063 0.104 0.069 0.099 0.050 0.104 0.066 0.108 0.062
• Average of 8 tests (see Table 6, p. 38)
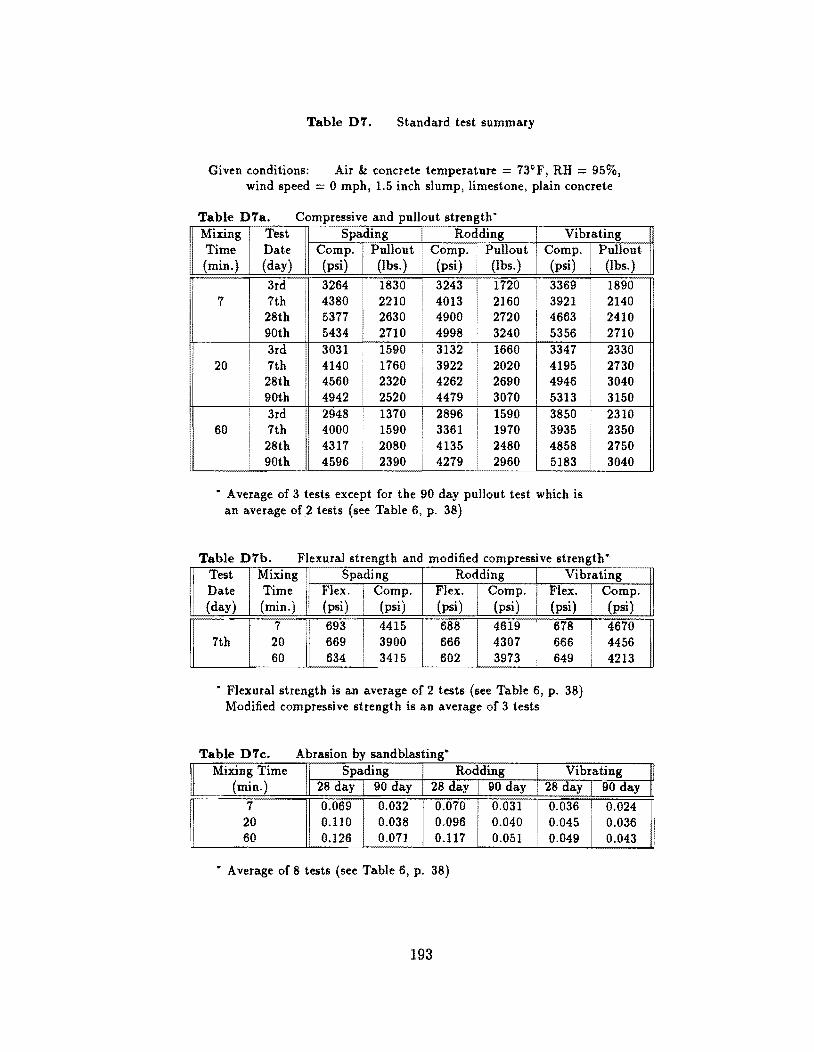
I
Table D7. Standard test summary
Given conditions: wind speed
Air &: concrete temperature = 73"F, RH = 95%, o mph, 1.5 inch slump, limestone, plain concrete
Table D7a. Compressive and pullout strength" Mixing Time (min.)
7
20
60
Test Spading I Rodding Date Compo Pullout I Compo Pullout (day) (psi) (lbs.) (psi) (lbs.)
3rd 3264 I 1830 I 3243 1720 7th 4380, 2210 4013 2160 28th 5377 2630 4900 2720 90th 5434 2710 I 4998 3240 3rd 7th
28th I 90th
3rd 7th 28th 90th
3031 4140 4560 4942 2948 4000 4317 4596
1590 1760 2320 2520 1370 1590
3132 3922 4262 4479
I 2896 I 3361
1660 2020 2690 3070 1590 1970
2080 4135 2480 2390 I 4279 I 2960
VibratI!n Compo Pu ou (psi) (lbs.)
I 3369 I 1890 3921 2140 4663 II 2410 5356 ' 2710
:::: I ~m 5313 3150 3850 3935 4858 5183
2310 2350 2750 3040
• Average of 3 tests except for the 90 day pullout test which is an average of2 tests (see Table 6, p. 38)
Table D7b. Flexural strength and modified compressive strength" Test Mixing Spading Rodding Vib,ating f1 Date Time Flex. I Compo Flex. Compo Flex. i Compo (day) (min.) I (psi) ! (psi) (psi) (psi) (psi) , (psi)
7 693
I
4415 688 4619 !
678 I 4670 7th 20 669 3900 666 4307 666 4456
60 634 3415 602 3973 649 4213
• Flexural strength is an average of 2 tests (see Table 6, p. 38) Modified compressive strength is an average of 3 tests
Table D7c. Abrasion by sandblasting· Mixing Time Spading Rodding Vibrating
(min.) II 28 day 90 day 28 day 90 day 28 day 90 day
7 0.069 0.032 0.070 0.031 0.036 0.024 20 0.110 0.038 0.096 0.040 0.045 0.036 60 0.126 0.071 0.117 0.051 0.049 0.043
" Average of 8 tests (see Table 6, p. 38)
193
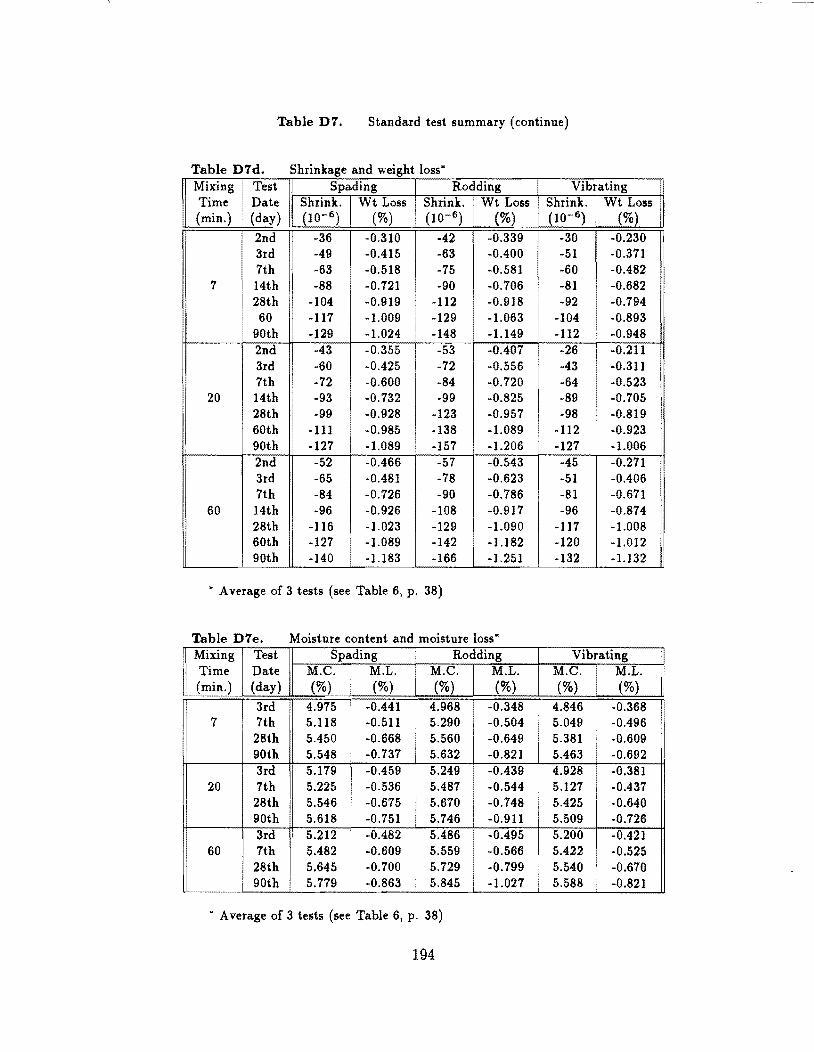
Table D7. Standard test summary (continue)
Table D7d. Shrinkage and weight loss· Mixing i Test Spading Rodding Vibrating Time Date Shrink. Wt Loss Shrink. Wt Loss Shrink. Wt Loss (min.) (day) (10- 6 ) (%) (10- 6 ) (%) (10- 6 ) (%)
2nd -36 -0.310 -42 -0.339 -30 -0.230 3rd -49 -0.415 -63 -0.400 -51 -0.371 7th -63 -0.518 -75 -0.581 -60 -0.482
7 14th -88 -0.721 -90 -0.706 -81 -0.682 28th -104 -0.919 -112 -0.918 -92 -0.794 60 -117 -1.009 -129 -1.063 -104 -0.893
90th -129 -1.024 -148 -1.149 -112 -0.948 2nd -43 -0.355 -53 -0.407 -26 -0.211 3rd -60 -0.425 -72 -0.556 -43 -0.311 7th -72 -0.600 -84 -0.720 -64 -0.523
20 14th -93 -0.732 ·99 -0.825 ·89 ·0.705 28th ·99 -0.928 ·123 ·0.957 -98 -0.819 60th ·111 -0.985 ·138 -1.089 -112 -0.923 90th -127 ·1.089 -157 -1.206 -127 -1.006 2nd -52 -0.466 -57 -0.543 -45 -0.271 3rd -65 -0.481 -78 -0.623 -51 -0.406 7th -84 -0.726 -90 -0.786 -81 -0.671
60 14th -96 -0.926 -108 -0.917 -96 -0.874 28th -116 -1.023 -129 -1.090 -117 -1.008 60th -127 -1.089 -142
I -1.182 -120 -1.012
90th -140 -1.183 -166 -1.251 -132 -1.132
- Average of 3 tests (see Table 6, p. 38)
Table D7e. Moisture content and moisture loss· Mixing Test Spading Rodding Vibrating I Time Date M.e. M.L. M.e. M.L. M.e.
!
M.L.
I (min.) (day) (%) (%) (%) (%) (%) (%) 3rd 4.975 ! -0.441
I 4.968 -0.348 4.846 -0.368
7 7th 5.118 -0.511 5.290 -0.504 5.049 -0.496 28th 5.450 -0.668
I
5.560 -0.649 5.381 -0.609 90th 5.548 -0.737 5.632 -0.821 5.463 -0.692 3rd 5.179 -0.459 5.249 -0.439 ! 4.928 -0.381
20 7th 5.225 -0.536 5.487 -0.544 5.127 -0.437 28th 5.546 -0.675 5.670 -0.748 5.425 -0.640 90th 5.618 -0.751 5.746 -0.911 5.509 -0.726 3rd 5.212 -0.482 5.486 -0.495 5.200 -0.421
60 7th 5.482 -0.609 5.559 -0.566 5.422 -0.525
I
28th 5.645 -0.700 5.729 -0.799 5.540 -0.670 90th 5.779 -0.863 5.845 -1.027 I 5.588 -0.821
• Average of 3 tests (see Table 6, p. 38)
194
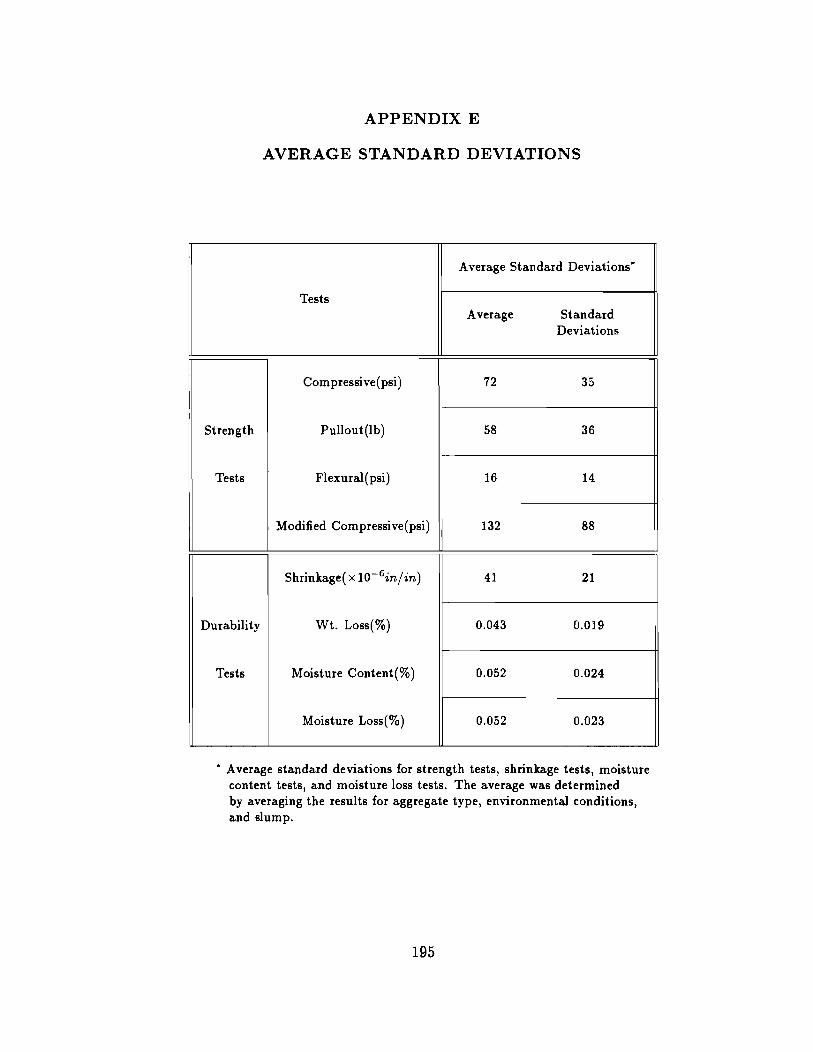
APPENDIX E
AVERAGE STANDARD DEVIATIONS
A verage Standard Deviations·
Tests Average Standard
Deviations
Compressive(psi) 72 35
Strength Pullout(lb) 58 36
Tests Flexural(psi) 16 14
Modified Compressive(psi) 132 88
Shrinkage( x 1O- 6in/ in) 41 21
Durability Wt. Loss(%) 0.043 0.019
Tests Moisture Content(%) 0.052 0.024
Moisture Loss(%) 0.052 0.023
• Average standard deviations for strength tests, shrinkage tests, moisture content tests, and moisture loss tests. The average was determined by averaging the results for aggregate type, environmental conditions, and slump.
195
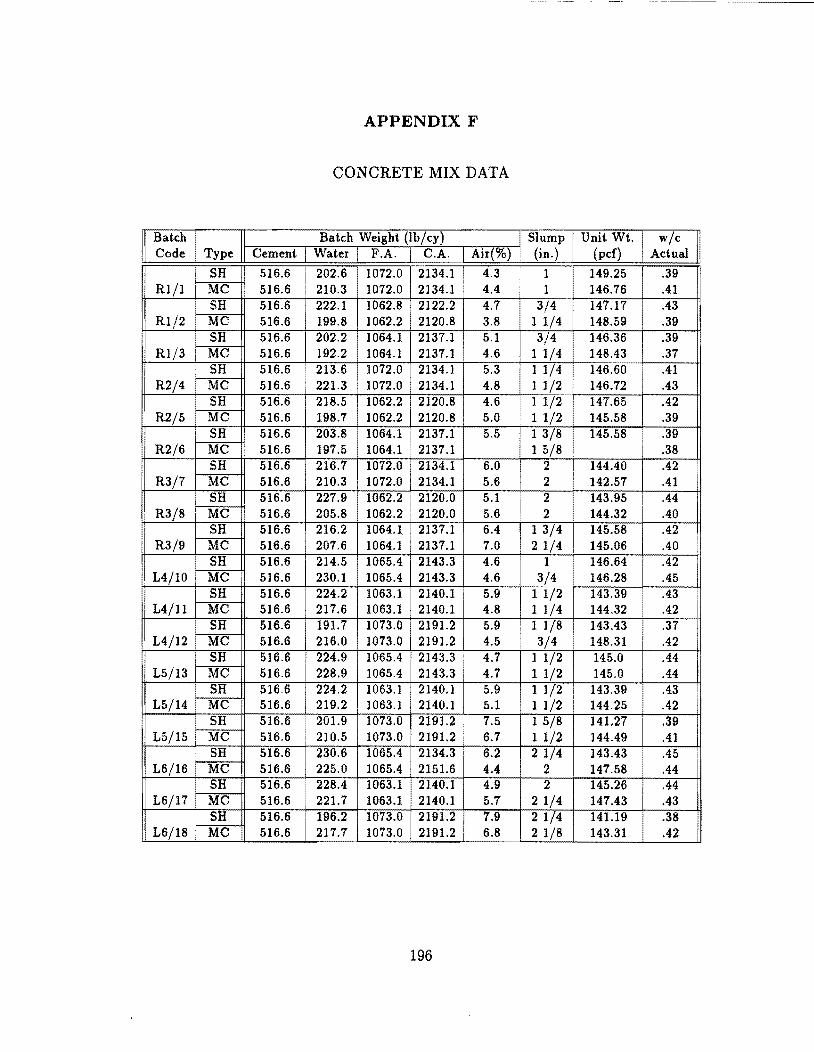
APPENDIX F
CONCRETE MIX DATA
Batch Batch Weight (Ih/cy) Slump Unit Wt. w/c Code Type Cement Water F.A. C.A. Air(%) (in.) (pcf) Actual
SH 516.6 202.6 1072.0 2134.1 I 4.3 1 149.25 .39 R1/1 MC 516.6 210.3 1072.0 2134.1 ! 4,4 1 146.76 ,41
SB 516.6 222.1 1062.8 2122.2 4.7 3/4 147.17 ,43 Rl/2 MC 516.6 199.8 1062.2 2120.8 3.8 1 1/4 148.59 .39
SH 516.6 202.2 1064.1 2137.1 5.1 3/4 146.36 .39 Rl/3 MC 516.6 192.2 1064.1 2137.1 i 4.6 1 1/4 148.43 .37
SH 516.6 213.6 1072.0 2134.] 5.3 1 ]/4 146.60 ,41 R2/4 MC 516.6 221.3 1072.0 2134.1 4.8 1 1/2 146.72 .43
SH 516.6 218.5 1062.2 2120.8 4.6 1 1/2 147.65 .42 R2/5 MC 516.6 198.7 1062.2 2120.8 5.0 1 1/2 145.58 .39
SH 516.6 203.8 i 1064.1 2137.1 5.5 1 3/8 145.58 .39 R2/6 MC 516.6 197.5 1064.1 2137.1 1 5/8 .38
SB 516.6 216.7 1072.0 2134.1 6.0 2 144,40 ,42 R3/7 Me 516.6 210.3 1072.0 2134.1 5.6 2 142.57 ,41
SH 516.6 227.9 1062.2 2120.0 5.1 I
2 143.95 ,44 R3/8 MC 516.6 205.8 1062.2 2120.0 5.6 2 144.32 ,40
SB 516.6 216.2 1064.1 2137.1 6,4 1 3/4 145.58 .42 R3/9 Me 516.6 207.6 1064.1 2137.1 7.0 2 1/4 145.06 .40
SH 516.6 214.5 1065,4 2143.3 4.6 1 146.64 ,42 . L4/10 MC 516.6 230.1 1065,4 2143.3 4.6 3/4 146.28 ,45
SB 516.6 224.2 1063.1 2140.1 5.9 1 1/2 143.39 ,43 L4/11 Me 516.6 217.6 1063.1 2140.1 4.8 1 1/4 144.32 ,42
SB 516.6 191.7 1073.0 2191.2 5.9 1 1/8 143.43 .37 L4/12 MC 516.6 216.0 1073.0 2191.2 4.5 3/4 148.31 .42
SH 516.6 224.9 1065.4 2143.3 i 4.7 1 1/2 145.0 .44 L5/13 ~ 516.6 228.9 ] 065.4 2143.3 4.7 1 1/2 145.0 ,44
516.6 224.2 1063.] 2140.1 5.9 1 ]/2 143.39 ,43 L5/14 MC 516.6 219.2 1063.1 2140.1 5.1 1 1/2 144.25 .42
SB 5]6.6 201.9 1073.0 2191.2 7.5 1 5/8 141.27 .39 II L5/15 MC 516.6 210.5 1073.0 2191.2 i 6.7 1 1/2 144,49 ,41
SB 516.6 230.6 1065.4 2134.3 6.2 2 1/4 143,43 ,45 L6/16 MC 516.6 225.0 ]065,4 2151.6 4.4 2 147.58 .44
SB 516.6 228.4 1063.1 2140.1 4.9 2 145.26 .44 L6/17 MC 516.6 221.7 1063.1 2140.1 5.1 2 1/4 141.43 ,43
SB 516.6 196.2 1073.0 2191.2 7.9 2 1/4 141.19 .38 L6/18 MC 516.6 217.1 1073.0 2191.2 6.8 2 1/8 143.31 .42
196
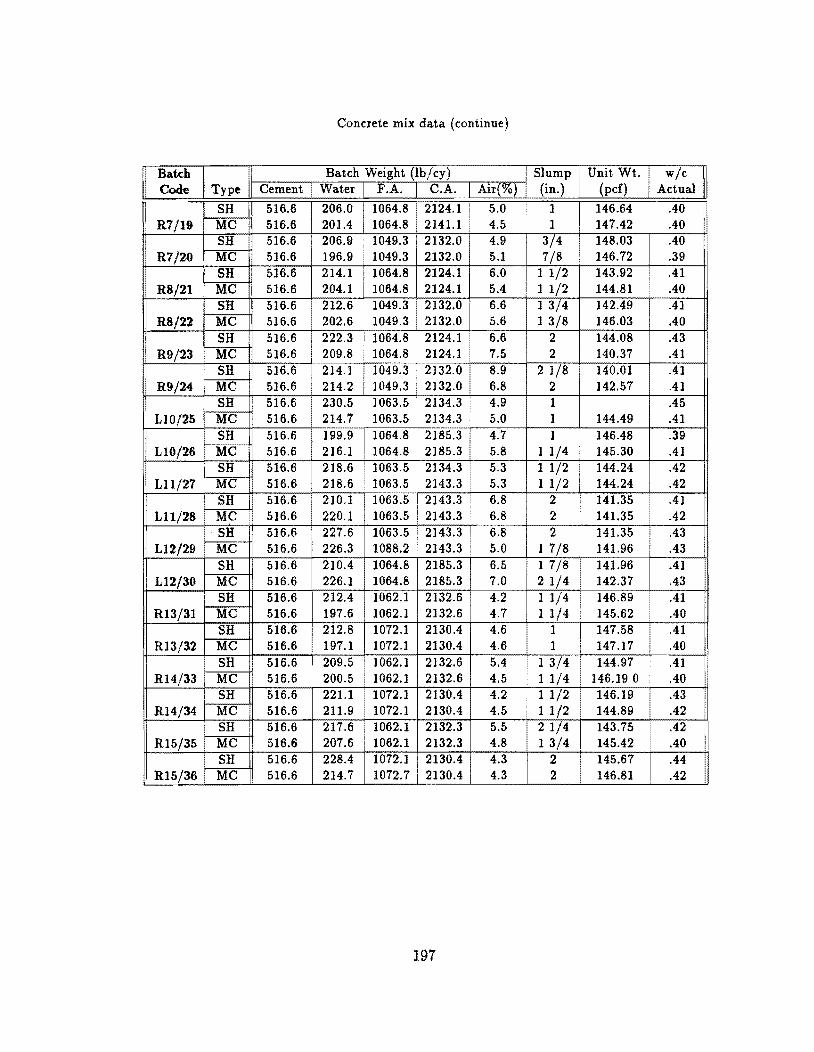
Concrete mix data (continue)
Ba.tch Ba.tch Weight (lb/ey) Slump I Unit Wt. w/c II Code Type Cement i Water F.A. C.A. Air(%) (in.) (pc!) Actual
SH 516.6 206.0 1064.8 • 2124.1 ! 5.0 1 146.64 .40 R1/19 MC 516.6 201.4 1064.8 2141.1 4.5 1 147042 040
=iiR 516.6 206.9 1049.3 2132.0 4.9 3/4 148.03 040 R7J20 516.6
I 196.9 1049.3 2132.0 5.1 7/8 146.72 .39
SH 516.6 214.1 1064.8 2124.1 6.0 1 1/2 143.92 Al R8/21 MC 516.6 204.1 1064.8 2124.1 5.4 1 1/2 144.81 .40
R8/22 ~ 516.6
I ~~~:: I 1049.3 ~ 6.6 1 3/4 142049 .41 516.6 • • i 1049.3 . 5.6 1 3/8 146.03 040
SH 516.6 222.3 i 1064.8 2124.1 6.6 2 144.08 .43 R9/23 MC 516.6 209.8 1064.8 2124.1 7.5 2 140.37 Al
SH 516.6 214.1 1049.3 2132.0 8.9 2 1/8 140.01 Al R9/24 MC 516.6 214.2 1049.3 2132.0 6.8 2 142.57 Al
SH 516.6 1063.5 • 2134.3 4.9 1 .45 LI0/2S MC 516.6 I 214.7 I 1063.'" i ,,~., .~ 5.0 1 144049 .41
SH 516.6 199.9 1064.8 2185.3 4.7 1 146048 .39 LI0/26 MC 516.6 216.1 1064.8 2185.3 5.8 1 1/4 145.30 .41
SH 516.6 218.6 1063.5 2134.3 • 5.3 1 1/2 144.24 .42 L11/27 MC 516.6 218.6 • 1063.5 2143.3 5.3 1 1/2 144.24 042
I SH 516.6 210.1 1063.5 2143.3 6.8 2 141.35 Al LIl/28 Me 516.6 220.1 1063.5 2143.3 6.8 2 141.35 .42
SH 516.6 227.6 1063.5 • 2143.3 6.8 2 141.35 .43 •
• L12/29 MC 516.6 226.3 1088.2 • 2143.3 5.0 1 7/8 141.96 043 SH 516.6 21004 1064.8 2185.3 6.5 1 7/8 141.96 Al
L12{30 MC 516.6 226.1 1064.8 2185.3 7.0 2 1/4 142.37 043 : SH 516.6 21204 1062.1 2132.6 4.2 1 1/4 146.89 Al
R13/31 Me 516.6 197.6 1062.1 2132.6 4.7 1 1/4 145.62 040 SH 516.6 212.8 1072.1 213004 4.6 1 147.58 Al
R13/32 MC 516.6 197.1 1072.1 213004 4.6 1 147.17 040 SH 516.6 209.5 1062.1 2132.6 5.4 1 3/4 144.97 Al
R14/33 MC 516.6 200.5 • 1062.1 2132.6 4.5 1 1/4 146.190 040 SH 516.6 221.1 1072.1 2130.4 4.2 1 1/2 146.19
RI4/34 IVI"" II 516.6 211.9 1072.1 213004 4.5 1 1/2 144.89 I 042 SH 516.6 217.6 1062.1 2132.3 5.5 2 1/4 143.75 042
R15/35 Me 516.6 207.6 1062.1 2132.3 4.8 1 3/4 145.42 .40 SH 516.6 22804 1072.1 213004 4.3 2 145.67 .44
• R15/36 MC 516.6 214.7 1072.7 213004 4.3 2 146.81 042
197
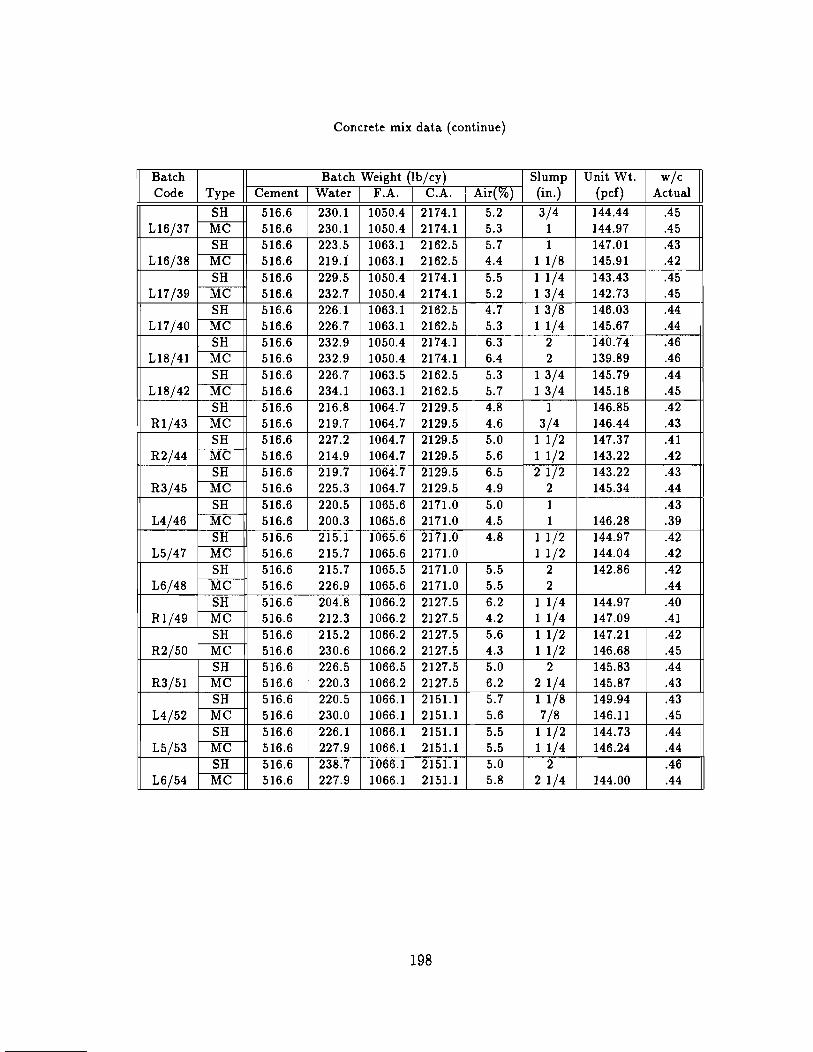
Concrete mix data (continue)
Batch Batch Weight (lb/cy) Slump Unit Wt. w/c Code Type Cement Water F.A. C.A. Air(%) (in.) (pcf) Actual
SH 516.6 230.1 1050.4 2174.1 5.2 3/4 144.44 .45 L16/37 MC 516.6 230.1 1050.4 2174.1 5.3 1 144.97 .45
SH 516.6 223.5 1063.1 2162.5 5.7 1 147.01 .43 L16/38 MC 516.6 219.1 1063.1 2162.5 4.4 1 1/8 145.91 .42
SH 516.6 229.5 1050.4 2174.1 5.5 1 1/4 143.43 .45 L17/39 MC 516.6 232.7 1050.4 2174.1 5.2 1 3/4 142.73 .45
SH 516.6 226.1 1063.1 2162.5 4.7 1 3/8 146.03 .44 L17/40 MC 516.6 226.7 1063.1 2162.5 5.3 1 1/4 145.67 .44
SH 516.6 232.9 1050.4 2174.1 6.3 2 140.74 .46 L18/41 MC 516.6 232.9 1050.4 2174.1 6.4 2 139.89 .46
SH 516.6 226.7 1063.5 2162.5 5.3 1 3/4 145.79 .44 L18/42 MC 516.6 234.1 1063.1 2162.5 5.7 1 3/4 145.18 .45
SH 516.6 216.8 1064.7 2129.5 4.8 1 146.85 .42 Rl/43 MC 516.6 219.7 1064.7 2129.5 4.6 3/4 146.44 .43
SH 516.6 227.2 1064.7 2129.5 5.0 1 1/2 147.37 .41 R2/44 MC 516.6 214.9 1064.7 2129.5 5.6 1 1/2 143.22 .42
SH 516.6 219.7 1064.7 2129.5 6.5 2 1/2 143.22 .43 R3/45 MC 516.6 225.3 1064.7 2129.5 4.9 2 145.34 .44
SH 516.6 220.5 1065.6 2171.0 5.0 1 .43 L4/46 MC 516.6 200.3 1065.6 2171.0 4.5 1 146.28 .39
SH 516.6 215.1 1065.6 2171.0 4.8 1 1/2 144.97 .42 L5/47 MC 516.6 215.7 1065.6 2171.0 1 1/2 144.04 .42
SH 516.6 215.7 1065.5 2171.0 5.5 2 142.86 .42 L6/48 MC 516.6 226.9 1065.6 2171.0 5.5 2 .44
SH 516.6 204.8 1066.2 2127.5 6.2 1 1/4 144.97 .40 Rl/49 MC 516.6 212.3 1066.2 2127.5 4.2 1 1/4 147.09 .41
SH 516.6 215.2 1066.2 2127.5 5.6 1 1/2 147.21 .42 R2/50 MC 516.6 230.6 1066.2 2127.5 4.3 1 1/2 146.68 .45
SH 516.6 226.5 1066.5 2127.5 5.0 2 145.83 .44 R3/51 MC 516.6 , 220.3 1066.2 2127.5 6.2 2 1/4 145.87 .43
SH 516.6 220.5 1066.1 2151.1 5.7 1 1/8 149.94 .43 L4/52 MC 516.6 230.0 1066.1 2151.1 5.6 7/8 146.11 .45
SH 516.6 226.1 1066.1 2151.1 5.5 1 1/2 144.73 .44 L5/53 MC 516.6 227.9 1066.1 2151.1 5.5 1 1/4 146.24 .44
SH 516.6 238.7 1066.1 2151.1 5.0 2 .46 L6/54 MC 516.6 227.9 1066.1 2151.1 5.8 2 1/4 144.00 .44
198
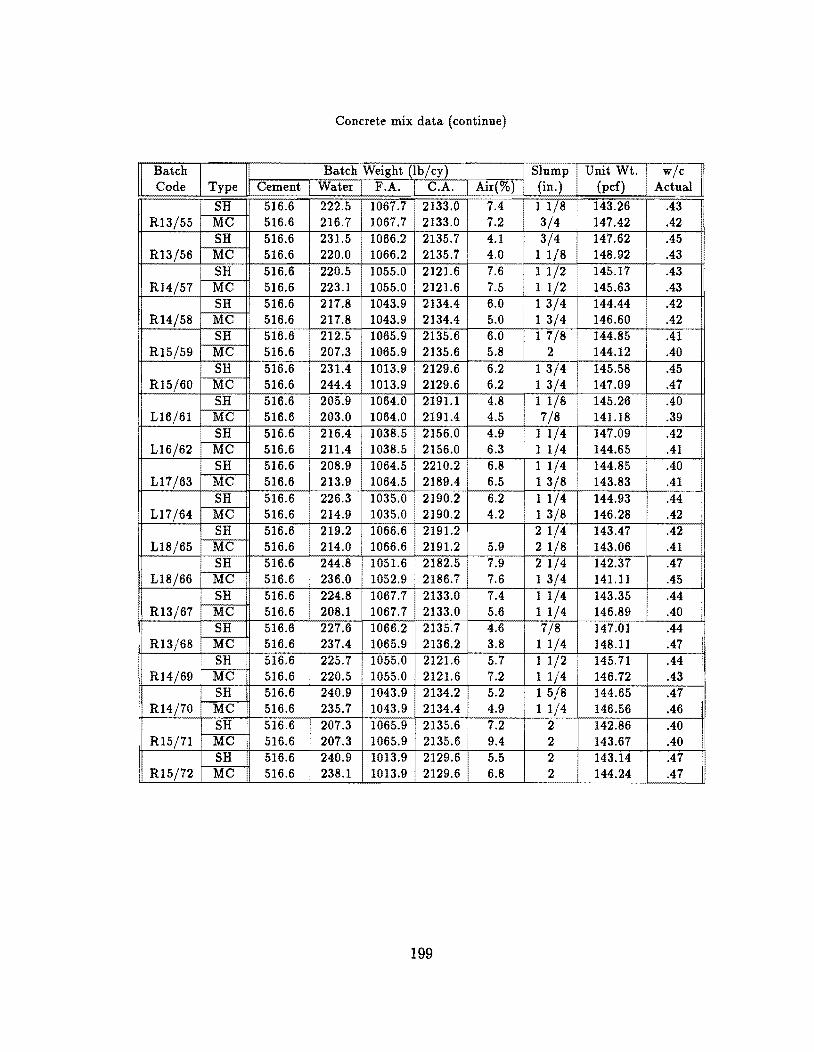
Concrete mix data (continue)
Batch Batch Weight (lb/cy) Slump Unit Wt. wlc Code Type II Cement i Water F.A. C.A. Air(%) (in.) (pcf) Actual
SH 516.6
HM+ 1067.7 2133.0 7.4 1 1/8 143.26 .43
R13/55 MC 516.6 16.7 1067.7 r 2133.0 7.2 3/4 147.42 .42 SH 516.6 1066.2 I 2135.7 4.1 3/4 147.62 .45
R13/56 MC 516.6 220.0 1066.2 2135.7 4.0 1 1/8 148.92 ! .43 SH 516.6 220.5 1055.0 2121.6 7.6 1 1/2 145.17 .43
R14/57 MC 516.6 223.1 1055.0 2121.6 7.5 1 1/2 145.63 .43 SH 516.6 217.8 1043.9 2134.4 6.0 1 3/4 144.44 .42
R14/58 MC 516.6 217.8 1043.9 2134.4 5.0 1 3/4 146.60 .42 SH 516.6 212.5 1065.91 ;~!~.6 6.0 1 7/8 144.85 .41
R15/59 M~ 516.6 207.3 1065.9 2135.6 5.8 2 144.12 .40 SH 516.6 231.4 1013.9 i 2129.6 6.2
! 1 3/4 145.58 .45
R15/60 MC 516.6 244.4 1013.9 2129.6 6.2 1 3/4 147.09 .47 SH 516.6 205.9 1064.0 2191.1 4.8 1 1/8 145.26 .40
L16/61 MC 516.6 203.0 1064.0 2191.4 4.5 7/8 141.18 .39 SH 516.6 216.4 1038.5 2156.0 4.9 1 1/4 147.09 .42
L16/62 MC 516.6 211.4 1038.5 2156.0 6.3 1 1/4 144.65 .41 SH 516.6 208.9 1064.5 2210.2 6.8 1 1/4 144.85 .40
L17/63 MC 516.6 213.9 1064.5 2189.4 6.5 1 3/8 143.83 .41 SH 516.6 226.3 1035.0 2190.2 6.2 1 1/4 144.93 .44
L17/64 MC 516.6 214.9 1035.0 2190.2 4.2 1 3/8 146.28 .42 SH 516.6 219.2 1066.6 2191.2
1 ~ ~/4 143.47 .42 L18/65 MC 516.6 214.0 1066.6 2191.2 5.9 /8 143.06 .41
SH 516.6 244.8 1051.6 2182.5 7.9 2 1/4 142.37 .47 L18/66 MC 516.6 236.0 1052.9 2186.7 7.6 1 3/4 141.11 .45
SH 516.6 224.8 1067.7 2133.0 7.4 1 1/4 143.35 .44 R13/67 MC 516.6 208.1 1067.7 2133.0 i 5.6 1 1/4 146.89 .40
SH 516.6 227.6 1066.2 2135.7 4.Q 1/8 147.01 .44 R13/68 MC 516.6 237.4 1065.9 2136.2 3.8 1 1/4 148.11 .47
SH 516.6 225.7 1055.0 2121.6 5.7 1 1/2 145.71 .44 R14/69 MC 516.6 220.5 1055.0 2121.6 i 7.2 1 1/4 146.72 .43
SH 516.6 240.9 1043.9 2134.2 5.2 1 5/8 144.65 .47 R14/70 MC 516.6 235.7 1043.9 2134.4 4.9 1 1/4 146.56 .46
I R15/71 SH 516.6 207.3 1065.9 2135.6 7.2 2 142.86 .40
I MC 516.6 207.3 1065.9 2135.6 9.4 2 143.67 .40 SH 516.6 240.9 1013.9 ~ 5.5 2 143.14 .47
R15/72 MC 516.6 238.1 1013.9 6.8 2 144.24 .47
199
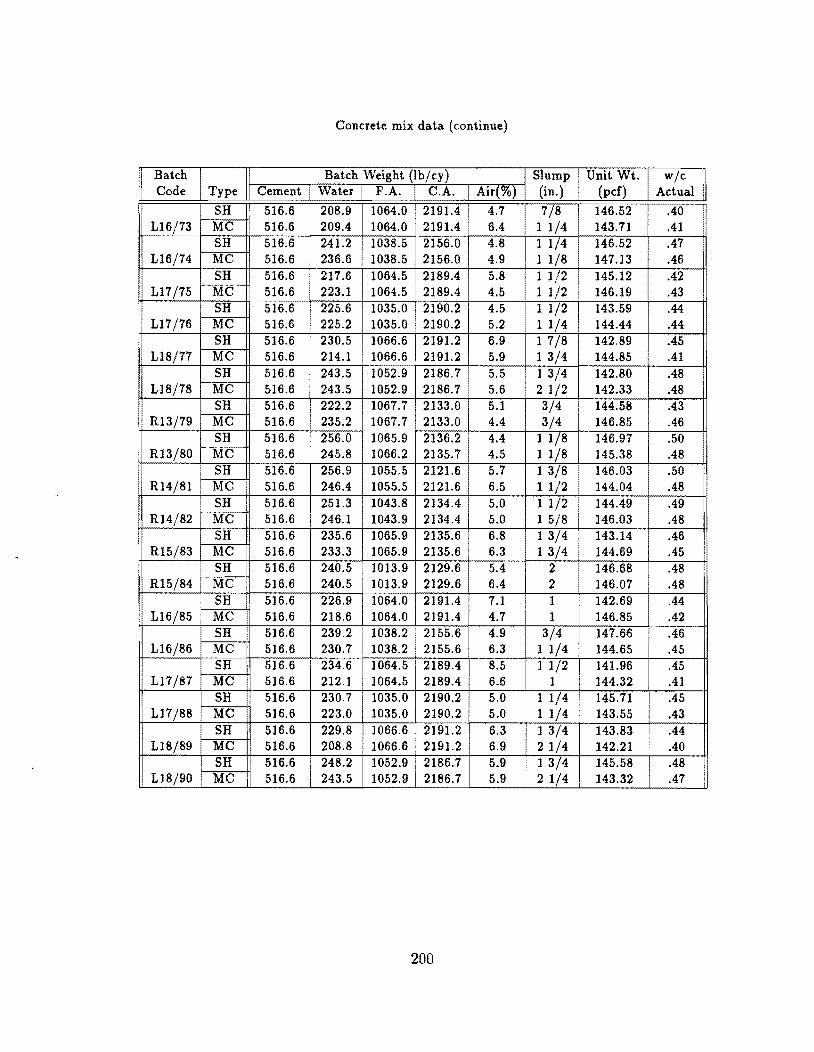
Concrete mix data (continue)
II ('. ~ rf'. pehement Batch Weight (lb/cy) Slump Unit Wt. w/c
Water F.A. C.A. Air(%) (in.) (pcr) Actual
SH . 516.6 208.9 1064.0 2191.4 i 4.7 7/8 146.52 .40 L16/73 MC 516.6 209.4 1064.0 2191.4 6.4 1 1/4 143.71 ,41
SH 516.6 241.2 1038.5 2156.0 4.8 1 1/4 146.52 .47 L16/74 MC 516.6 236.6 1038.5 2156.0 4.9 1 1/8 147.13 .46
SH 516.6 217.6 1064.5 2189.4 5.8 1 1/2 145.12 .42 L17/75 MC 516.6 223.1 1064.5 • 2189.4 4.5 1 1/2 146.19 .43
SH 516.6 225.6 1035.0 2190.2 4.5 1 1/2 143.59 .44 L17/76 MC 516.6 225.2 1035.0 2190.2 5.2 1 1/4 144.44 ,44
SH 516.6 230.5 1066.6 2191.2 6.9 1 7/8 142.89 .45 L18/77 MC 516.6 214.1 1066.6 2191.2 5.9 1 3/4 144.85 .41
SH 516.6 243.5 1052.9 2186.7 • 5.5 1 3/4 142.80 ,48 L18/78 MC 516.6 243.5 1052.9 2186.7 • 5.6 2 1/2 142.33 .48
SH 516.6 222.2 1067.7 2133.0 5.1 3/4 144.58 .43 R13/79 MC 516.6 235.2 1067.7 2133.0 4.4 3/4 146.85 ,46
SH 516.6 256.0 1065.9 2136.2 4.4 1 1/8 146.97 .50 R13/80 MC 516.6 245.8 1066.2 2135.7 4.5 1 1/8 145.38 .48
SH 516.6 256.9 1055.5 2121.6 5.7 1 3/8 146.03 .50 R14/81 MC 516.6 246.4 1055.5 2121.6 6.5 1 1/2 144.04 ,48
SH 516.6 251.3 1043.8 2134.4 5.0 1 1/2 144.49 .49 R14/82 MC 516.6 246.1 1043.9 2134.4 5.0 1 5/8 146.03 .48
SH 516.6 I 235.6 1065.9 2135.6 6.8 1 3/4 143.14 .46 R15/83 MC 516.6 233.3 1065.9 2135.6 6.3 1 3/4 144.69 .45
SH 516.6 240.5 1013.9 2129.6 5.4 2 146.68 .48 R15/84 i MC 516.6 240.5 1013.9 2129.6 6.4 2 146.07 .48
SH 516.6 226.9 1064.0 2191.4 7.1 1 142!l .44 L16/85 MC 516.6 218.6 1064.0 2191.4 4.7 1 146. .42
SH 516.6 I 239.2 1038.2 • 2155.6 4.9 3/4 147.66 .46 L16/86 MC 516.6 230.7 1038.2 2155.6 6.3 1 1/4 144.65 .45
SH 516.6 234.6 1064.5 2189.4 8.5 1 1/2 141.96 .45 L17 /87 MC 516.6 212.1 1064.5 2189.4 6.6 1 144.32 .41
SH 516.6 230.7 1035.0 2190.2 5.0 1 1/4 145.71 .45 • L17/88 MC 516.6 223.0 1035.0 2190.2 5.0 1 1/4 143.55 ,43
SH 516.6 229.8 1066.6 2191.2 6.3 1 3/4 143.83 .44 L18/89 MC 516.6 208.8 1066.6 2191.2 6.9 2 1/4 142.21 ,40
SH 248.2 1052.9 2186.7 5.9 1 3/4 145.58 .48 . L18/90 MC 516.6 243.5 1052.9 2186.7 5.9 2 1/4 143.32 .47
200
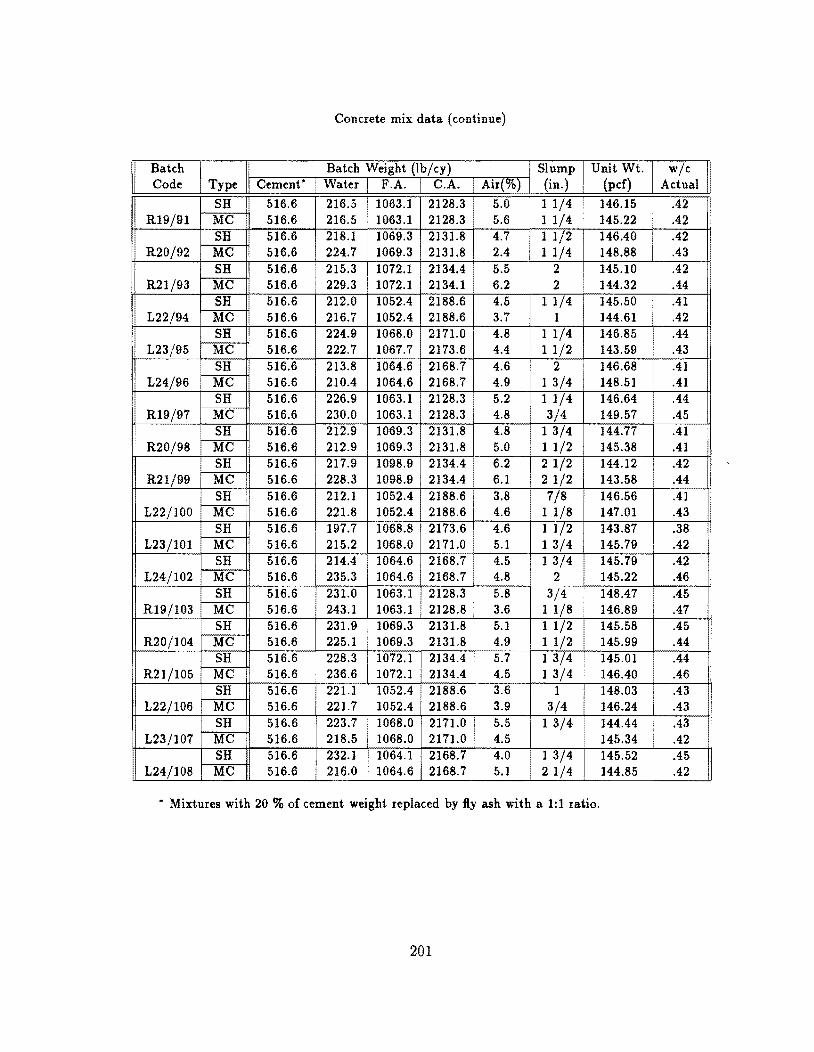
Concrete mix data (continue)
Batch Batch Weight (lb/cy) Slump Unit Wt. w/c Code Type Cement- Water F.A. C.A. Air(%) (in.) (pcf) Actual
SH 516.6 216.5 I 1063.1 2128.3 . 5.0 I 11/4 I 146.15 .42 R19/91 MC II 516.6 216.5 . 1063.1 2128.3 5.6 1 1/4 145.22 .42
SH 516.6 218.1 1069.3 2131.8 4.7 1 1/2 146.40 .42 R20/92 MC 516.6 224.7 1069.3 2131.8 2.4 1 1/4 148.88 .43
SH 516.6 215.3 1072.1 2134.4 5.5 2 145.10 .42 R21/93 MC 516.6 229.3 1072.1 2134.1 i 6.2 2 144.32 .44
SH 516.6 212.0 1052.4 2188.6 4.5 1 1/4 145.50 .41 L22/94 MC 516.6 216.7 1052,4 2188.6 3.7 1 144.61 ,42
SH 516.6 224.9 1068.0 2171.0 4.8 1 1/4 146.85 .44 L23/95 MC 516.6 222.7 1067.7 2173.6 4.4 11/2 143.59 ,43
SH 516.6 213.8 1064.6 2168.7 4.6 2 146.68 .41 L24/96 MC 516.6 210.4 1064.6 2168.7 4.9 1 3/4 148.51 ,41
SH I 516.6 226.9 1063.1 2128.3 . 5.2 1 1/4 146.64 ,44 R19/97 MC I 516.6 230.0 1063.1 2128.3 i 4.8 3/4 149.57 .45
SH 516.6 212.9 1069.3 2131.8 4.8 1 3/4 144.77 ,41 R20/98 MC 516.6 212.9 1069.3 2131.8 5.0 1 1/2 145.38 .41
SH 516.6 217.9 1098.9 2134,4 6.2 2 1/2 144.12 .42 R21/99 MC 516.6 228.3 1098.9 2134.4 6.1 2 1/2 143.58 .44
SH 516.6 212.1 1052.4 ~8.6 3.8 7/8 146.56 ,41 L22/100 MC 516.6 221.8 1052.4 8.6 4.6 1 1/8 147.01 .43
SH 516.6 197.7 1068.8 2173.6 4.6 1 1/2 143.87 .38 L23/101 MC 516.6 215.2 1068.0 2171.0 5.1 1 3/4 145.79 ,42
SH 516.6 214.4 1064.6 2168.7 4.5 1 3/4 145.79 .42 L24/102 ~ 516.6 235.3 1064.6 2168.7 4.8 2 145.22 .46
516.6 231.0 1063.1 2128.3 5.8 3/4 148.47 .45 R19/103 MC I
516.6 243.1 1063.1 2128.8 3.6 1 1/8 146.89 ,47 SH 516.6 231.9 1069.3 • 2131.8 • 5.1 1 1/2 145.58 .45
R20/104 MC 516.6 225.1 1069.3 I 2131.8 i 4.9 1 1/2 145.99 .44 SH 516.6 228.3 1072.1 2134.4 5.7 1 3/4 145.01 ,44
R21/105 MC 516.6 236.6 1072.1 2134,4 4.5 1 3/4 146,40 ,46 SH 516.6 221.1 1052.4 2188.6 i 3.6 1 148.03 .43
L22/106 MC 516.6 221.7 1052.4 2188.6 3.9 3/4 146.24 .43 SH 516.6 223.7 1068.0 2171.0 5.5 1 3/4 144,44 .43
L23/107 MC 516.6 218.5 1068.0 217}.0 4.5 145.34 .42 SH 516.6 232.1 1064.1 2168.7 4.0 1 3/4 145.52 .45
L24/108 MC 516.6 216.0 1064.6 2168.7 I 5.1 21/4 144.85 .42
• Mixtures with 20 % of cement weight replaced by fly ash with a 1:1 ratio.
201

Concrete mix data (continue)
Batch Batch Weight(lb/cy) Slump Unit Wt. w/c Code Type Cement Water F.A. C.A. Air(%) (in.) (pcf) Actual
SH 516.6 215.7 1065.4 2149.3 4.8 1 1/2 146.85 .42 L5/109 MC 516.6 226.0 1065.4 2149.3 7.8 1 1/2 142.61 .44
SH 516.6 190.6 1071.0 2158.4 6.8 1 1/2 144.00 .37 L5/110 Me 516.6 192.3 1071.0 2158.4 6.0 1 3/8 143.96 .37
SH 516.6 222.9 1065.0 2149.3 6.6 1 1/2 143.63 .43 L5/111 MC 516.6 217.9 1065.0 2149.3 7.0 1 3/8 144.23 .42
SH 516.6 202.4 1071.0 2158.4 5.5 1 1/2 144.69 .39 L5/112 Me 516.6 206.3 1071.0 2158.4 6.2 1 1/2 145.17 .40
SH 516.6 197.3 1071.0 2158.4 4.9 1 1/4 145.83 .38 L5/113 MC 516.6 220.6 1071.0 2158.4 5.5 1 1/2 146.76 .43
SH 516.6 227.3 1065.4 2149.3 4.9 1 1/2 145.26 .44 L5/114 MC 516.6 220.9 1065.4 2149.3 5.4 1 5/8 144.81 .43
SH 516.6 217.5 1071.0 2158.4 6.2 1 1/2 143.75 .42 L5/115 MC 516.6 213.3 1071.0 2158.4 6.8 1 3/8 142.53 .41
SH 516.6 228.6 1071.0 2158.4 5.6 1 1/2 143.96 .44 L5/116 Me 516.6 214.0 1071.0 2158.4 4.9 1 1/4 145.14 .41
202
