i*. .-- . i* - nrc.gov · tlie du catalyst was removed from each hibe in 1986, shipped off-site,...
TRANSCRIPT

Y 700 ExxonMobil Road PO Box 1163 Billings, Montana 59103-1 163 406 657 5380 Telephone 406 657 5374 Facsimile I *
.-- _. . _ 1 "I*._
February I O , 2006
--- United States Nuclear Regulatory Commission Region IV ATTN: Mr. Robert Evans 61 1 Ryan Plaza Drive, Suite 400 Arlington, TX 7601 1
Re: Termination NRC Radioactive Materials License Number SUB-I 382, NRC Docket Number 040-08769
Dear Mr. Evans:
Please accept this letter as the ExxonMobil Billings refinery's official request for you to review and approve the revised version of the report entitled Radioloqical Survey and Dose Modeling for Termination of License SUB-1382 that has been submitted to you via PDF file by Mr. Mark Garcia of Weston Solutions, Incorporated of Albuquerque, New Mexico.
This report contains the additional information requested by your office's resources. It is our hope that with these additions, you will approve the report and allow us to further our efforts in the termination of NRC Radioactive Materials License SUB-1382. Should you have any questions or require any additional information, please contact me at (406) 657-5218 or Mr. Garcia at (505) 837-6586.
Thank you for your time and consideration in this matter.
Radiatioh Safety 6fficer
SJCAI
Attachment
cc: Robert Schoenfelder, Weston Solutions, Inc. Mark Garcia, Weston Solutions, Inc.
OVERNIGHT DELIVERY

Radiological Survey and Dose Modeling for
Termination of License SUB 1382
Prepared for:
ExxonMobil Refining and Supply Company Billings, Montana
February 2006
Prepared by:
3840 Commons Ave., NE Albuquerque, New Mexico 87109
Mark Garcia, CMP, Technical Manager
Document Number: 1 3 0 1 4 ~ 0 1 0 ~ D ~ 0 1 9 ~ 0 6

TABLE OF CONTENTS
Section Paqe
1 . INTRODUCTION ......................................................................................................................... 1 1.1 OBJECTIVE ....................................................................................................................... 1 1.2 SITE HISTORICAL INFORMATION .............................................................................. 1
2 . RADIOLOGICAL SURVEYS ...................................................................................................... 2 2.1 SURVEY DESCRIPTION AND RESULTS FOR DOSE MODELING ........................... 3
2.1.1 Iiistniiiieiitatioii ................................................................................................... 3 2.1.2 F551 Furnace and Associated Process Equipineiit ............................................. 3 2.1.3 Potentially impacted areas .................................................................................. 7 CONTAMINATED MATERIALS DISPOSAL .............................................................. 10 2.2.1 Bottom blind flanges (Survey Unit #2) ............................................................ 13 2.2.2 Pipe Elbow from D503 (Survey Unit #4) ......................................................... 14 2.2.3 Catalyst Support Cones .................................................................................... 15
2.2
DOSE MODELING ..................................................................................................................... 16 3.1 SCENARIO - BUILDING OCCUPANCY ...................................................................... 17
3.1.1 3.1.2 3.1.3
Exposure Pathways Considered ........................................................................ 17 D and D General Parameters ............................................................................ 18 Building Occuipancy Modeling Results ............................................................ 18
Exposure Pathways Considered ........................................................................ 19 D and D General Parameters ............................................................................ 19 Resident Fanner Dose Modeling Results ......................................................... 19
3.2 SCENARIO - RESIDENT FARMER .............................................................................. 18 3.2.1 3.2.2 3.2.3
4 . CONCLUSION ............................................................................................................................ 20
13014-010-D-019-06 RadSurveyDoseModel-R2.dac .. 11

LIST OF TABLES
1 2 3 4 5 6 7 8 9 10
Furnace tuibe attacheli t points a id dourlistremi equipment suiiiuiiary ........................................... 4 Results for Samples from Potentially Impacted Areas .................................................................... 7 Data Suimiiary for Furnace Tnbes Removed from F55 1 ............................................................... 11 Data Sunmiary for Top End Flanges (Survey Unit #1) ................................................................. 12 Suiixiiary Data for Flaige Nuts and Bolts (Survey Unit #3) ......................................................... 13 Uranium Concentrations in Catalyst Samples ............................................................................... 16 Survey Data for the Building Occuipaiicy Scenario ....................................................................... 17 Modeling Results for Building Occuipaiicy Scenario ..................................................................... 18 Survey Data for the Resident Fanner Scenario .............................................................................. 19 Modeling Results for Resident Fanner Scenario ........................................................................... 19
LIST OF FIGURES
Figure Paqe
1 2 3 4 5 6 7 8 9 10 11 12 13 14 15 16
Process Schematic ............................................................................................................................ 5 Pigtail attachment points .................................................................................................................. 6 Downstream processing equipment - D503 ..................................................................................... 6 Spent Catalyst Storage area ............................................................................................................. 8 Mechanical Garage .......................................................................................................................... 8 F55 1 Sump ....................................................................................................................................... 9 F55 1 perimeter ................................................................................................................................. 9 Background location # 1 ................................................................................................................ 10 Background location # 2 ................................................................................................................ 10 F55 1 fiiiiiace tubes and survey tool ............................................................................................... 11 Top end flanges Survey Unit # 1 ................................................................................................... 12 Hardware nuts aid bolts Survey Unit # 3 ...................................................................................... 13 Bottom end flanges Survey Unit # 2 .............................................................................................. 14 D503 Pipe Elbow Survey Unit # 4 ................................................................................................. 15
Catalyst support cones inside radiological waste box .................................................................... 16 Survey of catalyst support cones .................................................................................................... 15
LIST OF APPENDICES
Appendix A Calculation of Source Tenii Iiiputs for Dose Modeling ..................................................... A-1
Appendix C Dose Modeling Report Suiiuiiaries for . Resident Fanner Sceiiario ................................ C-1 Appendix D Minimmi Detectable Concentration (MDC) Calculations ................................................ D-1
Appendix B Dose Modeling Report Suiiiiiiaries for . Building Occupaiicy Scenario .......................... B- 1
... 111

EXXONMOBIL DOSE MODELING
I. INTRODUCTION
This report was prepared by Weston Solutions, Inc. for tlie ExxonMobil Refilling and Supply Co. ExxoilMobil) refinery at Billings, Montana. The work was completed in conjunction witli ExuoiiMobil’s decision to teiininate its radioactive inaterials license no. SUB-1382 granted by tlie U.S. Nuclear Regulatory Conmission, Region IV.
1 .I OBJECTIVE
The objective of tlie dose iiiodeliiig is to determine if the inaterials remaining onsite are coiitaniiiated with depleted uraiiuni to a level that would result in a dose to an individual in excess of 25 inillirein (inrein). The 25 inrein dose limit Iias been established by the U.S. Nuclear Regulatory Conmission (NRC) as the maxiiiiuni dose to the average member of tlie critical group resulting from the unrestricted release of a site following license tennination.
Depleted uranium (DU) consists of tlie uranium isotopes U-238, U-235, and U-234 in equilibrium with their associated decay products. Although DU consists of these isotopes, 99% of its inass is from U-238 and therefore, in this report tlie radionwlides of concern are U-238 and its associated decay products. WESTON defined the following five areas of interest at the facility to be addressed in the license termination:
’ Tlie F55 1 fiirnace and associated downstream equipment, . The spent catalyst storage area, ’ The mechanical building (garage), a The F551 Fuiiiace sump, and . The F55 1 fiirnace perimeter.
An average value is deteiiniiied for each area of interest and used as the source term for tlie NRC- approved D and D version 2.1.0 coinputer model to detenniiie if the license may be tenniiiated witliont restrictions, conmionly luiown as unrestricted release.
Two modeling scenarios were used; one for building occupaiicy and one for a resident fanner. Although neither scenario is likely to happen, they were selected to provide a set of very conservative assumptions and ensure an over-estimate of the potential doses to the critical grouips. The results of tlie surveying, sample collection, and dose modeling indicate that tlie residual contamination present at the site would result in a potential dose of 2.13 inrein per year to the resident fanner a id 6.55 inreidyr to tlie building occupant. These values are well below tlie 25 inrein per year limit for license termination with unrestricted use.
1 .2 SITE HISTORICAL INFORMATION
From 1980 to 1986 the F551 Hydrogen Reformer furnace used 84 fiiniace tubes tliat contained a DU catalyst. The furnace tubes were approximately 40 feet long witli a11 outside diameter (OD) of 6 inches, an inside diameter (ID) of 4.5 inches, and a wall tliiclcness of 1.5 inches. Each tube had two 4-illch diameter pigtails, both located approximately 3 feet froin tlie bottom of the hibe. Tlie catalyst support cones, known as “bullets,” were placed inside tlie bottom end of the hibes with the catalyst loaded on top. Although there were three different bullet designs, base dimensions were approximately 3 feet long, with 4.5-inch OD and 4-inch ID, and one end of tlie bullet was tapered. Each furnace tube had an end cap flange approximately 1 inch thick and 10 inches in diameter at each end.
13014-01 0-D-019-06 RadSur~eyD0seM0del-R2.doc 1

Tlie DU catalyst was removed from each hibe in 1986, shipped off-site, aiid replaced with a 11011-
radioactive nickel-molybdenum catalyst. A survey of several tubes conducted in 1988 led to tlie deteimiiiatioii tliat tlie tubes would be managed as radioactively contaminated material. However, iiieasuremeiits perfoiiiied in 1995 indicated tliat a large portion of each fiiniace hibe (approximately 37 feet) was not contaminated above background levels and could have been released with no fiirtlier coiiceni about radiation levels (free released) a id disposed of as industrial waste or recycled.
111 Febmary aiid March of 1995, all funiace tubes were removed for metallurgical inspection. Prior to inspection or disassembly, tlie fiiniace tubes were surveyed for fixed aiid removable radioactivity. Although the results generally demonstrated background levels at tube tops and at pigtails, some furnace hibe bottoin openings showed elevated levels above background. To remove this residual activity, workers wearing personal protective equipment (PPE) removed a id cleaned all blind flanges and catalyst suipport cones using glove bags.
When surveys showed successfiil decoiitainiiiation to a free release limit of less than 5,000 disintegrations per minute per 100 centimeters squared (dpiid100 cm’), a coiifiniiatory ineasureiiieiit for total (fixed aiid removable) contamination aiid removable contamination was conducted. Survey data from tlie 1995 hibe refiirbislmeiit aiid decontamination indicate tliat tlie fiiniace tubes were all decontaminated to less than 5000 dpid100 c d , at wliich time they were iiiteiiially sandblasted, a id no further surveys were conducted to docuiiieiit tlie filial coiitaiiiiiiatioti levels. Tlie tubes were placed back into service at tliat time.
During tlie 2002 Hydrocracker hmiaround, five fiiniace hibes were removed (fiirnace hibe numbers 62, 77, 81, 82, a id 83). Approximately %foot sections of tube were cut from tlie ends of each hibe. In addition, 17 catalyst support cones were removed. Tlie end cap flanges from each of the five hibe were removed as well. These tubes, cones, aiid flanges are stored on site in a wooden box within a secured area with appropriate labeling in place. Surveys perfoniied at tlie time confimied tliat contamination levels were less than 5,000 dpnd100 c d .
In 2005, during another Hydrocracker tuiniarouiid tliat included replaceinelit of all tlie hibes with new ones, ExxoilMobil contracted WESTON to provide radiation safety support a id perfonii radiation surveys a id monitoring to characterize potentially contaminated equipment aiid areas, arrange for appropriate transportation aid disposal of contaminated materials, aiid docuiiieiit final conditions to support tenniiiatioii of tlie NRC license. This report presents tlie dose inodeling results, wliicli are based on data from radiological surveys conducted at tlie site during this himaround. Section 2 describes tlie areas surveyed a id presents tlie results used in the modeling. Section 3 describes tlie modeling. Section 4 contains tlie coiiclusioiis reached through tlie modeling.
2. RADIOLOGICAL SURVEYS
Iiistruiiieiit surveys conducted during the 2005 himaround indicated where residual contamination existed aiid wliicli potentially contaminated areas were clean. Measurements were perfoniied to meet two objectives. First, iiieasuremeiits were taken of potentially impacted areas and accessible sections of process equipment that were to remain in place after tlie himaround was completed to provide input data for dose inodeling to support license teniiiiiatioii aiid release of tlie site for unrestricted use, aiid disposal of tlie materials cleared for release from tlie site. Second, iiieasureiiieiits were taken of contaminated items for use in characterizing tlie waste to be disposed at a license radioactive waste disposal site.
During tlie Hydrocracker himaround, radiological surveys were perfoniied at tlie points where each individual fiiniace hibe was attached to other process equipment aiid where related equipment were accessible to deteiiiiiiie if upstream or downstream equipment had been contaminated during tlie use of radioactive materials. Tlie surface radiological surveys included direct static surveys with handheld
13014-01 0-0-019-06 RadSu~eyOoseModel-R2.doc z

pancake GM survey meters aiid swipe samples for removable contamination. The swipe samples were analyzed for gross alpha activity.
Once the tubes were removed from tlie fiiniace and placed in a remote lay-down area, surveys were performed of tlie tubes, tlie equipment that was removed along with tlie tubes, aiid tlie potentially impacted areas where tlie catalyst was stored or equipment was handled. Survey results were used to segregate tlie items that would require disposal at a licensed radioactive waste site aiid to characterize the radioactive contents of the waste. Additional measurements were perfoniied of the hibes, wliicli were to remain at tlie site as uincoiitaminated items, for input to the dose models.
2.1 SURVEY DESCRIPTION AND RESULTS FOR DOSE MODELING
WESTON’s health physicist reviewed a process flow diagram for tlie F551 fiiniace a id discussed it with ExxonMobil’s process engineer to deteniiiiie tlie potential for residual contamination in various parts of the fiirnace and related process equipment. Parts of the equipment that could reasonably be contaminated were identified aiid plans were made to access them during the tube removal activities. Surveys were conducted of tlie accessible intenial aiid external areas.
In addition, four potentially impacted areas of the site were identified based on WESTON’s review of tlie procedures for handling tlie catalyst and the furnace equipment. Those four areas were monitored for residual contamination on floor surfaces aiid in surrounding soils.
2.1 .I Instrumentation
The following iiistniiiients were used to perform the surveys described above.
liitenial hibe monitor -- Two pancake Geiger-Mueller (GM) detectors mounted back to back and attached to two data loggers were used to monitor tlie iiitenial surfaces of the tubes. This unit is 22% efficient for SrN-90, which is similar in energy to tlie Tli-234/Pa-2341ii decay product of U-238. Instrument efficiency aiid fiinction tests were perfoniied daily with a SrN90 source.
Surface monitor - Surfaces of equipment were scanned using a handheld pancake GM survey meter. This unit is 22% efficient for SrN-90, with energies siiiiilar to Th-234/Pa-234m. Instniiiieiit efficiency and fiinction checks were perfonlied daily with a SrN90 source.
Removable contamination monitor - Swipes were counted on a commercial alpha swipe counter with a 37.5% efficiency for U-238 aid a 36.3% efficiency for Th-230. Instruinieiit efficiency aiid function checks perfoniied daily with a Tli-230 source.
2.1.2 F551 Furnace and Associated Process Equipment
Tlie furnace tubes that previously contained tlie uranium catalyst were permanently removed aid replaced with new tubes during tlie turnaround in 2005. However, tlie rest of the fiimace components aiid other process equipment in tlie furnace circuit remained in place. WESTON conducted instniiiient surveys and collected swipe samples while tlie tubes were removed and the fiirnace was inoperable, wliicli allowed access to critical areas that cannot be accessed when the fiiniace is in use. Tlie surveys aiid sampling activities focused on tlie following components:
Top pigtails (curved tubes) that attach each tube to tlie inlet stream
Bottom pigtails that attach each hibe to the process and draw product from tlie tubes to a collection basin refractory dniiii (D503)
1301 4-0 10-D-019-06 RadSuweyDoseModel-RZ.doc 3

D503 collection basin refractory drum where radiological contamination would pool because the velocity of tlie system is at its lowest at that point, therefore facilitating deposition of entrained inaterial
Additional dowistreaiii processing equipment with accessible iiitenial surfaces (E523, E526, and T509).
'
Min. total Max. total Average total
Tlie fiiniace hibe attachinelit points (pigtails) and accessible downstream processing equipment (D503, E523, E526 and T509) are shown in Figure 1. Figure 2 demonstrates the teclmique used for surveying tlie pigtail attacluneiit points. The fk iace hibes have all been removed and relocated to a low background area, known as tlie catalyst storage area, for surveying. Figure 3 shows tlie pipe inlet to the D503 refractory drum. A section of the elbow was removed and replaced with a iiew section. The elbow will be disposed of as radioactive waste.
Attachment Points on Attachment Points on Attachment Points on Attachment Points on Attachment Points on Tubes 1 thru 20 Tubes 21 thru 40 Tubes 41 thru 60 Tubes 61 thru 80 Tubes 81 thru 84 Downstream
dpmllOOcm2 pCi dpm1100cm2 pCi dpmllOOcm~ pCi dpm1100cm2 pCi dpml100cm2 pCi dpml100cm2 pCi 0.00E40 0.00E40 0.00E40 0.00E40 0.00E40 0.00E40 0.00E40 0.00E-40 0.00E40 0.00E-40 0.00E40 0.00E40 2.02E43 9.10E-10 2.02E43 9.10E-10 4.55E43 2.73E-09 3.03E43 1.37E-09 4.00E40 1.80E40 9.09E44 4.10E44 1.40E42 6.32E-11 1.65E42 7.44E-11 3.13E42 1.41E-10 1.02E42 4.59E-11 8.13E-01 3.66E-01 8.81E43 3.97E43
Survey Results
Activity detected on tlie process equipment is conservatively assumed to result from the presence of licensed material. A total of 352 iiieasureineiits were made on areas of the funiace and associated equipment that were accessible before the iiew funiace tubes were put in place. Table 1 presents a suimiiary of the inoiiitoriiig data iiicludiiig miniintiin, average, and maxiiiium values for subsets of the data. The total activity in these temporarily accessible areas was estimated aiid an overall average value was derived as a reasonably conservative estimate of tlie amount of tlie licensed inaterial tliat nliglit exist in those components reiiiaiiiiiig in use at tlie site after license termination. The overall average value wliicli was used as a dose iiiodel input is provided in tlie table footnote, along with the maxiinuin individual result.
Tlie highest activity measured during the survey was located inside tlie pipe leading into D503, which is shown in Figure 3. This location was made accessible during the plant shut down when a large section of the pipe was replaced. A new section was put in place after the ineasureineiits were taken, aiid this location is 110 longer accessible to workers.
1301 4-0 1 O-D-O? 9-06 RadSurveyDoseModel-R2.doc 4

HYDROGEN- FEED
HWROGEN REmclE
PRODUCT HYDROGEN-
\ TUBES
\
MFMAhlATOR /1
\
I QUENCH WATER
c02 *
i CONDENSATE
Figure 1. Process Schematic
1301 4-01 0-D-019-06 RadSuweyDoseModel-RZ.doc 5

Figure 2. Pigtail attachment points
Figure 3. Downstream processing equipment - D503
13014-01 0-0-01 9-06 RadSurveyDoseModel-R2.doc 6

2.1.3 Potentially impacted Areas
After the removal was complete and all fiiniace tubes and associated equipment had been surveyed, samples (soil or sediment) were collected at potentially impacted areas. The samples were submitted to an offsite laboratory for ganmia spectroscopy aialysis. If an area had been previously surveyed, those results may be used to support the final stahis survey if deemed appropriate. The following areas were designated as potentially impacted and sampled:
. *
Spent catalyst storage area - sump in the center of the staging area. Mechanical building (garage) - sunip tliat nins the length of the garage. F55 1 fiirnace sump - sump below the furnace. F55 1 furnace perimeter- tlie perimeter of the foundation Background samples - samples collected in the parking lot outside of the fenced area of tlie plant. .
Figures 4 through 9 show tlie potentially impacted areas of tlie plant tliat were surveyed. If radioactive materials were used or stored in sui area, it was designated as a potentially impacted area and sampled. The samples were either soil or sediment and submitted to an offsite laboratory for radiochemical analysis.
Sample Results for the potentially impacted areas
Table 2 presents results from laboratory analyses of eiglit samples collected in potentially impacted areas and two samples from background locations. All samples were analyzed for uraniuni, but results tliat were below the laboratory detection liinit are not shown. Minimmi, average, and maximum values are shown at the bottom of the table and were calculated using only samples that had detectable uranium concentrations. The NRC-approved Derived Concentration Guideline Level (DCGL) for U-238 is equal to 1.4E+01 pCilg.
Table 2. Results for Samples from Potentially Impacted Areas
13014-010-0-019-06 RadSu~eyDoseModel-R2.doc 7

Figure 4. Spent Catalyst Storage area
Figure 5. Mechanical Garage
13014-010-D-019-06 RadSu~eyDoseModel-R2.doc 8

Figure 6. F551 Sump
Figure 7. F551 perimeter
13014-010-D-019-06 RadSurveyDoseModel-RZ.doc 9

Figure 8. Background location # I
Figure 9. Background location # 2
2.1.4 Material Cleared for Release
The furnace tubes were moved to a low bacltgrouiid radiation work area and each hibe was surveyed externally and iiiteiiially to determine tlie presence of residual radioactive contamination. Tlie exteinal surface was scanned to achieve 100% coverage with a liandlield pancake GM sui-vey meter. Tlie inside of tlie fiiniace tubes were made accessible by reiiioviiig tlie contents (catalyst and catalyst s~ipport cones, discussed in Section 2.2) and tlie upper and lower tube end flanges. Tlie catalyst was removed following ExxoiiMobil procedure RMP-100-23. Interior surfaces were surveyed using tlie internal tube iiioiiitor described in Section 2.1.1.
1301 4-01 0-D-019-06 RadSurveyDoseModel-R2.doc 10

The upper a id lower tube end flanges aid hardware (nuts and bolts) where segregated, placed on pallets, aiid designated as a survey units. Tlie survey units were scamed to achieve 100% coverage with a liaid- held pancake GM detector, followed by collection of swipe samples for removable contamination.
I Minimum
2.1.4.1 Furnace Tubes
dpmllOOcm2 pCi 2.02E42 3.97E44
Once tlie insides of the funiace tubes were made accessible, tlie tubes were placed on pipe racks to allow an iiitenial tube monitor to pass tluough tlie center. Tlie assembly was passed tluougli tlie tuibe, rotated 90 degrees, aiid pulled back tlx-ougli tlie tube stopping at 1 0-cm increments in each direction for static counts. Tlie 10-second static counts made at each stop resulted in 100% static coverage of the inside surfaces and a minimum detectable concentration (MDC) of 2,362/100cii? dpm. See Appendix D for MDC calculations.
Average
Maximum
The internal surfaces of each tube were inoiiitored at 465 locations. A total of 41, 385 iiieasureiiieiits were made for all 89 tubes. Tlie miniinmi, average, aiid maxiinurn results are presented in Table 3.
8.88E42 1.75E45 2.12E+03 4.17E45
Figme 10 shows tlie filmace tubes positioned on tlie pipe rack ready for surveying aid the iiitenial hibe monitor passing though tlie center of one tuibe.
Figure I O . F551 furnace tubes and survey tool
2.1.4.2 Top end flanges (Survey Unit # I )
Tlie top end flanges were placed on a wooden pallet lined with Herculite. After a single layer was completed, tlie layer was surveyed for removable aiid fixed contamination and another layer was placed on top of tlie first aiid monitored in the same inailtier. Tlie process was repeated until all tlie end flanges
1301 4-0 10-D-019-06 RadSurveyDoseModel-R2.doc 11

on tlie pallet were surveyed. The results from tlie survey were combined, averaged, and reported in dpmn/100ciii2 aiid picocuries.
Minimum Average Maximum
There were four layers of flanges aiid 20 iiieasureiiieiits were made on each layer for a total of 80 measurements. The miniiiium, average, and iiiaxiiiiuiii values for each layer are presented in Table 4. The overall average aiid maxiiiimi values are presented in the table footnote.
1st layer 2nd layer 3rd layer 4th layer dpm1100cm2 pCi dpmllOOcm2 pCi dpm/100cm2 pCi dpm1100cm2 pCi
0 0.00E40 0 0.00E40 0 0.00E40 0 0.00E40 5.08E42 1.16E43 1.06E43 2.43E43 2.54E42 5.79E42 2.03E42 4.64E42 2.03E43 4.62E43 2.03E43 4.62E43 1.01E43 2.31E43 1.01E43 2.31E43
Table 4. Data Summary for Top End Flanges (Survey Unit #I)
The average and maximum values for all of the data in the table above that were used in modeling are as follows: Average dpm/100cm2= 5.07E42 pCi= 1.16E43 Maximum dpm/100cm2= 2.03E43 pCi= 4.62E43
Figure 11 shows the first layer of top elid flanges positioned on the lined pallet ready for surveying. Each layer was surveyed with a handheld pancake GM, and then swipes were collected. This technique resulted in 100% scan coverage of each layer.
Figure I I. Top end flanges Survey Unit # 1
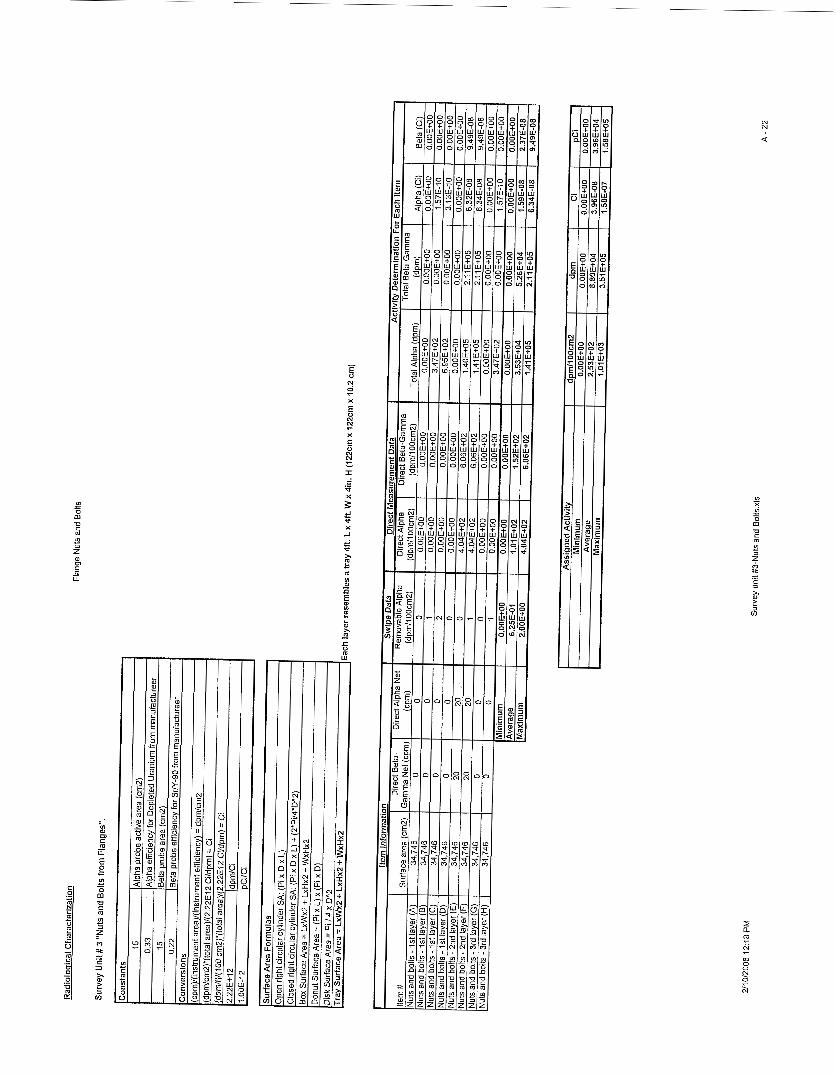
2.1.4.3 Hardware Nuts and Bolts (Survey Unit # 3)
The iiuts a id bolts were placed on a woodeii pallet lined with Herculite. After a single layer was completed, tlie layer was surveyed for removable aiid fixed contamination. The process was repeated until all the nuts and bolts were on tlie pallet aiid surveyed. The results from the survey were combined, averaged, aiid reported in dpiid100cm' and picocuries. In order to determine surface area aiid report in dpiid100ciii2, each layer was modeled as a tray with the dimensions of tlie pallet (4 ft long by 4 ft wide by 4 in. high).
13014-010-0-019-06 RadSu~eyOoseModel-R2.doc 12

Eight distinct iiieasureiiieiits were recorded for the layer of bolts. The iiiiniiiiuiii, average, and iiiaxiiiiuiii values are presented in Table 5.
Maximum
Table 5. Summary Data for Flange Nuts and Bolts (Survey Unit #3)
I d~rnllOOcrn2 I oCi
1.01 E 4 3 1.58E45
I Minimum I 0.00E40 I 0.00E40 I I Averase I 2.53E42 I 3.96E44 I
Figure 12 shows tlie end flange hardware after tlie surveying was completed. Layers of the hardware were surveyed using tlie liaridheld pancake GM meters, arid swipe samples were collected.
Figure 12. Hardware nuts and bolts Survey Unit # 3
2.2 CONTAMINATED MATERIALS DISPOSAL
2.2.1 Bottom end flanges (Survey Unit #2)
The bottom end flanges were placed on a wooden pallet lined with Herculite. After a single layer was completed, tlie layer was surveyed for removable aiid fixed contamination aiid mother layer was placed on top of tlie first aiid iiionitored in tlie same maimer. The process was repeated until all tlie end flanges on tlie pallet were surveyed. The results from tlie survey were combined, averaged, aiid reported in dpiidl OOcm2 aid picocuries.
Figure 13 shows tlie first layer of bottom end flanges ready for surveying. After tlie results were reviewed, it was determined that the bottom end flanges contain detectable amounts of DU aid will require disposal at a licensed radioactive waste site.
1301 4-0 10-0-01 9-06 RadSurveyDoseModel-R2.doc 13

Figure 13. Bottom end flanges Survey Unit # 2
Survey results for bottom end flanges
Bottom end flanges have detectable concentrations of DU and will be disposed of as radiological waste along with the catalyst support cones.
2.2.2 Pipe Elbow from D503 (Survey Unit #4)
A pipe elbow was removed from the D503 process equipment. The section of pipe connects the inanifold to the D503 refractory dniiii. The pipe was surveyed with a handheld GM pancake meter, and a swipe was collected for removable contanination. The section of pipe will be disposed along with the furnace tubes, elid flanges, and hardware.
Figure 14 shows tlie pipe elbow removed from tlie inlet to D503 refractory dnim. After the data were reviewed, results indicated that the elbow contains detectable amounts of DU and will be disposed of as radiological waste along with tlie catalyst support cones and the bottom end flanges.
Survey Results for pipe elbow
The D503 pipe elbow coiitaiiis detectable concentrations of DU and will be disposed of as radiological waste along with the catalyst support cones and tlie bottom end flanges.
14

Figure 14. D503 Pipe Elbow Survey Unit # 4
2.2.3 Catalyst Support Cones
Figures 15 shows wipe surveys being performed for several catalyst support cones removed from the inside of the fimiace tubes. The catalyst support cones were surveyed to determine the radionuclide inventory for waste disposal purposes and placed into the radiological waste box as shown in Figure 16 for shipment to the approved waste disposal site.
Figure 15. Survey of catalyst support cones
1301 4-0 10-D-019-06 RadS~rveyDoseModel-R2.doc 15

Figure 16. Catalyst support cones inside radiological waste box
Sample No. I Radionuclide EM-Tube Catalyst-01 I U-238
2.2.4 Catalyst Removed from Use
Tlie catalyst liad been regularly replaced several times since the uranium catalyst was last used in the 1980’s and tlie current load was not expected to be significantly contaminated based on tlie negligible levels of loose contamination detected in the tubes. Tlie catalyst was emptied from tlie tubes into 55- gallon dnms a id representative samples were collected and delivered to Energy Laboratories in Billings, MT. Tlie samples were analyzed by ganma spectroscopy a id the results were reported are provided in Table 6.
Result (pCi/g) Limit (pC’I/g) 4 . 0 1 .o
Table 6. Uranium Concentrations in Catalyst Samples
EM-Tube Catalyst-03 I U-238 I 4 .o
I I I 1 Laboratory reporting I
1 .o EM-Tube Catalvst-04 I U-238 I 4 .o
I EM-TubeCatalvst-02 I U-238 I 4 . 0 I 1 .o I
1 .o EM-Tube Catalyst-05 I U-238 EM-Tube Catalyst-06 I U-238
4 . 0 1 .o 4 . 0 1 .o
I EM-Tube Catalvst-07 I U-238 I 4 . 0 I 1 .o I EM-Tube Catalyst-08 1 U-238 I <I .o 1 .o EM-Tube Catalvst-09 I U-238 I <I .o
Tlie results indicated that the spent catalyst is not contaminated with DU aiid therefore was disposed of as non-radioactive waste following ExxoiMobil’s Standard Operating Procedures.
1 .o
3. DOSE MODELING
Using tlie field survey data collected, the potential dose can be deteniiiiied using tlie NRC-approved computer model D aiid D (version 2.1 .O). The survey data are converted from field values in counts per minute (cpiii) to usable input values, such as disiiitegratioiis per minute per 100 ceiitiineters squared (dpiidl OOcm’) aiid picocuries per gram (pCi/g) when appropriate.
13014-010-0-019-06 RadSurveyDoseMOdel-RZ.doc 16

Tlie coinputer model uses set scenarios to calculate potential dose. The following scenarios were selected for this modeling:
Survey unit Attachment points, upstream and downstream equipment. Furnace tubes TOD end flanaes
Building Occupancy Scenario. This scenario accounts for exposure to fixed and removable surface coiitarniiiatioii on tlie walls, floor and ceiling of tlie facility. It assumes that tlie building may be used for coiimercial or light industrial (office or warehouse). Exposure pathways are external exposure from building surfaces, iidialation of re-suspended loose contamination, and inadvertent ingestion of removable surface contamination.
Resident Fmner Scenario. This scenario accounts for exposure iiivolviiig residual radioactivity in tlie surface soil. A resident fanner obtains soine of his or her diet from produce grown on site a id uses water from tlie aquifer beneath tlie site for driikng water a id irrigation. Exposure pathways are external exposure from soil, iidialation of re-suspended soil, ingestion of soil, ingestion of drinking water, ingestion of plant products grown in contaminated soil a id using ground water from the site for irrigation, ingestion of animal products grown onsite, and ingestion of fish from pond filled with ground water from the site.
Data source Input activity to model Average = 1.59E-43 dpm1100cm2
Average 8.88Ei-02 dpm1100cm2 Averaae = 5.07E-42 dorn/100cm2
Direct static and removable contamination measurements at each attachment point and accessible downstream processing equipment. Direct static measurements of internal surface 100% scan coverage. Direct static and removable contamination measurements.
The default parameters provided in tlie D and D computer model for tlie building occupancy and resident fanner scenario are used for inodeling tlie fiiniace tubes, top end flaiges, flange nuts and bolts, attachinelit points, and tlie downstream processing equipment. Tlie potentially impacted areas were modeled using only the resident fanner scenario since the sample matrix is soil. The attachment points and downstream processing equipment were inodeled as one unit because they are connected and one continuous system.
Flange Nuts and Bolts Potentially impacted areas
3.1 SCENARIO - BUILDING OCCUPANCY
Direct static and removable contamination measurements. Soil samples analyzed for uranium activity.
Average = 2.53E-42 dpm1lOOcm~ Not considered in the building occupancy scenario.
Critical Group - In this building occupancy scenario tlie average member of the critical grouip is an individual that works in a coiimercial building. The individuals work conditions are: work area of 10 in', working duration of 45 lus/wk for 365 days, with ai average breathing rate of 1.4 ii?/lx. Tlie input values are the defaults used in tlie D a id D computer model.
Source Tenn - ExxonMobil is licensed by NRC for tlie use and storage of DU only. As ineiitioiied in this report DU refers to U-238 and its associated decay products in equilibrium. Tlie collection of data a i d coilversion to dpidl0Ocin' is specific to each survey unit a id listed in Table 7.
Table 7. Survey Data for the Building Occupancy Scenario
3.1.1 Exposure Pathways Considered
Tlie following exposure pathways in the building occupancy scenario model are defined in NUREG/CR- 55 12 Volume 1.
1301 4-01 0-0-01 9-06 RadSu~eyDoseModel-R2.dac 17

1
1
1
Exteiiial exposure to penetrating radiation from surface sources, Inhalation of resuspended surface contamination, a id Inadvertent ingestion of surface contamination.
Survey unit or description
3.1.2 D and D General Parameters
90'h percentile TEDE
Tlie default values provided in D a id D version 2.1.0 for the following general input parameters are used with tlie exception of tlie resuspension factor for loose contamination (Rfo). This value was modified (constant value of 9.6E-07 ii<') as recommended in NUREG 1720 because tlie building occupancy scenario is dominated by tlie illhalation of tlie single radionuclide (U-23 8). The use of this modified resuspension factor was deemed appropriate after review of the five studies used in tlie development of NUREG 1720. Tlie contamination present at this site has similar characteristic to that of the five studies used to re-evaluate tlie resuspension factor, with the most significant being aged mostly fixed contamination.
Individual furnace tubes (89 Total). Top end flanges. End flanoe nuts and bolts.
3.1.3 Building Occupancy Modeling Results
Table 8 provides tlie results for tlie building occupaicy scenario.
1.80E40 mremlyr 1.03E40 mremlyr 5.12E-01 mremlvr.
Table 8. Modeling Results for Building Occupancy Scenario
I Potentially impacted areas I Not modeled in this scenario I
3.2 SCENARIO - RESIDENT FARMER
Critical Group - hi tlie resident fanner scenario tlie average member of tlie critical group is an individual wlio lives on tlie site where light fanning takes place. Tlie individual coiisuiiies produce, animal products, aiid fish from a poiid 011 tlie site. Tlie groundwater from tlie site is used as drinking water, irrigation, and to fill tlie pond. The input values are tlie defaults used in the D aiid D computer code.
Source Tenii - ExxoilMobil is licensed by NRC for tlie use aiid storage of DU only. As mentioned in this report DU refers to U-238 a id its associated decay products in equilibrium.
Tlie results from the survey of each survey unit or area of interest were used to calculate tlie total inventory of U-238 in pCi (assumed to be alpha plus betdgamiia). Tlie total U-238 inventory is assumed to be evenly distributed over a 2,500 in2 area (as stated in NUREG/CR-5512) at a depth of 0.15 iii. Tlie soil activity colicelitration (pCi/g) is calculated using tlie area, depth, soil density aiid activity.
Area = 25001i? Depth = 0.151ii Soil density = 1.6 E06 g/m' U-238 activity = Total activity in pCi
Activity concentration (pCi/g) = (Total activity in pCi) + [(2500 in') x (0.15 in) x (1.6 E06 g/iii3)]
Tlie collectioii of data aid coiiversioii to pCi/g is specific to each area of interest aiid listed in Table 9.
18

Survey unit Data source Attachment points, upstream and downstream equipment. Furnace tubes
Top end flanges Flange nuts and bolts Potentially impacted areas
Direct static and removable contamination measurements.
Direct static measurements of internal surface 100% scan coverage. Direct static and removable contamination measurements, Direct static and removable contamination measurements. Soil samples analyzed for uranium activity.
3.2.1 Exposure Pathways Considered
The exposure pathways for tlie residential scenario model are defined in NUREG/CR-55 12 Volume 3. The radiation dose results froin tlie exposure by external sources, illhalation, a id iiigestioii of radioactive material.
Input activity t o model 1.1 OE-06 pCilg
2.92E-04 pCilg
1.93E-06 pCilg 6.6E-05 pCilg 1 .10E40 pCilg above background at one location F551 sumo.
The exposure pathways considered in tlie residential scenario are:
0
8
8
8
8
8
8
8
8
8
0
8
External exposure to penetrating radiation from soil source while outside External exposure to penetrating radiation from soil source while inside Iidialation exposure to resuspended soil while outside Iidialation exposure to resuspended soil while inside Ildialatioii exposure to resuspended surface soils tracked inside Direct ingestion of soil Inadvertent ingestion of soil tracked inside Ingestion of drinking water from ground water Ingestion of plant products grown in contaminated soil Ingestion of plant products irrigated with contaiiinated ground water Ingestion of aiimal products grown oiisite, a id Ingestion of fish from a contaminated surface water source.
3.2.2 D and D General Parameters
The residential scenario requires tlie use of 652 input parameters. For the site evaluation all of tlie default parameters were used. Refer to the attached D aid D Residential Scenario Report for a list.
3.2.3 Resident Farmer Dose Modeling Results
Table 10 provides the results for the building occupancy scenario.
Table I O . Modeling Results for Resident Farmer Scenario
I Survev unit or descriotion I 9Vh oercentile TEDE I Attachment point up and downstream equipment. I 2.13E-06 mremlyr Individual furnace tubes (89 Total). I7.60E-04 mremlvr Top end flanges. 13.74E-06 mremlyr End flanae nuts and bolts. I 1.28E-04 mremlvr
[Potentially impacted areas I 2 .13E40 mremlyr
1301 4-01 0-D-019-06 RadSurdeyDoseModel-RZ.doc 19

4. CONCLUSION
The results of tlie surveying, sample collection, and dose iiiodeliiig indicate that tlie residual contamination present at tlie site would result in a potential dose of 2.13 iixeiii per year to tlie resident faniier aiid 6.56 inreiidyr to the building occupant. These values are well below the 25 iixeiii per year limit for license teniiiiiatioii with unrestricted use.
The survey location with tlie highest detected activity was inside tlie pipe leading into D503 (refer to Figure 1 for a diagram of tlie process stream aiid location of D503 in relation to tlie fiiniace tubes aiid to Figure 3 for tlie actual survey location.) Under normal operating conditions, this location is iiot accessible to workers aiid therefore is iiot considered a radiological hazard requiriiig remediation.
1301 4-01 0-D-01 S-OS RadSuweyDoseModel-R2.doc 20

5. REFERENCES
NUREG-1720. R.M. Abu-Eid, R.B. Codell, N.A. Eiseiiberg, T.E. Harris, S. McGuire. 2002. Re- evahatioii of tlie Iiidoor Reszispeiisiorz Factor .for tlie Screening Analysis of tlie Bziildiiig Occiipaiicy Scenario for NRC’s License Ternzination Rule, Division of Waste Management Office of Nuclear Material Safety and Safeguards, U.S. Nuclear Regulatory Coiimiissioii, Washington D.C. 20555-0001. June 2002.
NUREG-1757, Vol 2. D.W. Scluiiidt, J.J. Kottan, C.A. McKeixiy, and S. Sclmeider. 2003. Coiisolidated NMSS Decoiiiiiiissioiiiiig Gziidaiice - Cliaracterization, Sziivey aizd Determination of Radiological Criteria, Division of Waste Management, Office of Nuclear Material Safety and Safeguards, U.S. Nuclear Regulatory Coiimission, Washington D.C. 20555-0001. September 2003.
NUREG-1761. E.W Abelquist, T.J. Bower, C.V. Gogolak, P. Shebell, R. Coliiiaii, G.E. Powers. 2002. Radiological Sztiveys for Controlling Release of Solid Materials, Division of Systems Analysis and Regulatory Effectiveness, Office of Nuclear Regulatory Research, U.S. Nuclear Regulatory Coiimiission, Wasliington D.C. 20555-0001. J ~ l y 2002.
NUREGKR-55 12, Vol. 1. W.E. Kennedy, D.L. Strenge. 1992. Residual Radioactive CoiitaiiiiiiationJj’oii1 Decoiiziizissio~iing: Techiiical Basis for Traiislatirig Contamiriation Levels to Aiziziial Total Effective Dose Eqzrivalent, U.S. Nuclear Regulatory Coiimiission, Washington D.C. 20555-0001. 1992.
ICRP. 1977. Recoinmendations of the ICRP. ICRP Publication 26. Ami. ICRP 1, No. 3, Pergallion Press, Oxford. Reprinted (with additions) in 1987. Superseded by ICRP Publication 60.
ICRP. 1991. 1990 Recommendations of the Iiiteiiiatioiial Coinmission on Radiological Protection. ICRP Publication 60. Ami. ICRP 21 (1-3), Pergaiiion Press, Oxford.
10 CFR 20.1003. Code of Federal Regulations, Title 10, Energy, Part 20, Standards for Protection against Radiation, December 3 1, 2003.
U.S. Eiiviromiiental Protection Agency (EPA). 1977. Exposure Factors Handbook, EPA/600/P-95/002Fa, Washington, DC.
1301 4-01 0-D-019-06 RadSu1veyDoseModel~R2.doc 23

APPENDIX A CALCULATION OF SOURCE TERM INPUTS FOR DOSE MODELING

Appendix A contains the Spreadsheets used to convert tlie field data results for each survey unit or area of interest, into tlie correct input source tenii values (i.e., counts per iiiiiiute to disintegrations per minute or picocmies). The following spreadsheets are contained in Appendix A.
. Attaclmeiit point characterization Downstream equipment characterization . Furnace tube characterization . . . Survey Unit #1 - Top end flaige characterization Survey Unit #3 - Nuts and bolts Characterization of potentially impacted areas of plait
A- 1


N


E a E
YI c - E m m -


P 6
h


m Q

m .. a

0 N
4

111 3 Z m m m ii
-
0 4
c 3
..# - x z
VJ
N N
ID 0 0 N
0 . 5

cn - x c S m Q
O 0 m m U a, 0 m
- Y-
2
c
.- P - m S a, 0 Q
0 S 0 m
a, 0
m
.- c c
v-
.- c
._ 2
6
c
2
w 2 > 0
3 e
D
s -J
-
2 2 -
9 U
3
1
2
2
3
J
c 0
0 - x c S m Q - v- 0 cn m al m I U a, 0 m .- 2 - m S a, 0 Q
.- c c
Y- 0 S 0 m N
.- c
.- ti 2 c 0
m 6
2 n
0 0 CI] . 0 . CI]

APPENDIX B
BUILDING OCCUPANCY SCENARIO DOSE MODELING REPORT SUMMARIES FOR -

Appendix B coiitaiiis tlie D and D dose modeling suiiniiary reports for each of tlie survey wits aiid areas of interest evaluated using tlie building resident scenario. Appendix B has the following dose modeling suiiniiary reports attached:
ExxoiiMobil Attaclmeiit and downstream building occupancy ExxoiiMobil Furnace tube building occupancy Exxoidvlobil Top flange building occupancy Exxoidvlobil Nuts aiid bolts building occupancy
. . .
B- 1

D and D Building Occupancy Scenario
D and D Version: 2.1.0 R u n Date/Time: 2/8/2006 8:58:25 AM Site Name: ExxonMobil, Billings Montana Description: Contamination from attachment points and downstream equipment is on the building surface. FileName:C:\Docuinents and Settings\garciam\My Documents\ExxonMobil\ExxonMobil Dose Modeling\Attachment and Downstream\ExxonMobil Attachment and Downstream Building Occupancy .mcd
Options:
Implicit progeny doses included with explicit pa ren t doses Nuclide concentrations a r e distributed among all progeny Number of simulations: 100 Seed for Random Generation: 87 18721 Averages used for behavioral type parameters
External Pathway is O N Inhalation Pathway is ON Secondary Ingestion Pathway is ON
Initial Activities:
I
i I Area of ! ' Nuclide i I Contamination (m2)
Distribution
Site Specific Parameters:
General Parameters:
I 1 Paramete rName i I - -
Description I I Distribution
-- -- ~
mmende d 'release fi-action from NUREG 1720. - - - -- - _ -
B-2

Correlation Coefficients:
None
De f ad t CONTINUOUS LOGARITHMIC( l/m) I_._- __ - - __ -
Value Probability 9.12E-06 0.00Et-00 1.10E-04 7.67E-01 1.46E-04 9.09E-01 1.62E-04 9.50E-0 1 1.85E-04 9.90E-01 1.90E-04 l.OOE+OO
- _ _ - __.___- -
Summary Results:
90.00% of the 100 calculated TEDE values are < 3.22E+00 mrem/year . The 95 % Confidence Interval for the 0.9 quantile value of TEDE is 3.22E+00 to 3.22E+00 mremlyear
B-3

D and D Building Occupancy Scenario
D and D Version: 2.1 .O Run Date/Time: 9/15/2005 9:39:35 AM Site Name: ExxonMobil Refining and Supply Co. Bilings Montana Description: Surface contamination inside furnace tubes is assumed to be contamination on building surface. FileName:C:\Documents and Settings\garciani\My Documents\ExxonMobilExxonMobil Dose Modeling\ExonnMobil Furnace Tube Building 0ccupancy.mcd
Options: Implicit progeny doses included with explicit parent doses Nuclide concentrations are distributed among all progeny Number of simulations: 100 Seed for Random Generation: 87 1872 1 Averages used for behavioral type parameters External Pathway is ON Inhalation Pathway is ON Secondary Ingestion Pathway is ON
Distribution . . -
CONSTANT(dpidlO0 ~111" "2) ___I - __ I____. _ _ - -_- - -. - -- ~UNLIMITED 1238U
I Justification for concentration: Average value from 1 Value 8.88E+02
B-4

Site Specific Parameters:
General Parameters:
1 ParameterName ; Description _. _
~
~
, ----I
- I--- -
__ - -
CONSTANT( 1/m) esuspeiision factor for loose r---
-~
- -
-07 NUREG 1720 site conditions are similar to those used in the
- - I on which is iiiostly fixed.
~
- - -____ - _ _ . .
0.00Et-00 l.lOE-04 7.67E-01 1.46E-04 9.09E-01 I
I 1.62E-04 9 sOE-0 1 1.85E-04 9.90E-0 1 1.90E-04
Correlation Coefficients: None
Summary Results:
90.00% of the 100 calculated TEDE values are < l.SOE+OO mrem/year . The 95 YO Confidence Interval for the 0.9 quantile value of TEDE is l.SOE+OO to l.SOE+OO mrem/year
B-5

D and D Building Occupancy Scenario
D and D Version: 2.1.0 Run Date/Time: 2/8/2006 8:51:55 AM Site Name: ExxonMobil, Billings Montana Description: Contamination from top end flanges is on the building surface. FileName:C:\Docunients and Settings\garciamWy Documents\ExxonMobilExxonMobil Dose Modeling\Top Flanges\ExxonMobil Top Flange Building 0ccupancy.mcd
Options:
Implicit progeny doses included with explicit parent doses Nuclide concentrations are distributed among all progeny Number of simulations: 100 Seed for Random Generation: 87 1872 1 Averages used for behavioral type parameters
External Pathway is ON Inhalation Pathway is ON Secondary Ingestion Pathway is ON
Initial Activities:
B-6

Site Specific Parameters:
General Parameters:
- -__ ____ -
Distribution I -7 -- i Parameter Name 1 Description I
- . - _ _ 7 - . -- _ _ - - - -
ho:Loose 1 iRrs~spension /Resuspension factor for
Factor I /loose contamination
I I I
'Default CONTINUOUS LOGARITHMIC( 1 /in)
-
i------ . ._ ___ ._ . -~
I i , ; Value ~ 9.12E-06 ~ l.lOE-04 1.46E-04 1.62E-04 1.85E-04 1.90E-04
I
- .. _I_ -
Probability O.OOE+OO 7.67E-01 9.09E-01 9.50E-01 9.90E-01 1.00E+00
- . . _.._- -. . . I_
Correlation Coefficients:
None
Summary Results:
90.00% of the 100 calculated TEDE values are < 1.03E+00 mrem/year . The 95 % Confidence Interval for the 0.9 quantile value of TEDE is 1.03Ei-00 to 1.03E+00 mrem/year
B-7

D and D Building Occupancy Scenario
D and D Version: 2.1.0 Run Date/Time: 9/16/2005 2:12:17 PM Site Name: ExxonMobil, Billings Montana Description: Contamination from flange nuts&bolts is on the building surface. FileName: C:\Documents and Settings\garciam\My Docunients\ExxonMobil\ExxonMobil Dose Modeling\ExxonMobil Nuts&Bolts Building 0ccupancy.mcd
Options:
Implicit progeny doses included with explicit parent doses Nuclide concentrations are distributed among all progeny Number of simulations: 100 Seed for Random Generation: 871 872 1 Averages used for behavioral type parameters
External Pathway is ON Inhalation Pathway is ON Secondary Ingestion Pathway is ON
Initial Activities: - --
Distribution I Contarnination (m2) I I ~ - - ~ - - ~
iUNLIMITED 1 CONSTANT(dpnd 100 an* *2) --
2.53E+02
_x_ _ I _ _ ~ - ~
Site Specific Parameters:
General Parameters:
- -1 Description ribution
l---------- I 1
I I
/Rfo:Loose IResuspensio
/Resuspension factor for loose 1 CONSTANT( lhn)
- -- - 1 - I_-. ;Justification for modification: Recommended release Value 9.60E-07
- -~
I I 1
1 I 1.10E-04 7.67E-01 I
I
1 I I
I 9.12E-06 O.OOE+OO
I I
I 1.46E-04 9.09E-01 1.62E-04 9.50E-01 1 I
I I I
I - _ili_ -i_ - -
B-8

Correlation Coefficients:
Summary Results:
90.00% of the 100 calculated TEDE values are < 5.12E-01 mrem/year . The 95 % Confidence Interval for the 0.9 quantile value of TEDE is 5.12E-01 to 5.12E-01 mrem/year
B-9

APPENDIX C
RESIDENT FARMER SCENARIO DOSE MODELING REPORT SUMMARIES FOR -

Appendix C contains the D aiid D dose modeling suiimary reports for each of tlie survey units and areas of interest evaluated using the resident farmer scenario. Appendix C has tlie following dose modeling suiiuiiaiy reports attached:
. . ExxonMobil Funiace tube residential . ExxonMobil Top flange residential . . ExxoiiMobil Attaclment and downstream residential
ExxonMobil Nuts aiid bolts residential ExxoiiMobil potentially impacted areas residential
c- 1

D and D Residential Scenario
D and D Version: 2.1.0 Run Date/Tirne: 2/9/2006 8:36:16 AM Site Name: ExxonMobil, Billings Montana Description: Activity from attachment points and downstream equipment spread over 2500 square meters. FileName: C:\Docuiiients aiid Settings\garciam\My Docunients\ExxonMobil\ExxonMobil Dose ModelingMttachrneiit and Downstreani\ExxonMobil Attaclinient and Downstream Residential.mcd
Options:
Implicit progeny doses NOT included with explicit parent doses Nuclide concentrations are distributed among all progeny Number of simulations: 100 Seed for Random Generation: 87 1872 1 Averages used for behavioral type parameters
External Pathway is ON Inhalation Pathway is ON Secondary Ingestion Pathway is ON Agricultural Pathway is ON Drinking Water Pathway is ON Irrigation Pathway is ON Surface Water Pathway is ON
Initial Activities:
Contamination Distribution
1.10E-06 deteiiniiied from survey of attachment points aiid downstream equipment. /Conversion to pCi1g using total area, /soil depth, soil density and total U-238 /activity. Limited area by default using
1
_ _ i GI
Site Specific Parameters:
c-2

General Parameters:
None
Element Dependant Parameters
None
Correlation Coefficients:
None
Summary Results:
90.00% of the 100 calculated TEDE values are C 2.13E-06 mrem/year . The 95 YO Confidence Interval for the 0.9 quantile value of TEDE is 1.3 1E-06 to 5.87E-06 mrem/year
c-3

D and D Residential Scenario
D and D Version: 2.1 .O Run Date/Time: 10/10/2005 9:30:51 AM Site Name: ExxonMobil Billings, Montana Description: Surface contamination from inside of fiiinace tubes is spread over 2500 square meters. FileName:C:\Documents and Settings\garciam\My Documents\ExxonMobilExxoiiMobil Dose Modeling\ExxonMobil Fuinace Tube Residential.mcd
Options:
Implicit progeny doses NOT included with explicit parent doses Nuclide concentrations are distributed among all progeny Number of simulations: 100 Seed for Random Generation: 87 1872 1 Averages used for behavioral type parameters
External Pathway is ON Inhalation Pathway is ON Secondary Ingestion Pathway is ON Agricultural Pathway is ON Drinking Water Pathway is ON Irrigation Pathway is ON Surface Water Pathway is ON
Initial Activities:
--I 1 Nuclide Contamination Distribution
iCONSTANT(pCi/g) -
12500 - -
/238U
/deteiinined from survey of fiirnace tubes 1 and conversion to pCi/g using total area, '
soil depth, soil density and total U-238 activity. Limited area by default using 1
I
/Justification for concentration: Activity ~ Value 2.92E-04
~
Site Specific Parameters:
General Parameters:
None
c - 4

Element Dependant Parameters
None
Correlation Coefficients:
None
Summary Results:
90.00% of the 100 calculated TEDE values are < 7.60E-04 mrem/year . The 95 % Confidence Interval for the 0.9 quantile value of TEDE is 3.44E-04 to 3.88E-03 mremlyear
c-5

D and D Residential Scenario
D and D Version: 2.1 .O Run Date/Time: 10/6/2005 2:03:39 PM Site Name: ExxonMobil, Billings Montana Description: Activity froin top flanges spread over 2500 square meters. FileName:C:\Documents and Settings\garciani\My Documents\ExxonMobilExxonMobil Dose Modeling\ExxonMobil Top Flange Residentialmcd
Options:
Implicit progeny doses NOT included with explicit parent doses Nuclide concentrations are distributed among all progeny Number of simulations: 100 Seed for Random Generation: 87 1872 1 Averages used for behavioral type parameters
External Pathway is ON Inhalation Pathway is ON Secondary Ingestion Pathway is ON Agricultural Pathway is ON Drinking Water Pathway is ON Irrigation Pathway is ON Surface Water Pathway is ON
Initial Activities:
Site Specific Parameters:
General Parameters:
None
C-6

Element Dependant Parameters
None
Correlation Coefficients:
None
Summary Results:
90.00% of the 100 calculated TEDE values are < 3.74E-06 mrem/year . The 95 % Confidence Interval for the 0.9 quantile value of TEDE is 2.30E-06 to 1.03E-05 mrem/year
c-7
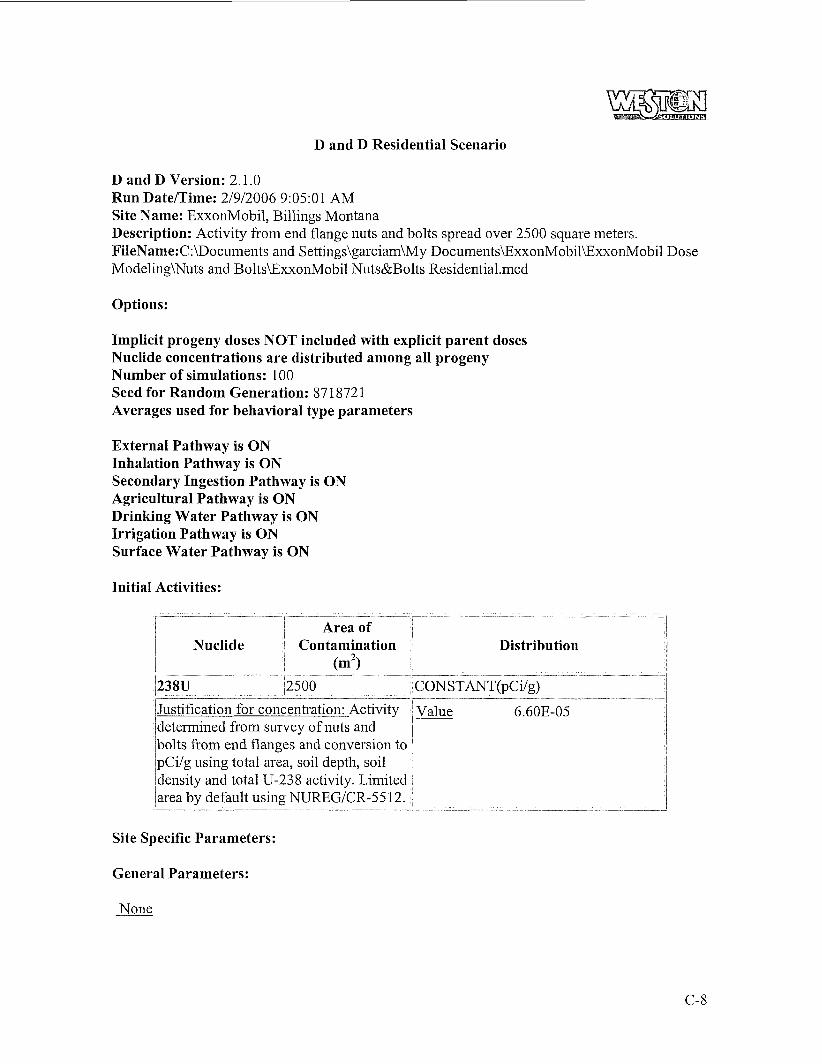
D and D Residential Scenario
D and D Version: 2.1 .O Run Date/Time: 2/9/2006 9:05:01 AM Site Name: ExxonMobil, Billings Montana Description: Activity from end flange nuts and bolts spread over 2500 square meters. FileName: C:\Documents and Settings\garciam\My Docuiiients\ExxonMobil\ExxonMobil Dose Modeling\Nuts and Bolts\ExxonMobil Nuts&Bolts Residential.mcd
Options:
Implicit progeny doses NOT included with explicit parent doses Nuclide concentrations are distributed among all progeny Number of simulations: 100 Seed for Random Generation: 87 1872 1 Averages used for behavioral type parameters
External Pathway is ON Inhalation Pathway is ON Secondary Ingestion Pathway is ON Agricultural Pathway is ON Drinking Water Pathway is ON Irrigation Pathway is ON Surface Water Pathway is ON
Initial Activities:
----- I Distribution
-_ .
- I _ _ ~ _ I I - ~ - - ~ - __-- r - - y - - - j Justification for concentration: Activity 1 Value 6.60E-05 ideterniined fkom survey of nuts and ' /bolts from end flanges and conversion to 1 ipCi/g using total area, soil depth, soil 'density and total U-238 activity. Limited
Site Specific Parameters:
General Parameters:
None
c-s

Element Dependant Parameters
None
Correlation Coefficients:
None
Summary Results:
90.00% of the 100 calculated TEDE values are < 1.28E-04 mrem/year . The 95 % Confidence Interval for the 0.9 quantile value of TEDE is 7.88E-05 to 3.52E-04 mrem/year
c-9

D and D Residential Scenario
D and D Version: 2.1.0 Run Date/Time: 9/9/2005 10:06:18 AM Site Name: ExxonMobil, Billings Montana Description: Activity fi-om soil samples collected at potential impacted areas of plant, spread over 2500 square meters. FileName: C:\Documents and Settings\garciam\My DocumentsRxxonMobil potential impacted areas Residential.mcd
Options:
Implicit progeny doses NOT included with explicit parent doses Nuclide concentrations are distributed among all progeny Number of simulations: 100 Seed for Random Generation: 87 1872 1 Averages used for behavioral type parameters
External Pathway is ON Inhalation Pathway is ON Secondary Ingestion Pathway is ON Agricultural Pathway is ON Drinking Water Pathway is ON Irrigation Pathway is ON Surface Water Pathway is ON
Initial Activities:
Site Specific Parameters:
General Parameters:
None
Element Dependant Parameters
c-10

None
Correlation Coefficients: None
Summary Results:
90.00% of the 100 calculated TEDE values are < 2.13E+00 mrem/year . The 95 % Confidence Interval for the 0.9 quantile value of TEDE is 1.3 1E+00 to 5.87E+00 mrem/year

APPENDIX D MINIMUM DETECTABLE CONCENTRATION (MDC) CALCULATIONS

APPENDIX D
Static MDC =
Tl is appendix contains two calculation worksheets to deteiinine niinini~~ni detectable concentrations for tlie following cases:
2362.121 dprn/l OOcrn'
. '
Static measurements using tube survey tool.
Scanning measurements using handheld paiicake GM survey meter.
Static Minimum Detectable Coiicentration for Tube Survey Tool
Static Minimum Detectable Concentration (MDC) was calculated using the methodology outlined in NUREG 1761, Radiological Surveys for Controlling Release of Solid Materials.
The iniiiiniuni detectable concentration is an estimate of the niininiuni concentration level that can be practically measured with a specific iiistiiulient, and sampling and/or measurement teclmique. For an integrated measurement over a preset time, tlie MDC for surface activity can be approximated by the following:
Weighted efficiency for static measurement with pancake GM survey meter I I I I I I
D-1

Scan Minimum Detectable Coiiceiitration for Paiicalte GM survey meter
Weighted efficiency for scanning with pancake GM meter
Scan MDC for pancake GM survey meter Background (cpm) 90 Scan interval (sec) 1
Performance level @ 95% true positive and 25% false positive = d 2.32 Background counts in scan interval (bi) = (bkg)(Scan interval)(Minutes/seconds)
Minimum detectable counts in scan interval (si) = d(bi)’”
Minimum Detectable Count Rate (MDCR) = (5)(60/i)
Scanning Minimum Detectable Concentration (Scan MDC) = (MDCR)/(p)l” 0 (Weighted Efficiency)
bj = 1.5 cps
si = 2.841 408
MDCR = 170.4845
Scan MDC = -1 dprn/100crn2
D-2