hyaluronan synthases (has1–3) in stromal and malignant cells correlate with breast cancer grade...
TRANSCRIPT
PRECLINICAL STUDY
Hyaluronan synthases (HAS1–3) in stromal and malignant cellscorrelate with breast cancer grade and predict patient survival
Paivi Auvinen • Kirsi Rilla • Ritva Tumelius • Markku Tammi •
Reijo Sironen • Ylermi Soini • Veli-Matti Kosma • Arto Mannermaa •
Jukka Viikari • Raija Tammi
Received: 24 October 2013 / Accepted: 3 December 2013 / Published online: 14 December 2013
� Springer Science+Business Media New York 2013
Abstract Accumulation of hyaluronan (HA) in pericel-
lular stroma and carcinoma cells is predictive of unfavor-
able patient prognosis in many epithelial cancers.
However, it is not known whether the HA originates from
carcinoma or stromal cells, or whether increased expres-
sion of hyaluronan synthase proteins (HAS1–3) contributes
to HA accumulation. In this study, localization and
expression of HAS1–3 were evaluated immunohisto-
chemically in 278 cases of human breast cancer, and cor-
related with prognostic factors and patient outcome. Both
carcinoma cells and stromal cells were HAS-positive. In
carcinoma cells, HAS1 and HA stainings correlated with
each other, and HAS1 associated with estrogen receptor
negativity, HER2 positivity, high relapse rate, and short
overall survival. In stromal cells, the staining levels of all
HAS isoforms correlated with the stromal HA staining,
stromal cell CD44, high relapse rate, and short overall
survival of the patients. In addition, expression levels of
stromal HAS1 and HAS2 were related to obesity, large
tumor size, lymph node positivity, and estrogen receptor
negativity. Thus, stromal HAS1 and HAS3 were indepen-
dent prognostic factors in the multivariate analysis. The
data suggest that increased levels of HAS enzymes con-
tribute to the accumulation of HA in breast cancer, and that
HA is synthesized in carcinoma cells and stromal cells. The
study also indicates that HAS enzyme levels are related to
tumor aggressiveness and poor patient outcome represent-
ing potential targets for therapy.
Keywords Breast cancer � Hyaluronan synthase �HER2 � Obesity
Abbreviations
HA Hyaluronan
Has, HAS Hyaluronan synthase gene and protein
bHABC Biotinylated hyaluronan binding complex
HR Hazard ratio
TSG-6 Tumor necrosis factor alpha stimulated
gene-6
IaI Inter alpha inhibitor
UDP Uridine diphosphate
RAR Retinoic acid receptor
STAT Signal transducer and activator of
transcription
NF-kB Nuclear factor kappa-light-chain-enhancer of
activated B cells
CREB cAMP response element binding protein
CISH Chromogenic in situ hybridization
BMI Body mass index
Electronic supplementary material The online version of thisarticle (doi:10.1007/s10549-013-2804-7) contains supplementarymaterial, which is available to authorized users.
P. Auvinen (&)
Department of Oncology, Cancer Center, Kuopio University
Hospital, P.O. Box 100, 70029 Kuopio, Finland
e-mail: [email protected]
K. Rilla � R. Tumelius � M. Tammi � J. Viikari � R. Tammi
Department of Anatomy, Institute of Biomedicine, University of
Eastern Finland, Kuopio, Finland
R. Sironen � Y. Soini � V.-M. Kosma � A. Mannermaa
Institute of Clinical Medicine, Pathology and Forensic Medicine,
University of Eastern Finland, Kuopio, Finland
R. Sironen � Y. Soini � V.-M. Kosma � A. Mannermaa
Biocenter Kuopio and Cancer Center of Easter Finland,
University of Eastern Finland, Kuopio, Finland
R. Sironen � Y. Soini � V.-M. Kosma � A. Mannermaa
Imaging Center, Clinical Pathology, Kuopio University Hospital,
Kuopio, Finland
123
Breast Cancer Res Treat (2014) 143:277–286
DOI 10.1007/s10549-013-2804-7
GlcUA Glucuronic acid
GlcNAc N-acetyl-glucosamine
Introduction
Hyaluronan (HA) is a ubiquitous component of the extra-
cellular matrix, present in the most normal tissues but its
levels are markedly increased in many carcinomas [1]. In
breast carcinoma, a high concentration of HA in pericel-
lular stroma and carcinoma cells strongly associates with
poor differentiation of tumors and unfavorable patient
prognosis [2].
Hyaluronan is produced at the intracellular face of the
plasma membrane by three isoforms of hyaluronan syn-
thases (HAS1–3) [3]. The three HASs have different
expression patterns and enzymatic properties [3]. However,
the functional importance of the three enzymes is not
entirely clear, since only Has2 knockdown is embryoni-
cally lethal [4] while Has1 and Has3 deletions have only
minor effects on the phenotype [5]. During HA synthesis,
HAS transfers the alternating glucuronic acid (GlcUA) and
N-Acetyl-glucosamine (GlcNAc) moieties from their
respective UDP-derivatives into this glycosaminoglycan,
simultaneously extruding the HA-chain into the extracel-
lular space [3]. The newly synthesized HA is either
released into the matrix or remains attached to the plasma
membrane, retained there by either HAS or by the specific
HA receptor, CD44, and thus forming a pericellular HA-
coat [6, 7].
Regulation of HAS activity is complex and occurs at
both the transcriptional and post-transcriptional levels [5].
Growth factors and cytokines are known to be major reg-
ulators of Has gene expression, especially those signaling
through the ErbB, FGF, and TGFb families [5]. Post-
transcriptional modifications of HAS, such as addition of
phosphate and O-GlcNAc moieties [5], as well as HAS
transport to and residence within the plasma membrane
strongly influence the enzymatic activity [8]. In addition,
the cellular contents of the HAS substrates UDP-GlcUA
and UDP-GlcNAc regulate HA synthesis [9].
Only a few clinical studies have focused on the presence
and location of HAS isoenzymes in malignant human
tumors. In bladder carcinoma, the level of HAS1 mRNA
was significantly increased, and this elevation predicted
metastasis [10]. The concentration of HAS1 mRNA was
also higher in renal cell carcinomas as compared with
normal tissue, but this was not the case in benign renal
tumors [11]. In addition, increased HAS1 mRNA expres-
sion in colon cancer [12] and elevated HAS1 protein
expression in ovarian cancer [13] have both correlated with
poor survival of patients. While, it is thought that most of
the HA accumulated in the tumor stroma is produced by
HAS1–3 in the stromal cells [1], there are also reports of an
increase in the amount of HAS protein present in carci-
noma cells [14].
The distribution and amount of HAS1–3 proteins have
not been studied in human breast carcinoma, although there
are experimental studies on breast cancer cells demon-
strating the importance of HAS2 as an enhancer of cancer
cell invasiveness and aggressiveness [15]. It has been
claimed that HAS2 has a critical role in the development of
a prometastatic microenvironment [16]. The aim of this
study was to investigate the localization and levels of
HAS1–3 proteins in human breast carcinoma cases. Fur-
thermore, tumoral HAS1–3 levels were correlated with
those of CD44 and HA, as well as with a number of clinical
parameters i.e. tumor size, nodal involvement, HER2, ER,
tumor grade, relapse rate, and survival. A strong prognostic
value for unfavorable outcome was associated with all
HASs, especially with HAS1.
Patients and methods
The criteria for patient selection have been described pre-
viously [17]. Shortly, the material included 278 breast
carcinoma cases, consisting of 139 HER2 positive and 139
HER2 negative cases matched with the time of the opera-
tion and the age of the patients. With the exception of the
HER2-status, no other pathological and clinical data were
reviewed before the selection of the patients. Permission
for this study was provided by the ethics committee of the
University of Eastern Finland, and also by the National
Supervisor Authority for Welfare and Health (VALVIRA).
The baseline characteristics of the patients have been
described previously [17]. Briefly, all of the 278 cases had
invasive breast carcinoma, and in addition 98 patients
(35 %) had also an in situ component. Two hundred and
twenty-eight patients (82 %) had ductal, 27 (10 %) had
lobular, 5 (2 %) mucinous, and 18 (6 %) presented with
some other histological subtype. Seventy-four (27 %) of the
patients had stage one, 153 (55 %) had stage 2, and 51
(18 %) were diagnosed with stage three disease. The mean
age of the patients was 58 years (ranging from 32 to
86 years), and the mean follow-up time was 6.3 years
(ranging from 0.4 to 11.1 years). As an adjuvant hormonal
treatment 107 (39 %) received tamoxifen, 40 (14.5 %) were
treated with an aromatase inhibitor, 23 (8 %) had switched
from tamoxifen to aromatase inhibitor, and 4 (1.5 %) had
Zoladex�. These were adjuvant chemotherapy regimens; 79
(28 %) received an anthracycline, 69 (25 %) anthracycline
and taxane, 3 (1 %) only taxane therapy, and 53 (19 %) an
adjuvant therapy based on cyclophosphamide, methotrexate,
278 Breast Cancer Res Treat (2014) 143:277–286
123

and 5-fluorouracil (CMF). Adjuvant trastuzumab treatment
was given to 63/139 (45 %) of the HER2-positive patients.
Postoperative radiotherapy was provided to 248 (89 %) of
all patients.
HAS, HA, and CD44 stainings
The deparaffinised sections were subjected to antigen
retrieval by incubation in 10 mM citrate buffer, pH 6.0 for
15 min in a pressure cooker at 120 �C. In order to block
endogenous peroxidase, the sections were treated for 5 min
with 1 % H2O2. After washing with 0.1 M Na-phosphate
buffer, pH 7.4 (PB), the sections were incubated in 1 %
bovine serum albumin (BSA) and 0.1 % gelatin solution
(Sigma G-2500, Sigma-Aldrich, MO) in PB for 30 min to
block nonspecific binding. Hyaluronan synthases
(HAS1–3) were detected by incubating the sections over-
night at 4 �C with polyclonal antibodies for HAS1 (2 lg/
ml, sc-34021, Santa Cruz Biotechnology, Inc., Santa Cruz,
CA), HAS2 (2 lg/ml, sc-34067, Santa Cruz) or HAS3
(2 lg/ml sc-34204, Santa Cruz), diluted in 1 % BSA. After
washed with PB, the sections were incubated for 1 h with
biotinylated antigoat secondary antibody (1:1,000, Vector
Laboratories) and visualized with the avidin–biotin per-
oxidase method (1:200, Vectastain Kit, Vector Laborato-
ries) followed by incubation for 5 min in 0.05 %
diaminobenzidine (Sigma) and 0.03 % hydrogen peroxide
in PB, yielding a brown reaction product. The nuclei were
stained with Mayer’s hematoxylin. The specificity of the
antibody stainings was controlled by preincubating the
antibodies with the peptides used for immunization, which
reduced the staining intensity with each antibody (Sup-
plementary Fig. S1). The possible cross-reactivity between
the antibodies against HAS1–3 has been controlled by
staining MCF7 cells transfected with HAS1–3 constructs.
No cross-reactivity was observed [18]. The staining
methods used for HA and CD44, and their evaluation have
been described before [17].
The evaluation of the HAS1–3
Hyaluronan synthase protein immunostainings were eval-
uated using representative 5 lm thick tumor sections.
Several randomly picked high-power fields were evaluated
in each section. The expression of HAS1–3 in breast car-
cinoma cells and stromal cells (i.e. fibroblasts, myofibro-
blasts and endothelial cells) was graded according to the
percentage of positive cells: negative (0–5 %); weak
(6–25 %); moderate (26–50 %); high (51–75 %); or very
high (76–100 %). The sections were evaluated by three
independent evaluators (YS, PA, RTu). In difficult cases,
and those with discrepancy between the evaluators, the
final decision was made by the leader of the group (YS).
Fluorescent co-staining of HAS2 and hyaluronan
Co-staining was done to compare the localization of HAS
with that of HA in stromal cells. The HAS2 isoform was
selected because it is known to be especially abundant in
stromal cells.
Deparaffinised sections were treated with 50 mM gly-
cine for 20 min at room temperature to quench any auto-
fluorescence. The sections were blocked with 1 % bovine
serum albumin for 30 min, followed by an overnight
incubation with the primary antibody against HAS2 (2 lg/
ml, sc-34067, Santa Cruz) together with 3 lg/ml of the
biotinylated hyaluronan binding complex (bHABC), pre-
pared in our laboratory [19]. After washing, the sections
were incubated for 1 h with the secondary antibody,
(1:500, Texas Red antigoat IgG, Vector) and streptavidin
(1:500, FITC Streptavidin, Vector). Nuclei were labeled
with DAPI (1 lg/ml, Sigma-Aldrich). The sections were
mounted in Vectashield (Vector H-1000, Vector).
Statistical analyses
The statistical analyses were conducted using SPSS version
17.0. The data concerning follow-up time, relapses, deaths,
and overall survival were obtained from hospital registers
which are linked with the National Population Registry.
The associations between staining intensities and clinical
parameters were calculated with the Chi square test. The
overall survival time was calculated from the date of
diagnosis to the date of death. The univariate analyses for
overall survival were conducted using the Kaplan–Meier
method, and the significance of the differences between
groups was assessed by the log-rank test. The multivariate
analyses for survival were done using Cox’s model,
including HAS isoforms, tumor size, lymph node status,
grade of the tumor, estrogen and progesterone receptor
status, HER2 status, and trastuzumab therapy among the
HER2-positive cases. This study was done according to the
recommendation criteria in tumor marker prognostic stud-
ies (REMARK) [20].
Results
HAS1, HAS2, and HAS3 were all expressed very fre-
quently in breast carcinoma cells, and they were mostly
seen in the cytoplasm, and occasionally on the cell surface
and nucleus (Fig. 1a–i). The distribution corresponded to
the large intracellular pool of HASs in the endoplasmic
reticulum-Golgi compartment and nuclear membrane [18].
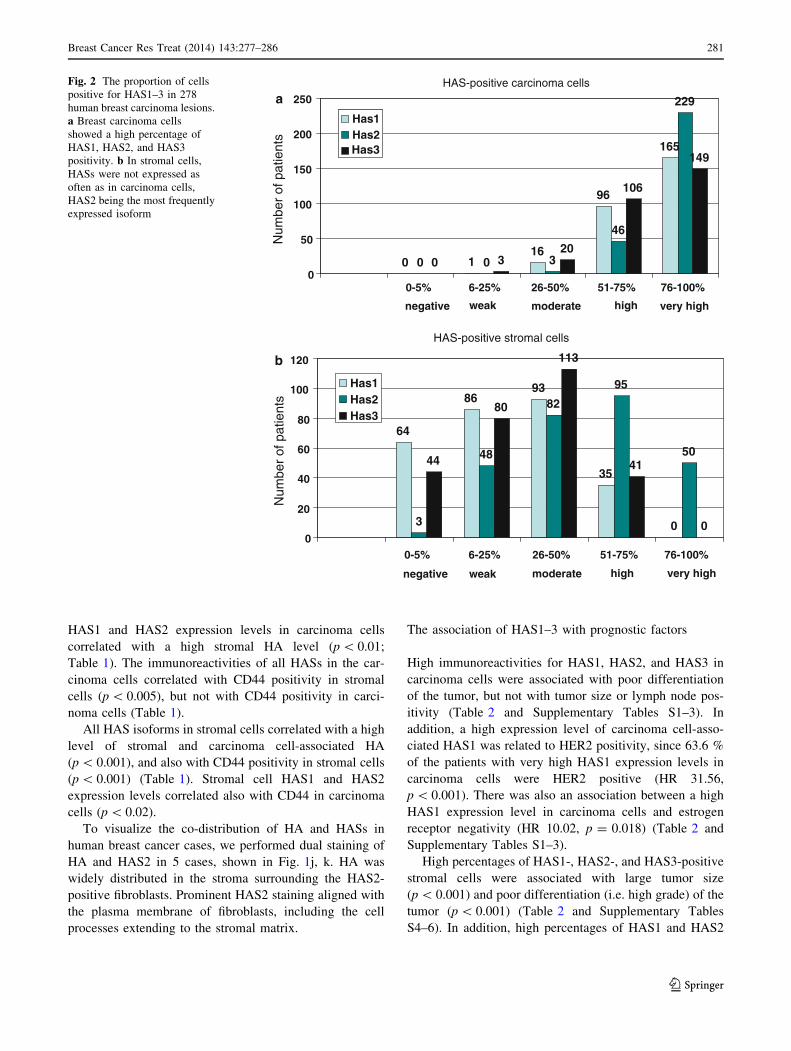
More than half of the breast carcinoma cells were HAS1,
HAS2, and HAS3 positive in 94, 99, and 92 % of the cases,
respectively, and in none of the cases were all breast
Breast Cancer Res Treat (2014) 143:277–286 279
123

carcinoma cells completely negative for HAS1, HAS2 or
HAS3 immunoreactivity (Fig. 2a).
HAS1, HAS2, and HAS3 were also detected in all types
of stromal cells (i.e. fibroblasts, myofibroblasts, and
endothelial cells) (Fig. 1a–i). The proportion of HAS-
positivity was generally lower in stromal cells than in
carcinoma cells. 64 (23 %) and 44 (16 %) of the samples
were totally negative for stromal cell-associated HAS1 and
HAS3, respectively, while a mere 3 (1 %) were negative
for HAS2 (Fig. 2b). More than half of the stromal cells
were positive for HAS1, HAS2, and HAS3 in 13, 52, and
15 % of cases, respectively (Fig. 2b).
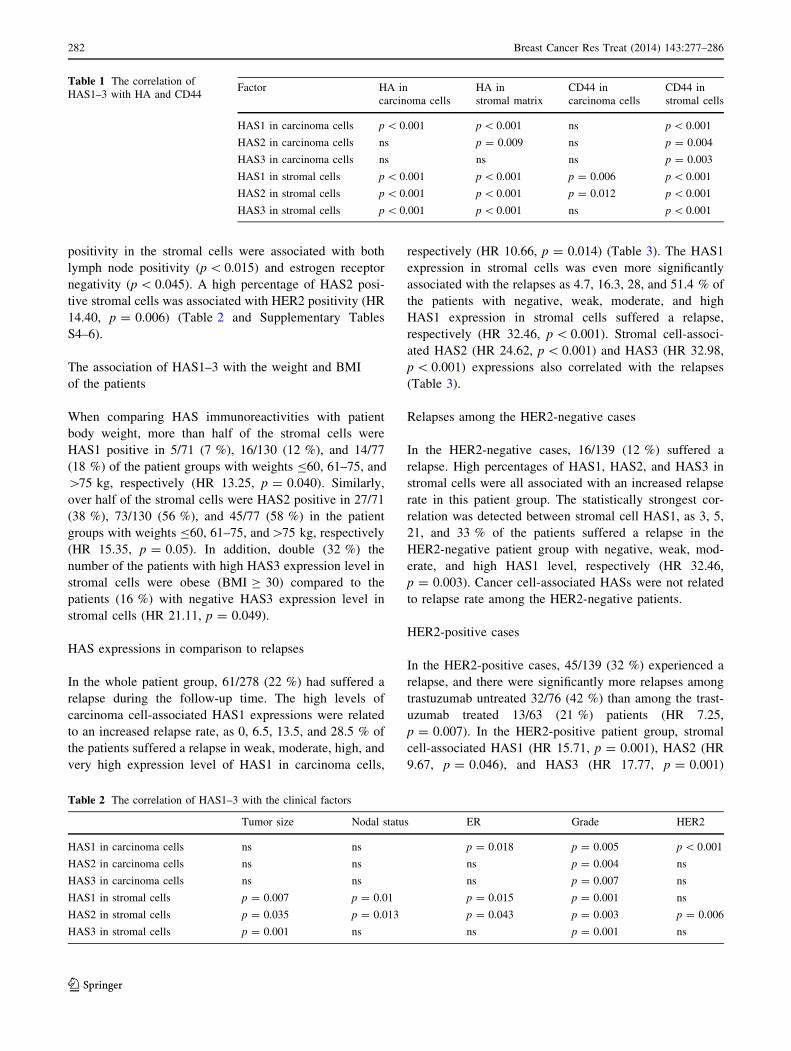
The association of HAS1–3 with HA and CD44
In a Chi square tests, a high percentage of HAS1 positive
carcinoma cells correlated with a high percentage of HA
positive carcinoma cells (HR 35.06, p \ 0.001). Both
Fig. 1 Hyaluronan synthase isoenzymes in breast carcinoma sec-
tions. HAS1 staining is shown in (a–c), HAS2 in (d–f), and HAS3 in
(g–i). An overview of low (a) and high (b) levels of HAS1 staining in
tumor and stromal cells, and at higher magnification in (c). d shows
an overview of strong HAS2 staining, and e, f higher magnification of
HAS2 staining in stromal and tumor cells, respectively. Mostly
negative and strong areas of HAS3 staining are shown in g and h,
respectively, and a higher magnification in (i). Tumor cells are
marked by asterisks, stromal cells by arrows. The co-localization of
HAS2 (red) and HA (green) in dual staining are shown in j, k. HAS2
is shown in j, and together with HA in k. Nuclei are marked with blue
color. Arrows in j indicate HAS-positive cell protrusion. Magnifica-
tion bar for low magnification (50 lm) (a, b, d, g, h) is presented in
h, and high magnification (20 lm) (c, e, f, i) in i. Magnification bar
(20 lm) for fluorescent images is shown in j
280 Breast Cancer Res Treat (2014) 143:277–286
123
HAS1 and HAS2 expression levels in carcinoma cells
correlated with a high stromal HA level (p \ 0.01;
Table 1). The immunoreactivities of all HASs in the car-
cinoma cells correlated with CD44 positivity in stromal
cells (p \ 0.005), but not with CD44 positivity in carci-
noma cells (Table 1).
All HAS isoforms in stromal cells correlated with a high
level of stromal and carcinoma cell-associated HA
(p \ 0.001), and also with CD44 positivity in stromal cells
(p \ 0.001) (Table 1). Stromal cell HAS1 and HAS2
expression levels correlated also with CD44 in carcinoma
cells (p \ 0.02).
To visualize the co-distribution of HA and HASs in
human breast cancer cases, we performed dual staining of
HA and HAS2 in 5 cases, shown in Fig. 1j, k. HA was
widely distributed in the stroma surrounding the HAS2-
positive fibroblasts. Prominent HAS2 staining aligned with
the plasma membrane of fibroblasts, including the cell
processes extending to the stromal matrix.
The association of HAS1–3 with prognostic factors
High immunoreactivities for HAS1, HAS2, and HAS3 in
carcinoma cells were associated with poor differentiation
of the tumor, but not with tumor size or lymph node pos-
itivity (Table 2 and Supplementary Tables S1–3). In
addition, a high expression level of carcinoma cell-asso-
ciated HAS1 was related to HER2 positivity, since 63.6 %
of the patients with very high HAS1 expression levels in
carcinoma cells were HER2 positive (HR 31.56,
p \ 0.001). There was also an association between a high
HAS1 expression level in carcinoma cells and estrogen
receptor negativity (HR 10.02, p = 0.018) (Table 2 and
Supplementary Tables S1–3).
High percentages of HAS1-, HAS2-, and HAS3-positive
stromal cells were associated with large tumor size
(p \ 0.001) and poor differentiation (i.e. high grade) of the
tumor (p \ 0.001) (Table 2 and Supplementary Tables
S4–6). In addition, high percentages of HAS1 and HAS2
0 116
96
165
0 0 3
46
229
0 320
106
149
0
50
100
150
200
250
0-5% 6-25% 26-50% 51-75% 76-100%
Has1Has2
Num
ber
of p
atie
nts
HAS-positive carcinoma cells
negative weak moderate high very high
64
8693
35
03
48
82
95
5044
80
113
41
00
20
40
60
80
100
120
0-5% 6-25% 26-50% 51-75% 76-100%
Has1Has2Has3
Has3
Num
ber
of p
atie
nts
HAS-positive stromal cells
negative weak moderate high very high
a
b
Fig. 2 The proportion of cells
positive for HAS1–3 in 278
human breast carcinoma lesions.
a Breast carcinoma cells
showed a high percentage of
HAS1, HAS2, and HAS3
positivity. b In stromal cells,
HASs were not expressed as
often as in carcinoma cells,
HAS2 being the most frequently
expressed isoform
Breast Cancer Res Treat (2014) 143:277–286 281
123
positivity in the stromal cells were associated with both
lymph node positivity (p \ 0.015) and estrogen receptor
negativity (p \ 0.045). A high percentage of HAS2 posi-
tive stromal cells was associated with HER2 positivity (HR
14.40, p = 0.006) (Table 2 and Supplementary Tables
S4–6).
The association of HAS1–3 with the weight and BMI
of the patients
When comparing HAS immunoreactivities with patient
body weight, more than half of the stromal cells were
HAS1 positive in 5/71 (7 %), 16/130 (12 %), and 14/77
(18 %) of the patient groups with weights B60, 61–75, and
[75 kg, respectively (HR 13.25, p = 0.040). Similarly,
over half of the stromal cells were HAS2 positive in 27/71
(38 %), 73/130 (56 %), and 45/77 (58 %) in the patient
groups with weights B60, 61–75, and[75 kg, respectively
(HR 15.35, p = 0.05). In addition, double (32 %) the
number of the patients with high HAS3 expression level in
stromal cells were obese (BMI C 30) compared to the
patients (16 %) with negative HAS3 expression level in
stromal cells (HR 21.11, p = 0.049).
HAS expressions in comparison to relapses
In the whole patient group, 61/278 (22 %) had suffered a
relapse during the follow-up time. The high levels of
carcinoma cell-associated HAS1 expressions were related
to an increased relapse rate, as 0, 6.5, 13.5, and 28.5 % of
the patients suffered a relapse in weak, moderate, high, and
very high expression level of HAS1 in carcinoma cells,
respectively (HR 10.66, p = 0.014) (Table 3). The HAS1
expression in stromal cells was even more significantly
associated with the relapses as 4.7, 16.3, 28, and 51.4 % of
the patients with negative, weak, moderate, and high
HAS1 expression in stromal cells suffered a relapse,
respectively (HR 32.46, p \ 0.001). Stromal cell-associ-
ated HAS2 (HR 24.62, p \ 0.001) and HAS3 (HR 32.98,
p \ 0.001) expressions also correlated with the relapses
(Table 3).
Relapses among the HER2-negative cases
In the HER2-negative cases, 16/139 (12 %) suffered a
relapse. High percentages of HAS1, HAS2, and HAS3 in
stromal cells were all associated with an increased relapse
rate in this patient group. The statistically strongest cor-
relation was detected between stromal cell HAS1, as 3, 5,
21, and 33 % of the patients suffered a relapse in the
HER2-negative patient group with negative, weak, mod-
erate, and high HAS1 level, respectively (HR 32.46,
p = 0.003). Cancer cell-associated HASs were not related
to relapse rate among the HER2-negative patients.
HER2-positive cases
In the HER2-positive cases, 45/139 (32 %) experienced a
relapse, and there were significantly more relapses among
trastuzumab untreated 32/76 (42 %) than among the trast-
uzumab treated 13/63 (21 %) patients (HR 7.25,
p = 0.007). In the HER2-positive patient group, stromal
cell-associated HAS1 (HR 15.71, p = 0.001), HAS2 (HR
9.67, p = 0.046), and HAS3 (HR 17.77, p = 0.001)
Table 1 The correlation of
HAS1–3 with HA and CD44Factor HA in
carcinoma cells
HA in
stromal matrix
CD44 in
carcinoma cells
CD44 in
stromal cells
HAS1 in carcinoma cells p \ 0.001 p \ 0.001 ns p \ 0.001
HAS2 in carcinoma cells ns p = 0.009 ns p = 0.004
HAS3 in carcinoma cells ns ns ns p = 0.003
HAS1 in stromal cells p \ 0.001 p \ 0.001 p = 0.006 p \ 0.001
HAS2 in stromal cells p \ 0.001 p \ 0.001 p = 0.012 p \ 0.001
HAS3 in stromal cells p \ 0.001 p \ 0.001 ns p \ 0.001
Table 2 The correlation of HAS1–3 with the clinical factors
Tumor size Nodal status ER Grade HER2
HAS1 in carcinoma cells ns ns p = 0.018 p = 0.005 p \ 0.001
HAS2 in carcinoma cells ns ns ns p = 0.004 ns
HAS3 in carcinoma cells ns ns ns p = 0.007 ns
HAS1 in stromal cells p = 0.007 p = 0.01 p = 0.015 p = 0.001 ns
HAS2 in stromal cells p = 0.035 p = 0.013 p = 0.043 p = 0.003 p = 0.006
HAS3 in stromal cells p = 0.001 ns ns p = 0.001 ns
282 Breast Cancer Res Treat (2014) 143:277–286
123
expressions associated with relapses, while carcinoma cell-
associated did not show any association.
In the trastuzumab untreated patients, the stromal cell
expression level of HAS3 was related to relapses as 9, 32,
46, and 77 % patients with negative, weak, moderate, and
high HAS3 expression levels in stromal cells suffered a
relapse (HR 12.39, p = 0.006). The stromal cell HAS1
expression level was also related to relapses in this patient
group (HR 10.84, p = 0.013).
Only 13 relapses have occurred among the 63 trast-
uzumab-treated HER2 positive patients, precluding reliable
statistical analysis because of the small number of cases.
However, all the 13 relapses were among the cases dis-
playing over 75 % of the carcinoma cells as HAS1
positive.
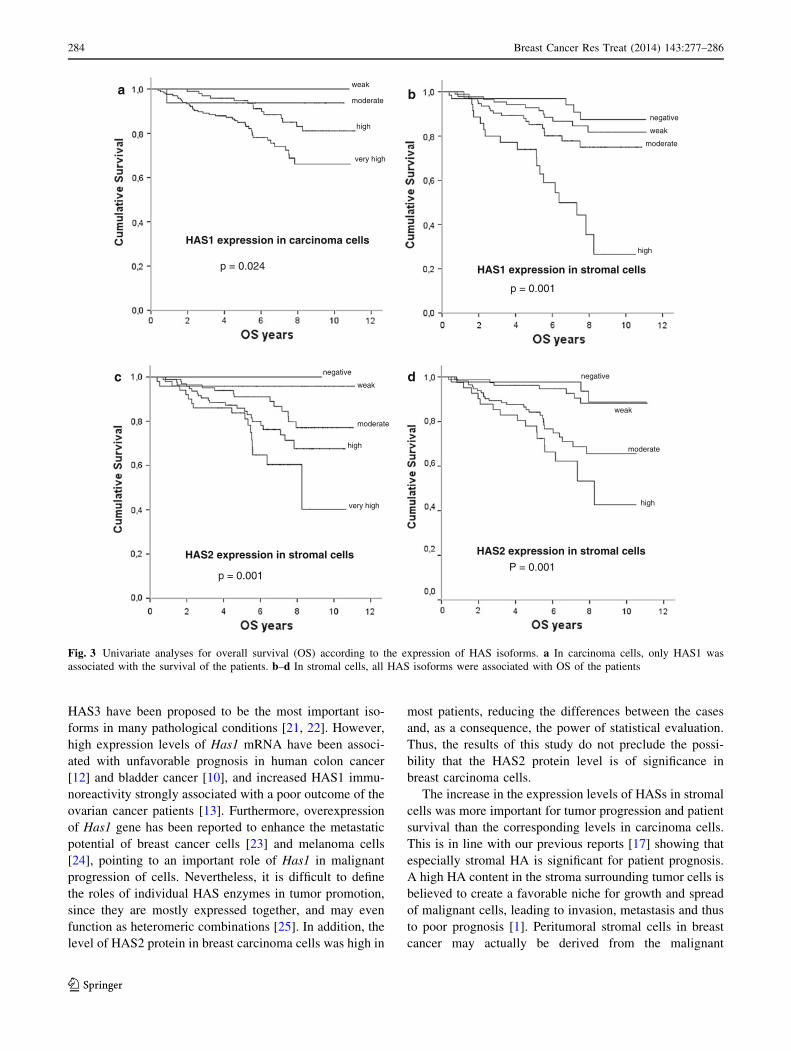
Survival analysis
If one considers the three isoenzymes, then HAS1 exhibited
the strongest correlation with the outcome of the patients.
While HAS2 and HAS3 positivity in breast carcinoma cells
did not correlate with survival, a high level of HAS1 in
carcinoma cells was associated with a short overall patient
survival, since 77, 85, 94, and 100 of the patients with very
high, high, moderate, and weak HAS1 expression in carci-
noma cells were alive (p = 0.024) (Fig. 3a). In stromal
cells, all HAS isoforms were related to short overall sur-
vival of the patients in the univariate survival analysis
(p \ 0.001) (Fig. 3b–d). In the HER2-positive patients, a
high level of HAS1 expression in stromal cells was asso-
ciated with a poor outcome of the patients as 44, 75, 76, and
88 % of the patients with high, moderate, weak, and neg-
ative HAS1 expression in stromal cells were alive, respec-
tively (p \ 0.0001). In addition, high HAS3 expression in
stromal cells was associated with short survival of the
HER2-positive patients (p = 0.012) (data not shown).
In the multivariate analysis of overall survival in the
whole study group, stromal cell HAS1 (reference stromal
cell HAS1: negative; stromal cell HAS1: 6–25 %, HR
1.485, p = 0.223; stromal cell HAS1: 26–50 %, HR 1.670,
p = 0.196; stromal cell HAS1: 50–75 %, HR 9.434,
p = 0.002), tumor size (p = 0.041), nodal status
(p \ 0.001), and estrogen receptor status (p = 0.009) were
all significant unfavorable prognostic factors. When the
multivariate analysis for overall survival was conducted for
HER2-positive patients, HAS1 in stromal cells (reference
stromal cell HAS1: negative; stromal cell HAS1: 6–25 %,
HR 0.828, p = 0.363; stromal cell HAS1: 26–50 %, HR
0.684, p = 0.408; stromal cell HAS1: 50–75 %, HR 5.881,
p = 0.015) together with estrogen receptor status
(p = 0.013) and adjuvant trastuzumab treatment
(p = 0.005) were the significant co-factors for unfavorable
prognosis. In the HER2-negative patients, HAS3 in stromal
cells (reference stromal cell HAS3: negative; stromal cell
HAS3: 6–25 %, HR 0.002, p = 0.969; stromal cell HAS3:
26–50 %, HR 4.182, p = 0.041; stromal cell HAS3:
50–75 %, HR 1.962, p = 0.161), together with lymph node
status (p = 0.032) were significant co-factors.
Discussion
The present study evaluated 278 breast cancer cases, and
revealed for the first time that high levels of HAS1, HAS2,
and HAS3 in stromal cells, and HAS1 in carcinoma cells,
have clinical significance, since the expression levels of all
of these enzymes were associated with disease recurrence
and poor outcome of the patients. In addition, we detected
strong correlations between HA and HAS1–3 immunore-
activities, suggesting that the accumulation of HA in breast
cancer tissue is at least partly due to the increased
expression levels of HAS1–3 proteins.
All HAS isoforms were widely expressed by both car-
cinoma and stromal cells. Scoring their immunoreactivity
revealed that HAS1 was the only enzyme with prognostic
significance in carcinoma cells, and in stromal cells, it was
the strongest in predicting relapses and poor prognosis.
This is partly an unexpected result, because HAS2 and
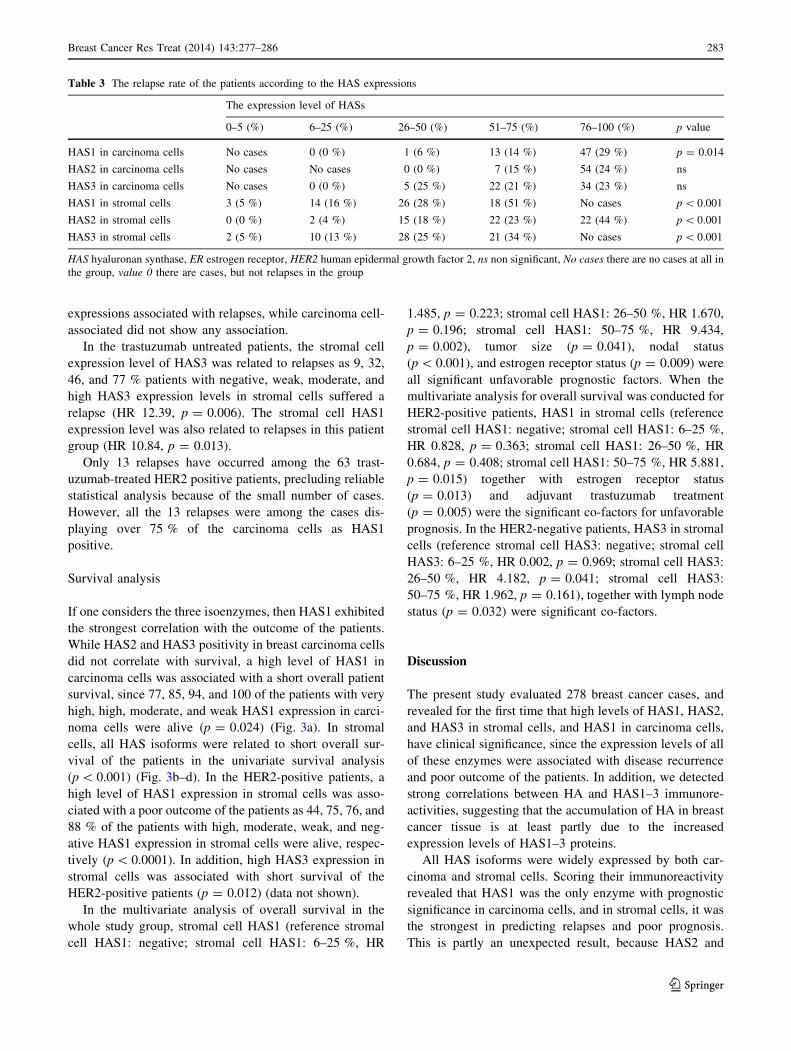
Table 3 The relapse rate of the patients according to the HAS expressions
The expression level of HASs
0–5 (%) 6–25 (%) 26–50 (%) 51–75 (%) 76–100 (%) p value
HAS1 in carcinoma cells No cases 0 (0 %) 1 (6 %) 13 (14 %) 47 (29 %) p = 0.014
HAS2 in carcinoma cells No cases No cases 0 (0 %) 7 (15 %) 54 (24 %) ns
HAS3 in carcinoma cells No cases 0 (0 %) 5 (25 %) 22 (21 %) 34 (23 %) ns
HAS1 in stromal cells 3 (5 %) 14 (16 %) 26 (28 %) 18 (51 %) No cases p \ 0.001
HAS2 in stromal cells 0 (0 %) 2 (4 %) 15 (18 %) 22 (23 %) 22 (44 %) p \ 0.001
HAS3 in stromal cells 2 (5 %) 10 (13 %) 28 (25 %) 21 (34 %) No cases p \ 0.001
HAS hyaluronan synthase, ER estrogen receptor, HER2 human epidermal growth factor 2, ns non significant, No cases there are no cases at all in
the group, value 0 there are cases, but not relapses in the group
Breast Cancer Res Treat (2014) 143:277–286 283
123
HAS3 have been proposed to be the most important iso-
forms in many pathological conditions [21, 22]. However,
high expression levels of Has1 mRNA have been associ-
ated with unfavorable prognosis in human colon cancer
[12] and bladder cancer [10], and increased HAS1 immu-
noreactivity strongly associated with a poor outcome of the
ovarian cancer patients [13]. Furthermore, overexpression
of Has1 gene has been reported to enhance the metastatic
potential of breast cancer cells [23] and melanoma cells
[24], pointing to an important role of Has1 in malignant
progression of cells. Nevertheless, it is difficult to define
the roles of individual HAS enzymes in tumor promotion,
since they are mostly expressed together, and may even
function as heteromeric combinations [25]. In addition, the
level of HAS2 protein in breast carcinoma cells was high in
most patients, reducing the differences between the cases
and, as a consequence, the power of statistical evaluation.
Thus, the results of this study do not preclude the possi-
bility that the HAS2 protein level is of significance in
breast carcinoma cells.
The increase in the expression levels of HASs in stromal
cells was more important for tumor progression and patient
survival than the corresponding levels in carcinoma cells.
This is in line with our previous reports [17] showing that
especially stromal HA is significant for patient prognosis.
A high HA content in the stroma surrounding tumor cells is
believed to create a favorable niche for growth and spread
of malignant cells, leading to invasion, metastasis and thus
to poor prognosis [1]. Peritumoral stromal cells in breast
cancer may actually be derived from the malignant
HAS1 expression in carcinoma cells
weak
moderate
high
very high
p = 0.024 HAS1 expression in stromal cells
negative
weak
moderate
high
p = 0.001
HAS2 expression in stromal cells HAS2 expression in stromal cells
negative
weak
moderate
high
very high
negative
weak
moderate
high
p = 0.001 P = 0.001
a
c d
b
Fig. 3 Univariate analyses for overall survival (OS) according to the expression of HAS isoforms. a In carcinoma cells, only HAS1 was
associated with the survival of the patients. b–d In stromal cells, all HAS isoforms were associated with OS of the patients
284 Breast Cancer Res Treat (2014) 143:277–286
123

epithelial cells that have undergone epithelial-mesenchy-
mal transition (EMT) [26]. In line with this hypothesis,
Has2 overexpression in mammary epithelial cells results in
the cells acquiring mesenchymal characteristics [27] and
Has2 has a critical role in the TGFb-induced EMT of
mammary cells [28]. On the other hand, HA secreted by
Has2 overexpressing mammary tumor cells accelerates
angiogenesis through the activation of stromal cells [29].
The present data suggests that HAS1–3 levels in stromal
cells might be associated with a high body weight and
obesity in the patients. In our previous study, a high stromal
HA content was also associated positively with a high body
mass index (BMI) [17]. Our study material is still too small
to permit exhaustive statistical analyses, but these results
are especially interesting, because in our other studies we
have found that not only HAS2, but particularly HAS1, is
more active in cells with a rich glucose and UDP-N-acetyl
glucosamine (UDP-GlcNAc) supply [30]. Moreover, there
is one report that HAS2 protein is stabilized in the presence
of a high cellular UDP-GlcNAc content [31]. It is thus
possible that the deranged glucose metabolism in cancer
may be linked to the enhanced HA synthesis and HA con-
tent in malignant tumors, and the known fact that obesity is
a breast cancer risk factor [32]. In support of this idea, a
high peridiagnostic fasting blood glucose level and high
BMI have both been associated with a high risk of breast
cancer relapse rate and poor outcome in the patients [33].
Accumulation of hyaluronan metabolism is rather com-
plex, with numerous signals and molecules associated with
its synthesis and degradation, these being regulated at
multiple levels. In addition to glucose metabolism, growth
factor signaling is one of the best characterized stimulators
of HA synthesis [5]. In our previous study, the content of
HA was higher in HER2-positive patients, and the prog-
nostic role of HA was most significant among the HER2-
positive patients [17]. Accordingly, in the current study,
HAS expression was strongly associated with HER2 posi-
tivity, and among HER2-positive patients the HAS
expressions associated with the outcome of the patients also
in the multivariate survival analysis. The present data thus
further imply a connection between HER2 signaling and
HA synthesis, and suggest that the high expression level of
HA on the cell surface and pericellular stroma may affect
binding of trastuzumab to its receptor [34], and thus con-
tribute to the bleak prognosis of HER2-positive patients.
The expression of the HA receptor CD44 was strongly
associated with the levels of all HASs in stromal cells.
Increased HA synthesis and CD44 expression are important
factors in inflammatory reactions [35, 36], and the impor-
tance of the inflammatory component in the initiation and
progression of cancer has become evident [37]. The finding
of Baek et al. [38] that high serum concentration of CD44
is a predictor for a short overall survival, especially among
the HER2-positive breast cancer patients, fits very well
with our observations that the high expression level of
CD44 in stromal cells associated with HAS expressions,
HA content, and unfavorable prognosis. The CD44-HA
axis likely recruit tumor inflammatory cells and modifies
their functions to support malignant growth.
In summary, this work demonstrates that the high levels
of HAS proteins, both in stromal and carcinoma cells, are
associated with poor differentiation, HER2-positivity, and
poor patient outcome. These findings are in line with many
in vitro studies showing a correlation between high HAS
expression, altered HA biosynthesis, and malignant prop-
erties of carcinoma cells [22]. Accordingly, in experi-
mental animal studies, inhibition of HA synthesis
suppresses growth and motility of breast carcinoma cells,
and inhibits their expansion in osteolytic bone metastases
[39]. The results of this study suggest that HASs are also
clinically significant factors in the progression of breast
cancer and thus potential targets for therapy.
Acknowledgments This study has been supported by Special
Government Funding (EVO) of Kuopio University Hospital (PA,
VMK, MT), Cancer Center of University of Eastern Finland (PA,
VMK, MT, RT), Sigrid Juselius Foundation (RT, MT), Northern Savo
Cancer Foundation (KR).We thank Helena Kemilainen, Eija Rahun-
en, and Kari Kotikumpu for their assistance in the laboratory.
Conflict of interest The authors declare that they have no conflict
of interest, neither financial nor personal.
Ethical standards The permission for this study was provided by
the ethics committee of University of Eastern Finland and by the
national authority—VALVIRA.
References
1. Tammi R, Kultti A, Kosma VM, Pirinen R, Auvinen P, Tammi M
(2008) Hyaluronan in human tumors: pathobiological and prog-
nostic messages from cell-associated and stromal hyaluronan.
Semin Cancer Biol 18:288–295
2. Auvinen P, Tammi R, Parkkinen J, Tammi M, Agren U, Jo-
hansson R, Hirvikoski P, Eskelinen M, Kosma VM (2000)
Hyaluronan in peritumoral stroma and malignant cells associates
with breast cancer spreading and predicts survival. Am J Pathol
156:529–536
3. Weigel P, DeAngelis P (2007) Hyaluronan synthases: a decade-
plus of novel glycosyltransferases. J Biol Chem
282:36777–36781
4. Camenisch T, Spicer A, Brehm-Gibson T, Biesterfeldt J,
Augustine M, Calabro A Jr, Kubalak S, Klewer S, McDonald J
(2000) Disruption of hyaluronan synthase-2 abrogates normal
cardiac morphogenesis and hyaluronan-mediated transformation
of epithelium to mesenchyme. J Clin Invest 106:349–360
5. Tammi R, Passi A, Rilla K, Karousou E, Vigetti D, Makkonen K,
Tammi M (2011) Transcriptional and post-translational regula-
tion of hyaluronan synthesis. FEBS J 278:1419–1428
6. Tammi R, MacCallum D, Hascall V, Pienimaki J, Hyttinen M,
Tammi M (1998) Hyaluronan bound to CD44 on keratinocytes is
displaced by hyaluronan decasaccharides and not hexasaccha-
rides. J Biol Chem 273:28878–28888
Breast Cancer Res Treat (2014) 143:277–286 285
123
7. Evanko S, Tammi M, Tammi R, Wight T (2007) Hyaluronan-
dependent pericellular matrix. Adv Drug Deliv Rev 59:1351–1365
8. Rilla K, Siiskonen H, Spicer A, Hyttinen J, Tammi M, Tammi R
(2005) Plasma membrane residence of hyaluronan synthase is
coupled to its enzymatic activity. J Biol Chem 280:31890–31897
9. Kultti A, Pasonen-Seppanen S, Jauhiainen M, Rilla KJ, Karna R,
Pyoria E, Tammi R, Tammi M (2009) 4-Methylumbelliferone
inhibits hyaluronan synthesis by depletion of cellular UDP-glu-
curonic acid and downregulation of hyaluronan synthase 2 and 3.
Exp Cell Res 315:1914–1923
10. Kramer M, Escudero D, Lokeshwar S, Golshani R, Ekwenna O,
Acosta K, Merseburger A, Soloway M, Lokeshwar V (2011)
Association of hyaluronic acid family members (HAS1, HAS2,
and HYAL-1) with bladder cancer diagnosis and prognosis.
Cancer 117:1197–1209
11. Chi A, Shirodkar S, Escudero D, Ekwenna O, Yates T, Ayyath-
urai R, Garcia-Roig M, Gahan J, Manoharan M, Bird V, Lo-
keshwar V (2012) Molecular characterization of kidney cancer:
association of hyaluronic acid family with histological subtypes
and metastasis. Cancer 118:2394–2402
12. Yamada Y, Itano N, Narimatsu H, Kudo T, Morozumi K, Hi-
rohashi S, Ochiai A, Ueda M, Kimata K (2004) Elevated tran-
script level of hyaluronan synthase1 gene correlates with poor
prognosis of human colon cancer. Clin Exp Metastasis 21:57–63
13. Yabushita H, Noguchi M, Kishida T, Fusano K, Noguchi Y, Itano
N, Kimata K, Noguchi M (2004) Hyaluronan synthase expression
in ovarian cancer. Oncol Rep 12:739–743
14. Nykopp T, Rilla K, Tammi MI, Tammi RH, Sironen R,
Hamalainen K, Kosma VM, Heinonen S, Anttila M (2010)
Hyaluronan synthases (HAS1–3) and hyaluronidases (HYAL1–2)
in the accumulation of hyaluronan in endometrioid endometrial
carcinoma. BMC Cancer 10:512
15. Udabage L, Brownlee G, Waltham M, Blick T, Walker E, Heldin
P, Nilsson S, Thompson E, Brown T (2005) Antisense-mediated
suppression of hyaluronan synthase 2 inhibits the tumorigenesis
and progression of breast cancer. Cancer Res 65:6139–6150
16. Okuda H, Kobayashi A, Xia B, Watabe M, Pai SK, Hirota S,
Xing F, Liu W, Pandey P, Fukuda K, Modur V, Ghosh A, Wilber
A, Watabe K (2012) Hyaluronan synthase HAS2 promotes tumor
progression in bone by stimulating the interaction of breast
cancer stem-like cells with macrophages and stromal cells.
Cancer Res 72:537–547
17. Auvinen P, Tammi R, Kosma VM, Sironen R, Soini Y, Man-
nermaa A, Tumelius R, Uljas E, Tammi M (2013) Increased
hyaluronan content and stromal cell CD44 associate with HER2
positivity and poor prognosis in human breast cancer. Int J
Cancer 132:531–539
18. Torronen K, Nikunen K, Karna R, Tammi M, Tammi R, Rilla K
(2013) Tissue distribution and subcellular localization of hyalu-
ronan synthase isoenzymes. Histochem Cell Biol. doi:10.1007/
s00418-013-1143-4
19. Tammi R, Agren U, Tuhkanen A, Tammi M (1994) Hyaluronan
metabolism in skin. Prog Histochem Cytochem 29:1–81
20. McShane L, Altman D, Sauerbrei W, Taube S, Gion M, Clark G,
Statistics Subcommittee of NCI-EORTC Working Group on
Cancer Diagnostics (2006) Reporting recommendations for tumor
MARKer prognostic studies (REMARK). Breast Cancer Res
Treat 100:229–235
21. Bharadwaj A, Kovar J, Loughman E, Elowsky C, Oakley G,
Simpson M (2009) Spontaneous metastasis of prostate cancer is
promoted by excess hyaluronan synthesis and processing. Am J
Pathol 174:1027–1036
22. Itano N, Kimata K (2008) Altered hyaluronan biosynthesis in
cancer progression. Semin Cancer Biol 18:268–274
23. Itano N, Sawai T, Atsumi F, Miyaishi O, Taniguchi S, Kannagi R,
Hamaguchi M, Kimata K (2004) Selective expression and
functional characteristics of three mammalian hyaluronan syn-
thases in oncogenic malignant transformation. J Biol Chem
279:18679–18687
24. Ichikawa T, Itano N, Sawai T, Kimata K, Koganehira Y, Saida T,
Taniguchi S (1999) Increased synthesis of hyaluronate enhances
motility of human melanoma cells. J Invest Dermatol 113:935–939
25. Karousou E, Kamiryo M, Skandalis SS, Ruusala A, Asteriou T,
Passi A, Yamashita H, Hellman U, Heldin CH, Heldin P (2010)
The activity of hyaluronan synthase 2 is regulated by dimeriza-
tion and ubiquitination. J Biol Chem 285:23647–23654
26. Petersen O, Nielsen H, Gudjonsson T, Villadsen R, Rank F,
Niebuhr E, Bissell M, Ronnov-Jessen L (2003) Epithelial to
mesenchymal transition in human breast cancer can provide a
nonmalignant stroma. Am J Pathol 162:391–402
27. Zoltan-Jones A, Huang L, Ghatak S, Toole B (2003) Elevated
hyaluronan production induces mesenchymal and transformedproperties in epithelial cells. J Biol Chem 278:45801–45810
28. Porsch H, Bernert B, Mehic M, Theocharis A, Heldin C, Heldin P
(2012) Efficient TGFbeta-induced epithelial-mesenchymal tran-
sition depends on hyaluronan synthase HAS2. Oncogene
32(37):4355–4365
29. Koyama H, Hibi T, Isogai Z, Yoneda M, Fujimori M, Amano J,
Kawakubo M, Kannagi R, Kimata K, Taniguchi S, Itano N (2007)
Hyperproduction of hyaluronan in neu-induced mammary tumor
accelerates angiogenesis through stromal cell recruitment: possible
involvement of versican/PG-M. Am J Pathol 170:1086–1099
30. Rilla K, Oikari S, Jokela TA, Hyttinen J, Karna R, Tammi R,
Tammi M (2013) Hyaluronan synthase 1 (HAS1) requires higher
cellular UDP-GlcNAc concentration than HAS2 and HAS3.
J Biol Chem 288:5973–5983
31. Vigetti D, Deleonibus S, Moretto P, Karousou E, Viola M,
Bartolini B, Hascall V, Tammi M, De Luca G, Passi A (2012)
Role of UDP-N-acetylglucosamine (GlcNAc) and O-GlcNAcy-
lation of hyaluronan synthase 2 in the control of chondroitin
sulfate and hyaluronan synthesis. J Biol Chem 287:35544–35555
32. van den Brandt P, Spiegelman D, Yaun S, Adami H, Beeson L,
Folsom A, Fraser G, Goldbohm R, Graham S, Kushi L, Marshall J,
Miller A, Rohan T, Smith-Warner S, Speizer F, Willett W, Wolk
A, Hunter D (2000) Pooled analysis of prospective cohort studies
on height, weight, and breast cancer risk. Am J Epidemiol
152:514–527
33. Contiero P, Berrino F, Tagliabue G, Mastroianni A, Di Mauro M,
Fabiano S, Annulli M, Muti P (2013) Fasting blood glucose and
long-term prognosis of non-metastatic breast cancer: a cohort
study. Breast Cancer Res Treat 138:951–959
34. Varadi T, Mersich T, Auvinen P, Tammi R, Tammi M, Salamon F,
Besznyak I Jr, Jakab F, Baranyai Z, Szollosi J, Nagy P (2012)
Binding of trastuzumab to ErbB2 is inhibited by a high pericel-
lular density of hyaluronan. J Histochem Cytochem 60:567–575
35. Hascall V, Majors A, De La Motte C, Evanko S, Wang A, Drazba
JA, Strong S, Wight T (2004) Intracellular hyaluronan: a new
frontier for inflammation? Biochim Biophys Acta 1673:3–12
36. Toole B (2004) Hyaluronan: from extracellular glue to pericel-
lular cue. Nat Rev Cancer 4:528–539
37. Mantovani A, Allavena P, Sica A, Balkwill F (2008) Cancer-
related inflammation. Nature 454:436–444
38. Baek J, Jin Q, Ensor J, Boulbes D, Esteva F (2011) Serum CD44
levels and overall survival in patients with HER2-positive breast
cancer. Breast Cancer Res Treat 130:1029–1036
39. Urakawa H, Nishida Y, Wasa J, Arai E, Zhuo L, Kimata K,
Kozawa E, Futamura N, Ishiguro N (2012) Inhibition of hyalu-
ronan synthesis in breast cancer cells by 4-methylumbelliferone
suppresses tumorigenicity in vitro and metastatic lesions of bone
in vivo. Int J Cancer 130:454–466
286 Breast Cancer Res Treat (2014) 143:277–286
123