human populations - lcps
TRANSCRIPT

Human Populations
http://www.globalchange.umich.edu/globalchange2/current/lectures/human_pop/human_pop.html

Studying Human Populations
• Demography – the study of populations (usually humans)
–Can include:
• Historical size and makeup (age structures/population pyramids)
– So how many teenagers vs adults vs elderly, etc.
• Economics– So how many poor vs middle class vs rich, etc.
• Social structure– So how many teachers vs military vs bankers vs students, etc.

Two general categories for countries which describe their growth rates:
• Developed Countries
– Higher average incomes
– Slower population growth
– Diverse industrial economies
– Stronger social support systems
Ex.) US, Canada, Australia, United Kingdom, France, etc.
• Developing Countries
– Lower average incomes
– Simple/agricultural based economies
– Rapid population growth
– Tend to need more foreign aid
Ex.) Honduras, India, Kenya, etc.
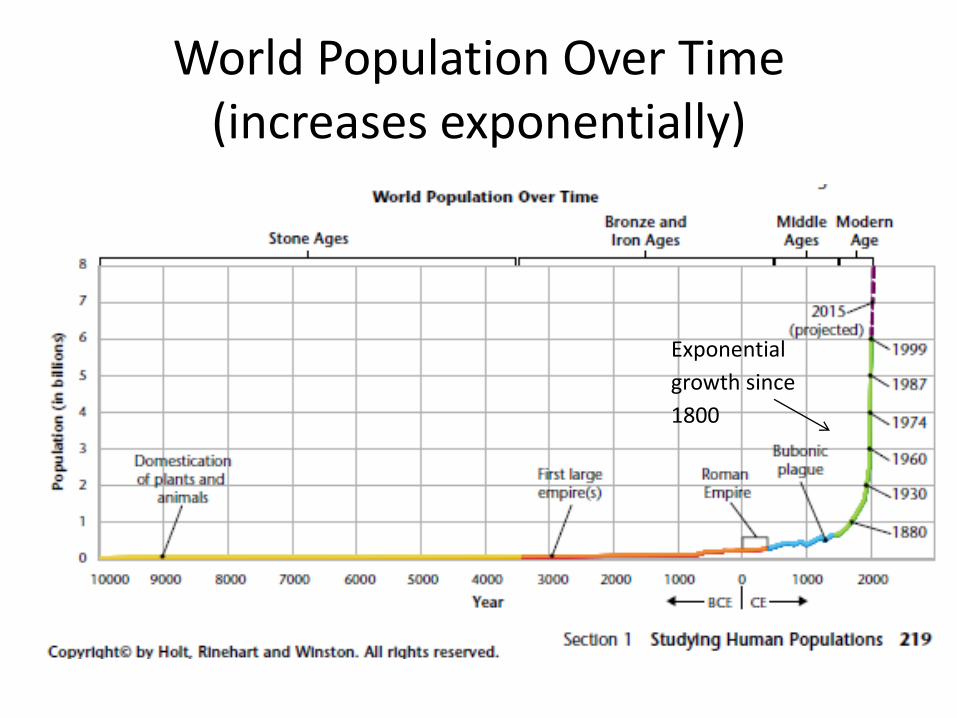
World Population Over Time (increases exponentially)
Exponential
growth since
1800

World Population Over Time (increases exponentially)
• The factors affecting global human population are very simple, they are:
– fertility
– mortality
– initial population
– time

Human population growth has accelerated (exponentially) in the last few centuries.
• The main reasons for this growth were improvements in hygiene and increases in food production, which accompanied the industrial and scientific revolutions.

Demographers – try to predict population trends using data such as:– Age Structure – graphically represents the data in
a double-sided bar graph

Age Structures/Pyramids
• pyramids for the years 1975 (pink) and 2000 (blue).
• The population/age structure of the developed world represents that of a stable (or nearly stable) population. (pyramid is more rectangular)
• The bottom figure (typical for countries like Mexico, Malaysia, India, etc.) is more triangular and shows how a rapidly growing population is dominated by young people.
• The female side of the diagram is particularly important in understanding future growth. This is because fertility is largely controlled by the number of females in their reproductive years (roughly ages 15 - 40).


Demographers – try to predict population trends using data such as:
• Morality Rates - death rate per individual– The combination of decreasing death rate due to the march of progress
in sanitation and medicine, coupled with the decrease in birth rate due to changes in the economies, has led to a profound change in the population growth curve in the developed world.

Demographers – try to predict population
trends using data such as:
Survivorship - the percentage of members of a group that are
likely to survive to any given age.
Members surviving to be very old = Type I(wealthy developed countries like Japan and Germany)
Similar death rates at all ages = Type II
Many children die = Type III curve (very poor areas)
Young Elderly

Demographers – try to predict population trends using data such as:
– Fertility rates - # of babies born each year/1,000 women in a population
• Ex.) baby boom was a period of high fertility, followed by the baby bust
US Fertility Rates 1900 - 2000
Replacement Level -avg # children need to have to replace the parents = 2

Fertility Rates
• Fertility is largely controlled by economics and by human aspirations.
• The high fertility of the developing world can be partially explained by the large number of hands needed to perform low-technology agricultural tasks. – In these areas, families with large numbers of children
realize an enhanced economic status. – As technology improves, parents realize that having more
children decreases rather than increases their standard of living. • A dramatic example of this effect occurred in Thailand, where, as
soon as parents realized that future economic status was linked to the secondary schooling (which is expensive in Thailand), the fertility rate dropped from about 6 to 2 in a decade!

Total Fertility Rate Per Country
Figure 2: Global Total Fertility Rates, 1990-1995
Fertility is largely controlled by economics and by human aspirations. The high fertility

Demographers – try to predict population trends using data such as:
– Migration - immigration (people are coming in) -vs- emigration (people are exiting/leaving)

Demographers – try to predict population trends using data such as:
• Life expectancy - average number of years a person is likely to live

In the demographic transition model, countries progress through 4 stages of chance in birth
rates, death rates, and population size.
• Stage 1 – Preindustrial = low growth rate, stability of death and births – most of the world in this condition until ~1700, then scientific and
industrial revolution began.
• Stage 2 – Transitional = population explosion as death rate declines (as hygiene, nutrition, and education improve) and birth rates continue high, so population grows very fast.
• Stage 3 – Industrial = stability at a much higher population level– population grows slow because birth rate decreases, so population
stabilizes but much higher than before. (most countries quadrupled their population during transition in 20th century)
• Stage 4 – Post Industrial = birth rate drops below replacement level (negative growth rate), so population decreases

4 Stages of Country Demographic Transitions
Stage I Preindustrial
Stage II Transitional
Stage III Industrial
Stage I V Postindustrial


Changing Population Trends –The Effects
• When a growing population uses resources faster than they can be renewed, the resources most critically affected are fuel wood, water, and arable land (land used to grow
crops).– Infrastructure – basic facilities and services that support a
community, such as public water supplies, sewer lines, power plants, roads, subways, schools, hospitals, etc.
– Urbanization – more people are living in cities than in rural areas.

Changing Population Trends –The Effects
• Symptoms of overwhelming population growth:
– Suburban sprawl
– Overcrowded schools
– Polluted rivers
– Barren land
– Inadequate housing
– insufficient resources (burnable fuel, food, H2O)

• Women collecting wood for their stoves (walking many miles)
• Unsafe water (use the same water for bathing, washing clothes, and drinking)
• Not enough housing (so may get slums, or tent communities), may use arable land to house people

• In this century, countries may be labeled moredeveloped or less developed. Not all countries are going through the demographic transition in the same way that the more developed countries did.
– Ex.) some countries have rapid population growth but are unable to make enough educational and economic gains to reduce the birth rate and move into the 3rd Stage.
– International communities focus on the least developed countries – give them priority to foreign aid and development programs to address population and environmental problems.

Different Regions of the World are Growing at Different Rates

• Some countries attempt to reduce birth rates directly through public advertising, family planning programs, economic incentives, or legal punishment of their citizens.– Ex.) Thailand
• Improved healthcare
• Openness to changing social traditions
• Cooperation of private and nonprofit organizations with government
• Economic incentives
– Ex.) China - (One Child Policy) – have to pay lots of money in taxes for more children.
Ways to Reduce Birth Rates:

Population Projections to 2050
• United Nations project that the world population will reach about 9 billion in 2050.
Assuming the medium-growth rate line below, worldwide fertility rates will decline to replacement level by 2050.

Human population growth has accelerated (exponentially) in the last few centuries.
2010