hrd-90-134 rural hospitals: factors that affect ... - archive
TRANSCRIPT
RURAL HOSPITALS
Factors That Affect Risk of Closure
~_L_-.-l--_ -.----____-.l_ .___ -----
:(;A(),/ IIKI)-!wl:M
GAO United States General Accounting Office Washington, D.C. 20548
Human Resources Division
B-239983
June 19,199O
Dear Congressional Requesters:’
Because of your concern about increasing numbers of rural hospital closures and their impact on elderly and poor rural residents, you asked us to look at a series of related issues. This report addresses one of the issues-the factors making rural hospitals vulnerable to closure.” Appendices II and III contain our methodology and supporting tables. Another report, to be issued later this year, will address your remaining questions and provide a broader discussion of factors influencing closures.
Background Rural hospitals have faced an enormous challenge in the last decade, responding to the changing role of hospitals in the current medical envi- ronment. Many medical procedures and illnesses that once required hos- pitalization now are treated in outpatient settings, thus reducing the demand for inpatient services among both rural and urban populations. Moreover, new technologies that greatly enhance the diagnostic and treatment capability of the health care system are costly and require high volume use to justify their purchase. Since urban hospitals are on average larger and have a higher volume of patients, they have an advantage in obtaining this new technology.
Studies show that rural hospitals provide a core of basic services to local rural communities. Also, they are more likely to provide long-term care nursing services than urban hospitals of similar size,:’ Although most rural hospitals provide care for less complex medical conditions, they still must compete for patients with the more technologically sophisticated urban hospitals. Changes in the delivery of health services and in the structure of hospitals’ insurance reimbursement appear to complicate rural hospitals’ ability to attract patients and generate revenues.
The most important change in the reimbursement of hospitals occurred in 1983 when the Congress established a prospective payment system (PPS) for inpatient services provided to Medicare beneficiaries, PPS sets
’ Congressional requesters are listed in app. I.
%ther issues included the impact of closures on (I) rural residents’ access to hospital care and (2) Medicare program costs.
“See L. G. Hart, R. A. Rosenblatt, and B. A. Amundson, “Is There a Role for the Rural Hospital‘?” Working Paper, Vol. 1, No. 1, WAMI Rural Health Research Center, IJniversity of Washington, 1989.
Page 1 GAO/HRD-90-134 Factors in Rural Hospital Closures

E239993 i
payment at a predetermined amount, based on the 1981 average cost of treatment for each patient with a similar diagnosis or requiring a similar treatment procedure. These payments are adjusted for certain hospital characteristics and updated annually. Hospitals with costs below this amount make a profit from the system; those with costs above the pre- determined payment lose. The intent of PPS was to control costs by giving hospitals financial incentives to deliver services more efficiently.
During the first 3 years of PPS (roughly fiscal years 1984-86), the majority of urban and rural hospitals profited from treating Medicare patients, but profits declined each year. Urban hospitals, however, aver- aged higher PPS profits than rural hospitals. By the 4th year of PPS, most rural hospitals lost money on their Medicare patients, while most urban hospitals still profited, although substantially less than in previous years. However, the difference between urban and rural PPS profits may be narrowing since the fourth year of PPS, as the Congress has increased the standardized amount (the amount on which PPS payments are based) at a higher rate for rural than for urban hospitals.
Declining utilization and changes in hospital payment systems have placed considerable financial pressures on both urban and rural hospi- tals. From 1986 to 1988,260 U.S. hospitals closed-about half in rural areas. Although many studies have described the characteristics of closed hospitals, there have been few efforts to identify the combination of factors that most increase a hospital’s risk of closure in the era of Medicare’s PPS.
Objectives, Scope, and Our objectives in this study were to (1) determine the financial charac-
Methodology teristics associated with rural hospital closures,4 (2) determine the role of Medicare payment in rural closures, and (3) identify the operating and environmental characteristics associated with financial distress and a high risk of closure. In our analysis, we compared the operating, envi- ronmental, and financial characteristics of hospitals that closed with those that remained open. We used a statistical technique, logistic regression, to identify factors that may contribute to rural hospitals’ risk of closure. Our analysis included all rural and urban nonfederal, short-stay general hospitals in operation in 1985.” Factors assessed for
4A closure was defined as the discontinuance of the provision of inpatient acute care medical services for any time period during 1980-88.
“To identify these hospitals, we used the American Hospital Association (AHA) Annual Survey data files and the Medicare Hospital Cost Report Information System (HCRIS) Minimum Data Set.
Page 2 GAO/HRD90-134 Factors In Rural Hospital Closures
\ B-239985
their effect on hospitals’ risk of closure are identified in table III. 1. We assessed the likelihood of closure during the 4-year time period 1985-88 (see app. II for further details on our methodology).
Results in Brief Closed rural hospitals suffered substantial and increasing financial losses during the 3 years before closure. Their losses were due primarily to their high cost per case relative to other, similar hospitals. Losses on Medicare patients were not a major factor causing most hospital clo- sures. Indeed, in the 3 years before closure, most hospitals made more or lost less money from treating Medicare patients than from treating other patients. However, for about a third of rural closures with fewer than 60 beds, the converse was true; they lost more from treating Medicare patients than from treating other patients. Consequently, Medicare may have contributed disproportionately to the losses and thus the financial distress of this group.
Contrary to the perception of many, a hospital’s location in a rural area did not raise the risk of closure over and above that of a comparable urban hospital. Rather, rural hospitals were more vulnerable to closure because several factors associated with a high risk of closure were more prevalent among these hospitals. One factor-low occupancy- increased this vulnerability substantially and tends to be associated with hospitals having high costs relative to other hospitals. Other major factors associated with a higher risk of closure were small size and own- ership by a for-profit entity. These findings suggest that strategies to prevent rural closures should target hospitals with high risk factors rather than all rural hospitals.
Characteristics of Urban and Rural Closures Differ
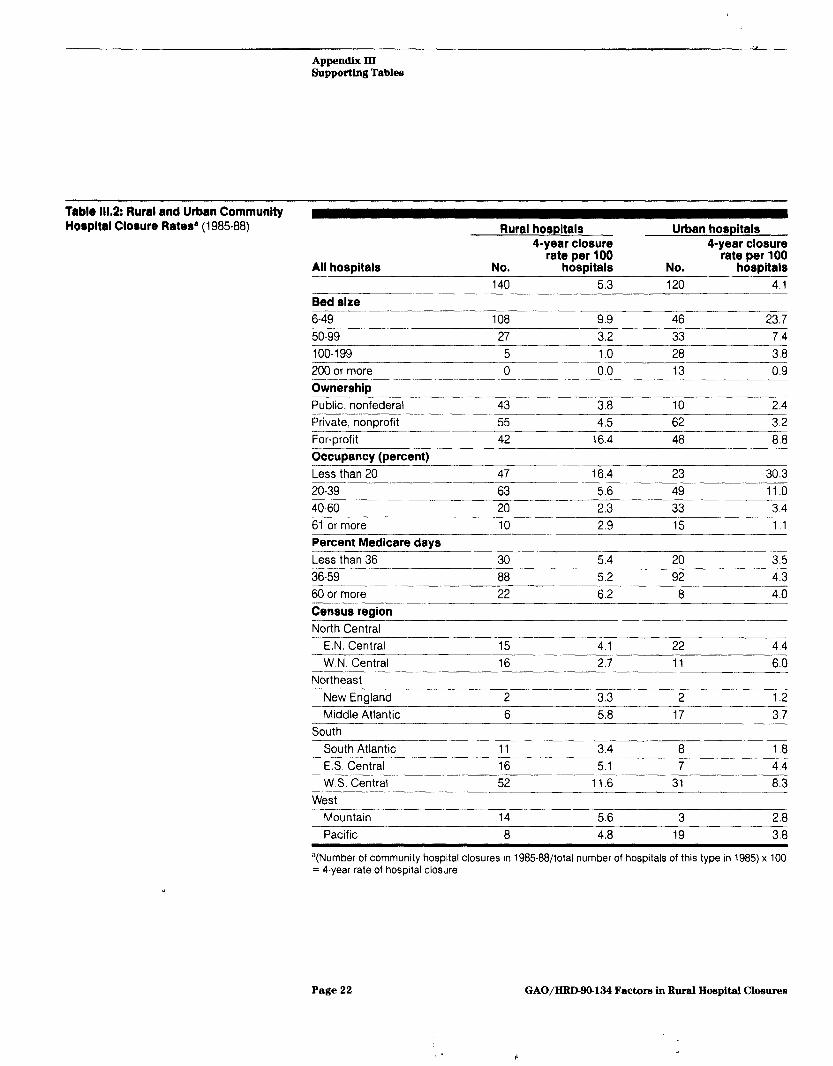
Between 1986 and 1988, the rate of hospital closures was 29 percent higher in rural than in urban areas (5.3 vs. 4.1 per 100).(i As shown in table 1, closed rural hospitals were predominantly small hospitals (fewer than 60 beds) and were about equally distributed among the ownership types.7 Also, over three-quarters of rural hospitals had occu- pancy rates of less than 40 percent. In contrast, urban closures were more evenly distributed across the hospital bed size groups and were largely nonprofit and for-profit hospitals. Fewer (60 percent) of the
“(No. of community hospital closures in 1986-88/k&J no. of hospitals of this type in 1985) X 100 = 4- year rate of hospital closure. See table III.2 for closure rates by bedsize, types of ownership, occu- pancy, and census regions.
7The three ownership types were public, private nonprofit, and for-profit
Page 3 GAO/HRD-90-134 Factors in Rural Hospital Closures

B-289988 ,
closed urban hospitals had occupancy rates of less than 40 percent. Dif- ferences among closed hospitals reflect, in part, differences that exist among open rural and urban hospitals. For example, more rural than urban public hospitals closed, but there were many more rural than urban public hospitals in operation during this period.
Financial Symptoms Both rural and urban hospitals that closed had substantial and
of Distress Precede Closure
increasing financial losses on patient care during the 3 years prior to closure (see table 111.3). Hospitals that remained open also generally declined in profitability during fiscal years 1984-87.N As would be expected, the closed hospitals’ decline was much steeper, and they were less profitable throughout the period. Losses among closed hospitals were generally a result of their higher median cost per discharge com- pared with open hospitals. Median cost per case!’ in the year prior to closure was 24-29 percent higher in rural hospitals that closed than in rural hospitals that remained open. Yet the hospitals that later closed generally were not treating more complex medical cases.1”
One cause of high costs per case prior to closure was low occupancy. Closed hospitals had occupancy rates that were 35 to 52 percent lower in the year prior to closure than those that remained open. At lower rates of occupancy, a hospital’s fixed costs represent a greater propor- tion of its operating costs, raising the cost per discharge. Low occupancy also may partly explain the higher staffing ratios” found in the closed hospitals.
Medicare Losses Not a Major Factor in Closures
Medicare was not a major factor contributing to the financial decline and closure of most rural or urban hospitals that closed between 1985 and 1988. Before closure, hospitals generally fared better from treating Medicare patients than from treating other patients. For example, during the 2nd year before closure, most hospitals lost from treating Medicare patients, but their losses generally were less on Medicare
‘Data are for hospital cost reporting periods for fiscal years 1984-87.
“Total expenses per discharge, adjusted to exclude outpatient and other expenses not related to pro- vision of acute care hospital services.
‘“We used the Medicare case mix index as an indicator of the complexity of a hospital’s patients (see app. II).
’ ‘Full-time equivalent personnel per average daily patient census, adjusted to exclude outpatient and other nonacute care hospital services.
Page 4 GAO/HRD-90-134 Factors in Rural Hospital Closures

6239983
Table 1: Comparison of Charactirtics of Open and Closed Hospltalr
Number of hostAtalr
Closed hospitals, 1985-88 (N ~280)
Rural Urban 1408 120’)
op”N” h5”2” PIa ,I, RW~l Urban
2,481 2.783
Size (percent) 6-49 50-99
77.1 38.3 39.5 5.3
19.3 27.5 33.2 14.9
100-199 3.6 23.3 20.9 257
200+ 0.0 10.8 6.4 54.2
OwnershID (Percent) Public, nonfederal Private, nonprofit
For-orofit
30.7 8.3 43.8 14.7 39.3 51.7 47.6 67.4
30.0 40.0 8.6 17.9
Occupancy (percent) Less than 20 33.6 19.2 9.6 1.9
20-39 45.0 40.8 42.7 14.2
40-60 14.3 27.5 34.3 33.9
61or more 7.1 12.5 13.4 50.0
Census region (percent) North Central:
E.N. Central
W.N. Central
10.7 18.3 14.2 17.3
11.4 9.2 23.1 6.3
Northeast:
New England Mid-Atlantic
1.4 1.7 2.4 6.1 4.3 14.2 4.0 16.0
South: -- South Atlantic 7.9 6.7 12.5 15.4
ES. Central 11.4 5.8 12.1 5.5
-KS. Central 37.1 25.8 15.9 12.3
West: Mountain 10.0 2.5 9.6 3.8 Pacific 5.7 15.8 6.4 17.3
Note: Data are for 1985. %ural4-year rate of hospital closure was 5.3 percent.
bUrban 4-year rate of hospital closure was 4.1 percent.
Page 5 GAO/HRD-90434 Factors in Rural Hospital Cloeures
.
B.
B-299983
patients than on their business as a whole. About three-quarters of the closed hospitals either profited from Medicare patients or fared better from treating Medicare patients than other patients in the 2nd year before closing.
The smallest closed rural hospitals, however, lost significantly more on Medicare than other open or closed hospitals. Specifically, 35 percent of the rural closures with fewer than 50 beds had PPS operating margins (a measure of profitability on Medicare patients) that were lower than their total operating margins (a measure of overall profitability on patient care). This compares with about 19 percent of larger rural and urban hospitals that closed.iz
For most small rural closures, we concluded that large Medicare losses were primarily due to their relatively high cost per discharge. Although the revenue of closed and open small rural hospitals was not very dif- ferent,‘:’ the median cost per discharge was dramatically higher (27 per- cent) for the closed hospitals in the year prior to closure. Despite this finding, we cannot rule out that Medicare may have contributed dispro- portionately to the financial distress and closure of 35 percent of these hospitals and 19 percent of other closures.
Multiple Factors Contribute to Rural Hospitals’ Closure
We found that a number of underlying factors made hospitals more vul- nerable to closure. Four factors had a large effect and were considered of particular importance. I4 Hospitals that had fewer than 100 beds, had occupancy rates of 40 percent or less, were owned by a for-profit entity, or were located in either the Northeastern or Southern regions of the United StatesI” were at least 3 times more likely to close than the com- parison groups we analyzed.l”
“Analysis based on 2nd year before closing.
“‘The median revenue per discharge was 6 percent lower in the closed than open hospitals.
‘^‘A large effect was measured by the odds ratios presented in table 111.4. See app II, section on “Sta- tistical Techniques” for further discussion of odds ratios.
‘“The South was defined as the West South Central, South Atlantic, and East South Central regions of the United States. The Northeast was defined as the New England and Middle Atlantic census regions.
“‘We defined our threshold of high-risk as 3 times the risk of closure of the comparison group included in the analysis. See table III.4 to identify the comparison “reference group” for each variable.
Page 6 GAO/HRD-90-134 Factors in Rural Hospital Closures

B-239983
Rural hospitals are more vulnerable as a group because several of the characteristics associated with hospitals’ higher risk of closure (e.g., smaller size, low patient volume) are more prevalent among rural than urban hospitals. However, their vulnerability appears to be a result of these characteristics rather than their location in a rural area. Control- ling for differences in operating characteristics, rural hospitals did not face a greater risk of closure than urban hospitals during the 1985-88 period.
Characteristics of Hospitals at Risk of Closure
We found that a number of hospital operating and environmental char- acteristics (bed size, occupancy, percent Medicaid days, case mix, area wages, ownership, and geographic region) had a modest to large effect on the risk of closure (see table 111.4). With the exception of ownership status, the effect of these characteristics on the risk of closure did not vary significantly between rural and urban hospitals.17
When we examined the effect of each characteristic while holding the other characteristics constant, we found that:
. Hospitals with fewer than 50 beds and those with 50-99 beds were 12 and 4 times more likely to close, respectively, than hospitals with 200 or more beds.
l Hospitals with very low volume (occupancy rates of less than 20 per- cent) were 9 times more likely to close than hospitals with occupancy rates of 61 percent or more. Hospitals with low to modest occupancy rates (20-39 percent) were 4 times more likely to close than hospitals with occupancy rates of 61 percent or more.
l Hospitals owned by a for-profit entity were more likely to close than publicly owned hospitals. This effect was larger for rural than urban hospitals. While rural for-profit hospitals were 8 times as likely to close as publicly owned rural hospitals, urban for-profit hospitals were 5 times as likely to close as publicly owned urban hospitals (see table 111.5).
. Hospitals with a relatively large percentage of Medicaid inpatient days (11 percent or more) had a 1.5 times higher risk of closure than hospi- tals with fewer Medicaid days.
17This statement is based on the statistical insignificance of most of the “interaction terms” in our model. See app. II for information on interaction terms.
Page 7 GAO/HRD90-134 Factors in Rural Hospital Closures

.
R-239983
. Hospitals with higher case mix indexes had a lower risk of closure. A lo-percent higher case mix for the average hospital reduced the risk of closure by 33 percent.lH
l Hospitals facing higher labor costs were more likely to close. For a lo-percent increase in the area wage index, the probability of closure increased by about 23 percent.‘”
l Hospitals in the North Central regions had twice the risk of closure of those in the West; hospitals in the Northeast and South had about 4 times the risk of closure of hospitals in the West.
Our analysis did not provide evidence that hospitals with a large share of Medicare patients were at greater risk of closure. When controlling for differences in hospitals’ operating characteristics, the odds of clo- sure were not greater for hospitals with Medicare inpatient days of 60 percent or more when compared to hospitals with an average percent of Medicare days. acB This finding did not differ for urban and rural hospitals.
Our data do not permit distinguishing between the effects of each indi- vidual factor used to indicate a declining or depressed economy. How- ever, we found that, as a group, factors such as the unemployment rate and low per capita income were important determinants of risk.?’ Evi- dence from a descriptive analysis we presented in another reporP also showed that hospitals in areas with low per capita income and increased unemployment were more likely to be financially distressed. We will fur- ther explore the role of economic factors in closure in the report we plan to issue later this year.
IsThis response is measured at the mean of the case mix index (1.13). At other levels of the case mix index, the estimated effect will differ since the logit function is not a linear relationship.
“‘This response is measured at the mean of the wage index (0.98). At other levels of the wage index, the estimated effect will differ since the logit function is not a linear relationship.
““We found some evidence that having relatively few Medicare days increased a hospital’s risk of closure. This finding, however, appears to be sensitive to the data source and the number of observa- tions in the analysis and therefore, should be interpreted cautiously. See app. II for a discussion of the limitations of the data source.
“‘All the market area demand variables were tested as a group: median income, median education, unemployment, population density, population age 66 and over, change in population, population, and Herfindahl index.
22Rural Hospitals: Federal Leadership and Targeted Programs Needed (GAOIHRD-90-67) June 1990, p, 19.
Page 8 GAO/HRD-90-134 Factors in Rural Hospital Closures

. ’
R-239983
Rural Location Did Not Increase Risk of Closure
We found that closure rates, not adjusted for differences in hospital operating characteristics, were higher for rural than urban hospitals during the 1985-88 time period. However, when holding operating and environmental characteristics constant, only for-profit rural hospitals had a slightly higher risk of closure than urban hospitals. Since for- profit hospitals represent a small share of all rural hospitals (fewer than 10 percent), the effect of this finding on the number of closures was negligible. Our analysis suggests that rural hospitals’ higher closure rate was due to a greater prevalence of high-risk characteristics (e.g., small size, low occupancy) among them. Thus, any strategies to prevent rural closures should target rural hospitals with high-risk characteristics, rather than all hospitals located in a rural area.
We are sending copies of this report to the Secretary of Health and Human Services, the Director of the Office of Management and Budget, and other interested parties. We also will make copies available to others on request. Please call me at (202) 275-5451 if you or your staff have any questions concerning the report. The major contributors to this report are listed in appendix IV.
Janet L. Shikles Director of Health Financing
and Policy Issues
Page 9 GAO/HRD-90-134 Factors in Rural Hospital Closures
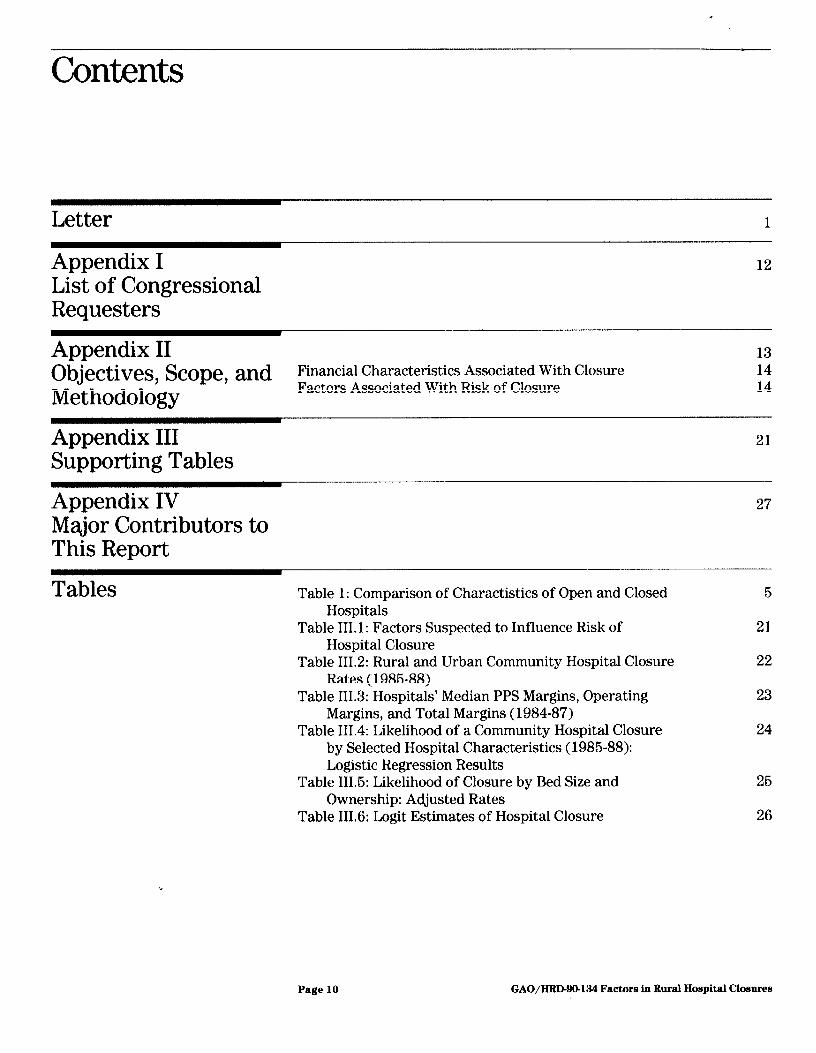
Contents
Letter
Appendix I List of Congressional Requesters
Appendix II 13
Objectives, Scope, and Financial Characteristics Associated With Closure 14
Methodology Factors Associated With Risk of Closure 14
Appendix III Supporting Tables
Appendix IV
21
27
Major Contributors to This Report
Tables Table 1: Comparison of Charactistics of Open and Closed 5 Hospitals
Table III. 1: Factors Suspected to Influence Risk of Hospital Closure
21
Table 111.2: Rural and Urban Community Hospital Closure Rates (1985-88)
22
Table 111.3: Hospitals’ Median PPS Margins, Operating Margins, and Total Margins (1984-87)
Table 111.4: Likelihood of a Community Hospital Closure by Selected Hospital Characteristics (1985-88): Logistic Regression Results
23
24
Table 111.5: Likelihood of Closure by Bed Size and Ownership: Adjusted Rates
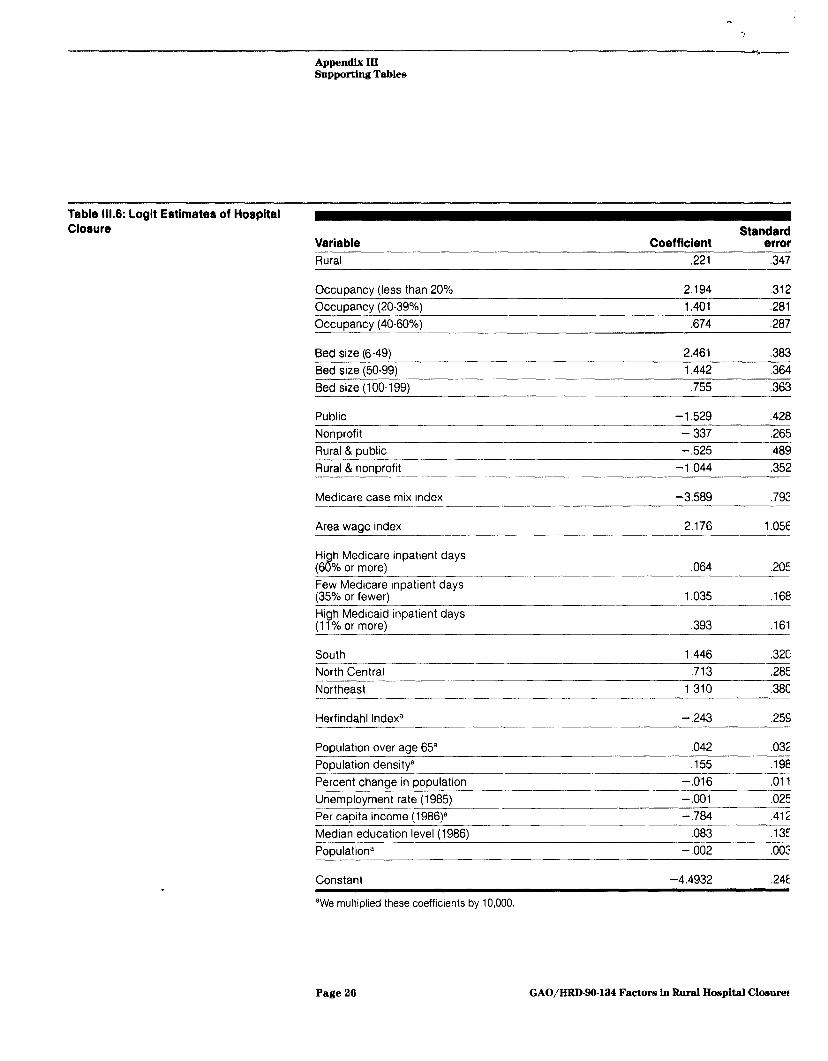
Table 111.6: Logit Estimates of Hospital Closure
25
26
Page 10 GAO/IiRD-90-134 Factors in Rural Hospital Closures

. .
Contents
Abbreviations
AHA ARF HCFA HCIA HCRIS HHS MSA PPS
Page 11
American Hospital Association Area Resource File Health Care Financing Administration Health Care Investment Analysts Medicare Hospital Cost Report Information System Department of Health and Human Services metropolitan statistical area prospective payment system
GAO/IUD-W-134 Factors in Rural Hospital Closures

Appendix I
List of Congressional Requesters
U.S. Senators James R. Sasser Kent Conrad J. James Exon John D, Rockefeller IV Carl M. Levin Richard Shelby Tom Daschle Lloyd Bentsen Strom Thurmond Bob Graham Harry Reid Larry Pressler John C. Danforth Steve Symms Ernest F. Hollings Thad Cochran Terry Sanford Albert Gore, Jr. Quentin N. Burdick Donald W. Riegle, Jr. Christopher S. Bond Mitch McConnell Barbara Mikulski Howard M. Metzenbaum Robert W. Kasten, Jr. John Breaux ’ Charles E. Grassley John Heinz Sam Nunn J. Bennett Johnston Tom Harkin William L. Armstrong
Page 12 GAO/IiRD-99-134 Factors in Rural Hospital Closures

*
Appenldix II
Objectives, Scope, and Methodology
This study focused on community hospitals that closed during 1985-88, the period after implementation of Medicare’s prospective payment system. The specific objectives were to (1) determine the financial char- acteristics associated with rural closures, (2) determine the role of Medi- care payment in rural closures, and (3) identify hospital operating and environmental characteristics associated with financial distress and the risk of closure
Through a review of the literature and discussions with experts in the field, we identified hospital and environmental characteristics that were suspected or documented as related to closure. We then constructed indicators of these measures from several data sources. Information on the organizational characteristics, utilization history, and financial per- formance of rural and urban community hospitals was obtained from the Medicare Hospital Cost Report Information System 1’1+31-I’PS4’ Min- imum Data Set and the American Hospital Association’s Annual Survey and closure files for 1980-88. Information on the external operating envi- ronment of hospitals was obtained from the Department of Health and Human Services’s 1988 Area Resource File (ARF).
During the initial phase of this work, we validated a sample of urban and rural community hospital closures listed in the AIIA closure files (1980-87). One state was randomly selected from each of the nine census regions, and all reported closures in that state were validated. Hospitals listed as questionable 1988 closures in a 1989 publication were also vali- dated.:! We used the AIIA definition of a community hospital as a nonfederal, short-term, general and other specialty hospital, whose facilities are available to the public. A closure was defined as the discon- tinuance of the provision of inpatient acute care medical services for any time period during 1980-88. Any hospital that closed and reopened during the study period was classified as a temporary closure but not excluded. Hospitals that did not meet our criteria for closure (for example, consolidations, changes of ownership) were excluded from the list of closures.
’ l&porting periods for fiscal years 1984-87.
“‘AHA Closure List Questioned,” Modern Healthcare, Mar. 3, 1989, p. 6., and “AHA’s ‘86,‘87 Closure Data Questioned,” Modern Ilealthcare, Mar. 17,1989, p. 6,
Pa@? 13 GAO/HRD-90-134 Factors in Rural Hospital Closures

Appendix II Objectives, Scope, and Methodology
Financial Characteristics Associated With Closure
To identify the financial characteristics associated with closure, we ana- lyzed data on two commonly used measures of hospitals’ profitability (total operating margin:! and total margin ) in the 4 years before closure. In this analysis, we compared the financial characteristics of open and closed hospitals, stratified by size and urban/rural location. Using bivar- iate techniques, we compared open and closed hospitals’ median profit margins, costs, and revenues5 and calculated rates of closure for hospi- tals, given certain levels of profitability.
Additional analyses were undertaken to assess Medicare’s contribution to the overall profits and losses of rural and urban hospitals. We com- pared PPS costs and revenues of closed and open hospitals stratified by size and urban/rural location. Also, we compared hospitals’ PPS margins” with their total operating margins. For hospitals that experienced PPS losses, we compared their PPS and operating margins to determine whether their losses on Medicare patients were more severe than on other patients.
PPS payment rules changed during our study period (for example, pay- ment rates increasingly were based on national average costs, rather than hospitals’ own costs). Therefore, while our methodology allows us to assess whether PPS payment was a major factor influencing the clo- sure of hospitals between 1985 and 1988, these results must not be assumed to reflect the pattern for more recent or future closures.
Factors Associated To identify factors that might contribute to a hospital’s financial dis-
With Risk of Closure tress and ultimate closure, we used several approaches. First, we com- pared the characteristics of closed and open hospitals. Second, we
“The operating margin is used to measure profitability on all patient care operations and is: (net patient revenue - operating expenses)/net patient revenue. Because for many hospitals, net patient revenue does not include all operating revenue, this measure understates operating profitability by an estimated l-l/‘2 to 2 percent (HCIA estimate; see footnote 6).
4The total margin measures overall profitability and is: (total revenue - expenses)/total revenue
“Much of this work was undertaken through a GAO contract with a private firm, Health Care Invest- ment Analysts (IICIA), Inc. HCIA also obtains its data from the Medicare cost reports. However, it obtains the original cost report source documents and has access to financial information that is not included in the Medicare HCRIS data set. HCIA extracted more detailed information on the closed hospitals than were available through HCRIS. For measures that could be constructed using both the GAO and HCIA data sets, we found that the estimates resulted in similar patterns and trends.
“The PI’S margin is used to measure profitability on Medicare patients and is calculated: (PI’S oper. ating revenue - PI’S operating costs)/PPS operating revenue. Our PPS margin does not include a hospital’s capital costs or capital cost reimbursement.
Page 14 GAO/HRD-90-134 Factors in Rural Hospital Closures

.
Appendix II Objectives, Scope, and Methodology
computed closure rates for urban and rural hospitals by factors we sus- pected influenced the risk of closure. Using a statistical technique, logistic regression, we assessed the individual and combined influence of the multiple factors associated with closure. This technique also per- mitted us to assess the effect of a hospital’s location in an urban or rural area, while holding constant other factors that could influence closure.
A Description of the Closure Model
We used a multivariate logit model to quantify the impact of hospital operating and environmental characteristics on the probability of clo- sure. We observed the status of 5,524 community hospitals (nonfederal, short-stay general hospitals) between 1985 and 1988. During this period, 260 hospitals closed. To estimate the statistical relationship between the likelihood of closure and our selected characteristics, we obtained maximum likelihood estimates from a logistic function.7 The dependent variable in this model is the closure status of the hospital during 198588. The variable equals 1 if the hospital closed between 1985 and 1988; otherwise the value of the variable is 0.
Factors Included in the Closure Model
The independent variables included in our model are characteristics of the hospital and its market environment. For each hospital, expected financial performance depends on projected revenues and costs over the 4-year period, 1985-88. The operating characteristics included in the regression model are considered direct or indirect determinants of hospi- tals’ revenues and costs. We recognize that in some cases, the variables are indicators of more than one operating characteristic of a hospital affecting costs and revenues. For example, a hospital’s bed size is an indicator of its capacity, capital costs, and mix of services.
The regression model was used to assess the effects of the independent variables on the likelihood of closure, while controlling for the effects of the other hospital and market characteristics. For variables obtained from the AHA Annual Survey, we used 1985 values of the variables to estimate the relationship between closure and the observed hospital or
7The logistic function is a nonlinear estimation technique that is appropriate when the dependent variable is dichotomous. Here the technique is necessary because only two conditions are considered for each institution-either it remained open during the entire period or it closed. The estimates were Jxrformed with the author-supported SAS logistic procedure. For a detailed description of the logit model, see #Jan Kmenta’s Elements of Econometrics, 2nd ed. (New York: MacMillan Publishing Co., 1986), or Robert S. Pindyck and Daniel L. Rubinfeld, Econometric Models and Economic Forecasts, 2nd ed. (New York: McGraw-Hill Hook Co.), 1981.
Page 16 GAO/HRD-90-134 Factors in Rural Hospital Closures

--1-- Appendix II Objectives, Scope, and Methodology
market characteristics.” For those obtained from the Medicare cost reports, we used data from hospital cost reporting periods beginning during fiscal year 1985. The variables included in the final regression model are described below.
Hospital Operating and Financial Location. This variable classified a hospital as urban or rural. An urban Characteristics hospital was one located within a metropolitan statistical area (MSA). A
rural hospital was one outside an MSA.!'
Bed size. Hospitals were grouped in one of four categories: fewer than 50 beds; 50-99 beds; loo-199 beds; and 200 beds or more. This factor mea- sures hospital size and is an indicator of a hospital’s capacity, capital costs, and mix of services.
Ownership. Hospitals were classified as either for-profit, private non- profit, or public nonfederal. This variable measures differences in risk due to the incentives and constraints facing these institutions. Also, it is an indicator of the potential availability of nonpatient sources of rev- enue from either community fundraising efforts or government subsidies.
Occupancy rate. A hospital’s occupancy rate was defined as the ratio of a hospital’s average daily census”’ to the average number of staffed beds maintained during the reporting period. Hospitals were categorized into one of four occupancy groups: less than 20 percent, 20-39 percent, 40-60 percent, and greater than 60 percent. Occupancy rate is an indicator of a hospital’s patient volume, which is a determinant of revenues and per patient costs. I I
Percent Medicare inpatient days. Hospitals were classified into three groups: low Medicare population (less than or equal to 35 percent Medi- care inpatient days); average-size Medicare population (36-59 percent
‘Vah* *-r 1985 wftrq’ not a’ able for all the variables used in estimating the model. When 1986 valul missi +I- dividual characteristics of hospitals, we used the closest reported value fro; 1’ .b the number of usable observations. If no reported value was available in il 1 data were reported, we used that information.
!q., ural generally used by Medicare’s PJ’S
“‘A\ ,’ inpatients, excluding newborns, receiving care each day during the reporting perioc.
’ ’ For ou ,~~.,L.ical approach to yield meaningful results, a hospital’s occupancy rate should be pre- determi: i.e., observed at least 1 year prior to closure. Occupancy data for all closures were for prior ye Data for the 1985 closures were from the 1983 and 1984 AIIA annual surveys.
Page 16 GAO/HRD-90-134 Factors in Rural Hospital Closures
l
1
.
Appendix II Objectives, Scope, and Methodology
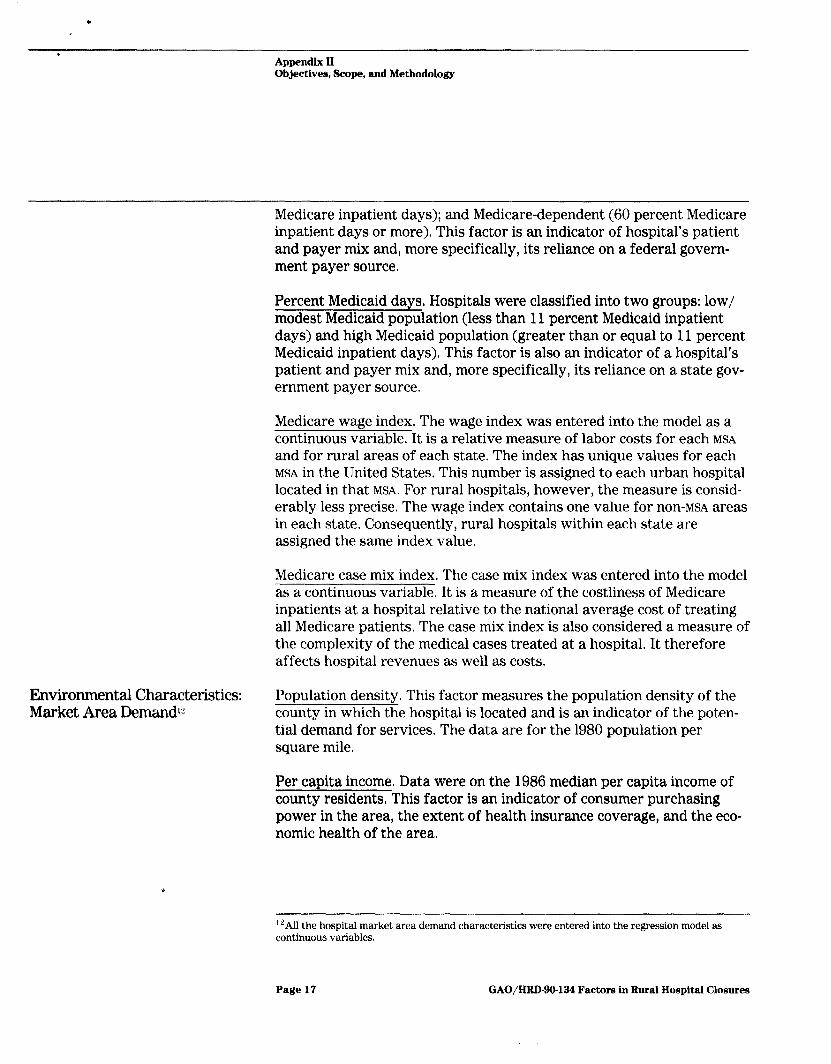
Medicare inpatient days); and Medicare-dependent (60 percent Medicare inpatient days or more). This factor is an indicator of hospital’s patient and payer mix and, more specifically, its reliance on a federal govern- ment payer source.
Percent Medicaid days. Hospitals were classified into two groups: low/ modest Medicaid population (less than 11 percent Medicaid inpatient days) and high Medicaid population (greater than or equal to 11 percent Medicaid inpatient days). This factor is also an indicator of a hospital’s patient and payer mix and, more specifically, its reliance on a state gov- ernment payer source.
Medicare wage index. The wage index was entered into the model as a continuous variable. It is a relative measure of labor costs for each MSA
and for rural areas of each state. The index has unique values for each MSA in the United States. This number is assigned to each urban hospital located in that MSA. For rural hospitals, however, the measure is consid- erably less precise. The wage index contains one value for non-MsA areas in each state. Consequently, rural hospitals within each state are assigned the same index value.
Medicare case mix index. The case mix index was entered into the model as a continuous variable. It is a measure of the costliness of Medicare inpatients at a hospital relative to the national average cost of treating all Medicare patients. The case mix index is also considered a measure of the complexity of the medical cases treated at a hospital. It therefore affects hospital revenues as well as costs.
Environmental Characteristics: Market Area Demand’”
Population density. This factor measures the population density of the county in which the hospital is located and is an indicator of the poten- tial demand for services. The data are for the 1980 population per square mile.
Per capita income. Data were on the 1986 median per capita income of county residents, This factor is an indicator of consumer purchasing power in the area, the extent of health insurance coverage, and the eco- nomic health of the area.
“All the hospital market area demand characteristics were entered into the regression model as continuous variables.
Page 17 GAO/HRD-90-134 Factors in Rural Hospital Closures

Appendix II Objectives, !3cope, and Methodology
.
Median education. Data were for the 1980 median level of education of county residents. This factor is an indicator of counties’ relative levels of need for and use of services,
Change in population. This factor measured the percentage change in the hospital county’s population from 1980 to 1985. It is a measure of the area’s growth, which affects the demand for health services.
Population. This factor measures the 1985 population of the county in which the hospital is located and thus indicates the potential demand for hospital services.
Population over 65 years old. Data were for the number of county residents over 65 years of age in 1980. The measure is included to cap- ture the effects of the population’s age composition on the demand for hospital services.
County’s unemployment rate. Data were for the percentage of the county’s civilian labor force unemployed in 1985. This factor is an indi- cator of the economic health of the county.
Environmental Characteristics: Market Structure
Herfindahl index. This index is a measure of the concentration of bed capacity in a county. It is computed by adding together the square of the percentage share of total county acute care beds controlled by each hos- pital.‘” The index is used as an indicator of the competitiveness of the market environment.
Environmental Characteristics: Other
Region. The nine U.S. Census regions were collapsed into four summary categories: (1) North Central (East North Central and West North Cen- tral regions); (2) Northeast (New England and Middle Atlantic regions); (3) South (South Atlantic, East South Central, and West South Central regions); and (4) West (Mountain and Pacific) regions. This variable is an indicator of differences in costs and revenues not accounted for by other variables in the model. For example, it is intended to capture the effect of regional differences in practice patterns and resource costs.
“‘That is, Herfindahl index = Z i s12, where s, = (hospital i’s bedsize/total county beds) X 100.
Page 18 GAO/HRD-90-134 Factors in Rural Hospital Closures
Appendix II Objectives, Scope, and Methodology
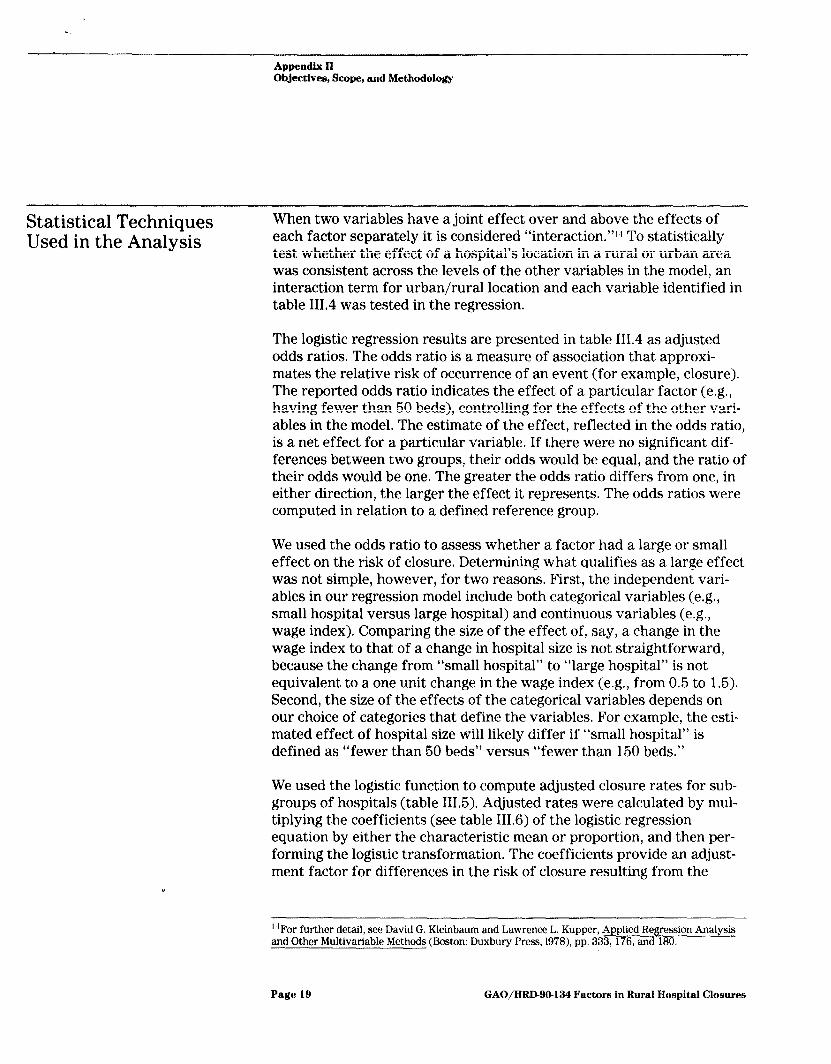
Statistical Techniques Used in the Analysis
When two variables have a joint effect over and above the effects of each factor separately it is considered “interaction.“l.’ To statistically test whether the effect of a hospital’s location in a rural or urban area was consistent across the levels of the other variables in the model, an interaction term for urban/rural location and each variable identified in table III.4 was tested in the regression.
The logistic regression results are presented in table III.4 as adjusted odds ratios. The odds ratio is a measure of association that approxi- mates the relative risk of occurrence of an event (for example, closure). The reported odds ratio indicates the effect of a particular factor (e.g., having fewer than 50 beds), controlling for the effects of the other vari- ables in the model. The estimate of the effect, reflected in the odds ratio, is a net effect for a particular variable. If there were no significant dif- ferences between two groups, their odds would be equal, and the ratio of their odds would be one. The greater the odds ratio differs from one, in either direction, the larger the effect it represents. The odds ratios were computed in relation to a defined reference group.
We used the odds ratio to assess whether a factor had a large or small effect on the risk of closure. Determining what qualifies as a large effect was not simple, however, for two reasons. First, the independent vari- ables in our regression model include both categorical variables (e.g., small hospital versus large hospital) and continuous variables (e.g., wage index). Comparing the size of the effect of, say, a change in the wage index to that of a change in hospital size is not straightforward, because the change from “small hospital” to “large hospital” is not equivalent to a one unit change in the wage index (e.g., from 0.5 to 1.5). Second, the size of the effects of the categorical variables depends on our choice of categories that define the variables. For example, the esti- mated effect of hospital size will likely differ if “small hospital” is defined as “fewer than 50 beds” versus “fewer than 150 beds.”
We used the logistic function to compute adjusted closure rates for sub- groups of hospitals (table 111.5). Adjusted rates were calculated by mul- tiplying the coefficients (see table 111.6) of the logistic regression equation by either the characteristic mean or proportion, and then per- forming the logistic transformation. The coefficients provide an adjust- ment factor for differences in the risk of closure resulting from the
’ ‘For further detail see David G. Kleinbaum and Lawrence L. Kupper, Applied Regression Analysis and Other Multivariable Methods (Boston: Duxbury Press, 1978), pp. 333, 176, and 180.
Page 19 GAO/HRD-99-134 Factors in Rural Hospital Closures
Appendix II Objectives, Scope, and Methodology
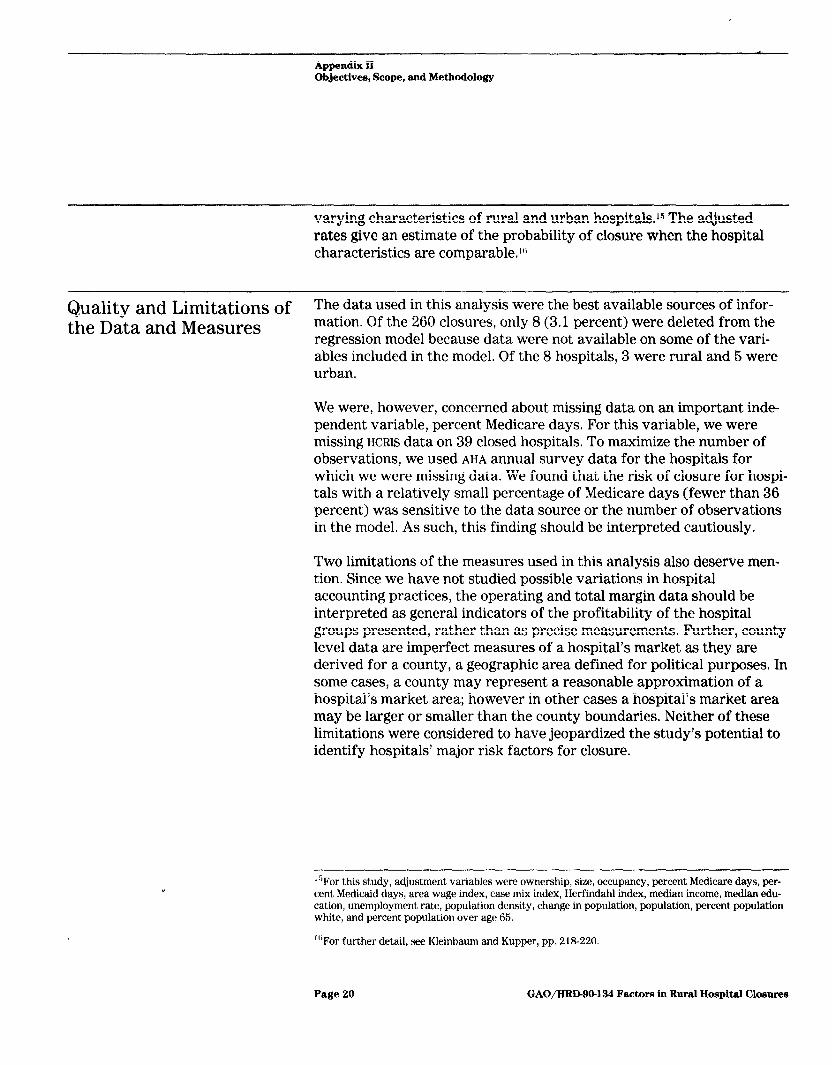
varying characteristics of rural and urban hospitals.lE The adjusted rates give an estimate of the probability of closure when the hospital characteristics are comparable.11’
Quality and Limitations of The data used in this analysis were the best available sources of infor-
the Data and Measures mation. Of the 260 closures, only 8 (3.1 percent) were deleted from the regression model because data were not available on some of the vari- ables included in the model. Of the 8 hospitals, 3 were rural and 5 were urban.
We were, however, concerned about missing data on an important inde- pendent variable, percent Medicare days. For this variable, we were missing HCRIS data on 39 closed hospitals. To maximize the number of observations, we used AHA annual survey data for the hospitals for which we were missing data. We found that the risk of closure for hospi- tals with a relatively small percentage of Medicare days (fewer than 36 percent) was sensitive to the data source or the number of observations in the model. As such, this finding should be interpreted cautiously.
Two limitations of the measures used in this analysis also deserve men- tion. Since we have not studied possible variations in hospital accounting practices, the operating and total margin data should be interpreted as general indicators of the profitability of the hospital groups presented, rather than as precise measurements. Further, county level data are imperfect measures of a hospital’s market as they are derived for a county, a geographic area defined for political purposes. In some cases, a county may represent a reasonable approximation of a hospital’s market area; however in other cases a hospital’s market area may be larger or smaller than the county boundaries. Neither of these limitations were considered to have jeopardized the study’s potential to identify hospitals’ major risk factors for closure.
‘“For this study, adjustment variables were ownership, size, occupancy, percent Medicare days, per- cent Medicaid days, area wage index, case mix index, Herfindahl index, median income, median edu- cation, unemployment rate, population density, change in population, population, percent population white, and percent population over age 65.
“‘For further detail, see Kleinbaum and Kupper, pp. 218-220
Page 20 GAO/HRD-90-134 Factors in Rural Hospital Closures

Appendix III
Supporting Tables
Table 111.1: Factor8 Surpected to Influence Risk of Hospital Closure Characterirtic Meanurea
Hospital operating and financial characteristic Hospital type and location Rural/urban status
Ownership
Multihospital svstem member
Capacity and utilization
Patient and payer mix
Long-term care services
Revenues, expenses, and profitability
Environmental characteristic Market area supply and competitionb
Market area demandb
Bedsize
Occupancy rate
Percent Medicare days Percent Medicaid davs
Swing bed program
Long-term care unit Area wage index Teachina status
Medicare case mix index
No. hospitals in county
Beds per 1,000 Adjacent to a MSA Phvsicians per 1,000
Herfindahl index
Skilled nursing beds Median income
Median education
Unemployment rate Population density
Change in population
Population
Other Census region
aMeasures included in the final regression model are defined in app. II
%ounty measures.
Page 21 GAO/HRD-90-134 Factors in Rural Hospital Closures
Appendix III Supportlng Tables
Table 111.2: Rural and Urban Community Horpltal Closure Rate3 (198588)
50-99
All hospitals
Bed size 6-49
Rural hospitals
27
Urban hospitals 4-year closure
3.2 33
4-year closure rate
7.4
per 100 rate per 100 No. hospitals No. hospitals 140 5.3 120 4.1
108 9.9 46 23.7
-- 100-199 5 1.0 28 3.8 -_ 200 or more 0 0.0 13 0.9
Ownership Public, nonfederal
Private, nonprofit ____I___- For-orofit
43 3.8 10 2.4
55 4.5 62 3.2
42 16.4 48 8.8
Occupancy (percent) Less than 20
20-39
40-60
47 16.4 23 30.3
63 5.6 49 11 .o -- 20 2.3 33 3.4
61 or more 10 2.9 15 1.1
Percent Medicare days Less than 36
36-59 600r more
30 5.4 20 3.5
68 5.2 92 4.3
22 6.2 8 4.0
Census region North Central-
E.N. Central 15 4.1 22 4.4
W.N. Central 16 2.7 11 6.0 Northeast
Middle Atlantic
---__ New Enaland
6 5.8
2 17
3.3
3.7
2 1.2
South ___-- South Atlantic l_-. ES Central
W.S. Central
- 11 3.4 8 1.8
16 5.1 7 4.4
52 11.6 31 8.3 West
-Mountain 14 5.6 3 2.8 Pacific 8 4.8 19 3.8
a(Number of community hospital closures in 198588/total number of hospitals of this type in 1985) x 100 = 4-year rate of hospital closure.
Page 22 GAO/HRD-90-124 Factors in Rural Hospital Closures

Appendix III Supporting Tables
Table 111.3: Hospitals’ Median PPS Margins, Operating Margins, and Total Margins (1984-87) Figures are profit margins as a percent of hospital revenues.a ^__I__-__^--_-.. .._. ._-..--_--_~.-- -
Closed hospitals (years prior to closure) Open hospital (PPS year)
Type of hospitals’ profit margin 4 3 2 1 1 2 3 4 -...-.-- .._... . ..-..-. -.---~_--..~..--...---.-- ~. All hospitals N~62~ N=l18 N=l66 N=166 N=4,584" N=4,954 N=4,948 N-4,913 .._... ~-. ------ ---. PPS margin 9 3 -5 -12 12 11 6 2 ..-.... . ~. -~. ~~~----~._-.---.-.----- __._ Operating margin -4 -8‘ -15 -22 2 0 -1 -2 . .._ ..__.. .___ - - .~ .~~. _~~ .-_~ .~ .._. ~~-. __~~ Total margin 1 -3 -8 -1.5 6 4 3 3 ..___-___ Rural hospitals N=36 N=70 N=97 N=90 N=2,338 N=2,362 N=2,304 N=2,305 -. ..~ .~ ~~_~.. ~~~ . ___-____.-. PPS margin 0 -1 -11 -21 8 7 1 -2 Operating margin -8 -11 -16 -25 0 -2 -3 -3
Total margin -2 -5 -7 -15 4 3 2 2
Urban hospitals N=26 N=48 N=69 N=76 N=2,246 N=2,592 N=2,644 N=2,608 ._-- “.-.__-.-_-. --..-_ .._- . ~~ _-~~. -... PPS margin 13 7 3 -4 15 14 9 5 Operating margin -1 -6 -13 -20 4 1 0 -1
Total margin 2 -2 -8 -15 7 5 4 3 _-._-. --_-^ . ..^._.. _.. _..._._.. ..-. --.-~ Rural hospitals with 6-49 beds PPS margin -1 -2 -13 -23 7 6 0 -2 Operating margln -8 -13 -18 -24 -3 -5 -7 -7 ..___ Total margln -2 -5 -9 -14 3 2 0 0 -._-- .__. _....._-..... -.-__ .~ Rural hospital8 with 50-99 beds l___l..__._._ _ _.... . . _---_.-.---~--.--.--..-~. PPS margin 0 3 -5 -10 9 8 2 -1
Operating margin d -5 -11 -25 0 -2 -3 -3 .---” . . _... .__.-. . ..-...~.-~... ___- Total marain d 0 -2 -18 4 3 2 2
Urban hospitals with 6-49 beds _____.----. -. PPS margin d 8 7 -9 10 14 6 5 .I.I __...__...... ._ I_..I._ _--_____-- .-. .__._~ _.._ -- Operating margin d -3 -10 -22 0 -2 -6 -6 _---...~ .--_~-____ ---.-___._ Total margln d -3 -8 -15 4 3 0 0 -._._ ..__....._. -_.-..- ..- .--... -~. .- -- ~~--.___- ___-. Urban hospitals with 50-99 beds ..___--~- ___.. PPS margin d 10 2 -1 13 13 8 4 --.. . . . --...-- _ ~.. .--.~-. -__----- .--- .___ --_____-----___. Operating margin d -8 -12 -21 1 0 -1 -2 “. . .-._ - ._.. -.- ..--- -.- _-.. .- ___-.-- ____ Total marain d -2 -8 -19 4 3 2 2
%ince there were some mrssing data for each median reported, the number of observations differs slightly for each computation.
‘All usable data for open and closed hospitals were included. Because we combine data for hospitals that closed in different years, the number of observations varies due to data availability in the years prior to closure. For example, no data were available 2-4 years prior to closure for hospitals that closed in 1985.
CFewer open hospitals were analyzed in PPS year 1 because many hospitals appeared to have incorrect data. Data were edited based on screens used by HHS, HCIA, and the Prospective Payment Assess- ment Commrssion.
dNot calculated due to small number of observations.
Page 23 GAO/HRD-90-134 Factors iu Rural Hospital Closures

r
Appendix III Supporting Tables
Table llL4: Llkellhood of a Communlty HO#pltOl Closure by Selected Horpltal Characterlstlce (1985-88): Logistic Regrerrion Result3
Characterlstlc
All commun/y ;o$ltals In 1985 = 1
(95% confidence Adjusted odds ratiob interval)
Y
Locatlon Rural 1.25 (.63 . 2.47’
Urban Reference group
Bed size Fewer than 50 11.72 (5.56 - 24.65: ______- 50-99 4.23 (2.08. 8.55:
100-199 2.13 (1.05 _ 4.29‘
200 or more Reference QrouD
Ownership Public
- 0.22 c.09 - 50’
Private nonprofit 0,71 (.42 - 1.21’
Private for-profit
Occupancy (percent) Less than 20
Reference group
8.97 (4.87 16.41
20-39 4.06 (2.34 - 7.02
40-60 (1.11 -3.45
61 or more Reference arouD
Percent Medicare days Fewer than 36 2.82 (2.03 3.95:
60 or more 1.07 (.72 - 1.57 ~- ___.---~-..~-.- - .- 36-59 Reference group
Percent Medicaid days 11 or more 1.48 (1.08 - 2.02
Fewer than 11 _____~~~~_.
Reference group
Region North Central
-_____ ...._~ --.... -- 2.04 (1.17 - 3.52 -~
Northeast 3.71 (1.76 7.81 .~ South 4.24 (2.28 - 7.98
West Reference group
Location and ownerrhlp Rural & public 0.59 (.23 - 1.54
Rural & private nonprofit 0.35 (.18 - .70
Rural & for-profit Reference group
Case mix Index (Meanx1.13 f .15) 0.67d
Wage index (Mean=0.98 + .17) 1 .24c
aThis table reports selected variables, including all the statisttcally significant vartables In the model
Page 24 GAO/HRD-SO-134 Factors in Rural Hospital Closures

Appendix lII Supporting Tables
bThe odds ratio approximates the relative risk of occurrence of an event such as closure. If there were no significant differences between two groups, their odds would be equal and the ratio of their odds would be one. The odds ratios in this table are computed in relation to a defined reference group. Thus, for example, hospitals with 50-99 beds were 4 times as likely to close as the reference group of hospi- tals with 200 or more beds.
‘Odds are significant at the 95 percent confidence level
dOdds are significant at the 99 percent confidence level.
Table 111.5: Likelihood of Closure by Bed Size and Ownership: Adjusted Rates
Bed size Fewer than 50
Four-year closure rate per 100 hospitals Rural hospitals Urban hospitals
4.32 7.09
50-99 1.60 2.68 100-199 0.81 1.37
200 or more 0.38 0.65
Ownership Public, nonfederal
Private, nonDrofit
0.57 0.77 1.11 2.49
Private for-profit 4.28 3.46
Note: See app. II for a discussion of adjusted rates.
Page 25 GAO/HRD-90434 Factors in Rural Hospital Closures
Appendix III Supporting Tables
Table 111.6: Logit Estimates of Hospital Closure
Variable Coefficient Rural ,221
Occupancy (less than 20% 2.194
Standard error
,347
,312
Occupancy (20-39%) 1.401 ,281
Occuoancv (40-60%) ,674 ,287
Bed size (6-49) 2.461 ,383
Bed size (50-99) 1.442 ,364
Bed size (100-199) ,755 ,363
Public -1.529 ,428
Nonorofit -.337 ,265
Rural & public -.525 ,489
Rural & nonprofit -1.044 ,352
Medicare case mix index -3.589 ,792
Area wage index 2.176 1.056
Hi h Medicare inpatient days (68% or more) Few Medicare inpatient days (35% or fewer)
High Medicaid inpatient days (11% or more)
,064 ,205
1.035 ,168
,393 ,161
South 1.446 ,326 -- North Central ,713 ,285
Northeast 1.310 .38C
Herfindahl indexa -.243 ,255
Population over aae 65” ,042 ,032 Population densitya ,155 ,198
Percent change in population -.016 ,011
Unemployment rate (1985) -.OOl ,025
Per capita income (1986)a -.784 ,412
Median education level (1986) ,083 .13E
Populationa -.002 ,002
Constant -4.4932 .24E
aWe multiplied these coefficients by 10,000.
Page 26 GAO/HRD-SO-134 Factors ln Rural Hospital Closurer
Appendix IV
Major Contributors to This Report
Human Resources Division,
Mark V. Nadel, Associate Director for National and Public Health Issues, (202) 276-6195
Edwin P.Stropko, Assistant Director
Washin&ion, DC.
(10SBOR)
Marsha LillieIBlanton, Evaluator-in-Charge Suzanne M. Felt, Evaluator Elizabeth A. Wennar, Evaluator C. Robert DeRoy, Evaluator (Computer Science) Patrick Redmon, Economist Steve Machlin, Statistician Lester Baskin, Intern
Page 27 GAO/HRD90-134 Factors ln Rural Hospital Closures


Keqwsts for copies of (iA0 report,s should be sent, to:
I1.S. Wwral Accout~tit~g Office Post. Office 130x 60 15 (;aitJwrslmrg, Maryland 20877
‘I’t~lq,hoIlt” 20%27!%;241
‘I’ht~ first five copies of each report are free. Additional copies are 82.00 tVlc11.
There is il 25% discount on orders for 100 or more copies mailed to 8 sitlglth ;itItlrtw.
Ordt~rs must be pwpaitl by cash or by check or money order made out t,o t.ht* SuI)t-‘rint,t~nti~lIt of D0cumt~nt.s.

Of’fic~ial Ihsitwss l’t~tl;~lt y f’or I’rivwt t’ lJsc* !kH~O
First-Class Mail ’ Post,age & Fees Paid i
GAO Permit No. GlOO :