howard assessment dashboard: information fast track · 2018-09-09 · ii overview of the 2015-16...
TRANSCRIPT

AY 2015-16
Howard University
Office of Institutional Assessment & Evaluation (OIAE)
Howard Assessment Dashboard: Information Fast Track

“Working together to cultivate
a culture of evidence-based
decision making…”
Howard Assessment Dashboard
Information Fast Track
Office of Institutional Assessment and Evaluation
(OIAE)
AY 2015-16

OIAE STAFF
Gerunda B. Hughes, Ph.D.
Director and Professor
Michael B. Wallace, Ph.D.
Associate Director
Ruth C. Franks
Administrative Coordinator
Linell D. Edwards, M.A.
Doctoral Intern
Heran Abiye
Post Baccalaureate Intern
Salisa Grant
Graduate Intern
Howard Assessment Dashboard: Information Fast Track Original Design by Peng Yu, Ph.D. (2012)

Howard Assessment Dashboard: Information Fast Track Fall 2016
i
TABLE OF CONTENTS
1. Enrollment, Retention and Graduation Rates ................................................................... 1
Enrollment ................................................................................................................................................. 1
Retention and Graduation ...................................................................................................................... 5
2. Student Learning Outcomes ............................................................................................ 10
Quantitative Reasoning: Spring 2016 ................................................................................................... 10
3. Institutional Surveys ......................................................................................................... 17
National Survey of Student Engagement (NSSE) 2014 and 2015 ....................................................... 17
Faculty Survey of Student Engagement (FSSE) 2014 ................................................................................ 34
Undergraduate Graduating Student Exit Survey 2016 ............................................................................... 39
Graduate and Professional Graduating Student Exit Survey 2016 ..................................................... 51
4. Special Topics ................................................................................................................... 63
Cooperative Institutional Research Program (CIRP) Freshman Survey 2015 and Your First College Year
(YFCY) Survey 2016 ................................................................................................................................ 63
Howard University Alumni Outcomes Assessment Project 2013 .............................................................. 66

ii
Overview of the 2015-16 Edition of the Howard Assessment Dashboard
The Howard University Assessment Dashboard: Information Fast Track, designed by the Office of
Institutional Assessment and Evaluation (OIAE), functions as a highly accessible source of
institutional assessment data and information that are particularly focused on student learning and
other developmental outcomes.
Data used for dashboard indicators are collected from a variety of sources and assessment instruments
and tools. Data are also collected using internally developed instruments such as subject area final
exams, senior comprehensive exams, and graduating student exit surveys. University offices such as
enrollment management, the registrar and financial aid also provide student data and information;
however, the information shared does not violate policies of confidentiality.
Nationally standardized instruments developed by the College Board, the Educational Testing Service
(ETS) and the American College Testing (ACT) Program are used to measure secondary student learning
outcomes. Additionally, commercially developed surveys such as the National Survey of Student Engagement
(NSSE), the Faculty Survey of Student Engagement (FSSE), the Cooperative Institutional Research Program (CIRP)
Freshman Survey and the Your First College Year (YFCY) Survey are administered periodically to measure a
wide range of student educational experiences and related dispositions. Other data are taken from
national databases such as the Integrated Postsecondary Education System (IPEDS) of the National
Center for Education Statistics (NCES).

Enrollment, Retention and Graduation Rates
1
1. Enrollment, Retention and Graduation Rates
It is vital for the University to continually monitor important institutional-level indicators and outcomes.
Defining classes/cohorts of students is important for admissions officers, enrollment management
personnel, administrators, and other key stakeholders as they plan. It is also important to assess and monitor
student academic progress to occur for purposes of improvement and accountability. This section
graphically presents current (AY2015-16) and longitudinal information on student enrollment, retention and
graduation.
Enrollment
67%
(4767)
33%
(2331)
HU Undergraduate Student
Enrollment by Gender, AY2015-16
Female Male
Source: Howard Univ. Registrar; Graph by OIAE
60%
(1952)
40%
(1294)
HU Graduate/Professional Student
Enrollment by Gender, AY2015-16
Female Male
Source: Howard Univ. Registrar; Graph by OIAE

Howard Assessment Dashboard AY 2015-16
2
92% (6514)
3% (179)6% (405)
Howard University Undergraduate Student
Enrollment by Citizenship Status, AY2015-16
United States
Citizens
Permanent
Residents
Non-Resident
Alien
Source: Howard Univ. Registrar; Graph by OIAE
82% (2661)
8% (244)11%
(341)
Howard University Graduate/Professional
Student Enrollment by Citizenship Status,
AY2015-16
United States
Citizens
Permanent
Residents
Non-Resident
Alien
Source: Howard Univ. Registrar; Graph by OIAE

Enrollment, Retention and Graduation Rates
3
65% (6719)
35% (3625)
Howard University Student Enrollment by
Gender (All Levels), AY2015-16
Female
Male
Source: Howard Univ. Registrar; Graph by OIAE
89% (9175)
4% (423)
7% (746)
Howard University Student Enrollment by
Citizenship Status (All Levels), AY2015-16
United States
Citizens
Permanent
Residents
Non-Resident
Alien
Source: Howard Univ. Registrar; Graph by OIAE

Howard Assessment Dashboard AY 2015-16
4
1,520
1,460
1,500
1,603
1,491
1,546
1,394
1594
1479
1676
1,200
1,300
1,400
1,500
1,600
1,700
1,800
2006 2007 2008 2009 2010 2011 2012 2013 2014 2015
Co
ho
rt E
nro
llm
ent
Cohort Year
Howard University First-Time in College Student Enrollment by Cohort
2006 to 2015
Source: Howard Univ. Registrar; Graph by OIAE
492
425
483 507439 461
431464 469
524
1,0281,035 1,017
1,096
1,0521,085
963
1,130
1,010 1,152
0
200
400
600
800
1,000
1,200
1,400
2006 2007 2008 2009 2010 2011 2012 2013 2014 2015
Co
ho
rt E
nro
llm
ent
Cohort Year
Howard University First-Time in College Student Enrollment by Gender
Cohort Year 2006 to 2015
Male FemaleSource: Howard Univ. Registrar; Graph by OIAE

Enrollment, Retention and Graduation Rates
5
Retention and Graduation
83% 85% 83% 83% 81%80%
83%84%
89%
85%
77% 73% 76% 74%70% 74% 74% 76% 74%
70% 69%72%
69%67%
70% 70% 70%
28% 28%24%
30% 27%
48%
53%
20%
30%
40%
50%
60%
70%
80%
90%
100%
2006 2007 2008 2009 2010 2011 2012 2013 2014 2015
Ret
enti
on
Ra
te
Howard University Undergraduate Student Retention Rates
Cohort Year 2006 to 2015
% Continued to 2nd Yr % Continued to 3rd Yr
% Continued to 4th Yr % Continued to 5th Yr
Source: Howard Univ. Registrar; Graph by OIAE
70% 70% 69%72%
69% 67%70% 70% 70%
22%28% 28%
24%30%
27%
48% 53%45% 42%
39%42%
40% 38%
43%46%
0%
20%
40%
60%
80%
100%
2005 2006 2007 2008 2009 2010 2011 2012 2013
Gra
du
ati
on
Ra
te
Howard University Undergraduate Student Graduation Rates
Cohort Year 2005 to 2013
% Continued to 4th Yr % Continued to 5th Yr % Graduated in 4 Yrs
Source: Howard Univ. Registrar; Graph by OIAE

Howard Assessment Dashboard AY 2015-16
6
33%35%
32% 30%28% 28% 28%
37%
29%
55%50%
47%43%
49%45% 43%
46% 47%
0%
20%
40%
60%
80%
100%
2004 2005 2006 2007 2008 2009 2010 2011 2012
4-Y
ear
Gra
duat
ion R
ate
Cohort Year
Howard University Undergraduate 4-Year Graduation Rate by Gender
Cohort Year 2004 to 2012
M
F
Source: Howard Univ. Registrar; Graph by OIAE
62%57% 57%
55%50% 52% 52%
72%
66% 66%63%
65% 64% 62%
0%
20%
40%
60%
80%
100%
2004 2005 2006 2007 2008 2009 2010
6-Y
ear
Gra
duat
ion R
ate
Cohort Year
Howard University Undergraduate 6-Year Graduation Rate by Gender
Cohort Year 2004 to 2010
M
F
Source: Howard Univ. Registrar; Graph by OIAE

Enrollment, Retention and Graduation Rates
7
33%35%
32% 30%28% 28% 28%
37%
29%
57%52% 51%
46% 47% 45%47%
52%
62%57% 57% 55%
50% 52% 52%
0%
20%
40%
60%
80%
100%
2004 2005 2006 2007 2008 2009 2010 2011 2012
Gra
duat
ion R
ate
Cohort Year
Howard University Undergraduate MALE Graduation Rates
Cohort Year 2004 to 2012
4-Yr Grad Rate 5-Yr Grad Rate 6-Yr Grad Rate
Source: Howard Univ. Registrar; Graph by OIAE
55%50%
47%43%
49%45% 43% 46%
47%
69%
63% 63%59% 62% 59% 59% 60%
62%57% 57% 55%
50%
52%52%
0%
20%
40%
60%
80%
100%
2004 2005 2006 2007 2008 2009 2010 2011 2012
Gra
duat
ion R
ate
Cohort Year
Howard University Undergraduate FEMALE Graduation Rates
Cohort Year 2004 to 2012
4-Yr Grad Rate 5-Yr Grad Rate 6-Yr Grad Rate
Source: Howard Univ. Registrar; Graph by OIAE

Howard Assessment Dashboard AY 2015-16
8
Note: Research Extensive institutions have an extensive research program covering many areas at a high level.
91%
63% 63%61% 60%
65% 64% 65% 64% 64%
0%
20%
40%
60%
80%
100%
2004 2005 2006 2007 2008
6-Y
ear
Gra
du
ati
on
Ra
te
Cohort Year
Howard University Graduation Rates-Bachelor Degree within 6 Years and
Mean Rates for Private Not-for-Profit Four-Year or Above Institutions
Howard University Private 4-Year or aboveSource: Howard Univ. Reistrar and IPEDS;Graph by OIAE
91%
63% 63%61% 60%
71% 71% 72% 72%73%
0%
20%
40%
60%
80%
100%
2004 2005 2006 2007 2008
6-Y
ear
Gra
du
ati
on
Ra
te
Cohort Year
Howard University Graduation Rates-Bachelor Degree within 6 Years and
Mean Rates for Research Extensive Universities
Howard University
Research Extensive Universities Source: Howard Uiniv. Registrar and IPEDS;Graph by OIAE

Enrollment, Retention and Graduation Rates
9
Note: Research Intensive means there's a narrowly focused, intensive research program in certain areas.
91%
63% 63%61% 60%54% 55% 55% 56%
57%
0%
20%
40%
60%
80%
100%
2004 2005 2006 2007 2008
6-Y
ear
Gra
du
ati
on
Ra
te
Cohort Year
Howard University Graduation Rates-Bachelor Degree within 6 Years and
Mean Rates for Research Intensive Universities
Howard UniversityResearch Intensive Universities
Source: Howard Univ. Registrar and IPEDS; Graph by OIAE
91%
63% 63% 61% 60%
69% 68% 69% 69% 69%
0%
20%
40%
60%
80%
100%
2004 2005 2006 2007 2008
6-Y
ear
Gra
du
ati
on
Ra
te
Cohort Year
Howard University Graduation Rates-Bachelor Degree within 6 Years and
Mean Rates for Private Not-for-Profit Four-Year or Above Institutions with
Enrollment between 10,000-19,999
Howard UniversityPrivate 4-Year or above Institutions with enrollment between 10,000-19,999
Source: HU Registrar and IPEDS; Graph by OIAE

Student Learning Outcomes Spring 2016 Quantitative Reasoning
10
2. Student Learning Outcomes This section provides data and information on the general education student learning outcome, quantitative
reasoning. Quantitative reasoning was assessed by measuring student performance on departmental final
exams designed and administered by the Department of Mathematics for College Algebra I, College
Algebra II, Pre-Calculus, Calculus I, Applied Calculus, and Introduction to Statistics.
Quantitative Reasoning: Spring 2016
In Spring 2016, the Office of Institutional Assessment and Evaluation (OIAE) requested data on student performance in College Algebra I, College Algebra II, Pre-Calculus, Calculus I, Applied Calculus, and Introduction to Statistics to assess the general education learning outcome, quantitative reasoning (QR). “Competent" performance was defined as earning a competency or final examination score of at least 60%. To aid in the identification of questions that would be used to assess quantitative reasoning, committee chairs were given the general education competencies for quantitative reasoning as defined by the Mathematical Association of America (MAA). Final examination Chairs were asked to identify questions on his or her respective final examination that measured students’ ability to:
• Quantitative Reasoning Competency 1 (QRC1): Interpret mathematical models such as formulas, graphs, tables, and schematics, and draw inferences from them; • Quantitative Reasoning Competency 2 (QRC2): Represent mathematical information
symbolically, visually, numerically, and verbally; • Quantitative Reasoning Competency 3 (QRC3): Use arithmetical, algebraic, geometric
and statistical methods to solve problems; and • Quantitative Reasoning Competency 4 (QRC4): Estimate and check answers to
mathematical problems in order to determine reasonableness, identify alternatives, and select optimal results.
College Algebra I
62%
(N=331)
81%
(N=106)63%
(N=235)
65%
(N=347)
80%
(N=197)
42%
(N=140)
0%
20%
40%
60%
80%
100%
Spring 2011 Spring 2012 Spring 2013 Spring 2014 Fall 2014 Spring 2016
College Algebra I: Instituitonal Results
Percent of Valid Cases Scoring 60% or Higher on
Quantitative Reasoning Competency 3

Howard Assessment Dashboard AY 2015-16
11
For Spring 2016, institutional results for College Algebra I show that 101 of 241 original enrollees withdrew or had no score, and 59 of 241 or 24% of the original enrollees earned a score of 60% or higher on QRC3. Out of the 140 valid cases, 59 or 42% of the students earned a score of 60% or higher on QRC3. Compared to Fall 2014, there was a 48% decrease in student performance on QRC3 for valid cases in Spring 2016.
For Spring 2016, institutional results for College Algebra I show that 101 of 241 original enrollees withdrew or had no score, and 71 of 241 or 29% of the original enrollees earned a score of 60% or higher on the final exam. Out of the 140 valid cases, 71 or 51% of the students earned a score of 60% or higher on the final exam. Compared to Fall 2014, there was a 16% decrease in student performance on the final exam for valid cases in Spring 2016.
College Algebra II
For College Algebra II, student performance on QRC1, QRC2, and QRC3 improved from Fall 2014 to
Spring 2016, with QRC3 showing the largest improvement (i.e., 74% increase).
23%
(N=149)
40%
(N=305)
34%
(N=285)
71%
(N=242)
41%
(N=239)
43%
(N=351)
61%
(N=197) 51%
(N=140)
0%
20%
40%
60%
80%
100%
Spring
2009
Spring
2010
Spring
2011
Spring
2012
Spring
2013
Spring
2014
Fall 2014 Spring
2016
College Algebra I: Instituitonal Results
Percent of Valid Cases Scoring 60% or Higher on the
Final Exam
17%
(N=303)
49%
(N=279)
76%
(N=193)
47%
(N=263)33%
(N=318)
49%
(N=123)
0%
20%
40%
60%
80%
100%
Spring 2009 Spring 2011 Spring 2012 Spring 2013 Spring 2014 Spring 2016
College Algebra II: Instituitonal Results
Percent of Valid Cases Scoring 60% or Higher on the
Final Exam

Student Learning Outcomes Spring 2016 Quantitative Reasoning
12
For Spring 2016, institutional results for College Algebra II show that 58 of 181 original enrollees withdrew or had no score, and 60 of 181 or 33% of the original enrollees earned a score of 60% or higher on the final exam. Out of the 123 valid cases, 60 or 49% of the students earned a score of 60% or higher on the final exam. Compared to Spring 2014, there was a 48% increase in student performance on the final exam for valid cases in Spring 2016.
Pre-Calculus
60%
(N=117)
65%
(N=85)
49%
(N=41)
67%
(N=123)
19%
(N=161)
64%
(N=86)
63%
(N=115)
53%
(N=65)32%
(N=41)
61%
(N=123)
9%
(N=186)
63%
(N=86)
0%
20%
40%
60%
80%
100%
Spring 2011 Spring 2012 Spring 2013 Spring 2014 Fall 2014 Spring 2016
Pre-Calculus: Instituitonal Results
Percent of Valid Cases Scoring 60% or Higher on
Quantitative Reasoning Competencies 2 & 3
QRC2 QRC3

Howard Assessment Dashboard AY 2015-16
13
For Pre-Calculus, student performance on QRC2 and QRC3 improved from Fall 2014 to Spring 2016,
with QRC3 showing the largest improvement (i.e., 600% increase). Performance on QRC3 increased 3%
from Spring 2014 to Spring 2016.
For Spring 2016, institutional results for Pre-Calculus show that 3 of 89 original enrollees withdrew or had
no score, and 46 of 89 or 52% of the original enrollees earned a score of 60% or higher on the final exam.
Out of the 86 valid cases, 46 or 53% of the students earned a score of 60% or higher on the final exam.
Compared to Fall 2014, there was a 140% increase in student performance on the final exam for valid
cases in Spring 2016. Performance on the final exam increased 2% from Spring 2014 to Spring 2016.
56%
(N=135)
25%
(N=87)
58%
(N=117)
60%
(N=149)
24%
(N=59)
52%
(N=124)
22%
(N=186)
53%
(N=86)
0%
20%
40%
60%
80%
100%
Spring
2009
Spring
2010
Spring
2011
Spring
2012
Spring
2013
Spring
2014
Fall 2014 Spring
2016
Pre-Calculus: Instituitonal Results
Percent of Valid Cases Scoring 60% or Higher on the
Final Exam

Student Learning Outcomes Spring 2016 Quantitative Reasoning
14
Calculus I
For Spring 2016, institutional results for Calculus I show that 55 of 96 original enrollees withdrew or had no score, and 21 of 96 or 22% of the original enrollees earned a score of 60% or higher on QRC3. Out of the 41 valid cases, 21 or 51% of the students earned a score of 60% or higher on QRC3. Compared to Fall 2014, there was a 34% decrease in student performance on QRC3 for valid cases in Spring 2016.
For Spring 2016, institutional results for Calculus I show that 15 of 96 original enrollees withdrew or had
no score, and 17 of 96 or 18% of the original enrollees earned a score of 60% or higher on the final exam.
Out of the 81 valid cases, 17 or 21% of the students earned a score of 60% or higher on the final exam.
Compared to Fall 2014, there was a 66% decrease in student performance on the final exam for valid cases
in Spring 2016.
27%
(N=86)
77%
(N=121)
51%
(N=46)
0%
20%
40%
60%
80%
100%
Spring 2014 Fall 2014 Spring 2016
Calculus I: Instituitonal Results
Percent of Valid Cases Scoring 60% or Higher on
Quantitative Reasoning Competency 3
27%
(N=98)
62%
(N=121)
21%
(N=81)
0%
20%
40%
60%
80%
100%
Spring 2014 Fall 2014 Spring 2016
Calculus I: Instituitonal Results
Percent of Valid Cases Scoring 60% or Higher on the
Final Exam

Howard Assessment Dashboard AY 2015-16
15
Applied Calculus
For Applied Calculus, student performance on QRC1 and QRC3 improved from Fall 2014 to Spring 2016, with QRC3 showing the largest improvement (i.e., 40% increase).
For Spring 2016, institutional result for Applied Calculus show that 9 of 57 original enrollees withdrew or
had no score, and 36 of 57 or 63% of the original enrollees earned a score of 60% or higher on the final
exam. Out of the 48 valid cases, 36 or 75% of the students earned a score of 60% or higher on the final
exam. Compared to Fall 2014, there was a 53% increase in student performance on the final exam for valid
cases in Spring 2016.
72%
(N=75)
43%
(N=75)
94%
(N=48)
60%
(N=48)
0%
20%
40%
60%
80%
100%
QRC1 QRC3
Applied Calculus: Instituitonal Results
Percent of Valid Cases Scoring 60% or Higher on
Quantitative Reasoning Competencies 1 & 3
Fall 2014 Spring 2016
59%
(N=140) 49%
(N=75)
75%
(N=48)
0%
20%
40%
60%
80%
100%
Spring 2014 Fall 2014 Spring 2016
Applied Calculus: Instituitonal Results
Percent of Valid Cases Scoring 60% or Higher on the
Final Exam

Student Learning Outcomes Spring 2016 Quantitative Reasoning
16
Introduction to Statistics
The Office of Institutional Assessment and Evaluation (OIAE) assessed student performance in
Introduction to Statistics for the first time in Spring 2016. Of the four quantitative reasoning competencies,
students performed better on QRC4 than on any of the other competencies. However, no student (0%)
scored 60% or higher on any of the items that competency QRC2 assessed. Originally, there were 35
students enrolled in the course; however, 2 students withdrew from the course or had no score resulting in
N=33 valid cases in the analysis. Of the 33 valid cases, 25 or 76% of the students earned a score of 60%
or higher on the final exam. Additionally, of the 35 original enrollees, 25 or 71% earned a score of 60% or
higher on the final e xam.
79%
(N=33)
0%
(N=33)
67%
(N=33)
82%
(N=33) 76%
(N=33)
0%
20%
40%
60%
80%
100%
QRC1 QRC2 QRC3 QRC4 Final Exam
Introduction to Statistics: Instituitonal Results
Percent of Valid Cases Scoring 60% or Higher on
Quantitative Reasoning Competencies 1-4 and the Final Exam

Institutional Surveys NSSE 2014-2015
17
3. Institutional Surveys
Opinions and perceptions matter. How satisfied are the stakeholders? Surveys of Howard stakeholders
provide information on their views of various university issues and conditions. The results of the surveys
also provide valuable feedback for an array of university units and information that can inform further
operational, administrative, instructional and policy improvements. We have selected a few items from each
survey and presented the results here. [Note: All survey results have limitations that particularly relate to
sampling and response rates. Some results herein should be interpreted with caution. Standard error
information is provided.] For more results, refer to the corresponding report for certain surveys that can be
found on the OIAE website: http://assessment.howard.edu. Other information can be requested.
National Survey of Student Engagement (NSSE) 2014 and 2015
The National Survey of Student Engagement (NSSE) collects information annually from samples of first-year and
senior students about the nature and quality of their undergraduate experience. Since its inception, more
than 1,000 institutions have used NSSE to measure the extent to which students engage in effective
educational practices that are empirically linked with learning, personal development and other desired
outcomes such as student satisfaction, persistence and graduation. NSSE Engagement Indicators are
summary measures based on sets of items (subscales) examining key dimensions of student engagement.
The ten indicators (bulleted below) are organized within four themes as follows:
Theme: Academic Challenge (AC):
Higher Order Learning
Reflective and Integrative Learning
Learning Strategies
Quantitative Reasoning
Theme: Learning with Peers (LWP):
Collaborative Learning
Discussions with Diverse Others
Theme: Experiences with Faculty (EWF):
Student Faculty Interaction
Effective Teaching Practices
Theme: Campus Environment:
Quality of Interactions
Supportive Environment

Howard Assessment Dashboard AY 2015-16
18
0
20
40
60
Higher OrderLearning
Reflective &Integrative Learning
Learning Strategies QuantitativeReasoning
39.6 39.842
25.5
39.7
36.038.9
28.2
Me
an
NSSE - Academic Challenge Theme: 2014-2015 Engagement Indicator Mean Comparisons
for First-Year Students
2014 2015 Source: NSSE 2014-2015Howard Univ. OIAE
In both years, first-year students report higher mean EI scores in Learning
Strategies than in any other areas, with a decline from 2014 to 2015. Mean
Engagement Indicator scores in Quantitative Reasoning are below the
median (30) and lowest among the areas, but with an increase from 2014-
2015. Quantitative Reasoning is of particular concern.
• Number of NSSE respondents: AY 2014 total of 595 with an overall response rate of 19%. AY 2014 First-year 310 (response rate 18% with Standard Error of +/-5%), Seniors 285 (response rate 19% with Standard Error of +/-5%); AY 2015 total of 475. AY 2015 First-year 235 (response rate 14% with Standard Error of +/-6%), Seniors 240 (response rate 16% with Standard Error of +/-5%).
• In the figures that follow, Howard University mean student scores on each Engagement Indicator (EI) are compared across academic years 2014-2015.
• Each EI is scored on a 60-point scale. A score of 60 indicates that student responses
are at the top of the scale on every survey item of a particular EI. For more information,
refer to NSSE website: www.nsse.iub.edu.

Institutional Surveys NSSE 2014-2015
19
0
20
40
60
Higher OrderLearning
Reflective &Integrative Learning
Learning Strategies QuantitativeReasoning
39.3 40.3 39.2
28.8
41.739.0
39.7
28.9
Me
an
NSSE Academic Challenge Theme: 2014-2015Engagement Indicator Mean Comparisons
for Senior Students
2014 2015 Source: NSSE 2014-2015Howard Univ. OIAE
Engagement Indicator Scores in each EI area are very consistent across years.
Mean Engagement Indicator scores in Quantitative Reasoning are lowest
among the areas and remained constant from 2014 to 2015. There is a
notable difference in mean EI scores across years in the area of Discussions
with Diverse Others.

Howard Assessment Dashboard AY 2015-16
20
0
20
40
60
Collaborative Learning Discussions with Diverse Others
36.4 37.5
32.0
40.7
Me
an
NSSE - Learning with Peers Theme: 2014-2015 Engagement Indicator Mean Comparisons
for First-Year Students
2014 2015Source: NSSE 2014-2015Howard Univ. OIAE

Institutional Surveys NSSE 2014-2015
21
0
20
40
60
Collaborative learning Discussions with Diverse Others
36.2 35.334.1
42.0
Me
anNSSE - Learning with Peers Theme: 2014-2015
Engagement Indicator Mean Comparisons for Senior Students
2014 2015 Source: NSSE 2014-2015Howard Univ. OIAE
0
20
40
60
Student-Faculty Interaction Effective Teaching Practices
21.8
32.5
22.8
39.8
Me
an
NSSE - Experiences with Faculty Theme: 2014-2015 Engagement Indicator Mean Comparisons
for First-Year Students
2014 2015 Source: NSSE 2014-2015Howard Univ. OIAE

Howard Assessment Dashboard AY 2015-16
22
0
20
40
60
Student-Faculty Interaction Effective Teaching Practices
26.5
35.3
26.3
39.8
Me
anNSSE - Experiences with Faculty Theme: 2014-2015
Enagagement Indicator Mean Comparisons for Senior Students
2014 2015 Source: NSSE 2014-2015Howard Univ. OIAE
0
20
40
60
Quality of Interactions Supportive Environment
33.7 33.6
40.636.7M
ean
NSSE - Campus Environment Theme: 2014-2015Engagement Indicator Mean Comparisons
for First-Year Students
2014 2015 Source: NSSE 2014-2015Howard Univ. OIAE

Institutional Surveys NSSE 2014-2015
23
The following graphs focus on selected Engagement Indicators allowing for comparisons among
first-year students and seniors across survey years.
0
20
40
60
Quality of Interactions Supportive Environment
34.429.9
40.4
33.6Me
an
NSSE - Campus Environment Theme: 2014-2015Engagement Indicator Mean Comparisons
for Senior Students
2014 2015Source: NSSE 2014-2015Howard Univ. OIAE
0
10
20
30
40
50
60
First-Year Senior
39.6 39.339.741.7
Me
an
NSSE 2014-2015 Indicator: Level of Higher Order Learning
Mean Comparisons for First-Year and Senior Students
2014 2015 Source: NSSE 2014-2015Howard Univ. OIAE

Howard Assessment Dashboard AY 2015-16
24
0
10
20
30
40
50
60
First-Year Senior
39.8 40.3
36.039.0
Me
anNSSE 2014-2015
Indicator: Level of Reflective & Integrative Learning Mean Comparisons for First-Year and Senior Students
2014 2015 Source: NSSE 2014-2015Howard Univ. OIAE
0
10
20
30
40
50
60
First-Year Senior
4239.238.9 39.7
Me
an
NSSE 2014-2015Indicator: Learning Strategies
Mean Comparisons for First-Year and Senior Students
2014 2015 Source: NSSE 2014-2015Howard Univ. OIAE
Across both years,
first-year students
report higher mean
Engagement scores on
Supportive
Environment than do
seniors.
For each group, scores
increased from 2014
to 2015.

Institutional Surveys NSSE 2014-2015
25
0
10
20
30
40
50
60
First-Year Senior
25.528.828.2 28.9
Me
anNSSE 2014-2015
Indicator: Quantitative ReasoningMean Comparisons for First-Year and Senior Students
2014 2015 Source: NSSE 2014-2015Howard Univ. OIAE
0
10
20
30
40
50
60
First-Year Senior
36.4 36.232.0
34.1
Me
an
NSSE 2014-2015Indicator: Collaborative Learning
Mean Comparisons for First-Year and Senior Students
2014 2015 Source: NSSE 2014-2015Howard Univ. OIAE

Howard Assessment Dashboard AY 2015-16
26
0
10
20
30
40
50
60
First-Year Senior
37.535.3
40.7 42.0
Me
anNSSE 2014-2015
Indicator: Discussions with Diverse Others Mean Comparisons for First-Year and Senior Students
2014 2015 Source: NSSE 2014-2015Howard Univ. OIAE
0
10
20
30
40
50
60
First-Year Senior
21.8
26.522.8
26.3
Me
an
NSSE 2014-2015Indicator: Student-Faculty Interaction
Mean Comparisons for First-Year and Senior Students
2014 2015 Source: NSSE 2014-2015Howard Univ. OIAE

Institutional Surveys NSSE 2014-2015
27
0
10
20
30
40
50
60
First-Year Senior
32.535.3
39.8 39.8
Me
an
NSSE 2014-2015Indicator: Effective Teaching Practices
Mean Comparisons for First-Year and Senior Students
2014 2015 Source: NSSE 2014-2015Howard Univ. OIAE
0
10
20
30
40
50
60
First-Year Senior
33.7 34.4
40.6 40.4
Me
an
NSSE 2014-2015Indicator: Quality Interactions
Mean Comparisons for First-Year and Senior Students
2014 2015 Source: NSSE 2014-2015Howard Univ. OIAE

Howard Assessment Dashboard AY 2015-16
28
0
10
20
30
40
50
60
First-Year Senior
33.629.9
36.733.6
Me
an
NSSE 2014-2015Indicator: Supportive Environment
Mean Comparisons for First-Year and Senior Students
2014 2015 Source: NSSE 2014-2015Howard Univ. OIAE
Descriptions of Comparison Groups found in the following figures:
Aspirants are exemplar institutions identified by Howard Senior Administration, or similar participating institutions in 2014, including American U., Boston U., Tulane U., UMBC, Georgia Institute of Technology, and NYU Polytechnic Institute.
HBCUs are those six such institutions participating in 2014, including Delaware State U., Dillard U., Fisk U., North Carolina Central U., Tennessee State U. and Univ. of Maryland Eastern Shore.

Institutional Surveys NSSE 2014-2015
29
Note: Percentages in this figure represent those responding that the emphasis was “very much” or “quite a bit.”
Note: Percentages in this figure represent those responding that the emphasis was “very much” or “quite a bit.”
0%
10%
20%
30%
40%
50%
60%
70%
80%
90%
100%
Howard Aspirants HBCUs
71%79%
69%
Pe
rce
nta
ge
Comparison Groups
Percentages of First-year Students Who SayCourses Emphasized Applying Facts,
Theories, Methods to Problems
Source: NSSE 2014Howard Univ. OIAEHoward N=274
0%
10%
20%
30%
40%
50%
60%
70%
80%
90%
100%
Howard Aspirants HBCUs
71%
81% 84%
Pe
rce
nta
ge
Comparison Groups
Percentages of Seniors Who SayCourses Emphasized Applying Facts,
Theories, Methods to Problems
Source: NSSE 2014Howard Univ. OIAE
Howard N=255

Howard Assessment Dashboard AY 2015-16
30
0%
10%
20%
30%
40%
50%
60%
70%
80%
Howard Aspirants HBCUs
49%53% 52%
Pe
rce
nta
ge
Comparison Groups
Percentages of First-year Students Who Say They Were Often Required to Reach Conclusions from Numerical Analyses
Source: NSSE 2014Howard Univ. OIAEHoward N=272
0%
10%
20%
30%
40%
50%
60%
70%
80%
90%
100%
Howard Aspirants HBCUs
58% 59% 62%
Pe
rce
nta
ge
Comparison Groups
Percentages of Seniors Who Say They Were Often Required to Reach Conclusions from Numerical Analyses
Source: NSSE 2014Howard Univ. OIAEHoward N=254

Institutional Surveys NSSE 2014-2015
31
0%
10%
20%
30%
40%
50%
60%
Howard Aspirants HBCUs
36%41% 40%
Pe
rce
nta
ge
Comparison Groups
Percentages of First-year Students Who Say They Were Often Required to Evaluate Conclusions of Others Based on Numerical Information
Source: NSSE 2014Howard Univ. OIAEHoward N=267
0%
10%
20%
30%
40%
50%
60%
70%
80%
90%
100%
Howard Aspirants HBCUs
40%
51% 52%
Pe
rcn
eta
ge
Comparison Groups
Percentages of Seniors Who Say They Were Often Required to Evaluate Conclusions of Others Based on Numerical Information
Source: NSSE 2014Howard Univ. OIAEHoward N=253

Howard Assessment Dashboard AY 2015-16
32
Note: Percentages in this figure represent those responding that the emphasis was “very much” or “quite a bit.
Note: Percentages in this figure represent those responding that the emphasis was “very much” or “quite a bit.
0%
10%
20%
30%
40%
50%
60%
70%
80%
90%
100%
Howard Aspirants HBCUs
58%
81%
71%
Pe
rce
nta
ge
Comparison Groups
Percentages of First-year Students Who Saythe Institution Emphasized Providing Academic Support
Source: NSSE 2014Howard Univ. OIAE
Howard N=221
0%
10%
20%
30%
40%
50%
60%
70%
80%
90%
100%
Howard Aspirants HBCUs
46%
70% 68%
Pe
rce
nta
ge
Comparison Groups
Percentages of Seniors Who Say the Institution Emphasized Providing Academic Support
Source: NSSE 2014Howard Univ. OIAE
Howard N=222

Institutional Surveys NSSE 2014-2015
33
Note: Percentages in this figure represent those responding that the emphasis was “very much” or “quite a bit.
Note: Percentages in this figure represent those responding that the emphasis was “very much” or “quite a bit”.
0%
10%
20%
30%
40%
50%
60%
70%
80%
90%
100%
Howard Aspirants HBCUs
55%
80%74%
Pe
rce
nta
ge
Comparison Groups
Percentages of First-year Students Who Say the Institution Emphasized Student Use of Learning Supports
Source: NSSE 2014Howard Univ. OIAE
Howard N=222
0%
10%
20%
30%
40%
50%
60%
70%
80%
90%
100%
Howard Aspirants HBCUs
41%
67%63%
Pe
rce
nta
ge
Comparison Groups
Percentages of Seniors Who Say the Institution Emphasized Student Use of Learning Supports
Source: NSSE2014Howard Univ. OIAEHoward N=219

Institutional Surveys FSSE 2014-2015
34
Faculty Survey of Student Engagement (FSSE) 2014
The Faculty Survey of Student Engagement (FSSE) complements the National Survey of Student Engagement (NSSE).
FSSE measures faculty members’ expectations of student engagement in educational practices. It also
collects information about how faculty members spend their time on professorial activities, such as teaching
and scholarship, and the types of learning experiences their institutions emphasize. In 2014, six hundred
fifty-three (653) lower and upper division Howard faculty members who only taught undergraduate students
were invited to participate in the FSSE and 159 faculty members responded by fully completing the survey,
a response rate of 27%. Sampling Error (+/- 6%).
Percentage of Howard Faculty Reporting Coursework Substantially Emphasizes the Following Higher-order Learning Skills, and Percentage of Howard Students Reporting Amount Their Coursework has Emphasized Each Skill
FSSE 2014 Item Class
Faculty Responding Very Much or
Quite a Bit
Faculty
N
Students Responding
Very Much or Quite a Bit
Student
N
Applying facts, theories, or methods to practical problems or new situations
LD* 86% 56 71% 274
UD* 94% 94 71% 255
Analyzing an idea, experience, or line of reasoning in depth by examining its parts
LD 80% 55 73% 273
UD 87% 93 73% 254
Evaluating a point of view, decision, or information source
LD 71% 55 73% 272
UD 82% 94 66% 252
Forming a new idea or understanding from various pieces of information
LD 69% 55 70% 266
UD 82% 93 67% 252
*Note: LD is Lower Division and UD is Upper Division Source: NSSE, FSSE 2014 (Howard Univ. OIAE)
*Lower Division (LD) courses are taken mostly by first-year and sophomore students. Upper Division (UD) courses are taken mostly by junior and senior students.

Howard Assessment Dashboard AY 2015-16
35
0
10
20
30
40
50
60
70
80
90
100
Lower Division Upper Division
8694
71 71
Pe
rce
nta
gePercentages of Faculty Who Report Emphasizing, and Students Who
Report: Applying facts, theories or methods to practical problems
Faculty on FSSE Students on NSSESource: NSSE, FSSE 2014 Howard Univ. OIAE
0
10
20
30
40
50
60
70
80
90
100
Lower Division Upper Division
79
93
60
71
Pe
rce
nta
ge
Percentages of Faculty Who Report Emphasizing, and Students Who Report: Combining Ideas from Different Courses When Completing
Assignments
Faculty on FSSE Students on NSSE Source: NSSE, FSSE 2014 Howard Univ. OIAE

Institutional Surveys FSSE 2014-2015
36
0
10
20
30
40
50
60
70
80
90
Lower Division Upper Division
84 85
67 66
Pe
rce
nta
gePercentages of Faculty Who Report Emphasizing, and Students Who
Report: Summarizing Learning from Class or Course Materials
Faculty on FSSE Students on NSSE
Source: NSSE, FSSE 2014 Howard Univ. OIAE
0
20
40
60
80
100
Lower Division Upper Division
93 95
72 70
Pe
rce
nta
ge
Percentages of Faculty Who Report the Importance that Howard Increase Emphasis on Students Spending Significant Amounts of Time Studying,
and of Students Reporting Perception of that Emphasis
Faculty on FSSE Students on NSSE Source: NSSE, FSSE 2014 Howard Univ. OIAE

Howard Assessment Dashboard AY 2015-16
37
0
10
20
30
40
50
60
70
Lower Division Upper Division
61
69
56
48
Pe
rce
nta
ge
Percentages of Faculty Encouraging, and Students Reporting: Asking Other Students for Help in Understanding Course Material
Faculty on FSSE Students on NSSE
Source: NSSE, FSSE 2014 Howard Univ. OIAE
0
10
20
30
40
50
60
70
80
90
100
Lower Division Upper Division
9092
37 39
Pe
rce
nta
ge
Percentage of Faculty and Students Reporting that They Have Discussed the Students' Academic Performance During AY 2014
Faculty on FSSE Students on NSSESource: NSSE, FSSE 2014 Howard Univ. OIAE

Institutional Surveys FSSE 2014-2015
38
*Note: Support defined as recreation, health care, counseling, etc. (Student Affairs Areas)
0
10
20
30
40
50
60
70
80
90
Lower Division Upper Division
87 89
4643
Pe
rce
nta
ge
Percentage of Faculty Reporting Importance of Institutional Emphasis on Providing Support* for Students' Overall Well-being
and Students Reporting Such
Faculty on FSSE Students on NSSESource: NSSE, FSSE 2014 Howard Univ. OIAE
In 2014, within the
Lower Division, 58% of
faculty respondents
were male, and 35%
were female. In the
Upper Division, 56% of
faculty respondents
were male, and 36%
were female.
In 2014, within the
Lower Division, 74%
of faculty respondents
hold Doctoral degrees
and 24% hold
Master’s degrees. In
the Upper Division,
75% of faculty
respondents hold
Doctoral degrees and
17% hold Master’s.
degrees

Institutional Surveys Undergraduate Exit Survey 2016
39
Undergraduate Graduating Student Exit Survey 2016
The 2012 Howard University Undergraduate Graduating Student Exit Survey (GSES) is administered annually to
prospective candidates for graduation who are enrolled in all of the University’s undergraduate programs.
The primary purpose of the survey is twofold: (1) to obtain information about students’ satisfaction with a
range of academic and co-academic experiences during their matriculation at the University, and (2) to
inquire about their plans for the future. The survey is administered by the Office of Institutional Assessment
and Evaluation (OIAE) through a web-based format with the assistance and cooperation of key staff in the
various schools and colleges. In 2016, there were 1,259 respondents to the Undergraduate GSES.
27% (333)
73% (890)
Howard Undergraduate GSES Respondents by Gender
Male Female
Source: HU Undergraduate Exit Survey 2016, OIAE
94% (1611)
6% (67)
Howard Undergraduate GSES Respondents by Citizenship
Status
U.S. Citizen Non U.S. Citizen
Source: HU Undergraduate Exit Survey 2016, OIAE

Howard Assessment Dashboard AY 2015-16
40
Note: First Generation students are defined as those whose parents do not hold a baccalaureate degree.
82% (1003)
18% (222)
Howard Undergraduate GSES Respondents by Student Status
First Time in College Student Transfer Student
Source: HU Undergraduate Exit Survey 2016, OIAE
32% (391)
76% (828)
1% (17)
Howard Undergraduate GSES Respondents by First Generation
Status
First Generation College Student (in your family)Not First Generation College StudentNot Sure
Source: HU Undergraduate Exit Survey 2016, OIAE
99% (1209)
1% (17)
Howard Undergraduate GSES Respondents by Enrollment Status
Full-time Part-time
Source: HU Undergraduate Exit Survey 2016, OIAE
39% (437)
53% (600)
7% (84)
Would Undergraduate GSES Respondents Recommend Howard
to a prospective student?
Yes, without reservation Yes, with reservation
Source: HU Undergraduate Exit Survey 2016, OIAE
The pie charts provide key demographic information on the survey respondents. Included in
these charts are gender, citizenship status, first-time student status, first-generation status, and
full-time and part-time status. A chart reporting whether or not the respondents would
recommend Howard to a prospective student is included.
Institutional Surveys Undergraduate Exit Survey 2016
41
12%
60%
5%
23%
0%
20%
40%
60%
80%
100%
Full-time OffCampus
Part-time OffCampus
Full-time OnCampus
Part-time OnCampus
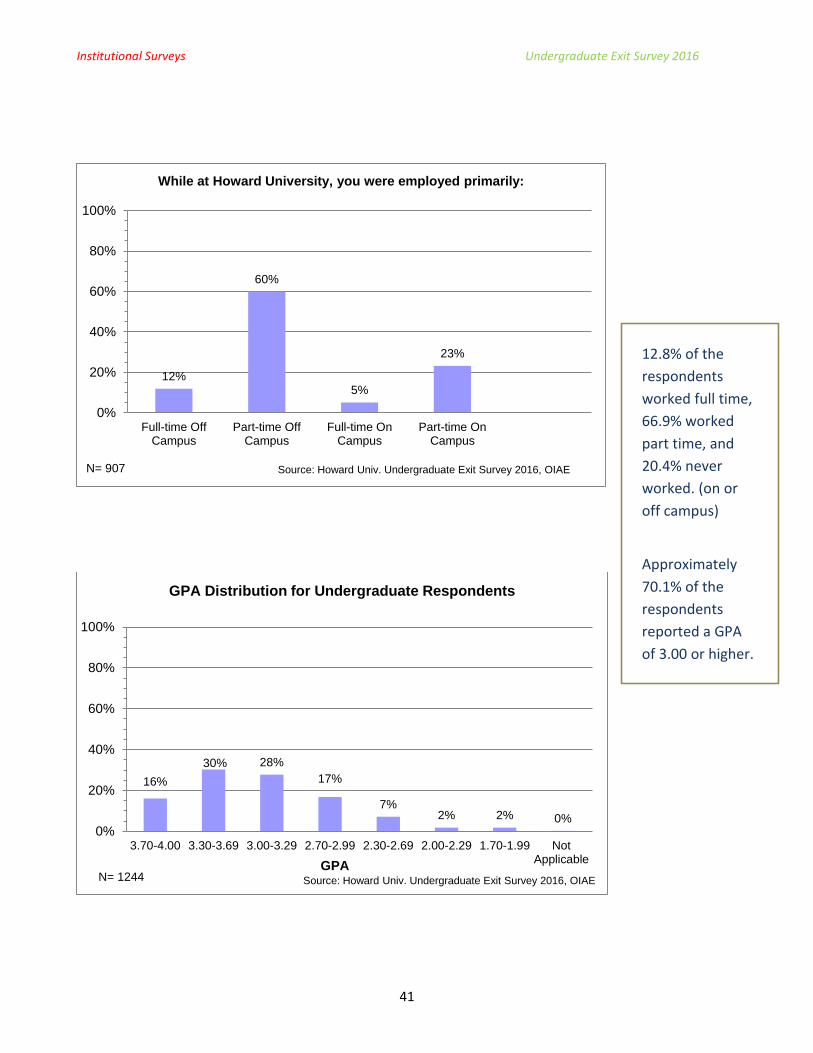
While at Howard University, you were employed primarily:
N= 907 Source: Howard Univ. Undergraduate Exit Survey 2016, OIAE
16%
30% 28%
17%
7%2% 2% 0%
0%
20%
40%
60%
80%
100%
3.70-4.00 3.30-3.69 3.00-3.29 2.70-2.99 2.30-2.69 2.00-2.29 1.70-1.99 NotApplicable
GPA
GPA Distribution for Undergraduate Respondents
N= 1244 Source: Howard Univ. Undergraduate Exit Survey 2016, OIAE
12.8% of the
respondents
worked full time,
66.9% worked
part time, and
20.4% never
worked. (on or
off campus)
Approximately
70.1% of the
respondents
reported a GPA
of 3.00 or higher.

Howard Assessment Dashboard AY 2015-16
42
49%
20%
4%
18%10%
0%
20%
40%
60%
80%
100%
MakingFinancial
Contributions
Recruiting NewStudents
Fundraising Volunteering Other
Please indicate the primary way you plan to give back to Howard as an alumna/alumnus
N= 862 Source: Howard Univ. Undergraduate Exit Survey 2016, OIAE
19%
65%
13%2%
1% 0%0%
20%
40%
60%
80%
100%
Very Satisfied Satisfied Dissatisfied VeryDissatisfied
Don't Know N/A
Rate the level of satisfaction with: Overall Quality of the Educational Experience
N= 1206 Source: Howard Univ. Undergraduate Exit Survey 2016, OIAE

Institutional Surveys Undergraduate Exit Survey 2016
43
15%
43%
23% 17%
2% 0%0%
20%
40%
60%
80%
100%
VerySatisfied
Satisfied Dissatisfied VeryDissatisfied
Don't Know N/A
Rate the level of satisfaction with: Customer Service in Administrative Offices of
Your School or College
N= 1204 Source: Howard Univ. Undergraduate Exit Survey 2016, OIAE
21%
60%
12%5%
1% 1%0%
20%
40%
60%
80%
100%
VerySatisfied
Satisfied Dissatisfied VeryDissatisfied
Don't Know N/A
Rate the level of satisfaction with: Faculty Professionalism
N= 1203 Source: Howard Univ. Undergraduate Exit Survey 2016, OIAE

Howard Assessment Dashboard AY 2015-16
44
22%
64%
11%
2% 1% 0%0%
20%
40%
60%
80%
100%
VerySatisfied
Satisfied Dissatisfied VeryDissatisfied
Don't Know N/A
Rate the level of satisfaction with: Level of Intellectual Stimulation in Courses
N= 1192 Source: Howard Univ. Undergraduate Exit Survey 2016, OIAE
16%
51%
18%11%
3% 2%
0%
20%
40%
60%
80%
100%
VerySatisfied
Satisfied Dissatisfied VeryDissatisfied
Don't Know N/A
Rate the level of satisfaction with: Your Preparation for Employment in Your Major
N= 1142 Source: Howard Univ. Undergraduate Exit Survey 2016, OIAE

Institutional Surveys Undergraduate Exit Survey 2016
45
Rate the level of satisfaction with the following Knowledge and Skill Development: (N =1182)
Item Very
Satisfied Satisfied Dissatisfied
Very Dissatisfied
Don't Know
N/A *Rank
(%Satisfied)
Ability to demonstrate leadership 46% 49% 3% 1% 1% 1% 95%
Knowledge of ethics 42% 52% 3% 1% 1% 1% 94%
Knowledge of African American
culture 45% 49% 4% 1% 1% 1% 93%
Development of critical thinking
and analysis skills 35% 58% 5% 1% 1% 1% 93%
Team work skill development 34% 58% 5% 1% 1% 1% 92%
Development of interpersonal
skills 38% 54% 5% 1% 1% 1% 92%
Development of life skills (e.g.,
prioritization, time management,
etc.)
39% 52% 7% 2% 0% 1% 91%
Training in oral communication 35% 56% 6% 2% 1% 1% 91%
Training in written
communication 33% 57% 7% 1% 1% 1% 90%
Knowledge of the humanities
(languages, history, philosophy,
literature, arts)
28% 61% 7% 2% 1% 2% 89%
Knowledge of the social
sciences 27% 61% 6% 2% 2% 3% 87%
12%
45%
25%
10%6% 3%
0%
20%
40%
60%
80%
100%
VerySatisfied
Satisfied Dissatisfied VeryDissatisfied
Don't Know N/A
Rate the level of satisfaction with: Access to Mentoring
N= 1194 Source: Howard Univ. Undergraduate Exit Survey 2016, OIAE

Howard Assessment Dashboard AY 2015-16
46
Rate the level of satisfaction with the following Knowledge and Skill Development: (N=1153)
Item Very
Satisfied Satisfied Dissatisfied
Very Dissatisfied
Don't Know
N/A *Rank
(%Satisfied)
Knowledge of African culture 36% 52% 8% 2% 1% 2% 87%
Knowledge of American Culture 24% 63% 6% 2% 2% 4% 87%
Multicultural knowledge 30% 56% 8% 2% 2% 2% 86%
Research skill development 29% 56% 10% 2% 2% 2% 84%
Knowledge of contributions of
the African Diaspora to your
major field of study
36% 47% 10% 2% 3% 2% 83%
Information literacy skills
development 24% 58% 11% 3% 2% 3% 82%
Knowledge about personal
health and nutrition 21% 60% 12% 3% 2% 3% 81%
Knowledge of global policies and
issues 24% 57% 12% 3% 2% 3% 81%
Knowledge of the physical
sciences 20% 54% 12% 3% 4% 7% 74%
Training in computer applications 16% 54% 19% 4% 2% 6% 70%
Knowledge of mathematics 14% 55% 18% 9% 1% 3% 69%
Source: 2016 Undergraduate Graduating Student Exit Survey, OIAE
3%
22% 26%
42%
2%5%
0%
20%
40%
60%
80%
100%
VerySatisfied
Satisfied Dissatisfied VeryDissatisfied
Don't Know N/A
Rate the level of satisfaction with: Overall Living Conditions in Residence Halls
N= 1161 Source: Howard Univ. Undergraduate Exit Survey 2016, OIAE

Institutional Surveys Undergraduate Exit Survey 2016
47
11%
59%
20%
9%
1% 1%
0%
20%
40%
60%
80%
100%
VerySatisfied
Satisfied Dissatisfied VeryDissatisfied
Don't Know N/A
Rate the level of satisfaction with: iLab and Campus Computer Laboratories
N= 1166 Source: Howard Univ. Undergraduate Exit Survey 2016, OIAE
5%
51%
28%
15%
1% 1%
0%
20%
40%
60%
80%
100%
VerySatisfied
Satisfied Dissatisfied VeryDissatisfied
Don't Know N/A
Rate the level of satisfaction with: Condition of University Libraries
N= 1161 Source: Howard Univ. Undergraduate Exit Survey 2016, OIAE

Howard Assessment Dashboard AY 2015-16
48
6%
34%25%
31%
3% 1%
0%
20%
40%
60%
80%
100%
VerySatisfied
Satisfied Dissatisfied VeryDissatisfied
Don't Know N/A
Rate the level of satisfaction with: Graduation Clearance Process
N= 1143 Source: Howard Univ. Undergraduate Exit Survey 2016, OIAE
9%
47%
23%
11%6% 3%
0%
20%
40%
60%
80%
100%
VerySatisfied
Satisfied Dissatisfied VeryDissatisfied
Don't Know N/A
Rate the level of satisfaction with: Provision of or Access to Institutional Assessment
Information (e.g., survey results, etc.)
N= 1206 Source: Howard Univ. Undergraduate Exit Survey 2016, OIAE

Institutional Surveys Undergraduate Exit Survey 2016
49
Rate the level of satisfaction with the following Student Support Offices: (N=1161)
Very
Satisfied Satisfied Dissatisfied
Very Dissatisfied
Don't Know N/A *Rank
(%Satisfied)
University Libraries 10% 64% 10% 9% 5% 3% 74%
Office of Admissions 9% 52% 12% 12% 11% 4% 62%
Office of Student Services 8% 47% 13% 12% 16% 6% 55%
Office of the Registrar 6% 47% 19% 13% 11% 4% 53%
Department of Student Life
and Activities 6% 46% 15% 16% 12% 5% 53%
HU Office of Career
Services 10% 41% 9% 8% 22% 10% 51%
Student Health Service
Center 7% 44% 25% 18% 4% 3% 51%
Campus Security 6% 43% 21% 19% 8% 4% 48%
Office of Student Accounts 5% 39% 24% 27% 4% 2% 44%
Office of Career Services in
your school or college 8% 35% 10% 9% 26% 12% 43%
Source: 2016 Undergraduate Graduating Student Exit Survey, OIAE
3%
29%
41%
27%
1% 0%0%
20%
40%
60%
80%
100%
VerySatisfied
Satisfied Dissatisfied VeryDissatisfied
Don't Know N/A
Rate the level of satisfaction with: Overall Condition of University Buildings
N= 1161Source: Howard Univ. Undergraduate Exit Survey 2016, OIAE

Howard Assessment Dashboard AY 2015-16
50
Rate the level of satisfaction with the following Student Support Offices: (N=1161)
Very
Satisfied Satisfied Dissatisfied
Very Dissatisfied
Don't Know N/A *Rank
(%Satisfied)
Office of Enrollment
Management 5% 36% 14% 15% 20% 10% 41%
University Counseling
Service 9% 31% 12% 11% 25% 13% 40%
Office of Residence Life 5% 35% 24% 24% 5% 7% 40%
Office of Student Financial
Services (Other than Office
of Financial Aid)
4% 29% 26% 30% 7% 4% 33%
HU Office of International
Student Services 5% 25% 7% 7% 33% 24% 30%
HU Office of Financial Aid 4% 23% 31% 38% 3% 2% 27%
Source: 2016 Undergraduate Graduating Student Exit Survey, OIAE
The table above shows the levels of overall student satisfaction with the student support offices. The
offices are listed in descending order based on their satisfaction ratings which are the combined
percentages of respondents who were “Very Satisfied” or “Satisfied.”. Due to large amounts of
respondents who selected “Don’t Know” or “N/A” regarding some of the offices, it may be best to
consider results which exclude those respondents. *Therefore, rankings of the units and satisfaction
percentages are listed in the last column of the table. These percentages were calculated having made
that adjustment. The percentages of satisfaction ratings computed are listed in the parentheses.

Institutional Surveys Graduate/Professional Exit Survey 2016
51
Graduate and Professional Graduating Student Exit Survey 2016
The Howard University Graduate and Professional Graduating Student Exit Survey (GSES) is administered annually
to prospective candidates for graduation enrolled in all graduate/professional programs. The primary
purpose of the survey is to obtain information about students’ satisfaction with a range of academic and co-
academic experiences during their matriculation and to inquire about their plans for the future. The survey
was administered by the Office of Institutional Assessment and Evaluation (OIAE) through a web-based
format. In 2016, there were 660 respondents. More detailed information can be obtained from the Howard
2016 Graduate/Professional Graduating Student Exit Survey Report (HU-OIAE, 2016).
Note: First Generation refers to those students whose parents do not hold a baccalaureate degree
36%, (203)
64% (358)
Howard Graduate/Professional GSES Respondents by Gender
Male Female
Source: Graduate/Professional Exit Survey 2016, OIAE
88% (497)
12% (65)
Howard Graduate/Professional GSES Respondents by Citizenship Status
U.S. Citizen Non U.S. Citizen
Source: Graduate/Professional Exit Survey 2016, OIAE
57.3% (322)
33% (186)
3% (17)
7% (37)
Howard Grad/Professional GSES Respondents by Student Status
First Time Graduate StudentFirst Time Professional StudentTransfer StudentOther
Source: Graduate/Professional Exit Survey 2016, OIAE
47% (266)53%
(296)
Howard Grad/Professional GSES Respondents by First Generation Status
First Generation Not First Generation
Source: Graduate/Professional Exit Survey 2016, OIAE

Howard Assessment Dashboard AY 2015-16
52
94% (527)
6% (33)
Howard Grad/Professional GSES Respondents by Enrollment Status
Full-time Part-time
Source: Graduate/Professional Exist Survey 2016, OIAE
40% (226)
34% (190)
23% (129)
3% (15) <1% (1)
Howard Grad/Professional GSES Respondents by Degree Goal
Master's Degree Doctoral Degree
Professional Degree Dual Degree
Certificate
Source: Graduate/Professional Exist Survey 2016, OIAE
39%, (218)
52% (292)
9% (52)
Would Grad/Professional GSES Respondents Recommend Howard to
a Prospective Student?
Yes, without reservationYes, with reservationNo
Source: 2016 Graduate/Professional Exit Survey, OIAE
27% (12)
30% (13)
44% (20)
Number of Years Howard Grad/Professional GSES
Respondents Lived on Campus
4 or more years
2-3 years
1 year or less Source: Graduate/Professional Exit Survey 2016, OIAE
The pie charts above provide key demographic information on the survey respondents.
Included in these charts are gender, citizenship status, first-time student status, first-
generation status, full-time and part-time status, and classification by degree. In addition,
a chart reporting whether or not the respondents will recommend Howard to a prospective
student and a chart reporting whether or not the respondents lived on campus are
included.

Institutional Surveys Graduate/Professional Exit Survey 2016
53
26%
40%
7%
27%
0%
20%
40%
60%
80%
100%
Full-time OffCampus
Part-time OffCampus
Full-time OnCampus
Part-time OnCampus
While at Howard University, you were employed primarily:
N= 361Source: Howard Univ. Graduate/Professional Exit Survey 2016, OIAE
32%34%
19%
4% 2%9%
0%
20%
40%
60%
80%
100%
3.70-4.00 3.30-3.69 3.00-3.29 2.70-2.99 2.30-2.69 NotApplicable
GPA Distribution for Graduate and Professional Respondents
N= 562 Source: Howard Univ. Graduate/Professional Exit Survey 2016, OIAE
Of the 361
respondents who
were employed
while at HU, 33%
worked full time,
and 67% worked
part time on or off-
campus.
Cumulative GPAs of
3.0 and above were
reported by 85%.

Howard Assessment Dashboard AY 2015-16
54
52%
20%
3%
21%
4%
26%
0%
20%
40%
60%
80%
100%
MakingFinancial
Contributions
RecruitingNew
Students
Fundraising Volunteering Other No Plan toContribute
Please indicate the primary way you plan to give back to Howard University as an Alumna/Alumnus
N= 562 Source: Howard Univ. Graduate/Professional Exit Survey 2016, OIAE
26%
59%
12%
1% 1% 1%
0%
20%
40%
60%
80%
100%
VerySatisfied
Satisfied Dissatisfied VeryDissatisfied
Don't Know N/A
Rate the level of satisfaction with the following:Overall quality of the educational experience
N= 562 Source: Howard Univ. Graduate/Professional Exit Survey 2016, OIAE

Institutional Surveys Graduate/Professional Exit Survey 2016
55
20%
46%
18% 14%
1% 2%
0%
20%
40%
60%
80%
100%
VerySatisfied
Satisfied Dissatisfied VeryDissatisfied
Don't Know N/A
Rate the level of satisfaction with the following:Customer Service in Administrative Offices in
Your School or College
N= 562 Source: Howard Univ. Graduate/Professional Exit Survey 2016, OIAE
27%
54%
13%
4% 1% 2%
0%
20%
40%
60%
80%
100%
VerySatisfied
Satisfied Dissatisfied VeryDissatisfied
Don't Know N/A
Rate the level of satisfaction with the following:Faculty professionalism
N= 562 Source: Howard Univ. Graduate/Professional Exit Survey 2016, OIAE

Howard Assessment Dashboard AY 2015-16
56
32%
56%
9%1% 1% 1%
0%
20%
40%
60%
80%
100%
VerySatisfied
Satisfied Dissatisfied VeryDissatisfied
Don't Know N/A
Rate the level of satisfaction with the following:Level of intellectual stimulation in courses
N= 562 Source: Howard Univ. Graduate/Professional Exit Survey 2016, OIAE
22%
54%
13%4% 3% 4%
0%
20%
40%
60%
80%
100%
VerySatisfied
Satisfied Dissatisfied VeryDissatisfied
Don't Know N/A
Rate the level of satisfaction with the following:Your preparation for employment in your major
N= 562 Source: Howard Univ. Graduate/Professional Exit Survey 2016, OIAE

Institutional Surveys Graduate/Professional Exit Survey 2016
57
Rate the level of satisfaction with Knowledge and Skill Development: (N=562)
Item Very
Satisfied Satisfied Dissatisfied
Very Dissatisfied
Don't Know
N/A *Rank
(%Satisfied)
Critical thinking and
analysis skills
development
42% 52% 4% 0% 1% 1% 94%
Knowledge of ethics 42% 52% 2% 1% 1% 2% 94%
Building on interpersonal
skills 38% 54% 5% 1% 1% 2% 92%
Ability to demonstrate
leadership 40% 51% 3% 1% 2% 2% 92%
Building on life skills
(e.g., prioritization, time
management, etc.)
38% 53% 4% 1% 1% 3% 91%
Team work skill
development 36% 55% 4% 1% 2% 3% 91%
Multicultural knowledge 38% 53% 4% 0% 2% 3% 91%
Training/Experiences in
verbal communication 31% 58% 5% 1% 2% 3% 89%
Source: 2016 Undergraduate Graduating Student Exit Survey, OIAE
21%
54%
11%3% 6%
5%
0%
20%
40%
60%
80%
100%
VerySatisfied
Satisfied Dissatisfied VeryDissatisfied
Don't Know N/A
Rate the level of satisfaction with the following: Your preparation for further education or advanced training
N= 562 Source: Howard Univ. Graduate/Professional Exit Survey 2016, OIAE

Howard Assessment Dashboard AY 2015-16
58
Rate the level of satisfaction with Knowledge and Skill Development: (N=562)
Item Very Satisfied
Satisfied Dissatisfied Very
Dissatisfied Don't Know
N/A *Rank
(%Satisfied)
Research skill
development 32% 54% 6% 1% 2% 4% 87%
Training/Experiences in
written communication 30% 57% 7% 2% 1% 3% 87%
Advanced information
literacy/facility
development (i.e., library
skills)
22% 59% 8% 1% 2% 7% 81%
Knowledge of global
policies and issues 30% 49% 8% 2% 3% 8% 80%
Knowledge of
contributions of the
African Diaspora to your
major field of study
33% 45% 6% 2% 6% 9% 78%
Training/Experiences in
computer applications 19% 53% 11% 1% 2% 12% 73%
Source: 2016 Undergraduate Graduating Student Exit Survey, OIAE

Institutional Surveys Graduate/Professional Exit Survey 2016
59
10%
38%
28%22%
1% 2%
0%
20%
40%
60%
80%
100%
VerySatisfied
Satisfied Dissatisfied VeryDissatisfied
Don't Know N/A
Rate the level of satisfaction with the following: Access to Wireless Internet Connection on Campus
N= 562 Source: Howard Univ. Graduate/Professional Exit Survey 2016, OIAE
15%
49%
13%
5%11%
15%
0%
20%
40%
60%
80%
100%
VerySatisfied
Satisfied Dissatisfied VeryDissatisfied
Don't Know N/A
Rate the level of satisfaction with the following:iLab and Campus Computer Laboratories
N= 562 Source: Howard Univ. Graduate/Professional Exit Survey 2016, OIAE

Howard Assessment Dashboard AY 2015-16
60
5.0%
27.0%
14.0%
10.0%
16.0%
27.0%
0%
20%
40%
60%
80%
100%
VerySatisfied
Satisfied Dissatisfied VeryDissatisfied
Don't Know N/A
Rate the level of satisfaction with the following:Condition of University libraries
N= 562 Source: Howard Univ. Graduate/Professional Exit Survey 2016, OIAE
19%
53%
18%
6% 3% 1%
0%
20%
40%
60%
80%
100%
VerySatisfied
Satisfied Dissatisfied VeryDissatisfied
Don't Know N/A
Rate the level of satisfaction with the following:Opportunity for students to formally assess academic programs
N= 562 Source: Howard Univ. Graduate/Professional Exit Survey 2016, OIAE

Institutional Surveys Graduate/Professional Exit Survey 2016
61
13%
43%
21%
7%10%
5%
0%
20%
40%
60%
80%
100%
VerySatisfied
Satisfied Dissatisfied VeryDissatisfied
Don't Know N/A
Rate the level of satisfaction with the following:Provision of or Access to Institutional Assessment
Information (e.g., Survey Results, etc.)
N= 562 Source: Howard Univ. Graduate/Professional Exit Survey 2016, OIAE
5%
35% 34%
19%
3% 4%
0%
20%
40%
60%
80%
100%
VerySatisfied
Satisfied Dissatisfied VeryDissatisfied
Don't Know N/A
Rate the level of satisfaction with the following: Overall condition of University buildings
N= 562 Source: Howard Univ. Graduate/Professional Exit Survey 2016, OIAE

Howard Assessment Dashboard AY 2015-16
62
Rate the level of satisfaction with the following Student Support Services: (N=562)
Student Support Office Very
Satisfied Satisfied Dissatisfied
Very Dissatisfied
Don't Know
N/A *Rank
(%Satisfied)
Office of Admissions 12% 46% 14% 8% 11% 9% 58%
HU Student Health
Service Center 12% 45% 17% 12% 8% 7% 56%
HU Office of Student
Accounts 9% 46% 17% 14% 8% 6% 56%
Office of Financial Aid (in
school/college) 13% 39% 14% 17% 8% 9% 52%
HU Office of Enrollment
Management 9% 42% 13% 11% 14% 11% 51%
Campus Security (Police) 8% 42% 13% 8% 17% 13% 49%
HU Office of Financial Aid
(main campus) 9% 38% 20% 20% 8% 6% 47%
Office of Student Financial
Services (other than
Office of Financial Aid)
9% 36% 15% 16% 14% 10% 45%
Office of Student Services 8% 34% 8% 5% 26% 19% 42%
Career/ Placement
Services in your college or
school (Not institutional office) 8% 30% 10% 6% 24% 23% 38%
Office of Student Life 8% 30% 8% 4% 28% 23% 37%
University Counseling
Service 9% 23% 7% 5% 30% 27% 32%
HU Office of Career
Services 6% 25% 7% 4% 29% 28% 31%
University Office of
International Student
Services
9% 20% 4% 3% 30% 35% 29%
International Student
Services (in
school/college)
7% 18% 4% 4% 30% 37% 25%
Source: 2016 Undergraduate Graduating Student Exit Survey, OIAE

Special Topics CIRP Freshman Survey 2015 & YFCY Survey 2016
63
4. Special Topics
Cooperative Institutional Research Program (CIRP) Freshman Survey 2015 and
Your First College Year (YFCY) Survey 2016
The Cooperative Institutional Research Program (CIRP) - Freshman Survey collects information at entry
that provides a comprehensive profile of incoming students, what they are like before they experience
college. Sections of the CIRP survey ask questions about academic preparedness, expectations of college,
student values and goals, and concerns about financing college. The Your First College Year Survey
(YFCY) is a parallel survey to the CIRP and is designed to examine changes that may have taken place in
students during their first year of matriculation. Data are matched for students who completed both
instruments.
0%
10%
20%
30%
40%
50%
Howard C1 C2
48%
37%40%41%
34% 34%
Pe
rce
nta
ge
Comparison Groups
CIRP 2015-YFCY 2016 Percentage Comparisons on Habits of Mind Construct for Total High Score Groups
CIRP YFCYCIRP 2015-YFCY 2016Howard Univ. OIAE
In the title of each
graph, High”
represents
students who
scored one-half
standard deviation
or more above the
mean of 55.
The Cooperative Institutional Research Program (CIRP) - Freshman Survey collects information at entry
that provides a comprehensive profile of incoming students, what they are like before they experience
college. Sections of the CIRP survey include questions about academic preparedness, expectations of
college, student values and goals, concerns about financing college, and others. The Your First College
Year Survey (YFCY) is a parallel survey to the CIRP and is designed to examine changes that may have
taken place in students during their first year of matriculation. Data are matched for 185 Howard
students who completed both the CIRP in fall 2015 and the YFCY in spring 2016. In the following graphs,
Comparison groups: C1 All Private 4-year Colleges (nonsectarian, catholic, other religious); C2 All
Universities (Public/Private).

Howard Assessment Dashboard AY 2015-16
64
0%
10%
20%
30%
40%
50%
60%
70%
Howard C1 C2
58%
35%39%
65%
48% 47%
Pe
rce
nta
ge
Comparison Groups
CIRP 2015-YFCY 2016 Percentage Comparisons on Social Agency Construct for Total High Score Groups
CIRP YFCY
CIRP Constructs are complex and multifaceted. To measure broad underlying areas more precisely,
Item Response Theory (IRT) is used to combine individual survey items into global measures that
capture these areas. The Habits of Mind Construct combines the following items among others:
* Seek solutions to problems and explain them to others
* Support your opinions with a logical argument
*Seek alternative solutions to a problem
* Evaluate the quality or reliability of information you received
* Explore topics on your own, even though it was not required for a class
* Seek feedback on your academic work
Note: The items are listed in the order of weight they carry in forming the construct, with the most
important contributor coming first. [For more detailed information: www.heri.ucla.edu/about-cirp/]
The graphs above indicate that greater proportions of Howard students recorded higher Habits of Mind
Construct (HMC) scores on both surveys than did those of each comparison group. All students’ HMC
scores declined from CIRP to YFCY. Howard students’ Social Agency Construct (SAC) scores were greater
than those of each comparison group. Howard students and those from each comparison group
registered increased SAC scores across CIRP and YFCY surveys.
CIRP 2015-YFCY 2016 Howard Univ. OIAE

Special Topics CIRP Freshman Survey 2015 & YFCY Survey 2016
65
0%
5%
10%
15%
20%
25%
30%
Howard C1 C2
28%25%
28%
21% 21% 22%
Pe
rce
nta
ge
Comparison Groups
CIRP 2015-YFCY 2016 Percentage Comparisons on Academic Self-Concept Construct for Total High Score Groups
CIRP YFCY
0%
5%
10%
15%
20%
25%
30%
35%
Howard C1 C2
19%
25%23%
35%
32% 31%
Pe
rce
nta
ge
Comparison Groups
CIRP 2015-YFCY 2016 Percentage Comparisons on Social Self-Concept Construct for Total High Score Groups
CIRP YFCY
The pattern of differences between CIRP and YFCY construct scores indicate that at Howard
and other HBCUs students tend to indicate declines in their self-perceptions related to
academic areas, but indicate gains in perceptions relating to social areas.
CIRP 2015-YFCY 2016 Howard Univ. OIAE
CIRP 2015-YFCY 2016 Howard Univ. OIAE

Special Topics Howard University Alumni Outcomes Assessment Project 2013
66
Howard University Alumni Outcomes Assessment Project 2013
The Howard University (HU) Office of Institutional Assessment & Evaluation (OIAE), along with the HU Department of Alumni Relations (HUDAR) within the Office of Development and Alumni Relations (ODAR) planned and implemented the Howard University Alumni Outcomes Assessment Project 2013, which included focus group interviews and a rather comprehensive survey. The primary purpose of this project was to provide University community stakeholders with useful assessment information from alumni on student learning and developmental outcomes, levels of student satisfaction with many aspects of the HU experience (academic and co-academic), various ratings of the University, employment/career outcomes and status, and particular areas germane to alumni relations, such as giving. Due to the generational representativeness of the respondent pool, data on many survey items were broken down by Birth Decade Cohorts. The complete Howard University Alumni Outcomes Assessment Project: Perspectives Along the Path to Truth and Service, Final Report 2013 report can be found on the website of the Howard University Office of Institutional Assessment and Evaluation. [ http://assessment.howard.edu ]
Perspectives Along the Path to Truth and Service

Howard Assessment Dashboard AY 2015-16
67

Special Topics Howard University Alumni Outcomes Assessment Project 2013
68
Note: Birth Decade Cohort from 1990s is smallest with 12 respondents.
Nearly all alumni attribute major or moderate impact to their Howard University experience
relating to their development of certain key life skills and dispositions such as self-competence and
self-confidence.

Howard Assessment Dashboard AY 2015-16
69

Special Topics Howard University Alumni Outcomes Assessment Project 2013
70

Howard Assessment Dashboard AY 2015-16
71

Special Topics Howard University Alumni Outcomes Assessment Project 2013
72

Howard Assessment Dashboard AY 2015-16
73
Very substantial
proportions of
alumni attribute
their development
of key professional
skills to their
Howard University
education and
training.

Special Topics Howard University Alumni Outcomes Assessment Project 2013
74

Howard Assessment Dashboard AY 2015-16
75
Many critical academic
conditions and Student
Affairs activities and
supports at Howard
University are rated
satisfactorily by large
majorities of alumni.
Several areas/functions
are in need of more
development or
improvement.

Special Topics Howard University Alumni Outcomes Assessment Project 2013
76

Howard Assessment Dashboard AY 2015-16
77
Practically all alumni
responding would
recommend Howard to
others, with nearly
three quarters of them
doing so without
reservation.

Special Topics Howard University Alumni Outcomes Assessment Project 2013
78
Nearly two thirds of
alumni indicate the
willingness to serve
Howard through
financial gifts, and a
substantial number are
willing to make personal
presentations to
students. Many alumni
are willing to serve in
more than one way.


2565 Georgia Avenue, N.W.
Miner Hall, Suite 111
Washington, D.C. 20059
Phone: 202-865-0207
Fax: 202-234-2214
Email:
Website: http://www.howard.edu/assessment