how to use portfolio123 to use portfolio123 ... to you as a collection of files packed together...
TRANSCRIPT

1
How To Use
Portfolio123
Excel Add-In:
Stefano’s P123 Manager
By, Marc H. Gerstein
2
Stefano’s P123 Manager is an Excel add-in that adds considerable power and flexibility to your Simulation-development efforts. It doesn’t necessarily do anything you can’t do on the Portfolio123 web site. Instead, it does things much, much more quickly enabling you to do interesting things many of which you probably wouldn’t bother with if you don’t have the add-in. This Tutorial presumes you are comfortable with creating, testing and evaluating Simulations in Portfolio123. If you need a refresher, you may wish to download Part 14 of the Tutorial Series, available
in the Tutorials topic of the Help area (http://www.portfolio123.com/doc/SimulationEvaluation.pdf).
* * * * * Essentially, the add-in allows you to see what your simulation performance results would look like with changes in key parameters. On the web, you would do one new trial at a time. With the add-in, you can run up to 100 trials at a time. Multiple trials would be on the following categories of parameter changes:
• Changes in Period (Start and/or End dates)
This is the heart of the add-in. It allows you to examine many different trial periods, including periods that overlap. Besides providing full analyses of how your simulation performed under different market conditions, the flexibility you get with assigning dates helps you assess the robustness of you model; i.e. to determine the extent, if any, to which good or bad luck involving start and end dates might have impacted the sort of single trial you may have run on the web.
• Changes in Rules (Buy and/or Sell rules)
Suppose you have a Buy Rule capping industry exposure at, say, 20%. Is that really best? Why not 25%, or 30% or 15%. With the add-in, you can examine all such scenarios at the same time, and have all the results appear before you in a way that enables you to make clear and easy comparisons. Suppose you have a Sell Rule requiring stocks to be eliminated from the portfolio if the rank falls below 80. Might 70 be better, or 90? Again, the add-in allows you to examine all such scenarios. Moreover, you need not vary one rule at a time. You might, for example, work with different combinations of Sell threshold and industry exposure limit at the same time.
• Combination involving changes in both Period and Rules You can combine the above kinds of inquiries by examining permutations that reflect different combinations of Periods and Rules.
Although examination of different Periods is often regarded as the heart of the add-in, the how-to material will start with examination of how to study different kinds of rules, simply because that is easier for new users to grasp. Once we’ve mastered that, we’ll move on to consideration of changes in Period, and then on to the most complex use, the combinations involving Rules and Periods. Before doing that, however, we’ll consider what, exactly, an Excel add-in is (that context should help you better understand the workings of Stefano’s P123 Manager), review the installation process, and examine the interaction between simulation on the web site and simulation in Excel via the add-in.

3
Introducing Excel Add-In Although Stefano’s P123 Manager is very easy to use, it can seem at first glance, to be very challenging. One way to master Stefano is to learn and memorize the definitions of the prompts and the steps. We’ll accomplish that. But the task will be greatly simplified if we start, not by working on Stefano Step 1, but instead, by developing an understanding of what add-ins are and the role they play within Excel. The roots of the Excel add-in go back to earlier generations of computer spreadsheets. Imagine you are faced with a simple but frequently-recurring spreadsheet task. Perhaps you’re tracking expenditures and need to add a dozen items. Assume, too, that at the end of every month, you need to copy the result to a separate area designed to record these figures. You also need set up a new column for the next month. It’s not complicated. That, actually, can be a problem. With Excel, excessive simplicity can lead to lapse in concentration and human errors. So you’d like an alternative to working cell by cell every month. You can address this through what is known as a “macro.” You’d create the macro by recording your keystrokes as you go through the process once. After you finish, you’ll save the sequence of keystrokes and establish a means to reactivate it, a “hot key.” You may, for example, decide to assign Alt-N as the key combination you’ll use to activate the sequence of steps that records last month’s expense total and sets up a new expense column for a new month. This is great for simple repetitive tasks. But it is limited . . . to just that, simple repetitive tasks. The next step in macro development was to allow for use of logic. Non-programmers may immediately think about “if-then” capability. For example, if the month for which expenses are tallied is a quarter end month (March, June, September or December), copy the expense total in the usual place and also sum up the last three months’ worth of expenditures and copy it to a separate quarterly-journal area. Those who do have programming background know “if-then” is just a drop in the bucket compared to the totality of what could be done. They might want to “nest” multiple if-then functions; if the month is the last in the year (December) the macro should also copy the sum of the prior 12 months’ expenses to a separate annual journal area. Come to think of it, should the macro even assume the fiscal year ends in December? Perhaps the user should indicate somewhere which month is the last of the fiscal year. The logic should read this and adjust the quarterly and year-end schedule accordingly. Finally, we may not want one-key activation for the whole thing. Perhaps we’d like to put prompts on the Excel toolbar that let the uses activate individual sections of the program at the proper times (such as places where the user can click to create new journals). There’s more, much more. Burt hopefully, this is enough to give you a sense of how much more powerful a macro can be if logic is incorporated. Microsoft permits macros in Office to incorporate logic; quite a lot of logic at that through VBA (Visual Basic for Applications), a full-fledged programming language that is incorporated into Office. Suppose, though, that you are a professional developer and that you’d like to create logic-intense macros for use of (and preferably purchase by) others. VBA is a start, but you’d need more. You’d need to be able to pack your code in such a way that unauthorized users would not be able to see or modify it. You also need to be able to have other users install your code into their own spreadsheets. Once again, Microsoft obliges by allowing for the creation of these self-contained code packages. These are known as add-ins. That is exactly what Stefano’s P123 Manager is; a highly logic-intense macro written in VBA that has been securely packaged in such a way as to be distributed to and used by others. Remember this as we proceed. Notwithstanding the Stefano features, we ultimately are working, not with a special program environment but with Excel spreadsheets, something with which many of us have been comfortable for years.

4
Installation Stefano’s P123 Manager comes to you as a collection of files packed together using a Zip utility. Here’s what you need to do to install it.
• Completely close all instances of Excel • Unzip the files to a folder you create in your computer • Run the file entitled setup.exe; when prompted, click on "Install" • When the installation is complete, a new window appears called "Stefano's portfolio123
Manager," which should be open at all times when the add-in is used. • Click on "Install add-in" to install the Add-in within your copy of Excel • Excel should open • If no worksheets are open, start a new one from Excel
At this point the Add In menus should be visible or accessible within Excel. If that is not the case, go to View->Toolbars and check the box next to Stefano's P123 Manager. You should see 'Import Simulation' in the toolbar menu. If not close the worksheet and start a new one.

5
Our First Look At Stefano’s P123 Manager We’ll work with a simple Portfolio123 simulation created specifically to demonstrate Stefano’s P123
Manager. It’s publicly visible: http://www.portfolio123.com/port_summary.jsp?portid=763020 Here’s a summary of the parameters: General
• Starting Capital: 100,000.00 • Benchmark: S&P 500 • Commission: 10.00 • Slippage: 0 • Rebalance Frequency: Four Weeks • Price For Transactions: Next Average of Hi and Low • Allow Sold Holdings To Be Re-bought at Rebalance: Yes
Position Sizing • 5% (approx. 20 positions)
Universe & Ranking • Universe: No OTC Exchange • Ranking: Portfolio 123 pre-defined Comprehensive: QVGM system
Buy Rules • AvgVol(60)>=5000 • Price>=5 • MktCap>=100 • Industry!=FSMISC • Universe($ADR)=False
Sell Rules • Rank < 90
Period • Start Date: 3/31/01 • End date: 3/25/11
Figure 1 shows a summary of the simulation results. Figure 1

6
Now, let’s re-create this simulation in the add-in.
Start by accessing the add-in from the Excel. Then, in the Stefano interface, click on “Import Simulation.”
Figure 2
Use the pop-up Stefano window to log in using your regular Portfolio123 user ID and Password.
Figure 3
Next, choose the simulation you’d like to import into Excel. Figure 4
By the way, if you don’t see these windows, they may have found their way behind one or more larger windows you presently have opened. As with Windows in general, you can bring these covered-up windows by clicking on the program icon in the task bar which, for most users, is at the bottom of the screen. Figure 5
Note that if the Stefano icon is flashing yellow, as depicted in Figure 5, that means it’s actively working and depending on the context, may be awaiting action from you, such as choosing which Simulation to import. After you click “OK” at the bottom of the Import Simulation window, the add-in will go to your Portfolio123 account and collect key information from the simulation and place it into a newly-created Excel spreadsheet.
7
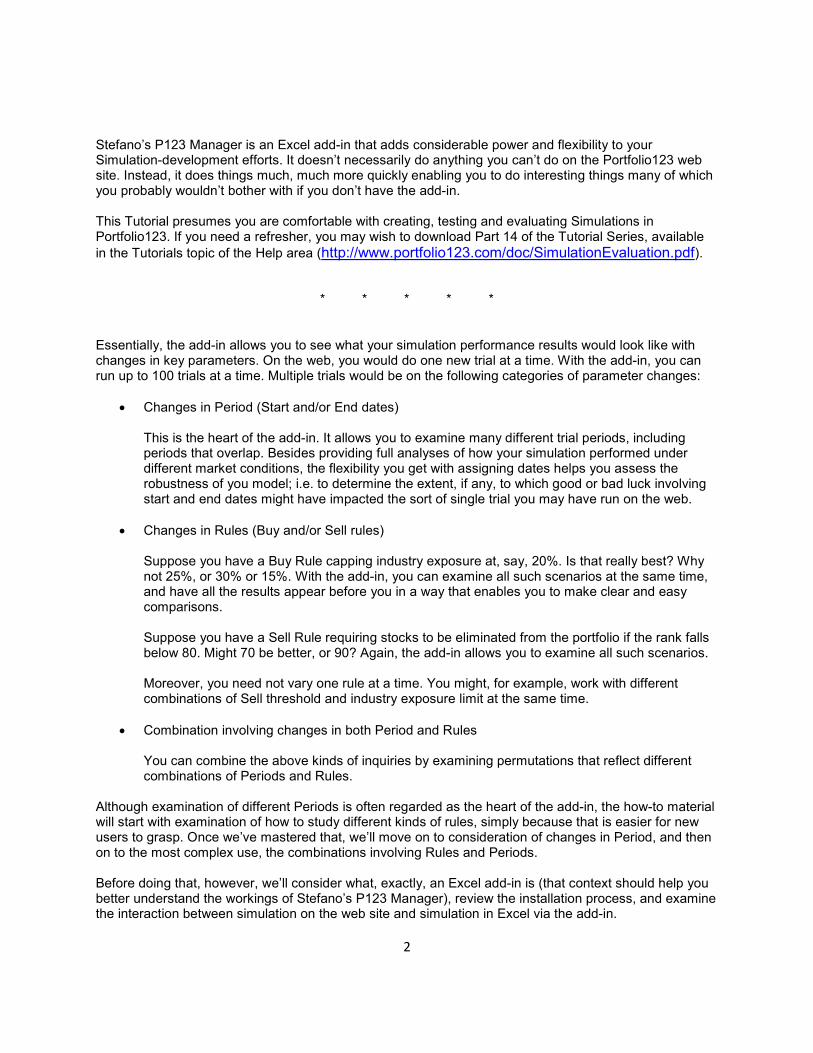
Figure 6
This should look familiar. Almost all the parameters you set in Portfolio123 are here. The one exception is the Start Date. One the web site, it’s set as 3/31/01. In the add-in, we see 3/25/10. Regardless of what parameters are established on the web, the add-in defaults to an assumption that you want a one-year period ending with the present day. You can use the Stefano interface to change the dates to match what you have on the web. But that’s going the long way. Remember, this is an Excel add-in, a super-charged macro. The information you see, here, is not equivalent to information you’d enter into other kinds of software using an input box. All you need do here is put your cursor into the cell you want to change and edit. Figure 7
That’s it. The add-in (macro) is going to read and use whatever information it finds in that cell (assuming it’s recognizably formatted as a date, and that its earlier than the End Date; if not, the logic will be violated and you’ll get an error message). How the date gets there, whether via the add-in interface or manual typing, is irrelevant. One instance where you really do need to use the add-in interface is to launch the simulation. Figure 8 show what the interface looks like after a simulation has been imported.

8
Figure 8
We can import a simulation or add permutations. We don’t need to import a simulation; we already did that. So obviously, the relevant menu item is “Add Permutations.” When we click on that, Stefano launches a script that sets the worksheet up to accept variations in dates and/or rules. That’s what the add-in is meant to do. But we’re not going to do it right now. To nail down our understanding of what this spreadsheet is about, we’re going to stay for a while in familiar simulation territory and run it just once in its original form. I’m going to cheat here and do something you’re not going to do in your regular use of the add-in, but which will help you get comfortable with the way it sits in Excel. The stronger your understanding of this, the easier a time you’ll have with the add-in as we get to what it’s really intended to do. I need to find a way to get the simulation to run. To accomplish that, I’m going to do something I know will make the appropriate menu item visible. I’m going to copy one of my rules – it doesn’t matter which rule (any Buy or Sell rule will suffice) into Column D. Figure 9
Once any content is placed in Column D on any the rows that hold rules or dates, the add-in will assume you’re ready to move on and activate an important new menu choice, “Create Permutations.” Figure 10
By the way, it doesn’t really make a difference what we put in column D. It could even be the word “hello” or an “x.” In fact, it doesn’t even have to go into Column D. Type “x” in Column E instead, or even further out to the right. Also, it needn’t’ be in a row that actually articulates an existing rule. Try putting an “x” in Cell G39. Stefano presumes we’re going to add a new Sell rule there and shows us the “Create Permutations” menu option. The moral of the story is that once something, anything, goes into an area where the add-in is willing to accept new Rules- or Dates-related content, it will activate the “Create Permutations” menu choice. That’s all we want to accomplish right now. Don’t worry about triggering an error in the event the new content is gibberish. Stefano won’t actually try to work with it because it hasn’t yet been cued as to what it’s supposed to be. We’ll do that in the next chapter. For now, all we want to do is activate the “Create Permutations” menu. After clicking on Create Permutations, you’ll see a lot of things happening in Excel. A new sheet will be created and named “Sheet1 Run.” This will be next to the original sheet, which was previously names by the add-in “Sheet1 Imp.” Don’t worry about the content you see rapidly added to and removed from your view. What you’re seeing is a sequence of keystrokes that you could theoretically have handled manually but which have been incorporated into a script (complex, logic-intense macro). The purpose of the script is to examine the rows

9
of your original import sheet, and organize the variations of the simulation that will have to be run. When the script finishes running, the variations will all be cataloged for you in the Run worksheet. Figure 11
There’s nothing earth-shaking here. Rank < 90 was our original Sell Rule. No new variations are created because we didn’t ask for any. The only reason you see this particular rule is because this corresponds to the row I used to place new content in Column D of the original Import worksheet. What about the extra copy of the Rank<90 Sell Rule copied into Cell D32 (Figure 9)? It was ignored because we didn’t give Stefano an important cue it needs that tells it to take the content seriously. That’s OK for now because we don’t want to take it seriously. We’ll do that in the next chapter. For now, all we need is to run the simulation once in its original form. Figure 12 shows the item that’s important to us right now; the menu that becomes activated after Stefano runs its permutation-creating script. Figure 12
“Run All Permutations” is the item we now need. Clicking on it tells the add-in to run our simulation once for each permutation (variation) listed in our spreadsheet. For each of these runs, the add-in will use the Rules and Dates in Column C and again to reflect new information in columns to the right of C. Since we have only one permutation that incorporates no new dates or rules, we should expect the add-in to run the simulation just one time and that the results we get should match the one’s we saw when we ran it on the web. After clicking on “Run All Permutations,” you’ll see a pop-up window inviting you to choose the output information you’d like to see. Figure 13

10
Make your choices, and then click on “OK” to start running the simulation. While the simulation is running, you’ll be able to see on the Stefano window the same sort of progress information you see when you run a simulation on the web site. Figure 14
If the window is behind others, you can bring it to the fore and monitor progress by clicking on the Stefano icon (which should be flashing) on the task bar. After the run is completed, the results will be brought into the spreadsheet. Figure 15
The information in you see row 3, as well as that contained in columns you’d be able to see if you scroll to the right, should match what you see for the simulation on the web site. For now, don’t worry about the rows below 3. These are not useful for a single run. When there are multiple runs, as is the case when the add-in is appropriately used, the presentation will include the averages and standard deviations for each column. Before moving on, let’s take a quick glance at one more aspect of the way the add-in c an be used to set up simulations. For the most part, the add-in assumes you will want to keep parameters other than rules and dates as they were when the simulation was last saved on the web. In Figure 6, light-green backgrounds are used for cells that display these supposedly non-changing parameters. Actually, though, if you want to change them, you can. Figure 16 reproduces the cell containing the Universe parameter. Figure 16
11
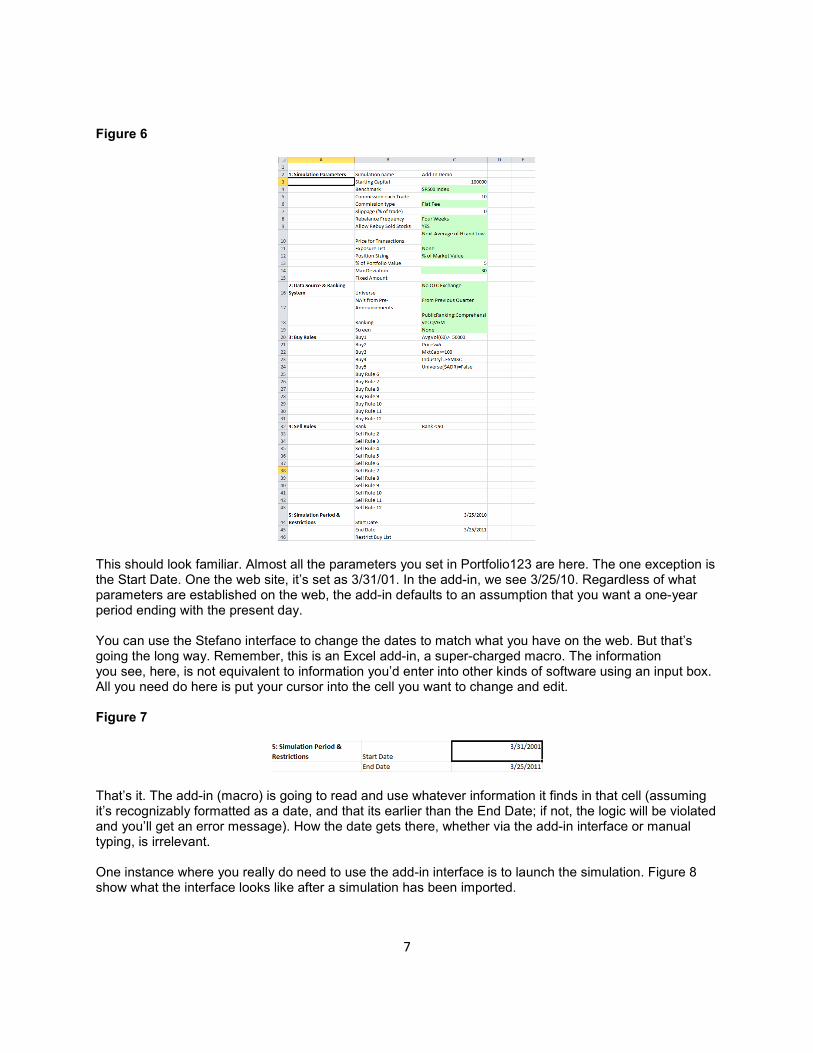
Actually, if we click on any of these green-background parameters, a menu will appear containing all the choices available to us if we’d like to make a change. Where applicable, the menu will contain both pre-defined and user-created items. Figure 17
Figure 18 is a variation on this theme. Figure 18
Here, to change the commission assumption, we get to choose the type of commission when we click on the green cell. To modify a number, we’d do in manually in Column C (just above the cell on which we clicked).
* * * * * All this should give you a good sense of how Stefano’s P123 Manager works, a look under the hood. We cheated a bit in the way we caused it to activate the “Create Permutations” menu item. I think, though, it was worthwhile to do this. The exercise here, replicating an existing simulation, gives us a good sense of how the Portfolio123 web site, Stefano’s P123 Manager, and Excel relate to one another and work together. That should make it much easier to grasp the upcoming material, where we’ll use the add-in as intended.

12
Experimenting With Different Rules Now, it’s time to do some legitimate work with Stefano’s P123 Manager. We’re going to use it to examine how various rules changes will impact the performance of the “Add-in Demo” simulation. To get started, let’s nail down the meaning of a word we’ve already encountered but not looked at closely: permutation. A permutation is a variation on a basic idea. Usually we’re talking about more than one variation, and the word “permutation” is often used interchangeably with the word “combination.” Whether you think of permutations as variations or combinations depends on context. Consider, for example, the simulation’s sell rule: Rank < 90. Suppose we’d like to see how the simulation would perform not just with the sell threshold set at 90, but also at 70, 80, and 95. This is a “Group” consisting of four permutations. There is one original item (Rank<90) and three new variations. To put this into Stefano, click on the “Add Permutations” item in the interface, and then click on “Add Group.” Here’s what you’ll see: Figure 19
You’re being asked how many values, or variations, will be in the group. One of them will always be the original variation (Rank<90 in this example). If you leave the default option, 4, you’ll be invited to add three new variations to go along with the one we start with. If we’d like to only add two more variations, that means the total (including the original version) will be 3. Here’s what we get after we change “4” to a “3” and click on “OK.” Figure 20

13
Nothing happened . . . right? That’s what you’d conclude if you’re looking at Row 32, which is where the Rank<90 rule is located. Actually, though, something very important occurred. Go back to Figure 20 and look at Row 1. Notice that we see “1” in the top rows under columns D and E Also, if you look at the task bar, you’ll see that the “Create Permutations” menu choice has been activated. That’s interesting. We knew we needed content beyond Column C in one of the relevant rows. In the last Chapter, we recognized that the relevant rows were those that contained Buy or Sell Rules. Now, we learn that Row 1 is also relevant, even though it’s not labeled. The values added by Stefano to Row 1 are cues telling it to take seriously content it sees in columns beyond C. When Row 1 was empty, we could put any gibberish we wanted beyond Column C. Now, we need to be careful. The values in Row 1 tell Stefano to look at the information beyond Column C and use it in Portfolio123. If it’s gibberish, something not recognizable in Portfolio123 (based on the same syntax you use on the web site), the simulation run will be interrupted and we’ll get an Error message. What happens if we don’t add any new information? Let’s click on “create Permutations and find out. Figure 21
That does not seem informative. In fact, if we were to go ahead and run the permutations, we’d see the original simulation run three times. Stefano always knows to run the simulation once with the factors listed in Column C. It also knows to run the simulation two additional times using variations specified in Columns D and E. Since no such variations were specified here, it wound up using the same parameters all three times. Let’s now get serious and give Stefano two additional variations. Figure 22
The original version of the simulation called for a stock to be sold if the rank was less than 90. One variation calls for sale if the rank falls below 80. A third version, the most lenient, won’t sell until the rank falls below 70. We can state the rule variations in Columns D and E by typing from scratch. Or we can copy Rank<90 from Cell C32 into D32 and E32, and then edit the latter two cells.

14
If we click on “Create Permutations” now, we’ll wind up with something that suggests we’ll get more interesting results. Figure 23
We now expect to see three runs of the simulation, one with our original Rank<90 sell rule and two others; one with a sell threshold of 80 and another with a sell threshold of 70. Indeed, that’s exactly what will occur if we click on “Run All Permutations.” Figure 24
Suppose we also want to vary one the Buy Rules, the one specifying a minimum price. It might be tempting to do this: Figure 25
Let’s click on “Create Permutations” and see if it works.

15
Figure 26
It won’t give rise to an error. There are three versions of the simulation Stefano can ask Portfolio123 to run. But is it what we REALLY want? We can get a simulation using our original Price>=5 Buy rule and our original Rank<90 Sell rule. But if we want to see a simulation using Price>=8 as a Buy rule, we cannot see how it would run with our original Rank<90 sell rule. The only sell rule with which it can be combined is Rank<70. To get a simulation that reflects all the different combinations (permutations!), we need to treat each set of variations on a particular rule as a “Group;” this being the phrase used by the Stefano interface. To vary two rules, we need to establish two Groups. We do this first by establishing one Group, which we’ll use for variations in the Sell rule. Then, we’ll establish a second Group, which we’ll use for variations in the minimum-price Buy rule. Here’s a step by step illustration: Start by loading the simulation, with the original parameters, into Stefano. Figure 27
Next, ask Stefano to create a three-variation group (one of which will use the original parameters and two of which will use variations). Figure 28

16
Figure 29 shows what we’ll wind up with after clicking on OK. Figure 29
Thus far, we’ve been in familiar territory. Now let’s do something new. Go back to the interface and again click “Add Group.” Figure 30
Figure 30 shows the cues for Group 1 in Columns D and E of the first row. Compare this to Figure 31, which shows what happens after we click on OK again to tell Stefano to add the second group (which will have three price-rule values, one for the original Price>=5 Buy rule and two new variations). Figure 31
Notice Row 1. Columns D and E continue to show the markers for Group 1. And now, Columns F and G show markers for our new group, which Stefano refers to as Group 2. Let’s fill in the variations.

17
Figure 32
This is vastly different from what we had in Figure 25, when we tried to squeeze both sets of rule changes into a single group. Notice that now, clicking on “Create Permutations” gives us all the rule combinations we really want to see. Figure 33
This time, we have nine permutations reflecting every possible combination of price and sell rule. We’ll have to wait a bit longer after clicking on “Run All Permutations” because Stefano is asking Portfolio123 to do more work. But we’ll get a lot more information! Figure 34
18
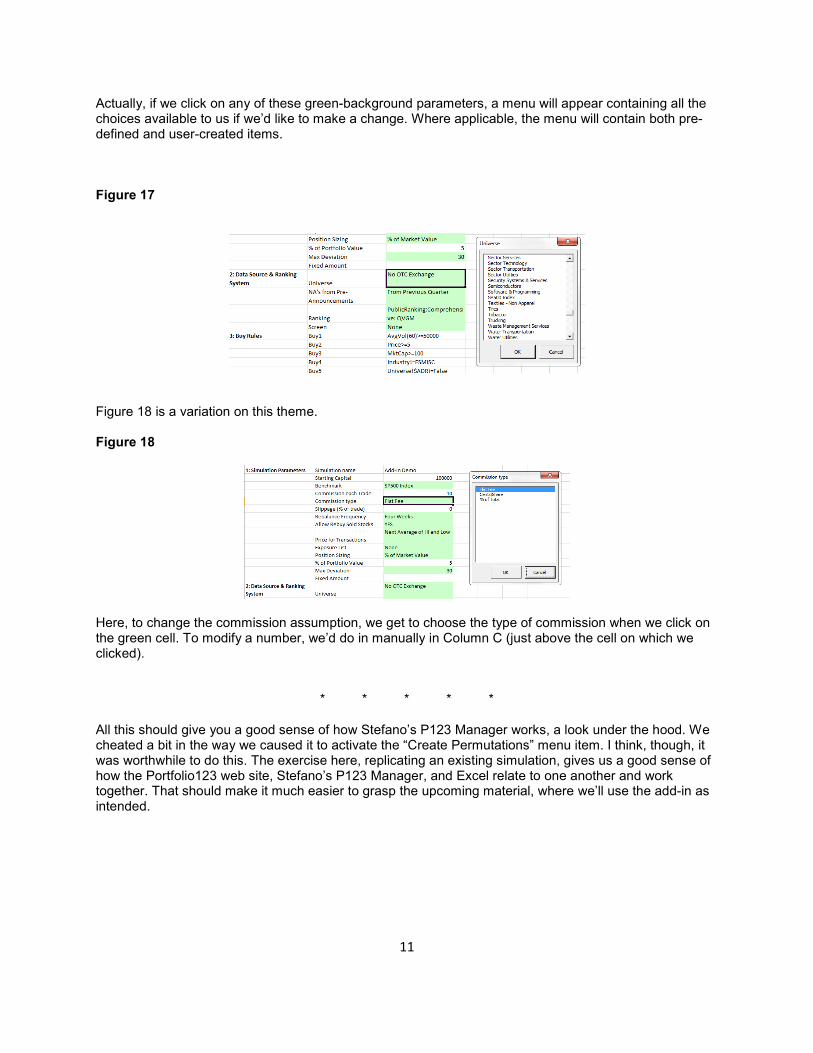
Note, by the way, we did not have to create all of your groups before inputting all the rule variations. We could have created Group 1, typed in our new Sell rules, gone back to the interface to create Group 2, and then typed in the new Buy rules. Moreover, we didn’t even have to use the Stefano interface at all to articulate the groupings. Remember, this is, first, last, and always, Excel. All we want are to have Row 1, Row 21 and Row 32 look as they do in Figure 32. We’re free simply type everything manually if we wish. (The extension of the green background we see in Row 19 is purely cosmetic; it has no bearing at all on the results we’ll get.) Finally, note that the groups do not have to be the same size. Figure 35 illustrates a sheet in which I manually established three groups: Group 1 has three variations on the Sell rule (the original plus two new ones); Groups 2 was expanded and now has four variations on the minimum price Buy rule (the original plus three new ones); and I added a Group 3 which has two variations (the original plus one new version) on the minimum-market cap Buy rule. Figure 35
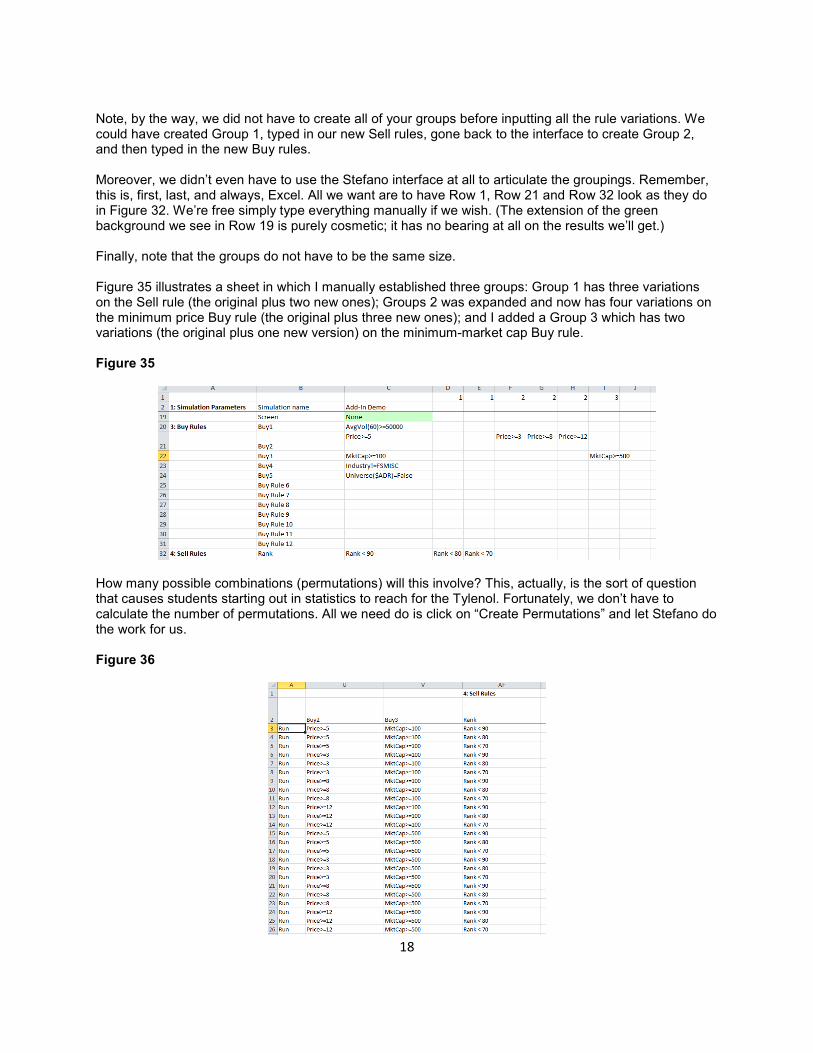
How many possible combinations (permutations) will this involve? This, actually, is the sort of question that causes students starting out in statistics to reach for the Tylenol. Fortunately, we don’t have to calculate the number of permutations. All we need do is click on “Create Permutations” and let Stefano do the work for us. Figure 36

19
By counting rows in Excel, we see that the three groups produce 24 possible combinations, or permutations. This is pretty impressive. We can get a lot of information out of Portfolio123 quickly and conveniently because Stefano is taking care of the grunt work. Yet this is not really the most advanced part of Stefano. That would involve the variations we can create based on dates. We started with rules variations because of the way it helps us improve our understanding of what the Stefano add-in is and how it works. Having accomplished that, let’s move now to date variations.

20
Experimenting With Different Dates For now, let’s stop experimenting with rules and focus only on changes involving start and end dates. (In the next, and final, section we’ll work with rules and dates simultaneously.) I had previously suggested that this is the more difficult aspect of Stefano. Actually, though, by now you already know almost everything about the add-in that you’ll need to work with date-variations and to work with date-and-rule variations (the next section). The more challenging aspect is the decisions you’ll make as you decide what you want Stefano to do for you. Let’s run quickly through the process of establishing date variations. Once again, we’ll work with the simulation named “Add-In Demo.” Figure 37 shows the default setting for the dates. Figure 37
This calls for a single test, starting 3/28/10 and ending 3/28/11. Figure 38 shows the pop-up window you’ll get if you go into the “add Permutations” menu and click on “Add Dates.” Figure 38

21
The first two active items are self-evident.
• The first input box shows the today as the end date.
• In the next input box, Stefano presumes you will want to conduct a 52-week test.
Both of these are default Stefano assumptions. They will be there regardless of the date settings saved on Portfolio123 for your original simulation and regardless of whether you amended the spreadsheet cells containing date information. The next two default entries, the 4-week shift and the use of 10 periods, is best understood by looking at the periods Stefano planning to use, based on the default settings, as spelled out in the bottom of the add-dates pop-up window. Figure 39
To understand the last two items, look at the top two trials in the Periods window.
• The most recent one runs from 3/29/10 through 3/28/11. This is a 52-week period.
• The next one starts 3/1/10 and ends 2/28/11. This, too, is a 52-week period. This and the prior 52-week period are as per the “duration” input box.
• Note though that the start date of one period is 4 weeks earlier than the start date of the next
period. The end dates are likewise four weeks apart. This is quite different from the typical “backtest.” Usually, we’d think about consecutive periods; by way of example, we might consider 3/29/09 – 3/28/10 and then 3/29/10 – 3/28/11.
Here, however, our periods are not consecutive. They overlap for 48 out of 52 weeks,. What we have, here, when we start in the “Add Dates” pop-up window, is an assumption that we want ten completely independent 52-week tests. It is further presumed that each 52-week tests begins four weeks after the prior one. To help us visualize what’s happening, I’m going to change the last input box to assume only 3 periods.

22
Figure 40
Now, experiment with the date-shift drop-down menu and see how it changes the tests that will be run. Here’s what one-week date shifting looks like. Figure 41
Notice how the start dates, 3/15/10, 3/22/10, and 3/29/10, are now one-week apart. Figure 42 shows how five independent two-year tests, each of which start a week after the prior one, looks.

23
Figure 42
Figure 43 shows what happens if I accept this last group of dates and click “OK.” Figure 43
This should have a sort-of familiar ring. We see that Stefano created a group to hold date variations. But there are two important differences:
• With the rules-based groups created in the last chapter, each group addressed a single rule; when it comes to date, each rule addresses a date pairing (involving a start and end date)
• With the rules based groups, one variation consisted of the original rule, the one that was specified in Column C when we got started. With dates, the most recent pairing will go into Column C even if Stefano has to change what was originally there.
Clicking “Create Permutations” produces this outcome. Figure 44
24
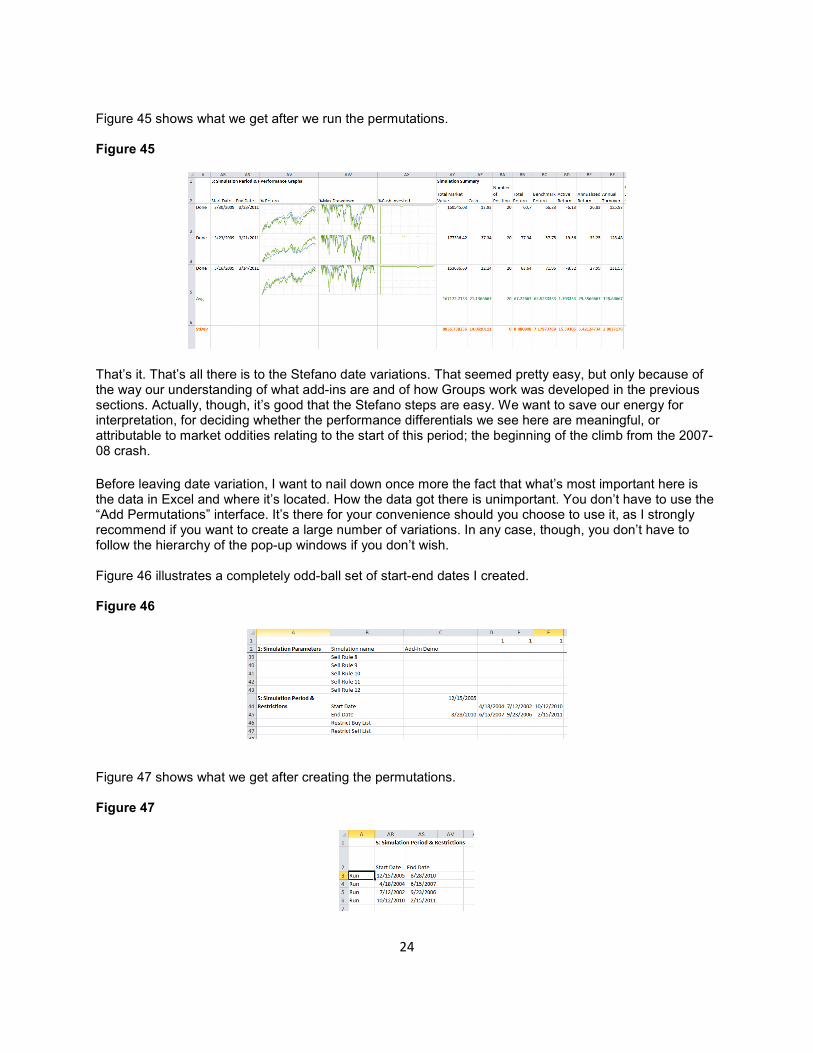
Figure 45 shows what we get after we run the permutations. Figure 45
That’s it. That’s all there is to the Stefano date variations. That seemed pretty easy, but only because of the way our understanding of what add-ins are and of how Groups work was developed in the previous sections. Actually, though, it’s good that the Stefano steps are easy. We want to save our energy for interpretation, for deciding whether the performance differentials we see here are meaningful, or attributable to market oddities relating to the start of this period; the beginning of the climb from the 2007-08 crash.
Before leaving date variation, I want to nail down once more the fact that what’s most important here is the data in Excel and where it’s located. How the data got there is unimportant. You don’t have to use the “Add Permutations” interface. It’s there for your convenience should you choose to use it, as I strongly recommend if you want to create a large number of variations. In any case, though, you don’t have to follow the hierarchy of the pop-up windows if you don’t wish. Figure 46 illustrates a completely odd-ball set of start-end dates I created. Figure 46
Figure 47 shows what we get after creating the permutations. Figure 47

25
Figure 48 shows the simulation results. Figure 48
This manual mix-and-match approach can, actually, be pretty useful. Quants like to assume a model should be robust, that it should produce more or less the same kinds of results in all periods. Indeed, the traditional use of the Stefano date-variations is to assess this sort of robustness. Actually, though, conditions in the real world can vary so wildly, that perfect robustness may be just a pipe dream. We may, therefore, choose to separately examine several noteworthy market periods, such as 2001-02 (tech crash), 2002-03 (post-crash recovery), 2004-06 (more or less normal market), 2007-08 (general finance-led crash), 2009 (post-crash recovery), and 2010-2011(recent period) perhaps, some or all of which may include the typical time-shifted multiple runs. In this case, manual creation of the date-variation group can be preferable. (Remember to put one of your variations in Column C and identify all other columns as being part of Group 1.) Now, we’re ready to finish by combining rule variations and date variations. That would have seemed horribly complicated at the beginning, but based on what we now know about Stefano and Excel, it should seem quite easy.

26
Experimenting With Different Rule And Date Variations The key to combining date and rule variations is to remember that in all cases, we’re just dealing with groups. It doesn’t matter which group is numbered 1, which is numbered 2, etc. All that matters is that each group be properly identified in Row 1. Here’s a simple example in which we’ll use three variations on the sell rule (one of which will, of course, be the original) and five simulation periods set to start and end four weeks apart. Let’s start with the Sell-Rule variations. Figure 49
Next, in the interest of convenience, let’s use the menu to add our date variations. Figure 50

27
Figure 51
Notice how in this case two new rule-variation columns were added (to bring the total, including the original rule) to three, and how four new date variation columns were added (to bring the total, including the original pairing) to five. The rule-variations are Group 1 because that’s the one I input first. The date variations are group 2. Here’s what we get after clicking to “Create Permutations.” Figure 51
Notice how we have 15 possible combinations (permutations) of date-pairings and sell rules. Figure 52 shows what the sheet named “Sheet1 Imp” looks like if after I manually add a third group to address minimum-price Buy Rule variations. (Notice Row 1: Don’t forget to label the group!)

28
Figure 52
That’s going to boost the number of permutations to 45, as we (partially) see in Figure 53. Figure 53

29
Stefano does the grunt work in arranging all the permutations. All we need do is keep the groupings straight on the “Sheet1 Imp” worksheet. How far can this be pushed? Stefano’s P123 Manager can run up to 100 simulations at one time. So actually, the set of permutations illustrated in Figure 53 is a bit less than half as large as it can be. But there is another constraint: your ability to absorb and evaluate the output. Each user will have a different threshold. I suspect, though, that it’s much easier to approach the 100 limit if you’re dealing with one large date-variation grouping, or perhaps one date-variation grouping and one more to explore variations of one rule. Ultimately, though, this is a matter of personal preference. So long as you don’t exceed 100 permutations in all, you can mix and match as you wish.