how does financial market evaluate business models ... annual meetings... · how does financial...
TRANSCRIPT

HOW DOES FINANCIAL MARKET EVALUATE BUSINESS MODELS? EVIDENCE
FROM EUROPEAN BANKS
Stefano Cosmaa – Riccardo Ferretti
b – Elisabetta Gualandri
c - Andrea Landi
d – Valeria
Venturelli e,*
Abstract This paper investigates the way in which the financial market defines and
evaluates different business models/business mix, using a sample of listed European banking
groups, with a total asset value greater than 50 billion US$, for the period 2012-2015 . The
main results suggest that both net interest income and non -interest components foster market
valuation and that financial market seems to associate a better risk-return trade-off to non-
banking fees and commissions, compared to the banking ones. This evidence enables us to
identify 3 cluster of European banking groups based on the values that the market attributes to
the main components of income. These findings have strategic implications both for bank
managers, regulators and supervisors due to the impact of the crisis on banking business, bank
profitability and riskiness and the new challenges they entail.
keywords: banking strategies; business mix; market-to book value; panel data; cluster
analysis
EFM classification 510
Preliminary version
Please do not quote or cite without authors’ permission
a Department of Economics ‘Marco Biagi’, University of Modena and Reggio Emilia, Viale Berengario 51, 41121 Modena,
Italy, [email protected] and CEFIN, Centro Studi Banca e Finanza
b Department of Communication and Economics, University of Modena and Reggio Emilia, Viale Allegri 9, 42121 Reggio
Emilia, Italy, [email protected] and CEFIN, Centro Studi Banca e Finanza
c Department of Economics ‘Marco Biagi’, University of Modena and Reggio Emilia, Viale Berengario 51, 41121 Modena,
Italy, [email protected] and CEFIN, Centro Studi Banca e Finanza
d Department of Economics ‘Marco Biagi’, University of Modena and Reggio Emilia, Viale Berengario 51, 41121 Modena,
Italy, [email protected] and CEFIN, Centro Studi Banca e Finanza
e Department of Economics ‘Marco Biagi’, University of Modena and Reggio Emilia, Viale Berengario 51, 41121 Modena,
Italy, [email protected] and CEFIN, Centro Studi Banca e Finanza
* Corresponding author

2
1. Introduction
The paper addresses the question of strategic drivers in the banking sector and proposes an
innovative approach that aims to understand how and by which measures the different bank
business models (BMs) contribute to profitable bank strategies in terms of market evaluation.
The relevance of the topic is due to the impact of the crisis on banking business, bank
profitability and riskiness. All these factors have determined new challenges facing banks on
the one hand, and regulator and supervisors on the other hand.
From the managerial point of view, the crisis has caused a deep revision of banks’ business
models (BBM) and the enhancement of their strategic ability to exploit market positioning
and business mix in order to create value.
From the point of view of banking supervision, the same interest is testified by the strong
focus on business model analysis (BMA) embedded in the SREP; it is also a key area of the
supervisory activity by the SSM in the Thematic Review in 2015 and 2016. BMA in banking
supervision aims to reveal a bank’s key vulnerabilities in the short run and the viability and
sustainability of its strategic plans in the short and medium terms. The supervisory assessment
not only regards the risks undertaken by each bank and therefore its vulnerability
(idiosyncratic risk in a micro-prudential perspective) but also its contribution to systemic risk,
in a macro-prudential perspective.
A key issue in BMA is the identification of bank business model types: which variables and
typical characteristics should be considered? Another issue regards the definition of clusters
of banks with similar business models to develop the peer analysis. The peer analysis is a
technique often used by supervisory authorities (SREP) and the definition of peers is a crucial
point since the allocation of certain banks to a specific peer group may create problems in the
analysis and determine misleading results as the intermediary meets several of the
characteristics of different business models.
From the shareholder point of view, the banking business model is an important element in
the evaluation of banks’ ability to create value. In a phase of high volatility of financial
markets and relevant needs of fund raising, it is crucial to understand how the market assesses
and evaluates a bank’s process of restructuring and the changes in the strategies and business
mix. As a consequence, the market evaluation of the viability and sustainability of each
bank’s business model is an important element in the management strategic choices.
Therefore, a key question is whether banking supervisors take into consideration the market
evaluation of the strategic positioning of the supervised banks.
In the last two decades, the business model (BM) has become a key managerial concept but
still now there is not a widely accepted definition in the economic literature, mainly based on
strategic management studies, and some limits and difficulties are evident when applied to the
financial sector. Notwithstanding the plurality of definitions, there is consensus in believing
that BM offers a useful holistic perspective for understanding not only what businesses do but
also how they do it.
In our work we consider business models as the result both of portfolio choices and of
strategic abilities to exploit the market positioning in order to create value in the different
business areas. The portfolio choices find evidence in the different mix of strategic business
areas (SBAs) which reflect how the “first level long-run strategies” (like differentiation,

3
growth, diversification, internationalization) are translated into organizational features of
different combinations of product/customers/resources to create and capture value. The
strategic abilities embrace the managerial choices that pursue revenue enhancement, cost
efficiency, risk management in the different business areas as to capture value from the
adopted business mix.
The main research question of the paper concerns the way in which the market define and
evaluate different business models/business mix.
Respect to the previous works, our paper represents one of the first attempt to directly assess
the risk/return implications of strategic drivers and of different product mixes implemented by
the most relevant European banks. In this paper, we prefer capital market data (Price to
tangible book value) to accounting data, because equity prices are forward-looking and hence
better identifiers of prospective performances and risks associated with different strategic
choices, and also of intangible values. We use an income composition approach, rather than a
balance sheet approach, with a finer classification of the commissions and fees: Banking
Commissions - that measure the income from banking and lending related services – and
Market Commissions - that measure the income from securities, asset management, insurance
and other financial services. Moreover, we use other strategic variables concerning
“efficiency and risk strategies” like operating efficiency and risk factors.
These choices enable us to classify European banking groups on the values that the market
attributes to the main components of income once we control for the effects on market value
of other strategic variables. To our knowledge, this is one of the first study that identify
clusters on the basis of market value.
Our sample (proprietary data set) is made up of consolidated accounting data, for the period
2012-2105, of listed European banking groups with a total asset value greater than 50 billion
US$ at 2015. The final dataset includes 184 bank-year observations corresponding to 48 bank
holding companies (BHCs) belonging to 14 countries. We select 31 banks from 9 countries in
the Euro area, accounting for around 70% of the EMU's total banking assets, plus 15 Non-
EMU banking groups. Italy and Spain account for the majority of banks in the sample, given
the fragmentation of their banking system.
The main result is that both net interest income and non-interest components foster market
valuation; in fact both of them positively impact on market value. Disentangling the
components of net fees and commission income reveals that financial market seems to
associate a better risk-return trade-off to non-banking fees and commissions, compared to the
banking ones. Moreover, as expected, financial market negatively reacts to an increase in the
level of operating expenses, of the cost of credit and of the degree of systemic risk. Our major
empirical findings remain qualitatively unchanged even considering price to tangible book
value measured at different time interval.
These results have then been used in order to define the weight of the different business mixes
at market value; this exercise enables us to identify 3 business models, using cluster analysis
methodology. The different clusters do not show significant differences in terms of
performance measure, with two principal exceptions. On one hand, risk return profile is
higher for “Market oriented banks” while the probability of default, proxied by the Zscore, is
higher for “Retail banks” group which encloses banks more linked to traditional banking
business. The second cluster, “Retail diversified”, stands between the other two groups.

4
The paper is structured as follows. Section 2 reviews the theoretical and empirical literature
on Banking Business Model (BBM) by drawing on the main concepts adopted in the strategic
management literature. Section 3 presents the econometric methodology and the data used.
Section 4 describes the results. Finally, Section 5 concludes.
2. Literature Review
Evolving market conditions, technological innovations, regulatory changes, and current
monetary policy stance challenge the sustainability of banks’ business models. The “business
model question” is increasingly grabbing the attention of bank managers, regulators, investors
and financial analysts. The need to use the business model concept as a tool for analyzing the
bank’s performance and assessing its viability asks, first of all, for a clear understanding of
what “business model” means, since the existing literature does not offer a uniform picture
(Klang et al., 2014)..
We start by drawing on the strategic management studies to deepen and specify the concepts
of corporate strategy, business strategy and business model. Three different strands of
literature deal with BMs: IT and e-business, strategy, and strategic groups. In the former, the
BM symbolizes how a firm creates, distributes, and captures value. In particular, this
literature has developed a BM concept aimed to embrace all the elements and relationships
that enables IT-based or Internet-based firms to generate value. It follows the idea that the
system (a sort of gestalt) creates more value than the sum of individual parts and the BM is
essential to enhance it (Amit and Zott, 2001; Zott et al. 2011). Therefore, according to these
analyses, BM is interpreted as a representation of the set of decisions, activities, and
relationships between them that explain how an organization creates, delivers (to its
stakeholders, including customers) and captures the value (Osterwalder and Pigneur 2012),
building a sustainable competitive advantage in defined markets (Morris et al., 2005). Often
these contributions tend to give greater emphasis to some components of this systemic
representation. Some stress how the firms generate value, i.e. the value proposition (Baden-
Fuller and Haefliger, 2013), or how they optimize the structure of cost/revenue (ie. the value
capture); some others focus on the way in which the relationships with the enterprise’s
network (suppliers, customers, delivery channels, partners, competitors) increase value.
Notwithstanding the different focus on BM components, there is consensus on the idea that
BM offers a useful holistic perspective for understanding not only what businesses firms do
(e.g., what products and services they produce to serve needs of customers in addressable
market spaces) but also how they do it (e.g., how they bridge resources and product markets
in serving the needs of customers). So that BM becomes a new unit of analysis which puts an
emphasis on firm’s activity system to create value as well as to capture it (Zott et al., 2011).
In the second field of studies, strategy, recognised as the foundation of competitive advantage
and value creation (Porter, 1996), involves two levels of execution: corporate (what) and
business (how). Corporate strategy (Ansoff, 1965) delineates the amplitude and
diversification of the company’s business portfolio in terms of Strategic Business Areas
(SBAs); it is the set of high-order (first level) long-run choices such as growth, size,
governance structures, diversification, internationalization. It answers the question as to

5
where we have to compete. Business strategy (second level) identifies how to achieve the
competitive advantage in each SBA. Some scholars (Shafer et al. 2005) see a clear distinction
between strategy and BM: strategy focuses on market and external competition while BM has
a more operative nature focusing on the internal consistency of strategic choices (operative
approach). For some others (Mottura, 2011), BM and strategy are different but strongly
related since BM is the direct result of a firm’s realized strategy (systemic approach). A
systemic approach is detectable in the latter strand as well, but with reference to groups of
companies with similar strategies (strategic groups) instead of single firm. Cluster analysis of
data at firm’s level is adopted to identify the strategic groups (Short et al. 2007, Leask 2004);
since the input data are usually the result of both strategic and operative choices, the overlap
between strategy and BM is amplified.
Figure 1 – BM definition: the different approaches of management literature
This theoretical framework guides our review of the Banking Business Model (BBM)
literature. In banking, corporate strategy (what) leads to SBAs choices reflected in the
business mix (asset & liability composition and income composition), while business strategy
(how) relates to the management of revenues, efficiency, and risk in each SBA. Business mix
and business strategy are the components of the BM and the factors affecting performance
indicators (profitability, risk levels, market value).
Both long-run and business strategies are affected by the macroeconomic, competitive and
regulatory variables. These context variables have ex ante effects on bank strategies and their
BM in so far as they condition the hypothesis the strategic plans are based on. Ex post they
directly affect the way in which the business strategies reach the targeted results.
6
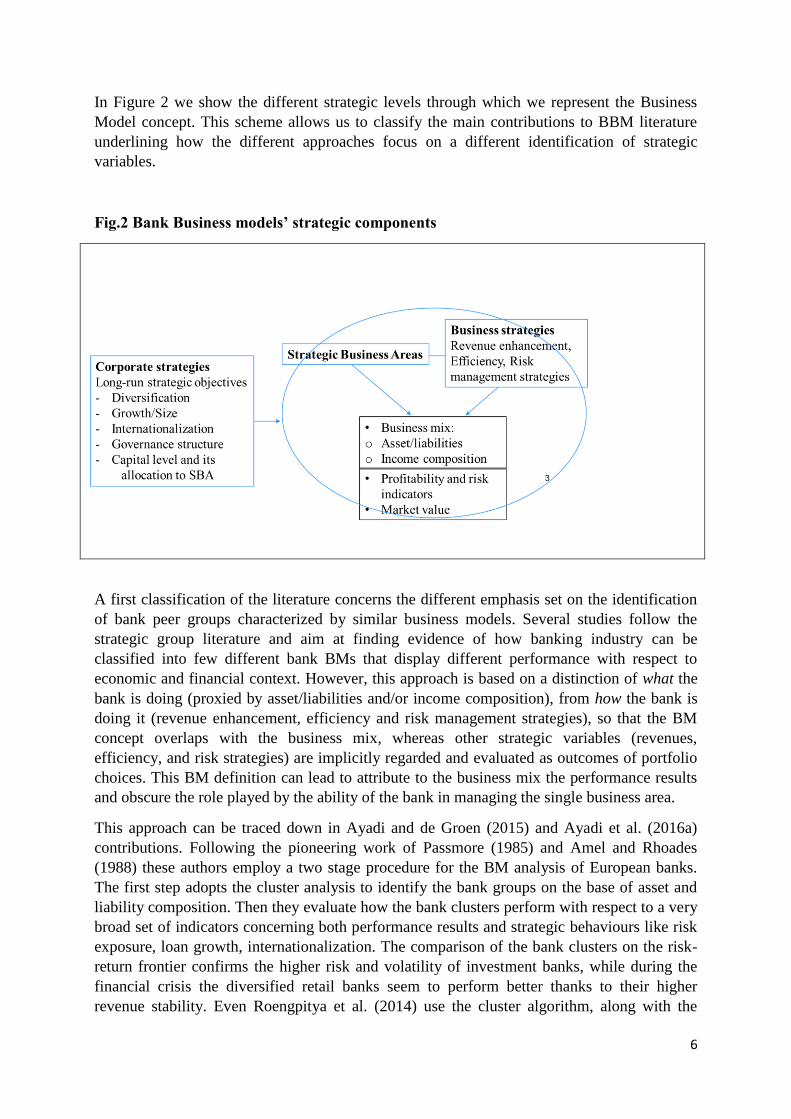
In Figure 2 we show the different strategic levels through which we represent the Business
Model concept. This scheme allows us to classify the main contributions to BBM literature
underlining how the different approaches focus on a different identification of strategic
variables.
Fig.2 Bank Business models’ strategic components
A first classification of the literature concerns the different emphasis set on the identification
of bank peer groups characterized by similar business models. Several studies follow the
strategic group literature and aim at finding evidence of how banking industry can be
classified into few different bank BMs that display different performance with respect to
economic and financial context. However, this approach is based on a distinction of what the
bank is doing (proxied by asset/liabilities and/or income composition), from how the bank is
doing it (revenue enhancement, efficiency and risk management strategies), so that the BM
concept overlaps with the business mix, whereas other strategic variables (revenues,
efficiency, and risk strategies) are implicitly regarded and evaluated as outcomes of portfolio
choices. This BM definition can lead to attribute to the business mix the performance results
and obscure the role played by the ability of the bank in managing the single business area.
This approach can be traced down in Ayadi and de Groen (2015) and Ayadi et al. (2016a)
contributions. Following the pioneering work of Passmore (1985) and Amel and Rhoades
(1988) these authors employ a two stage procedure for the BM analysis of European banks.
The first step adopts the cluster analysis to identify the bank groups on the base of asset and
liability composition. Then they evaluate how the bank clusters perform with respect to a very
broad set of indicators concerning both performance results and strategic behaviours like risk
exposure, loan growth, internationalization. The comparison of the bank clusters on the risk-
return frontier confirms the higher risk and volatility of investment banks, while during the
financial crisis the diversified retail banks seem to perform better thanks to their higher
revenue stability. Even Roengpitya et al. (2014) use the cluster algorithm, along with the

7
adoption of some judgmental criteria, and balance sheet ratios to classify the BMs of a large
sample of listed and non-listed banks from 34 countries, in the period 2005-2013. When
valued in terms of performance the retail funded group displays the highest average level and
the lowest variability of profitability over time. The trading banks are the group with the
highest volatility of return on equity and cost base. The wholesale funded group stands
between the other two groups in term of return levels and volatility. The study finds
significant shifts across different BMs before and after the crisis and the performance
statistics show that the change in banks’ BM induced a prevailing worsening in profitability.
A different result with respect to migration between bank clusters over time is that showed by
Franch and Zochowsky (2016) in their classification of European banks in the period 2007-
14. Comparing the high numbers of bank clusters based on size, asset/liability and income
composition indicators, they find that most of the banks remained in the same group as
evidence of “sticky” business models not easily adapting to a changing environment or in
anticipation of stress. De Meo et al. (2016) adopt an original fuzzy clustering technique based
on a broad set of asset/liability mix indicators of listed and non-listed European banks (77 for
15 countries) for the period 2006-14. They individuate three main clusters of banks: Retail,
Diversified, Investment banks. Then each group has been split according to four EBA
classification criteria (systemic relevance, dimension, organizational complexity, cross border
activity) the authors consider as attributes of strategic choices. Among the eight resultant peer
groups, retail banks show the highest return on asset in the years preceding the financial crisis
but the worst performances at the peak of the sovereign debt crisis as effect of the
deterioration of credit quality. The specificity of bank strategies is the focus of Mergaert and
Vennet (2016) analysis. They define the BM in term of the strategic variables that reflect the
long-term choices of management (latent strategies) related to assets and liabilities
composition, capitalization, income structure and bank’s risk profile. The common variance
of these variables are the factors that define two broad BBMs: retail and diversified. The
authors underline the graduation of these models and use the common factor analysis to
evaluate both how these long-run strategies are implemented and their impact on
performance. The authors conclude for a substantial variation of business model effects over
different bank types and show that retail-oriented banks perform better in terms of both
profitability and stability and that diversification improves profitability, but also increases
probability of distress. A different approach to the grouping of European bank is employed by
Bonaccorsi et al. (2016). They classify 112 significant European banks following a step
procedure based on threshold values of balance sheet parameters like size, lending propensity,
international credit exposure. Moreover, they qualify a priori two groups represented
respectively by Network and Public Development banks. The study points to the
macroeconomic conditions as the main driver of current differences in profitability across
bank types, whereas the riskiness seems reflect both differences in borrowers’ riskiness and
the extent to which IRB models are employed by banks. How the management of risk weights
is linked to the BM adopted by banks is the theme the study of Ayadi et al. (2016b) is focused
on. By applying the Ayadi et al. (2016a) cluster approach and using the same group
classification, the authors provide evidence of the different degree of regulatory arbitrage
across bank business models. Notably the IRB adoption seems to have a positive effect on the
riskiness of the Retail diversified banks, signalling the existence of regulatory arbitrage taking
place within this banking business model, possibly via Basel risk weights manipulation.

8
A second stream of the BM literature in banking relies on a wide definition of BM that
combines corporate and business strategies with context variables. According to our scheme
this approach has the merit of considering many strategic aspects of a BM even if these
studies often fail to make a clear distinction between long-run strategies, business mix and
business strategies. The primary aim of this approach is the identification of which BM
variables affect the banks vulnerability, reflecting the supervisors’ concerns for the
consequences of bank strategies on default events. Most of the studies deals with the risk of
individual banks. When the analysis extends to the systemic risk relevant implications for
regulators emerge: some BM variables have opposite effects on bank tail risk and its exposure
to severe shocks in the financial system. This approach characterizes the work of Altunbas et
al. (2011) who use a broad set of bank characteristics to individuate BMs. Three risk
measures of a large sample of European and US banks are regressed on some groups of
indicators, collected in the pre-crisis period. These should denote different banks’ BMs: asset,
funding and income structure variables along with indicators like loan growth, capital ratio,
total asset and a number of variables that account for major macroeconomic and institutional
factors. Therefore their definition of BM includes business mix variables along with some
other strategic variables concerning growth, capitalization and size. These strategic variables
along with the reliance on short-term market funding are statistically significant in explaining
the bank distress. Köhler (2014) follows a similar approach relating the Z-logscore to some
business mix and loan growth variables for a large sample of European banks. The analysis
evaluates the relation with regard to the main institutional bank categories: commercial,
saving and cooperative, investment banks with a focus on listed banks. In Köhler (2015) the
same risk indicator is regressed on two main business mix variables (non-interest income
share and non-deposit funding as a fraction of total asset) and then integrated with many other
control variables. The approach is similar to that adopted by Demirguc-Kunt and Huizinga
(2010) for an international sample of 1,334 banks in 101 countries leading up to the 2008
financial crisis. The econometric study of Köhler confirms some results found in the bank
diversification literature pointing to the risk of shifting the bank activity on the financial
markets (securities and wholesale fund market). Even in a recent study of ECB (2016) on a
sample of 143 euro area banking groups over the period 1995-2014, the z-score variable is
regressed on several bank-specific business model characteristics, including some business
mix measures (like retail ratio, income diversification, short term borrowing), the cost-to-
income ratio, a leverage ratio and size. Other explanatory variables regard, macroeconomic
conditions and structural market features. In the pre-crisis phase the income diversification is
associated with higher default risk whereas during and after the emergence of the financial
crisis more diversified banks displayed lower default risk levels.
The bulk of these studies focuses on the nexus between BM variables and individual bank
risk, whereas only few of them deal with the effects of strategic choices on systemic risk. An
analysis of the nexus between business models variables and measures of individual and
systemic bank risk based on market values is that proposed by Van Oordt and Zhou (2014)
who rely on stock market data from CRSP of US Bank Holding Companies from 1991 to
2011. Drawing on the literature on market risk the authors separate two dimensions of banks’
systemic risk: the bank tail risk and the linkage between a bank’s tail risk and severe shocks
in the financial system. As expected they find a stronger dependence between large banks and
the systemic risk, that is a positive association between size and the sensitivity to severe
shocks in the financial system (approximated by severe changes in the financial sector index).
9
2.1. Novelty of our contribution
With respect to the current BM literature our paper presents some significant differences.
Firstly, we estimate the performance of different banks’ BMs in terms of market value instead
of using accounting performance data. Following Baele et al. (2007) and Calomiris and
Nissim (2014), we believe that equity prices are forward-looking and hence better identifiers
of prospective profitability and risks of the different strategic choices. By taking into account
the banks’ intangible assets, associated to relationship banking and bank’s reputation, the
market analysts evaluate the qualitative information and the strategic drivers of specific bank
performance (Chen et al., 2014).
Secondly, the estimation of the effect of BMs on banks’ Price to book values is based on a
definition of BM which includes the business mix variables (proxied by income components)
and other strategic variables concerning “efficiency and risk strategies” like operating
efficiency, risk behaviour (Beta and loan loss provisions). By keeping separated the business
mix variables from the other ones, we estimate how the market evaluates the different
business components and, as a second step, we use the estimated market value of these
business components to individuate cluster of banks. The novelty of our approach is the
classification of bank groups based on the values that the market attributes to the main
components of income once we take into account the effects on market value of other
strategic variables. To our knowledge, this is one of the first study that identify clusters on the
basis of market value.
As already outlined, in our study the business mix is proxied by the income composition. We
prefer the income approach to the balance sheet composition as the former captures in a finer
way the important bank service activity. By focusing on a sample of large banks we are able
to propose a finer classification of the net fees and commissions income. We distinguish the
Banking Commissions, that measure the income from banking and lending related services,
from the Market Commissions that measure the income from asset management, insurance
and other financial services. We are aware that income variables reflect product/customer
combinations but also incorporate the bank pricing policies. According to our scheme these
policies should belong to the strategic variables that explain how the bank is effective and
efficient in delivering products and values to customers. By taking into account the high level
of price competition in the banking markets and the precious informative content of income
variables (whose values reflect the different types of products and segment of customers) we
believe that the last ones are more suited to capture the contribution of business mix to the
bank value.
3. Methodology and data
3.1. Data
The bank sample is made up of 48 banking groups belonging to fourteen European countries.
The composition of the sample by country is provided in the appendix [Table A.1]. We have
only considered consolidated data of listed European banking groups with a total asset value

10
greater than 50 billion US$ at 2015. Bank-level data come from the annual balance sheet. We
exclude banks with missing data on basic accounting variables, including assets, loans,
deposits, equity, interest income, non-interest income and commissions. We use the last four
years of data, 2012–2015. The starting date is 2012 since we limit our analysis to a period in
which banks, after the peak of the crisis, are reorganizing their activity.
The final dataset includes 184 bank-year observations corresponding to 48 bank holding
companies (BHCs) belonging to 14 countries. We select 31 banks from 9 countries in the
Euro area, accounting for around 70% of the EMU's total banking assets1, plus 15 Non-EMU
banking groups. Italy and Spain account for the majority of banks in the sample, given the
fragmentation of their banking system.
Differently from other studies (DeYoung and Roland, 2001; Chiorazzo et al., 2008) we
analyze the bank BM using consolidated accounting data. This latter choice is of particular
importance for several reasons: on the one hand banks tend to reserve the making of non
traditional innovative activities to non-banking subsidiaries whose contribution can be more
precisely evaluate if consolidated financial statements are available; on the other hand,
diversification benefits may exist for the institution as a whole and not for the single
subsidiary. Moreover, financial holding company represents the relevant unit of observation
for regulators on extremly important topic such as the level of systemic risk (Stiroh and
Rumble, 2006).
3.2. Measure of banks’ business mix
To determine the results of choices concerning bank business mix, asset-based measure
and/or income-based indicator can be used. Ideally to measure the array of bank activities,
detailed data on the degree to which each bank underwrites, operates mutual funds, insurance,
etc should be used. The available dataset do not provide information with this type of detailed
information on the different type of activities engaged. So several authors construct revenue
based measure that suffers from larger measurement problems than the asset-based measure
(Laeven and Levine 2007). In fact, loans and in general more traditional activities can yield
fee income; in this way the income-based measures that do not disentagle the different fee and
commission components could overestimate the degree to which some lending institutions
engage in non-lending activities. For instance, DeYoung and Rice (2004) show that payment
services linked to traditional banking activities are the largest source of non-interest income
for U.S. banks. Brighi and Venturelli (2014, 2016) find similar results for Italian BHCs.
In line with our research question, we construct several business mix measures detailed in the
remainder of the section.
The first type of business mix analysed is the one related to the diversification across different
sources of income. Traditionally in literature (Stiroh, 2004, 2006a, 2006b; Lepetit et al., 2008)
one way to capture the degree of diversification of bank activities is to consider the net
interest income generated by traditional activities and non-interest income produced by non-
traditional ones. To account for diversification between major activities, we consider on the
one hand the ratio between net interest margin over tangible book value (INT) and on the
other the ratio between net commission and trading income over tangible book value (NON).
1 2014 figures.
11
The second set of indicators relate to the diversification between different sources of non
interest income. Following the seminal work of DeYoung and Roland (2001), Stiroh (2004),
Mercieca et al. (2007) and Lepetit et al. (2008) to allow for deeper insights, we have first of
all to distinguish the principal components of non-interest income. Two principal components
have been identified: net fee and commission (COMM) on the one hand and the net results
from trading activities (TRAD) on the other.
The third step is to verify the degree of diversification within the commission revenues. To
mitigate the overestimation problem, the analysis of the balance sheet information enable us
to disaggregate fee income in relation to the type of activities developed. In particular, we
divide net fees and commission revenue along three principal dimensions:
- Banking Commissions (BANK), that comprise commission income from
guaranties given, lending related, collection and payment services, services related
to factoring, tax collection services, current accounts management and other
services;
- Market Commissions (MKT), fee and commission revenue from credit derivatives,
trading operations in financial instruments and foreign exchange, custody and
administration of securities, underwriting operations, servicing related to
securitization, placement of securities, financial structure consultancy service, fees
from portfolio management services, depositary bank services, investment
consultancy service and from the distribution of third party products and services;
- Other commissions (O), that comprise commission income that cannot be allocated
to one of the previous categories since banks balance sheet do not disclose related
information.
To our purpose, the variable total net fees and commission income (COMM) is the sum of
Banking and Market commission; in other words in our analysis we do not take into
consideration the aggregate Other commission given classification problems.
This disaggregation enable us to identify a more precise measure of the traditional banking
business. To this end, banking commission have been first of all added to net interest margin
in order to define the variable ADJ_INT = INT + BANK.
All variables are computed as the fraction over the tangible book value.
3.3. Market based and accountancy performance measures
Market based performance is measured in terms of Price to tangible book value (TBV). We
measure the market-to-tangible book ratio as the ratio of market value of common equity at
year end to tangible common equity (PTBV). This indicator is used in the first part of the
analysis when we evaluate how the market values the business mix and the other strategic
variables.
Several alternative proxies of bank accountancy performance are employed when we compare
the performance of the bank clusters: the return on average assets (ROAA) defined as the ratio
of net profits to total average assets. To adjust this measure for risk (volatility), following
Stiroh (2004) and Chiorazzo et al. (2008) we compute the ratio between the annual ROA and
its standard deviation calculated over the entire sample period. SHROAi,t indicate risk-
adjusted returns, for the bank i in the year t. Analytically:

12
i
ti,ti,
σROA
ROASHROA
Finally as in Stiroh (2004) we introduce a measure of insolvency risk computed in terms of
the Z-score. The Z-Score is a proxy for insolvency risk and is measured by how many
standard deviations a firm is away from insolvency. A higher Z-Score indicates improved
risk-adjusted performance; in other words, higher values of Z-score imply lower probabilities
of failure. Analytically:
ti
ti
ti
ti
tiROA
TA
EROA
scoreZ,
,
,
,
,
where E/TA is the equity-to-total asset ratio (equity capital divided by total assets).
3.4. Efficency and risk variables
To proxy bank’s credit quality we use the ratio Loan loss provision over Tangible book value
(LLP).
To measure the effect of efficiency on bank profitability (COST) we introduce in the analysis
the ratio of operating expenses over Tangible book value. The variable operating expenses is
computed as the sum between personnel expenses and other administrative expenses.
As a proxy for bank risk and leverage we use the variable Beta (BETA). The BETA of each
bank were obtained by estimating, with the OLS method, the market model. More precisely,
the BETA of bank j for the year t was estimated using daily returns in local currency of the
bank j in year t. The returns of the market portfolio are those of the S & P 100 E GLOBAL -
PRICE INDEX in Euros.
Processing the R2 of these regressions, we also build another variable named
INTERNATIONALIZATION. In detail, the INTERNATIONALIZATION index of bank j in
year t is the difference between the R2 of the market model of the bank j in year t and the
average R2 in year t computed for the entire sample of banks in the year. Also this variable is
employed when we compare the performance of the bank clusters.
3.5. Empirical methodology
The approach is based on the panel fixed effect relationship between the market-to-book ratio
(our dependent variable) and proxies for bank activities, which are based on measures derived
from accounting concepts. We are able to capture how a greater focus on the traditional
business, captured by net interest income, for instance, affects the bank’s market value.
We use the econometric models shown to examine the link between market performance and
the business mix. In particular:
ti,
5
3sti,sti,2ti,1ti,ti, ελβNONβINTβαy
(1)

13
i,t
6
4si,tsi,t3i,t2i,t1i,ti,t ελβTRADβCOMMβINTβαy
(2)
i,t
7
5si,tsi,t4i,t3i,t2i,t1i,ti,t ελβTRADβMKTβBANKβINTβαy
(3)
ti,
6
4sti,sti,3ti,2ti,1ti,ti, ελβTRADβMKTβADJ_INTβαy
(4)
where i identifies the individual bank-observation belonging to the sample (i = 1, 2, 3,...,48); t
expresses the time variable (t = 2012,…, 2015); s are the parameters to be estimated, is a
matrix of efficiency and risk variables. Both the constant and the error terms are also
indicated in the model.
INT is the ratio between net interest income over tangible book value, NON is the ratio
between non traditional revenues (BANK, MKT, TRAD) over Tangible book value, COMM
is the ratio between net commission income computed as the sum of banking (BANK) and
market (MKT) commission. TRAD is the ratio of trading profit, BANK is the ratio of banking
commission, MKT is the ratio of market commission and finally ADJ_INT is the ratio of net
interest margin adjusted for banking commission (INT+BANK), all variables computed as the
fraction over the Tangible book value.
The other variables control for factors, related to the efficiency and risk sphere, potentially
affecting the market valuation.
Results of Model 3 have been then used to define the weight of the different business mixes at
market value. First of all, we computed the fitted PTBV or in other terms we calculated the
linear prediction from the fitted model for the PTBV for the different banks and for the
different year. Then we averaged it out for the single individual bank along the 4 years time
span obtaining the average predicted PTBV for each bank. To define the weight we proceeded
as follow.
In model 3, the variables that describe the banks’ business mix are INT, BANK, MKT,
TRAD. For each of the four variables, we first compute the average over the time span; then
we multiply the average for the coefficient of the panel fixed effect model. Finally, for each
bank in the sample, we compute the weight as the fraction of the market value of the variable
over the average fitted PTBV.
Once defined the weight of the different lines of income, we use them in order to identify
bank groups, using cluster analysis methodology. We use Ward’s cluster analysis technique
(Ward, 1963) which is an agglomerative hierarchical clustering method that forms clusters on
the basis of minimising within group variance.
A list of the variable used is presented in Table 1.
[Table 1 around here]

14
4. Empirical Results
4.1. Descriptive statistics
Table 2 reports the descriptive statistics for the sample of European BHCs. These banks are
quite varied with mean average assets of € 559 billion that range from € 34.6 billion to €
2,210 billion. UK and French banks are the largest, with an average total assets of € 1,337.4
and € 1,112.5 respectively. Our sample includes both low and high performing BHCs both in
terms of market and accounting measures; the mean PTBV is 1.108 and the median is 0.945.
The mean ROAA is 0.171, with a median of 0.270.
As for business mix measures are concerned, the average (mean) bank generated 62.1% of its
revenues from net interest income, 27.3% from net fees and commission income and 10.6%
from trading profit. The composition of net fees and commission income shows a nearly equal
contributions of BANK (49.8%) and MKT (50.2%) commissions; this result testifies to the
relevance of fees and commissions linked to traditional banking business. Therefore banking
commissions, when added to net interest income, represent on average the 74.4% of the total
operating income.
[Table 2 around here]
4.2. Multivariate Analysis
The hypothesised existence of a positive relationship between market performance and
different business mixes, aims to understand how and by which measures the bank business
mixes contribute to profitable bank strategies in terms of market valuation proxied by price to
tangible book value (Table 3).
The main result is that both net interest income and non-interest components foster market
valuation (column 1); in fact both of them positively impact on value. When we control for
the different components of non-interest income a clearer picture emerges. On the one hand,
no statistically significant effect is evident with respect to trading profit (columns 2-3-4),
while, on the other, market commissions impact more on price to tangible book value than
banking ones (column 3).
The disaggregation of the net fees and commission income introduced in the present
contribution seems to represent a critical step in the understanding of how the financial
market evaluates the different banks’ business mix. Our results suggest that financial market
seems to associate to market fees and commissions, compared to the banking ones, a higher
value creation (i.e.: better risk-return trade-off).
Turning to the variables more linked to efficiency and risk factors, all of them produce results
consistent with our expectations. The market negatively reacts to an increase in the level of
operating expenses, of the cost of credit and of the degree of systemic risk (Table 3, columns
1-4). These results enable also to appreciate the choice of market value as dependent variable.
In fact, Price-to-tangible-book value captures directly both forward-looking market
expectations and also return and risk features of the different strategies as testified by the
significance of the risk factors (Beta and LLP). Differently from the more consolidated

15
literature that put into relation business model characteristics and risk, introducing risk as a
dependent variable (see Altunbas et al. 2011; Bonaccorsi et al. 2016), the choice to use market
value enable us to explicit and directly count for the risk dimension.
[Table 3 around here]
Results of Model 3 have been then used in order to define the weight of the different business
mixes at market value. Once defined the weight of the different lines of income, we use them
in order to identify business models, using cluster analysis methodology.
We identify 3 clusters. Cluster characteristics can be easily summarised with a radar plot
(Figure 1). Cluster 3, made up of 6 banks, includes banks “Market oriented” with the highest
incidence of market commissions and trading profits and the lowest rate of net interest
income. Cluster 1, made up of 17 banks, includes banks with the highest incidence of net
interest income and banking commissions and the lowest share of market commission (Retail
banks). The second cluster stands between the other two groups. It is composed by 22 banks
“Retail diversified” that show a higher incidence of market commissions than cluster 1 but
lower than cluster 3, and a lower ratio of net interest income and banking commission than
cluster 1 but higher than cluster 3. In Table 4 we summarize the principal characteristics of
the groups identified.
[Table 4 around here]
Cluster 3 is characterised by the highest ratio of operating costs on tangible book value,
confirmed also by the highest cost to income ratio, and by the lowest cost of credit risk. These
are banks characterised also by the highest degree of internazionalisation.
The different clusters do not show significant differences in terms of performance measure,
with two principal exceptions. On the one hand, the value creation (the risk-return tradeoff) is
higher for Cluster 3 as testified by the highest Price to tangible book value while, on the other
hand, the probability of default, proxied by the Zscore, is higher for Cluster 1 which encloses
banks more linked to traditional banking business. These results are in line with De Meo et al.
(2016).
From the perspective of the efficiency and risk strategies (our second level of BM definition,
that is the managerial choices that pursue revenue enhancement, cost efficiency, risk
management in the different business areas to capture value from the adopted business mix),
the clustering based on the business mix reveals differences in all our measures of efficiency
and risk (operating costs, internationalization, credit risk), except beta. This means that the
bank’s systematic risk, and consequently its cost of equity capital, does not depend on the
business mix only. Therefore, the way in which the business mix is managed seems to be
relevant especially for the non-diversifiable risk profile of the bank.
4.3. Robustness checks

16
In this section, we investigate the likely impact of different measures of bank market
performance.
At this purpose, we re-run our baseline Model (Model 3) changing the definition of PTBV
employed. We use PTBV measured at subsequent periods of time (Table 5). In column 1, we
use year-end PTBV for year t as in Table 3; in the subsequent columns (2-6) we use PTBV
computed respectively at the end of January, at the end of February, at the end of March, at
the end of April and at the end of May of year t+1. The adjustment aims to control for the
date at which the accounting data enter into the market information set. In this sense, the end
of the year stock prices may not fully reflect the value implications of annual report
information. While generally financial statements are approved by the shareholders meetings
between the months of April and May; it is also true that the boards of directors approve the
financial statement proposals in previous months, between February and March, and
simultaneously they disclose key data. Even before this disclosure, the investors deal with
analysts' estimates centered on up to date information. So it is quite possible that on the one
hand at the end of the year t, the market capitalization already reflects the year t accounting
information as, on the other, that the value implications of annual report information on stock
prices follow a slower process. Following Calomiris and Nissim (2014), to control for this
potential bias and avoid the distorting effects of any capital increases or other extraordinary
operations, the market cap of the months from January to May of the year t+1 is computed
multiplying the end-of-year market value of common equity by one plus the cumulative stock
return till the reference date.
[Table 5 around here]
As can be seen in Table 5 also considering PTBV measured at different time interval, our
major empirical findings remain qualitatively unchanged with the exception of Beta that loses
its statistical significance.
5. Conclusions
This paper empirically investigates the way in which the financial market defines and
evaluates different business models/business mix, using a sample of 48 relevant listed
European banking groups, in the period 2012-2015.
We define business models as the result both of portfolio choices and of strategic abilities to
exploit the market positioning in order to create value in the different business areas. The
portfolio choices find evidence in the different mix of strategic business areas (SBAs) and are
proxied by the different business mix composition or the different income components.
Strategic abilities embrace the managerial choices that pursue revenue enhancement, cost
efficiency, risk management in the different business areas as to capture value from the
adopted business mix and are proxied by efficiency and risk factors included in the empirical
specification.

17
These choices enable us to classify European banking groups based on the values that the
market attributes to the main components of income once we control for the effects on market
value of other strategic variables.
The main results suggest that both net interest income and non interest components foster
market valuation and that financial market seems to associate to non banking fees and
commissions, compared to the banking ones, a higher value creation (i.e.: better risk-return
trade-off). Moreover, as expected, financial market negatively reacts to an increase in the
level of operating expenses, of the cost of credit and of the degree of systemic risk. Our major
empirical findings remain qualitatively unchanged even considering price to tangible book
value measured at different time interval.
This evidence enable us to identify 3 cluster of European banking groups based on the values
that the market attributes to the main components of income. The different clusters do not
show significant differences in terms of performance measure, with two principal exceptions:
risk return profile is higher for “Market oriented banks” while the probability of default,
proxied by the Zscore, is higher for “Retail banks” group which encloses banks more linked
to traditional banking business. The second cluster, “Retail diversified”, stands between the
other two groups.
These findings solicit some interesting considerations also in terms of policy implications.
First of all, our study contributes to define the concept of BM and stresses that BM includes
not only strategic variables related to the asset mix composition but also efficiency and risk
variables that most contribute to shareholders’ and customers’ value. Given this, it is
necessary to deepen and to analyze the nexus between these variables to understand the
strategic decisions interdependencies and their connection with banks performance.
Our analysis suggest that financial market seems to associate a better risk-return trade-off to
market-oriented banks. This result is not linked to the more intense trading activities
developed by these banks but to the wide and articulated range of services related to custody
and administration of securities, to underwriting operations, to portfolio management and
advisory service. Although it is a bunch of activities with a high incidence of operating costs,
it allows to achieve a level of revenues that is reflected in a higher market value. The
conclusions of our work on this topic are not in line with the prevalent literature on bank
diversification that indicates that the higher revenues linked to security activities are more
than offset by the higher level of risk associated to this market activity.
From the point of view of the banking supervision, business model analysis (BMA) embedded
in the SREP should take into consideration capital market data since equity prices are
forward-looking and hence better identifiers of prospective performance and risks associated
with different strategic choices. Our study shows how the different variables that affect BM
are associated to different market values. Since SREP exercise is developed also in order to
evaluate the bank capital adequacy, the point of view of the market should not be ignored.
The last consideration is associated to the theme of information disclosure. As underlined
before, from the shareholder point of view, the banking business model is an important
element in the evaluation of banks’ ability to create value. This valuation is strictly connected
to the type, amount and quality of information disclosed.

18
In the most consolidate literature on bank diversification, one way to capture the degree of
diversification of bank activities is to consider net interest income generated by traditional
activities and non-interest income produced by non-traditional ones in aggregate term or at
best, distinguishing the two principal components of non-interest income: commission and fee
revenue on the one hand and the net results of financial operations on the other. The aggregate
analysis of the net fee and commission income does not allow for their allocation to the
various areas of banking activity. In the recent literature on banks’ BM a classification of
business activities based on the composition of the balance sheet assets and liabilities prevails
in order to overcome the limitations associated to aggregate income measures.
We overcome the limitations associated to aggregate income measures by identifying those
banks that provide detailed data on fees and commission income. In fact, our study deals with
the main European banks for several reasons: because of their systemic importance, for their
greater articulation by business segments and last but not least for the deeper and more
detailed disclosure of balance sheet information provided. This type of informational
disclosure enable us to disaggregate fee income in relation to the type of activity developed.
Based on this breakdown, our study allows to distinguish the market value created from
services more linked to traditional banking business from those associated to financial
markets.
To conclude, our contribution also shows the importance of disclosure and the need to
harmonize, among the different European countries, the reported breakdown of the different
sources of income. A finer classification of the net fees and commission components is
essential since they stem from activities materially different one from the other and given
their growing role in the formation of operating income and in conditioning bank
performance.
References
Altunbas, Y., Manganelli, S., Marques-Ibanez, D., 2011. Bank Risk During the Financial Crisis - Do
Business Models Matter?.
Ayadi, R., E., de Groen, 2014. Banking Business Models Monitor 2014: Europe, Montreal, Joint
Centre for European Policy Studies (CEPS) and International Observatory on Financial Service
Cooperatives (IOFSC) publication.
Ayadi, R., E., de Groen, W.P., Sassi I., Mathlouthi W., Rey H., Aubry O., 2016a. Banking Business
Models Monitor 2015: Europe, Alphonse and Dorimène Desjardins International Institute for
Cooperatives and International Observatory on Financial Service Cooperatives (IOFSC).
Ayadi, R., V. Pesic, and G. Ferri, 2016b. Regulatory arbitrage in EU banking: do business models
matter?, IRCCF Working Paper, Montreal.
Amel, D.F. and Rhoades, S.A., 1988. Strategic groups in banking. The Review of Economics and
Statistics, 70(4), pp.685-689.
Amit, R. and Zott, C., 2001. Value creation in e‐business. Strategic Management journal, 22(6‐7),
pp.493-520.
Ansoff, H.I, 1965, Corporate Strategy, McGraw-Hill.
Baden-Fuller, C. and Haefliger, S., 2013. Business models and technological innovation. Long range
planning, 46(6), pp.419-426.

19
Baele, L., De Jonghe, O. and Vander Vennet, R., 2007. Does the stock market value bank
diversification?. Journal of Banking & Finance, 31(7), pp.1999-2023.
Bonaccorsi di Patti, E., Felici, R. and Signoretti, F.M., 2016. Euro area significant banks: main
differences and recent performance (No. 306). Bank of Italy, Economic Research and International
Relations Area.
Brighi, P. and Venturelli, V., 2014. How do income diversification, firm size and capital ratio affect
performance? Evidence for bank holding companies. Applied Financial Economics, 24(21), pp.1375-
1392.
Brighi, P. and Venturelli, V., 2016. How functional and geographic diversification affect bank
profitability during the crisis. Finance Research Letters, 16, pp.1-10.
Calomiris, C.W. and Nissim, D., 2014. Crisis-related shifts in the market valuation of banking
activities. Journal of Financial Intermediation, 23(3), pp.400-435.
Chen, L., Danbolt, J. and Holland, J., 2014. Rethinking bank business models: the role of intangibles.
Accounting, Auditing & Accountability Journal, 27(3), pp.563-589.
Chiorazzo, V., Milani, C. and Salvini, F., 2008. Income diversification and bank performance:
Evidence from Italian banks. Journal of Financial Services Research, 33(3), pp.181-203.
De Meo, E., De Nicola, A. Lusignani, G. and Zicchino L., 2016. European Banks in the XXI century:
are their Business Models sustainable? (forthcoming).
DeYoung, R. and Roland, K.P., 2001. Product mix and earnings volatility at commercial banks:
Evidence from a degree of total leverage model. Journal of Financial Intermediation, 10(1), pp.54-84.
DeYoung, R. and Rice, T., 2004. Noninterest income and financial performance at US commercial
banks. Financial Review, 39(1), pp.101-127.
Demirgüc¸ -Kunt, A., Huizinga, H., 2010. Bank activity and funding strategies: the impact on risk and
returns. Journal of Financial Economics, 98 (3), 626–650.
ECB, 2016. Recent trends in euro area banks’ business models and implication for banking sector
stability, Financial Stability Review - Special Features, May.
Franch and Zochowsky (2016) Financial Stability Review, 2016.
Klang D., Wallnöfer M., Hacklin F., 2014, The Business Model Paradox: A Systematic Review and
Exploration of Antecedents, International Journal of Management Reviews, Vol. 16, 454–478.
Köhler, M., 2014. Does non-interest income make banks more risky? Retail-versus investment-
oriented banks. Review of Financial Economics, 23(4), pp.182-193.
Köhler, M., 2015. Which banks are more risky? The impact of business models on bank stability.
Journal of Financial Stability, 16, pp.195-212.
Laeven, L. and Levine, R., 2007. Is there a diversification discount in financial conglomerates?.
Journal of Financial Economics, 85(2), pp.331-367.
Leask, G., 2004, Is there still value in strategic group research?, Aston University, RP0404, January.
Lepetit L., E. Nys, P. Rous and A. Tarazi, 2008. “Bank income structure and risk: An empirical
analysis of European bank”s. Journal of Banking and Finance. 32, 1452–1467.
Mercieca, S., Schaeck, K. and Wolfe, S., 2007. Small European banks: Benefits from diversification?.
Journal of Banking & Finance, 31(7), pp.1975-1998.
Mergaerts, F. and Vander Vennet, R., 2016. Business models and bank performance: A long-term
perspective. Journal of Financial Stability, 22, pp.57-75.

20
Morris, M., Schindehutte, M. and Allen, J., 2005. The entrepreneur's business model: toward a unified
perspective. Journal of business research, 58(6), pp.726-735.
Mottura P., 2011, Banche, Egea, Milano.
Osterwalder, A., Pigneur, Y., 2012, Business Model Generation. Hoboken, NJ: John Wiley.
Passmore, S.W., 1985. Strategic Groups and the Profitability of Banking. Federal Reserve Bank of
New York.
Porter, M. E., 1996, "What Is Strategy?" Harvard Business Review 74, no. 6: 61–78.
Roengpitya, R., Tarashev, N.A. and Tsatsaronis, K., 2014. Bank business models. BIS Quarterly
Review December, 55-65.
Shafer, S.M., Smith, H.J. and Linder, J.C., 2005. The power of business models. Business horizons,
48(3), pp.199-207.
Short J.C., Ketchen, D.J., Palmer T.B., Hult G.T., 2007, Firm, Strategic Group and Industry Influences
on Performance, Strategic Management Journal, 28: 147–167.
Stiroh, K.J., 2004. Diversification in banking: Is noninterest income the answer?. Journal of Money,
Credit, and Banking, 36(5), pp.853-882.
Stiroh, K.J., 2006a. New evidence on the determinants of bank risk. Journal of Financial Services
Research, 30(3), pp.237-263.
Stiroh, K.J., 2006b. A portfolio view of banking with interest and noninterest activities. Journal of
Money, Credit, and Banking, 38(5), pp.1351-1361.
Stiroh K. and A. Rumble. 2006. “The dark side of diversification: The case of US financial holding
companies”. Journal of Banking and Finance. 30 (8), 2131–2432.
Van Oordt, M.R. and Zhou, C., 2014. Systemic risk and bank business models. mimeo
Ward Jr, J.H., 1963. Hierarchical grouping to optimize an objective function. Journal of the American
statistical association, 58(301), pp.236-244.
Wirtz B.W., Pistoia A., Ullrich S., Göttel V., 2016, Business Models: Origin, Development and Future
Research Perspectives, Long Range Planning, 49: 36-54.
Zott, C., Amit, R. and Massa, L., 2011. The business model: recent developments and future research.
Journal of management, 37(4), pp.1019-1042.

21
Table 1 Variables names and definitions
Name Definition
PTBV Market price to tangible book value
INT Net interest income over tangible book value
ADJ_INT Net interest income over tangible book value + Banking commission over
tangible book value
COMM Banking commission over tangible book value + Market commission over
tangible book value
BANK Banking commission over tangible book value
MKT Market commission over tangible book value
TRAD Trading profit over tangible book value
NON Non interest income over tangible book value = COMM+TRAD
TOP Total operating income over tangible book value = INT+COMM+TRAD
COST Total operating expenses over tangible book value
LLP Loan loss provisions over tangible book value
BETA Systemic risk
ROAE Net results from ordinary activity over total average equity
ROAA Net results from ordinary activity over total average asset
SHROA Annual ROA over its standard deviation calculated over the entire sample
period
Z_SCORE
ti,
ti,
ti,ti,
ti,ROAσ
TA
EROA
scoreZ
COST-
INCOME Total operating expenses over intermediation margin
TA Total asset (euro mln)

22
Table 2 Summary statistics for all banks in the sample, on average over the period
2012-2015
Obs mean min p25 p50 p75 max sd
Performance Measure
PTBV 180 1.108 0.009 0.666 0.945 1.339 5.890 0.823
ROAA 184 0.171 -6.830 0.070 0.270 0.495 1.950 0.798
SHROA 184 2.818 -2.831 0.210 1.131 2.986 35.718 5.795
Z-SCORE 184 46.761 -1.578 14.611 30.188 50.434 333.758 55.475
Business Mix
INT 180 0.289 -0.045 0.212 0.263 0.323 0.817 0.148
ADJ_INT 180 0.349 -0.053 0.249 0.302 0.394 1.115 0.191
NON 180 0.189 -0.017 0.122 0.166 0.231 0.717 0.121
COMM 180 0.135 -0.012 0.084 0.120 0.162 0.540 0.090
BANK 180 0.060 -0.009 0.029 0.049 0.074 0.456 0.057
MKT 180 0.075 -0.003 0.030 0.056 0.083 0.538 0.085
TRAD 180 0.054 -0.070 0.020 0.043 0.073 0.476 0.058
Business Mix composition
INT/TOP 180 62.1% 20.1% 56.3% 63.6% 71.4% 100.0% 13.8%
COMM/TOP 180 27.3% 4.9% 20.8% 25.9% 31.8% 64.6% 10.3%
TRAD/TOP 180 10.6% -27.0% 5.1% 9.5% 15.0% 67.2% 9.7%
ADJ_INT/TOP 180 74.4% 20.1% 67.7% 76.3% 86.0% 109.1% 17.0%
MKT/TOP 180 15.0% -0.5% 6.4% 12.7% 18.9% 64.6% 12.6%
COMM/NON 180 74.0% 6.8% 61.3% 73.5% 84.9% 238.1% 21.6%
TRAD/NON 180 26.0% -138.1% 15.1% 26.5% 38.7% 93.2% 21.6%
BANK/COMM 180 49.8% 0.0% 34.2% 47.0% 66.5% 101.9% 27.3%
MKT/COMM 180 50.2% -1.9% 33.5% 53.0% 65.8% 100.0% 27.3%
Efficiency and risk
COST 180 0.327 -0.100 0.216 0.298 0.395 1.226 0.178
LLP 180 0.099 -0.247 0.026 0.061 0.137 0.962 0.130
BETA 180 1.246 0.033 0.881 1.183 1.584 2.584 0.544
COST_INCOME 184 0.652 0.409 0.544 0.624 0.702 2.892 0.227
TA [000,000] 184 559,000 34,600 124,000 281,000 843,000 2,210,000 568,000 For a definition of the variables, see Table 1.

23
Table 3 Market performance and business mix
This table reports the results of a panel data regression. Regression coefficients are reported with standard error
in parenthesis. The dependent variable is year end PTBV for year “t”. INT measures net interest margin over
tangible book value. ADJ_INT is the sum of net interest margin plus banking commission. COMM is the sum of
banking and market commission. BANK, MKT and TRAD measure respectively, the ratio of banking
commission, of market commission and of the trading profit over tangible book value. The following bank
efficiency and risk variables are included in the regression: COST is the ratio between personnel and other
administrative expenses over tangible book value, LLP is the ratio of loan loss provisions to tangible book value,
BETA is a measure of systemic risk. For a definition of the variables, see Table 1. The observation period is
2012–2015.
(1) (2) (3) (4)
Mod. 1 Mod. 2 Mod. 3 Mod. 4
Constant 0.250* 0.157 0.152 0.143
(0.143) (0.138) (0.138) (0.138)
INT 3.130*** 3.177*** 3.255***
(0.481) (0.458) (0.468)
ADJ_INT 3.482***
(0.457)
COMM+TRAD 1.880***
(0.516)
COMM 6.562***
(1.144)
BANK 5.763***
(1.724)
MKT 6.566*** 5.656***
(1.140) (0.922)
TRAD 0.621 0.601 0.608
(0.551) (0.558) (0.562)
COST 0.005 -1.683*** -1.586** -1.109**
(0.502) (0.608) (0.638) (0.528)
LLP -1.596*** -1.581*** -1.534*** -1.463***
(0.345) (0.324) (0.335) (0.333)
BETA -0.199*** -0.147** -0.151*** -0.163***
(0.060) (0.058) (0.058) (0.058)
Observations 179 179 179 179
Number of ID 45 45 45 45
Adj. R2 0.4201 0.4824 0.4892 0.4942
***, **, * indicates statistical significance at the 1%, 5% and 10% respectively

24
Table 4 The performance of identified clusters
This table reports the results descriptive statistics for the cluster identified. of a panel fixed effect data regression.
We use Ward’s cluster analysis technique. COST is the ratio between personnel and other administrative
expenses over tangible book value, LLP is the ratio of loan loss provisions to tangible book value,
INTERNATIONALIZATION is the bank's internationalization index, BETA is a measure of systemic risk,
PTBV is the price to tangible book value, ROAA is the return on average asset, SHROAA is the risk adjusted
return on average asset, Zscore is the measure of bank insolvency risk, Cost-income is the ratio between
personnel and other administrative expenses over intermediation margin, TA is the total asset in millions of
euros. All the variable are expressed in terms of average for each bank over the four year time span. For a
definition of the variables, see Table 1. The observation period is 2012–2015.
Cluster Cluster Cluster
1 2 3
Number of banks 17 22 6
Business Mix
Weight ADJ_INT
Weight INT
Weight BANK
Weight MKT
Weight TRAD
Efficiency and risk
COST
LLP
INTERNATIONALIZATION
BETA
Performance measures
PTBV
ROAA
SHROAA
Zscore
Cost-income
TA (000,000)
84.62%*
59.10%*
25.53%*
13.12%*
2.26%
35.87*
17.38*
-1.49*
1.27
1.02
0.08
1.28
36.33*
0.63
413,982*
72.52%*
55.59%
16.93%*
25.71%*
1.77%*
25.28*
6.21*
2.51
1.22
1.11
0.21
4.32
53.49
0.63*
573,705
35.87%*
31.53%*
4.34%*
61.57%*
2.55%
52.38*
2.68*
7.17*
1.28
1.37*
0.25
1.57
52.60
0.81*
941,783*
* statistically significant differences at the 5% level based on pair-wise t-test comparisons

25
Figure 1 Radar Plot – Distribution of weights among the clusters (median value)

26
Table 5 Different market performance measures: Robustness check
This table reports the results of a panel data regression. Regression coefficients are reported with standard error
in parenthesis. The dependent variables are year end PTBV for year t (1); PTBV computed at the end of January
t+1 (2); PTBV computed at the end of February t+1 (3); PTBV computed at the end of March t+1 (4); PTBV
computed at the end of April t+1 (5); PTBV computed at the end of May t+1 (6). INT measures net interest
margin over tangible book value. BANK, MKT and TRAD measure respectively, the ratio of banking
commission, of market commission and the trading profit over tangible book value. The following bank
efficiency and risk variables are included in the regression: COST is the ratio between personnel and other
administrative expenses over tangible book value, LLP is the ratio of loan loss provisions to tangible book value,
BETA is a measure of systemic risk. For a definition of the variables, see Table 1. The observation period is
2012–2015.
(1) (2) (3) (4) (5) (6)
PTBV_YEAR_EN
D
PTBV_JA
N
PTBV_FE
B
PTBV_MARC
H
PTBV_APRI
L
PTBV_MA
Y
Constant 0.152 -0.024 -0.103 -0.075 -0.092 -0.101
(0.138) (0.145) (0.162) (0.166) (0.158) (0.160)
INT 3.255*** 3.371*** 3.603*** 3.387*** 3.423*** 3.546***
(0.468) (0.490) (0.552) (0.572) (0.541) (0.546)
BANK 5.763*** 5.076*** 6.209*** 6.902*** 6.612*** 6.178***
(1.724) (1.803) (2.013) (2.058) (1.969) (1.990)
MKT 6.566*** 5.445*** 5.910*** 6.014*** 5.936*** 6.407***
(1.140) (1.192) (1.328) (1.354) (1.298) (1.313)
TRAD 0.601 0.301 0.408 0.516 0.347 0.384
(0.558) (0.585) (0.671) (0.712) (0.658) (0.664)
COST -1.586** -1.341** -1.597** -1.538** -1.425* -1.699**
(0.638) (0.667) (0.747) (0.767) (0.731) (0.739)
LLP -1.534*** -1.292*** -1.455*** -1.677*** -1.607*** -1.355***
(0.335) (0.351) (0.401) (0.422) (0.393) (0.397)
BETA -0.151*** -0.013 0.022 0.005 0.018 0.044
(0.058) (0.061) (0.070) (0.074) (0.068) (0.069)
Observation
s
179 179 179 179 179 179
Number of
ID
45 45 45 45 45 45
Adj. R2 0.4892 0.4372 0.4130 0.4106 0.4243 0.4207
***, **, * indicates statistical significance at the 1%, 5% and 10% respectively

27
Table A.1 European listed banks
Country Bank Name Average TA
[000,000]
AT Erste Group Bank AG 202,493
AT Raiffeisen Bank International AG 125,671
BE KBC Groep NV/ KBC Groupe SA-KBC Group 248,286
CH Credit Suisse Group AG 750,358
CH Julius Baer Group Ltd 62,668
CH UBS Group AG 905,762
DE Aareal Bank AG 47,559
DE Commerzbank AG 569,159
DE Deutsche Bank AG 1,742,877
DE Deutsche Postbank AG 163,863
DK Danske Bank A/S 451,624
DK Jyske Bank A/S (Group) 53,912
ES Banco Bilbao Vizcaya Argentaria SA 650,626
ES Banco de Sabadell SA 174,261
ES Banco Popular Espanol SA 156,109
ES Banco Santander SA 1,247,980
ES Bankia, SA 258,653
ES Bankinter SA 57,329
ES Caixabank, S.A. 342,843
FR BNP Paribas SA 1,947,418
FR Crédit Agricole S.A. 1,563,645
FR Crédit Industriel et Commercial SA - CIC 242,077
FR Natixis SA 532,306
FR Société Générale SA 1,276,903
IE Allied Irish Banks plc 112,703
IT Banca Monte dei Paschi di Siena SpA-Gruppo MPS 192,612
IT Banca popolare dell'Emilia Romagna 61,328
IT Banca Popolare di Milano SCaRL 50,076
IT Banco Popolare - Società Cooperativa-Banco Popolare 125,389
IT Intesa Sanpaolo SpA 655,697
IT Mediobanca SpA - Banca di Credito Finanziario SpA 73,174
IT UniCredit SpA 869,329
IT Unione di Banche Italiane Scpa-UBI Banca 123,916
NL ABN AMRO Bank NV 385,741
NL ING Groep NV 1,020,533
PL Powszechna Kasa Oszczednosci Bank Polski SA - PKO BP
SA 54,113
PT Banco Comercial Português, SA-Millennium bcp 80,749
SE Nordea Bank AB (publ) 653,706
SE Skandinaviska Enskilda Banken AB 279,792
SE Svenska Handelsbanken 283,145
SE Swedbank AB 220,194

28
UK Barclays Plc 1,663,703
UK HSBC Holdings Plc 2,090,164
UK Lloyds Banking Group Plc 1,080,090
UK Royal Bank of Scotland Group Plc (The) 1,314,515
UK Standard Chartered Plc 538,401