horticultural crops plant nutrition seriescochran.agrilife.org/files/2011/09/plant-nutrition.pdf ·...
TRANSCRIPT

i
HORTICULTURAL CROPS PLANTNUTRITION SERIES
Volume VIII1997
Department of Horticultural ScienceTexas A&M University
College Station, TX 77843-2133

ii
HORTICULTURAL CROPS PLANTNUTRITION SERIES
Editor: J. Benton Storey
Volume VIII1997
Department of Horticultural ScienceTexas A&M University
College Station, TX 77843-2133

iii
Preface
The review papers in this volume represent many hours of work on the part of eachstudent and their editor. They are presented as a permanent record of the dedication of this classto the science of mineral nutrition. The topics represent an important aspect of mineral nutritionbeing studied, and in some cases practiced by the author.
Chris Freeman has raised the level of this course to heights it has never known by firstwriting a Home Page for it during the summer and second by solving the mysteries of TTVN. Hehas been the production manager during the semester by bringing us on line each class meeting,setting up the computer, and recording some of the sessions.
I want each one of you at College Station, Commerce, Tarleton, and Texarkana to knowhow much I have appreciated you this semester. You have been very attentive and have workedhard in this very dynamic and interesting field of plant nutrition. Volume VIII of theHorticultural Plant Nutrition Series published by this Department includes a chapter written byeach of you which will be a tangible accomplishment that you can keep in your library and on yourresume.
I wish everyone of you success in your graduate study and in the productive life that youhave ahead of you. I hope you will take the nutrition facts that you have learned and build onthem. Some of you may have opportunity to expand our knowledge of these facts throughresearch and others will teach your students the principles of plant nutrition. All of you will havethe opportunity to use the information you have learned throughout your life time, so continue tostudy plant nutrition and enrich the knowledge you already have in this exciting field.
I owe a great deal to Dr. Don Cawthon, Dr. Connie Fox, and Mr. Mark Storey (whorecorded the sessions) for their long hours of facilitating this course at Commerce, Tarleton, andTexarkana respectively. The many e-mail, fax, and phone messages have paid off as we havejoined forces to fulfill our Land Grant Mission of meeting the needs of students across the state.I hope there will be many more TTVN courses offered between our campuses. It was myprivilege to work with Don and Connie, both of whom I have known for a long time, but have notoften had the honor of working with. And it was a special privilege of working with my son whois well on his way in the field of Science Education. I wish all of you the very best as we haveproven to the world that Distance Education has great potential in the field of Horticulture.
J. Benton Storey, Ph.D., CPHEditor

iv
TABLE OF CONTENTS
Page
Retranslocation as a Mechanism in the Nitrogen Budgeting of Plantsby Douglas Smith 1
Are Slow Release Fertilizers a Viable Alternative to Water Soluble Fertilizersby Daphne Richards 8
Iron Deficiency on Bentgrass Golf Greensby John Jordan 14
Nitrogen Fertilization and its Effect on Chinch Bug Populations in Sorghumand St. Augustine grass
by Trent Hale 20
Does Nitrogen Affect Thatch Production in Turfgrass?by Jason Gaudreau 31
Foliar fertilization of orchidsby Janette Grossman 38
Phosphorus and Potassium Effects on Soybeansby Stephen Gowin 44
The Effects of Anoxia and Soil Compaction in Quercus stellata due toConstruction Injury
by Priscilla J. Files 52
Reclamation of Sodic and Saline Soilsby Shannon T. Alston 62
Dairy Composting: Does it Affect the Availability of Nitrogen andPhosphorus?
by Tammy Cantrell 69
An Argument for the Use of Equisetum in Constructed WetlandsDesigned for Wastewater Cleanup
by Michelle S. Meche 77
Effects of Nitrogen Fertility on Thatch Management for Dwarf
Bermudagrasses
v
by Jason Gray 83
Can Plants Be Used to Clean Up Soils Contaminated With Heavy Metals?
by Mary R. Suplick 94
Compilation of Factors Influencing Flowering in Hibiscus rosa-sinensisIncluding Causes and Prevention of Bud Abscission
by Christopher Neil Freeman 102
The Use of VAM in Phosphorus Deficient Soilsby Elise Konow 109
Is there a Superior Bean Genotype that can use Rock Phosphate forEconomical Production in Tropical Soil?
by Toni Hammers 118
The Effect of Potassium Fertility on Disease Resistance in Turfgrass Species 123
by Scott Abernathy

1
Retranslocation as a Mechanism in the Nitrogen Budgeting of Plants
Douglas R. SmithDepartment of Agricultural Sciences, Texas A&M University - Commerce, Commerce, TX 75428
Additional index words. nitrogen recycling, translocation, leaf senescence, leaf abscission
Abstract. Throughout the growing season, N availability is often compromised by a number of conditions. Many plants utilize a process known as retranslocation to increase their Nitrogen Use Efficiency. In many cases, the amount of recycled N can account for 60 to 75% of the total N taken up annually by the plant. Many experiments have studied the rates as well as the mechanism of retranslocation.
Higher plants have processes available to them that allow minerals and other nutrients to
be moved from one location in the plant to another. This transport occurs in a source to sink
relationship, which means the nutrients are taken from one area, generally of higher concentration,
to another where it is needed. This transport occurs in both xylem and phloem tissues. Most
mineral nutrients are transported from the roots to shoots by the xylem tissue. Mineral nutrients
as well as photosynthates can be transported from leaves, or other portions of the shoots, to other
leaves, fruits, roots, or other sink sites via the phloem tissue.
Minerals are moved from the site of original deposition to new locations through
processes referred to as retranslocation or remobilization. These processes occur with most of
the mineral nutrients, and are a very important part of the mineral budgeting of higher plants. The
most common destinations for retranslocation are new leaves or the root system. In fact many
plants cycle their nutrients in a series of retranslocations (Marschner, 1995).

2
Retranslocation as a part of the N recycling process
Nitrogen is the most limiting mineral nutrient in plants, and is the most commonly used
fertilizer nutrient (Heckathorn and Delucia, 1996). Many plants have evolved mechanisms to save
as much of the N as possible during harsh conditions such as drought and during the senescence
of leaves. As the soil moisture drops, so does the availability of N to the plant (Li and Redmann,
1992).
Nitrogen is recycled through a series of translocations. Both NO3 and NH4 are taken up
by the roots. Nitrate, a readily xylem mobile form of N, is transported to the shoots. At the
cellular level in the leaves, NO3 is responsible for a host of different activities especially in the
vacuole. Nitrate must be reduced to NH4, prior to entering metabolism.
The process of reduction of NO3 to NH4 is normally coupled to the production of amino
acids, which helps avoid NH4 toxicity. The C chains used in the production of amino acids are
derived from the tricarboxilic acid cycle (TCA cycle), often in the form of pyruvate and α-
ketogluterate(Voet and Voet, 1995). The most common amino acid in plants is glutamine, which
is also a precursor to several other amino acids (Jeschke and Pate, 1991; Voet and Voet, 1995).
N-reduction occurs only in cells that are carrying on respiration and, depending on species, can
occur in both roots and shoots. Some amino acids may only be synthesized in the shoot, however
(Larsson et al., 1991).
New Agropyron dasystachyum leaves contain much higher N concentrations than the
older leaves located two nodes down. Higher concentrations of N in new leaves may be due to
increased amounts of carbohydrates in the older leaves, and the retranslocation of N from the

3
older to the newer leaves (Li and Redmann, 1992). The main cause of the retranslocation to the
newer leaves is the increased demand for N, and possibly a low availability of N in the soil.
The process
Retranslocation occurs in a series of steps, mediated by an assortment of biochemical
reactions. Initial reactions must result in the nutrient becoming available. Availability occurs
either through breakdown of proteins or by the addition of a chelate. Either way, the nutrient
must become mobile in the phloem sap. Several biochemical processes can increase availability
including enzymatic action and plant hormones. Some nutrients such as Ca are not as mobile in
the phloem and have much lower rates of retranslocation (Andrews and Siccama, 1995).
Retranslocation starts in the individual leaf cell with mobilization. The minerals are then
taken to the phloem through short term transport, and loaded into the phloem, where it is
transported to the required site (Marschner, 1995).
Why is retranslocation necessary?
There are many different reasons for plants to retranslocate nutrients, especially N. In
many tallgrass prairie species, N retranslocation occurs as a response to drought. This is a
method for these plants to preserve N by removing it from shoots for retranslocation to and
storage in the roots and rhizomes. Once placed in these storage organs, the N is not susceptible
to losses through fire or herbivory. Retranslocation prevents losses due to senescence, and
increases root growth thereby increasing water uptake (Heckathorn and DeLucia, 1994).
Some plants fulfill the majority of their N reduction in the shoots. In these plants, it is
necessary to retranslocate N in the reduced form to the roots (Marschner, 1995). This process

4
may also provide important feedback to the roots on what is available as well as what is needed in
the shoots.
Retranslocation in Grains
Nitrogen can be retranslocated to other sites of high demand as well. For instance, grains
have a high demand for N. One of the selection criteria for grains as a feed component is the
Nitrogen Harvest Index (NHI) which is the ratio of grain N to total aboveground plant N. The
NHI is “often regarded as a measure of retranslocation efficiency of N from vegetative plant parts
to the grain” (Bulman and Smith, 1994). Reports of as high as 90 to 100% of total N present
at maturity has been accumulated by the time of anthesis in wheat (Triticum aestivum L.). Studies
also suggest that N uptake and N retranslocation are negatively correlated (Bulman and Smith,
1994). Therefore, it can be assumed that the bulk of N for grain fill is a result of retranslocation.
When 15N was used to label root uptake of wheat, it was found that 80 to 95% of that
fraction absorbed was moved to the shoot within 24h (Larsson et al., 1991). Between 10 an 15%
of this fraction was then remobilized and transported to the roots. It is thought that this relatively
quick return to the roots by that fraction incorporated into the shoot may provide a relatively
efficient system allowing shoots to provide feedback to the roots and influence uptake (Cooper
and Clarkson, 1989). The same authors also proposed that a common pool of cycling N provides
the shoots as well as the roots with a readily available source of N that can be drawn upon as
demanded by the tissues.
It has been proposed that a majority of the N cycles through a wheat plant at least once
before being incorporated in to the shoot. In an experiment by Simpson et al. (1982) the entire
fraction of N taken in a 24 h period appeared to be transported through the phloem before 80 %

5
of that fraction was incorporated in to the shoot tissue. In experiments with rice, it was found
that N was cycled through older leaves before being retranslocated to the meristematic tissues of
the roots and shoots (Simpson et al., 1982).
Retranslocation in Woody Species
Extensive research has been undertaken in the field of retranslocation as it relates to trees.
It has been shown that fertilization has positive effects on Corsican pine for up to 12 years after
only one application (Crane and Banks, 1992). Estimates as high as two thirds of the N required
for production of new foliage is supplied through retranslocation from senescing or abscising
leaves. A prolonged abscission period has been explained as an adaptation to nutrient shortages
(Escudero et al., 1992). This is possible if one considers leaves or needles as a storage organ,
where nutrients can be remobilized when needed, before the organ is abscised.
Throughout the life of a leaf, the N concentration decreases. Decreasing concentration
occurs primarily due to dilution as carbohydrates build up in the leaf. As senescence occurs
however, N concentration continues to decline as N is retranslocated to “sinks” (Negi and Singh,
1993).
The primary factor associated with the efficiency of N retranslocation in trees is the
abscission period. A longer abscission period decreases the efficiency of retranslocation (del Arco
et al., 1991), and may be associated with the difficulty in determining exactly when an individual
leaf will shed (Escudero et al., 1992). This phenomenon is found in both evergreens as well as
deciduous species. Deciduous and evergreen species differ considerably in N retranslocation. F.
micrantha, a deciduous species, showed 75.3 % retranslocation for N, while only 53.6% of needle
N was retranslocated for the evergreen R. arboreum (Negi and Singh, 1993).

6
Contrary to popular thought, woody species native to low fertility soils are not more
efficient in their retranslocation abilities. In fact the opposite is true. The species native to more
fertile soils have higher concentrations of organic N that can be hydrolyzed, releasing the highly
mobile amino-N (Negi and Singh, 1993).
The costs of retranslocation
Although retranslocation has many benefits certain problems are also associated. In
tallgrass prairie species, a rate of retranslocation of approximately 30% of foliar N has been found
to retranslocate under drought stress. This comes at a cost of lowered C accumulation in the
immediate post stress interval, due to the placement of N in the roots and rhizomes as opposed to
the photosynthetically active shoots (Heckathorn and Jeschke, 1996).
Cycling of N also costs the plant energy. Although this energy is important to overall
plant production, it is considered negligible when compared to the benefit of providing a readily
available N supply throughout the plant (Simpson et al., 1982).
Literature Cited
Andrews, J. A. and T. G. Siccama. 1995. Retranslocation of calcium and magnesium at theheartwood sapwood boundary of Atlantic white cedar. Ecology. 76:659- 663.
Bulman, P. and D. L. Smith. 1994. Post-Heading nitrogen uptake, retranslocation, andpartitioning in spring barley. Crop Sci. 34:977-984
Crane, W. J. B. and J. C. G. Banks. 1992. Accumulation and retranslocation of foliar N infertilized and irrigated Pinus radiata. Forest Ecology and Mgt. 52:201-223.
Cooper, H. D. and D. T. Clarckson. 1989. Cycling of amino-N and other nutrients betweenshoots and roots in cereals - A possible mechanism integrating shoot and root in theregulation of nutrient uptake. J. of Exp. Bot. 40:753-762.

7
del Arco, J. M., A. Escudero, and M. V. Garrido. 1991. Effects of site characteristics onnitrogen retranslocation from senescing leaves. Ecology. 72:701-708.
Escudero, A., J. M. del Arco, and M. V. Garrido. 1992. The efficiency of N retranslocationfrom the leaf biomass in Quercus ilex ecosystems. Adv. in Veg. Sci. 13:225-238.
Jeschke, W. D. and J. S. Pate. 1991. Modeling of the partitioning, assimilation and storage ofnitrate within root and shoot organs of castor bean (Ricinus communis L.). J. Exp. Bot.42:1091-1103.
Heckathorn, S. A. and E. H. DeLucia. 1994. Drought induced nitrogen retranslocation inperennial C4 grasses of tallgrass prairie. Ecology. 75:1877-1886.
Heckathorn, S. A. and E. H. Delucia. 1996. Retranslocation of shoot nitrogen to rhizomes androots in prairie grasses may limit loss of N to grazing and fire during Drought. FunctionalEcology. 10:396-400.
Larsson, C. M., M. Larsson, J. V. Purves, and D. T. Clarckson. 1991. Translocation and cyclingthrough roots of recently absorbed N and S in wheat (Triticum aestivum) during vegetativeand generative growth. Physiol. Plant. 82:345-352.
Li, Y. S. and R. E. Redmann. 1992. Nitrogen budget of Agropyron dasystachyum in Canadianmixed prairie. Am. Midl. Nat. 128:61-71.
Marschner, H. 1995. Mineral nutrition of higher plants. 2nd ed. Academic Press Inc. San Diego.
Negi, G. C. S. and S. P. Singh. 1993. Leaf N dynamics with particular reference toretranslocation in evergreen and deciduous tree species of Kumaun Himalaya. Can. J. ForestRes. 23:349-357.
Simpson, R. J., H. Lambers, and M. J. Dalling. 1982. Translocation of N in a vegetative wheatplant (Triticum aestivum). Physiol. Plant. 56:11-17.
Voet, D. and J. G. Voet. 1995. Biochemistry. 2nd ed. John Wiley and Sons, Inc. New York.

8
Are Slow Release Fertilizers a Viable Alternative to Water SolubleFertilizers?
Daphne Richards1
Department of Horticultural Sciences, Texas A&M University, College Station, TX 77843-2133
Additional index words. controlled release fertilizers, ornamental crops, top-dressing, nutrition
Abstract. Increasing awareness of the waste and pollution of natural resources hasplaced pressure on greenhouse growers to lower the amount of fertilizer runoff andto use water and fertilizers more efficiently. Many potentially useful ways toaddress this problem have been researched, one of which is the use of various slowor controlled-release fertilizers. With a few modifications, these fertilizers have beenshown to reduce fertilizer runoff and at the same time increase plant nutrientuptake.
Growers must supply their crops with the proper amount of essential nutrients in order to
produce the highest possible quality crop in the shortest possible amount of time. This requires a
constant nutrient supply and precise applications (Maynard and Lorenz, 1979). With concerns
increasing over the supply and quality of our water, greenhouse growers are under more and more
pressure to use fertilizers more efficiently. Among the many suggested solutions to the problems
of groundwater contamination and fertilizer use efficiency is the use of slow release fertilizers,
also known as controlled release fertilizers (Barron, 1974).
Controlled Release Fertilizers are Available in Various Forms
Two categories of controlled release fertilizers, differing in method of release
control, are available. One group achieves control of release via the slow solubility of the
______________________1Graduate Assistant-Teaching. Home address: 4407A College Main, Bryan, TX 77801chemicals used. These include isobutylidene diurea and urea-formaldehyde, both of which are
slowly soluble. The other group achieves control of release by coating soluble fertilizers with
either slowly soluble sulfur (sulfur-coated products) or with insoluble plastics (resin or polymer

9
coated products). Degradation of some slowly soluble fertilizers (sulfur-coated products and
urea-formaldehyde) is accomplished by soil microbes. Plastic coated fertilizers (Osmocote,
Nutricote and various other name-brands) allow water to diffuse into the prill, which dissolves
the fertilizer inside, creating a nutrient solution which diffuses out of the prill and into the media.
This diffusion is dependent on media temperature, with higher temperatures leading to faster rates
of diffusion and thus faster release of nutrients (Oertli and Lunt, 1962; Barron, 1974).
Fertilizer Efficiency
Fertilizer efficiency is the proportion of applied plant nutrients which is actually taken up by
plants and can be considered as kilograms of nutrient taken up compared to kilograms of fertilizer
applied. Much of the fertilizer applied is lost by various means, such as leaching, fixation into
unavailable chemical forms and N volatilization into the atmosphere (Barron, 1974). Experiments
have been conducted to compare the efficiency of water soluble fertilizers to controlled release
fertilizers. Water soluble fertilizers are generally believed to be inefficient, although they are still
the most common method of fertilization used (Barron, 1974; Hershey and Paul, 1982). The
efficiency (defined as the percentage of applied N absorbed by the plant) of liquid feed fertilization
has been estimated as 46% and that of Osmocote (a controlled release fertilizer) as 89%
(Holcomb, 1980).
Nutrient Leaching and Pollution of Groundwater
Much of the fertilizer applied to plants with fertigation is lost due to leaching. This represents
a problem for the environment as well as for greenhouse crops. As pressure increases for more
conscientious use of our natural resources, ways to eliminate fertilizer runoff and contamination
of groundwater are being sought (Hicklenton, 1990; Cox, 1993). One way to control loss of

10
nutrients via leaching is to use controlled release fertilizers (Oertli and Lunt, 1962). It has been
found that total nitrogen lost from containers of pot chrysanthemums over the course of four
weeks was lower for controlled release than for water soluble fertilizers. However, it was also
found that there was just as much or more leaching from controlled release fertilizer treated pots
than from water soluble fertilizer treated pots in the first two and a half weeks (Hershey and Paul,
1982).
Plant Nutrient Uptake Varies With Plant Development
Plants require differing amounts of nutrients at differing phases of their growth cycles.
Ideally, the concentration of nutrients available to plants will parallel the needs of those plants
(Barron, 1977). An application of various controlled release fertilizers at the recommended label
rate exceeded the needs of the plant in the first few weeks of the growing cycle (measured by the
amount of nitrogen in leachate samples) (Hershey and Paul, 1982; Cox, 1993). More nutrients
being released at the beginning of growth, when roots are not extensive and therefore unable to
take up a large supply of nutrients, is therefore wasteful. As a solution to this problem, a lower
amount of controlled release fertilizer, perhaps one-half rate, could be used at planting and a
second application, also one-half rate, made two to three weeks later (Cox, 1993).
Fertilizer Analysis and Release Rate are Important
As with all fertilizers, controlled release fertilizers have varying analyses and the analysis
chosen should coincide with the needs of the plant. Also, the nutrient needs of the plant should be
considered when deciding how much controlled release fertilizer to apply. Labels generally give
one recommended rate and are not specific for specific crops. It is therefore important for the
grower to be aware of the nutrient requirements for each particular crop. In addition, controlled

11
release fertilizers have various methods and rates of nutrient release which should be considered
when using them. This information is generally available from the manufacturer (Barron, 1974).
Placement of the Controlled Release Fertilizer Should be Considered
The primary method of applying controlled release fertilizers has been incorporation into the
media prior to planting. As mixing methods are not always efficient and storage of media with
incorporated controlled release fertilizer is not recommended (nutrients are released even though
no plants are present), an alternative placement would be beneficial to most growers (Meadows
and Fuller, 1983). Several different placement locations have been tried with varying success.
Meadows and Fuller (1983; 1984) found that controlled release fertilizer placed directly into the
dibble hole when transplanting cuttings or seedlings (referred to as “dibbling”) produced superior
plants (based on quality ratings) and also that dibbling reduced the amount of nutrients found in
leachate samples than incorporation. In a separate study (1984) they also found that placement of
controlled release fertilizer in the bottom of the pot (on top of 1 cm of media) produced plants of
lower quality. Another common method is to apply the controlled release fertilizer to the top of
the media after transplanting (called top-dressing). Payne and Adam (1980) found no significant
differences between top-dressing and incorporation of controlled release fertilizers.
Conclusions
It has been shown in many studies that, with a few modifications, controlled release fertilizers
can be more efficient and less polluting than water soluble fertilizers. Several factors should be
considered when choosing the type, rate, and placement of these fertilizers. The type of
controlled release fertilizer chosen will be dependent upon the needs of the plant, the type of
media used and by personal experience and preference. The rate of controlled release fertilizer

12
will also be specific to the specific crop involved, but will also be influenced by the growing cycle
of the crop. Newly transplanted seedlings and cuttings would require less controlled release
fertilizer with a second application later in the growing season. The choice of placement of
controlled release fertilizers would depend on personal use. If a grower plans to use all of a batch
of media within a short amount of time, he or she may choose to incorporate the fertilizer before
planting. However, if the media will be stored for a significant amount of time, perhaps top-
dressing would be beneficial.
Literature Cited
Barron, H.M. 1974. The use of slow-release fertilizers. Proc. Intl. Plant Propagators’ Soc. 24:221-229.
Barron, H.M. 1977. Controlled release fertilizer and its use in hot climates. So. Florist andNurseryman. 89:16-17, 35-38.
Cox, D.A. 1993. Reducing nitrogen leaching-losses from containerized plants: the effectivenessof controlled-release fertilizers. J. Plant Nutrition. 16: 533-545.
Hershey, D.R. and J.L. Paul. 1982. Leaching-losses of nitrogen from pot chrysanthemums withcontrolled-release or liquid fertilization. Scientia Horticulturae. 17:145-152.
Hicklenton, P.R. 1990. Growth of capillary-irrigated Andorra juniper and Sarcoxieeuonymus as affected by controlled release fertilizer type and placement. J. Environ. Hort. 8:92-95.
Holcomb, E.J. 1980. How to increase fertilizer efficiency through slow-release formulations. Ill.Amer. Nurseryman. 152:9.
Maynard, D.M. and O.A. Lorenz. 1979. Controlled-release fertilizers for horticultural crops.Hort. Rev. 1:79-140.
Meadows, W.A. and D.L. Fuller. 1983. Relative effectiveness of dibble applied Vs incorporatedOsmocote for container grown woody ornamentals. So. Nurserymen’s Assoc. ResearchConference. 28:63-66.

13
Meadows, W.A. and D.L. Fuller. 1984. Osmocote rate and placement studies in transplanting onepint potted woody ornamental liners to three gallon containers. So. Nurserymen’s AssocResearch Conference. 29:70-71.
Meadows, D.L. and D.L. Fuller. 1984. Osmocote rate and placement studies in transplanting onegallon container grown azaleas to three gallon containers. So.Nursemen’s Assoc. ResearchConference. 29:73-74.
Oertli, J.J. and O.R. Lunt. 1962. Controlled release of fertilizer minerals by incapsulating membranes: I. Factors influencing the rate of release. Soil Sci. Soc. Amer. Proc. 28:579-587.
Payne, R.N. and S.M. Adam. 1980. Influence of rate and placement of slow-release fertilizer on pot plants of African violet grown with capillary mat watering. HortSci. 15: 607-609.

14
Iron Deficiency on Bentgrass Golf Greens
John Jordan1
Department of Soil and Crop Sciences, Texas A&M University, College Station, TX 77843-2474
Additional index words. chlorophyll synthesis, respiratory enzymes, Agrostis stolonifera, Agrostis palustris
Abstract. Most iron deficiencies in bentgrass are a result of high soil pH levels oralkaline soils. Iron is a necessary micronutrient for chlorophyll synthesis thusplaying a vital role in turfgrass color. Iron is immobile within the plant and isremoved quickly from frequent mowing that bentgrass requires for putting greensurfaces. This requires frequent low application rates of iron to replenish the plantsneed for iron. Acceptable levels of iron within the plant enhanced visual shootquality by causing a darker green color of the leaf blades. Response to ironapplications varies with environmental conditions. Favorable turfgrass conditionsfavor an increased uptake of iron into the plant. When maintained at acceptablelevels in the plant, iron can help bentgrass maintain high visual shoot quality underhigh traffic and low mowing heights that occur on golf course greens.
Creeping bentgrass (Agrostis palustris) provides an excellent putting surface for golf
greens and is the choice of most golfers in the world. Extremely low mowing heights, heavy
traffic from golfers, and frequent irrigation subject bentgrass greens to severe summer stress.
Management of bentgrass, a cool-season species, in hot-humid climates in the southern United
States is a difficult task.
Iron has been applied to turfgrasses for color enhancement and improved growth under Fe
deficient conditions (Deal and Engel, 1965; Minner and Butler, 1984). A dark green color is a
major component of visual shoot quality on bentgrass greens. To promote this aesthetic beauty,
Fe has been applied to promote a darker green color for cool-season turfgrasses grown on Fe
sufficient soils (Carrow, 1983; Schmidt and Snyder, 1984; Snyder and Schmidt, 1974; Wehner
and Haley, 1990).

15
Physiological effects of Fe
The physiological functions of Fe within the grass plant are primarily twofold. First,
although Fe is not part of the chlorophyll molecule, it is one of the nutrients essential for
chlorophyll synthesis (Beard, 1973; Duble, 1996). Secondly, Fe is a constituent of certain
enzymes in the respiratory system. Thus, since Fe is required for chlorophyll synthesis, levels of
Fe available to the plant influence turfgrass color.
Iron is also a constituent of certain respiratory enzymes such as catalase, peroxidase, and
cytochrome oxidase (Machold and Scholz, 1968). The most well known heme proteins are the
cytochromes. Cytochromes are constituents of redox systems in chloroplasts in addition to being
a component in the redox chain in nitrate reductase (Marshner, 1995). Catalase and peroxidase
activity declines under Fe deficient conditions. The decreased activity of catalase reveals Fe
deficiencies in the leaves of plants. In Fe deficient roots, peroxidase activity is depressed. This
does not benefit the plant due to the requirement of peroxidase for biosynthesis of lignin and
suberin (Marshner, 1995).
Iron deficiency causes and symptoms
Iron is the micronutrient most commonly deficient in turfgrass. An Fe deficiency is usually
a result of insolubility rather than an absence of the element in the soil (Beard, 1973).
Deficiencies of Fe are most common in alkaline soils, soils high in organic matter, poorly draining
soils, and in areas where excessive thatch is present. Iron deficiency symptoms usually show
when leaf tissue is below 50 ppm Fe (Duble, 1996).
1 Graduate Assistant-Research. Home Address: 2250 Dartmouth #823, College Station, Texas 77840

16
When an Fe deficiency becomes evident, the condition first appears as an interveinal
yellowing of the youngest actively growing leaves. This condition can give the leaf blade a striped
appearance. Iron deficiency symptoms are quite similar to the symptoms for N deficiency except
that it first appears on the younger leaves (Oertli, 1963). Continued frequent Fe applications are
necessary to maintain a dark green color on bentgrass golf greens. When deficiencies occur, even
a browning appearance may occur along with the interveinal yellowing.
Factors effecting Fe uptake by bentgrass
Plants can absorb Fe as either the Fe2+ or Fe3+ ions. However, Fe is physiologically active
only in the Fe2+ state (Beard, 1973). Iron is a micronutrient and the amount of Fe found in plant
tissues is minimal. Iron is also immobile in the plant.
Several plant attributes, environmental conditions, and management practices can effect
uptake of Fe. On sand-based bentgrass greens, excessive fertilization can often occur to meet
high standards of club members. This can create high P levels resulting in a decrease in Fe
uptake. Poorly drained soils in addition to excessive irrigation can also reduce uptake.
Environmental factors such as low soil temperatures, excessively dry soils, and areas receiving
low light will also exhibit less Fe uptake. Plant genetics can be a dominant factor determining the
amount of Fe uptake. Different cultivars of the same species can exhibit quite different amounts
of Fe uptake (Duble, 1996). All of these factors can influence the quantity of Fe uptake by
bentgrass.
In Virginia, Snyder and Schmidt (1974) reported the greatest Fe color enhancement on
bentgrass during cool, dry periods. In Georgia, where Fe applications on creeping bentgrass in
stressful summer months is common, research was conducted indicating that color and quality

17
responses to Fe applications were minimal during this stressful period (Glinski, Carrow, and
Karnok, 1990). Ideally, Fe application should be applied when bentgrass is at peak growth and
under minimal stress. This does not occur on many golf courses during hot summer months when
many people are playing golf. Careful analysis should be given to determine if frequent Fe
applications are cost effective or simply a waste of time and money.
Correcting Fe deficiency in bentgrass
Since Fe deficiencies of turfgrasses grown on alkaline soils is common, one approach to
correcting Fe chlorosis has been to reduce soil alkalinity to allow more Fe uptake by the plant (
Minner and Butler, 1984). This can be accomplished by applying acidifying materials such as
sulfur or sulfuric acid. This type of application is not practiced as a management tool for
bentgrass golf greens. Instead, products such as FeSO4 are more commonly used and applied as a
foliar spray (Sturkie and Rouse, 1967). This product is usually applied at a rate of 60 ml to 150
ml per 93 m2. There are many other products that work well as foliar applications. These
products such as Ferromec® and MaxiGreen® are more commonly used. Ferromec® consists of
15% N, 3% S, and 6% Fe. Iron chelates are quite effective on common turfgrass mowed
infrequently. However, due to high maintenance qualities of maintaining bentgrass at extremely
low mowing heights (0.3 cm), foliar applications are more advantageous. These foliar
applications are usually not chelated. Chelates are more difficult for the plant to absorb than other
smaller ions.
Applications of Fe to bentgrass do improve color and visual shoot quality of the plant.
However, the duration or residual of Fe applications does not last for an extended period of time.
Typically, Fe applications improve color of bentgrass for only 1 to 3 weeks. Maximum color

18
response can occur within days of a foliar application if environmental conditions are favorable.
In bentgrass, Fe is immobile in the plant and is removed with clippings. Since most bentgrass is
mowed daily, the response is short lived. This calls for repeated Fe applications on a biweekly or
monthly basis to maintain high visual shoot quality for golf course greens.
Conclusions
Creeping bentgrass greens are extremely difficult to manage in stressful summer months.
It is proven that Fe applications can enhance color shoot quality in all months ( Glinski, Carrow,
and Karnok, 1990). Response rates vary during seasons with favorable bentgrass growing
conditions increasing uptake of Fe by the plant.
Perhaps the best indicator of Fe deficiencies will be soil pH. A good turf manager
monitors soil pH constantly and management techniques need to be exercised to keep pH between
6 and 7 if possible. Applying products with sulfur in the analysis can help lower pH slightly to
increase Fe uptake by the plant. The pH level between 6 and 7 promotes maximum turf growth,
which will reduce the chances of experiencing Fe deficiency symptoms.
Iron deficiencies are not usually so severe to become fatal to the plant, but can severely
decrease visual quality of bentgrass. Repeated low rate applications will help keep Fe levels from
being deficient in the plant and will promote healthier, high quality bentgrass. Iron is only one
micronutrient and acceptable levels of other nutrients needs to be carefully examined and
maintained.
Literature cited
Beard, J.B. 1973. Turfgrass: Science and culture. Prentice-Hall, Englewood Cliffs, N.J.
Carrow, R.N. 1983. Turfgrass field day report. Kansas State University, Manhattan,Kansas.

19
Deal, E.E. and R.E. Engel. 1965. Iron, manganese, boron, and zinc: effects on growth of‘Merion’ Kentucky bluegrass. Agron. J. 57:553-555.
Duble, R.L. 1996. Turfgrasses: Their management and use in the southern zone. Texas A&MUniversity Press, College Station, TX.
Glinski, D.S., R.N. Carrow, and K.J. Karnok. 1992. Iron fertilization effects on shoot-rootgrowth, water use, and drought stress of creeping bentgrass. Agron. J. 84:496-503.
Machold, O. and G. Scholz 1968. Iron content and chlorophyll formation in higher plants.Naturwissenschaften 9:447-452.
Marschner, Horst 1995. Mineral nutrition of higher plants. Second Edition. Academic Press,London.
Minner, D.D. and J.D. Butler. 1984. Correcting iron deficiency of Kentucky bluegrass.HortScience 19:109-111.
Oertli, J.J. 1963. Nutrient disorders in turfgrasses. California Turfgrass Culture. 3(3):17-19.
Schmidt, R.E., and V. Snyder. 1984. Effect of N, temperature, and moisture stress on the grownand physiology of bentgrass and response to chelated iron. Agron. J. 76:590-594.
Snyder, V., and R.E. Schmidt. 1974. Nitrogen and iron fertilization on bentgrass. P. 176-185. InE.C. Roberts (ed.) Proc. 2nd Inter. Turf. Res. Conf. VPI, Blacksburg, VA. 15-20 June1973. ASA, Madison, WI.
Sturkie, D.G., and R.D. Rouse. 1967. Response of zoysia and Tiflawn bermuda to P and K.1967 Agronomy Abstracts. p. 54.
Wehner, D.J. and J.E. Haley. 1990. Iron fertilization of Kentucky bluegrass. Commun. Soil SciPlant Anal. 21:629-637.

20
Nitrogen Fertilization and its Effect on Chinch Bug Populations inSorghum and St. Augustine grass
Trent Hale1
Department of Soil and Crop Sciences, Texas A&M University, College Station, TX 77843-2474
Additional index words. Stenotaphrum secundatum, Blissus leucopterus complex..
Abstract. Overwintered chinch bug females reared on susceptible varieties ofsorghum developed faster, lived longer, laid more eggs, and had a lower mortalitythan those reared on resistant varieties. Chinch bug resistance was decreased by theaddition of sodium nitrate and increased with the addition of superphosphate in potand field experiments. Experiments conducted on chinch bug populations in St.Augustinegrass showed that an organic source of nitrogen resulted in lower chinchbug populations and lower levels of damage to the turf when compared to aninorganic source of nitrogen. Chinch bug responses to highly available nitrogenmay be due to a preference for lush turf, or biological regulation effects such asmortality and oviposition rates.
Introduction
Nitrogen is important to insects as well as plants. There is a marked difference in the N
content of insects (7%) and plants (2%). Because of this difference insects must consume the
parts of the plant that will yield enough N for the insect to grow and reproduce (Dale, 1988).
Fertilization will effect host selection, growth rates, survival and reproduction of insect
populations. Generally N fertilization increases insect populations and their subsequent damage
(Mattson, 1980). However in some cases the opposite maybe true. According to Scriber (1984),
a minimum of 115 studies show that
______________________
1 Graduate Assistant-Research. Soil and Crop Sciences, College Station, Texas 77843-2474

21
an increase in N fertility increased insect growth, fecundity, and populations. Conversely, a
minimum of 44 studies indicate a decrease in insect populations or resulting damage to plants with
increase N fertilization.
It is the purpose of this paper to review the findings of several experiments investigating
the effects of N fertility on chinch bug populations in sorghum and St. Augustinegrass.
Varietial differences in sorghum to chinch bugs
A series of experiments were conducted by R. G. Dahms at the Oklahoma Agricultural
Experiment Station in 1936 to investigate the effect of several varieties of sorghum and other host
plants on biology of the chinch bug. The first experiment
investigated the relationship of plant variety in the seedling stage on oviposition and longevity of
adults. Dahms found that overwintered females reared on chinch bug susceptible varieties lived
longer, laid more eggs, and had a higher daily oviposition rate than those reared on resistant
varieties.
Another series of experiments were conducted to determine the effect of a resistant
cultivar (Atlas sorgo) and a susceptible cultivar (Dwarf Yellow milo) on rate of development,
mortality, and body length of nymphs. The average duration of each stadium, which is the time
interval between instars, was higher in the chinch bug resistant variety (Fig. 1). First generation
varietial difference was small for the first three instars, but became more pronounced in instar four
and five . Differences in development of instars became more pronounced in the second and third
generations. The lack of differences in development time for the initial three stadia of the first
generation may be attributed to the fact that adults were collected from barley, an excellent host

22
for chinch bugs. As the chinch bugs feed and developed varietial differences in became more
pronounced.
0
5
10
15
20
25
Milo
Firs
tG
ener
atio
n
Milo
Sec
ond
Gen
erat
ion
Milo
Thi
rdG
ener
atio
n
Atla
s F
irst
Gen
erat
ion
Atla
sS
econ
dG
ener
atio
n
Atla
s T
hird
Gen
erat
ion
DE
VE
LO
PM
EN
T O
F IN
ST
AR
S (
DA
Y)
1ST INSTAR
2ND INSTAR
3RD INSTAR
4TH INSTAR
5TH INSTAR
Fig. 1. Rate of development of first, second and third generations of chinch bugnymphs reared on seedling plants of Dwarf Yellow milo and Atlas sorgo, LawtonOkla., 1935. (Based on Dahms et al. 1936.)
Mortality was high for the first-generation nymphs on both varieties during the first
stadium (Fig. 2). Only four of the 25 nymphs that reached the second instar became adults on
Atlas sorgo where 23 reached adulthood on Dwarf Yellow milo. The four adults reared on Atlas
sorgo survived for only 3 days. The 23 adults reared on Dwarf Yellow milo were active,
copulated and all of the females laid eggs. The average length of 5th instar nymphs and adults
reared on the susceptible cultivar was 0.5 mm longer than those reared on Atlas sorgo (Dahms et
al., 1936).

23
0
10
20
30
40
50
60
70
80
90
100
0 1 2 3 4 5
INSTAR
% M
OR
TA
LIT
Y Milo First Generation
Milo Second Generation
Milo Third Generation
Atlas First Generation
Atlas Second Generation
Atlas Third Generation
Fig. 2. Mortality of the first, second and third generation of chinch bug nymphsreared on seedling plants of Dwarf Yellow milo and Atlas sorgo, Lawton, Okla.,1935. (Based on Dahms et al. 1936.)
Effects of N on chinch bugs in sorghum
The findings of Dahms et al. (1936) initiated a second series of experiments by Webster
and Mitchell to determine the N fractions in Atlas sorgo and Dwarf Yellow milo sorghum plants.
Amino N combined with the basic fraction (diamino acids) account for higher percentages of
soluble N found in the susceptible cultivar (Fig. 3). They concluded that resistant cultivars
generally have a lower N content than susceptible varieties grown under like conditions (Webster
and Mitchell, 1940).
The effect of fertilizers on chinch bug resistance in sorghums was the next area to be
investigated. Dahms and Fenton (1940) found that in pot and field experiments with Atlas sorgo,

24
Dwarf Yellow milo, and Finney milo the resistance to chinch bugs was decreased by the addition
of sodium nitrate (NaNO3) and increased with the addition of superphosphate to soils.
0
0.05
0.1
0.15
0.2
0 27 40 45 53 60 70 80 85
AGE IN DAYS
% N
ITR
OG
EN
DWARF YELLOW MILO ATLAS SORGO
Fig. 3. Combined percentages of amino and basic nitrogen for a resistant cultivar(Atlas sorgo) and a susceptible cultivar (Dwarf Yellow milo). (From Dahms andFenton, 1940.)
With the previous experiments as a basis another series of experiments were initiated to
investigate the effect of P, N, and other nutrients on the oviposition and longevity of chinch bugs
on seedlings grown in various nutrient solutions. According to Dahms (1947), more eggs were
laid on plants growing in high N solutions versus plants growing in low N solutions. Chinch bugs
feeding on plants in low N solutions or high P solutions had lower oviposition rates compared to
bugs reared on plants grown in high N or low P solutions for Atlas sorgo and Finney milo.
Dahms (1947) concluded that the addition of N to soils deficient in N would benefit chinch bugs,
while P amendments to P deficient soils would be detrimental to chinch bug populations.

25
Effects of N on chinch bugs in St. Augustinegrass
Several experiments were carried out by Horn and Pritchett using ‘Floratine’ St.
Augustinegrass, ‘Emerald’ zoysiagrass, ‘Tiflawn’ bermudagrass, and centipedegrasses to
investigate the response of chinch bug populations to different sources and rates of N, P, and K
(Table 1). The results show that source and rate have an effect on the susceptibility of ‘Floratine’
St. Augustinegrass to chinch bug injury (Horn and Pritchett, 1963). Agrinite®, the organic
source of N, resulted in lower chinch bug populations and lower levels of damage to the turf.
When fertilization rates were increased using the inorganic source of N (NH4NO3) the damage
due to infestation increased. Plots fertilized at the highest rate with an inorganic source of N were
63% killed by chinch bugs. Damage was much less on plots fertilized at the same rate of N with
the organic N source (Horn and Pritchett, 1963).
Table 1. Effects of Three Rates of Nitrogen, Phosphorus, and Potash on Chinch BugDamagex to ‘Floratine’ St. Augustinegrass and chinch bug populationsy.
Sources ofNitrogen
Rates of Fertilization
Nitrogen (N) Phosphorus (P2O5) Potash (K2O)Pounds per 1000 ft2 year-1
4 8 16 0 2 4 2 4 8Inorganic 8.3z 6.6 3.7 6.5 6.4 5.7 5.8 6.7 6.1Organic 8.7 8.6 7.8 8.6 8.5 7.9 8.5 8.4 8.1Check 9.0 9.0 9.0 9.0 9.0 9.0 9.0 9.0 9.0
Five Minute Chinch Bug CountAll N Rates Check
Inorganic 60 28 41 64 74 59 52 68Organic 40 28 41 52 52 48 48 45
xRating Scale 9.0 = no damage 1.0 = plot mostly deadyReproduced form Horn and Pritchett (1963).zEach entry is average of 3 replications
The most recent findings relating fertility and its effect on chinch bug populations were
reported by Busey and Snyder. A chinch bug susceptible cultivar of St. Augustine was subjected
26
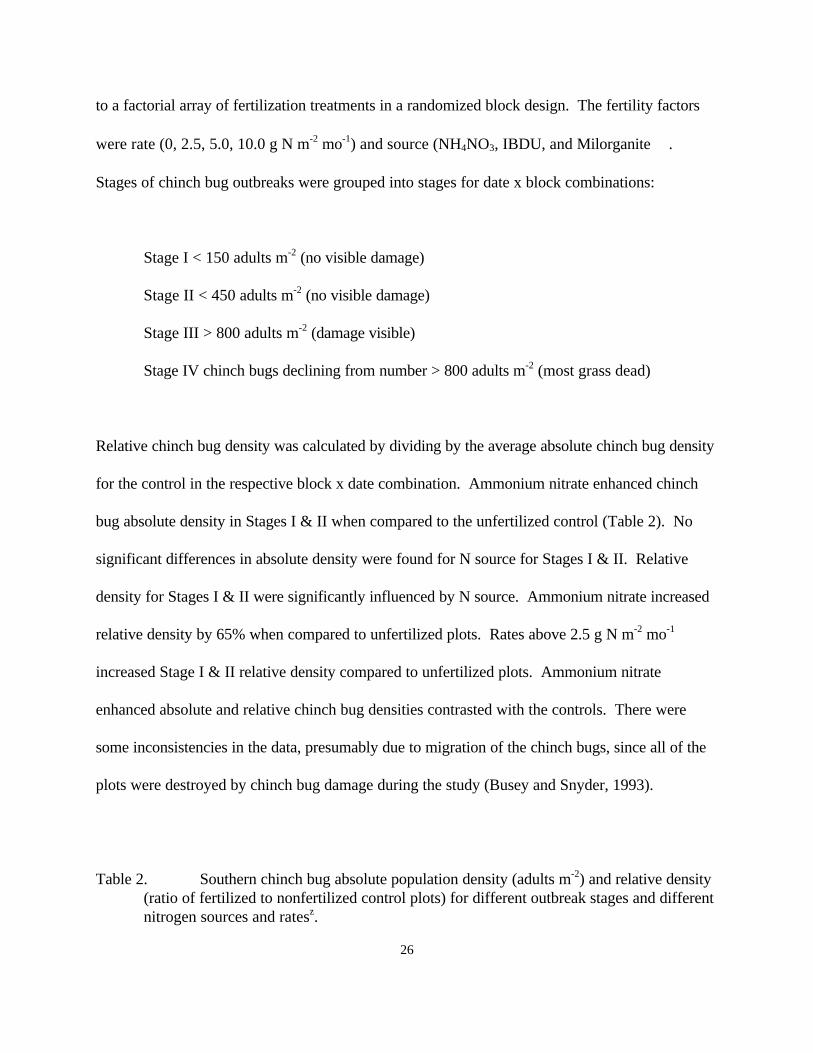
to a factorial array of fertilization treatments in a randomized block design. The fertility factors
were rate (0, 2.5, 5.0, 10.0 g N m-2 mo-1) and source (NH4NO3, IBDU, and Milorganite).
Stages of chinch bug outbreaks were grouped into stages for date x block combinations:
Stage I < 150 adults m-2 (no visible damage)
Stage II < 450 adults m-2 (no visible damage)
Stage III > 800 adults m-2 (damage visible)
Stage IV chinch bugs declining from number > 800 adults m-2 (most grass dead)
Relative chinch bug density was calculated by dividing by the average absolute chinch bug density
for the control in the respective block x date combination. Ammonium nitrate enhanced chinch
bug absolute density in Stages I & II when compared to the unfertilized control (Table 2). No
significant differences in absolute density were found for N source for Stages I & II. Relative
density for Stages I & II were significantly influenced by N source. Ammonium nitrate increased
relative density by 65% when compared to unfertilized plots. Rates above 2.5 g N m-2 mo-1
increased Stage I & II relative density compared to unfertilized plots. Ammonium nitrate
enhanced absolute and relative chinch bug densities contrasted with the controls. There were
some inconsistencies in the data, presumably due to migration of the chinch bugs, since all of the
plots were destroyed by chinch bug damage during the study (Busey and Snyder, 1993).
Table 2. Southern chinch bug absolute population density (adults m-2) and relative density(ratio of fertilized to nonfertilized control plots) for different outbreak stages and differentnitrogen sources and ratesz.

27
Stage I & II Stage III Stage IVTreatment Absolute Relative Absolute Relative Absolute RelativeNitrogen sources Ammonium nitrate 197*
1.65** 1299* 1.86**559 7.83
IBDU 164 1.28 1197 1.53 860 13.70 Milorganite 124 1.00 1125 1.46 738 10.90Nitrogen rates(g N m-2 mo-1) 2.5 128 0.99
1293* 1.75** 947* 16.63*
5.0 186*1.45*
1150 1.55 530 6.43
10.0 1701.49*
1179 1.56 681 9.37
Fertilized mean 162 1.31 1207* 1.62* 719 10.81Nonfertilized mean 130 1.00 852 1.00 207 1.00C.V. (%) 42 43 39 50 90 130Analysis of F-test probabilities, ignoring nonfertilized controlsNitrogen sources NS * NS NS NS NSNitrogen rates NS NS NS NS NS NSSources X rates NS NS NS NS NS NS
zFrom Busey and Snyder (1993).Means for combined Stages I + II are of four replications pooled over three dates ofobservation. Means for Stage III are of four replications at one date of observation:means for Stage IV represent only two replications pooled at one and two dates ofobservation.*, ** Differs from nonfertilized controls at P = 0.05 or 0.01, respectively
The second experiment involved fertilizing 20 St. Augustinegrass cultivars at high (14.7 g
N m-2 y-1) and low (4.8 g N m-2 y-1) fertilization treatments. Plots were evaluated once per month
for percent dead canopy which was assumed to be caused by chinch bug activity. Results of the
second experiment showed chinch bug damage was more severe in the high fertilization plots
(Table 3) (Busey and Snyder, 1993).
Table 3. Southern chinch bug damage (% of canopy dead) of St. Augustinegrass turf plotssplit into high (14.7 g N m-2 y-1) compared with low (4.8 g N m-2 y-1) fertilization rates, asa function of month of damagez.
Month of damage

28
Treatment 0 1 2 3 4High fertilization 0 20*** 33*** 44*** 56**Low fertilization 0 14 24 34 47
zFrom Busey and Snyder (1993).Number of observations was 37, 37, 34, 24, and 13 , respectively, for months 0, 1, 2, 3,and 4.**, *** Fertilization treatments differ at P = 0.01 and P = 0.0001, respectively.
Summary
The growth and survival of insect herbivores is often dependent on the N concentration of
plant tissue (Mattson, 1980). High levels of N may enhance a host plants nutritional value.
However this can be countered by N acting as a feeding deterrent or enhancing toxic
allelochemicals (Mattson, 1980). In a recent review of the literature, Scriber (1984) found a
minimum of 115 studies showing that an increase in N fertility increased insect growth, fecundity,
and populations. Conversely, a minimum of 44 studies indicate a decrease in insect populations or
resulting damage to plants with increased N fertilization. Insect responses to N fertility are
species and host dependent making inferences from unrelated studies difficult.
The first experiments conducted on chinch bugs found that overwintered females reared
on chinch bug susceptible varieties of sorghum developed faster, lived longer, laid more eggs, had
a higher daily oviposition rate, lower mortality, and longer body length than those reared on
resistant varieties (Dahms, 1936). A later study attributed the varietial differences in sorghum to
higher levels of amino N combined with the diamino acids found in the susceptible cultivar
(Webster and Mitchell, 1940). Dahms and Fenton (1940) found in both pot and field experiments
chinch bug resistance was decreased by the addition of NaNO3 and increased with the addition of
superphosphate to soils. An additional study concluded that the addition of N to soils deficient in

29
N would benefit chinch bugs, while P amendments to P deficient soils would be detrimental to
chinch bug populations (Dahms, 1947). Experiments conducted on chinch bug populations in St.
Augustinegrass showed that an organic source of N resulted in lower chinch bug populations and
lower levels of damage to the turf when compared to an inorganic source of N (Horn and
Pritchett, 1963; Busey and Snyder, 1993). Chinch bug responses to highly available N may be
due to a preference for lush turf, or biological regulation effects such as mortality and oviposition
rates (Busey and Snyder, 1993). However, due to the difficulty in conducting research on such a
mobile pest many questions proposed by researchers have yet to be answered.
Literature Cited
Busey, P. and George H. Snyder. 1993. Population outbreak of the southern chinch bug isregulated by fertilization. p. 353-357. In R. N. Carrow, N. E. Christians, R.C. Shearman[eds.] International Turfgrass Society Research Journal 7. Intertec Publishing Corp.,Overland Park, Kansas.
Dahms, R. G. 1947. Oviposition and longevity of chinch bugs on seedlings growing in nutrientsolutions. M. Econ. Entomol. 40:841-845.
Dahms, R. G. and F. A. Fenton. 1940. The effect of fertilizers on chinch bug resistance insorghums. J. Econ. Entomol. 33:688-692.
Dahms, R. G., R. O. Snelling, and F. A. Fenton. 1936. Effect of several varieties of sorghum andother host plants on the biology of the chinch bug. Jour. Econ. Ent. 29(6):1147-1153.
Dale, D. 1988. Plant-mediated effects of soil mineral stresses on insects, pp. 35-110. In E. A.Heinrichs [ed.], Plant stress-insect interactions. Wiley, New York.
Horn, G. C. and W. L. Pritchett. 1963. Chinch bug damage and fertilizer: Is there a relationship?Florida Turf-Grass Assoc. Bull. 9:3,6-7.
Mattson, W. J. 1980. Herbivory in relation to plant nitrogen content. Annu. Rev. Ecol. Syst.11:119-161.
Scriber, J. M. 1984. Nitrogen Nutrition of plants and insect invasion, pp. 441-460. In R. D.Hauck [ed.], Nitrogen in crop production. Am. Soc. Agron.

30
Webster, James E. and Howard Mitchell. 1940. Determination of the nitrogen fractions in Atlasand milo sorghum plants. Plant Physiol. 15:749-753.

31
Does Nitrogen Affect Thatch Production in Turfgrass?
Jason E. GaudreauDepartment of Soil and Crop Sciences, Texas A&M University, College Station,TX 77843-2474
Abstract. There are many essential nutrients required for proper turfgrassmanagement. Nitrogen is typically the nutrient applied in the largest amounts.Nitrogen requirements vary with the intended use of the turfgrass, soil medium, andthe desired turf aesthetics. Thatch is a tightly intermingled organic layer of deadand living shoots, stems, and roots that develops between the zone of greenvegetation and the soil surface. Thatch can be detrimental to the turf’s aestheticsand can increase the turf’s susceptibility to pest and disease damage. The type andrate of nitrogen fertilizer applied to the turf determines the thatch thickness.
Thatch has been a problem to turfgrass managers for many years. High amounts of
fertilizer are necessary to provide the turf with adequate nutrients to promote a rapidly growing
dense sod with dark green color. The excessive use of fertilizer does produce a dense turf but it
also produces excess organic material. If organic matter production is greater than
decomposition, thatch accumulation will result.
What is thatch?
Thatch is a tightly intermingled organic layer of dead and living plant material that
develops between the zone of green vegetation and the soil surface (Beard, 1982). There is also a
layer adjacent to the thatch called mat. The mat layer is directly below the thatch layer. The mat
layer is developed from secondary cultural practices such as
topdressing and cultivation. Mat is defined as the partially decomposed thatch intermixed with
the mineral soil from cultural practices and from soil flora and fauna activity (White, 1984).

32
The evaluation of thatch development in studies has raised a common question of how to
measure the thatch. Some researchers have proposed devices that measure the compressibility of
the turf. The “thatchmeter” was developed to measure the distance the turf compressed when a
designated weight is applied to the turf. A study was initiated with the thatchmeter on
bermudagrass (Cynodon dactylon var. Tifdwarf) greens to measure the compressibility of the turf
as an indicator of thatch development. The areas with more thatch compressed deeper (Volk,
1972) (Fig. 1).
Compressibility of thatch
0
2
4
6
8
10
12
14
1.25 1.5 2 2.5 3 3.5 4cm of thatch
mm
of
dep
ress
ion
Fig.1 Compressibility of thatch on cm depth of thatch to the top of the mineral soil (Volk, 1972).
A simpler method of measuring thatch is to remove a plug and measure the distance from
the top of the thatch layer to the bottom of the thatch. One other method used to measure thatch
is called ashing. Ashing invovles removing a plug of grass, cutting off the roots and shoots of the
plug, and subjecting the plug to 500°C - 600°C for 1-3 hours. The intense heat releases the
hydrogen and oxygen ions leaving the carbon. The remaining ash is weighed to give an organic
material content (Sartain, 1985).
33
Rates of Nitrogen
Depending on the use of the turf determines the amount of N needed in a growing season.
Golf greens require approximately 3.62 - 6.34 kgs N per 1000 ft2 per year whereas an athletic
field requires approximately 2.72 - 5.44 kgs N per 1000 ft2 per year. Soil characteristics and
desired aesthetics determine many turf manager's fertility programs.
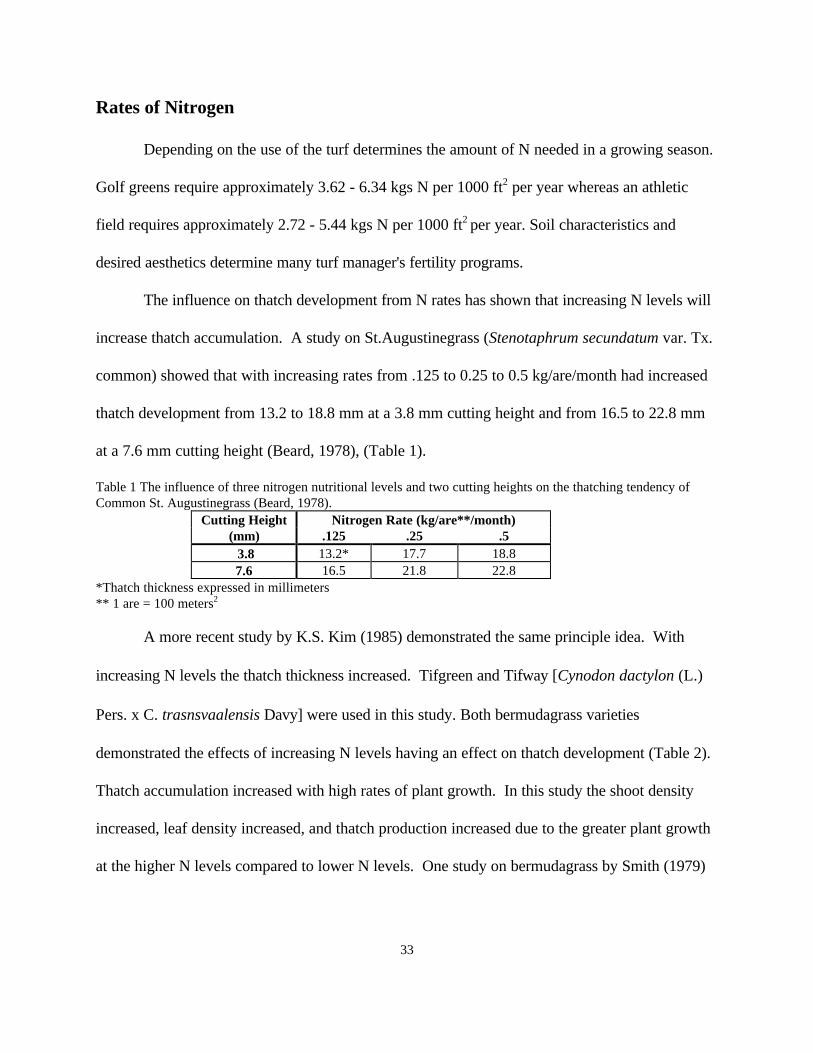
The influence on thatch development from N rates has shown that increasing N levels will
increase thatch accumulation. A study on St.Augustinegrass (Stenotaphrum secundatum var. Tx.
common) showed that with increasing rates from .125 to 0.25 to 0.5 kg/are/month had increased
thatch development from 13.2 to 18.8 mm at a 3.8 mm cutting height and from 16.5 to 22.8 mm
at a 7.6 mm cutting height (Beard, 1978), (Table 1).
Table 1 The influence of three nitrogen nutritional levels and two cutting heights on the thatching tendency ofCommon St. Augustinegrass (Beard, 1978).
Cutting Height Nitrogen Rate (kg/are**/month)(mm) .125 .25 .5 3.8 13.2* 17.7 18.87.6 16.5 21.8 22.8
*Thatch thickness expressed in millimeters** 1 are = 100 meters2
A more recent study by K.S. Kim (1985) demonstrated the same principle idea. With
increasing N levels the thatch thickness increased. Tifgreen and Tifway [Cynodon dactylon (L.)
Pers. x C. trasnsvaalensis Davy] were used in this study. Both bermudagrass varieties
demonstrated the effects of increasing N levels having an effect on thatch development (Table 2).
Thatch accumulation increased with high rates of plant growth. In this study the shoot density
increased, leaf density increased, and thatch production increased due to the greater plant growth
at the higher N levels compared to lower N levels. One study on bermudagrass by Smith (1979)

34
resulted in 30% more thatch when treated with 75 kg soluble N ha-1 than when treated with 25
kg soluble N ha-1 due to the increased plant growth.
Table 2 Effects of Nitrogen on thatch accumulation in Tifway and Tifgreen Bermuda (Kim, 1985). Bermuda
VarietyParameter Nitrogen Level
(kg/are* /month).25 .5 1.0 1.5
Tifway thatch thickness(mm)
11.5 12.2 12.4 13.8
shoot density (per 100 cm2)
151 154 161 164
# of leaves(per shoot)
16.2 16.3 18.5 15.4
Tifgreen thatch thickness(mm)
11.1 12.0 13.4 15.7
shoot density (per 100 cm2)
153 157 172 175
# of leaves(per shoot)
14.0 16.8 17.1 17.8
*1 are = 100 meters2
All of these examples support the theory that high rates of N do increase thatch
accumulation. It should be pointed out that although thatch increased with the higher rates used
in this study, the higher rates are beyond what is normally used in practice. There was no
significant increase in thatch production in relation to N fertility rates, but applying N to a N-
deficient turf could cause some increase in thatch, and at very high N levels, thatch may be
enhanced (Carrow, 1987). Normal rates of N do promote thatch development but are also
controllable with secondary cultivation practices such as verticutting, topdressing and aerifying.
Nitrogen Sources
The source of N also plays an important role in thatch development. Many past studies
indicate different levels of thatch occur depending on the N source. Ammonium sulfate,
ammonium nitrate, sewage sludge, calcium nitrate, and Isobutylidene diurea (IBDU) are all
common fertilizers used on turf as N sources.

35
Sewage sludge produced a high quality turf but it produced more thatch than NH4NO3
(White, 1984). The sewage sludge treatments produced a darker green, more dense turf than
NH4NO3. This observation of having a higher quality turf and more thatch is consistent with the
findings of Meinhold et al. (1973), who found that stimulating leaf and shoot growth by N
fertility contributed to an increase in thatch development in Tifgreen bermudagrass.
Sartain (1985) found that sewage sludge produced significantly greater amounts of thatch
than did IBDU. IBDU consistently promoted the lowest level of thatch accumulation when
compared to both (NH4)2SO4 and sewage sludge. This consistent lower amount of thatch can be
attributed to the more even release of N from the IBDU over a period of time depending upon
fertilizer particle size and quantity of water present. Ammonium sulfate produced the greatest
amount of thatch compared to sewage sludge and IBDU. The rate of growth and total N uptake
was greatest in the (NH4)2SO4 plots (Table 3).
Table 3 Effect of Nitrogen source and rate on thatch (Sartain, 1985).Nitrogen
SourceRate
(g m-2)Growth (kg
ha-1 day-1)N Uptake
(g ha-1 day-1)Thatch
Accumulation(dag kg-1)
AS* 5 29.5 1300 54.110 27.1 1201 45.2
IBDU* 5 25.4 1174 23.610 24.8 1161 23.4
SS* 5 20.9 911 26.010 20.4 1024 31.3
*AS = ammonium sulfate, IBDU = Isobutylidene diurea, SS = sewage sludge
Different fertility sources produced different thatch depths (Smith, 1979). Calcium nitrate
and (NH4)2NO3 were found to produce different amounts of thatch, but the results of this study
were less direct. Along with N sources, aerification was the main focus of the study. Smith

36
found consistently more thatch in the (NH4)2SO4 plots versus the Ca(NO3)2 plots. Maximum
thatch production occurred in plots receiving lowest aerification for both Ca(NO3)2 and
(NH4)2SO4. Therefore frequent aerification can reduce the amount of thatch that develops as a
result of N fertility (Table 4).
Table 4. Thatch thickness after one growing season of aerification and fertility treatments (Smith, 979).e
Treatment Nitrogen Thickness (mm)Aerification semiyearly AS♣ biwkly 12.4 bc*
CN biwkly 12.4 bcAS + L biwk1ly 13.1 bAS + L + TPD biwkly 17.3 a
Avg. 12.6Aerification monthly CN biwkly 8.8 d
AS + L biwkly 10.3 bcdCN wkly 10.3 bcdAS + L wkly 10.6 bcd
Avg. 10.0Aerification biweekly CN biwkly 9.5 d
AS + L biwkly 11.0 bcdCN wkly 9.6 cdAS + L wkly 11.0 bcd
Avg. 10.3*common letters means no significant differences as tested by Duncan’s multiple range test at 5% level.♣AS = ammonium sulfate, CN = calcium nitrate, L= lime, TPD = topdressing,
Conclusion
There are several factors that relate to turfgrass thatch accumulation. The liberal use of
fertilizers to produce a dark green dense turf can be detrimental to the turf. High rates of N
promotes excessive organic material production. The microbes are unable to break down the
organic material at a rate that will deter thatch and mat accumulation. The type of fertilizer will
also affect thatch accumulation. Ammonium sulfate produces higher amounts of thatch than
Ca(NO3)2, and IBDU has been proven to produce the least amount of thatch when compared to
(NH4)2SO4 and sewage sludge. Most researchers will agree that although N plays an important

37
role in thatch development, cultivation practices do also affect the amount of thatch and mat that
accumulates.
Literature Cited
Beard, J.B. 1982. Turfgrass management for golf courses. 1st ed. Burgess Publishing Co.Minneapolis, Minnesota.
Beard, J.B., A. Almodares, and R.L. Duble. 1978. Nitrogen fertilization studies on St. Augustinegrass plus the relationship to thatch and its control. Prog-Rep-Tex-Agric-Exp-Stn. PR-3489:29-33.
Carrow, R. N., B.J. Johnson, and R.E. Burns. 1987. Thatch and quality of Tifwaybermudagrass in relation to fertility and cultivation. J. Agronomy 19:524- 530.
Johnson, B.J., R.N. Carrow, and R.E. Burns. 1987. Bermudagrass turf response to mowing practices and fertilizer. J. Agronomy 79:677-680.
Kim, K.S. and J.B. Beard. 1985. The effects of mowing height and N fertility levels on thethatch accumulation and growth of two bermudagrasses. Prog-Rep-Tex-Agric-Exp-Stn.PR-4340:96-98.
Meinhold, V.H., R.L. Duble, R.W. Weaver, and E.C. Holt. 1973. Thatch accumulation inbermudagrass turf in relation to management. J. Agronomy 65:833-835.
Sartain, J.B. 1985. Effect of acidity and N source on the growth and thatch accumulation ofTifgreen bermudagrass and on soil nutrient retention. J. Agronomy 77:33-36.
Schearman, R.C., E.J. Kinbacher, T.P. Riordan, and D.H. Steinegger. 1980. Thatch accumulation in Kentucky bluegrass as influenced by cultivar, mowing, and Nitrogen. HortScience 15:312-313.
Smith, G.S. 1979. Nitrogen and aerification influence on putting green thatch and soil. J.Agronomy 71:680-684.
Volk, G.M. 1972. Compressibility of turf as measure of grass growth and thatch development onbermudagrass greens. J. Agronomy 64:503-506.
White, R.H. and R. Dickens. 1984. Thatch accumulation in bermudagrass as influenced bycultural practices. J. Agronomy 76:19-22.

38
Foliar fertilization of orchids
Janette Grossmann1
Department of Horticultural Sciences, Texas A&M University, CollegeStation, TX 77843-2133
Additional index words. orchid cultivation
Abstract. Foliar fertilization is an efficient and economic way of supplementing nutrients to plants. Foliar feeding of orchids depends on the types of orchids grown, the media used, and in what climatic conditions they are cultivated. Foliar application of nutrients is a common practice in many orchid farms. Even though there are limited studies of nutrient uptake by foliar sprays in orchids, those which exist demonstrate its effectiveness. Despite some disadvantages of foliar fertilization in general, this technique has many practical uses in a commercial operation.
Over the years there has been a lot of controversy about foliar fertilization of
orchids (Poole and Sheehnan,1980). The major concern being the nature of the cuticle
(Morrison, 1988). Sheehnan et al. (1967) treated mature Cattleya ‘Trimos’ plants with
both foliar sprays and root drench applications of radioactive P derived from phosphoric
acid. Samples were taken after 0.5, 2, 12, 24, and 120 hours and analyzed. Almost 35%
of the amount supplied was found 24 hours later in the pseudobulb below the leaf that had
been sprayed, thus determining its efficient absorption through leaves. This suggests that
other nutrients with similar movements as P can also enter orchid leaves in the same
manner.
Orchid Leaves
In general, the outer wall of the leaf is covered by the cuticle which is composed of1 ____________________
Student. Home address: Fresno 209A Col. Aguila, Tampico, Tams., Mexico.
39
cutin and epicuticular wax (Marschner, 1995). The wax is the main barrier to nutrient
passage. The main functions of these structures is to protect the leaf from excessive
water loss by transpiration and against excessive leaching by rain (Marschner, 1995;
Sinclair, 1986). The cuticle thickness varies with habitat and exposure, and may
sometimes be thicker on the upper surface (Sinclair, 1986).
There are two distinct categories of orchid leaves (Sinclair, 1986). The first is ribbed
or plicated which are thin, membranous and sometimes deciduous with little water storage
capacity and seldom have trichomes. Examples include Coelogyne barbata, Calanthe
furcata, and most Cataseum species. The second is the leathery group which is
subdivided into soft, hard, and fleshy types with more rigid, thicker leaves and lacking
prominent veins. Also, the cuticle is thicker and waxier. These include Paphiopedilum
and Phalaenopsis orchids.
Trichomes or leaf hairs facilitate foliar uptake due to the increased surface area
(Marschner,1995). Trichomes are not a dominant feature in orchids. But some thin
leaf groups have hair on the lower surface of the leaf while thicker, leathery leaves are
often devoid of hairs (Sinclair, 1986). But there has been evidence of glandular
trichomes on both leaf surfaces in the Pleurothallidinae, which contains 3000 species in
30 genera , including Masdevilla (Pridgeon,1981). Assumption of mineral uptake by
these trichomes can be made, but have not been proven.
In addition, closed stomatas, sites of gas exchange on leaves, occurring during the
night favor foliar application (Hew, 1991). Since nocturnal applications of foliar sprays
result in higher labor and less efficiency, farmers spray all leaves, mainly the bottom

40
surfaces until slight runoff and also direct sprays to the root zone (Khaw, 1982).
A surface tension reducing agent is added to the foliar spray to maximize penetration
into the leaf. This allows the solution to cover more surface area primarily the cuticle
pores (Morrison, 1988). In addition, silicon-based surfactants seem to decrease leaf
damage and increase efficiency of sprays, mainly for leaves with thick cuticles (Horesch
et al, 1981).
When to Feed
Factors affecting orchid nutrition include the species, the stage of growth, potting
media, and growing conditions (Poole and Sheehnan,1980; Soon,1980). Feeding starts in
spring in temperate climates when orchids start actively growing due to longer days and
higher temperatures (Brian and Wilma Ritterhausen,1985). A weak solution is given on a
fortnightly basis. Maximum growth occurs during the summer increasing feeding to once
a week or 10 days, depending on how often the orchids are watered (Brian and Wilama
Ritterhausen,1989). Feeding may be reduced or discontinued when growth slows down
or ceases in winter (Soon,1980). In comparison, orchids in the tropics have growth year-
round due to the high temperatures and abundance of sunlight while the productivity is
limited only by the supply of moisture and nutrients (Soon,1980).
Advantages and Uses
In general, foliar fertilization is a rapid method of correcting micronutrient
deficiencies (Marschner,1995). These trace minerals are required in small amounts by
orchids making its application more economical (Baker and Baker,1996). The application
of macronutrients has encountered some drawbacks mainly that of foliage burn at higher

41
rates (Alexander and Schroeder,1987). However, urea, which has high N, can be applied
at high concentrations without being phytotoxic (Alexander and Schroeder,1987) and is
absorbed and translocated very rapidly after application (Klein and Weinbaum,1984).
Also combining foliar fertilizers with pesticides has proven to increase pesticide
efficiency and keep application costs to a minimum (Et Attal et al.,1984).
Feeding a uniform group of orchids is best accomplished by spraying the foliage with
a fine nozzle. Khaw (1982) recommends using a high pressure pump in order to give a
‘misty’ spray droplet and prevent excessive run-off and thus save on the quantity of
fertilizer used. Also, a solid cone is preferable for effective coverage of plant parts.
Foliage is kept a good healthy green and growth will speed up, particularly in young
plants (Brian and Wilma Ritterhausen,1985). Spraying with foliar fertilizer benefits leaves
which have turned yellow due to the need of repotting or loss of roots (Brian and
Wilma Ritterhausen, 1989). Also, newly repotted plants are sprayed until they produce
new roots to take up feed. In addition, there is no danger of salts building up in the media
since the fertilizer enters through the leaves (McKenzie,1980). Moreover, one can save
time combining fertilizer, insecticide, and fungicide in one application (Ibara,1980; Hew
and Lim,1989). Lastly, viral infections can be repressed for many years by an aggressive
fertilizer program (Soon,1980) which can include foliar applications.
Examples of Foliar Feeding
Feeding should be given in accordance to the stage of orchid growth. Hew and Lim
(1989) showed the efficient uptake of young plantlets in culture flasks where leaching was

42
prevented. McKenzie (1980) gives some examples: 30N:4.4P:8.3K for small plants and
seedlings, 18N:7.9P:14.9K for adult plants and 10N:13.1P:16.2K to induce better
flowering in a plant in the bud stage. Also, organic fertilizers can be beneficial because
they contain natural trace minerals (Baker and Baker,1996) but may have objectionable
odor. An example listed is fish fertilizer at 1/10 of the recommended strength when used
as a foliar spray.
Conclusion
Many factors have to be considered in orchid nutrition. These include water quality
and frequency of irrigation; light intensity, quality, duration; and temperature (Poole
and Sheehnan,1980). Growers should work out a feeding schedule considering media, age
of plant, and nutrient sources. Foliar fertilization should be efficiently used as a
supplement to media fertilization. Besides the nutritional and economical potential of this
technique, it can also contribute to decreasing soil and water contamination since less
media fertilizer would be utilized (Alexander and Schroeder,1987).
Literature cited
Alexander, A. and M. Schroeder. 1987. Modern trends in foliar fertilization. Journal of Plant Nutrition.10:1391-1395.
Baker, M.L. and C.O. Baker. 1996. Orchid species culture: Dendrobium. Timber Press Inc. Portand, Oregon.
El Attal, Z.M., O.K. Moustafa and S.A. Dieb. 1984. Influence of foliar fertilizers on the toxicity and tolerance to some insecticides in cotton leaf worm. J. Agri. Sci. Cambridge. 102:111-114.
Hew, C. S. 1991. Orchid cut-flower production in ASEAN countries. In J. Arditti (ed.),

43
Orchid Biology: Reviews and Perspectives VI (1994), pp. 363-400.
Hew, C.S. and L.Y. Lim. 1989. Mineral uptake by orchid plantlets grown on agar culture medium. Soilless Culture 5:23-24. Horesch, I. and Y. Levy. 1981. Response to iron-deficient citrus trees to foliar iron sprays with low surface tension surfactant. Sci. Hortic. (Amsterdam). 15:227-233.
Ibara, K. 1980. Production of potted Dendrobium orchids. Commertial Dendrobium Growers Conference. Hawaii. p. 24.
Khaw, C.H. 1982. Mineral Nutrition of Orchids. Malayan Orchid Rev. 16:34-39.
Klein, J. and S.A. Weinbaum. 1984. Foliar application of urea to olive: translocation of urea nitrogen as influenced by sink demand and nitrogen deficiency. J. Amer. Soc. Hort. Sci. 109:356-360.
Marschner, H. 1995. Mineral nutrition of higher plants. 2nd ed. Academic Press Limited, San Diego, California.
McKenzie, P. 1980. The ward lock book of orchid growing. Ward Lock Limited, London. p.37.
Morrison, G.C. 1988. The orchid grower’s manual. Kangaroo Presss. Kenthurst NSW.
Poole H. A. and T. J. Sheehnan. 1980. Mineral nutrition of orchids. In J. Arditti (ed), Orchid Biology: Reviews and Perspectives II (1982), pp. 197-211.
Pridgeon, A.M. 1981. Absorbing trichomes in in the Pleurothallidinae. Ame. J. Bot. 68:64-71.
Ritterhausen, Brian and Wilma. 1985. Orchid growing illustrated. Sterling Publishing Co., Inc. New York. p. 118.
Ritterhausen, Brian and Wilma. 1989. Orchids as houseplants. Ward Lock Limited, London. p. 37. 32
Sheehnan, T.J., J.N. Joiner, and J.K. Cowart. 1967. Absorption of P by Cattleya ‘Trimos’ from foliar and root applications. Proc. Fla. State Hort. Soc. 80:400-404.
Sinclair, R. 1986. Water relations in orchids. In J. Arditti (ed.), Orchid Biology: Reviews and Perspectives V (1990), pp. 63-112.
Soon, T. E. 1980. Orchids of Asia. Times Books International. Singapore. P.174.

44
Phosphorus and Potassium Effects on Soybeans
Stephen GowinDepartment of Horticultural Sciences, Texas A&M University, College Station, TX 77843-2133
Additional index words. deficiencies, essential nutrients
Abstract. N, P, and K are the three most important nutrients essential for plantgrowth. If any of these elements are eliminated, deficient, or tied up in the soil,plant growth will be reduced. Phosphorus and K have an impact on growth andyield potential in soybeans. Soil test is the cheapest and smartest investment afarmer can make. Low testing soils use various amounts of P and K fertilizer. Hightesting soils cost a producer large amounts of money if P and K are being added atany amount. Banding fertilizer close to the roots of the plant will enhance yieldpotential.
P Deficiency
Phosphorus deficiency may be more limiting to the world crop production than any other
deficiencies, toxicities, or diseases (PPI, 1979). Phosphorus deficiency is very hard to determine
in many field crops. Phosphorus deficiency may cause the soybean plants to look much greener,
thus giving them a healthy appearance. At the onset of P deficiency, the stems, leaves, or fruit
are stunted. The dark green, bluish, or sometimes purple color, is caused by the restricted size of
the leaf area. The darker color in the leaves is more apparent when various amounts of N have
been added for plant growth (PPI, 1979).
The most damaging effect of P deficiency in soybeans occurs during pod-fill. If
the plant is deficient in P at this juncture, the yield potential decreases dramatically.
If the plant is deficient in P during pod-fill, the size of the seed , leaves, and stems
_________________ 1Graduate candidate. Office address: CEA-AG Texas Agricultural Extension Service, P.O. Box248, New Boston, Tx 75570

2
are much smaller. The only way to truly know if the soybean plant has a nutrient deficiency is to
take plant tissue for analysis. Low levels of P can slow plant growth by slowing movement of
nutrients from the roots to the upper plant parts and inhibit the utilization of carbohydrates for cell
growth (Usherwood, 1997).
Soybeans take up about half of their needed P during the last 40 days of the growing
season (PPI, 1979), thus representing the time during pod-fill (Table 1).
Table 1. Percent of total P taken up by soybeans (PPI, 1979).
After Planting
40 Days 80 Days 100 Days 120 Days 140 Days
2 44 51 76 100
K Deficiency
Potassium is absorbed from the soil by the plant in the ionic form (K ). The primary
function of K is photosynthesis, protein synthesis, water use efficiency, and the development of a
healthy root system. The maximum need for K uptake in soybeans occurs during the periods of
rapid vegetative growth. Plants deficient in K tend to have weak stems and are more susceptible
to some plant diseases (Sinclair and Backman, 1993). Potassium reduces mold and mildew in
soybeans (PPI, 1979).
Potassium deficient plants in early stages of plant growth have irregular yellow molting
around the leaf margins. This will often lead to an irregular chlorotic order

1
that can lead to necrosis and the downward cupping of leaf margins (Sinclair and Backman,
1993). During this time, the basal portions remain green. Severe deficiency tends to produce
wrinkled and mis-shapened seeds. The seeds may also have a purple appearance at the point
where they were attached to the pod.
The deficiency can be corrected by applying fertilizers that contain K which increases the
number of pods and the size, weight, and number of seeds (Bharati, Whigham, and Voss, 1986).
Potassium fertilization also increases nodulation by Brady rhizobium (Sinclair and Backman,
1993). The increase in nodulation will increase the symbiotic N fixation capability in legumes
such as soybeans.
Movement of P and K
Phosphorus moves more freely in sandy soils than it does in clay soils, but is bound to soil
more than most other ions. Run off and crop removal are the only significant ways soils lose P
(PPI, 1979).
Phosphorus and K both are primarily moved in the soil by diffusion. This is a slow, short
range, process that depends on soil moisture. Dry conditions restrict diffusion (PPI, 1979).
Potassium is more soluble than P, thus giving K the ability to move greater distances. When
comparing P, K, and Ca there is a correlation on how solubility can effect the extent they are able
to travel in the soil solution.
Nitrogen (as NO ) which has a negative charge, moves very freely in the soil, whereas P
and K are tied up in the soil and cannot move freely (Table 2).

2
Table 2. The relative movement of N, P, K, and Ca in soil (PPI, 1979).
<-------------N-------------> <---P---> <---------K---------> <-----Ca----->
Crop roots, such as soybeans, usually contact less than 1 to 3% of the soil surface in
which they grow (PPI, 1979). Therefore, if P and K are not available in the 1 to 3 % range, then
the crop can be deficient of these two nutrients.
Research shows that if the P in a loamy soil is more than one centimeter from a root, it
will never move close enough to be taken up by the root (PPI, 1979). Thus, if P and K are below
the plow layer or hard pan the roots will not have access to these nutrients. However, nutrients
accumulate in the upper layer of the soil after repeated fertilizer application of little or no tillage
(Bharat, Whigham, and Voss, 1986).
The producer must apply a commercial fertilizer with an adequate supply of essential nutrients in
order to enhance optimal growth. The best way to apply the P and K commercial fertilizers is by
banding it directly beside the plant roots. Fertilizer that is placed close to roots are taken up
quicker to the roots.
Soybean Fertilization Using P and K
Fertilizer recommendations for soybean and other crops should be based on the nutrient
needs of the crop and the quantity of those nutrients available in the soil as measured by a soil
test. Soil analysis results should be compared to the critical level maintenance nutrient
requirement (Vitosh and Johnson, 1995). Soil test results below the critical level indicates a soil
that has nutrients insufficient for crop growth (Vitosh and Johnson, 1995). If the nutritional
analysis is above the critical soil test level, the soil is capable of supplying the nutrients required by

2
the crop and no response to additional nutrients in fertilizer would be expected. Critical levels for
each nutrient are provided when the soil analysis report is returned to clientele.
The necessity for high fertilizer dosage, when relatively small quantities of P are being
removed, indicates that much of the added P is being tied up and is unavailable to growing plants
(Brady, 1978).
Phosphorus add-in fertilizers exceed the amount that is removed by crops by more than
24% in the United States (Table 3).
Table 3. A comparison of N,P, and K removal by crops and resupply by fertilizers in the United
States (Blaine and Crouse, 1997).
(N) (P) (K)
Removed in crops (thousands of tons) 8838 1207 4152
Added in fertilizers (thousands of tons) 4580 1499 2313
Addition as percent of removal 52 124 56
A 2688 kg per Ha yield in Mississippi removed about 10.8 kg P and 18.9 kg K from soil in
the seed alone. Some soils, already high in fertility, can supply everything the soybean plant needs
but most soils cannot match fertilizer, grade, and rate with the soil and plant needs (Blaine and
Crouse,1997).
An 11 year study on Kenyon loam in Northeastern Iowa was conducted to determine the
effects of P and K fertillization on high testing soils (Mallarino, Webb, and Blackmar,1991).

2
Analyses of variance showed that 11 year means for yields of corn and soybean were not
significantly affected by either P or K fertilization. Occasional positive yield responses to
fertilization were observed in individual years, but these responses often did not pay fertilizer
costs. The results at this site suggest that corn and soybean producers could increase profits by
not applying P or K fertilizers to high-testing soils (Mallarino, Webb, and Blackmar,1991).
Phosphorous and K applications increase soil and leaf P and K content over time and with
application levels (Bharati, Whigham, and Voss,1986).
Table 4. The expected response of soybeans and potash at various soil testing levels
(Blaine and Crouse, 1997).
Yield Expected without Fertilizer Required Fertilizer
Soil Testing Phosphate Potash Phosphate Potash Levels % Kg/Ha
V. Low 35-80 50-80 120 120
Low 75-96 76-96 60 60
Medium 92-100 92-100 30 60
High 100 100 0 0
Very High 100 100 0 0
The values in Table 4 indicate the percentage of maximum yield that can be obtained
without fertilizer. For example, if the soil test is very low in K, the yield might be 20 to 50 %

3
below what it could produce with adequate levels. One hundred thirty-three kg of K per Ha are
recommended to prevent this yield loss on low testing soils (Blaine and Crouse, 1997). High crop
yields will lower soil fertility levels much more rapidly.
Conclusion
A producer must have a quality soil fertility management program in order to optimize
yield. The pH must be maintained at 6.5 to 7.0 in order to enhance the uptake of P and K.
Soybeans grow best on soils of medium to high fertility with favorable pH (Blaine and Crouse,
1997). The crops must be able to effectively use all essential nutrients, micro and macro nutrients
that are available in the soil. The best investment that a row crop farmer can make is to take a soil
sample every three years on all crop land.
Soil analyses are most often used prior to planting to evaluate the fertility level of the soil;
whereas, plant analyses are used during the growing season to monitor the seasonal nutrient levels
of plants, evaluate the effectiveness of fertilizer treatments and aid in the diagnosis of abnormal
plant growth. Both soil tests and plant analyses are used to determine if nutrient deficiencies,
toxicities, or imbalances are the causative factor of growth disorders during the growing season
(Mengel and Segars, 1987).
Literature Cited
Bharati, M. P., D. K. Whigham and R. D. Voss. 1986. Soybean response to tillage and nitrogen,phosphorus and potassium fertilization. Agronomy Journal. 78:947-950.
Blaine, Allen and Keith Crouse. 1997. Soybeans: liming and fertilization. Extension Bulletin E-873. Extension Service, Mississippi State University.
Brady, Nyle C. 1978. The nature and properties of soils. 8th ed. McMillan Publishing Co., NewYork
1
Mallarino, A. P., J. R. Webb and A. M. Blackmer. 1991. Corn and soybean yields during elevenyears of phosphorus and potassium fertilization on high testing soil. Journal ProductionAgriculture, 4/3:312-316.
Mengel, David and William Segars. 1987. Soybeans: improvement, production, and uses. 2nd ed.Agronomy Monograph, No. 16. American Society of Agronomy. Madison, WI.
PPI - Potash and Phosphate Institute. 1979. Soil Fertility Manual. Atlanta, GA.
Sinclair, J. B. and P. A. Backman. 1993. Compendium of Soybean Diseases. 3rd ed. Publishedby American Phytopathological Society.
Usherwood, Nobel R. 1997. Ag Briefs. Fall 1997. Published by Potash and Phosphate Institute,Atlanta, GA.
Vitosh, M. L. And J. W. Johnson. 1995. Tri-State Fertilizer for Corn, Soybeans, Wheat andAlfalfa. Extension Bulletin E-2567.

2
The Effects of Anoxia and Soil Compaction in Quercus stellata dueto Construction Injury
Priscilla J. FilesDepartment of Horticultural Sciences, Texas A&M University, College Station, TX77843-2133
Additional index words. oxygen deprivation, gas exchange, drought resistance
Abstract. Among the many different types of oak tree species in the central Texas area,the post oak, Quercus stellata, seems to be one of the most sensitive to soil compaction.With the boom in building of new homes and businesses, construction damage or 'dozerblight', is prevalent. The damage is primarily in the form of soil compaction, whichcombined with flooding, inhibits oxidative respiration, forms toxic compounds, andobstructs root growth. Taking measures to prevent construction damage rather thanattempting to ameliorate damage is the best way to avoid loss of these important trees.
The Post Oak, Quercus stellata, is one of our most important landscape trees, existing in a
range that extends from southern Massachusetts south to Florida and west to Texas (Wasowski
and Wasowski, 1988; Dirr, 1975). The Post Oak is most prevalent in Texas in the Blackland
prairie, the Post Oak Savannah, the Western Cross Timbers, and the Eastern Cross Timbers
stretching from east of Wichita Falls to Texarkana in the eastern corner of the state. Its range
then travels diagonally southwest past Bryan-College Station and Austin to the edge of the Hill
Country (Wasowski and Wasowski, 1988).
Characteristics
Quercus stellata is a large deciduous oak with roundly lobed leaves. Typically found on
dry, gravelly or sandy soils and rocky ridges, a very large Post Oak may reach a height of 25 m
and width of 13 m, but the average mature tree is13 by 8 m (Dirr 1975; Odenwald and Turner,

3
1987). Post Oaks allowed to grow openly have a dense, round-topped crown with gnarled stout
spreading branches, and are hardy from zone five to nine (Dirr, 1975).
Their value as a shade tree can be anywhere from 10-23% of the property value of a new
home (Miller, 1995).
Drought Tolerance
Recommended as a landscape tree for Xeriscape-type landscapes, Q. stellata is one of the
most drought tolerant large trees (Ellefson et al., 1992; Pallardy and Rhoads, 1993). Quercus
stellata develops an extensive root system and is not prone to leaf abscission due to water stress
(Pallardy and Rhoads, 1993). Post Oaks are able to avoid dehydration during times of normal
drought because they develop a greater root length per unit of supported leaf area and their roots
penetrate rapidly to lower soil depths (Pallardy and Rhoads, 1993). Not only are Post Oaks
drought tolerant but also, along with other oak species such as Q. alba, they have shown superior
recovery to predrought capacity. This appears to be due to increased stomatal limitation of
photosynthesis, specifically by Q. stellata, implying that the mesophyll constituents of
photosynthesis were relatively resistant to dehydration damage (Ni and Pallardy, 1992). It also
appears that Q. stellata seedlings may not experience a change in osmotic potential during
exposure to long (45 days) periods of drought (Kwon, 1989). Perhaps cavitation, which occurs in
most plants at -1 to -2 MPa, is not as severe of a problem in Q. stellata as in other species (Taiz
and Zeiger, 1991).
Evidence brought forth in an experiment on gas exchange indicated that Q. stellata is able
to sustain photosynthesis and leaf conductance to water vapor at leaf moisture values near -3MPa.
The same study revealed that Q. stellata seedlings had the highest photosynthetic rates and

4
highest leaf conductance when exposed to abundant soil water. These responses imply that xeric
species have a higher capacity for gaining carbon from dry soil and that this may be dependent on
water stressed responses and superior ability to photosynthesize at high soil water rates (Ni,
1991).
Soil Compaction and Flooding
While Q. stellata is resilient in droughty conditions, other environmental stresses such as
soil compaction, flooding, or the combination of the two results in decline and may often result in
death.
The major problems that occur with soil compaction are lack of available oxygen, anoxia
(completely lacking oxygen), hypoxia (partially lacking oxygen), reduction of gas exchange and
density of the soil which prevents penetration by tender roots (Day and Bassuk, 1994; Janne and
Welsh, 1997).
Oxygen Deprivation
In well-structured soils, gas-filled pores allow diffusion of O2 several meters deep. In
general, when the volume of the soil occupied by air is decreased below 10-12%, most plants are
likely to be injured. When oxygen concentrations are below the critical oxygen pressure for a
certain species aerobic respiration is slowed or halted and anaerobic respiration, fermentation, is
the only way plants can produce ATP to drive basic metabolic processes. Because only 2 moles
of ATP per mole of six-carbon sugar are respired as the net yield of fermentation as compared to
36 moles of ATP netted during aerobic respiration, injury to roots is caused by lack of ATP. Not
only are roots that are anoxic or hypoxic unable to grow and metabolize they are also unable to
support the physiological processes which shoots are dependent upon (Taiz and Zeiger, 1991;

5
Brady, 1990). Canopy cover is reduced as evidenced in observations from logging practices in
areas where the soil has been compacted (Whitman et al., 1997). The trees cannot produce
enough energy to survive.
Flood Damage
Flooding, whether due to natural causes or excessive irrigation practices, is a major
problem especially when combined with soil compaction. Because the rate of O2 diffusion is
approximately 10,000 times slower through water than air, when the pores are filled with water,
O2 may be limiting. The detrimental effect of excessive water on O2 levels is intensified in
compacted soils (Day and Bassuk, 1994). Along with O2 deprivation, reduction of gas exchange
between the roots and the air in the pore space of the soil is detrimental (Janne and Welsh, 1997).
In an experiment on the effects of flooding and containerized fruit trees, gas exchange to the roots
and stomatal conductance were affected in conjunction with decreased CO2 assimilation. In less
than 12 hours net CO2 assimilation was reduced compared to controls and in five days the net
CO2 assimilation was only 32% of the net assimilation of controls (Beckman et al., 1992).
The formation of toxic organic compounds is favored during flooded conditions as a result
of O2 deprivation (Brady, 1990; Janne and Welsh, 1997). Acetic acid, butyric acid, and bacterial
metabolites are released into the soil water as anaerobic microorganisms in the soil metabolize
organic substrates. These acids along with reduced sulfur compounds, such as H2S a respiratory
poison, are toxic to plants when present at high concentrations (Taiz and Zeiger, 1991).
Density

6
The negative effects of soil compaction are not completely due to poor aeration. Soil
layers may become so impenetrable as to obstruct the growth of roots even if enough O2 is
available (Brady, 1990). Compaction levels may be determined by soil bulk density defined as
oven dry mass/volume or by penetration resistance measured by a penetrometer. Plant
performance has been more strongly linked to resistance to the penetrometer than the level of bulk
density. A MPa of 2.3 seems to be the highest approximate limit of soil strength that would allow
root growth of woody species (Day and Bassuk, 1994).
Construction Damage
Many new homeowners in the central Texas area buy wooded lots with the intention of
building a home among the trees. Unfortunately, current construction practices are not designed
to preserve the Central Texas woodlands. The most irreparable damage that occurs during
construction of new homes is bulldozer damage, otherwise known as 'dozer blight'. There are at
least six ways that trees suffer injuries from bulldozers:
1. Soil compaction,
2. Root wounds that include disruption of mycorrhizal activity,
3. Lower trunk wounds,
4. Exposure to leaves of heat and fumes from oil and gasoline,
5. Wounds to the trunk, and
6. Wounds to the branches (Keslick, 1997).
The remainder of this paper will concern itself with the first two types of injuries.
Roots

7
The majority of a tree's root system is within the top meter of the soil. In fact,
99% is in the top meter, with most of the absorption being conducted by roots in the top 15 cm.
The spread of the root system often extends more than 10 m beyond the dripline of the branches
and can easily extend outward in a circle with a diameter more than twice the height of the tree.
A particular root is directly connected to a given set of branches in oaks, most commonly on the
corresponding side of the tree. If the roots are damaged or die, then death of the corresponding
set of branches is the usual result (Relf, 1997; Tree Page, 1997).
Compaction and Roots
Soil compaction affects the small feeding roots less than 0.2 to 1 mm in diameter and less
than 1 to 2 mm in length. These non-woody roots are the major portion of the absorbing surface
of the root system. They are concentrated within the top 15 cm of the soil and a significant
portion of them are located within the top few millimeters of soil, growing into the leaf litter of
the forest floor, into lawns and cracks and crevices of hard pavements (Relf, 1997; Tree Page,
1997). In a study on tillage intensity and fertility level effects on N and carbon cycling in a
vertisol it was found that any changes to the soil environment in a positive fashion, i.e. adding
nutrients, including increased biomass inputs, were restricted to the top 10 cm of the soil (Torbert
et al., 1997). Root suffocation caused by compaction combined with flooding, and impedance of
root growth due to poor penetrability of the soil are the main causes of root death in compacted
soils (Day and Bassuk, 1994; Janne and Welsh, 1997).
Feeder roots form relationships with mycorrhizal fungi, in particular

8
ectomycorrhizae for oaks, which facilitate the absorption of nutrients, especially P, Zn, Mn, Cu,
and water. Ectomycorrhizae flourish in leaf litter and so are especially prone to damage from soil
compaction (Keslick, 1997).
Reducing Construction Damage
Establishing landscape trees or preserving existing trees is particularly troublesome on
construction sites. The most limiting factor is O2 deprivation due to compaction and drainage
(Lichter and Lindsey, 1993). Protection and prevention seem to be the most effective ways to
reduce construction damage. By establishing a root protection zone the chances of saving an
existing Post Oak may be increased. Solid fencing should be erected at least one and one-half
times the circumference of the dripline to restrict any access under the tree. The fence should be
installed prior to clearing of the site, not during construction. Neither storage of materials nor
pedestrian or vehicular traffic should be allowed within the root protection zone. The soil, shrubs
and ground covers should be retained within the fence to prevent any disturbance (Arnold, 1997;
Gilbert, 1996; Wasowski and Wasowski, 1988). Using soil amendments such as sintered fly-ash
and expanded slate amendments in high proportions (20-33%) and incorporating them into the
soil reduced bulk density for as long as 4 years after incorporation (Day and Bassuk, 1994). Use
of such materials may be beneficial for highly trafficked areas unprotected by a fence.
Conclusion
More effective measures will be taken to reduce construction damage as the economic
importance of landscape trees becomes more obvious. This is particularly true in Central Texas,
where Native Post Oaks are the predominant species. Typically developers have been ambivalent
toward tree retention considering them to be obstacles in the early stages of building, yet

9
regarding them as selling points toward the end of contracts often times after extensive damage
has already occurred (Gilbert, 1996).
Ironically, the very characteristics that make Q. stellata desirable for the
landscape are what inevitably kills them under adverse conditions. Soil compaction combined
with flooding, a typical situation found in landscapes of newly constructed homes, may be lethal
to Post Oaks. It is impossible to assume that a tree that has the physiological characteristics
designed to overcome drought, and has never been disturbed or irrigated, can overcome this type
of stress. Further study targeting Q. stellata in regards to the effects of drought, abundant soil
moisture, and flooding should be carried out.
Literature Cited
Arnold, M.A. 1997. Landscape construction and maintenance. A Course Packet forHORT 425. Fall 1997 Edition. Department of Horticultural Sciences. Texas A&M University,College Station, TX.
Beckman, T.G., R.L. Perry, and J. A. Flore. 1992. Short-term flooding affects gasexchange characteristics of containerized sour cherry trees. HortScience 27: 1297-1301.
Brady, N.C. 1990. The nature and property of soils. 10th Ed. MacMillan PublishingCompany, New York, NY.
Day, S.D. and N.L. Bassuk. 1994. A review of the effects of soil compaction andamelioration treatments on landscape trees. Journal of Arboriculture. 20(1): 9-16.
Dirr, M. 1975. Manual of woody landscape plants: their identification, ornamentalcharacteristics, culture, propagation and uses. 4th Ed. Stipes Publishing Company,Champaign, IL.
Ellefson, C., T. Stephens, and D. Welsh. 1992. Xeriscape gardening: waterconservation for the American landscape. Macmillan Publishing, New York,NY.
Gilbert, O.L. 1996. Retaining trees on construction sites. Arboricultural Journal.20: 39-45.

10
Janne, E.E. and D.F. Welsh. Protecting existing landscape trees from constructiondamage due to grade change. http://aggie-horticulture.tamu.edu/extension
Keslick, J.A. Jr. 1997. "Dozer" blight. One absorptive structure, mycorrhiza. How to killa tree. http://[email protected].
Kwon, W.K. and S.G. Pallardy. 1989. Temporal changes in tissue water relations ofseedlings of Quercus acutissima, Q. alba, and Q. stellata subjected to chronic waterstress. Canadian Journal of Forest Research. 19: 622-626.
Lichter, J.M. and P.A. Lindsey. 1993. Soil compaction and site construction: assessmentand case studies. The Landscape Below Ground. Proceedings of an InternationalWorkshop. International Society of Arboriculture. Savoy, IL.
Miller, F.D. 1995. Utility trenching: its affect on growth and overall plant health ofshade trees. Arborist News. 4(2): 15-16.
Ni, B. and S.G. Pallardy. 1991. Response of gas exchange due to water stress in seedlingsof woody angiosperms. Tree Physiology. 8(1): 1-9.
Ni, B. and S.G. Pallardy. 1992. Stomatal and nonstomatal limitations to netphotosynthesis in seedlings of woody angiosperms. Plant Physiology. 99: 1502-1508.
Odenwald, N. and J. Turner. 1987. Identification selection and use of southern plants forlandscape design. Claitor's Publishing Division, Baton Rouge, LA.
Pallardy S.G. and J.L. Rhoads. 1993. Morphological adaptations to drought in seedlingsof deciduous angiosperms. Canadian Journal of Forest Research. 23: 1766-1774.
Relf, D. 1997. Tree roots-where are they? The Virginia Gardener Newsletter. 6(8).Department of Horticulture, Virginia Tech, Blacksburg, VA.
Taiz, L. and E. Zeiger. 1991. Plant physiology. The Benjamin/Cummings PublishingCompany, Inc. Redwood City, CA.
Torbert, H.A., K.N. Potter, and J.E. Morrison, Jr. 1997. Tillage intensity and fertilitylevel effects on nitrogen and carbon cycling in a vertisol. Communications in Soil Science andPlant Analysis. 28(9& 10): 699-709.
Tree Page. 1997. Trees. PLANTanswers Home.
Wasowski, S. and A. Wasowski. 1988. Native Texas plants: landscaping region byregion. Gulf Publishing Company, Houston, TX.

11
Whitman, A.A., N.V.L. Brokaw, and J.M. Hagan. 1997. Forest damage caused byselection logging of mahogany (Swietenia macrophylla) in northern Belize. ForestEcology and Management. 92: 87-95.

12
Reclamation of Sodic and Saline Soils
Shannon T. AlstonDepartment of Agronomy, Tarleton State University, Stephenville, Texas, 76401
Additional Index Words: salt, sodium, sodic, saline, gypsum, calcium
Abstract: Salt is the savor of food, but the scourge of agriculture: in excess salt killsgrowing plants. Sodic, saline, and sodic-saline soils affect agricultural fieldproduction in many regions across the United States as well as in numerous othercountries. These soils can be productive once again with proper reclamation andmanagement techniques available to producers the world over.
Salted soils are unproductive unless harmful salts are lessened or removed. About 2100
years ago, the Romans plowed the semiarid fields of Carthage and applied salt to ensure that the
Carthaginians could not re-establish their powerful metropolis. Efforts to recolonize the area 24
years later failed because the salted fields were still unproductive (Donahue, 1983). Soluble salt
contamination of soil has caused problems for all of recorded history. Primarily this
contamination occurs in arid regions of the world where inadequate rainfall results in lack of
leaching resulting in accumulation of excess salts. The effects of salt devastation are apparent in
many areas and are becoming more common and serious as land use intensifies and water supplies
become more limited and polluted with soluble salts. The accumulation of soluble salts in the soil
results in one of the most serious agricultural problems that producers face in arid regions.
Harmful effects of salt include poor seed germination and plant growth, these problems result
from one or both of the following conditions: (1) a limited availability of water due to a high
osmotic concentration of the soil solution, and/or (2) an unsuitable physical or nutritional state
caused by a high level of exchangeable sodium (Na) (Hausenbuiller, 1978).

13
Salts accumulation in the soils of arid regions occurs in many ways. The most common
way salts are deposited in the soil is by the introduction of water that is then lost by evaporation
and transpiration. The net result of this phenomenon is salt accumulation. Some soils develop in
arid regions under conditions of poor drainage where there is more evaporation than precipitation
(Foth, 1978). Under these conditions soluble salts and exchangeable Na may collect in amounts
sufficient to impair plant growth and possibly alter soil structure and properties. Water may also
move upward through the soil strata by means of artesian wells and shallow water tables (Tisdale,
1985). Evaporation of this water results in the deposition of soluble salts into the soil which
strengthens the concept introduced. These soils are widespread in arid and semiarid regions
where a lack of precipitation (less than 38.1 cm./yr.) hinders the leaching process (Tisdale, 1985).
These types of soils are particularly prevalent in irrigated areas where improper drainage methods
are used. This is the case of salt marshes, mangrove groves, and salt marshes found adjacent to
salt lakes and other bodies of salty water (Black, 1968). Another source of salt introduction into
the soil is by means of the ocean through tidal actions and sea spray being carried inland by wind
(Hausenbuiller, 1978). Soils that form from marine parent material also contribute to the amount
of soluble salts present (Tisdale, 1985). Salt accumulation can be avoided by selecting deep, well-
drained soil.
Soils affected by salts have been given many descriptive and imaginative names such as
white alkali, black alkali, slick spots, and summer snow. These names have been given to describe
the topical appearance of the soil itself. The most common descriptors used to describe salt
affected soils are saline, sodic, and saline/sodic. Saline soil can be defined as soil that contains
excess salts made up of Cl and SO4 salts of Na, Ca, and Mg (Tisdale, 1985). Saline soils possess

14
a saturated extract conductivity (ECSE) of >4ds·m-1, pH<8.5, and have <15% exchangeable Na%
(ESP) (Black, 1968). Sodic soils occur when ESP>15%, ECSE<4ds·m-1, and pH>8.5. In sodic
soils, excess Na disperses the soil colloids and creates nutritional disorders in most plants
(Tisdale, 1985). Excess Na hinders water penetration in soils yielding drought stress symptoms to
be expressed by plants. Sodic/saline soils possess both the salt concentration (4ds·m-1) to qualify
it as saline and high exchangeable Na (>15% ESP) to justify it as sodic as well; however pH is
<8.5 (Hausenbuiller, 1978) (Table 1).
Table 1. Summary of salt-affected soil classifications.Classification Conductivity
(ds·m-1)
Soil pH Exchangeable
Sodium Percent
Soil Physical
Condition
Saline >4.0 <8.5 <15 Normal
Sodic <4.0 >8.5 >15 Poor
Saline/Sodic >4.0 <8.5 >15 Normal
Source: Tisdale et al., 1985.
Tests are performed and calculations made to determine if a soil is saline, sodic or saline/sodic.
ESP is calculated to determine the percentage of exchangeable Na ions to the total exchangeable
cations in the soil sample. This calculation is facilitated by the formula:
ESP = exchangeable sodium ions *(100)cation exchange capacity
Soils through which salty water flows often adsorb too much Na on the soil exchange sites, the
higher the value of Na adsorbed to the soil colloid the higher the ESP value will be (Donahue,
1983). Another way ESP values are derived is by a similar calculation known as the Sodium

15
Adsorption Ratio (SAR). This ratio is used to estimate the amount of exchangeable Na
percentage of a soil, or what it is likely to become. SAR values correlate well to the ESP of a soil
and are easier to calculate and estimate. The conductivity of a soil sample is easy to determine.
All ions conduct electricity and because of this principle salt content can be determined by
measuring electrical conductivity of the soil solution (Donahue, 1983). Soil pH is the final criteria
to measure in order to classify soils as saline, sodic, or a combination of both.
Producers must consider reclamation and management when presented with the problem
of producing a crop on salt-affected soils. Soil reclamation is more difficult in actual practice than
in theory. Good drainage is a necessity for the reclamation of saline soils. It is essential to remove
the excess salts from the root zone, and this can only be done by the application of sufficient
water to leach the salts into the lower soil depths (Foth, 1978). Unless drainage is adequate, the
addition of too much water will raise the water table and lead to increased accumulations of salt in
the surface soil. Instead of leaching the salts from the soil they will in actuality be adding more
salts (Foth, 1978). Sufficient drainage should be provided to reduce the ground water level well
below the zone of root penetration. Preferably the ground water should never be less than 2.4-3.1
m below the surface, and every effort should be made to prevent it from rising nearer than 1.5-1.8
m from the soil surface if even for a brief period of time (Black, 1968). Once ample drainage has
been accomplished the reclamation process can continue. In fine-textured soils the leaching
process will be slow, especially if there is a clay hardpan present in the soil subsurface.
Percolation of surface water into the soil with a hardpan can result in a perched water table. The
water is trapped on top of the hardpan and is unable to leach through the dense clay. The
presence of a dense, clay hardpan makes the reclamation process difficult even under medium and

16
coarse-textured soils. It is questionable if reclamation of soils with very deep clay subsoils is
feasible under an economic standpoint (Foth, 1978). Experiments have shown that leaching is all
that is needed to reclaim saline soils that have adequate internal drainage (Loomis, 1992). The
addition of chemicals, plowing under of manure, or green-manuring crops are unnecessary. In
terms of irrigation, no specific direction can be given regarding the frequency of irrigation or the
quantity of water to apply at each irrigation. The main points to observe are: (1) that the soil be
kept moist so that the soil solution will not become sufficiently concentrated with salts to damage
the growing crop, (2) that sufficient water be applied at each irrigation to result in some leaching
of salts into the drainage water, and (3) that the soil of each irrigation pan be carefully leveled so
that the water will enter the soil uniformly (Foth, 1978).
All that has been said concerning the need for drainage and the application of sufficient
irrigation water to cause leaching is as important, if not more important in the reclamation of
sodic and saline/sodic soils. It has been demonstrated that application of sufficient irrigation
water coupled with sound farming practices will result in the removal of exchangeable Na and
salts. This reclamation process can be hastened by amending the soil with a supply of soluble Ca
(Hausenbuiller, 1978). Gypsum is the amendment used most widely for the purpose of displacing
exchangeable Na. Once in soil solution, the Ca from gypsum undergoes and exchange with the
Na present. The displaced Na becomes part of the soil solution and forms a soluble salt that can
be leached from the soil profile. A diagram of this reaction can be seen in Equation 1.
Na2 + CaSO4 Ca + Na2SO4 (Equation 1)
Gypsum is not a highly soluble salt; therefore it will not readily leach from the soil profile. It is
for this reason that precautions must be taken to obtain maximum soil surface contact. One

17
method to facilitate soil contact is to mix the soil with the gypsum so that extensive contact is
made with the soil exchange sites. With increasing amounts of gypsum to the soil, pH of a
particular soil will increase. If the soil being reclaimed possesses a high pH the addition of ground
sulfur will accomplish the same results as gypsum, but at a slower pace (Loomis, 1992). The
sulfur must first be oxidized in the soil and then combines with water to form sulfuric acid.
Equation 2.
2S + 3O2 + H2O + 2Na 2NaSO4-2 + 4H+ (Equation 2) The
theory behind this is that the same reaction occurs as in Equation 1, but instead of releasing Ca
into the soil H+ ions will be released which will result in a lowering of soil pH. Other soluble
sulfates such as Fe and Al have been tested and proved effective in this process (Tisdale, 1984).
The elimination of soluble salts and exchangeable Na from soils by leaching has been a
satisfactory method of reclaiming salt-affected soils. The downfall to this method is that the
leached Na and salt is washed into groundwater supplies and streams making these water bodies
even more salt polluted. More costly water and lower salt tolerances have focused attention on
precipitation of salts, which is a relatively new concept in managing salty soils. This idea suggests
that instead of leaching salts into the ground water, they can be leached to a depth of 1-2 meters,
where much of the salt would form slightly soluble gypsum (CaSO4•2H2O) or carbonates
(CaCO3, Mg CO3) during dry cycles and not react any longer as soluble salts (Donahue, 1983).
In theory any water that reaches and passes through this precipitation zone will not carry as much
salt or Na into groundwater sources or surface water. Many unanswered questions arise with this
new hypothesis.

18
Literature Cited
Black, C.A. 1968. Soil plant relationships. New York: John Wiley and Sons.
Donahue, Roy L., Raymond W. Miller, and John C. Shickluna. 1983. Soils: An introduction tosoils and plant growth. 5th Edition. New Jersey: Prentice-Hall, Inc.
Foth, Henry D. 1978. Fundamentals of soil science. 6th Edition. New York: John Wiley andSons.
Hausenbuiller, R.L. 1978. Soil science: Principles and practices. 2nd Edition. Iowa: Wm. C.Brown Co.
Loomis, R.S., and D.J. Connor. 1992. Crop ecology: Productivity and management inagricultural systems. New York: Cambridge University Press.
Tisdale, Samuel L., Werner L. Nelson, James D. Beaton, and John L. Havlin. 1993. Soil fertilityand fertilizers. 5th Edition. New York: Macmillan Publishing Co.
Dairy Composting: Does it Affect the Availability of Nitrogen andPhosphorus?
Tammy Cantrell1
Department of Horticultural Sciences, Tarleton State University, Box T-0050, Stephenville,Texas 76402

19
Information in this paper was taken from data listed on several different studies conducted on
composting and its relationship to nutrient uptake. There are 38 dairies currently operating in
Johnson County. Each dairy animal produces 6.7 kilograms of waste per day on average. A herd
of 500 Holstein cows can produce 772,773.54 kg solids/year. Dairy operators are looking for
economical and environmentally safe methods to deal with the large amount of waste generated
by animals. Composting is rapidly becoming the logical choice for these dairy operators. The
availability of Nitrogen and Phosphorus in compost were examined as well as different methods to
apply the compost for best results. The average percentage of N in compost is 1.5-3.5% and P is
.06-1.5%. In general, Nitrogen has a lower availability and Phosphorus remains about the same
as a chemically applied nutrient.
Johnson County currently has 38 dairies. In 1996 dairies were the leaders in the Johnson
County Agricultural Economy. Monies raised in 1996 totaled $32,299,854. Johnson County's
economy is definitely enhanced by the presence of these dairies, but there are pros and cons in
dealing with the waste generated by dairy cattle. According to ASAE data each live dairy animal
produces 6.7 kilograms of waste per day on average (Table 1).
________________________
1 County Extension Agent-4-H, Johnson County, 2 Main Street, Suite 309, Cleburne, Texas76031
Disposing of dairy manure in a cost effective and environmentally safe method has become a
major concern for dairy producers and the general public. There is concern that the groundwater

2
supply may become contaminated due to nitrates. Nitrate is a mobile form of N that can be easily
leached into groundwater. When NO3-N is present in groundwater at a rate of more than 10 mg
kg-1 it is considered to be hazardous to the health of people. Senator Tom Harkin (D-IA)
announced on September 25, 1997 that he is crafting legislation that would require large livestock
operators to submit animal waste management plans to USDA for approval. The objective in
Johnson County is to be able to utilize dairy manure as a compost in compliance with USDA
guidelines, and increase the N and P availability in the soil.
Table 1: Calculations on amount of solid waste produced in one year by a herd of 500 Hosteincows weighing 635.029 kilograms each.
1) Liveweight 500 hd. x 635.029kg/hd.=317,514.68kg liveweight
2) Total Manure Solids Production a) Based on 24 hr. confinement (all manure collected into a waste stream)
317,514.68 kg liveweight x 6.68 kg solids/1,000 hd./day =2,117.188 kg solids/day
=772,773.54 kg solids/year
b) Based on 6 hour/day confinement period on concrete (remaining 18 hrs./day in openlots):Total solids load on concrete entering liquied manure system=
6 hrs/day 24 hrs./day x 4,667.466 kg solids/day=1,166.87 lbs. solid/day =4,259.27 kg/year
Types of Composting

2
Composting is the controlled degradation of organic matter to simpler compounds of (CO2,
H2O) under thermophilic, aerobic conditions (Sweeten et al., 1990). The following conditions are
ideal for composting:
Oxygen-3-5% volumeMoisture-40-60% wet basis
C:N:P ratio=20-25:1:0.2pH=7.0-8.0
Ash content in manure=45% or lessTemperature=57-74EC
The major methods of composting today are In-bin mechanically mixed, In-vessel (eg. rotating
cylinder), Static Pile/Windrow (unmixed), Windrow Method, and Aerated Static Pile Windrow
(eg. Beltsville Aerated Static Pile Method).
Aerated-Bin composting can be accomplished through mechanical stirring. In this process
composting material is fed into an aerated bin. Environmental conditions in the bin are controlled
carefully so that a steady rate of decomposition is maintained by micro-organisms. Aeration
within the reactor is accomplished by forcing air into the compost using draft
compressors/blowers, turning the compost mechanically or a combination of both of these.
Turning the compost should be performed on a daily basis to allow oxygen to reach all micro-
organisms. During the first 2 weeks forced aeration will usually exceed 4.6 to 9.1 meters. During
the third week 1-2 scfm per m-3 or less. Temperature should also be monitored by using oxygen
probes that will aid in determining turning frequencies and aeration schedules which may differ for
each mix of compost. In the batch-operated system perforated pipes are used to provide aeration.
Air can have positive or negative pressure, or a combination of both. Every few days compost
will have to be transferred to another adjacent bin in this method (Kuhlman et al., 1990).

3
When compost is complete it will have a black-brown crumbly appearance and an earthy
smell which indicates it is ready for use. Aerobic thermophilic composting kills most pathogens
and weed seeds. Other benefits of composting are the reduction of materials volume and weight.
Most of the odor is dissipated, physical properties improved, and mineral elements retained.
While NH4-N may be volatized, total N usually remains stable (Sweeten et al., 1990).
Effects of Composting on Nutrient Availability
The total amount of N, P, and K excreted annually by dairy cattle averages 127, 27.22 and,
88.45 kg/head/year respectively. Nitrogen begins to transform immediately once manure is
excreted. A large percent of N will be lost to the atmosphere though volatization of ammonia
(Sweeten et al., 1991). Percentage of loss is dependent on wind speed, humidity, temperature and
pH. Moisture can also affect loss through volatization. Nitrogen will also be made more
unavailable if manure compost is not fully mature. Immature compost can create its own demand
for nutrients. Micro-organisms are working during composting to break down manure.
Immature compost will utilize N making it unavailable for plant growth. Low availability of N
occurs frequently in compost with a high C:N ratio (Dick and McCoy et al., 1993).
When comparing nutrient content of compost to manure the following results are gained:
-P and K- higher in compost-N-similar or slightly higher in compost-N-availability-usually lower

2
-Other minerals-higher in compost
Nitrogen N, P, and K are the three nutrients in highest demand by crops. The average
percentage of N in compost is 1.5-3.5%, P is .06-1.5% and K is generally twice that of P
(Sweeten et al., 1990). Nutrient uptake may be increased due to compost improving soils
chemical, physical, and biological properties. Another advantage is that leaching or loss of
nutrients can be decreased by increasing the soil organic matter content. Organic matter helps
hold nutrients that are in a water soluble form that would otherwise be leached. The addition of
organic matter to soil through composting helps by increasing mineralization. This in turn helps
to make micro-nutrients more available by causing minerals to chelate, which makes them more
soluble and more mobile to the plant roots (Dick and McCoy et al., 1993).
When applying composts to croplands N is slowly available. Nitrogen is much more
available in inorganic sources. The slow availability of N in soils that have had compost applied,
however, will have N over a longer period of the growing season since the possibility of leaching
is decreased. The availability of P and K in composted soils remains comparative to soils treated
with chemical fertilizers. Phosphorus is usually even a little higher due to loss of dry matter
during composting that causes P to become more concentrated. Following composting, nutrient
availability in the growing season represents approximately 25% N, 100% P, and 80% K of the
total N, P, and K in the compost (Stewart, et al. 1990).

1
Benefits for farmers cannot always be immediately measured when using compost.
In the first year or two of composting goals should be to reduce money spent on chemical
fertilizers, while maintaining yields, and to begin to restore nutrients to soil. With each
year's application of compost soil fertility is improved and fertilizer costs will continue to
decrease. The need for chemical nutrients can sometimes be completely eliminated and
crop yields will continue to increase. Yearly applications of compost to fallow fields in
addition to chemical fertilizers have been shown to greatly improve soils because of the
addition of organic matter to the soil and the additional nutrients from the chemicals that
are readily available for the plants. Spreading of compost can not always be evenly done.
With each years application the addition of organic matter to soils will build up and
improve the soil conditions immensely which allows for higher nutrient availability. It was
the large loss of organic matter in soils that contributed to the dustbowl of the 1930s.
Composts not only aid in restoring soil to greater productivity, they also bind toxic metals
to organic matter. Toxic metals are not much of a problem in dairy manure, but they are
in high pH soils, industrial waste, and sewage sludge (Dick and McCoy et al., 1993).
Summary
The negatives of composting are cost of equipment, space, and not being able to
meet crop demands at the right time. Composting provides dilute sources of N, P, and K
as compared to chemical fertilizers. The benefits of long-term composting seem to
outweigh these negatives. Most dairies are already equipped with heavy machinery. When
viewing the overall problem of disposing of dairy waste, composting is a logical solution
to the problem. Annual compost applications yield long term benefits. Crop yields will

2
increase and chemical fertilizer costs will continue to be reduced, and weed seed
population and pathogens will be decreased by higher temperatures. Toxic metals will be
bound to organic matter. Improvement of soil conditions will allow for greater nutrient
uptake. Nutrients are available over a longer period of time, but may not be available at
the right time to meet crop demands.
Literature Cited
Barker, J.C. 1996, Utilization of dairy manure as a fertilizer. Publication No. EBAE 133-88 North Carolina Cooperative Extension Service, North Carolina State University,Raleigh N.C. 5p.
Buchanan, Marc and Stephen Gleissman. 1991. How compost fertilization affects soilnitrogen and crop yield. Bio-Cycle, University of California, Santa Cruz.
Dick, W.E. and E.L. McCoy. 1993. Enhancing soil fertility by addition of compost.Science and Engineering of Composting Design, Environmental, Microbiological,and Utilization Aspects, H.A.J. Hoitink, ed. Ohio State University
Kuhlman, L.R. 1990. Windrow composting of agricultural and municipal wastes.Elseview Science Publishers B.V./Pergamon Press plc.
Stewart, B.A. 1990. Agronomic benefits of compost. West Texas A&M University,Canyon, Texas.
Sweeten, John M.0. 1990. Composting manure and sludge. Texas Agricultural ExtensionService, Texas A&M University System, College Station 77843. 4p.
Sweeten, John M. and M. McFarland, B.L. Harris, G. Westmoreland, C. Baird, and L.Manning. 1991. Animal waste application. L-5044, Texas Agricultural ExtensionService, Texas A&M University System. 77843. 4p.

3
An Argument for the Use of Equisetum in ConstructedWetlands Designed for Wastewater Cleanup
Michelle S. Meche2
Department of Horticultural Sciences, Texas A & M University, College Station, TX77843-2133
Additional index words. horsetail, nutrient removal, nutrient uptake, water treatment
Abstract. Constructed wetlands have become an increasingly popular methodof treating various types of wastewater. While numerous plant species areused in these wetlands, Equisetum (subgenus Equisetum) has been ignored asa possible plant material. However, studies indicate that this plant would behighly suitable for use in constructed wetlands. Equisetum’s extensive rootsystem is a positive factor in its symbiotic relationship with the microbialorganisms necessary to aid in cleaning wastewater. Studies have also shownthat Equisetum is superior in nutrient uptake to most other plant speciescurrently used in artificial wetland systems. Additional studies have shownthat Equisetum is even capable of taking up heavy metals such as Hg.
Numerous municipalities, mines, agricultural businesses (farming and
animal husbandry), and even nurseries have turned to constructed wetlands as a
viable means of cleansing runoff waters in light of state and federal legislation
regulating the use of water. These wetlands have diverse uses and can be designed
to treat numerous types of runoff, even including raw wastewater (Bastian et al.,
1989). Most of these wetlands utilize a combination of plant material and bacterial
colonies as the means to cleanse runoff. However, the quality of the wetland
system will vary depending upon plant species (Auclair, 1979). Some common
plants used in constructed wetlands are Eichhornia spp. (water hyacinth), Typha
spp. (cattail), Phragmites communis (common reed), and Scirpus spp. (bulrush).
Yet while these and other species have been utilized in constructed wetlands, those
2 Graduate Assistant--Teaching. Home address: 2900 Silver Spur Circle, Apartment C, BryanTX 77801.

4
of the genus Equisetum (subgenus Equisetum) have remained conspicuously
absent from trials in these wetlands. Most likely, these plants, commonly known
as horsetail, have been neglected due to their common perception as a troublesome
C3 weed, but this plant does have numerous attributes that would make it an
excellent choice for use in constructed wetlands designed to remove nutrients from
waste water.
Equisetum has been categorized as a member of the order Equisetales and is the
only genus in the family Equisetaceae (Agashe, 1995). According to Agashe,
Equisetaceae dates back to the Upper Carboniferous and attained a high level of
diversification by the Permocarboniferous period. The order flourished in the Mesozoic
era but declined in the Cenezoic. Today it is composed solely by the genus Equisetum.
This genus has been in existence since the mid-Permian period (Agashe, 1995).
The plant’s life cycle is much like that of other spore-bearers. Equisetum,
however, includes the formation of a cone-like strobilus from which the spores are
released (Taylor and Taylor, 1993). Aside from the formation of the strobilus,
Equisetum’s life cycle exactly parallels the life cycles of other plants which undergo
sporophytic and gametophytic stages. Equisetum also reproduces asexually by rhizomes.
Root System
One of Equisetum’s chief attributes making it a suitable plant matter for
constructed wetlands is its root system. Equisetum is remarkable for its extensive rhizome
systems with the potential to cover hundreds of feet and to reach depths of six to seven
feet (Hauke, 1963), and Equisetum’s much-acclaimed root system is also extensive. In
fact, much of its reputation as a weed and its resistance to any method of eradication

5
resulting in soil disturbance is due to this massive root system (Cloutier and Watson,
1985). This root system also has its benefits. Within gravel bed microcosm wetlands, a
greater root biomass has been found to result in a greater chance for N uptake or
nitrification mediated by O2 transport to the rhizome (Zhu and Sikora, 1995). This study
found that in a comparison of reed and Typha, the higher removal rate of
NH4-N by reed was likely due to its greater rhizosphere development while the lower
removal rate in Typha was due to its low root biomass weight. These results indicate that
Equisetum use would also result in a higher removal rate of NH4-N due to its extensive
root system.
Additionally, Equisetum’s root system would also seem ideal since these extensive
subsurface systems offer abundant room for microbial colonies. The basis for selection of
aquatic plants for wastewater treatment rests upon the species’s ability to work in
cooperation with microorganisms (Wolverton, 1989). This cooperative growth between
macrophytic plant species and microorganisms is the basis for wastewater treatment in
wetlands since these microorganisms form symbiotic relationships with the higher plants,
and this relationship normally results in an increase in degradation rates and in the removal
of organic chemicals form the wastewater (Wolverton, 1989). Additionally, this study has
found that the electrical charges associated with aquatic plant root hairs react with
opposite charges on colloidal particles like suspended solids. This causes them to adhere
to the root hair where they are removed from the wastewater and are sorbed into the plant
and microorganisms. Since Equisetum is an aquatic plant with an extensive subsurface
system, it probably fits all of these requirements exceptionally well.

6
Nutrient Uptake
In addition to the advantages Equisetum derives from its subsurface structures, it is
remarkable for its abilities to take up nutrients. In fact, numerous studies have indicated
Equisetum’s superior potential for removing nutrients. One study examined the storage of
C, P, and N in littoral Equisetum stands and found that these stands are effective in the
retention of nutrients and organic matter coming from the land (Sarvala et al., 1982). The
study found that during August, when the Equisetum stands were in the height of their
yearly growth, its C and nutrient stores were almost a hundredfold times those of other
living components of lake Pääjärvi, an oligotrophic and mesohumic lake in southern
Finland. Indeed, during its active growth cycle, Equisetum proved to be a dominant sink
for these three nutrients, and it would doubtless behave in the same way in constructed
wetlands.
Equisetum has also been shown effective as a sink for other elements. A study of
Equisetum arvense near Mount St. Helens has shown that the plant is capable of taking up
considerable amounts of Hg vented from the volcano during and following its May 1980
eruption (Siegel et al., 1984). While this study is concerned primarily with the use of plant
materials as a means of charting Hg levels, Equisetum should not be overlooked as a
possible means of cleansing wastewater of heavy metals.
One of the most thorough studies of Equisetum’s abilities to take up nutrients and
organic matter shows that these plants surpass most of the other plant species currently
used in constructed wetlands (Auclair, 1979). This study compared Equisetum fluviatile
to Typha angustifolia, Phragmites communis, Scirpus fluviatilis, Eleocharis plaustris,
and Scirpus validus and found that the Equisetum had the greatest concentrations of ash,

7
N, P, K, Ca, Mg, Fe, and Mn and also had the highest total concentration of nutrients.
Perhaps most exceptional is Equisetum’s ability to take up Fe, and Auclair calls for further
study of Equisetum for this reason. In fact, Zn was the only nutrient for which Equisetum
did not have the highest concentration.
Conclusions
Due to Equisetum’s exceptional abilities at taking up nutrients and organic matter,
it would appear to be an appropriate and functional plant material to use in a constructed
wetland designed to treat wastewater. Its extensive root system allows a large surface
area for microbial populations and also aids the plant in the removal of NH4-N. Further,
Equisetum has been proven more effective at taking up most nutrients than other plant
species commonly used in constructed wetland systems.
These attributes call for additional study of the use of Equisetum in nutrient
removal from wastewater; however, this plant has other distinct advantages. Unlike other
plants used in constructed wetlands, Equisetum produces limited litter which might fall
back into the wetland and reintroduce nutrients into wastewater that is being cleansed
(Kadlec and Knight, 1996). The plant’s free-standing vertical growth is easy to manage
and tends not to take up space that could be valuable in agricultural or nursery operations.
Equisetum’s lack of sensitivity to herbicides would be a distinct benefit in agricultural or
horticultural uses since the plant will remain relatively unaffected by herbicides used to
control weeds invading crops.
For all of these reasons, Equisetum clearly merits attention as a plant choice in
constructed wetlands.
8
Literature Cited
Agashe, Shripad N. 1995. Paleobotany: plants of the past, their evolution,paleoenvironment and application in exploration of fossil fuels. Oxford & IBH,New Delhi.
Auclair, Allan N. D. 1979. Factors affecting tissue nutrient concentrations in a Scirpus-Equisetum wetland. Ecology. 60: 337-348.
Bastian, Robert K, Peter E. Shanaghan, and Brian P. Thompson. 1989. Use of wetlandsfor municipal wastewater treatment and disposal--regulatory issues and EPApolicies. In Constructed Wetlands for Wastewater Treatment: Municipal,Industrial, and Agricultural.
Donald A. Hammer, ed. Lewis Publishers, Chelsea, MI. 265-278.
Cloutier, Daniel and Alan K. Watson. 1985. Growth and regeneration of field horsetail(Equisetum arvense). Weed Science 33: 358-365.
Hauke, Richard. 1963. A taxonomic monograph of the genus Equisetum subgenusHippochæte. Verlag Von J. Cramer, Weinheim, Germany.
Kadlec, Robert H. and Robert L. Knight. 1996. Treatment wetlands. Lewis Publishers,Boca Raton.
Sarvala, Jouko, Timo Kairesalo, Irma Koskimies, Anja Lehtovaara, Jukka Ruuhijärvi, andInkeri Vähä-Piikkiö. 1982. Carbon, phosphorous and nitrogen budgets of thelittoral Equisetum belt in an oligotrophic lake. Hydrobiologia 86(1/2): 41-53.
Siegel, Barbara, Sanford M. Siegel and Stanya J. Horsky. 1984. Equisetum plants andthe cycling of mercury at Mount St. Helens. Environ. Sci. Technol. 18: 179-181.
Taylor, Thomas N. and Edith L. Taylor. 1993. The biology and evolution of fossil plants.Prentice-Hall, Englewood Cliffs, NJ.
Wolverton, B. C. 1989. Aquatic plant/microbial filters for treating septic tank effluent.In Constructed Wetlands for Wastewater Treatment: Municipal, Industrial, andAgricultural. Donald A. Hammer, ed. Lewis Publishers, Chelsea, MI. 173-178.
Zhu, Tong and F. J. Sikora. 1995. Ammonium and nitrate removal in vegetated andunvegetated gravel bed microcosm wetlands. Wat. Sci. Tech. 32(3): 219-228.

9
Effects of Nitrogen Fertility on Thatch Management for DwarfBermudagrasses
Jason Lee Gray1
Soil and Crop Sciences Department, Texas A&M University, CollegeStation, TX 77843-2747
Additional index words. Overseeding, scalping
Abstract. Dwarf bermudagrass (Cynodon spp.) is the most highly adaptedgrass for use on golf greens in the southern United States. Tifdwarf, andTifgreen have been the industry standard bermudagrasses for the past fourdecades, although some new dwarf bermudagrass varieties are now available.Thatch accumulation on these dwarf grasses is the number one problem forsuperintendents trying to maintain healthy greens. Thatch causes manyproblems that are detrimental to turf quality. Nitrogen rates and sourceshave been shown to significantly influence the rate of thatch accumulation inthese turfs although it is recommended to also control thatch mechanically.
Historical Perspective of Greens Type Bermudagrasses
Grasses with a prostrate growth habit, such as bentgrass and bermudagrass,
maintain a high residual leaf area at close mowing heights, and are the preferred grass
types for putting greens. Bermudagrass, a C4 grass, is the most highly adapted grass for
use on golf greens in the hot, humid regions of the southern United States. Carbohydrate
reserves and root development are not significantly reduced in bermudagrass even at
putting green mowing heights (Duble, 1996). Increased mowing heights make greens type
bermudagrasses stemmy, spindly, and more susceptible to scalping.
__________________________________
1 Graduate assistant. Home address: 1525 East 29th Street Apt.#612 Bryan, TX 77802

10
Bermudagrass (Cynodon spp.) is found in over one hundred countries throughout the
subtropical and tropical areas of the world, including the southern United States.
Common bermudagrass (C. dactylon) was introduced into this country during the colonial
period from Africa or India (Duble, 1996). Bermudagrass is a sod forming perennial that
spreads by stolons, rhizomes, and seed. Common bermudagrass became very popular as a
golf turf in the south. It grows on a variety of soils, both acid and alkaline, and is tolerant
to high salinity.
Natural hybrids between C. dactylon and C. transvaalensis, and crosses resulting
from grass breeding programs have been released by state universities, the Crop Research
Division of the USDA, and the U.S. Golf Association Green Section. All of the hybrid
bermudagrasses are sterile or have variable offspring and must be propagated by sprigs or
sod. Much work has been done in developing bermudagrass as a greens type grass able to
withstand the ever growing pressure of the golfing public. Past breeding and selection
introduced many improved varieties able to withstand lower mowing heights and more
traffic. Some of the earliest selections came from Africa in the 1930s. These varieties,
Uganda, Royal Cape and Hall’s selection were improved from common bermudagrass
with less seed head production and slower growth habit.
In the US, a variety known as Bayshore was selected from a golf course in Miami
in the 1950s (Duble, 1996). It was a very popular natural hybrid that was later replaced
on golf greens in the 60s by the superior variety Tifgreen. Tifgreen, released in 1956 by
Georgia AES, was a tremendous advancement for the golf industry. It was a natural
hybrid that maintained high density at the 6.35mm mowing heights common to that time.
This low growing, rapid spreading variety quickly became the most popular choice for

11
southern golf greens. Nine years after Tifgreen, Tifdwarf was released from the Georgia
AES. Tifdwarf is a vegetative mutant that occurred from Tifgreen, and resembles
Tifgreen except that its leaves and internodes are significantly shorter, and is darker green.
The dwarf growth characteristics of Tifdwarf gave it superior putting quality on greens as
mowing heights were lowered to 4.76mm.
New Dwarf Bermudagrasses
Over the past three to four decades, the only bermudagrass varieties specifically
adapted for use on golf greens in the southern US were Tifgreen and Tifdwarf. Both
require daily mowing at heights of 4.76mm or less and N requirements of 1980 to 2970 kg
N ha-1 month-1 during the growing season. These hybrid bermudagrasses require
cultivation practices such as vertical mowing, aerification, and topdressing to maintain
high quality putting turf and control thatch buildup. Increased demand for dwarf
bermudagrasses with “bentgrass” putting characteristics, off-type occurrence in Tifdwarf,
and the potential disastrous results that could arise from dependence on a single variety
have accelerated interest in development of new bermudagrasses for golf greens. The
industry has responded in the 90s with a wave of new bermudagrass cultivars with dwarf
characteristics. Researchers are studying several of these new dwarf hybrids that spread
vigorously and have little vertical leaf growth. Some of the cultivars, Champion and
Floradwarf, are already commercially available and in place on many southern greens. A
few others, MS Supreme, TW-72, and Mini-Verde, will be commercially available before
the end of the century. Southern superintendents who struggle to maintain healthy greens
at 4.76mm may find these new grasses to be the answer. Breeders and growers of these
new cultivars have made claims about the superior performance of their varieties as

12
compared to Tifdwarf, but little has been done to prove these claims. These new grasses
may require distinctly different management practices and fertilizer programs than
Tifdwarf.
Performance of several of these varieties is well established based on replicated
trials at many locations. However, some have limited testing in replicated performance
trials. Much less information exists on the management requirements of these new dwarf
bermudagrasses. For example, many superintendents report greater difficulty in fall and
spring overseeding transition with some of the new dwarf bermudagrass greens.
Questions also exist about the best approach to manage thatch development in these
grasses. Many of these grasses will likely be planted to greens in Spring 1998 as part of a
cooperative program between the United States Golf Association, The National Turfgrass
Evaluation Program, and the Golf Course Superintendents Association of America.
However, this On-site Testing Program will most likely not be able to accommodate
sufficient variation in cultural variables at one location to provide sufficient information on
which to base cultural recommendations. There is an extremely strong need for
information on the cultural requirements of many of the new dwarf bermudagrasses.
Thatch Management
Thatch management has probably been the biggest concern for superintendents in
the management of bermudagrass golf greens. Increased thatch levels bring about
problems such as poor soil air exchange, water infiltration, and nutrient use (Ferguson,
1964; Hanson and Juska, 1969; Madison, 1971; Thompson and Ward, 1966). This leads
to problems of sponginess of turf, development of shallow root systems, uneven mowing

13
(scalping), increased disease incidence, increased insect damage, and reduced drought,
cold, and wear tolerance (Duble, 1996).
Thatch is defined as “the tightly intermingled layer of living and dead stems, leaves
and stolons that develops between the green vegetation and the soil surface” (Thompson
and Ward, 1966). There is also a layer under the thatch that is commonly called the mat
layer. It is defined as “the intermingled layer of living and dead stems, leaves, stolons, and
mineral soil that develops directly below thatch” (Thompson and Ward, 1966). Thatch
and mat form chiefly from the periodically sloughed off (senesced) roots, horizontal stems
(stolons and rhizomes), stubble, mature leaf sheaths, and blades (Ledeboer and Skogley,
1967). The mat layer is more desirable in turf because of the increased microbial activity
in the soil medium.
Several factors contribute to thatch accumulation. These include: varieties with
increased vigor (more stems, roots, rhizomes), low pH in thatch layer, and high N
(Ferguson, 1964; Hanson and Juska, 1969). Thatch accumulation is directly related to its
decomposition rate, and thatch buildup in sod occurs only when production of plant
material exceeds decomposition (Smith, 1969). Decomposition is a metabolic activity
carried out by soil microbial populations. Rate of added material decay depends mainly
upon soil environment, type of organisms involved, and chemical composition of added
organic material (Hutchings and Martin, 1934). Proteins and carbohydrates decompose
more rapidly than do hemicellulose and cellulose, and lignins are very resistant to
decomposition (Ledeboer and Skogley, 1969; Ledeboer and Skogley, 1973). Duble and
Menn (1972) reported that lignin/cellulose ratio is less than 0.25 in bermudagrass shoots
and greater than 2.0 in the thatch. The constituents of thatch that are harder to

14
decompose are the plant stems, roots, rhizomes and stolons as opposed to the leaf sheaths
and blades (Ledeboer and Skogley, 1969). Increased N leads to a higher lignin/cellulose
ratio in bermudagrass, which leads to increased tissue production and decreased levels of
decomposition (Meinhold et al., 1973). The increased fertility also leads to increased rates
of senescence and replacement, which adds to the thatch layer (Riley, 1975). Increased
stress of plants in a golf green situation caused by close and frequent mowing also leads to
an increase in the sloughing off of leaf sheaths, stems, and root parts (Madison, 1962).
On sand based soils, there is also a high need for K and P fertilization. Potassium
is important because of its contribution to root growth, environmental stress tolerance
(heat, cold, and drought), wear tolerance and reducing the turf’s susceptibility to leaf spot
diseases (Duble, 1996). Pest problems in bermudagrass are widespread and increase with
increasing levels of management (Duble, 1996). High N, close mowing and frequent
irrigation increases the susceptibility of bermudagrass to insects and diseases. Nitrogen
rates and thatch levels are controlling factors in the severity of brown patch and dollar
spot diseases.
Fertilizer type and rate affects rates of thatch accumulation. Turfgrasses grown on
sandy soils in the southern United States require large quantities of N fertilizers (1980 to
2970 kg N ha-1 month-1) to remain a desirable dark green color. N is applied as a soluble,
slow release organic, or natural organic compound. Slow or controlled release N sources
are generally more expensive than soluble inorganic N sources like (NH4)2SO4. Oxidation
of the NH4+ in (NH4)2SO4 acidifies the soil, but NO3
- is more leaching prone. According
to Tisdale and Nelson (1975), increased acidity tends to slow the nitrification process.
Acidifying the soil has been shown to increase thatch buildup due to slowing the microbial

15
breakdown of the thatch. Adding CaSO4 to an acid soil counteracts some detrimental
effects, and reduces thatch accumulation.
Another factor that directly affects thatch accumulation is the activity of soil
microorganisms. Soil microorganism activity is influenced by many soil conditions such as
soil temperature, pH, moisture, and aeration. Microbial populations are most active in
aerated soil environments of near neutral pH, with adequate moisture, and temperatures
between 60-80oF. Microorganisms are most active where organic matter is the highest as
they depend on it for food (Starkey, 1954). Maintaining an adequate environment for soil
microbial decomposition is an important tool in managing thatch accumulation. Sartain
(1978), reported that increased acidity promoted thatch accumulation by decreasing
microbial activity.
Sartain tested acidity and N source on thatch accumulation. He had treatments of
1) isobutylidene diurea (IBDU), a slowly soluble synthetic organic N fertilizer whose rate
of N release depends on soil moisture, 2) (NH4)2SO4, and 3) activated sewage sludge.
Sartain (1978) reported that IBDU (31-0-0) consistently promoted the lowest level of
thatch accumulation as compared with the N-sources Sewage Sludge (6-0.9-0) and
(NH4)2SO4 (21-0-0) applied at equal annual N totals. In general, turfgrass growth rates in
response to applied sewage sludge were inferior to the synthetic organic slow-release N-
sources. Application of activated sewage sludge resulted in 14% more thatch
accumulation than NH4NO3 (White and Dickens, 1982).
Meinhold et al. (1973) reported that increasing N fertilization increases the lignin
cellulose ratio, which leads to lower carbon evolution from microbial activity. The thatch
became harder to break down with the increased lignin content. Rate and source of N

16
have pronounced effects on bermudagrass thatch accumulation (Smith, 1970). Similar to
Sartain’s findings, Smith found that using (NH4)2SO4 reduced pH, and reduced Ca and K
concentrations in the soil, which led to decreased microbial breakdown of thatch as
compared to other sources (Smith, 1970). Using (NH4)2SO4 increased thatch by as much
as 14% (Riley, 1975).
Although N fertility is very important in controlling thatch buildup in turf, research
has shown that topdressing and mechanically removing thatch by vertical mowing and
aerification is more effective in decreasing thatch and increasing the mat layer. White and
Dickens (1982) reported that 4 topdressings per year reduced thatch accumulation more
than 1, and increased mat depth, while not affecting turf quality. Thompson and Ward
(1966) also reported that topdressing with soil was the most effective way to reduce
thatch in Tifgreen bermudagrass. Vertical mowing effectively reduced thatch in Kentucky
bluegrass and bermudagrass (Murray and Juska, 1977; Johnson, 1979). Carrow et
al.(1987) showed that sand topdressing reduced thatch by as much as 62%.
Removing thatch mechanically from golf greens by vertical mowing and
aerification retards buildup of excessive thatch or removes it after it has accumulated to a
detrimental level (Duble,1996). Riley (1975) reported a linear relationship between
vertical mowing and thatch depth while not affecting turf quality on Tifgreen and
Tifdwarf. Core aerification helps in maintaining an adequate environment for soil
microorganisms. Smith (1979) reported that increasing aerification from twice yearly to
monthly slightly decreased thatch thickness. Bi-weekly light vertical mowing and core
aerification could decrease thatch by up to 25% (McWhirter and Ward, 1976; Carrow et
al., 1987; Weston and Dunn, 1985).
17
Conclusion
Mowing dwarf bermudagrasses at today’s golf green heights increases stress on
the plants, which leads to higher levels of thatch. This leads to other management
problems. Thatch needs to be controlled in order to maintain healthy greens. The new
bermudagrasses that grow more vigorously may have even more problems with thatch
buildup. Although mechanical thatch reduction is the best way to control thatch, N
fertility can also be an important tool in preventing thatch buildup.
Research has shown that use of activated sewage sludge as an N-source is
detrimental to dwarf bermudagrass by causing significant thatch increase. (NH4)2SO4 and
fertilizers that decrease pH reduce microbial thatch breakdown and high rates of N from
any source lead to higher replacement and senescence that increases the thatch layer. It is
very important to continue to investigate the problems that thatch causes and how it can
be best controlled.
Literature Cited
1. Carrow, R.N., B.J. Johnson, and R.E. Burns. 1987. Thatch and quality of Tifwaybermudagrass in relation to fertility and cultivation. Agron. J. 79:524-530
2. Duble, R.L. and W.G. Menn. 1972. Thatch accumulation in relation to lignin/ celluloseratio in bermudagrass. Agron. Abstr. 64:62.
3. Duble, R.L. 1996. Turfgrasses, Their Management and Use in the Southern States.Texas A&M University Press, College Station, TX. 323p.
4. Ferguson, M.H. 1964. Mat and thatch – cause, effect, and remedy. USGA GreenSection Record. 1(5):10-13.
5. Hanson, A.A. and F.V. Juska. 1969. Turfgrass Management. Van Nostrand ReinholdCo., New York. 715 p.
6. Hutchings, I.J. and T.L. Martin. 1934. Influence of the carbon-nitrogen ratios of organic matter on rate of decomposition in the soil. Agron. J. 26:333-341.

18
7. Ledeboer, F.B. and C.R. Skogley. 1967. Investigations into the nature of thatch and
methods for its decomposition. Agron. J. 39:320-323. 8. Ledeboer, F.B. and C.R. Skogley. 1973. Effects of various nitrogen sources, timing,
and rates on quality and growth rate of cool-season turfgrasses. Agron. J. 65:243-246.
9. Madison, J.H. 1971. Practical Turfgrass Management. Van Nostrand Reinhold Co., New York. 420p.
10. McWhirter, E.L. and C.Y. Ward. 1976. Effect of vertical mowing and aerification on
golf green quality. Mississippi Agric. For. Exp. Stn. Res. Rep. 2(12).
11. Meinhold, V.H., R.L. Duble, R.W. Weaver, and E.C. Holt. 1973. Thatchaccumulation in bermudagrass turf in relation to management. Agron. J. 65:833-835.
12. Murray, J.J. and F.V. Juska. 1977. Effect of management practices on thatchaccumulation, turf quality, and leaf spot damage in common Kentucky bluegrass.Agron. J. 69:365-369.
13. Riley, F.B. 1975. Management Practices in Relation to Thatch Accumulation in aBermudagrass (Cynodon spp.) Putting Green. M.S. Thesis, Texas A&M University.
14. Sartain, J.B. 1985. Effects of acidity and N source on the growth and thatch accumulation of Tifgreen bermudagrass and on soil nutrient retention. Agron. J. 77:33-36.
15. Smith, G.S. 1969. Thatch – causes, problems, and control. Florida Turf. 4:5-6.
16. Smith, G.S. 1970. Effects or aerification frequencies and nitrogen sources onTifdwarf bermudagrass. Proc. Fla. Turfgrass Mgmt. Conf. 18:96-98.
17. Smith, G.S. 1979. Nitrogen and aerification influence on putting green thatch andsoil. Agron. J. 71:680-684.
18. Starkey, R.L. 1954. Soil Microorganisms – The Dynamic Phase of the Soil. GolfCourse Reptr. 23:14-15
19. Tisdale, S.L. and W.L. Nelson. 1975. Soil Fertility and Fertilizers. MacmillanPublishing Co., New York.
20. Thompson, W.R. and C.Y. Ward. 1966. Prevent thatch accumulation on Tifgreenbermudagrass greens. Golf Course Mgmt. 34:20-38.
21. Weston, J.B. and J.H. Dunn. 1985. Thatch and quality of Meyer zoysia in response to

19
mechanical cultivation and nitrogen fertilization. p. 449-458. In F. Lemaire (ed.)Proc.5th Int. Turfgrass Res. Conf., Avignon, France. 1-5 July 1985. Institut Nationalde la Recherde Agronomique, Paris, France.
22. White, R.H. and R. Dickens. 1984. Thatch accumulation in bermudagrass asinfluenced by cultural practices. Agron. J. 76:19-22.

20
Can Plants Be Used to Clean Up Soils Contaminated WithHeavy Metals?
Mary R. Suplick3
Department of Agricultural Sciences, Texas A&M University – Commerce, Commerce,TX 75249
Additional index words. phytoremediation, phytoextraction, metallophytes, accumulators,excluders.
Abstract. Metallophytes are plants that can accumulate unusually high levels oftoxic heavy metals. Their potential use in phytoextraction, the use of greenplants to remove and contain an environmental contaminant, is beinginvestigated. Three types of metallophyte species exist on metalliferous soils.Accumulators allow the unrestricted uptake and transport of metals to theirbiomass. Indicators regulate both uptake and translocation maintaining plantconcentrations equal to those of the soil. Excluders maintain low biomassconcentrations by way of an excluding mechanism in the roots that restrictstranslocation. Tolerant and non-tolerant races of the same plant species exist.Phytoextraction is emerging as a more economical and ecologically soundmethod of soil remediation than traditional methods.
The ability of some plant species to colonize metalliferous soils has long been
recognized, and such species have been used as geobotanical indicators in surface mineral
exploration (Brooks, 1972). Termed metallophytes, these plants can accumulate unusually
high levels of toxic metals such as Cd, Cu, Mn, Pb and Zn. Metal-rich mine tailings, metal
smelting, electroplating, ore refining, and municipal sludge dumping are some of the most
important human activities that contaminate soils with large quantities of heavy metals.
Of the approximately one-thousand contaminated Superfund sites identified on the
United States Environmental Protection Agency’s National Priority list of 1986, 40% of
them involve heavy metal contamination associated with industrial activities and 70% of
those sites involve two or more metals (Ebbs, 1997). The most commonly used methods

21
of dealing with heavy metal pollution are either the removal and burial of the contaminated
soil, an extremely expensive process, or simply isolation of the site (Kumar, 1995).
Phytoextraction, the use of green plants to remove and contain an environmental
contaminant, is currently under investigation as a third alternative. This process generally
requires the plant to translocate heavy metals to the easily harvestable shoots, thereby
reducing the volume of contaminated material, which can then either be isolated as a
hazardous waste or ashed and recycled as metal ore. Thus, plants that can
hyperaccumulate particular heavy metals, while producing high biomass yields under
standard agricultural practices, would be desirable for such operations (Kumar, 1995).
Metal Uptake by Different Species
Flora population studies on contaminated soils have shown the development of
constant relationships between particular plant species and calamine (Zn) soils in western
and central Europe, serpentine soils (Ni, Cr), and soils of the copperbelt (Cu) in central
Africa. Some species are found only on metalliferous soils while others occur
simultaneously on uncontaminated soils in the same region. This indicates the evolution of
adapted metal tolerant races. The presence of a species or population on a metal
contaminated soil implies that it has elevated levels of metal toxicity and that it has
adapted its physiology. (Baker, 1981).
True metallophytes are plant species that can hyperaccumulate heavy metals in
their biomass to a concentration > 1% on a dry matter basis. Metallophyte species vary in
their abilities to accumulate metals, and for a given species these abilities may vary as well
3 Graduate assistant-Research. Texas A&M University System Agricultural ExperimentStation-Dallas: 17360 Coit Rd., Dallas, TX 75252

22
with respect to different metals (Baker and Brooks, 1989). Some plant species exhibit the
capability to accumulate high levels of several different metals while others are restricted
to one or two metal species (Fig. 1).
1. Thlaspi alpestre 2. Minuartia vera 3. America maritima 4. Silene vulgaris 5. Lotuscorniculatus 6. Festuca ovina
Fig. 1. Concentrations of Zn, Pb, Cu, and Cd in the leaf dry matter of sixplant species growing on metalliferous soil in Germany (Ernst, 1975).
Thlaspi alpestre (alpine pennycress) was found to have accumulated Zn at a
concentration above 10,000 µg/g in its leaves, 25 times the toxcicity level for that of
agronomic crops of 400 µg/g. Minuartia verna (vernal switchwort) accumulated Cu
concentrations up to 120µg/g, 6 times the toxic level of 20µg/g (Ernst, 1975). The ability
of any plant to take up and store Pb and Cd is astounding since these two metals are not
essential mineral nutrients.
Physiological Strategies of Plants to Metalliferous Soils
It has been asserted that plants growing on toxic metalliferous soils cannot prevent
metal uptake but only restrict it and thus accumulate metals in their tissues to varying
degrees (Peterson, 1975). Adopting this approach makes their strategy for survival one of
tolerance to heavy metals and not avoidance.
Zinc
0
2500
5000
7500
10000
12500
1 2 3 4 5 6
soil [Z] = µg/g
plan
t [Z
n] =
µg/
g
Lead
0
500
1000
1500
2000
2500
1 2 3 4 5 6
soil [Pb] = 20000 µg/g
plan
t [P
b] =
µg/
gCopper
0
25
50
75
100
125
1 2 3 4 5 6
soil [Cu] = 88 µg/g
plan
t [C
u] =
µg/
g
Cadmium
0
100
200
300
400
500
1 2 3 4 5 6
soil [Cd] = 1750 µg/g
plan
t [C
d] =
µg/
g

23
Based on this and other data it has been proposed (Baker, 1981) that three types
of plants exist on metalliferous soils based upon their individual physiological responses:
accumulators, indicators, and excluders. Accumulator species are so named because of
their ability to maintain high concentrations of heavy metals in their biomass. Whether
growing on soils of low or high metal concentration, root uptake and translocation are
completely unrestricted. Indicator species regulate both the uptake and the translocation
of metals to the biomass. An increase in soil concentration would be directly reflected in
an increase in biomass concentration. Excluder species maintain biomass concentrations
at a low and constant level and an excluding mechanism in the roots prevents translocation
despite a high soil and root concentration. However, this excluding mechanism is effective
only up to a critical soil value, individual to each species, above which the excluding
mechanism breaks down and the unrestricted transport results in toxicity (Fig. 2).
Fig. 2. Three physiological responses of plants to increasing soil metal concentrations as
reflected in biomass metal concentrations (Baker, 1981).
Tolerant and non-tolerant races of the same species are grown together in a metal-
rich medium to establish the relationship between uptake and transport characteristics in
Excluder
[soil]
[pla
nt]
Accumulator
[soil]
[pla
nt]
Indicator
[soil]
[pla
nt]
24
excluder species. Silene maritima, a known Pb tolerant species and suspected excluder,
was grown on a Pb rich slag. Tissue analysis of the shoots confirmed that the tolerant
race was able to restrict transport of Pb from the roots to the shoots, thus avoiding
toxicity, while the non-tolerant race was not, resulting in plant death. At the time of plant
death the shoot of the non-tolerant race contained greater than 400 µg/g DM, while
comparatively, the shoot of tolerant race contained less than 100 µg/g DM (Baker, 1978).
Metal tolerance is not simply just a genetic trait or predisposition of some plant
species, but rather a condition of edaphic evolution and adaptation. Some species, or races
within a species, simply lack the genetic capability to adapt their physiology. Baker (1981)
asserts that this is evidenced by the knowledge that in both accumulator and excluder
species internal mechanisms have been developed to actively detoxify metal ions, but in
separate sites in the plant. In accumulator species the site of detoxification is in the shoots
while excluders detoxify metals in the roots.
External mechanisms may also play an active role in the plants ability to avoid
toxicity. Because accumulator species concentrate heavy metals in the aerial portion of
the plant, over-wintering, frequent brush fires, or other natural means of defoliation may
assist in detoxifying the storage sites by simply removing the sites of ever increasing
toxicity (Blake, 1981). Certain excluder species have been observed to store high levels of
Zn in the roots through the spring and summer, only to quickly translocate the metal to the
biomass in the fall in anticipation of defoliation (Rascio, 1977).
Conclusion
As the United States, and other heavily industrialized countries of the world,
continue in their efforts to clean up toxic heavy metal soil contamination there remains a

25
diligent search for any new technology that would make such efforts less expensive and
more ecologically sound. Removing contaminated soil from 1 ha to a depth of 7 cm
creates nearly 4539 metric tons of soil that must be washed or buried. In contrast, a
contaminated site populated by metallophytes, whose biomass was harvested and
incinerated, would produce approximately 25 to 30 tons of ash (Kumar, 1995).
Previous research efforts toward realizing the goal of phytoremediation were
concentrated simply on locating, identifying, and quantifying which plant species were
capable of heavy metal hyperaccumulation, which metals they would accumulate, and how
much they would accumulate. Current research has become primarily focused on
genetically altering plants, of known high biomass yields and wide environmental
adaptation, by introducing the gene for the protein metallothionein which is a chelator
known to detoxify certain metals in some plants.
Literature Cited
Baker, A. J. M. 1978. Ecophysiological aspects of zinc tolerance in Silene maritima.New Phytol. 80:635-642.
Baker, A. J. M. 1981. Accumulators and excluders – strategies in the response of plantsto heavy metals. J. Plant Nutr. 3:643-654.
Baker, A. J. M. and R. R. Brooks. 1989. Terrestrial higher plants which hyperaccumulatemetallic elements – a review of their distribution, ecology, and phytochemistry.Biorecov. 1:81-126.
Black, Harvey. 1995. Absorbing possibilities: phytoremediation. Environ. HealthPerspect. 103(12):110-116.
Brooks, R. R. 1972. Geobotany and biogeochemistry in mineral exploration. Harper &Row, London & New York.
Ebbs, Stephen D, and Leon V. Kochian. 1997. Toxicity of zinc and copper to Brassicaspecies: implications for phytoremediation. J. Environ. Qual. 26:776-781.

26
Ernst, W. H. O. 1975. Physiology of heavy metal resistance in plants. Proc. Int. Conf.On Heavy Metals in the Environment. 2:121-136.
Kumar, P. B. A. Nanda, Viatcheslav Dushenkov, Harry Motto, and Ilya Raskin. 1995.Phytoextraction: the use of plants to remove heavy metals from soils. Environ. Sci.Technol. 29:1232-1238.
Peterson, P. J. 1975. Element accumulation by plants and their tolerance of toxic mineralsoils. Proc. Int. Conf. On Heavy Metals in the Environment. 2:39-54. Toronto,Canada.
Rascio, N. 1977. Metal accumulation by some plants growing on zinc mine deposits.Oikos. 29:250-253.
Turner, R. G. 1970. The subcellular distribution of zinc and copper within the roots ofmetal-tolerant clones of Agrostis tenuis. New Phytol. 70:539-545.
Vazquez, J. Barcelo, Ch. Poschenrieder, J. Madico, P. Hattan, A. J. M. Baker, and G. H.Cope. 1992. Localization of zinc and cadmium in Thlaspi caerulescens(Brassicaceae), a metallophyte that can hyperaccumulate both metals. J. PlantPhysiol. 140:350-355.

27
Compilation of Factors Influencing Flowering in Hibiscusrosa-sinensis Including Causes and Prevention of BudAbscission
Christopher Neil FreemanDepartment of Horticultural Science, Texas A&M University College Station, TX 77843, USA
Additional Index Words: bloom, blossom, drop, illumination, nutrition.
Abstract. An examination of contemporary literature reveals a variety offactors affecting the number, size and quality of flowers on Hibiscus rosa-sinensis L. including light intensity, fertilizer rate, fertilizer source,temperature, and watering regimen. The study reveals the causes of budabscission: ethylene gas, dark storage, temperature, fertilizer concentration,and water stress plus prevention of bud abscission utilizing Silver Thiosulfateand auxins.
Hibiscus rosa-sinensis L. is a popular patio and bedding plant (northern climates)
known for large, colorful blossoms. Successful marketing of this tropical plant depends
on growing techniques that assure prolific quantities of blooms. Several factors affect the
quantity, size and number of blooms, including: lighting, fertilizer type and amount,
temperature, and watering. Stress levels in any of these areas can have a detrimental
effect on the flowering of this plant, but optimum conditions assure dramatic success.
Illumination amount and intensity has a proportional effect on flowering initiation,
flower size, and quantity (Neumaier, et al., 1987). The plants perform best in full sun,
although different cultivars have specific preferences (Beers and Howie, 1985). Full sun
decreased the number of days to flowering (33 vs. 42); increased the average number of
total buds per plant (134 vs. 111); enhanced the number of flowers per plant (92 vs. 75)
but decreased flower diameter (117 mm vs. 124.4 mm) when compared with 50% shade
(Neumaier, et al., 1987).

28
Fertilizer regimen plays a crucial role in flowering. Proper elemental concentration
ratios are just as important as adequate fertilization levels. Improper elemental balance
can have a detrimental effect on flowering as is the case with an overabundance of N.
Nitrogen has a detrimental effect on buds when applied in excessive quantities because it
produces leafy soft-stemmed growth at the expense of flowers. This is particularly
noticeable in species that flower only on woody plant material (Beers and Howie, 1985).
A study of controlled released fertilizer (crf) concluded that an application of ~200-300
ppm of 12 g Osmocote provided the greatest number of buds per plant (>140) while the
number of buds per plant greatly diminished with Osmocote applications of 9 g and 12 g
at levels greater than 300 ppm. Utilizing 3 g and 6 g Osmocote did not cause fewer buds
to develop. The overall number of blooms was fewer at all concentration levels, but bud
number per plant did not decrease at applications greater than 400 ppm (Neumaier, et al.,
1987).
Potassium is crucial for flowering of Hibiscus. Successful growers have concluded
that K, when present in amounts greater than N (1part N:3 parts K) has a beneficial effect
on flower quality, quantity, color, and appearance. These growers have found that it is
best to fertilize frequently and in small amounts (Beers and Howie, 1985). The trials of
growers have been reinforced by scientific research. This research helps explain the
reasons why proper K levels have such a beneficial effect. While increased levels of
potassium in solution had a somewhat limiting effect on macroelemental concentrations in
leaf tissue (N, P, and Ca), it had a beneficial effect on leaf micronutrient concentration.
Iron, Mn, Zn, and Mo levels were all significantly increased with enhanced K fertilization
levels (Egilla and Davies, 1995). Thus, proper macroelemental ratios can have a beneficial

29
effect on micronutrient uptake, which can serve to enhance metabolic processes of the
plant, leading to a higher quality crop.
While proper nutrition is important in promoting a strong flowering response,
cultural practices are vital to assure that these flowers remain on the plant. Bud abscission
is an obstacle in the production of this plant. Since the aesthetic quality correlates with
market value of this crop, bud abscission prevention is crucial. There are numerous causes
of bud drop, all related to stress. Any one or a combination of the following factors:
water stress, improper illumination, inadequate fertilizing, and ethylene gas all can cause
Hibiscus to jettison buds (Beers and Howie, 1985).
Storage conditions of this crop are responsible for the quality of plants at time of
sale. Three main factors affect the loss of buds during storage and transport: darkness,
temperature and ethylene buildup. To maximize crop value, it is crucial to provide proper
conditions for the plant during this time of stress.
A number of studies have been conducted to determine the effect of storage
condition on bud abscission in hibiscus. One study concluded that a storage temperature
of 15.5° C will maximize the flower diameter and number of flowers per plant while
minimizing the number of abscised buds. The same study concluded that the shortest
duration of storage is best as light exclusion time is minimized (Gibbs, et al., 1989). A
different study found somewhat different optimum storage temperatures, concluding that
10° C minimized bud abscission, while higher temperatures actually increased this effect
(Thaxton, 1986). While light levels during storage affected bud abscission, pre-storage
lighting also affected the amount of bud drop during storage. Another study determined
that predark storage irradiance of 980 µmol·s -1·m-1 resulted in 58.6% abscission after

30
subsequent storage while predark storage irradiance of 500 µmol·s -1·m-1 resulted in a
78.3% abscission, a significant increase (Force, et al., 1988).
While there is some concurrence in the literature regarding the correlation among
illumination, temperature, and bud drop; there are discrepancies regarding the size of buds
most likely to abscise. One such study concluded that the most mature buds abscised in
significantly less time than less developed buds (Thaxton, 1986). However, another study
found that dark storage abscission was greatest for buds of 10-30 mm (61.8%), followed
by buds less than 10 mm (36.2%) with buds greater than 30 mm having significantly less
amount of abscission during dark storage (2.7%); suggesting that the more developed
buds are least likely to abscise. The authors of this study hypothesize that this is due to
the fact that there is a decrease in the amount of photosynthates available to the
developing flower combined with a reduction in the ability of the flower bud to compete
for available assimilates (Force, et al., 1988). Another study suggests a physiological
basis for this occurrence. The plant abscises less developed buds due to the fact that they
have not developed structures suitable for reproductive purposes (Gilliland, et al., 1976).
While the different results of some studies could be interpreted as errant research, it is
more plausible that researchers did observe different results due to the influence of other
variables than the ones being specifically studied. This provides an area for further study
to determine environments that favor undeveloped bud abscission and environments
favoring mature bud drop.
While it is important to understand the causes of bud abscission, from a practical
standpoint it is valuable to determine possible methods of preventing this occurrence.

31
There are two areas that growers can manipulate to enhance bud retention: cultural
practices and chemical enhancement.
The most cost effective prevention for bud drop are cultural practices. One study
determined that the increased flower bud abscission during dark storage is due to the
decreased supply of photosynthates to the developing buds. These researchers suggest
that bud drop can be minimized by attempting to increase plants’ assimilate reserve by
high irradiance or to reduce the sink demand by partial bud removal. The main expense in
these practices is labor.
Other studies have examined chemical methods of abscission prevention.
Specifically the use of auxins and silver thiosulfate may be utilized in this effort.
The abscission zone creation is facilitated by an increase in membrane
permeability, caused specifically by ethylene and abcscisic acid. The hypothesis is that
acid phosphatase is synthesized and released in a manner similar to other hydrolytic
enzymes, its activity is accelerated and enhanced by abscisic acid. Phosphatase is a
membrane responsible for cell wall degradation. However, auxins maintain the integrity of
cell membranes by maintaining integrity of dictyosomal vesicles and thus the integrity of
the plasma membrane (Gilliland, et al., 1976). This provides another area for further
study: a determination if increasing auxin concentration prevents bud abscission.
One area where significant research has been conducted on chemical control and
prevention of bud drop is in application of silver Thiosulfate (SSTs). One such study
determined that application of SSTs prior to ethylene or high temperature (common in
Texas) exposure resulted in a decrease in bud abscission rates when compared with plants
sprayed only with water. The results are quite significant. In this study both treated and

32
untreated plants were exposed to 1 ppm ethylene for 48 hours. The untreated plants (0
mM SSTs) had 87.07 ± 15.8% bud abscission 0 days after ethylene exposure and 100.00 ±
0.0% bud abscission 10 days after exposure. In contrast, plants treated with 4 mM SSTs
had only 1.16 ± 2.0% abscission 0 days after exposure to ethylene, 8.09 ± 7.5% drop at 10
days and 10.98 ± 9.6% abscission 20 days after exposure. The same study examined
temperature effects at 10, 20 and 30° C. Since 30° C had the most significant effect on
abscission, these results are noted here. The study found that a treatment of 0 mM had
bud abscission rates of 14.29 ± 10.9%, 97.14 ± 3.2% and 97.14 ± 3.2% at days 0, 10 and
20, respectively. The treatment of 4mM SSTs resulted in bud abscission rates of 0.00 ±
0.00%, 5.26 ± 3.9% and 5.26 ± 3.9% at days 0, 20 and 20, respectively (Thaxton, 1986).
This demonstrates a significant decrease in the amount of bud drop from ethylene
exposure in crops treated with sodium thiosulfate. These results are confirmed by a
similar study evaluating the effects of SSTs application and bud abscission induced by
ethylene, and darkness. This study further concluded that SSTs is not a
phytotoxicological agent (Hoyer, 1986).
Conclusions
Practices that growers can engage in to maximize the market value of Hibiscus rosa-
sinensis are: proper lighting, proper fertilizer type and amount, optimum temperature, and
watering. In addition, there are cultural practices and chemical applications that can
minimize bud loss due to transportation and storage stress which can be utilized to
preserve a good crop. There is still more research that should be conducted to really
determine bud sizes that are most likely to abscise, and under which condition. This
determination will assist the grower in knowing what maturity level of buds is best for

33
transport, providing maximum aesthetic value of Hibiscus crops when they reach the point
of sale.
LITERATURE CITED
1. Beers, L. and J. Howie 1985. Growing hibiscus. Kangaroo Press, Kenthurst, 1985. pp. 16-22 and 78-83.
2. Egilla, J.N. and F.T. Davies Jr. 1995. Response of Hibiscus rosa-sinensis L. to varying levels of potassium fertilization: growth, gas exchange and mineral element concentration. Journal of Plant Nutrition, 18:1765-1783.
3. Force, A.R., K.A. Lawton, and W.R. Woodson 1988. Dark-induced abscission of hibiscus flower buds. HortScience 23:592-593.
4. Gibbs, M.M., T.M . Blessington, J.A. Price, and Y. Wang 1989. Dark-storage temperature and duration influences flowering and quality retention of hibiscus. HortScience 24:646-647.
5. Gilliland, M.G., C.H. Bornman, and F.T. Addicott, 1976. Ultrastructure and acid phosphatase in pedicel abscission of hibiscus. American Journal of Botany 63:925-935.
6. Hoyer, L. 1986. Silver thiosulfate can to some extent prevent leaf, bud and flower drop in Hibiscus rosa-sinensis caused by ethylene and darkness. Acta-Horticultur Wageningen: International Society for Horticultural Science 181:147-153.
7. Neumaier, E.E., T.M. Blessington, and J.A. Price 1987. Effect of light and fertilizer rate and source on flowering, growth, and quality of hibiscus. HortScience 22:902-904.
8. Thaxton, D.R. 1986. Determination of factors involved in Hibiscus rosa-sinensis L.. Bud abscission. Texas A&M University Master of Science Thesis.

34
The Use of VAM in Phosphorous Deficient Soils
E. KonowDepartment of Horticultural Sciences, Texas A&M University, College Station, Texas77843
Additional index word: mycorrhiza, plant nutrition, Vesicular-arbuscular mycorrhizas,Enodmycorrhiza, fungi.
Abstract. Low Phosphorous is a growth-limiting problem associated withmany agricultural soils. Discovering ways in which to increase P nutrition inplants, with minimal additions of fertilizer, is essential for crop production onsuch soils. Mycorrhizal associations can increase the uptake of P in areas inwhich available soil P is limited. Particular attention to compatibility of hostplants and fungi can allow for maximum enhancement of phosphorousuptake. Factors, such as add P fertilizer, native mycorrhizal species and soiltillage practices, can influence the establishment of mycorrhizal colonization.
Plants must obtain from their environment the mineral nutrients, which are the
fundamental materials required for all of the complex biochemical reactions necessary to
cell life and thus plant growth. Much of the evolution of plants has involved the
development of techniques for acquisitioning these building blocks. The benefits of adding
these nutrients to the soil to maximize plant growth have been known for thousands of
years. Much of the scientific research concerned with plants has incorporated some
aspect of plant nutrition. Agricultural and Horticultural research on crop plants has
involved the determination of the quantities of nutrients required for optimal crop yields
and the ability of varying soils to provide these nutrients. Certain plant species are
sometimes characterized by uncommonly high or low amounts of one or more of the
mineral nutrients. Scientists have categorized these nutrients by their quantities and
functions in plants. Among those nutrients that are categorized as essential, Nitrogen,

35
Phosphorous, and Potassium are the most commonly found to be limiting to plant growth.
Compared with Nitrogen, Phosphorous and Potassium are required by plants in somewhat
smaller quantities.
Of all of the nutrients that can be provided by natural occurrence in the earth’s
crust, Phosphorus (P) is most commonly the element that limits plant growth (Ravin,
1992). While the addition of P to a soil that has a limiting quantity is one obvious
solution, it is not always practical. Adding P may not always be possible, especially in
soils that are particularly deficient, or in countries were fertilizer costs exceed the benefits
of agricultural yields. While plants have spent much of their evolution creating ways of
obtaining nutrients, scientists have spent much of their time in developing ways to enhance
and use these evolutionary traits to increase agricultural and horticultural production.
One such evolutionary technique, developed over time, can be attributed not to plants, but
to their symbiotic counterpart, the fungi.
Associations between plant roots and fungus have produced Mycorrhiza. While
these associations are general not essential to most plants, they do occur naturally quite
often. All gymnosperms, 83% of the dicotyledonous and 79% of the monocotyledonous
plants are involved in mycorrhiza relationships (Marschner, 1995). Understanding
mycorrhiza and the benefits they provided can lead to better utilizing the P in deficient
soil.
Phosphorous Availability and Effects on Plant Growth
While additions of N, P, and K generally all have been shown to increase crop
yields, only P absorption is continued into the later stages of growth when N and K uptake

36
is slowing (Le Bot, 1994). Phosphorous is taken up mainly in the form of H2PO4- from
the soil solution (Marschner, 1995). This uptake occurs by the active mechanism
involving H+ cotransport or HCO3- antiport properties (Le Bot, 1994). Phosphorus is
indirectly responsible for the high cation concentration of DNA and RNA structures since
it contributes to the acidic nature of the nucleic acids making up these structures
(Marschner, 1995). Phosphorous is an essential component of biomembranes and energy
rich compounds such as ATP, GTP, and UTP that are responsible for the synthesis of
starch, cellulose, and sucrose (Marschner, 1995). Deficiencies of Phosphorus can result
in decreased leaf number, leaf surface area, and leaf expansion (Marschner, 1995), due to
a decline in plant hydraulic conductivity (McArthur, 1993). Frequently a shift in
photoassimilates and P partitioning to favor root growth occurs when P is limiting
(McArthur, 1993). Poor P nutrition can decrease the overall shoot canopy and thus
photosynthetic surface area, as well as axillary bud growth (McArthur, 1993). Limited P
can affect soybean growth by decreasing pod production and retention (Lauer, 1989).
Low P in corn resulted in decreased respiration, low levels of soluble protein, and enzyme
activity as well as accelerating the onset of senescence (Russo, 1995). As a result of the
dramatic effects low P can have on many valuable agricultural crops, monitoring and
maintaining adequate levels of P is essential in agricultural production. To be available to
plants, P must be contained in the soil solution (Le Bot, 1994). The labile, soluble solid
form of P in soil is easily converted to soil solution (Le Bot, 1994). A third P pool, an
insoluble fraction, exchanges with the labile portion at a very slow rate (Le Bot, 1994). It
is because of this insoluble fraction that it is necessary to add 10-15% more P than a crops'
demand for it (Le Bot, 1994). While P concentration is typically between 0.3 and 3.0

37
kg·ha-1, rapidly growing crops can absorb as much as 1 kg·ha-1 day-1 (Le Bot, 1994).
Techniques that can increase the absorption in soil that are low in P would greatly benefit
agricultural areas that are unable to meet P demands with added fertilizer. The
mycorrhizal relationship found in many plants may be one such technique. The
mycorrhizal symbioses found in P deficient soils can increase the uptake of P remarkably
(McArthur, 1993).
Mycorrhizal contributions
While root exudes and morphological changes in roots can contribute to nutrient
absorption, these methods are not easily controlled by agricultural practices apart from
genetic selection for such traits. Mycorrhizal symbiosis can enhance the P nutrition of a
plant beyond what could be obtained through the plant's adaptation to low P on it’s own
(McArthur, 1993). Microorganisms living within the rhizosphere can benefit plants by
using sugars or cells and tissues sloughed off by plants as a carbon source for production
of organic acids or chelators that can increase the bioavailablity of certain mineral
nutrients (Marschner, 1995). These bacteria do cause nutrient absorption benefits but not
to a great extent (Marschner, 1995). Since mycorrhizas do not have to compete with
other microorganisms for an energy source, they can exits in greater quantities and are
easier to establish in the rhizosphere (Marschner, 1995). Potato crops can benefit from
mycorrhizal fungi during early to mid season growth by the resulting enhanced
absorption of P (McArthur, 1993).
Vesicular-arbuscular mycorrhizas (VAM) are Enodmycorrhiza, living within the
cortical cells of plant roots and extending mycelium into the surrounding soil (Marschner,

38
1995). VAM form bladder like storage structures both intra and intercellularly (Sullia,
1991). Branched hyphae, arbuscules, serving as absorptive structures, and sites of solute
exchange with the host, are characteristic of VAM (Sullia, 1991). The combination of
roots and mycorrhiza hyphae in soils increase the surface area that can absorb nutrients.
(Marschner, 1995). The mycelia extend the region of P absorption beyond the root zone
that is rapidly depleted in P limited soils. (Sullia, 1991). In heavily infected plants the
fungal mass is typically 10% of the total root mass but can reach as much as 20%
(Marschner, 1995). The total amount of P that hyphae may contribute to the plant can be
as high as 70-80% of the P absorbed and the rate of uptake is 2-3 times that of
nonmycorrhizal plants (Marschner, 1995).
Improved phosphorus nutrition of some VAM plants may also increase the
tolerance of the plant to drought stress (Marschner, 1995). The ability of VAM fungi to
make the insoluble fraction of soil available to the plant (Sullia, 1991) is of particular
interest in agricultural areas in which P fertilization is limited. In calcareous soils, high
rates of respiration of mycorrhizal roots can further increase the solubility of some soluble
calcium phosphates and thus increase the effectiveness of P absorption by roots
(Marschner, 1995). Accumulation of polyphosphates in the vacuoles can act as storage or
as an alternative energy source for ATP, involved in transporting phosphate from the
hyphae to the root across the plasma membrane as inorganic phosphate (Marschner,
1995). VAM roots in Potato showed higher protein concentration and enhanced
microsomal ATPase and acid phosphatase activities compared with their non-mycorrhizal
counterparts (McArthur, 1993). VAM may provide other benefits such as increased
absorption of N, Zn, Cu, and Fe, as well as increasing chlorophyll concentration and plant

39
growth (Runjin, 1990). Using VAM inoculum may be beneficial in reducing fertilizer
inputs (Sullia, 1991).
Practical Applications of VAM
VAM fungi are beneficial in reclamation of mined land. The application of topsoil
and irrigation to southwestern Wyoming arid regions, was successful in allowing faster
inoculation with VAM, and thus assisted in the reclamation of mined lands by host plants
(White, 1992). VAM cannot yet be grown in pure culture so methods of obtaining spores
or fungi most be developed (Khalil, 1994). Present methods included planting already
infected plant material in proximity to desired host (Camel, 1991), collecting spores from
soil and incorporating them when planting host species, the addition of top soil containing
spores or propagales (White, 1992). Natural inoculation can occur as wind, rain, and
invertebrates, such as earthworms carrying spores over a long dispersal range (Gange,
1993).
Problems Associated with using VAM
While the fungi are totally dependent on the host plant for carbon sources, the
plant is not necessarily dependent on the fungi (Marschner, 1995). A large proportion of
the net photosynthates that are appropriated to roots is used for fungal growth and
maintenance (Marschner, 1995). In soils that are high in P, or in which high levels of P
fertilizer are added, VAM fungi colonization may decrease as plants adjust to higher root
uptake (Marschner, 1995). Costs to plant growth by fungi use of photosynthates must be
compared with the benefits that occur from enhanced absorption of P (Marschner, 1995.)

40
Colonization of plants is related to the compatibility of host with symbiant fungi
(McArthur, 1993) and determining specific combinations for crops is essential for
maximizing utilization of mycorrhizae relationships. Induced root physiology of P starved
plants favor increased VAM infection (McArthur, 1993) and it may be that plants that
receive appropriate P from the soil do not produce the anatomy for VAM infection
(Amijee, 1990; Dhillion, 1991). In an experiment using Syngonium, which has somewhat
thick and unbranched roots with few hairs, and Nephrolepis, which has a well-developed
root system and root hairs, it was shown that greater colonization occurred in the
Nephrolepis (Wang, 1993). Also, poor aeration (Wang, 1993), the composition of root
exudes, toxins and other defense reactions may also decrease the colonization of VAM
fungi (Marschner, 1995). Tillage and soil disturbances can delay or depress the infection
of plants with mycorrhizal fungi (Marschner, 1995).
Conclusion
Much research has been generated that demonstrates an increased absorption of P and
other essential nutrients, with the addition of symbiotic associations. Enhancing the
infection of crops with VAM fungi could assist growers in utilizing soils that may have
been consider to have too low a fertility for agricultural crops. This is significantly
important to those countries that have soils poor in fertility and costs for fertilizer
amendments are not feasible. Considerations of plant host and fungi combination, tillage
practices and crop root anatomy must all be examined when determining if VAM is to be
used.

41
Literature Cited
Amijee, F., D.P. Stribley, and P.B. Tinker. 1990. Soluble carbohydrates in roots of leek (Allium porrum) plants in relation to phosphorous supply and VA Mycorrihizas. Plant nutrition- physiology and application. Kluwer Academic Publishers.
Camel, S.B., M.G. Reyes-Solis, R. Ferrera-Cerrato, R.L. Franson, M.S. Brown, and G.J.Bethlenfalvay. 1991. Growth of Vesicular-Arbuscular Mycorrhizal Myceliumthrough Bulk Soil. Soil Sci. Soc. Amer. J. 55:389-393.
Dhillion, Shircharn S. 1992. Host-Endophyte Specificity of Vesicular-ArbuscularMycorrhizal Colonization of Oryza Sativa L. at the Pre-transplant Stage in low orhigh Phosphorous Soil. Soil Biol. Biochem. 24(5):405-411.
Gange, Alan C. 1993. Translocation of Mycorrhizal fungi by Earthworms during Early Succession. Soil Biol. Biochem. 25 (8):1021-1026.
Khalil, S., L. Carpenter-Boggsy, and T. E.Loynachan. 1994. Procedure for RapidRecovery of VAM Fungal Spore from Soil. Soil Biol. Biochem. 26(11):1587-1588.
Lauer Michael J. and Dale G. Blevins. 1989. Dry Matter Accumulation and PhosphateDistribution in soybean Grown on Varying Levels of Phosphate Nutrition. Journalof Plant Nutrition. 12(9):1045-1060.
Le Bot, Jacques, David J. Pillbeem, and Ernest A. Kirby. 1994. Plant Mineral Nutritionin Crop Production. Mechanisms of Plant Growth and Improved Production.Marcel Dekker, Inc. New York, N.Y.
Marschner, H. 1995. Mineral Nutrition of Higher Plants. Academic Press, Sand Diego,CA.
McArthur, David A.J. and Richard N. Knowles. 1993. Influence of Vesicular -Arbuscular Mycorrhizal fungi on the Response of Potato to Phosphorous Deficiency. Plant Physiol. 101:147-160.
McArthur, David A.J. and Richard N. Knowles. 1993 Influence of Species of Vesicular-Arbuscular Mycorrihizal fungi and Phosphorous Nutrition on Growth, Development, and Mineral Nutrition of Potato (Solanum tuberosum L.) Plant Physiol. 102:771-782.
Runjin L. and L. Xinshu. 1990. Effects of Vesicular- Arbuscular Mycorrhizas andPotassium on Apple Seedling. International Symposium on Diagnosis ofNutritional Status of Decidous Fruit Orchards. Acta Horticulturae 274:297-302.

42
Sullia, S. B. 1991. Use of Vesicular-Arbuscular Mycorrhiza (VAM) as biofertilizer forHorticultural Plants in developing counties. Horticulture- New Technologies andApplications. Kluwer Academic Publisher. Netherlands.
Wang H., S. Parent, A. Gosselin and Y. Desjardines. 1993. Vesicular-Arbuscular Mycorrhizal Peat-based Substrates Enhance Symbiosis Establishment and Growth of three Micropropagted species. J. Amer. Soc. Hort. Sci. 118 (6):896-901.
White, J.A., E.J. Depuit, J.L Smith and S. E Williams. 1992. Vesicular-ArbuscularMycorrhizal Fungi and Irrigated Mined Land Reclamation in southwesternWyoming. Soil Sci. Soc. Am. J. 56:1464-1469.

43
Is There A Superior Bean Genotype That Can Use RockPhosphate for Economical Production in Tropical Soil ?
Toni Henke-HammersDepartment of Agricultural Sciences, Texas A&M University Commerce,TX
Additional index words. Acidic, genetic, phosphorus fertilizer
Abstract. Little is known about the different genetic or phenological potentialof bean cultivars to utilize rock phosphate as a phosphorus fertilizer. This isimportant among developing tropical countries. Comprised of acidic, highlyweathered soils. Phosphorus is often the first limiting nutrient to theproduction of this nutritious and relatively inexpensive human food source.This less expensive form of phosphate fertilizer could be paired with anefficient use bean and liberate millions of people from dependence onimported food products.
The common bean is an important source of protein for millions in Latin America,
Africa and Asia. Beans and legumes average 19 to 28% protein content (Hernandes and
Focht 1985). Beans rank second to rice as a basic food staple in many tropical and
subtropical countries. (Morton ,1975)
Low phosphorus availability in these soils, however, limits bean production.
There is much concern that the increasing demands of growing populations cannot be met
under the current production constraints (Janssen , 1989).
Bean farming is conducted mainly by poor farmers cultivating ten hectares or less.
Who are not able to purchase great quantities of fertilizer. Combined with the capacity of
many tropical soils to fix applied phosphorus into forms unavailable to plants (Sanchez
and Uehara 1980) the prospects for prosperity seem bleak. An alternative genetically

44
improved P efficient bean and the available rock phosphate could make economical and
profitable production of an important food source possible.
Soil Phosphorus
Phosphorus occurs in soil almost exclusively as orthophosphate. The total content
of P in the soil ranges from .02 to .15%. In mineral soils the proportion of organic P is
between 20 and 80%. Weathered mineral soils and volcanic organic soils predominate in
the tropics and subtropics. The mineral soils bind the P as Fe and Al compounds. The
organic compounds bind the P in the volcanic soil. Many attempts have been recorded to
develop a procedure to access insoluble P from the third or non-labile fraction of the soil,
but none have been successful. The first fraction (the P in soil solution) is available to the
plant. Only the P held on clay surface (the second fraction or labile pool) contributes to
the solute P as well as the non-labile pool.
The acidity often observed in tropical soils further complicates matters. Anions are
adsorbed more strongly when the soil pH is raised and the ions are able to exchange with
adsorbed phosphate and release P into the soil solution. This process is known as
desorption. When these acidic soils are limed to raise pH. Low soluble precipitates, such
as Ca, Fe and Al phosphates may be formed. The availability of applied P as well as
liberated P is decreased if the concentration of these ions is high as is often the case in
tropical soils. ( Amarasiri and Olsen, 1973). Calcium carbonates can even adsorb P slowly
returning it to apitate and the third soil fraction at pH greater than 7.0.
These same scientists reported that liming and adding P increased yield of rye and millet
until the soil pH reached about 6.5. They blamed the precipitated Fe and Al hydroxides
for inactivation of added P . They also noted that Pigeon peas on limed and fertilized

45
soils had better root systems concluding that greater root development accounted for the
higher yields.
Another important mechanism for soil to release P into solution is decomposition
of organic matter ( Hernandez and Focht 1976). Rhizobium inoculated nodules of the
pigeon pea facilitate the use of organically bound P but the procedure did not increase
yields or P in the soil solution. Lynch and Beebe 1995 to the same conclusions. This is in
contrast to the expected plant root interaction with soluble P described by Marshner
(1986). He explained the N2 fixation process of the microbes may help the roots effect
pH changes in the rhizosphere and influence p uptake. Given that the most important ions
containing P in the soil are H2PO4- and HPO4 2- (depending on the soil pH) and the root
can be as much as one pH unit different from the soil. The end result is increased uptake
of the P by the roots.
Factors That Effect Bean Plant Phosphorus Uptake Efficiency
Lynch and Beebe ( 1995) defined efficiency to be "the ability of a system to
convert inputs to outputs". They further suggested six main physiological mechanisms
that could be sources of increased P efficiency in beans:
1. Reduced tissue P requirements
2. Longer season phenology which extends the time available for physiological use of P,
3. High P seed reserves for seedling establishment. ( In fact large seeded Andean
genotypes have proven outstanding at P utilization Yan et al., 1995),
4. Root exudates which can liberate inorganic P from Fe and Al compounds,
5. Mycorihizal symbiosis and

46
6. Root activity and architecture .
These researchers hypothesize genetic differences for P efficiency in bean germplasm are
primarily caused by genetic variation for root traits. This was also postulated by Fawole
et al. (1982) when they did experiments of inheritance and physiology of bean growth
under P stress. Heritable variation for root dry weight existed in the beans studied. Back
crosses that showed little variation . Fawole believes that only a few genes contribute to
root mass and dominance variance is the most likely mode of inheritance.
Conclusions
Marshner (1986) reported several studies in Britain have proven rock phosphates
give satisfactory crop yield responses on acid soil. This also is normally the most available
and economical form of phosphate fertilizer in the tropics. The challenge now is to
selectively produce palatable, high yielding, heavy rooted beans. This can be done form
the strains of culturally acceptable beans already in existence.
Literature cited
Fawole, Iyiola, W. H. Gabelman, and G. C Gerloff 1982. Genetic Control of RootDevelopment in Beans (Phaseolus vulgaris L.) Grown Under Phosphorus StressJournal of American Society of Horticulture Science 107: 98-100
Amarasiri, S.L. and S. R. Olsen 1973. Liming as Related to Solubility of P and PlantGrowth in an Acid Tropical Soil Journal of American Society of HorticultureScience 37: 716-720
Hernandez, B. S. and D. D. Focht 1985. Effects of Phosphorus, Calcium and HUP- andHUP+ Rhizobia on Pigeon Pea Yields in an Infertile Tropical Soil AgronomyJournal 77: 867-871

47
Lynch, J. P. and S. E. Beebe 1995. Adaptation of Beans (Phaseolus vulgaris L.) to LowPhosphorus Availability HortScience 30: 1165-1171
Morton, Julia F. 1976. The Pigeon Pea (Cajanus cajan Millsp. ), A High Protein ,Tropical Bush Legume HortScience 11: 1119
Yan, X., J.P. Lynch and S.E. Beebe 1996. Utilization of Phosphorus Substrates byContrasting Common Bean Genotypes CropScience 36: 936-941

48
The Effect of Potassium Fertility on Disease Resistance inTurfgrass Species.
Scott Abernathy4
Department of Soil and Crop Sciences, Texas A&M University, College Station, TX77842-
Additional index words. Bermudagrass, Creeping bentgrass, Kentucky bluegrass
Abstract. Plant nutrition is recognized as an important component in diseaseresistance for turfgrass species. Potassium is one of the most important nutrientsinvolved in plant health, playing an essential role in both mechanical andbiochemical defense mechanisms. A review of the literature indicatesinconsistencies concerning the relationship between K and disease severity inturfgrass species. Some studies show a negative correlation between plant K levelsand disease, while others show no correlation. Therefore, potassium’s effect ondisease must be considered on a species-by-species basis. A complete, balancedfertility program did consistently decreased disease severity and should be anintegral part of any successful turf management program.
The relationship between nutrition and disease has been recognized since the
beginning of the 20th century (Beringer and Trolldenier, 1979). A large body of
literature exists documenting the effects of plant nutrition on diseases. A plant’s
nutritional status can determine its level of resistance to a given pathogen (Huber and
Arny, 1985). Potassium, an essential nutrient, is considered to play an important role in
host plant resistance.
The Role of Potassium in Plant Nutrition
The role of K in plant nutrition has been extensively researched. Although K is not
directly associated with the molecular structure of any plant constituent, it has been
4 Graduate student. Home address: 8454 Scasta. Bryan, TX 77808.

49
designated an essential element in all higher plants. Excluding C, H, and O, K is second
only to N in concentrations required by plants for growth, development and
reproduction (Turner and Humnel, 1992). It plays vital roles in such physiological
functions as photosynthesis, carbohydrate and protein synthesis, osmoregulation, cell
expansion, stomatal movement, and regulation of numerous enzymatic reactions (Turner
and Humnel, 1992), (Marschner, 1995).
The Role of Potassium in Disease Resistance
Potassium is important in numerous plant processes. Growth, stress and wear
tolerance, weed encroachment, disease incidence and overall aesthetic quality are all
affected by K levels within a plant (Turner and Hummel, 1992). Of these factors,
potassium’s effect on disease incidence has received the most attention.
Potassium has been shown to play a significant role in disease resistance. Its role
in cell wall integrity is recognized as an important component of disease prevention. For
example, in K deficient plants, the outer epidermal wall tends to be thin relative to K
sufficient plants, allowing pathogens to easily penetrate host cells. Also, high K levels
enhance lignification of cell walls, preventing pathogen penetration (Beringer and
Trolldenier, 1979).
Aside from its role in mechanical defenses to pathogen penetration, little else is
known about the specific mechanisms by which K effects disease resistance. This is
especially true in the area of biochemical defense mechanisms. Due to its involvement in
enzymatic activity, K is thought to participate in nearly all cellular functions that
influence disease severity (Huber and Arny, 1985). However, the specific mechanisms
of this influence are still unknown. Huber and Arny, 1985, speculated that “potassium

50
probably exerts its greatest effect on disease through specific metabolic functions that
alter compatibility relationships of the host-pathogen environment.” For example, in K
deficient plants, the synthesis of high-molecular weight compounds, such as protein,
starch and cellulose, is inhibited. As a result, low-molecular weight organic compounds
accumulate providing an excellent food source for pathogen development (Marschner,
1995).
Potassium Levels and Disease Incidents in Turfgrass Species
The effects of K fertility on disease incidents are well documented for many plants,
including some turfgrass species. The results however, have been inconsistent.
Goss and Gould (1967) studied the interrelationship between fertility levels and the
occurrence of Ophiobolus graminis Sacc. var. avenae E.M. Turner, on Agrostis spp.
The most severe infections were found on those plots that received the highest nitrogen
fertility levels. However, K had a suppressing effect on Ophiobolus patch throughout
the experiment.
Goss (1972) reviewed a study by Evans on leaf spot disease in coastal
bermudagrass. Potassium deficiency was shown to significantly influence disease
severity (Table 1).

51
Table 1 - The effects of various combinations of N, P, K and lime on leaf-spot disease ofBermudagrass*
Fertilizer treatments** Spots per leaf, averageNPKL 13.5
N(.5)PKL 19.9NP(.5)KL 23.1
NKL 16.0NPK 19.6NPL 147.5
* Data was taken from Evans et al. 1964. ** N = 178 Kg/ha, P = 39 Kg/ha, K = 74 Kg/ha, and L = lime to bring pH to 6.5
Markland et al. (1969) studied the influence of N fertilizers on the incidence of
dollar spot, Sclerotinia homoeocarpa F.T. Bennett, in creeping bentgrass, Agrostis
palustis Huds, and found that K levels in the foliage showed a high negative correlation
with the number of disease sites. They speculated that plant tissue low in K accumulate
amino acids, amides and carbohydrates, which provide pathogens with an increased food
supply.
Dollar spot (Slerotinia spp.) incidence in tifway bermudagrass [Cynodon dactylon
(L.) Pers] was related to K application rate, source, and frequency (Horn, 1969).
Potassium reduced dollar spot at all application rates. Similar results were reported for
leaf spot (Helminthosporium spp.) in bermudagrass (Juska and Murray, 1974). Also,
there was less incidence of leaf spot in plots fertilized with N and K, as opposed to those
plots only fertilized with N.
The incidence of snow mold (Typhula itoana) and dollar spot (Sclerontinia
hemoerra) on Penncross creeping bentgrass was not affected by K fertilization. Brown
patch (Rhizoctonia soloni Kuhn) actually increased slightly, but not significantly, with K
applications (Waddinton, 1978).

52
Nitrogen greatly effected the incidence of Prechslera spp. and Puccinia coronata
on perennial ryegrass (Colium perenne), but K had no significant effect (Lam and Lewis,
1982).
Potassium only had a slight influence on dollar spot in bermudagrass, with less
disease occuring at the lowest K level (Carrow et al, 1987). These findings refute those
of Horn (1969).
According to the literature, the role of K in disease incidence varied
depending on the plant / pathogen systems. Therefore, sweeping generalizations about
potassium’s effect on disease can not be made. It does become apparent however, that
the effects of K on disease incidence are mainly confined to the deficiency ranges, and
excess amounts of K does not appear to be beneficial.
The Importance of Balanced Nutrition
The balance or ratio of all nutrients may play as important a role in disease
resistance as the level of any one specific nutrient (Huber and Arny, 1985). The highest
disease severity was found on plots fertilized with high rates of N fertilizer (Hull et al,
1979). Those plots receiving complete N-P-K fertilizers showed significantly less disease
(Table 2).

53
Table 2 - Visual scores of stripe smut incidence on variously fertilized ‘Merion’ Kentuckybluegrass turf in June 1972
Nutrients Fertilization rate** applied x 2x 4x Avg.
---------disease score***----------N:0:0 3.2bc* 4.2bc 8.8d 5.4sN:P:0 1.5ab 2.2ab 3.2ab 2.3rN:0:K 1.5ab 2.2ab 4.8c 2.8rN:P:K 1.0a 1.2a 2.5ab 1.6r
Avg. 1.8y 2.5y 4.8z
* Values within the ratio by rate interaction and averages followed by the sameletter are not significantly different at the 5% confidence level.** Fertilizer rate: x = 12-2-4 g/m2 N-P-K.*** Visual disease scores; 0 = no disease, 10 = completely infected.
Regardless of the inconsistencies present in the literature concerning K’s effect on
disease, it is apparent that nutrient management is a vital component in disease prevention.
A balanced fertility program, one that maintains all essential elements within sufficient
ranges, will help reduce both disease incidence and severity.
Conclusion
Potassium will not increase disease resistance in all instances. But, when
incorporated into a complete, balanced fertility program, K will lower disease incidence in
turfgrass species.
Literature cited
Beringer, H. and G. Trolldenier. 1978. Influence of potassium nutrition on the responseto environmental stress. In Potassium Research - Review and Trends. P.189-224.International Potash Institute. Bern, Switzerland.
Carrow, R.N., B.J. Johnson, and R.E Burns. 1987. Thatch and quality of Tifwaybermudagrass turf in relation to fertility and cultivation. Agron. J. 79:524-530.
Goss, R.L. 1972. The effects of potassium on disease resistance. In The Role ofPotassium in Agriculture. American Society of Agronomy, Crop Science Societyof America, and Soil Science Society of America, Madison, WI P221-241.

54
Goss, R.L. and C.J. Gould. 1967. Some interrelationships between fertility levels andOphiobolus patch disease in turfgrasses. Agron. J. 59:149-151.
Horn, G.C. 1969. Potassium fertilizers for Tifway bermudagrass. P.204-211. In J.B.Beard (ed) Proc. of 1st Int. Turfgrass Res. Conf., Harrogate, England. 15-18July 1969. Sport Turf Res. Inst., Bingley, England.
Huber, D.M and D.C. Arny. 1985. Interactions of potassium with plant disease. InR.D. Munson (ed) Potassium in Agriculture. American Society ofAgronomy, Crop Science Society of America, and Soil Science Society ofAmerica, Madison, WI. P. 467-488.
Hull, R.J., N. Jackson, and C.R. Skogley. 1979. Influence of nutrition on stripe smutseverity in Kentucky bluegrass turf. Agron. J. 71:553-556.
Lam. A. and G.C. Lewis. 1982. Effects of nitrogen and potassium fertilizer onDrechslera spp and Punninia coronata on perennial ryegrass. Plant Pathology31:123-131.
Marschner, H. 1995. Mineral nutrition of higher plants. 2nd ed. Academic Press inc.San Diego, CA.
Markland, F.E., E.C. Roberts, and L.R. Frederick. 1969. Influence of nitrogen fertilizerson Washington Creeping bentgrass, Agrostis palustris Huds. II. Incidence ofDollar Spot, Sclerotinia homoeocarpa, infection. Agron. J. 61:701-705.
Turner, T.R. and N.W. Hummel. 1992. Nutritional requirements and fertilization. InG. A. Peterson, P.S. Baenziger, and R.J Luxmoore(ed). Agronomy. Crop Science Society of America, and Soil Science Society of America, Madison, WI 32:405 - 410.
Waddington, D.V., T.R. Turner, J.M. Duich, and E.L. Moberg. 1978. Effect offertilization on Penncross Creeping bentgrass. Agron. J. 70:713-718.