horiba, ltd. · forecasts of horiba, ltd. and its affiliated ... management plan, which ends in...
TRANSCRIPT

AN
NU
AL R
EP
OR
T 2
012
ANNUAL REPORT 2012http://www.horiba.com© 2013 HORIBA, Ltd. All rights reserved.
HORIBA, Ltd.
2, Miyanohigashi-cho, Kisshoin, Minami-ku,Kyoto 601-8510, Japan
Phone: +81-75-313-8121 Fax: +81-75-312-7389
E-mail : [email protected]

The theme to celebrate HORIBA, Ltd.’s 60th anniversary is “TASUKI: Handing on Omoi.”A tasuki is the sash worn in an ekiden (long distance relay race). A sash in the corporate color blue, and five
colors representing the five business segments, forms a “60.” On the sash is the message, “Handing on Omoi. From our predecessors to the next generation and the world.”
Omoi means an emotional feeling, passion, thoughts, enthusiasm, desire, aspiration, ambition, commitment, mission, and objective.
01
HORIBA 60th ANNIVERSARY
HORIBA will continue to expand our business globally as integrated analysis and measurement solution supplier
with the five business segments.
02Annual Report 2012 |
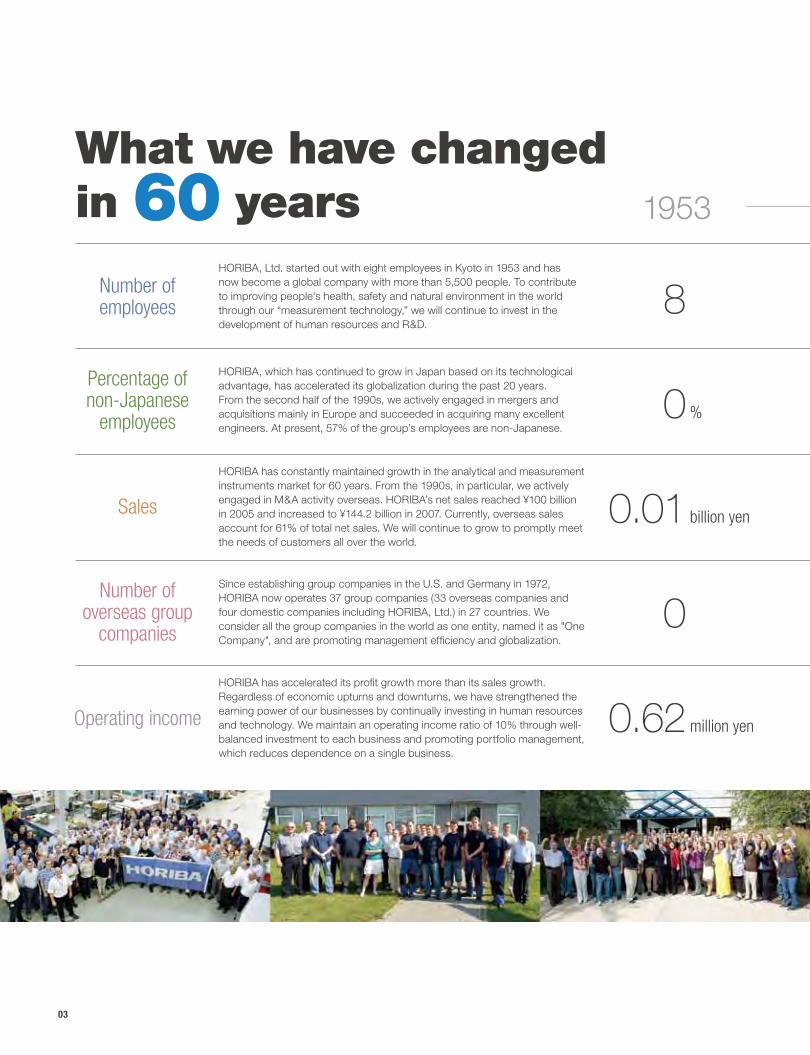
HORIBA, Ltd. started out with eight employees in Kyoto in 1953 and has now become a global company with more than 5,500 people. To contribute to improving people's health, safety and natural environment in the world through our “measurement technology,” we will continue to invest in the development of human resources and R&D.
HORIBA, which has continued to grow in Japan based on its technological advantage, has accelerated its globalization during the past 20 years. From the second half of the 1990s, we actively engaged in mergers and acquisitions mainly in Europe and succeeded in acquiring many excellent engineers. At present, 57% of the group’s employees are non-Japanese.
HORIBA has constantly maintained growth in the analytical and measurement instruments market for 60 years. From the 1990s, in particular, we actively engaged in M&A activity overseas. HORIBA’s net sales reached ¥100 billion in 2005 and increased to ¥144.2 billion in 2007. Currently, overseas sales account for 61% of total net sales. We will continue to grow to promptly meet the needs of customers all over the world.
Since establishing group companies in the U.S. and Germany in 1972, HORIBA now operates 37 group companies (33 overseas companies and four domestic companies including HORIBA, Ltd.) in 27 countries. We consider all the group companies in the world as one entity, named it as "One Company", and are promoting management efficiency and globalization.
HORIBA has accelerated its profit growth more than its sales growth. Regardless of economic upturns and downturns, we have strengthened the earning power of our businesses by continually investing in human resources and technology. We maintain an operating income ratio of 10% through well-balanced investment to each business and promoting portfolio management, which reduces dependence on a single business.
%
billion yen
million yen
8
0
0.01
0
0.62
Number of employees
Percentage of non-Japanese
employees
Number of overseas group
companies
Operating income
Sales
1953
What we have changedin 60 years
03

%
billion yen
companies
billion yen
5,530
57
117.6
33
11.7
%
billion yen
companies
billion yen
1,859
24
40.8
6
2.3
%
billion yen
companies
billion yen
494
7
7.2
2
1.6
19931973 2013*
* the amount for fiscal 2012
HORIBA 60th ANNIVERSARY
(including 35 employees of a non-consolidated U.S. subsidiary at the time)
04Annual Report 2012 |

Analysis elucidates the unknown in all ages.HORIBA’s quest toward the future will continue based on the spirit of “Joy and Fun” together with the analysis & measurement technologies, brands cultivated for 60 years, and the unchanging messages from our predecessors.
What we have not changedin 60 years
05

The HORIBA Motto Joy and Fun"Joy and Fun" represents our desire to see all employees performing work that is rewarding and allows them to lead happy and
fulfilling lives. We want our people to put "Joy" into their work through their own efforts by making the most of the time they spend in the workplace. To that end, the company provides places where employees can work with a sense of "Joy and Fun." Furthermore, if employees do work with a sense of "Joy and Fun," their ability to generate ideas increases, their imagination expands, their efficiency
also rises, and corporate value increases. This results in a "win-win" relationship for customers, shareholders, suppliers, and the society.
HORIBA 60th ANNIVERSARY
06Annual Report 2012 |
19
Business Overview Automotive Test Systems
Medical-Diagnostic Instruments & Systems
Semiconductor Instruments & Systems
Scientific Instruments & Systems
Process & Environmental Instruments & Systems
31
Value Creation Based on Invisible Values Human Resources Technology
37 Corporate Governance
39 CSR
40 Financial Data
75 Corporate Philosophy
76 Corporate Data
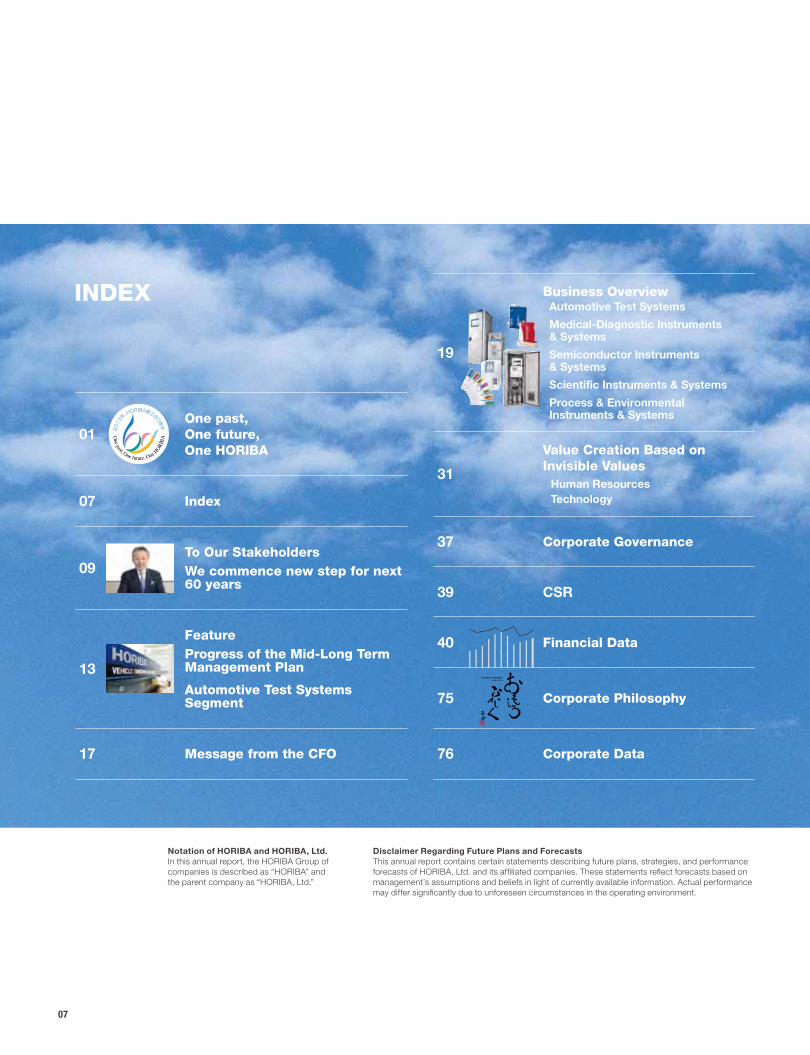
INDEX
01One past,One future,One HORIBA
07 Index
09To Our StakeholdersWe commence new step for next 60 years
13
FeatureProgress of the Mid-Long Term Management Plan
Automotive Test Systems Segment
17 Message from the CFO
Disclaimer Regarding Future Plans and ForecastsThis annual report contains certain statements describing future plans, strategies, and performance forecasts of HORIBA, Ltd. and its affiliated companies. These statements reflect forecasts based on management’s assumptions and beliefs in light of currently available information. Actual performance may differ significantly due to unforeseen circumstances in the operating environment.
Notation of HORIBA and HORIBA, Ltd.In this annual report, the HORIBA Group of companies is described as “HORIBA” and the parent company as “HORIBA, Ltd.”
07

Change of Fiscal Year-EndHORIBA unified its fiscal year-end as December 31, effective from fiscal 2006. As a result of this change, the following irregular fiscal periods were recorded: Fiscal 2006 for HORIBA, Ltd. and HORIBA Advanced Techno Co., Ltd. comprised the 9 months and 11 days from March 21, 2006 to December 31, 2006; and fiscal 2006 for HORIBA STEC, Co., Ltd. comprised the 9 months from April 1, 2006 to December 31, 2006. The fiscal year-end of other consolidated HORIBA subsidiaries was December 31. Their 2006 fiscal periods remained unchanged at 12 months.
08Annual Report 2012 |

To Our Stakeholders
We commence new step for next 60 yearsHORIBA celebrated the 60th anniversary of its foundation in 2013.In Japan, especially in Kyoto, there are many companies with a history of 100 years or more. These companies all have similar things in common, such as a firmly established management philosophy, investment in human resources, unceasing innovation, support from customers, or the harmonization with society. We see our 60th anniversary as one stepping stone and will continue to grow so that we can take new leap toward next 60 years.
In fiscal 2012, our balanced management helped us achieve operating income ratio of 10% despite decreased sales and profit. In fiscal 2012, ending December 31, 2012, HORIBA posted a decline in revenue and profit, consolidated net sales ¥117.6 billion (down 4.7% year-on-year), operating income ¥11.7 billion (down 21.2%) and net income ¥7.3 billion (down 14.6%). The Semiconductor Instruments & Systems segment experienced a slowdown in the second half of fiscal 2012, while the Medical-Diagnostic, Scientific, and Process & Environmental Instruments & Systems segments also recorded a decline in profit due to factors such as the
appreciation of the yen. On the other hand, the Automotive Test Systems segment achieved an improvement in the profitability of automotive emission measurement systems and the MCT (Mechatronics) business turned profitable, which led to a rise in profit, partly absorbing the negative impact of other segments. HORIBA’s operating income ratio of 10% is certainly not at a satisfactory level, but it is commendable that this was a year when the effects of balanced management were apparent. Balanced management counterbalances earnings fluctuation in each segment across the entire company through a continued, well-balanced investment in our five businesses.
Our Mid-Long Term Management Plan is progressing; Speed is the challengeConcentrated investment in highly profitable businesses is one of the strategic policies of our Mid-Long Term Management Plan, which ends in fiscal 2015, and we have steadily invested in the Medical-Diagnostic Instruments & Systems segment, where high growth is expected. In particular, we are making investments to localize reagent production in the BRICs region, where demand for medical-diagnostic instruments and systems is expanding.
Chairman, President & CEO
09
MESSAGE
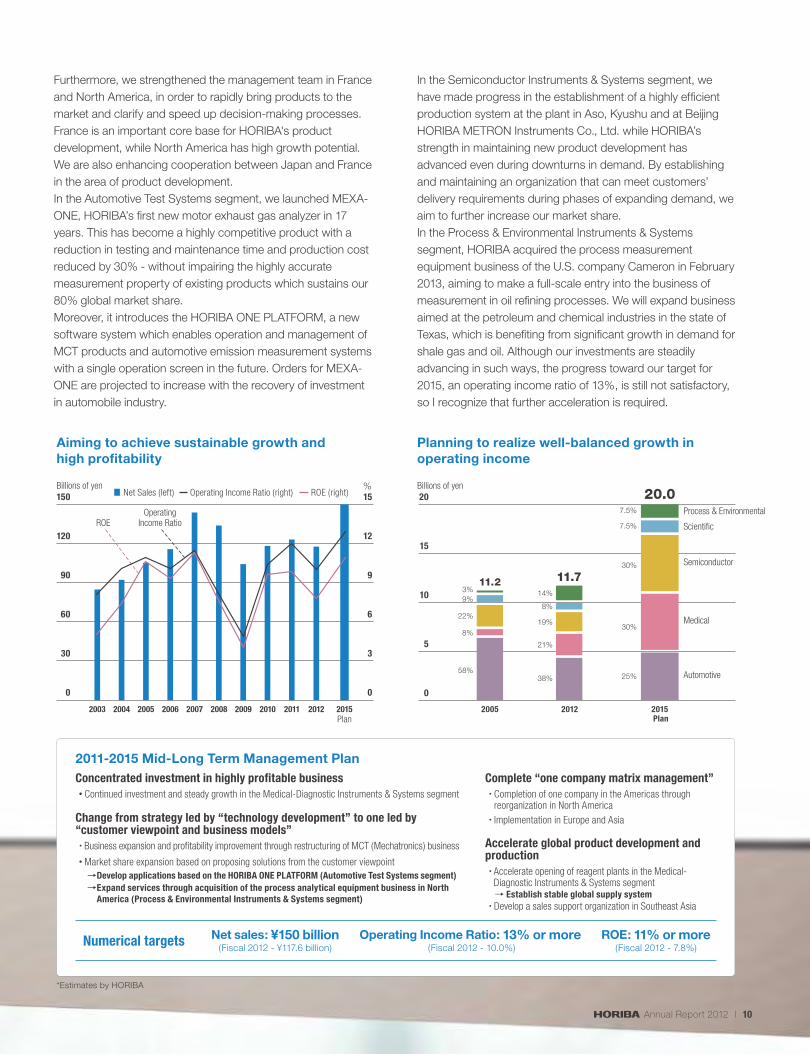
2011-2015 Mid-Long Term Management Plan
Planning to realize well-balanced growth in operating income
Net sales: ¥150 billion(Fiscal 2012 - ¥117.6 billion)
Operating Income Ratio: 13% or more (Fiscal 2012 - 10.0%)
ROE: 11% or more(Fiscal 2012 - 7.8%)Numerical targets
Aiming to achieve sustainable growth andhigh profitability
Net Sales (left) Operating Income Ratio (right) ROE (right)150
120
90
60
30
0
15
12
9
6
3
0
Billions of yen Billions of yen%
2003 2004 2005 2006 2007 2008 2009 2010 2011 2015Plan
ROEOperating
Income Ratio
2012
Concentrated investment in highly profitable business・Continued investment and steady growth in the Medical-Diagnostic Instruments & Systems segment
Change from strategy led by “technology development” to one led by “customer viewpoint and business models”・Business expansion and profitability improvement through restructuring of MCT (Mechatronics) business
・Market share expansion based on proposing solutions from the customer viewpoint →Develop applications based on the HORIBA ONE PLATFORM (Automotive Test Systems segment) → Expand services through acquisition of the process analytical equipment business in North
America (Process & Environmental Instruments & Systems segment)
Complete “one company matrix management”・ Completion of one company in the Americas through
reorganization in North America
・Implementation in Europe and Asia
Accelerate global product development and production・ Accelerate opening of reagent plants in the Medical-
Diagnostic Instruments & Systems segment → Establish stable global supply system ・Develop a sales support organization in Southeast Asia
20
15
10
5
0
2005 2012 2015 Plan
Process & Environmental
Scientific
Semiconductor
Medical
Automotive58%38% 25%
8%
21%
30%22%
19%
30%
9%8%
7.5%
3% 14%
7.5%
20.0
11.711.2
*Estimates by HORIBA
Furthermore, we strengthened the management team in France and North America, in order to rapidly bring products to the market and clarify and speed up decision-making processes. France is an important core base for HORIBA's product development, while North America has high growth potential. We are also enhancing cooperation between Japan and France in the area of product development.In the Automotive Test Systems segment, we launched MEXA-ONE, HORIBA’s first new motor exhaust gas analyzer in 17 years. This has become a highly competitive product with a reduction in testing and maintenance time and production cost reduced by 30% - without impairing the highly accurate measurement property of existing products which sustains our 80% global market share.Moreover, it introduces the HORIBA ONE PLATFORM, a new software system which enables operation and management of MCT products and automotive emission measurement systems with a single operation screen in the future. Orders for MEXA-ONE are projected to increase with the recovery of investment in automobile industry.
In the Semiconductor Instruments & Systems segment, we have made progress in the establishment of a highly efficient production system at the plant in Aso, Kyushu and at Beijing HORIBA METRON Instruments Co., Ltd. while HORIBA’s strength in maintaining new product development has advanced even during downturns in demand. By establishing and maintaining an organization that can meet customers’ delivery requirements during phases of expanding demand, we aim to further increase our market share.In the Process & Environmental Instruments & Systems segment, HORIBA acquired the process measurement equipment business of the U.S. company Cameron in February 2013, aiming to make a full-scale entry into the business of measurement in oil refining processes. We will expand business aimed at the petroleum and chemical industries in the state of Texas, which is benefiting from significant growth in demand for shale gas and oil. Although our investments are steadily advancing in such ways, the progress toward our target for 2015, an operating income ratio of 13%, is still not satisfactory, so I recognize that further acceleration is required.
10Annual Report 2012 |

Changes in the management structure
Measures taken so far ■ Changed the corporate name and unified our corporate brand ■ Introduced “Matrix Management” ■ Restructured group companies in the Americas and Europe, and organized development bases ■ Introduced “Shared services*” in the U.S., Japan and the U.K. ■ Expanded the Blackjack Project globally ■ Initiated the HORIBA COLLEGE ■ Enhanced head office function
Measures to take from now on ■ Expand “Shared services” in Europe and Asia ■ Implement ERP (Enterprise Resource Planning) systems in all group companies, making it complete
Senior Corporate Officer,General Manager of Finance & Control Division
Sunao Kikkawa
Corporate Officer,General Manager of Sales & Marketing Division of
HORIBA ABX S.A.S. Bertrand de Castelnau
Senior Corporate Officer,General Manager of Sales Division
Takashi Nagano
Chairman, President & CEO
Atsushi Horiba
Executive Vice President and General Manager ofCorporate & Segment Strategy Division
Juichi SaitoExecutive Vice President
Dr. Kozo Ishida
Senior Corporate Officer,General Manager of Research &
Development DivisionDr. Masayuki Adachi
Executive Corporate Officer,Chairman, President & CEO of
HORIBA International CorporationDr. Jai Hakhu
Senior Corporate Officer,President & CEO of HORIBA Jobin Yvon S.A.S.
Dr. Michel Mariton
(as of April 1, 2013)
Proposing new analytical applications as a “solution provider”In order to raise profitability, it is essential not only to increase sales of equipment (hardware) but also to propose solutions from the customer viewpoint about what kind of analysis and measurement is feasible through its use of that hardware. To achieve this, I think it is important for HORIBA itself to become a “solution provider.” This means providing analytical solutions
Becoming a stable, highly profitable company
*“Shared services” refer to the consolidation of certain common services in several divisions and organizations in order to enhance the productivity of the entire company or group companies and achieve cost reductions.
to current customers while continuing to refine the technology, quality and cost of the instruments.Based on the new introduction of MEXA-ONE, the Automotive Test Systems segment has been able to propose analytical applications while providing data and tests themselves. At the same time, in the case of the process measurement equipment business newly acquired by the Process & Environmental Instruments & Systems segment in the U.S., the aim is to achieve distinctiveness by embarking on maintenance
11
MESSAGE
*1: Point-of-care testing (POCT) is defined as medical testing at or near the site where patients are located; in places such as examination and surgery by a doctor or a physician, a hospital ward, or a clinic for outpatients*2: Fiscal 2012 sales excluding sales of testing reagents
and services that are closely linked to customers. Furthermore, in the Medical-Diagnostic Instruments & Systems segment, consumable testing reagents already account for about 50% of segment sales and have become a major source of earnings for HORIBA. By providing testing equipment in places of Point-of-care testing (POCT)*1 such as a doctor’s office for initial diagnosis or a surgery room, we contribute to reduce testing time and improve the quality of medical care which includes adequate diagnosis, nursing care and prevention of diseases. By expanding business fields that provide solutions directly linked to the creation of customer value in such ways, we aim to make HORIBA highly distinct from its competitors, and I believe this will stabilize earnings while increasing growth and profitability.At present, non-hardware business including services, maintenance, and consumables generates about 13% of HORIBA’s sales*2, but we intend to change our focus from a strategy led by “technology development” to one led by “customer viewpoint and business models” so that this ratio rises to around 20% in the medium term.
Continuing to foster human resources and technologies for further growthHORIBA is promoting management that clarifies “what we will change” and “what we will never change,” practices we learned by overcoming several economic crises in the past. What we are striving to change at present is our management balance and globalization. “What we will never change” is our continued investment in “Invisible Values” (assets not visible in the financial statements) such as human resources and technology. While economic cycles of recession and boom have repeatedly occurred, our continued investment has been the driving force behind substantial growth in subsequent recovery phases. Based on this experience, we will continue to invest in human resources and technology as we prepare for future growth. The HORIBA COLLEGE, which began in 2009 to provide educational opportunities to our employees, has built up the number of available courses, and we have adopted various creative measures to enable us to secure human resources with abundant diversity such as the introduction of recruitment of newly graduates in the autumn period and the continual recruitment of students from overseas. These continuing initiatives to create value will steadily bear fruit, even during challenging times, and continue to generate sources of new growth.
The sashes (“Tasuki” in Japanese) to the next 60 yearsHORIBA celebrated the 60th anniversary of its foundation in 2013. Some of our group companies have continued to grow for nearly 200 years. I am convinced of the fact that companies with such a history can continue to display a powerful attraction as a member
of HORIBA Group. This also attributes to the fact that we have consistently exercised good management practices based on a unique corporate culture symbolized by the company motto “Joy and Fun.” This corporate culture cultivates the “Invisible Values” of human resources and technologies that are valued worldwide. We ultimately provide these “Invisible Values” to customers in the form of real “products” that create corporate value and earnings. We will continue to pursue corporate growth based on the enhancement of our “Invisible Values” and hand over our unique culture to the next generation.Our headquarters are located in Japan, but HORIBA is not another Japanese company that conducts business around the world. Rather, our objective is to be a truly global company with the understanding of culture, customs, and values of the countries and regions where we conduct business in harmony with the local community and its employees. In 2009 as part of these endeavors, we have welcomed non-Japanese employees with management experience in global blue-chip companies as executive corporate officers of HORIBA, Ltd. Three of these executives are currently involved in our global business management.I firmly believe that implementing management based on this corporate philosophy will lead to sustained growth while creating a corporate structure that is invulnerable to economic fluctuation. As a global company we will consequently receive a fair market valuation from investors around the world.To reward our owners (shareholders) in 2012, we paid a record-high annual dividend, including a commemorative dividend for our 60th anniversary since its foundation. (In 2011, we paid an annual dividend per share of ¥40, and in 2012, we paid an annual dividend of ¥50, including the commemorative dividend of ¥10.) For 2013, we have revised our dividend policy that was continually based on non-consolidated net income since HORIBA’s public listing to one based on consolidated net income. At the present time, we are forecasting an annual dividend of ¥45.HORIBA will continue to help overcome various issues associated with social development, such as environmental pollution, by supplying analytical and measurement instruments. We will also continue to supply a wide variety of products in order to provide “assurance” to all people. Furthermore, even at times when our operating environment is uncertain, instead of being complacent and running away from risk, or blindly stepping on the brake, we intend to pursue management strategies which turn risk into opportunity by correctly ascertaining situations and acting bold. I sincerely hope that all our stakeholders understand and agree with our management policies and will continue to support us for many years to come.
April 2013
Atsushi HoribaChairman, President and CEO
Path of change to achieve transformation
12Annual Report 2012 |

Progress of the Mid-Long Term Management PlanDuring 2012, the second year of the current Mid-Long Term Management Plan which ends in 2015, HORIBA made significant investment for establishing business bases mainly in reagent plants for the Medical-Diagnostic Instruments & Systems segment, the division in focus, Progress was also achieved in organizational improvement. The state of progress toward achieving profit targets, however, is still not satisfactory and further acceleration is required.
Assumed exchange rates: ¥80/U.S. dollar, ¥110/Euro * Return on equity
Net Sales ¥150.0 billionFiscal 2012: ¥117.6 billion
13%or moreFiscal 2012 : 10.0%
ROE* 11%or moreFiscal 2012 : 7.8%
Numerical targets for 2015
2001 ▶ 2005
Driven by the automotive segment
2005 ▶ 2010Contributed by growth in the
semiconductor segment
2010 ▶ 2015More balanced portfolio
with growth in the medical segment
Vertical axis : Operating Income Ratio in the final year Horizontal axis : Compound annual growth rate of Net Sales Size of circle : Net Sales volume
35%
25%
15%
5%
-5%
35%
25%
15%
5%
-5%
35%
25%
15%
5%
-5%
Profitability Profitability Profitability
Growth Growth Growth4% 2% 2%8% 4% 4%12% 6% 6%16% 8% 8%
Automotive
Automotive
Automotive
ScientificScientific
Scientific
Business portfolios aimed by the Mid-Long Term Management Plan
Left: 2012 Results Right: 2015 Plan Left: 2012 Results Right: 2015 Plan
50
25
0
6
3
0
43
4.4
222.4
17 2.220
0.9
13 1.6
465.0
34
6.0
30
6.0
24
1.516
1.5
Billions of yen Billions of yen
2012 results and 2015 plan targets by business segment
Automotive AutomotiveMedical MedicalSemiconductor SemiconductorScientific ScientificProcess &Environmental
Process &Environmental
Net Sales Operating Income
2011
2015
Operating Income Ratio
Semiconductor Semiconductor
Semiconductor
Process &Environmental
Process &Environmental
Process &Environmental
Medical
Medical
Medical
Feature
13
FEATURE

Key measures initiated or achieved by 2012
Key measures to take in 2013
Automotive Launched a new emission measurement systemTurned the MCT (Mechatronics) business profitable
Medical
Expanded capacity of a reagent plant in JapanBegan construction of a new reagent plant in IndiaBegan relocation and capacity expansion of a reagent plant in BrazilBrought products sold in Japan to the Asian market
Semiconductor Expanded the Aso plant and enhanced production system
ScientificCompleted construction of an R&D center in ParisAcquired electronic beam technologies
Process & Environmental
Acquired a process measurement equipment business in North America to enhance service business (in February 2013)
Expand business in India
・ Grow the automotive test system business, driven by an increase in automotive manufacturers' investment.・ Accelerate growth in medical business while completing a reagent
plant construction・ Grasp the chance of growing demand for analytical and
measurement instruments as environmental regulations are being established.
Expand presence in North America
・ Establish bases on the West Coast (integration of the Medical-Diagnostic, Sientific, and Process & Environmental business bases)・ Accelerate reorganizing the sales channels in the medical business・ Promote the process measurement instrument business
In order to bring values to society and raise profitability, it is essential not only to
generate sales of equipment (hardware) but also to propose solutions from the
customer viewpoint about what kind of analysis and measurement is feasible through
the use of that hardware. In other words, it is to provide value beyond hardware sales.
To achieve this, it is important for HORIBA itself to become a “solution provider”. This
means providing analytical solutions to customers that use hardware while continuing
to refine the properties of the hardware, such as technology, quality and cost. We need
to visit our customers frequently and explore their real needs. Then, we will materialize
their needs in our products and bring back to them. What we deliver is not simply
hardware but also data that they need. By expanding our business arena to include
the provision of solutions that are directly linked to customers’ value creation, we are
determined to differentiate ourselves from our competitors and achieve a small degree
of profit fluctuation as well as high growth and profitability.
Aiming to become a “solution provider”
Products & Solutions
Market (customers)
Core technology
Application technologyRegulations
14Annual Report 2012 |

15
Feature
Expectations for MEXA-ONE
MEXA-ONE will cater to a variety of advanced needs in engine development1The latest trends in engine development, such as hybrid vehicles and downsizing engines, require increasingly advanced exhaust gas measurement capability. Development sites must also support research on motors and batteries, which includes developing an appropriate balance with engines, advanced technologies and higher extensibility. The diffusion of automobiles in emerging countries is accelerating local needs for automobile development. We believe the local demand for emissions measurement in these countries will expand as well. In both cases, the demand for quality, as well as a lower cost of performance, is much higher than that of previous models. MEXA-ONE is a product that can satisfy such needs.
MEXA-ONE offers an integrated platform with a high degree of extensibility3What customers need is analysis data. Analytical and measurement instruments need to function more simply and more quickly. Furthermore, to simplify data collection and enhance the functionality of systems, it
MEXA-ONE will greatly reduce total cost of ownership2Fierce competition among automobile manufacturers is generating the need for faster, more efficient development with lower cost. As MEXA-ONE has reduced analyzer response times by 50%, it can substantially shorten customers’ analysis time. Moreover, costs associated with overall testing are also sharply reduced. As testing times for emission measurement systems are generally longer than those of other test procedures, even a small reduction in power consumption and a lowered requirement for consumables adds up to a large potential savings. Compared to HORIBA’s former model, MEXA-ONE has managed to cut power consumption by 10% and the use of consumables by 30%.
Customers will be supported by a global service network4We have established a 24-hour response maintenance organization for major customers located around the world. This is important for HORIBA to maintain high market share and gain strong customer confidence. HORIBA’s global service network provides a high level of assurance at automobile development sites around the world.
Inheriting the no. 1 position in global salesSince launching the first automotive emission measurement system in 1964, HORIBA has supplied emission measurement systems for engine development in close cooperation with the world’s automobile manufacturers for nearly half a century. The new MEXA-ONE product that we launched for the first time in 17 years in 2012 aims to return to the starting point with a fresh approach, as the product name implies. MEXA-ONE possesses a greatly enhanced measurement system and expanded application software performance to respond the evolving needs in automotive development.
Automotive Test Systems
Segment
Engine emission measurement system
MEXA-ONESulfer analyzer
Solid particulate measurement
instrument
Ammonia/NOx measurement
instrument
Fourier transform infrared analyzer
Flow meterEngine
AC Dynamometer
Flow of emission
■ Image of HORIBA ONE PLATFORM
Integrated control of analytical and measurement instruments
*DPF: Diesel Particulate Filter
Catalysts(Ternary catalysts, de-NOx canalysts, DPF*, etc.)
will be necessary to seamlessly link and control other analytical and measurement instruments. Therefore, with the introduction of the “HORIBA ONE PLATFORM,” we envisage that HORIBA’s Automotive Test Systems segment will make a significant contribution to the enhanced efficiency of engine and automobile development by providing total customer solutions that include combinations with our MCT products.
FEATURE

16Annual Report 2012 |
100
75
50
25
0
Share (%)
Approx.market
size
Expanding the MCT business
1 Improving profitability
The MCT business, which HORIBA acquired from Carl Schenck AG (Germany) in 2005, has continued efforts since the acquisition in cost cutting, optimal allocation of personnel, and adjustment of production capacity at factories. As a result, MCT profitability sharply improved in 2012. In addition, sales growth in China mirrored the expanding investment in the automobile industry. The MCT business has also managed to expand its market share among major automobile manufacturers in Japan.
In 2012, we started full-scale operation of the Olomouc factory in the Czech Republic to produce chassis dynamometers. The new factory is designed to substantially boost productivity by optimizing production lines and reselection of suppliers. These efforts have realized cost reductions that contributed to the improved earnings in 2012. We aim to continued improvements in profitability by transferring other MCT production lines to the Olomouc factory.
Revisiting to the source of automobile development2The MCT business has a total market size of more than ¥150 billion, including engines, chassis dynamometers, driveline test equipment, and brake testers. The market has the potential to expand further with growth into the BRIC countries and investment in electric vehicle development. HORIBA has an 80%* share of the global emission measurement systems market, but only around a 10 to15% share of the MCT market. We believe we will be able to raise this share through customer relationships fostering the confidence that we have cultivated in the emission measurement systems business and links to our new MEXA-ONE product.
We are reinforcing our testing laboratories to respond to investment in the pursuit of fuel efficiency technologies for automobiles and the introduction of electric vehicles. At the headquarters of HORIBA, Ltd. in Kyoto, we have set up one of four testing laboratories as a drivetrain testing laboratory equipped with a virtual battery system that caters to the need to analyze hybrid systems and electric motor performance. At the newly opened Shanghai Technical Center in China we have installed a drivetrain testing laboratory similar to the one in Kyoto and an engine testing laboratory equipped with MEXA-ONE. We now have the ability in China to test engines that are brought in by our customers, which will expand sales and accelerate new product developments that capture local needs.
Olomouc factory (Czech Republic)
Shanghai Technical Center’s virtual battery laboratory
■ Fields where HORIBA aims to expand market share
¥40 bln
Emissions measurement
¥10 bln
Safety, comfort, and ITS
¥150 bln
Engine performance tests; drivelines tests; vehicles, wind tunnel balances, brake tests; motor and battery tests
Fields where HORIBA can expand market share
80%
15%
30%
Emissions business Driving management systems & drive recorders
MCT business
*Market share is estimated by HORIBA.

Implementing shareholder return linked to earnings growthUp to 2012: Payout ratio of 30% of HORIBA, Ltd.’s net income2013 onwards: Aiming for payout ratio of 30% of HORIBA’s consolidated net income*
*Target a total shareholder return of 30% of consolidated net income combined with the amount of dividend payments and share buybacks
Select an optimal financing method, responding to capital needs and with due consideration to factors such as the equity ratio, capital cost, market interest rates, and credit ratings.
Achieving a high ROE (Return on Equity) based on earnings growthMid-Long Term Management Plan (2015): 11% or more
Sunao Kikkawa Senior Corporate Officer and General Manager of Finance & Control Division
Sunao Kikkawa joined HORIBA, Ltd. in 1974. He was assigned to work at HORIBA Instruments Incorporated (U.S.) in 1982 and returned to HORIBA, Ltd. in 1988. He was appointed General Manager of the Accounting Department in 1996 and Senior Corporate Officer in 2007. He made efforts toward globalizing HORIBA’s accounting operations along with the Group’s globalization and maintaining compliance with international accounting standards. At present he is engaged in raising efficiency in capital strategy and group administrative operations as Senior Corporate Officer and General Manager of the Finance & Control Division.
Message from the CFO
HORIBA is investing for growth and rewarding shareholders in a balanced manner
Implement a shareholder return policy linked to earnings growth
HORIBA was the first listed Japanese company to start paying shareholder dividends based on a payout ratio in 1974 when listed in the Second Section of the Tokyo Stock Exchange. This practice has paid dividends to its owners without interruption for 38 years. Since 2013, we have changed from dividend policy targeting at 30% of nonconsolidated net income to the total shareholder return, combined with the amount of dividend payments and share buybacks, targeting at 30% of consolidated net income.
Financial policies
HORIBA maintains an appropriate level of liquidity in hand to ensure efficient funding in response to capital requirements. This is an important guideline for HORIBA’s financing activities. We define liquidity in hand to be a sum of cash and cash equivalents and the open amount of the commitment lines that have been negotiated with financial institutions. At the end of fiscal 2012, liquidity in hand amounted to ¥43.8 billion, which was ¥38.8 billion in cash and cash equivalents and a ¥5.0 billion open balance of commitment lines with banks.
Basic capital policy
HORIBA’s basic capital policy is as follows.
17
CFO MESSAGE

■ Dividend per Share (left) ■ Commemorative Dividend per Share (left)
- Total Shareholder Return (right) [including commemorative dividends and share buybacks]
2001 2002 2003 2004 2005 2006 2007 2008 2009 2010 2011 2012 2013 Plan
Dividend payments and total shareholder return Five-year accumulated cash flow
Sum of five years (2003-2007)
Sum of five years (2008-2012)
Operating cash flow
Shareholder return (total)
Investing cash flow (cash outflow)
Free cash flow
60
50
40
30
20
10
0
60
50
40
30
20
10
0
60
50
40
30
20
10
0
%Yen Billions of yen
Dividend payments and totalshareholder return
As the economic downturn after the Lehman Brothers Shock in 2008 deteriorated HORIBA’s profitability, our dividend per share was depressed in 2009 and 2010. However, thanks to growth in the Medical-Diagnostic Instruments & Systems segment combined with an earnings recovery in the Automotive Test Systems segment and the Semiconductor Instruments & Systems segment, we raised the dividend per share in 2011 and effectively did the same in 2012 including a commemorative dividend of 10 yen per share to celebrate the 60th anniversary of HORIBA, Ltd. In 2013, we will change the dividend policy to one based on consolidated net income. After adopting the new standard, we are projecting a dividend per share of 45 yen based on our net income forecast of ¥6.3 billion as of February 14, 2013. Based on consolidated net income, the payout ratio in the past 11 years, from 2002 to 2012, can be recalculated to 21.2%. Although this is a retrospective calculation, the change from 30% of HORIBA, Ltd.’s net income to 30% of its consolidated net income increases the shareholder return by about 40%.
Growth in accumulated free cash flow
HORIBA continuously makes investments in production facilities and systems as well as R&D and human resources from a long-term perspective, rather than based on the operating performance for a single fiscal year. Accumulated free cash flow (FCF; operating cash flow plus investing cash flow) for the five years (from 2003 to 2007) amounted to about ¥9 billion, due to the heavy initial capital investment burden associated with implementing ERP (Enterprise Resource Planning) systems for globalized operations. However, FCF for the subsequent five years (from 2008 to 2012) expanded to around ¥25.0 billion, as our operating cash flow expanded even after investments in plants and an R&D center, in addition to investments in human resources and R&D activities. The shareholder return (the sum of dividend payments and the amount of share buybacks) for the same period grew by close to 70% due to an increase in dividends driven by earnings growth and share buybacks.
18Annual Report 2012 |

Business Overview
Business overview by region
Europe Asia Japan
23%of total sales
22%of total sales
39%of total sales
Medical Medical-Diagnostic Instruments & SystemsPrincipal products
Equipment for blood sample analysis (hematology analyzers, equipment for measuring immunological responses, clinical chemistry analyzers, blood glucose measurement systems)
Major customers
Medical testing centers, small to medium-sized hospitals, medical practitioners
Product applications
Health and diagnostic testing, disease diagnosis
Segment sales
19%Proactive product development in a largestable-growth marketHORIBA medical products are primarily blood testing instruments and reagents for the in-vitro diagnostics market, with over ¥2 trillion in global annual sales. The segment’s business model is based on earnings generated from reagents sales. HORIBA sells its original small and medium-sized blood cell counters in the diagnostic market for point-of-care testing (POCT), which is defined as immediate diagnostic testing during patient care; typically in small hospitals, testing centers, outpatient clinics, and surgery centers. We are endeavoring to boost instrument sales which will lead to expanded sales of testing reagents.
Automatic blood cell counter plus
CRP Risk factor Changes in medical insurance systems in different countries
Automotive Test Systems Automotive Test Systems
Principal products
Emission measurement systems, automotive emission analyzers, onboard emission measurement systems, driveline test systems, engine test systems, break test systems, drive recorders
Major customers
Automobile and motorcycle manufacturers, automotive component manufacturers, multipurpose motor manufacturers, government regulatory agencies, oil companies, automotive maintenance and repair centers
Product applications
Development of new gasoline, diesel and hybrid powertrains, vehicle certification and quality control, in-use vehicle inspections
Segment sales
37%Strong support for automotive developmentHORIBA’s automotive emission measurement systems have been adopted as the primary standard by national certification bodies in many countries. This recognition has led to a commanding top position in the industry with an 80%* global market share. Business acquisitions have expanded our product lineup into complete turnkey systems for automotive development. These test systems are used at the forefront of research and development and quality control. Our test systems are indispensable for developing new types of engines, such as gasoline, diesel, hybrid electric power trains and alternative fuel engines. We expect to experience an increase in demand for our automotive development instruments.* HORIBA’s estimate
Emission measurement
system
Risk factor The global automotive industry’s shifting R&D investments
19
BUSINESS OUTLINE

AmericasJapan
• Steady growth and high market shares for products that are related to R&D applications and environmental regulations.
Asia• Expect high growth in China, India, and Southeast Asian countries.• Use know-how accumulated in developed countries to expand business in Automotive, Medical and Process & Environmental segments.
Americas
• High potential for expanding market share in this market that represents 40% of global demand for analytical and measurement instruments.• Focus on product development and marketing for the medical and semiconductor markets.• Expand capacity of a reagent plant in Brazil for the Medical-Diagnostic Instruments & Systems segment.
Europe• Sales increase with the effects of the corporate acquisition and the business acquisition.• Opening of R&D Center in Paris as a core facility for product development in Europe.
16%of total sales
pH meters
Scientific Scientific Instruments & SystemsPrincipal products
Particle-size distribution analyzers, X-ray fluorescence analyzers, Raman spectrophotometers, spectrometers, gratings, pH meters
Major customers
Manufacturers, research institutions, universities, government agencies, electric power companies
Product applications
R&D, product quality testing, criminal forensics
Segment sales
17%Achieve a good balance with unique analytical measurement technologies and business operationsHORIBA provides over 500 types of instruments in the leading edge of scientific technology. We command leading market shares thanks to our high-level of analytical technology know-how and enhanced customer support. The Scientific segment develops basic analytical and measurement technologies, which play key roles in providing new technologies to other business segments.
Risk factor Investment trend of national government agencies and other institutionsDemand fluctuation following changes in environmental regulations
Semiconductor Semiconductor Instruments & SystemsPrincipal products
Mass flow controllers, chemical concentration monitors, reticle/mask particle detection systems, residual gas analyzers
Major customers
Semiconductor production equipment manufacturers, semiconductor device makers, semiconductor cleaning equipment manufacturers
Product applications
Flow control of gases and liquids, monitoring of cleaning fluid concentrations in semiconductor manufacturing processes, semiconductor and LCD quality control inspections
Segment sales
15%Contributing to improve yieldin semiconductor manufacturing processesThe semiconductor industry is cyclical but continues to grow. HORIBA’s main products are mass flow controllers; devices that control gas and liquid flows in the semiconductor, solar cell, and LED (light-emitted diode) manufacturing process. Semiconductor products also include many other types of monitoring equipment for semiconductor production. HORIBA provides customers with high-level solutions that support technical advances in processing, miniaturization, and yield enhancement.
Mass flow controllersRisk factor Significant fluctuation in demand caused by the “silicon cycle” in the semiconductor
industry and investments related to LEDs, solar cells, and other energy sources
Process & Environmental Process & Environmental Instruments & Systems
Principal products
Stack gas analyzers, water quality analysis and examination systems, air pollution analyzers, environmental radiation monitor
Major customers
Manufacturers, government agencies, electric power companies
Product applications
Measurement of gaseous emissions, wastewater and water supplies, environmental pollution monitoring, environmental radiation measurement equipment
Segment sales
12%Providing analytical and measurement instruments for compliance with environmental regulationsHORIBA provides environmental measurement solution technologies in a wide range of fields for environmental preservation in various parts of the world. Together with the provision of process measurement technologies which fulfill analytical needs in manufacturing development, we ensure public safety, security, and health.Stack gas analyzer
Risk factor Decline in sales prices caused by pricing competition Demand fluctuation following changes in environmental regulations
20Annual Report 2012 |

Sales breakdown Net sales and Operating income Sales breakdown by region
Automotive Test Systems
Segment sales
37%
Emission gasmeasurement66%
Engines 13%
Drivelines7%
Vehicles 4%Driving managementsystems &drive recorders 7%
Other 3%
Japan 35%Europe 24%
Asia 29%Americas 12%20102009200820072006200520042003 2015Plan
2011 2012
8
6
4
2
0
60
45
30
15
0
Net sales (left)Operating income (right)
Billions of yen Billions of yen
MEXA has No. 1 global share in emissionmeasurement systemsSince we developed the first MEXA in 1964, HORIBA has been a pioneer in emission measurement systems and has provided the global market with the latest technologies required for automotive development, meeting requirements that have constantly changed with the times. HORIBA’s emission measurement systems command the top position in the industry with an 80%* worldwide market share and have been adopted as the primary standard by national certification bodies in many countries and by major global automotive manufacturers. (*HORIBA’s estimate)
We have delivered over 8,000 MEXA units to our customers. Going forward, we plan to expand sales of MEXA-ONE, which we introduced in 2012 against the backdrop of renewed investment. We are committed to continuing support for automotive development by responding to rising demand for the measurement of the emission characteristics of alternative fuels such as biofuel, and the requirement to measure emissions in more diverse applications such as construction machinery, ships, locomotives, and general purpose engines.
2013: Anticipate the automotive industry’sinvestment for improvement in fuel efficiencyHORIBA recorded an increase in sales and profit in 2012, thanks to increased investment by automotive
manufacturers globally, and improved profitability led by profit restructuring efforts made by the MCT (Mechatronics) business unit.In 2013, we are expecting a strong investment appetite by automakers globally and gradual recovery in demand, triggered by Europe’s fuel efficiency requirements and other various new emission standards that are likely to be tightened in 2014-2015.
Providing solutions for hybrid cars (HV),plug-in hybrid cars (PHV) and electric cars (EV)HORIBA’s MCT business provides essential measurement systems to evaluate power-train efficiency and aerodynamic performance. These areas are important also for the development of electric cars and related investments are expected to increase. We plan to have a complete product line-up based on the HORIBA ONE PLATFORM at an early stage and aim to expand business and improve profitability by increasing our market share in Japan, Europe, and the Americas and accelerating to capture new demand in emerging markets.Meanwhile, development of HV or PHV vehicles that use engines, motors and batteries requires new features in emission measurement systems, and also the emission measurement need is increasing, particularly in emerging markets where need for local development is increasing amid accelerated growth in automotive sales.
21
BUSINESS REVIEW

Major products and market shares
Emission Measurement Systems Driveline Test Systems
These systems continuously and simultaneously measure chemical components in emission gases over a broad range of concentrations.They are widely used in R&D and product certif ication in the automotive industry.
The driveline is an extremely important power train part that transmits energy from engines or motors to the vehicles’ tires. HORIBA’s driveline test systems use the latest simulation technology for applications in all types of driveline testing. This is HORIBA’s strength demonstrated by providing flexible systems for all applications.
2009200820072006200520042003 2010
Billions of yen Million Euro/Million US$/100 Million Yen60
50
40
30
20
10
0
24,000
20,000
16,000
12,000
8,000
4,000
02011
HORIBA's Automotive Segment Sales (left)
Aggregate R&D Spending by 3 German Automakers (right; Million Euro)
Aggregate R&D Spending by 2 U.S. Automakers (right; Million US$)
Aggregate R&D Spending by 3 Japanese Automakers (right; 100 Million Yen)
Source: HORIBA’s survey based on companies’ disclosed materials
HORIBA businessdivisions
Emissionsbusiness
MCTbusiness
Driving managementsystems &
drive recorders
Electric Market size(Billions of yen)
40
100
30-
15
10
Gasoline &diesel Hybrid
Drivelines tests
Vehicles, wind tunnel balances, brake tests
Safety and IT
Motor, batterymeasurement
Engine performance tests
Emissions measurement
200
180
160
140
120
100
Sources: HORIBA’s survey based on materials of the Ministry of Economy, Trade and Industry, Ministry of Land, Infrastructure, Transport and Tourism, Japan Automotive Manufacturers Association Inc., and others
* Fuel efficiency amounts of each region are converted in km/L, only for reference. Sources: HORIBA’s survey based on materials of the Ministry of Economy, Trade and Industry, Japan Automotive Manufacturers Association Inc., and others
2005 2010 2015 2020 2025
JapanGasoline
Diesel
2000 2005 2010 2015 2020
U.S.
Europe
China
India
Carbon dioxide (CO2) weighted average (g/km)New short-termregulations
New long-termregulations
Post new long-termregulations
New long-termregulations
Post new long-termregulations
New short-termregulations
Passenger carsSmall commercial vehicles
California
Federal
LEV-II (2004) LEV-II (2009) LEV-III ?
Tier-2 Tier-3?
Euro4
Euro5
Euro6
China 3, China 4
China 5
U.S.
Bharat Stage 2 in Cities
Bharat Stage 3 in Cities
Bharat Stage 4 in Cities Nationwide
Nationwide
Nationwide
Introduced only in Beijing in 2012. Nationwide launch to be determined.
Europe: 24.4km/l* EU’s regulation implementation time schedule from 2016 to 2020 is yet determined.
17.8km/l
Japan: 20.3km/l* Calculated by preliminary target amount
U.S.26.4km/l
Japan
Europe
Next emissionregulation
80% 15%53% 7%
1. Progression of emission standards by region/county 2. Automotive fuel efficiency (CO2 emission) standards of Japan, U.S., and Europe
HORIBA’S automotive business
HORIBA aims to expand sales and improve profit by focusing
investments in driveline measurement systems.
HORIBA's automotive segment sales andmajor automakers' R&D spending
Trend of automobile-related regulations
Note: Market shares quoted are estimates by HORIBA.
Worldmarket share Segment sales World
market share Segment sales
22Annual Report 2012 |
Sales breakdown Net sales and Operating income Sales breakdown by region
Medical-Diagnostic Instruments & Systems
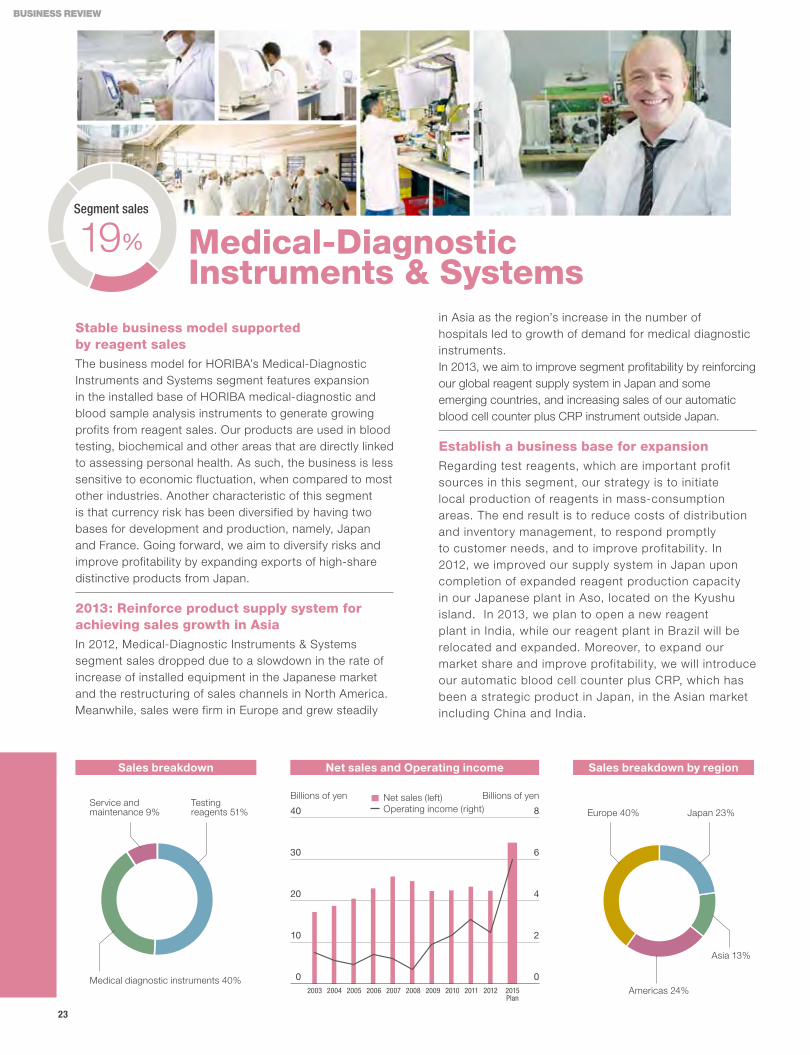
Segment sales
19%
20102009200820072006200520042003 2015Plan
2011 2012
Net sales (left)Operating income (right)
Billions of yen Billions of yenTesting reagents 51%
Medical diagnostic instruments 40%
Service andmaintenance 9% Japan 23%Europe 40%
Asia 13%
Americas 24%
8
6
4
2
0
40
30
20
10
0
Stable business model supportedby reagent salesThe business model for HORIBA’s Medical-Diagnostic Instruments and Systems segment features expansion in the installed base of HORIBA medical-diagnostic and blood sample analysis instruments to generate growing profits from reagent sales. Our products are used in blood testing, biochemical and other areas that are directly linked to assessing personal health. As such, the business is less sensitive to economic fluctuation, when compared to most other industries. Another characteristic of this segment is that currency risk has been diversified by having two bases for development and production, namely, Japan and France. Going forward, we aim to diversify risks and improve profitability by expanding exports of high-share distinctive products from Japan.
2013: Reinforce product supply system for achieving sales growth in AsiaIn 2012, Medical-Diagnostic Instruments & Systems segment sales dropped due to a slowdown in the rate of increase of installed equipment in the Japanese market and the restructuring of sales channels in North America. Meanwhile, sales were firm in Europe and grew steadily
in Asia as the region’s increase in the number of hospitals led to growth of demand for medical diagnostic instruments.In 2013, we aim to improve segment profitability by reinforcing our global reagent supply system in Japan and some emerging countries, and increasing sales of our automatic blood cell counter plus CRP instrument outside Japan.
Establish a business base for expansionRegarding test reagents, which are important profit sources in this segment, our strategy is to initiate local production of reagents in mass-consumption areas. The end result is to reduce costs of distribution and inventory management, to respond promptly to customer needs, and to improve profitability. In 2012, we improved our supply system in Japan upon completion of expanded reagent production capacity in our Japanese plant in Aso, located on the Kyushu island. In 2013, we plan to open a new reagent plant in India, while our reagent plant in Brazil will be relocated and expanded. Moreover, to expand our market share and improve profitability, we will introduce our automatic blood cell counter plus CRP, which has been a strategic product in Japan, in the Asian market including China and India.
23
BUSINESS REVIEW

Major products and market shares
Blood tests are essential for assessing the health of people and animals. These analyzers check red and white blood cell counts as well as hemoglobin concentrations and platelet counts.
8% 100%80% 10%
Expand supply of instruments and reagents in Asia
Instruments• Accelerate sale of our automatic blood cell counter plus CRP, a high market share product in Japan, in China and India • Our operations in France are responsible for medium and large-sized instruments, while Japan produces small-sized instruments.
Reagents• The local reagent supply systems have resulted in cost reductions for distribution and inventory management, thereby improving profitability.
Dispersion of production bases has lessened the impact of currency exchange rate fluctuations and thus protects cost competitiveness.
Establishing product supply systemSales ratio of test reagents in HORIBA’s Medical-Diagnostic Instruments &Systems segment
Test category Clinical chemistry Hematology Immunology Coagulation
Market size ¥1 trillion ¥0.2 trillion ¥1 trillion ¥0.1 trillion
Large hospitalsTesting centers
Hematology analyzer systems — —
Small and medium-sized hospitals Clinical chemistry analyzers
CRP counters forasthma medication Coagulation reagentsPrivate practitioners
Blood glucose measurement systems
Hospital units and surgery rooms (POCT*)
*Point-of-care testing (POCT) is defined as medical testing by a physician at or near the site where patients are located such as a surgery ward, a hospital ward, or a clinic for outpatients.
Business development by testing category
%60
50
40
30
20
10
02009200820072006200520042003 2010 2011 2012
India: New facility
for production (reagents)
Brazil: Expansion of production facilities
(reagents)
Japan:Product
development and production facilities (instruments and
reagents)France: Product
development and production facilities (instruments and
reagents)
The sales ratio of test reagents has been increasing thanks to the increase in the installed base of instruments. The ratio has become stable at around 50-55%.
China: Product
development and production facilities
(reagents)
Automatic Hematology Analyzers
Automatic Blood Cell Counter plus CRP
Note: Market shares quoted are estimates by HORIBA.
Worldmarket share Segment sales World
market share Segment sales
This is the first counter in the world to simultaneously measure blood cell counts and C-Reactive Protein (CRP), which the body produces in response to internal inflammation, thus facilitating faster and more accurate diagnosis.
Hosp
itals
Small and medium-sized hematology
analyzers
Field in which HORIBA exhibits strength
24Annual Report 2012 |

Sales breakdown Net sales and Operating income Sales breakdown by region
SemiconductorInstruments & Systems
Segment sales
15%
Mass flowcontrollers 77%
Wet process monitors 16%
Dry process monitors 5%
Other 2%
Japan 51%
Europe 6%
Asia 30%
Americas 13%
20102009200820072006200520042003 2015Plan
2011 2012
9
6
3
0
30
20
10
0
Net sales (left)Operating income (right)
Billions of yen Billions of yen
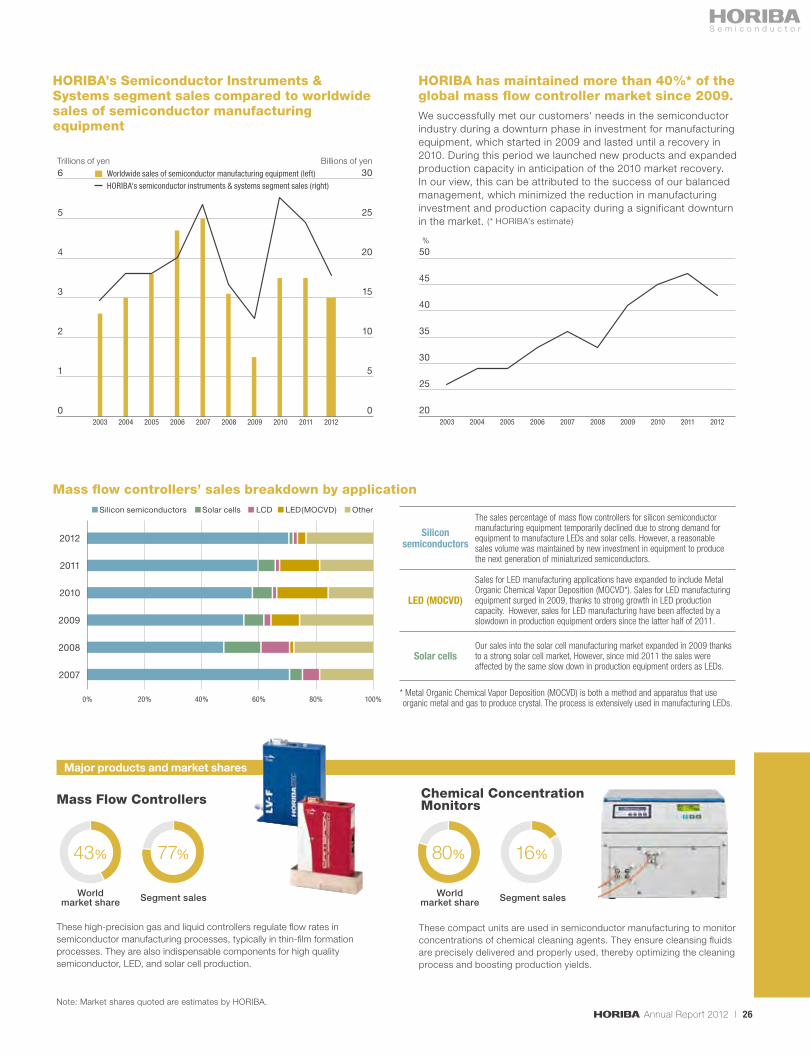
Products that fulfill the needs of new markets and applicationsHORIBA’s Semiconductor Instruments & Systems segment manufactures and markets mass flow controllers, essential components in semiconductor manufacturing equipment, chemical concentration monitors, used in semiconductor wafer cleaning processes, plus other essential instruments for the semiconductor manufacturing industry. In particular, our mass flow controllers have a leading 43%* global semiconductor market share. Those highly functional products satisfy customer requirements for improved productivity and performance enhancements in next-generation miniaturized manufacturing processes.(*HORIBA’s estimate)
2013: Ability to respond to surges in demand thanks to an increase in semiconductor production capacityIn the first half of 2012, mass flow controller sales were very favorable, following the recovery of production orders by makers of equipment for silicon semiconductor manufacturing and related products. In the second half of 2012 sales dropped sharply due to our customers’ downward production adjustment.
In 2013 we expect the low demand will persist for the first six months. Nonetheless, we forecast that the operating income ratio will improve in the second half of 2013 due to a recovery in demand and the appreciation of the yen.
Expansion of sales in Asia, supported by strong trust from global semiconductor makersMuch of HORIBA’s service strength lies in its capability to support customers in Asia. Our strategy is to expand our market share by earning more credibility from manufacturing equipment makers of semiconductors, photovoltaics, and LEDs, and by developing enhanced, quality products that satisfy anticipated customer demand. In addition, we have secured additional production capacity for the Semiconductor Instruments & Systems segment in the Aso plant, which recently completed expanded capacity for the Medical Diagnostic Instruments & Systems segment. We are thus prepared to meet our customers’ high volume delivery requirements during phases of expanding demand for manufacturing equipment. Moreover, we entered into full-scale production of mass flow controllers at Beijing HORIBA METRON Instruments Co., Ltd., a joint venture established in China in 2011. We expect this factory will be well positioned to meet rising demand in Asia.
25
BUSINESS REVIEW
Trillions of yen Billions of yen
200820072006200520042003 20102009 2011 2012
6
5
4
3
2
1
0
30
25
20
15
10
5
0200820072006200520042003 20102009 2011 2012
%50
45
40
35
30
25
20
Worldwide sales of semiconductor manufacturing equipment (left)
HORIBA's semiconductor instruments & systems segment sales (right)
Silicon semiconductors Solar cells LCD LED(MOCVD) Other
2012
2011
2010
2009
2008
2007
0% 20% 40% 60% 80% 100%
Major products and market shares
Mass flow controllers’ sales breakdown by application
43% 80%77% 16%
Silicon semiconductors
The sales percentage of mass flow controllers for silicon semiconductor manufacturing equipment temporarily declined due to strong demand for equipment to manufacture LEDs and solar cells. However, a reasonable sales volume was maintained by new investment in equipment to produce the next generation of miniaturized semiconductors.
LED (MOCVD)
Sales for LED manufacturing applications have expanded to include Metal Organic Chemical Vapor Deposition (MOCVD*). Sales for LED manufacturing equipment surged in 2009, thanks to strong growth in LED production capacity. However, sales for LED manufacturing have been affected by a slowdown in production equipment orders since the latter half of 2011.
Solar cellsOur sales into the solar cell manufacturing market expanded in 2009 thanks to a strong solar cell market, However, since mid 2011 the sales were affected by the same slow down in production equipment orders as LEDs.
* Metal Organic Chemical Vapor Deposition (MOCVD) is both a method and apparatus that use organic metal and gas to produce crystal. The process is extensively used in manufacturing LEDs.
HORIBA’s Semiconductor Instruments & Systems segment sales compared to worldwide sales of semiconductor manufacturing equipment
HORIBA has maintained more than 40%* of the global mass flow controller market since 2009.We successfully met our customers' needs in the semiconductor industry during a downturn phase in investment for manufacturing equipment, which started in 2009 and lasted until a recovery in 2010. During this period we launched new products and expanded production capacity in anticipation of the 2010 market recovery. In our view, this can be attributed to the success of our balanced management, which minimized the reduction in manufacturing investment and production capacity during a significant downturn in the market. (* HORIBA’s estimate)
These high-precision gas and liquid controllers regulate flow rates in semiconductor manufacturing processes, typically in thin-film formation processes. They are also indispensable components for high quality semiconductor, LED, and solar cell production.
These compact units are used in semiconductor manufacturing to monitor concentrations of chemical cleaning agents. They ensure cleansing fluids are precisely delivered and properly used, thereby optimizing the cleaning process and boosting production yields.
Mass Flow Controllers Chemical Concentration Monitors
Note: Market shares quoted are estimates by HORIBA.
Worldmarket share Segment sales World
market share Segment sales
26Annual Report 2012 |
Sales breakdown Net sales and Operating income Sales breakdown by region
Scientific Instruments & Systems
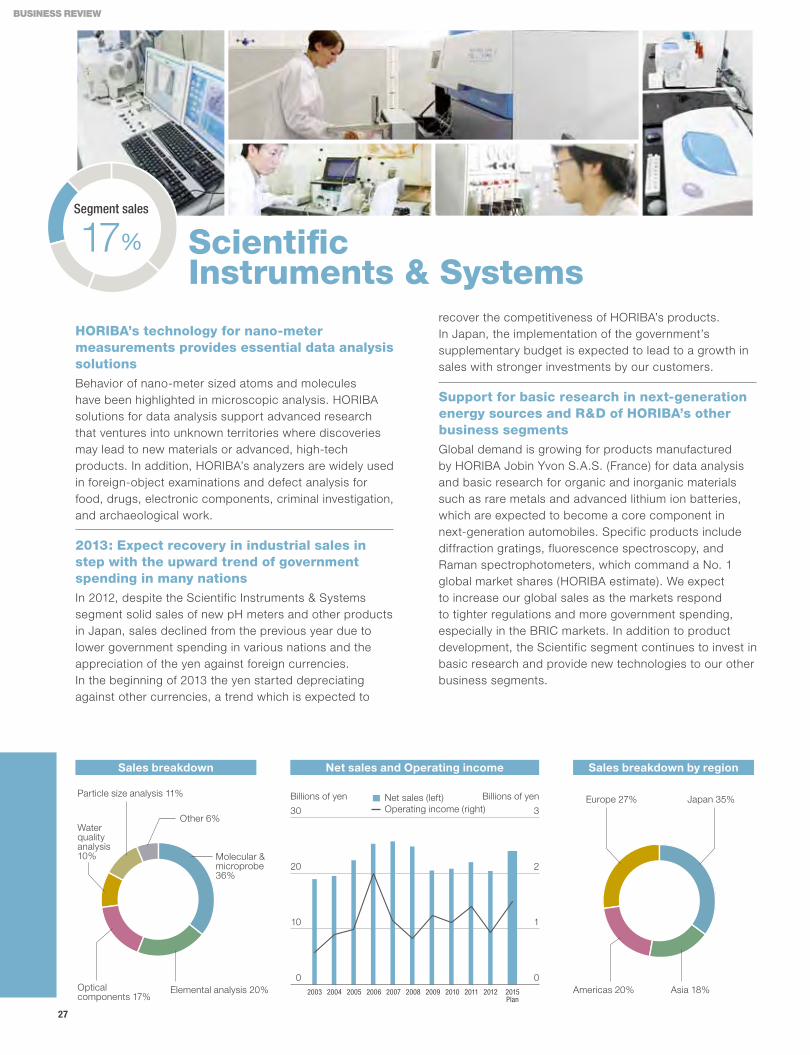
Segment sales
17%
Molecular µprobe 36%
Elemental analysis 20%Opticalcomponents 17%
Waterqualityanalysis 10%
Particle size analysis 11%
Other 6%
Japan 35%Europe 27%
Asia 18%Americas 20%20102009200820072006200520042003 2015Plan
2011 2012
3
2
1
0
30
20
10
0
Net sales (left)Operating income (right)
Billions of yen Billions of yen
HORIBA’s technology for nano-meter measurements provides essential data analysis solutionsBehavior of nano-meter sized atoms and molecules have been highlighted in microscopic analysis. HORIBA solutions for data analysis support advanced research that ventures into unknown territories where discoveries may lead to new materials or advanced, high-tech products. In addition, HORIBA’s analyzers are widely used in foreign-object examinations and defect analysis for food, drugs, electronic components, criminal investigation, and archaeological work.
2013: Expect recovery in industrial sales in step with the upward trend of government spending in many nationsIn 2012, despite the Scientific Instruments & Systems segment solid sales of new pH meters and other products in Japan, sales declined from the previous year due to lower government spending in various nations and the appreciation of the yen against foreign currencies.In the beginning of 2013 the yen started depreciating against other currencies, a trend which is expected to
recover the competitiveness of HORIBA’s products. In Japan, the implementation of the government’s supplementary budget is expected to lead to a growth in sales with stronger investments by our customers.
Support for basic research in next-generation energy sources and R&D of HORIBA’s other business segmentsGlobal demand is growing for products manufactured by HORIBA Jobin Yvon S.A.S. (France) for data analysis and basic research for organic and inorganic materials such as rare metals and advanced lithium ion batteries, which are expected to become a core component in next-generation automobiles. Specific products include diffraction gratings, fluorescence spectroscopy, and Raman spectrophotometers, which command a No. 1 global market shares (HORIBA estimate). We expect to increase our global sales as the markets respond to tighter regulations and more government spending, especially in the BRIC markets. In addition to product development, the Scientific segment continues to invest in basic research and provide new technologies to our other business segments.
27
BUSINESS REVIEW
Majorproducts and market shares
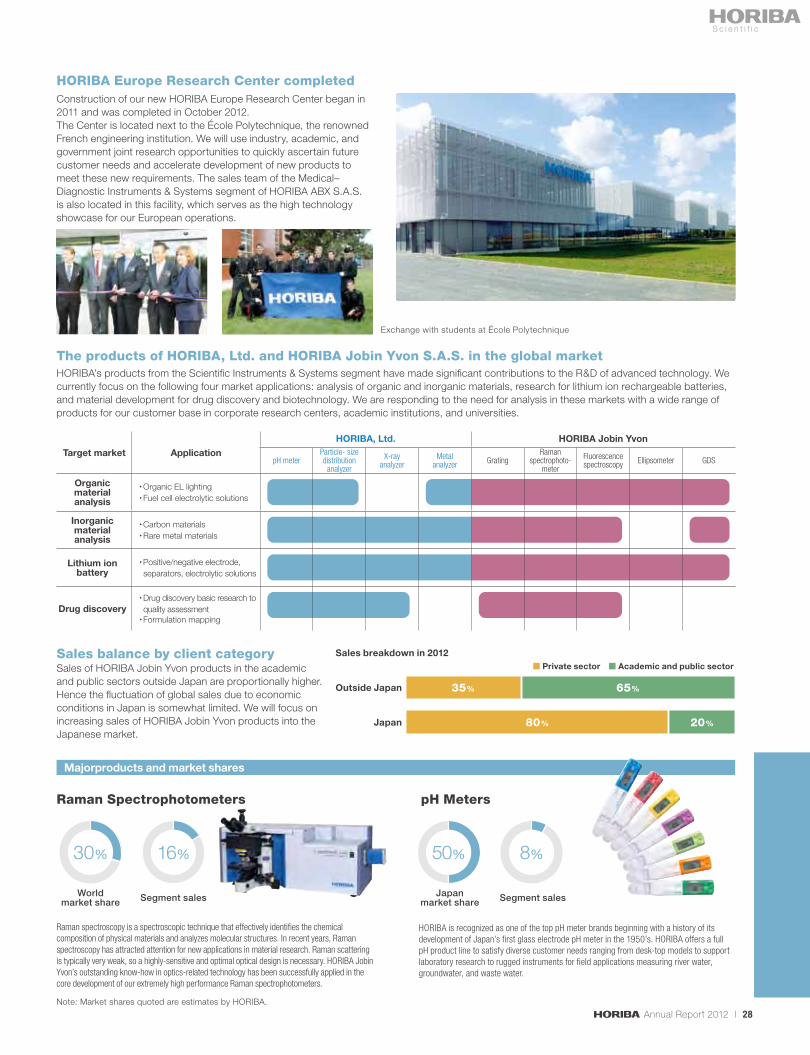
Target market Application
HORIBA, Ltd. HORIBA Jobin Yvon
pH meterParticle- size distribution
analyzer
X-rayanalyzer
Metalanalyzer Grating
Raman spectrophoto-
meter
Fluorescence spectroscopy Ellipsometer GDS
Organic material analysis
• Organic EL lighting• Fuel cell electrolytic solutions
Inorganic material analysis
• Carbon materials• Rare metal materials
Lithium ion battery
• Positive/negative electrode, separators, electrolytic solutions
Drug discovery• Drug discovery basic research to quality assessment
• Formulation mapping
30% 50%16% 8%
Sales of HORIBA Jobin Yvon products in the academic and public sectors outside Japan are proportionally higher. Hence the fluctuation of global sales due to economic conditions in Japan is somewhat limited. We will focus on increasing sales of HORIBA Jobin Yvon products into the Japanese market.
HORIBA Europe Research Center completed
The products of HORIBA, Ltd. and HORIBA Jobin Yvon S.A.S. in the global market
Sales balance by client category■ Private sector ■ Academic and public sector
Japan
Outside Japan 35%
80%
65%
Sales breakdown in 2012
20%
Exchange with students at École Polytechnique
Construction of our new HORIBA Europe Research Center began in 2011 and was completed in October 2012.The Center is located next to the École Polytechnique, the renowned French engineering institution. We will use industry, academic, and government joint research opportunities to quickly ascertain future customer needs and accelerate development of new products to meet these new requirements. The sales team of the Medical–Diagnostic Instruments & Systems segment of HORIBA ABX S.A.S. is also located in this facility, which serves as the high technology showcase for our European operations.
HORIBA’s products from the Scientific Instruments & Systems segment have made significant contributions to the R&D of advanced technology. We currently focus on the following four market applications: analysis of organic and inorganic materials, research for lithium ion rechargeable batteries, and material development for drug discovery and biotechnology. We are responding to the need for analysis in these markets with a wide range of products for our customer base in corporate research centers, academic institutions, and universities.
Raman Spectrophotometers pH Meters
Raman spectroscopy is a spectroscopic technique that effectively identifies the chemical composition of physical materials and analyzes molecular structures. In recent years, Raman spectroscopy has attracted attention for new applications in material research. Raman scattering is typically very weak, so a highly-sensitive and optimal optical design is necessary. HORIBA Jobin Yvon’s outstanding know-how in optics-related technology has been successfully applied in the core development of our extremely high performance Raman spectrophotometers.
HORIBA is recognized as one of the top pH meter brands beginning with a history of its development of Japan’s first glass electrode pH meter in the 1950’s. HORIBA offers a full pH product line to satisfy diverse customer needs ranging from desk-top models to support laboratory research to rugged instruments for field applications measuring river water, groundwater, and waste water.
Note: Market shares quoted are estimates by HORIBA.
Worldmarket share Segment sales Japan
market share Segment sales
28Annual Report 2012 |

Sales breakdown Net sales and Operating income Sales breakdown by region
Process & Environmental
Segment sales
12%
Water qualityanalysis 33%
Other 15%
Air pollutionanalysis 15%
Stack gasanalysis 37%
Japan 68%Europe 12%
Asia 13%
Americas 7%
Net sales (left)Operating income (right)
Billions of yen Billions of yen
20102009200820072006200520042003 2015Plan
2011 2012
4
3
2
1
0
20
15
10
5
0
HORIBA supports global environmental measures and new energy industriesWe provide analytical and measurement instruments for a wide variety of applications to measure air, water, and soil constituents. We supply these instruments to various industries whose work is essential for environmental emission reduction and process monitoring. We play an important role in gas measurement and monitoring of industrial liquid waste in the electric power, steel, and chemical industries as well as energy industries including oil refining, and heavy chemicals; purified water management for medical and semiconductor use; and constant monitoring and control of water quality in the pharmaceutical, food, and cosmetic fields. In addition, HORIBA’s accurate measuring technology helps ensure public safety through environmental radiological measurement, demand for which has expanded since the Great East Japan Earthquake of March 2011.
2013: Focus on demand trends for stack gas analyzers and environmental radiation monitorsIn 2012, demand for environmental radiation monitors gradually declined in Japan after the rapid increase
following the Great East Japan Earthquake, while demand for stack gas analyzers at thermal power plants was firm.In 2013, we are currently forecasting declining profits on higher sales, as demand for environmental radiation monitors is expected to drop further.
Aiming to become global No. 1 in the environmental regulation business and expand in the process measurement fieldHORIBA is determined to grow its market share in the global environmental analytical instrument market, estimated at ¥150 billion, by utilizing its accumulated know-how and experience in Japan, Europe, and the Americas. We also aim to expand our market share in the water quality measurement field, by giving added emphasis to pH measuring technology, a HORIBA's core business since its foundation in the 1950’s. Moreover, we will further develop business by leveraging HORIBA’s expertise in the environmental and analytical instrument markets in Asia and other emerging nations, where demand is projected to grow rapidly. In addition, the process measurement equipment business we recently acquired will be important for our development of business in energy and chemicals.
29
BUSINESS REVIEW

Major products and market shares
50% 20%37% 33%
HORIBA has a leading market share in Japan in continuous emission monitoring systems used in plants and other facilities that generate gaseous emissions and soot. Our instruments have established extensive credibility for the robust application design of their sampling systems, which are essential in continuous measurement of a variety of gases. The analyzers are used to satisfy regulatory requirements or process control needs in system applications for power generation, petrochemicals, steel, paper, foods and pharmaceuticals.
HORIBA’s air pollution analyzers have won high acclaim in the field as highly reliable analyzers that demonstrate excellent precision and long-term stability at ppb* concentrations. They are used in over 50 countries to monitor air quality by municipal governments and industrial companies. Demand has been expanding for PM2.5-related monitoring.
HORIBA‘s products are used for monitoring and control in water treatment processes. We have a wide-ranging water quality product line to measure pH, the basic water quality indicator, as well as chemical oxygen demand (COD), total nitrogen, and total phosphorous. They have been highly evaluated in the water quality analysis field by municipalities and companies in the electric power, gas, petrochemicals, steel, paper, foods, and pharmaceuticals industries.
Acquisition of a process measurement equipment business in North AmericaIn February 2013, HORIBA acquired the process measurement equipment business of Cameron, a Texas-based U.S. company that mainly focuses on products and services for oil and gas drilling and refining.HORIBA has taken over facilities and personnel of the acquired business and will provide a full range of measuring equipment and maintenance service to customers. Through this acquisition, HORIBA aims to enter the process analytical business and realize synergies by integrating the newly acquired process know-how and technologies with HORIBA’s existing expertise. As a result, we are forecasting a six fold growth in combined sales for our Process and Environmental segment sales in the U.S. by 2018.
Stack Gas Analyzers
Air Pollution Analyzers
Water Quality Analyzers
HORIBA’s new facilities integrate gas and liquid measurement devices used for processing of petroleum, ethylene, and other products. The acquired business markets turn-key packages and systems coupled with maintenance and service contracts.
*ppb: parts per billion. One part per billion denotes one part per 1,000,000,000 parts. This notation is mainly used for describing small concentration measurement.
Target market: Environmental regulation market
These analyzers provide highly sensitive and precise measurements of NOx, SO2, CO, CO2, and O2 constituents in gases emitted by boilers and furnaces in thermal power stations and refuse incineration facilities. A single unit can simultaneously and continuously measure all five gases. HORIBA has a leading market share in this competitive market with over 50 competitors.
The H-1 industrial water quality analyzers perform in a wide range of applications from pure water for semiconductor and food to water treatment to sewage and industrial wastewater. They confirm progress in wastewater treatment processes and control water treatment equipment. Moreover, we have developed pH electrodes that resist damage in harsh environments by strengthening their toughness, thereby reducing the frequency of electrode replacement and maintenance operations. In overseas markets where competition is intense, we will be unifying these products with HORIBA Advanced Techno’s brand of water quality analyzers to enhance customer satisfaction while utilizing the strengths of HORIBA, Ltd.
Stack Gas Analyzers
Japanmarket share Segment sales Japan
market share Segment sales
Note: Market shares quoted are estimates by HORIBA.
H-1 series of industrialwater quality analyzers
30Annual Report 2012 |
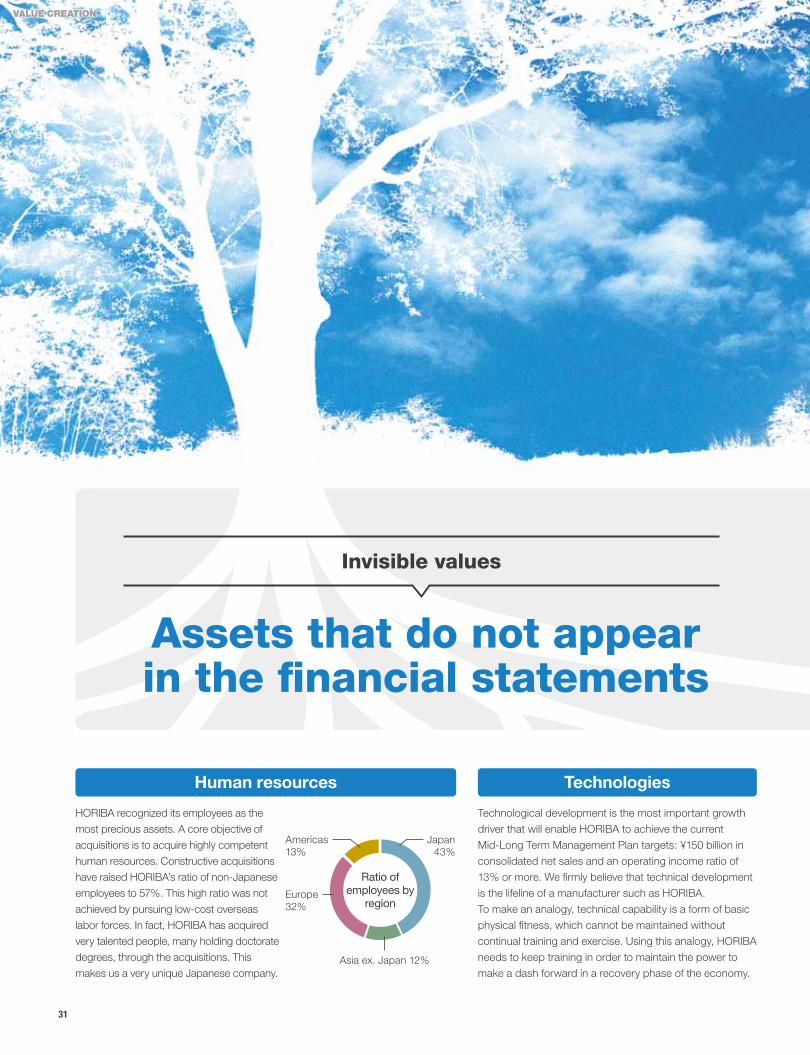
Invisible values
Human resources
HORIBA recognized its employees as the
most precious assets. A core objective of
acquisitions is to acquire highly competent
human resources. Constructive acquisitions
have raised HORIBA’s ratio of non-Japanese
employees to 57%. This high ratio was not
achieved by pursuing low-cost overseas
labor forces. In fact, HORIBA has acquired
very talented people, many holding doctorate
degrees, through the acquisitions. This
makes us a very unique Japanese company.
Technologies
Technological development is the most important growth
driver that will enable HORIBA to achieve the current
Mid-Long Term Management Plan targets: ¥150 billion in
consolidated net sales and an operating income ratio of
13% or more. We firmly believe that technical development
is the lifeline of a manufacturer such as HORIBA.
To make an analogy, technical capability is a form of basic
physical fitness, which cannot be maintained without
continual training and exercise. Using this analogy, HORIBA
needs to keep training in order to maintain the power to
make a dash forward in a recovery phase of the economy.
Ratio ofemployees by
region
Americas 13%
Europe 32%
Asia ex. Japan 12%
Japan 43%
Assets that do not appear in the financial statements
31
VALUE CREATION

Creating value by using our “Invisible values” is one of HORIBA’s important management philosophies.
The fruit (earnings) and the trunk with branches and leaves (the balance sheet), are both visible and important values. However, we believe that the essence of good management is to grow strong thick roots (invisible values) in rich soil (corporate culture).We do not believe that a management’s emphasis on maximizing short-term earnings and neglecting investment in invisible values will foster sustainable growth or increased corporate value.
The number of fruit and the value ofthe harvest are important,but it is more important that the roots are growing strong.
Rationale ofinvisible values
Customers
HORIBA helps improve people’s
quality of life in a sustainable society
by supplying products and providing
services to customers. We think it is
important to provide solutions in addition
to supplying hardware (instruments). In
order to achieve this goal, we collaborate
with suppliers and group companies
in Japan and overseas to improve the
quality of our products and services.
Brands
HORIBA works on growing Invisible
Values in human resources, technologies,
and its corporate culture. Invisible Values
are essential in generating future earnings
and enabling enterprise continuity, while
achieving numerical targets for net sales,
profits, and other indicators.
We believe that these efforts are
reflected in raising the value of the
HORIBA brands.
Organizational structures
HORIBA operates five businesses in 27
countries. We believe it is important that our
competent employees in each business and
each region take the initiative in promoting
their business and that we have the cohesive
power to sustain HORIBA as an integrated
group. With that aim, we are spreading our
“Joy and Fun” corporate culture into our
global groupwide operation and promoting
“One Company Matrix Management.”
32Annual Report 2012 |

Without being swayed by economic upturns and downturns HORIBA has consistently invested in
human resources, which are precious “invisible values” of the company.
The foundation for sustainable value creation is the understanding each HORIBA employee has of
our corporate motto “Joy and Fun” and corporate culture that is symbolized by “Open and Fair”
and “entrepreneurial spirit”, and puts this heritage into practice in his or in her role.
We have established a global personnel development and exchange program for all our employees.
Value Creation Based on Invisible Values
33
VALUE CREATION

Human Resources
Global Strategy/Budget Meetings were attended by participants in as many as 11 countries in 2012.
Japan
South Korea
China
Thailand
Singapore
India
U.S.
Brazil
U.K.
France
Germany
Global Strategy/Budget Meeting Participants
Non-japanese participants (left) Japanese participants (left)Participating countries (right)
200
160
120
80
40
0
20
16
12
8
4
0
Number of participants Countries
2005 2006 2007 2008 2009 2010 2011 2012
HORIBA COLLEGEThe HORIBA COLLEGE hosted 21 courses for around 430 attendees in 2012 at the training center called “FUN HOUSE”. Since its opening in february 2009, the number of courses has reached about 100 and the total number of attendees is almost equal to the number of employees based in japan. Our employees teach and learn from each other. Our ultimate objective is to ensure that
HORIBA’s know-how and skills that have been accumulated over 60 years will be inherited by the next generation. Our belief is that the expert knowledge and experience directly linked to our business operations should be maintained by sharing them within the group. Implanting HORIBA’s corporate culture at the same time leads to the effective development of high-quality personnel.
GLOBAL Strategy/Budget MEETINGHORIBA holds Global Strategy/Budget Meetings, where group companies’ management and executives get together to discuss business strategies, budget, and various other matters in English. It is held twice a year since 15 years ago with the aim of facilitating smooth global business execution. We believe that face-to-face communication is critical in sharing management issues
among group companies globally and accelerating the speed of decision making.
34Annual Report 2012 |
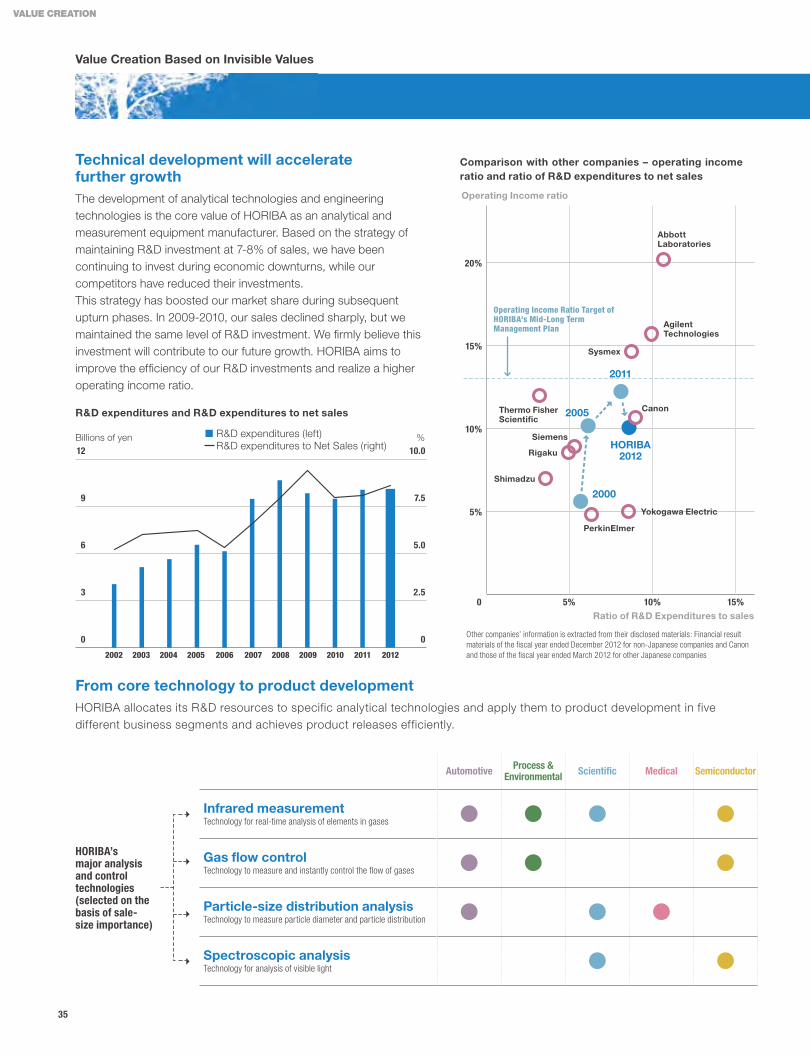
R&D expenditures and R&D expenditures to net sales
Comparison with other companies – operating income ratio and ratio of R&D expenditures to net sales
Operating Income ratio
Ratio of R&D Expenditures to sales
Other companies’ information is extracted from their disclosed materials: Financial result materials of the fiscal year ended December 2012 for non-Japanese companies and Canon and those of the fiscal year ended March 2012 for other Japanese companies
Automotive Process & Environmental Scientific Medical Semiconductor
Infrared measurementTechnology for real-time analysis of elements in gases ● ● ● ●
Gas flow controlTechnology to measure and instantly control the flow of gases ● ● ●
Particle-size distribution analysisTechnology to measure particle diameter and particle distribution ● ● ●
Spectroscopic analysisTechnology for analysis of visible light ● ●
HORIBA’s major analysis and control technologies (selected on the basis of sale-size importance)
20%
15%
10%
5%
15%10%5%0
Shimadzu
Siemens
Thermo Fisher Scientific
PerkinElmer
Rigaku
Yokogawa Electric
Canon
Agilent Technologies
Sysmex
Abbott Laboratories
HORIBA2012
2005
2011
2000
12
9
6
3
0
10.0
7.5
5.0
2.5
0
Billions of yen %
2002 2003 2004 2005 2006 2007 2008 2009 2010 2011 2012
R&D expenditures (left) R&D expenditures to Net Sales (right)
Value Creation Based on Invisible Values
Technical development will acceleratefurther growthThe development of analytical technologies and engineering technologies is the core value of HORIBA as an analytical and measurement equipment manufacturer. Based on the strategy of maintaining R&D investment at 7-8% of sales, we have been continuing to invest during economic downturns, while our competitors have reduced their investments.This strategy has boosted our market share during subsequent upturn phases. In 2009-2010, our sales declined sharply, but we maintained the same level of R&D investment. We firmly believe this investment will contribute to our future growth. HORIBA aims to improve the efficiency of our R&D investments and realize a higher operating income ratio.
Operating Income Ratio Target ofHORIBA's Mid-Long Term Management Plan
From core technology to product developmentHORIBA allocates its R&D resources to specific analytical technologies and apply them to product development in five different business segments and achieves product releases efficiently.
35
VALUE CREATION

Breakdown of contributors to readout No. 39 issue
HORIBA’s non-japanese personnel
74%
HORIBA’sjapanese personnel2%
Outsideresearchers24%
“READOUT” is a technical journal issued by HORIBA since 1990. The name "READOUT" represents our sincere desire to offer whatever the necessary information to read because we would like to have our company's proprietary products and technologies well understood. The journal is issued both in English and in Japanese and is widely distributed to variety of people overseas including customers.
HORIBA's technical journal “READOUT”
Cover of Readout No. 40 issue
Contents of Readout No. 39 issue
Technology
HORIBA's technical journal “READOUT,” which has been issued since 1990, publishes variety of technical information and messages globally. Mr. Atsushi Horiba, current president, contributed an article to No. 2 issue in 1991 entitled “Global R&D.” “READOUT” featured Asia in 2010, America in 2011, and Europe, the largest base of the HORIBA Group, in 2012 with the No. 39 issue.
These three were originally edited and issued in English. For example, over 70% of technical research papers and articles in the No. 39 issue were written by HORIBA’s overseas personnel and over 20% were contributed by our customers in Europe or professors who are engaged in joint research with us. Having global R&D bases which are capable of such publication is one of HORIBA’s strengths.
HORIBA, Ltd. implemented an organizational change in 2011, and has been strengthening a function-based across-the-segment R&D activities under a newly-established R&D Division. As the next step, we are focusing on improving the global headquarters’ functions of our entire global R&D
Aiming for management of global development and services
activities. Being strongly oriented towards organic integration with our overseas acquisitions, HORIBA sees its technical capabilities extending around the world as a set of values that is not limited to a region or a business domain. The ultimate goal is to enhance the efficiency of HORIBA’s global technical assets. We take full advantage of our global collaboration in technology development. This is one of the keys for our growth.
The latest No. 40 issue The latest No. 40 issue focuses on analytical and measurement applications. In order to raise profitability, HORIBA finds it important to make proposals to customers about what kinds of analysis and measurement can be performed by using hardware, rather than simply selling equipment (hardware). This essentially means being a “solution provider”. From this perspective, the latest issue introduces what kinds of analysis and measurement can be conducted with HORIBA’s various analytical systems and how they can contribute to technological innovation.
36Annual Report 2012 |

Number of board directors and corporate officers
20131997
Corporate Governance
Corporate governance philosophyHORIBA fully recognizes the importance of its shareholders as the company’s owners. Since the 1950’s, when Japanese companies paid little attention to corporate governance, HORIBA has pledged to conduct its corporate affairs by the following policies which focus on our responsibility to the company’s owners.
Directors: 5 (including 1 outside members)
Corporate officers: 18 (including 3 non-Japanese)Directors: 9 (including 2 outside members)
(As of April 1, 2013)
Board of directors and auditors
Chairman, President & CEO Atsushi Horiba
Executive Vice President Dr. Kozo Ishida
Executive Vice President Juichi Saito
Managing Director Fumitoshi Sato
Director (Outside) Masahiro Sugita Auditor of MSD K.K. Auditor of The 77 Bank, Ltd.
Auditor Toshihiko Uno
Auditor (Outside) Kanji Ishizumi President of the Law offices ofChiyoda Kokusai, Attoney at Law
Auditor (Outside) Keisuke Ishida Chairman of the Board, CEO, Shashin Kagaku Co., Ltd.Chairman of the Board, SK-Electronics Co., Ltd.
Corporate officer
Executive Corporate Officer Dr. Jai Hakhu
Senior Corporate Officer Dr. Michel Mariton
Dr. Masayuki Adachi
Sunao Kikkawa
Takashi Nagano
Dr. Kiyoaki Hara
Corporate Officer Hideyuki Koishi
Bertrand de Castelnau
Yuichi Muroga
Atsushi Nakamine
Junior Corporate Officer Seiji Usui
Hiroshi Kawamura
Narihiro Oku
Tadao Nakamura
Tsukasa Satake
Yasuo Yamashita
Kenichi Obori
Hideyuki Nishibun
Appointment of outside directors andcorporate auditor To avoid managing with an introverted approach, HORIBA has always appointed directors and corporate auditors from outside the company. This practice started with the company’s origin in 1953 and has been continued through to the present day.
Implementing shareholder return linked toearnings growthHORIBA was the first listed Japanese company to start paying shareholder dividends based on a predetermined payout ratio in 1974 when the company was listed in the Second Section of the Tokyo Stock Exchange. From 2013, we will change the base amount of profit returns to shareholders from 30% of nonconsolidated net income to 30% of consolidated net income combined with the amount of dividend payments and share buybacks, so that shareholder returns are more directly linked to consolidated performance.
Open general meetings of shareholdersSince its initial stock listing in the Second Section of the Osaka Securities Exchange in 1971, HORIBA has encouraged all shareholders (whom we frequently call owners) to attend the annual General Shareholders Meeting. These meetings are held on Saturdays to facilitate public attendance. An
informal get-together event is held afterwards to enable shareholders to talk directly with the management.
Adoption of a corporate officer systemSince 2005, HORIBA has decreased the number of directors to five members to prevent the Board of Directors meetings from becoming inflexible and to promote lively, in-depth discussion. In addition, we introduced a corporate officer system in 1998 to augment managerial capability. At present, HORIBA has 18 corporate officers including three non-Japanese. One of them is Dr. Jai Hakhu, who joined HORIBA in 2010 and now serves as a head of HORIBA’s U.S. operation.
37
CORPORATE GOVERNANCE
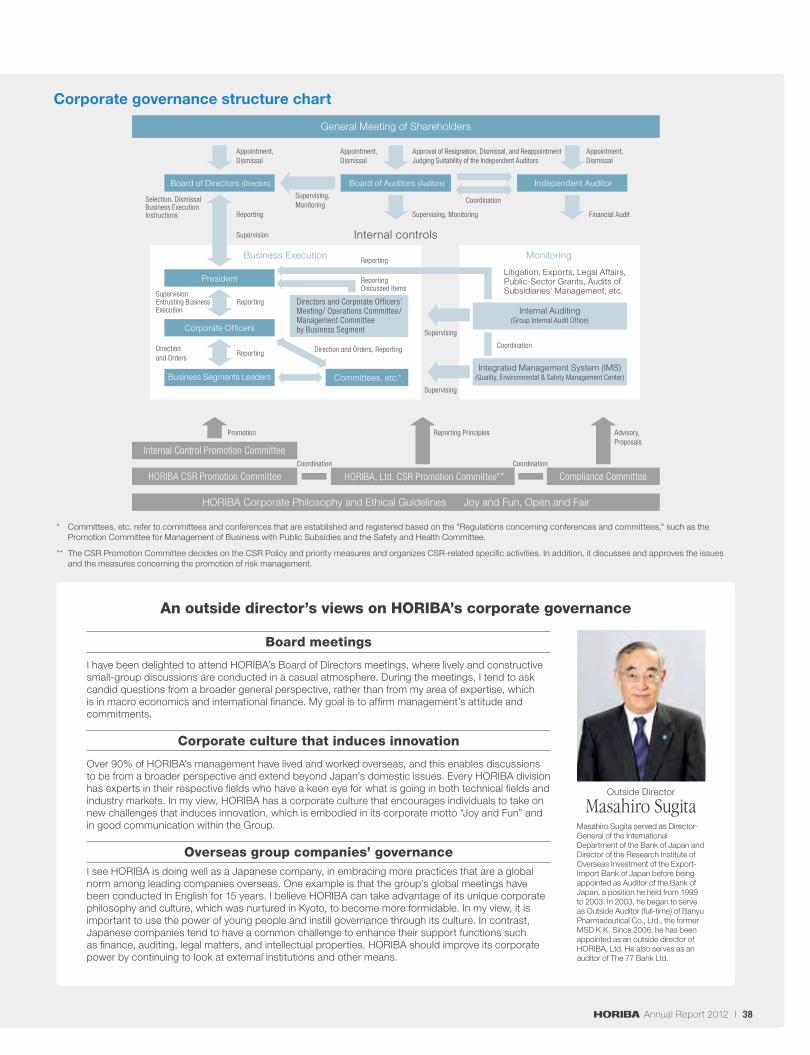
Board meetings
I have been delighted to attend HORIBA’s Board of Directors meetings, where lively and constructive small-group discussions are conducted in a casual atmosphere. During the meetings, I tend to ask candid questions from a broader general perspective, rather than from my area of expertise, which is in macro economics and international finance. My goal is to affirm management’s attitude and commitments.
Corporate culture that induces innovation
Over 90% of HORIBA’s management have lived and worked overseas, and this enables discussions to be from a broader perspective and extend beyond Japan’s domestic issues. Every HORIBA division has experts in their respective fields who have a keen eye for what is going in both technical fields and industry markets. In my view, HORIBA has a corporate culture that encourages individuals to take on new challenges that induces innovation, which is embodied in its corporate motto “Joy and Fun” and in good communication within the Group.
Overseas group companies’ governanceI see HORIBA is doing well as a Japanese company, in embracing more practices that are a global norm among leading companies overseas. One example is that the group’s global meetings have been conducted in English for 15 years. I believe HORIBA can take advantage of its unique corporate philosophy and culture, which was nurtured in Kyoto, to become more formidable. In my view, it is important to use the power of young people and instill governance through its culture. In contrast, Japanese companies tend to have a common challenge to enhance their support functions such as finance, auditing, legal matters, and intellectual properties. HORIBA should improve its corporate power by continuing to look at external institutions and other means.
Masahiro Sugita served as Director-General of the International Department of the Bank of Japan and Director of the Research Institute of Overseas Investment of the Export-Import Bank of Japan before being appointed as Auditor of the Bank of Japan, a position he held from 1999 to 2003. In 2003, he began to serve as Outside Auditor (full-time) of Banyu Pharmaceutical Co., Ltd., the former MSD K.K. Since 2006, he has been appointed as an outside director of HORIBA, Ltd. He also serves as an auditor of The 77 Bank Ltd.
Outside Director
Masahiro Sugita
* Committees, etc. refer to committees and conferences that are established and registered based on the "Regulations concerning conferences and committees," such as the Promotion Committee for Management of Business with Public Subsidies and the Safety and Health Committee.
** The CSR Promotion Committee decides on the CSR Policy and priority measures and organizes CSR-related specific activities. In addition, it discusses and approves the issues and the measures concerning the promotion of risk management.
Corporate governance structure chart
An outside director’s views on HORIBA’s corporate governance
Board of Directors (Directors) Board of Auditors (Auditors) Independent Auditor
President
Corporate Officers
Business Segments Leaders Committees, etc.*
Internal Control Promotion Committee
HORIBA CSR Promotion Committee HORIBA, Ltd. CSR Promotion Committee** Compliance Committee
Directors and Corporate Officers’Meeting/ Operations Committee/Management Committeeby Business Segment
Business Execution Monitoring
Internal controls
General Meeting of Shareholders
Litigation, Exports, Legal Affairs,Public-Sector Grants, Audits ofSubsidiaries' Management, etc.
HORIBA Corporate Philosophy and Ethical Guidelines Joy and Fun, Open and Fair
Internal Auditing(Group Internal Audit Office)
Integrated Management System (IMS)(Quality, Environmental & Safety Management Center)
Appointment,Dismissal
Coordination
Appointment,Dismissal
Supervising,Monitoring
Supervising, Monitoring Financial Audit
Supervision
Reporting
Supervising
Supervising
Coordination
CoordinationCoordination
Reporting PrinciplesPromotion Advisory,Proposals
ReportingDiscussed Items
Reporting
Reporting
ReportingDirectionand Orders
Approval of Resignation, Dismissal, and ReappointmentJudging Suitability of the Independent Auditors
Selection, DismissalBusiness ExecutionInstructions
SupervisionEntrusting BusinessExecution
Direction and Orders, Reporting
Appointment,Dismissal
38Annual Report 2012 |
HORIBA Gaiareport
Gaiareport 2012
Website
CSR
Please visit our website for details.
http://www.horiba.com/gaiareport/
Corporate social responsibility (CSR) policy“Promoting CSR through operations”
HORIBA’s products, supplied by its five business segments, are intimately linked with key challenging issues of our times: energy, human health, global environment, and public safety. With a sense of pride, we will support products and technologies that contribute to building a sustainable society and improving the people’s quality of life. This is the essence of HORIBA’s CSR activities.
HORIBA Group CSR policy
HORIBA helps realize a pleasant and happy society by promoting corporate activities based on the key issues of the global environment, human health, public safety and energy.
CSR promotion committeeHORIBA established the HORIBA Group CSR Promotion Committee in April 2005 in order to promote group-wide CSR activities. The committee, which is chaired by Dr. Kozo Ishida, Executive Vice President of HORIBA, Ltd., and participated in by four directors in charge of CSR from the four group companies in Japan, decides on the CSR policy and priority measures. Each of the group companies has its own CSR Promotion Committee where the policy and measures decided by the HORIBA Group CSR Promotion Committee are reported, and HORIBA’s social contributions concerning education, the environment, local communities, and other areas are put together and reported.
Promote CSR through operations
Top issues for 2012
Realize HORIBA PREMIUM from the perspective of CSR
1. Enhance communication with stakeholders2. Achieve IMS* targets3. Adhere to compliance
* IMS (Integrated Management System):This is a unique service program established by the Japan Quality Assurance Organization (JQA). Various management system standards such as quality (ISO9001), the environment (ISO14001), health and safety (OHSAS18001), and medical (ISO13485) standards, are integrated and JQA assesses how effectively the system is managed within the organization.
HORIBA PREMIUM– Create First Class Value
CSR Report: Gaiareport
HORIBA publishes the "Gaiareport" as an annual environmental and corporate social responsibility report. Since 2009, the report has been comprised of two parts: a booklet and a Web version. Various statistical data concerning compliance, environmental burden, and other information are disclosed on the web, in order to facilitate the search function. The booklet features select topics and is compact and easier to read, resulting in a significant reduction in paper volume.
39
CSR
FINANCIAL DATAYear Ended December 31, 2012
40Annual Report 2012 |

2003.3 2004.3 2005.3 2006.3 2006.12 2007.12 2008.12 2009.12 2010.12 2011.12 2012.12 2012.12
For the Year Millions of yen Thousands of U.S. dollars (Note 1)
Net sales ¥78,501 ¥85,073 ¥92,492 ¥105,665 ¥116,099 ¥144,283 ¥134,248 ¥104,538 ¥118,556 ¥123,456 ¥117,609 $1,358,385Operating costs and expenses 73,027 78,223 83,119 94,390 104,392 127,753 123,290 99,394 106,256 108,549 105,857 1,222,649Operating income 5,474 6,850 9,373 11,275 11,707 16,530 10,958 5,144 12,299 14,906 11,751 135,724Net income 786 2,074 3,524 6,473 6,510 8,691 6,039 3,161 7,927 8,664 7,396 85,423Capital expenditures 3,444 3,501 3,956 5,664 5,059 9,336 6,645 4,534 4,033 4,670 7,882 91,037Depreciation and amortization 2,915 3,037 2,944 3,173 3,246 4,161 4,955 4,573 4,523 4,146 3,743 43,231Research and development expenses 4,044 5,129 5,636 6,553 6,136 9,474 10,662 9,831 9,480 10,060 10,092 116,562
At Year-End Millions of yen Thousands of U.S. dollars (Note 1)
Total assets ¥100,542 ¥92,657 ¥99,913 ¥119,976 ¥129,236 ¥154,367 ¥133,279 ¥129,580 ¥137,290 ¥144,649 ¥153,836 $1,776,807Cash and cash equivalents 22,061 13,603 16,108 14,884 15,673 20,565 22,660 27,590 34,459 35,767 38,858 448,810
Trade notes andaccounts receivable
Affiliated companies - - - - - - 63 6 1 126 4 46Other 29,594 29,143 30,595 37,408 42,485 45,873 37,330 34,505 36,425 39,249 37,516 433,310
Inventories 18,336 19,402 22,012 27,273 30,947 33,734 29,802 23,363 24,843 26,288 28,101 324,566Property, plant and equipment, net 19,000 18,841 18,481 20,223 21,700 24,071 23,115 23,602 22,516 22,924 28,179 325,467
Trade notes andaccounts payable
Affiliated companies 51 58 26 45 44 53 40 52 60 0 21 242Other 9,147 8,700 11,264 13,017 14,917 16,792 11,063 10,515 13,423 13,196 11,807 136,370
Liabilities with interest 33,218 21,460 16,042 13,866 16,224 25,177 20,984 18,348 17,128 18,358 18,083 208,858Shareholders’ equity 40,144 43,348 52,263 65,446 72,371 80,377 76,829 79,906 84,019 90,232 99,248 1,146,315Share price at end of fiscal period (¥) 765 1,380 1,950 3,690 4,400 4,100 1,237 2,250 2,303 2,320 2,489 U.S. dollars (Note 1) 28.74Number of employees (consolidated) 3,691 3,808 3,984 4,461 4,697 4,976 5,146 5,133 5,202 5,448 5,530
Per Share Information Yen (Notes 2, 3, 4) U.S. dollars (Note 1)
Net income - basic ¥22.21 ¥62.90 ¥98.33 ¥154.27 ¥154.23 ¥205.01 ¥142.76 ¥74.77 ¥187.46 ¥204.88 ¥174.87 $2.01Net income - diluted 18.31 50.10 83.81 146.97 153.70 204.39 142.71 74.68 187.11 204.41 174.37 2.01Net assets 1,293.30 1,350.31 1,415.75 1,548.08 1,710.75 1,892.64 1,816.96 1,889.58 1,986.77 2,133.44 2,346.45 27.10Cash dividends 14.50 10.00 16.00 28.00 26.00 39.00 44.00 13.00 17.00 40.00 50.00 0.57
Financial Ratios
Operating income to net sales (%) 7.0 8.1 10.1 10.7 10.1 11.5 8.2 4.9 10.4 12.1 10.0Return on assets (%) 0.8 2.2 3.7 5.9 5.2 6.1 4.2 2.4 5.9 6.1 5.0Return on equity (%) 2.0 5.0 7.4 11.0 9.4 11.4 7.7 4.0 9.7 9.9 7.8Shareholders' equity ratio (%) 39.9 46.8 52.3 54.6 56.0 52.1 57.6 61.7 61.2 62.4 64.5Consolidated dividend payout ratio (%) 57.2 15.3 16.5 18.1 16.9 19.0 30.8 17.4 9.1 19.5 28.6Nonconsolidated dividend payout ratio (%) 40.8 30.3 41.8 33.8 30.0 30.1 30.0 30.0 30.3 30.5 37.5
Eleven-Year Summary
Notes: The stated amounts are rounded down to the nearest million yen from the year, ended December 31, 2009, but are rounded (up or down) to the nearest million yen prior to that year.
1. The U.S. dollar amounts are provided solely for convenience at the rate of ¥86.58 to US$1.00, the rate prevailing on December 31, 2012.
2. Effective from the year ended March 20, 2003, HORIBA adopted the revised accounting standard for per share information. The amounts in prior years have not been restated.
3. Effective from the year ended December 31, 2006, HORIBA adopted the revised accounting standard for presentation of net assets in the balance sheet. The amounts in prior years have not been restated.
4. For the year ended December 31, 2006, the accounting term for HORIBA, Ltd. and HORIBA Advanced Techno Co., Ltd. was only 9 months and 11 days and that for HORIBA STEC Co., Ltd. was only 9 months as a result of a change in the fiscal year-end to December 31.
41
FINANCIAL DATA

2003.3 2004.3 2005.3 2006.3 2006.12 2007.12 2008.12 2009.12 2010.12 2011.12 2012.12 2012.12
For the Year Millions of yen Thousands of U.S. dollars (Note 1)
Net sales ¥78,501 ¥85,073 ¥92,492 ¥105,665 ¥116,099 ¥144,283 ¥134,248 ¥104,538 ¥118,556 ¥123,456 ¥117,609 $1,358,385Operating costs and expenses 73,027 78,223 83,119 94,390 104,392 127,753 123,290 99,394 106,256 108,549 105,857 1,222,649Operating income 5,474 6,850 9,373 11,275 11,707 16,530 10,958 5,144 12,299 14,906 11,751 135,724Net income 786 2,074 3,524 6,473 6,510 8,691 6,039 3,161 7,927 8,664 7,396 85,423Capital expenditures 3,444 3,501 3,956 5,664 5,059 9,336 6,645 4,534 4,033 4,670 7,882 91,037Depreciation and amortization 2,915 3,037 2,944 3,173 3,246 4,161 4,955 4,573 4,523 4,146 3,743 43,231Research and development expenses 4,044 5,129 5,636 6,553 6,136 9,474 10,662 9,831 9,480 10,060 10,092 116,562
At Year-End Millions of yen Thousands of U.S. dollars (Note 1)
Total assets ¥100,542 ¥92,657 ¥99,913 ¥119,976 ¥129,236 ¥154,367 ¥133,279 ¥129,580 ¥137,290 ¥144,649 ¥153,836 $1,776,807Cash and cash equivalents 22,061 13,603 16,108 14,884 15,673 20,565 22,660 27,590 34,459 35,767 38,858 448,810
Trade notes andaccounts receivable
Affiliated companies - - - - - - 63 6 1 126 4 46Other 29,594 29,143 30,595 37,408 42,485 45,873 37,330 34,505 36,425 39,249 37,516 433,310
Inventories 18,336 19,402 22,012 27,273 30,947 33,734 29,802 23,363 24,843 26,288 28,101 324,566Property, plant and equipment, net 19,000 18,841 18,481 20,223 21,700 24,071 23,115 23,602 22,516 22,924 28,179 325,467
Trade notes andaccounts payable
Affiliated companies 51 58 26 45 44 53 40 52 60 0 21 242Other 9,147 8,700 11,264 13,017 14,917 16,792 11,063 10,515 13,423 13,196 11,807 136,370
Liabilities with interest 33,218 21,460 16,042 13,866 16,224 25,177 20,984 18,348 17,128 18,358 18,083 208,858Shareholders’ equity 40,144 43,348 52,263 65,446 72,371 80,377 76,829 79,906 84,019 90,232 99,248 1,146,315Share price at end of fiscal period (¥) 765 1,380 1,950 3,690 4,400 4,100 1,237 2,250 2,303 2,320 2,489 U.S. dollars (Note 1) 28.74Number of employees (consolidated) 3,691 3,808 3,984 4,461 4,697 4,976 5,146 5,133 5,202 5,448 5,530
Per Share Information Yen (Notes 2, 3, 4) U.S. dollars (Note 1)
Net income - basic ¥22.21 ¥62.90 ¥98.33 ¥154.27 ¥154.23 ¥205.01 ¥142.76 ¥74.77 ¥187.46 ¥204.88 ¥174.87 $2.01Net income - diluted 18.31 50.10 83.81 146.97 153.70 204.39 142.71 74.68 187.11 204.41 174.37 2.01Net assets 1,293.30 1,350.31 1,415.75 1,548.08 1,710.75 1,892.64 1,816.96 1,889.58 1,986.77 2,133.44 2,346.45 27.10Cash dividends 14.50 10.00 16.00 28.00 26.00 39.00 44.00 13.00 17.00 40.00 50.00 0.57
Financial Ratios
Operating income to net sales (%) 7.0 8.1 10.1 10.7 10.1 11.5 8.2 4.9 10.4 12.1 10.0Return on assets (%) 0.8 2.2 3.7 5.9 5.2 6.1 4.2 2.4 5.9 6.1 5.0Return on equity (%) 2.0 5.0 7.4 11.0 9.4 11.4 7.7 4.0 9.7 9.9 7.8Shareholders' equity ratio (%) 39.9 46.8 52.3 54.6 56.0 52.1 57.6 61.7 61.2 62.4 64.5Consolidated dividend payout ratio (%) 57.2 15.3 16.5 18.1 16.9 19.0 30.8 17.4 9.1 19.5 28.6Nonconsolidated dividend payout ratio (%) 40.8 30.3 41.8 33.8 30.0 30.1 30.0 30.0 30.3 30.5 37.5
HORIBA, Ltd. and Consolidated Subsidiaries
The years ended March 20, 2003 - 2006 and the years ended December 31, 2006 - 2012.
Computations:Shareholders’ equity = net assets - subscription rights to shares - minority interestsNet income per share (¥) = 100 x (net income – projected bonuses to directors and corporate auditors)* / (average number of shares issued and outstanding in the fiscal period, corrected for treasury stock)Net assets per share (¥) = 100 X (Shareholders’ equity – projected bonuses to directors and corporate auditors)* / (number of shares issued and outstanding, corrected for treasury stock)Operating income to net sales (%) = 100 x operating income / net salesReturn on assets (ROA, %) = 100 x net income / average total assets in prior fiscal periodReturn on equity (ROE, %) = 100 x net income / average shareholders’ equity in prior fiscal periodShareholders’ equity ratio (%) = 100 x shareholders’ equity / total assetsConsolidated dividend payout ratio (%) = 100 x dividends paid / net income (consolidated)Nonconsolidated dividend payout ratio (%) = 100 x dividends paid / net income (nonconsolidated)
*Directors' and corporate auditors' bonuses from the year ended December 31, 2006 are recognized in selling, general and administrative expenses.
42Annual Report 2012 |

12.0
10.0
8.0
6.0
4.0
2.0
0
18,000
15,000
12,000
9,000
6,000
3,000
0
8.2
4.9
10.4
10,958 5,144 12,299 16,530 11,707 11,275 9,373 6,850 5,474 14,906
12.1
10.0
11.5
10.1
10.7 10.1
8.1
7.0
100
75
50
25
0
40,000
30,000
20,000
10,000
0
87
81 8285
92
82 86
93
74
50.0
40.0
30.0
20.0
10.0
0.0
44.0
13.0
17.0
39.0
26.0 28.0
16.0
10.0
14.5
10,000
8,000
6,000
4,000
2,000
0
4,955
4,573
4,523
3,246
4,161
3,173 2,944 3,037 2,915
6,645
4,534
4,033
9,336
5,059
5,664
3,956 3,501 3,444
2008.12 2009.12 2010.12 2011.122007.122006.122006.32005.32004.32003.3
Millions of Yen % Millions of Yen Days
Yen Millions of Yen
143
75
187
205
175
205
154 154
98
63
22
2008.12 2009.12 2010.12 2011.12 2012.12
2,500
2,000
1,500
1,000
500
0
250
200
150
100
50
0
2007.122006.122006.32005.32004.32003.3
Yen Yen
1,817 1,890
1,987
2,133
2,346
1,893 1,711
1,548
1,416 1,350 1,293
2008.12 2009.12 2010.12
76
85
29,802 23,363 24,843 33,734 30,947 27,273 22,012 19,402 18,336 26,288
2011.122007.122006.122006.32005.32004.32003.3
2008.12 2009.12 2010.12
4,146
4,670
2011.12
3,743
7,882
2012.122007.122006.122006.32005.32004.32003.3
9.0
7.5
6.0
4.5
3.0
1.5
0
180,000
150,000
120,000
90,000
60,000
30,000
0
4.2
2.4
5.9 6.1
5.2
5.9
3.7
2.2
0.8
Millions of Yen %
2008.12 2009.12 2010.12
6.1
5.0
2011.122007.122006.122006.32005.32004.32003.3
2008.12 2009.12 2010.12
40.0
2011.12
50.0
2012.122007.122006.122006.32005.32004.32003.3
12.0
10.0
8.0
6.0
4.0
2.0
0
12,000
10,000
8,000
6,000
4,000
2,000
0
7.9
9.4
8.0
6.6
5.3
6.2 6.1 6.0
5.2
Millions of Yen %
2008.12 2009.12 2010.12
10,662 9,831 9,480 9,474 6,136 6,553 5,636 5,129 4,044 10,060
8.1
8.6
2011.122007.122006.122006.32005.32004.32003.3
150,000
120,000
90,000
60,000
30,000
02008.12 2009.12 2010.122007.122006.122006.32005.32004.32003.3
9,340
78,501 10,465
85,073 8,999
92,492 10,319
105,665 9,753
116,099
14,290
144,283
13,721
134,248
12,022
104,538 11,787
118,556
Millions of Yen
21,131
15,942
14,391
17,696
23,582
17,301
14,764
18,960
27,022
18,777
18,183
19,510
34,446
20,508
18,039
22,351
37,945
22,989
20,111
25,300
51,475
25,836
26,934
25,748
54,232
24,722
16,762
24,810
37,192
22,337
12,483
20,503
35,751
22,514
27,676
20,825
2011.12
2008.12 2009.12 2010.12
12.0
10.0
8.0
6.0
4.0
2.0
0.0
12,000
10,000
8,000
6,000
4,000
2,000
02007.122006.122006.32005.32004.32003.3
7.7
4.0
9.7
2011.12
9.9
11.4
9.4
11.0
7.4
5.0
2.0
Millions of Yen %
6,039 3,161 7,927 8,691 6,510 6,473 3,524 2,074 786 8,664
Net IncomeReturn on Equity (ROE)
Total AssetsReturn on Assets (ROA)
R&D ExpedituresR&D Expeditures to Net Sales
Operating IncomeOperating Income to Net Sales
InventoriesDays
Net Income per Share (left)Net Assets per Share (right)
Capital ExpendituresDepreciations and Amortization
14,558
123,456
38,678
23,485
24,694
22,040
Process & Environmental
Scientific
Semiconductor
Medical-Diagnostic
AutomotiveTest Systems
10,662 9,831 9,480 9,474 6,136 6,553 5,636 5,129 4,044 10,060
2012.12
133,279 129,580 137,290 154,367 129,236 119,976 99,913 92,657 144,649 100,542 133,279 129,580 137,290 154,367 129,236 119,976 99,913 92,657 144,649
2012.12
100,542
29,802 23,363 24,843 33,734 30,947 27,273 22,012 19,402 18,336 26,288
2012.12
10,958 5,144 12,299 16,530 11,707 11,275 9,373 6,850 5,474 14,906
2012.122012.12
13,709
117,609
43,230
22,400
17,861
20,406
2012.12
7.8
7,396 6,039 3,161 7,927 8,691 6,510 6,473 3,524 2,074 786 8,664 7,396
11,75111,751 28,10128,101
153,836153,836 10,09210,092
Net Sales by Segment
Net Income and Return on Equity (ROE)
Net Income per Share and Net Assets per Share
Eleven-Year Summary
In fiscal 2012, ended December 31, 2012, HORIBA’s net sales decreased for the first time in three years, due to the appreciation of yen, which persisted nearly until the year-end, and the sluggish economy caused by the European debt crisis and other factors.By segment, the Automotive Test Systems segment witnessed a recovery in capital investment and R&D investment by automakers but the Semiconductor Instruments & Systems segment recorded a significant decrease in sales. The appreciation of the yen reduced the value of overseas sales when converted into yen in the Scientific Instruments & Systems segment and the Medical-Diagnostic Instruments & Systems segment.
Net income also decreased for the first time in three years, due to a drop in sales in all business segments other than the Automotive Test Systems segment, which achieved improved profitability in response to higher sales and continued cost reduction efforts. This resulted in ROE declining by 2.1 percentage points to 7.8%.
Fiscal 2012 net income per share was ¥175, down ¥30 from the previous year, while net assets per share renewed a record-high of ¥2,346.
43
FINANCIAL DATA

12.0
10.0
8.0
6.0
4.0
2.0
0
18,000
15,000
12,000
9,000
6,000
3,000
0
8.2
4.9
10.4
10,958 5,144 12,299 16,530 11,707 11,275 9,373 6,850 5,474 14,906
12.1
10.0
11.5
10.1
10.7 10.1
8.1
7.0
100
75
50
25
0
40,000
30,000
20,000
10,000
0
87
81 8285
92
82 86
93
74
50.0
40.0
30.0
20.0
10.0
0.0
44.0
13.0
17.0
39.0
26.0 28.0
16.0
10.0
14.5
10,000
8,000
6,000
4,000
2,000
0
4,955
4,573
4,523
3,246
4,161
3,173 2,944 3,037 2,915
6,645
4,534
4,033
9,336
5,059
5,664
3,956 3,501 3,444
2008.12 2009.12 2010.12 2011.122007.122006.122006.32005.32004.32003.3
Millions of Yen % Millions of Yen Days
Yen Millions of Yen
143
75
187
205
175
205
154 154
98
63
22
2008.12 2009.12 2010.12 2011.12 2012.12
2,500
2,000
1,500
1,000
500
0
250
200
150
100
50
0
2007.122006.122006.32005.32004.32003.3
Yen Yen
1,817 1,890
1,987
2,133
2,346
1,893 1,711
1,548
1,416 1,350 1,293
2008.12 2009.12 2010.12
76
85
29,802 23,363 24,843 33,734 30,947 27,273 22,012 19,402 18,336 26,288
2011.122007.122006.122006.32005.32004.32003.3
2008.12 2009.12 2010.12
4,146
4,670
2011.12
3,743
7,882
2012.122007.122006.122006.32005.32004.32003.3
9.0
7.5
6.0
4.5
3.0
1.5
0
180,000
150,000
120,000
90,000
60,000
30,000
0
4.2
2.4
5.9 6.1
5.2
5.9
3.7
2.2
0.8
Millions of Yen %
2008.12 2009.12 2010.12
6.1
5.0
2011.122007.122006.122006.32005.32004.32003.3
2008.12 2009.12 2010.12
40.0
2011.12
50.0
2012.122007.122006.122006.32005.32004.32003.3
12.0
10.0
8.0
6.0
4.0
2.0
0
12,000
10,000
8,000
6,000
4,000
2,000
0
7.9
9.4
8.0
6.6
5.3
6.2 6.1 6.0
5.2
Millions of Yen %
2008.12 2009.12 2010.12
10,662 9,831 9,480 9,474 6,136 6,553 5,636 5,129 4,044 10,060
8.1
8.6
2011.122007.122006.122006.32005.32004.32003.3
150,000
120,000
90,000
60,000
30,000
02008.12 2009.12 2010.122007.122006.122006.32005.32004.32003.3
9,340
78,501 10,465
85,073 8,999
92,492 10,319
105,665 9,753
116,099
14,290
144,283
13,721
134,248
12,022
104,538 11,787
118,556
Millions of Yen
21,131
15,942
14,391
17,696
23,582
17,301
14,764
18,960
27,022
18,777
18,183
19,510
34,446
20,508
18,039
22,351
37,945
22,989
20,111
25,300
51,475
25,836
26,934
25,748
54,232
24,722
16,762
24,810
37,192
22,337
12,483
20,503
35,751
22,514
27,676
20,825
2011.12
2008.12 2009.12 2010.12
12.0
10.0
8.0
6.0
4.0
2.0
0.0
12,000
10,000
8,000
6,000
4,000
2,000
02007.122006.122006.32005.32004.32003.3
7.7
4.0
9.7
2011.12
9.9
11.4
9.4
11.0
7.4
5.0
2.0
Millions of Yen %
6,039 3,161 7,927 8,691 6,510 6,473 3,524 2,074 786 8,664
Net IncomeReturn on Equity (ROE)
Total AssetsReturn on Assets (ROA)
R&D ExpedituresR&D Expeditures to Net Sales
Operating IncomeOperating Income to Net Sales
InventoriesDays
Net Income per Share (left)Net Assets per Share (right)
Capital ExpendituresDepreciations and Amortization
14,558
123,456
38,678
23,485
24,694
22,040
Process & Environmental
Scientific
Semiconductor
Medical-Diagnostic
AutomotiveTest Systems
10,662 9,831 9,480 9,474 6,136 6,553 5,636 5,129 4,044 10,060
2012.12
133,279 129,580 137,290 154,367 129,236 119,976 99,913 92,657 144,649 100,542 133,279 129,580 137,290 154,367 129,236 119,976 99,913 92,657 144,649
2012.12
100,542
29,802 23,363 24,843 33,734 30,947 27,273 22,012 19,402 18,336 26,288
2012.12
10,958 5,144 12,299 16,530 11,707 11,275 9,373 6,850 5,474 14,906
2012.122012.12
13,709
117,609
43,230
22,400
17,861
20,406
2012.12
7.8
7,396 6,039 3,161 7,927 8,691 6,510 6,473 3,524 2,074 786 8,664 7,396
11,75111,751 28,10128,101
153,836153,836 10,09210,092
Operating Income and Operating Income to Net Sales Inventories and Inventory Turnover (Days)
Total Assets and Return on Assets (ROA)R&D Expenditures andR&D Expenditures to Net Sales
Cash Dividends per ShareCapital Expenditures andDepreciations and Amortization
44Annual Report 2012 |
\ \
HORIBA, Ltd. and Consolidated Subsidiaries | Consolidated Financial Review
45
FINANCIAL DATA

\ \
\ \
\ \
\
\
\
\
\
\ \
\
\
\
\ \
\
\
\
\
\
\
\
\
\
\
\
\
\
\
\ \
\
\
46Annual Report 2012 |
\ \
\
\
\
\
\
\
\
\
\ \
\
\
\
\
\
\
\
\
\
\
\
\
\
\
HORIBA, Ltd. and Consolidated Subsidiaries | Consolidated Financial Review
47
FINANCIAL DATA
48Annual Report 2012 |

HORIBA, Ltd. and Consolidated Subsidiaries | Consolidated Financial Review
49
FINANCIAL DATA

Consolidated Balance SheetsConsolidated Balance SheetsHORIBA, Ltd. and Consolidated Subsidiaries Thousands ofFor the years ended December 31, 2011 and December 31, 2012 U.S. dollars
Millions of yen (Note 1)
ASSETS 12/2011 12/2012 12/2012
Current assets:Cash and cash equivalents...................................................................................................................................... ¥35,767 ¥38,858 $448,810Trade notes and accounts receivable (Note 7)
Affiliated companies..................................................................................................................................... 126 4 46Other................................................................................................................................................................... 39,249 37,516 433,310
Allowance for doubtful receivables...................................................................................................................... (750) (856) (9,886)Marketable securities (Note 5).............................................................................................................................. 1,100 1,501 17,336Inventories (Note 6).................................................................................................................................................... 26,288 28,101 324,566Deferred tax assets (Note 15)............................................................................................................................... 3,201 2,881 33,275Other current assets................................................................................................................................................. 3,272 3,980 45,969
Total current assets..................................................................................................................................... 108,255 111,988 1,293,462Property, plant and equipment:
Land................................................................................................................................................................................... 7,362 8,172 94,386Buildings and structures........................................................................................................................................... 19,443 24,210 279,625Machinery, equipment and vehicles..................................................................................................................... 11,856 12,807 147,920Construction in progress.......................................................................................................................................... 2,130 1,851 21,379Other property, plant and equipment.................................................................................................................. 12,388 13,386 154,608
Total.................................................................................................................................................................... 53,181 60,428 697,944Accumulated depreciation....................................................................................................................................... (30,256) (32,249) (372,476)
Net property, plant and equipment........................................................................................................ 22,924 28,179 325,467Investments and other noncurrent assets:
Investment securities (Note 5).............................................................................................................................. 3,423 3,977 45,934Investments in nonconsolidated subsidiaries and affiliates....................................................................... 90 67 773Deferred tax assets (Note 15)............................................................................................................................... 2,115 2,030 23,446Allowance for doubtful accounts........................................................................................................................... (40) (74) (854)Other investments and other assets.................................................................................................................. 3,240 3,176 36,682
Total.................................................................................................................................................................... 8,829 9,178 106,006Intangibles:
Goodwill............................................................................................................................................................................ 201 319 3,684Software.......................................................................................................................................................................... 4,182 3,488 40,286Other intangibles.......................................................................................................................................................... 256 681 7,865
Total.................................................................................................................................................................... 4,640 4,490 51,859Total assets................................................................................................................................................................................ ¥144,649 ¥153,836 $1,776,807
LIABILITIES AND NET ASSETSCurrent liabilities:
Short-term loans (Note 8)....................................................................................................................................... ¥6,152 ¥4,300 $49,665Current portion of long-term debt (Note 8)..................................................................................................... 660 1,388 16,031Trade notes and accounts payable:
Affiliated companies..................................................................................................................................... 0 - -Other................................................................................................................................................................... 13,196 11,829 136,625
Accounts payable - other........................................................................................................................................ 7,805 9,195 106,202Accrued income taxes............................................................................................................................................... 2,459 1,317 15,211Deferred tax liabilities (Note 15)........................................................................................................................... 18 6 69Accrued bonuses to employees............................................................................................................................ 755 902 10,418Accrued bonuses to directors and corporate auditors............................................................................... 84 38 438Reserve for product warranty................................................................................................................................ 1,308 1,176 13,582Provision for business structure improvement............................................................................................... 174 - -Other current liabilities............................................................................................................................................. 5,956 7,504 86,671
Total current liabilities................................................................................................................................ 38,574 37,662 434,996
Long-term debt (Note 8) ..................................................................................................................................................... 11,544 12,394 143,150Deferred tax liabilities (Note 15)........................................................................................................................................ 108 153 1,767Employees' retirement benefits (Note 9)....................................................................................................................... 1,775 2,066 23,862Directors' and corporate auditors' retirement benefits........................................................................................... 221 195 2,252Provision for compensation losses................................................................................................................................... 616 457 5,278Other noncurrent liabilities................................................................................................................................................... 1,348 1,370 15,823
Total liabilities................................................................................................................................................. 54,189 54,299 627,154Contingent liabilities (Note 13)Net assets (Note 10):Shareholders' equity:
Common stock.............................................................................................................................................................. 12,011 12,011 138,727Authorized - 100,000,000 sharesIssued and outstanding - 42,294,669 shares (excluding treasury stock) at 12/2011Issued and outstanding - 42,297,169 shares (excluding treasury stock) at 12/2012
Capital surplus.............................................................................................................................................................. 18,717 18,717 216,181Retained earnings........................................................................................................................................................ 66,278 71,725 828,424Treasury stock - 238,083 shares at 12/2011 and 235,583 shares at 12/2012................................ (788) (780) (9,009)
Total shareholders' equity......................................................................................................................... 96,219 101,674 1,174,335Accumulated other comprehensive income:
Unrealized gains (losses) on available-for-sale securities......................................................................... 717 987 11,399Foreign currency translation adjustments........................................................................................................ (6,703) (3,413) (39,420)
Total accumulated other comprehensive income............................................................................ (5,986) (2,426) (28,020)Subscription rights to shares.............................................................................................................................................. 186 245 2,829Minority interests in consolidated subsidiaries............................................................................................................ 40 42 485
Total net assets............................................................................................................................................. 90,460 99,536 1,149,641Total liabilities and net assets............................................................................................................................................ ¥144,649 ¥153,836 $1,776,807
See the notes to the consolidated financial statements.
50Annual Report 2012 |

Consolidated Statements of IncomeHORIBA, Ltd. and Consolidated Subsidiaries Thousands ofFor the years ended December 31, 2011 and December 31, 2012 U.S. dollars
(Note 1)12/2011 12/2012 12/2012
Net sales (Note 21)....................................................................................................................................................................... ¥123,456 ¥117,609 $1,358,385
Operating costs and expenses (Note 21):Cost of sales........................................................................................................................................................................ 70,259 68,220 787,941Selling, general and administrative expenses......................................................................................................... 38,290 37,637 434,707
Total operating costs and expenses............................................................................................................ 108,549 105,857 1,222,649
Operating income (Note 21)....................................................................................................................................................... 14,906 11,751 135,724
Other income (expenses):Interest and dividend income........................................................................................................................................ 190 312 3,603Interest expense................................................................................................................................................................. (494) (478) (5,520)Foreign exchange gains (losses), net......................................................................................................................... (283) (206) (2,379)Gain on sale of property, plant and equipment..................................................................................................... 10 31 358Loss on sale of property, plant and equipment..................................................................................................... (4) (0) (0)Loss on disposal of property, plant and equipment............................................................................................. (48) (143) (1,651)Loss on impairment of fixed assets (Note 16)...................................................................................................... (98) (135) (1,559)Loss on valuation of investment securities (Note 5).......................................................................................... (370) (2) (23)Reversal of provision for loss on guarantees......................................................................................................... 67 - -Provision for compensation losses............................................................................................................................. (214) - -Reversal of provision for compensation losses..................................................................................................... - 67 773Provision for business structure improvement..................................................................................................... (267) - -Other, net.............................................................................................................................................................................. 255 (26) (300)
Total other expenses, net................................................................................................................................ (1,259) (581) (6,710)
Income before income taxes and minority interests....................................................................................................... 13,647 11,170 129,013
Income taxes (Note 15):Current................................................................................................................................................................................... 5,187 3,236 37,375Deferred................................................................................................................................................................................. (204) 538 6,213
Total income taxes.............................................................................................................................................. 4,982 3,774 43,589
Income before minority interests............................................................................................................................................ 8,664 7,395 85,412
Minority interests in earnings (losses) of consolidated subsidiaries........................................................................ (0) (0) (0)
Net income ...................................................................................................................................................................................... ¥8,664 ¥7,396 $85,423
U.S. dollars
(Note 1)12/2011 12/2012 12/2012
Per share information:Net income - basic........................................................................................................................................................... ¥204.88 ¥174.87 $2.01Net income - diluted........................................................................................................................................................ 204.41 174.37 2.01Cash dividends.................................................................................................................................................................... 40.00 50.00 0.57
Consolidated Statements of Comprehensive IncomeHORIBA, Ltd. and Consolidated Subsidiaries
For the years ended December 31, 2011 and December 31, 2012 Thousands of U.S. dollars
(Note 1)
12/2011 12/2012 12/2012Income before minority interests ¥8,664 ¥7,395 $85,412Other comprehensive income (Note 20)
Unrealized gains (losses) on available-for-sale securities............................................................................... (179) 270 3,118Foreign currency translation adjustments............................................................................................................... (1,434) 3,297 38,080Share of other comprehensive income of affiliates accounted for using equity method.................... (0) (2) (23)Total other comprehensive income............................................................................................................................ (1,613) 3,565 41,175
Comprehensive income 7,050 ¥10,960 $126,588Total comprehensive income attributable to
Owners of the parent....................................................................................................................................................... 7,051 ¥10,956 $126,541Minority interests............................................................................................................................................................... (0) 4 46
See the notes to the consolidated financial statements.
Millions of yen
Yen
Millions of yen
Consolidated Statements of Income
51
FINANCIAL DATA

Consolidated Statements of Changes in Net AssetsHORIBA, Ltd. and Consolidated Subsidiaries Thousands ofFor the years ended December 31, 2011 and December 31, 2012 U.S. dollars
(Note 1)12/2011 12/2012 12/2012
Shareholders' equityCommon stock
Balance at beginning of current fiscal year............................................................................................................... ¥12,011 ¥12,011 $138,727Balance at end of current fiscal year........................................................................................................................... ¥12,011 ¥12,011 $138,727
Capital surplusBalance at end of previous fiscal year......................................................................................................................... ¥18,717 ¥18,717 $216,181Balance at end of current fiscal year........................................................................................................................... ¥18,717 ¥18,717 $216,181
Retained earningsBalance at beginning of current fiscal year............................................................................................................... ¥58,468 ¥66,278 $765,511Changes in items during the period:
Cash dividends......................................................................................................................................................... (845) (1,945) (22,464)Net income................................................................................................................................................................. 8,664 7,396 85,423Disposal of treasury stock.................................................................................................................................. (8) (3) (34)Total.............................................................................................................................................................................. 7,810 5,446 62,901
Balance at end of current fiscal year........................................................................................................................... ¥66,278 ¥71,725 $828,424
Treasury stockBalance at beginning of current fiscal year............................................................................................................... (¥804) (¥788) ($9,101)Changes in items during the period:
Purchase of treasury stock................................................................................................................................ (0) - -Disposal of treasury stock.................................................................................................................................. 16 8 92Total.............................................................................................................................................................................. 16 8 92
Balance at end of current fiscal year........................................................................................................................... (¥788) (¥780) ($9,009)
Shareholders' equity, totalBalance at beginning of current fiscal year............................................................................................................... ¥88,392 ¥96,219 $1,111,330Changes in items during the period:
Cash dividends......................................................................................................................................................... (845) (1,945) (22,464)Net income................................................................................................................................................................. 8,664 7,396 85,423Purchase of treasury stock................................................................................................................................ (0) - -Disposal of treasury stock.................................................................................................................................. 7 4 46Total.............................................................................................................................................................................. 7,826 5,455 63,005
Balance at end of current fiscal year........................................................................................................................... ¥96,219 ¥101,674 $1,174,335
Accumulated other comprehensive incomeUnrealized gains (losses) on available-for-sale securities
Balance at beginning of current fiscal year............................................................................................................... ¥897 ¥717 $8,281Changes in items during the period:
Net changes in items other than shareholders' equity............................................................................ (179) 270 3,118Total.............................................................................................................................................................................. (179) 270 3,118
Balance at end of current fiscal year........................................................................................................................... ¥717 ¥987 $11,399
Foreign currency translation adjustments Balance at beginning of current fiscal year............................................................................................................... (¥5,269) (¥6,703) ($77,419)Changes in items during the period:
Net changes in items other than shareholders' equity............................................................................ (1,434) 3,289 37,987Total.............................................................................................................................................................................. (1,434) 3,289 37,987
Balance at end of current fiscal year........................................................................................................................... (¥6,703) (¥3,413) ($39,420)
Accumulated other comprehensive income, totalBalance at beginning of current fiscal year............................................................................................................... (¥4,372) (¥5,986) ($69,138)Changes in items during the period:
Net changes in items other than shareholders' equity............................................................................ (1,613) 3,560 41,118Total.............................................................................................................................................................................. (1,613) 3,560 41,118
Balance at end of current fiscal year........................................................................................................................... (¥5,986) (¥2,426) ($28,020)
Subscription rights to sharesBalance at beginning of current fiscal year............................................................................................................... ¥126 ¥186 $2,148Changes in items during the period:
Net changes in items other than shareholders' equity............................................................................ 60 58 669Total.............................................................................................................................................................................. 60 58 669
Balance at end of current fiscal year........................................................................................................................... ¥186 ¥245 $2,829
Minority interests in consolidated subsidiariesBalance at beginning of current fiscal year............................................................................................................... ¥9 ¥40 $462Changes in items during the period:
Net changes in items other than shareholders' equity............................................................................ 31 2 23Total.............................................................................................................................................................................. 31 2 23
Balance at end of current fiscal year........................................................................................................................... ¥40 ¥42 $485
Net assets, totalBalance at beginning of current fiscal year............................................................................................................... ¥84,155 ¥90,460 $1,044,814Changes in items during the period:
Cash dividends......................................................................................................................................................... (845) (1,945) (22,464)Net income................................................................................................................................................................. 8,664 7,396 85,423Purchase of treasury stock................................................................................................................................ (0) - -Disposal of treasury stock.................................................................................................................................. 7 4 46Net changes in items other than shareholders' equity............................................................................ (1,521) 3,621 41,822Total.............................................................................................................................................................................. ¥6,305 ¥9,076 $104,827
Balance at end of current fiscal year........................................................................................................................... ¥90,460 ¥99,536 $1,149,641
See the notes to the consolidated financial statements.
Millions of yen
Consolidated Statements of Changes in Net Assets
52Annual Report 2012 |

Consolidated Statements of Cash FlowsHORIBA, Ltd. and Consolidated Subsidiaries Thousands ofFor the years ended December 31, 2011 and December 31, 2012 U.S. dollars
(Note 1)12/2011 12/2012 12/2012
Cash flows from operating activities:Income before income taxes.......................................................................................................................................................... ¥13,647 ¥11,170 $129,013Adjustments to reconcile income before income taxes to net cash provided by operating activities:
Depreciation and amortization........................................................................................................................................... 4,146 3,743 43,231Loss on impairment of fixed assets................................................................................................................................. 98 135 1,559Increase (decrease) in allowance for doubtful receivables.................................................................................... (40) 55 635Increase (decrease) in provision for business structrue improvement............................................................. 192 (177) (2,044)Increase (decrease) in employees' retirement benefits.......................................................................................... 87 186 2,148Increase (decrease) in directors' and corporate auditors' retirement benefits .......................................... (26) (26) (300)Increase (decrease) in reserve for loss on guarantees........................................................................................... (67) - -Increase (decrease) in provision for compensation losses.................................................................................... 187 (159) (1,836)Interest and dividend income.............................................................................................................................................. (190) (312) (3,603)Interest expense...................................................................................................................................................................... 494 478 5,520Foreign exchange losses (gains)........................................................................................................................................ (21) 13 150Loss (gain) on sales of fixed assets................................................................................................................................. (5) (30) (346)Loss on disposal of fixed assets....................................................................................................................................... 48 143 1,651Loss (gain) on valuation of investment securities..................................................................................................... 370 2 23Loss (gain) on sales of investment securities............................................................................................................. 0 - -Decrease (increase) in trade notes and accounts receivable.............................................................................. (4,080) 4,133 47,736Decrease (increase) in inventories................................................................................................................................... (2,144) 40 462Increase (decrease) in trade notes and accounts payable.................................................................................... 70 (2,345) (27,084)Other, net.................................................................................................................................................................................... 791 1,417 16,366
Subtotal............................................................................................................................................................................. 13,560 18,468 213,305Interest and dividends received......................................................................................................................................... 184 305 3,522Interest paid............................................................................................................................................................................... (519) (499) (5,763)Income taxes paid.................................................................................................................................................................... (6,270) (4,879) (56,352)
Net cash provided by (used in) operating activities....................................................................................... 6,954 13,395 154,712
Cash flows from investing activities:Increase in time deposits..................................................................................................................................................... (872) (2,410) (27,835)Decrease in time deposits................................................................................................................................................... 507 2,410 27,835Decrease in time deposits restricted for use.............................................................................................................. 32 32 369 Payments for purchase of marketable securities...................................................................................................... (1,908) (2,904) (33,541)Proceeds from sales of marketable securities............................................................................................................ 905 2,509 28,978Payments for purchase of property, plant and equipment..................................................................................... (4,204) (6,741) (77,858)Proceeds from sales of property, plant and equipment.......................................................................................... 51 79 912Payments for purchase of intangibles........................................................................................................................... (226) (712) (8,223)Payments for purchase of investment securities...................................................................................................... (136) (147) (1,697)Proceeds from sales or redemption of investment securities.............................................................................. 12 7 80Payments for purchase of investments in consolidated subsidiary................................................................... (44) (18) (207)Other, net.................................................................................................................................................................................... (260) 3 34
Net cash provided by (used in) investing activities........................................................................................ (6,145) (7,891) (91,141)
Cash flows from financing activities:Net increase (decrease) in short-term loans.............................................................................................................. 1,557 (2,395) (27,662)Increase in long-term debt.................................................................................................................................................. 824 1,827 21,101Repayments of long-term debt.......................................................................................................................................... (577) (635) (7,334)Repayments on finance lease obligations...................................................................................................................... (135) (156) (1,801)Proceeds from stock issuance to minority shareholders....................................................................................... 41 - -Net decrease (increase) of treasury stock................................................................................................................... (0) 0 0Cash dividends paid................................................................................................................................................................ (847) (1,943) (22,441)Cash dividends paid to minority interests..................................................................................................................... (6) - -
Net cash provided by (used in) financing activities........................................................................................ 855 (3,304) (38,161)
Effect of exchange rate changes on cash and cash equivalents............................................................................................... (356) 891 10,291Net increase (decrease) in cash and cash equivalents.................................................................................................................. 1,308 3,090 35,689Cash and cash equivalents at beginning of year............................................................................................................................... 34,459 35,767 413,109Cash and cash equivalents at end of year........................................................................................................................................... ¥35,767 ¥38,858 $448,810
See the notes to the consolidated financial statements.
Millions of yen
Consolidated Statements of Cash Flows
53
FINANCIAL DATA

\
\
\
\
\
HORIBA, Ltd. and Consolidated Subsidiaries | Notes to Consolidated Financial Statements
54Annual Report 2012 |
\
HORIBA, Ltd. and Consolidated Subsidiaries | Notes to Consolidated Financial Statements
55
FINANCIAL DATA

\ \
56Annual Report 2012 |

HORIBA, Ltd. and Consolidated Subsidiaries | Notes to Consolidated Financial Statements
57
FINANCIAL DATA

58Annual Report 2012 |

HORIBA, Ltd. and Consolidated Subsidiaries | Notes to Consolidated Financial Statements
59
FINANCIAL DATA
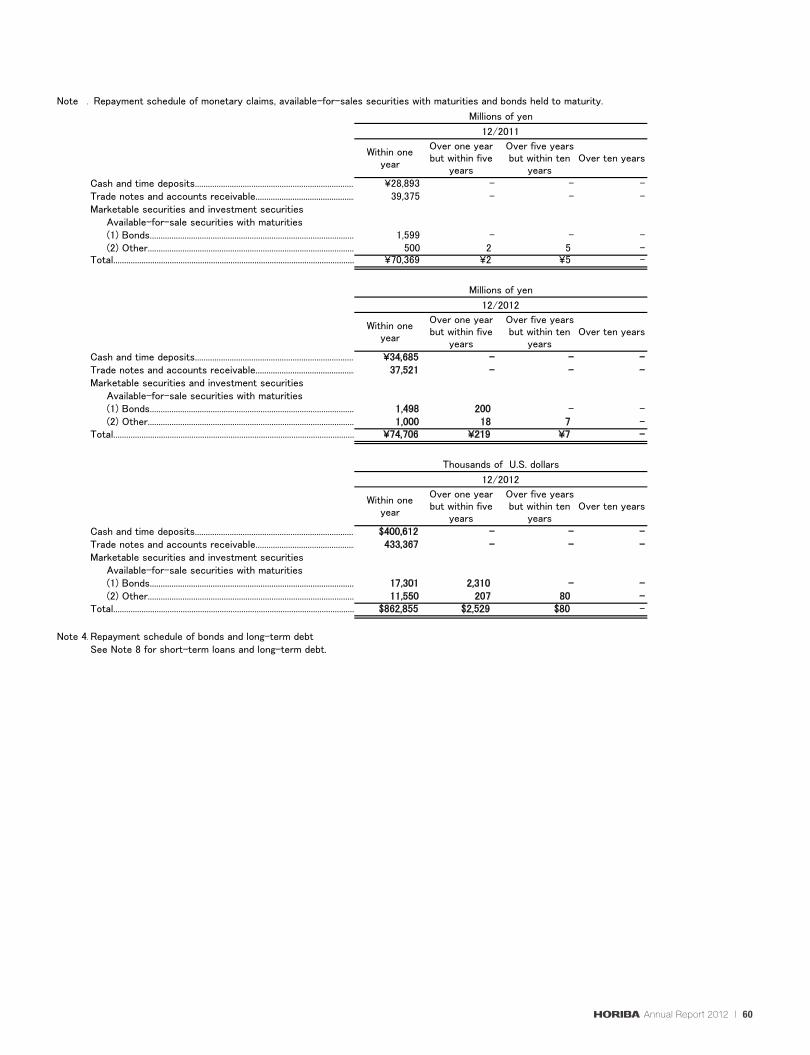
60Annual Report 2012 |
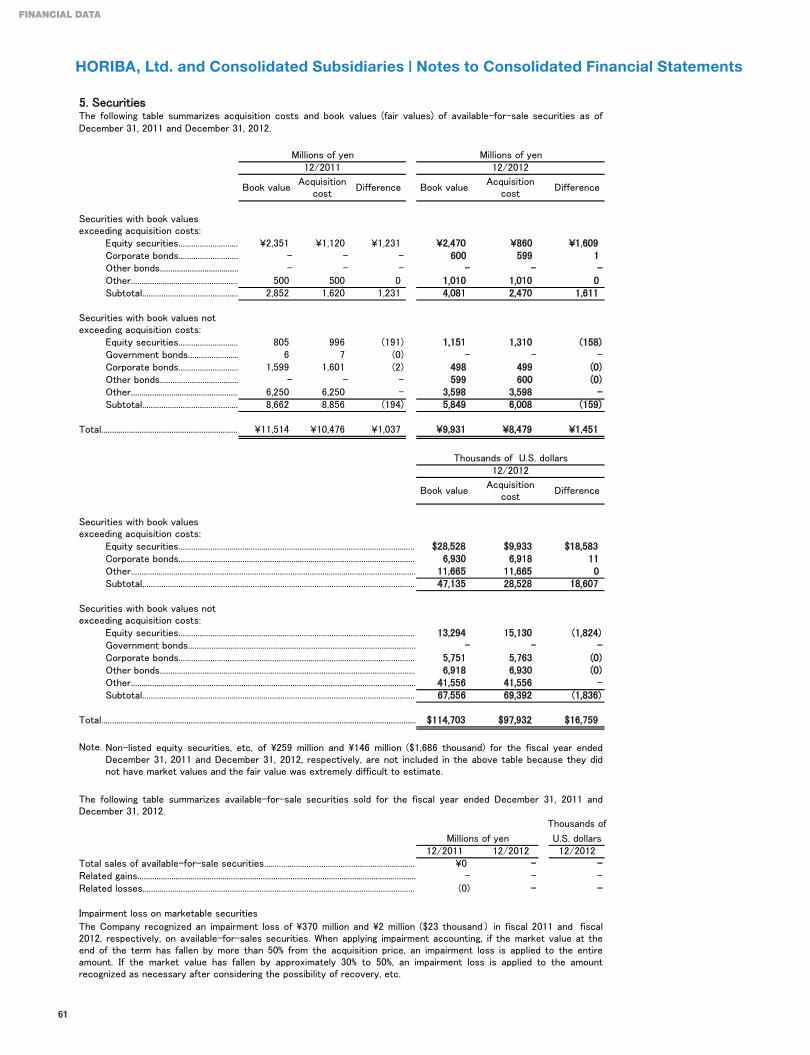
\ \
\ \
HORIBA, Ltd. and Consolidated Subsidiaries | Notes to Consolidated Financial Statements
61
FINANCIAL DATA

\\
62Annual Report 2012 |

\ \\ \
\ \
\ \
HORIBA, Ltd. and Consolidated Subsidiaries | Notes to Consolidated Financial Statements
63
FINANCIAL DATA

\
64Annual Report 2012 |

\
HORIBA, Ltd. and Consolidated Subsidiaries | Notes to Consolidated Financial Statements
65
FINANCIAL DATA

\ \
\ \ \
\
\ \
66Annual Report 2012 |
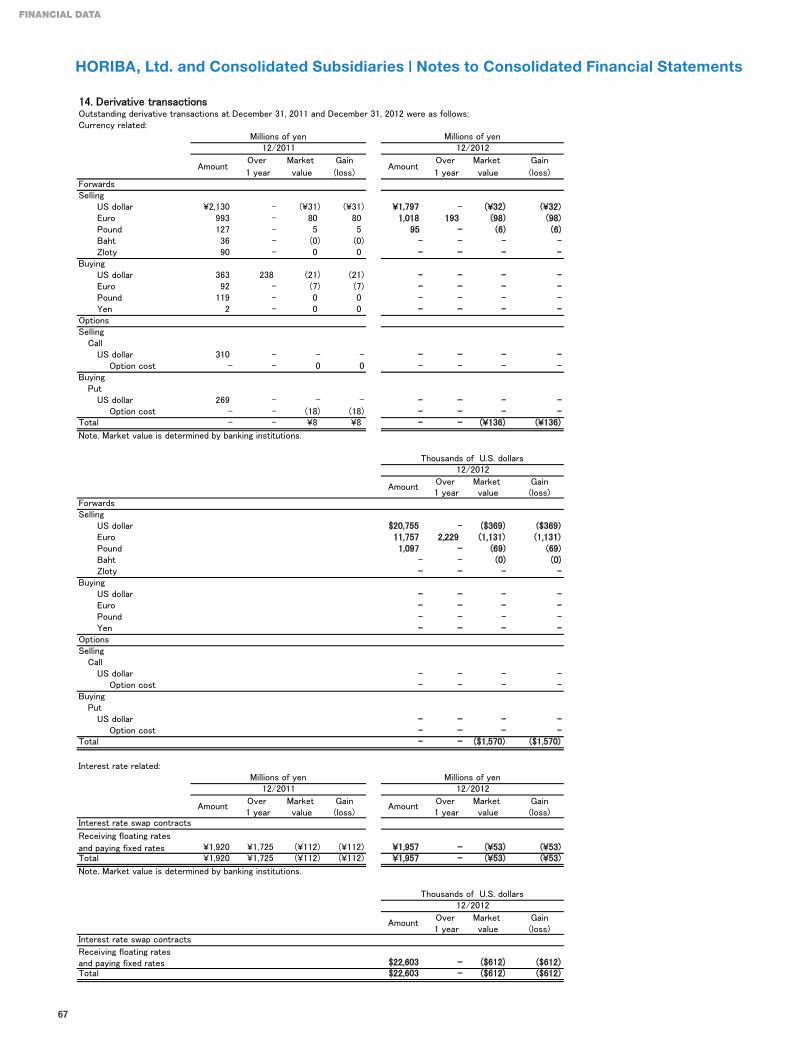
HORIBA, Ltd. and Consolidated Subsidiaries | Notes to Consolidated Financial Statements
67
FINANCIAL DATA

68Annual Report 2012 |
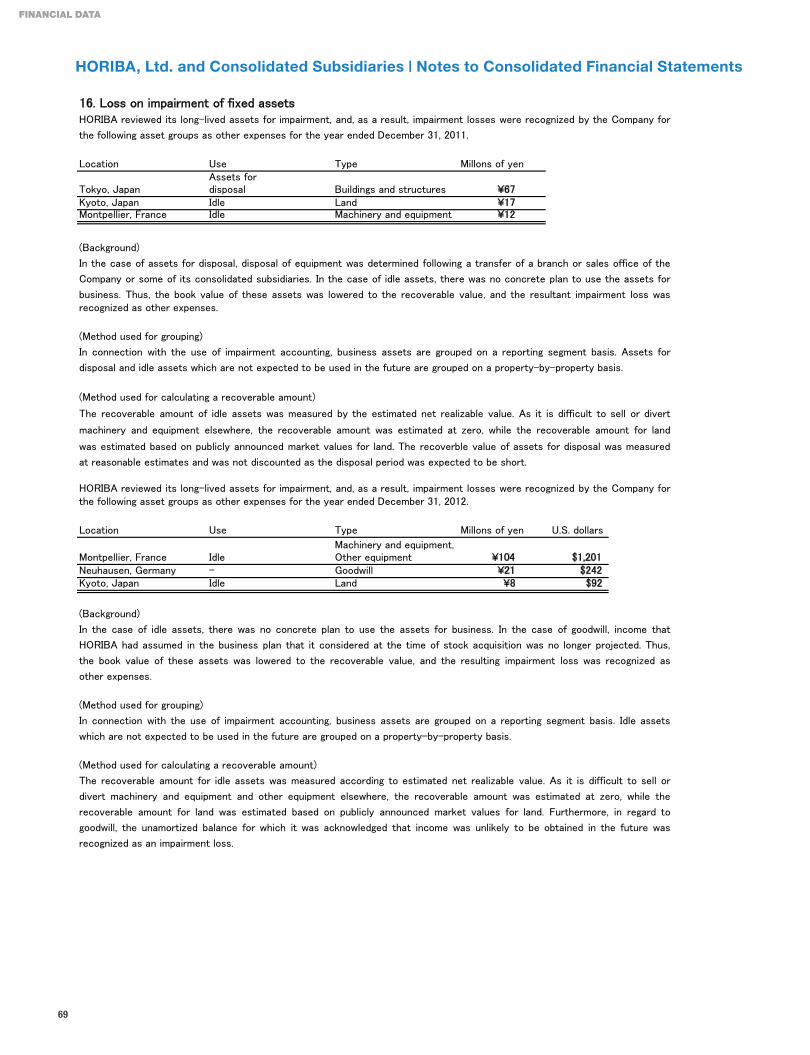
HORIBA, Ltd. and Consolidated Subsidiaries | Notes to Consolidated Financial Statements
69
FINANCIAL DATA

70Annual Report 2012 |

\
\ \
\ \ \\ \
\ \ \
HORIBA, Ltd. and Consolidated Subsidiaries | Notes to Consolidated Financial Statements
71
FINANCIAL DATA

72Annual Report 2012 |

\\
\\
HORIBA, Ltd. and Consolidated Subsidiaries | Notes to Consolidated Financial Statements
73
FINANCIAL DATA

Independent Auditors’ Report
74Annual Report 2012 |

HORIBA’s company motto
“Joy and Fun”Originates from the belief that if we take interest and pride in the work that occupies most of the active time in our lives, in the place where we spend the large part of each day, then as a result our satisfaction with life will increase, and we will be able to enjoy our lives even more. Taking interest and pride in our work leads us to “Joy and Fun.”
| Business Operations | We, at the HORIBA, apply our most advanced analytical
technologies to provide highly original analytical and measuring products and
equipment in such fields as engine emissions, scientific analysis, industrial and
process control, environment monitoring, semi-conductor process control,
medical and health-care, and biotechnology, thereby contributing to the progress
of science and technology, improvement in the quality, development and benefit
of human health. We are engaging in the new businesses for derivative and
peripheral products aim to develop scientific technology and improve the life of the
community, while at the same time minimizing the impact on the environment.
We strictly abide by all environmental protection laws and regulations in our
business activities. In addition, all HORIBA Group companies are required to
attain the highest levels of quality for establishing, developing, and maintaining
environmental systems, including implementing internal control standards that
minimize the impact that our business activities have on the environment.
We strive to deliver higher value-added products and services in the shortest
possible time to customers all over the world, combining the functions and
specialties of development, production, sales, and services from globally located
points throughout the world. Furthermore, we aim to be the leader in the global
market in the fields and product segments in which we operate, to meet all
customers’ needs consistently, and to effectively maximize our limited resources
through a policy of selective investment.
| Customer Responsiveness | We maintain a philosophy of pursuing technology
to the ultimate degree in both the fundamental and applied technology fields,
supplying products that continuously satisfy customers’ requirements. We are
committed to offering top-quality, highly reliable products and services with a
consistent level of excellence throughout the world. We are obliged to observe
the highest standards for establishing, developing, and maintaining quality control
systems. To provide products and services to customers in the fastest delivery time
possible, we have adopted the slogan “Ultra-Quick Supplier” for all our activities.
This slogan encompasses not only production lead times but also development,
marketing and sales, service, and control functions.
| Responsibility to Shareholders and Investors | Our basic policy is to
calculate annual dividends on an allocated rate of net income. Important information
regarding management and business operations are fully disclosed on a regular
basis to shareholders and potential investors. A timely responsive management
control system should be maintained by HORIBA Group companies to ensure
that company objectives are met, profit generated and the information disclosed
represents the true performance of the company as well as its management.
| Employees | We are proud of the entrepreneurial spirit that led to the creation
of HORIBA Group companies. Each employee is made aware of this heritage, and
we actively encourage ideas and innovations from individual employees. HORIBA
promotes an open and fair business environment that allows all employees
to achieve their individual goals and maximize their potential. To further each
employee’s personal and professional growth, we encourage thinking from a
global perspective and have established a global personnel development program
and performance evaluation system. We value employees who challenge their
personal abilities and recognize their own accomplishments.
75
CORPORATE PHILOSOPHY

6,000
5,000
4,000
3,000
2,000
1,000
0
2003 2004 20062005 2007 2008 2009 2010 2011 2012
YenFinancial institutions 0.82%
Individual investors93.61%
Japanese companies 8.01% Individual investors
21.26%
Financial institutions35.69%Securities companies 0.74%
Foreign investors34.30%
Breakdown of Types of
Shareholders (6,835 in total)
Breakdown of Ownership among
Shareholders (42,532,752
shares in total)
Securities companies 0.54% Japanese companies 2.41%
Foreign investors 2.62%
2013
Corporate Data
Stock Price Trend
Corporate Information
Head Office 2, Miyanohigashi-cho, Kisshoin, Minami-ku, Kyoto 601-8510, Japan
Founded October 17, 1945
Incorporated January 26, 1953
Paid in Capital 12,011 million yen As of December 31, 2012
Number of Employees 5,530(Consolidated) As of December 31, 2012
Fiscal Closing Date December 31, annually
Annual Meeting of Shareholders Held in March
Transfer Agent Sumitomo Mitsui Trust Bank, Limited
Independent Auditor KPMG AZSA LLC
Stock Listings Tokyo Stock Exchange, First Section
Osaka Securities Exchange, First Section
Securities Code: 6856
Major Shareholders As of December 31, 2012
Name of Shareholders Shares (Thousands) Percentage (%)
Japan Trustee Service Bank, Ltd. 3,366 7.91
The Master Trust Bank of Japan, Ltd. 2,551 5.99
Taiyo Fund, L.P. 2,169 5.09
National Mutual Insurance Federation of Agricultural Cooperatives 1,287 3.02
Masao Horiba 1,275 2.99
NOMURA BANK (LUXEMBOURG) S.A. S/A NOMURA MULTI CURRENCY JAPAN STOCK LEADERS FUND 901 2.11
JP MORGAN CHASE BANK 385174 840 1.97
The Bank of Kyoto, Ltd. 828 1.94
Atsushi Horiba 809 1.90
HORIBA Raku-Raku Kai 808 1.90
76Annual Report 2012 |
CORPORATE DATA

AN
NU
AL R
EP
OR
T 2
012
ANNUAL REPORT 2012http://www.horiba.com© 2013 HORIBA, Ltd. All rights reserved.
HORIBA, Ltd.
2, Miyanohigashi-cho, Kisshoin, Minami-ku,Kyoto 601-8510, Japan
Phone: +81-75-313-8121 Fax: +81-75-312-7389
E-mail : [email protected]