optimizing dry powder measurements - horiba · © 2012 horiba, ltd. all rights reserved. optimizing...
TRANSCRIPT
© 2012 HORIBA, Ltd. All rights reserved.
Optimizing Dry Powder MeasurementsFeaturing the LA-950 PowderJet
Ian [email protected]/us/particle

© 2012 HORIBA, Ltd. All rights reserved.
What we’ll talk about
Why measure dry?
Sampling & dispersion tips
Unique PowderJet features
Method development studies
© 2012 HORIBA, Ltd. All rights reserved.
Why Measure Dry?
Difficult to measure wetSolubilityDensityExpensiveSwelling
Final use is dry
Native state

© 2012 HORIBA, Ltd. All rights reserved.
The Workflow
+ +
=MAXIMUM PRECISION!
© 2012 HORIBA, Ltd. All rights reserved.
What we’ll talk about
Why measure dry?
Sampling & dispersion tips
Unique PowderJet features
Method development studies

© 2012 HORIBA, Ltd. All rights reserved.
SMALL PARTICLES POTENTIALLY SMALL
EXTRACTION ERRORS (A) POTENTIALLY LARGE
SAMPLE PREP ERRORS (C)
LARGE PARTICLES POTENTIALLY LARGE
EXTRACTION ERRORS (B) POTENTIALLY SMALL
SAMPLE PREP ERRORS (D)
INSTRUMENT ERROR IS SMALL AND RELATIVELY CONSTANT
PARTICLE SIZE
SAMPLE PREPARATION SAMPLE EXTRACTION
INSTRUMENT ERROR
%
E
R
R
O
R A
B
C
D
Measurement Error Sources

© 2012 HORIBA, Ltd. All rights reserved.
PLACE SPATULA INTO POWDEREXTRACT SMALL AMOUNT FOR ANALYSISACCEPTABLE FOR NARROW DISTRIBUTIONS
SEGREGATE LARGE AND SMALL WHEN POLYDISPERSE LARGE PARTICLES PERCOLATE UPWARD SMALL PARTICLES GRAVITATE DOWNWARD
EASY METHODMOST USED METHOD
Technique: Grab Sampling

© 2012 HORIBA, Ltd. All rights reserved.
When a powder is stored in a container, it can be mixed by rolling and tumbling the container. The container should not be more than half to two-thirds full. It is important to perform this action before “grabbing” a sample with a spatula.
Then pull sample with a spatula…..
Grab Sampling from Bottle
© 2012 HORIBA, Ltd. All rights reserved.
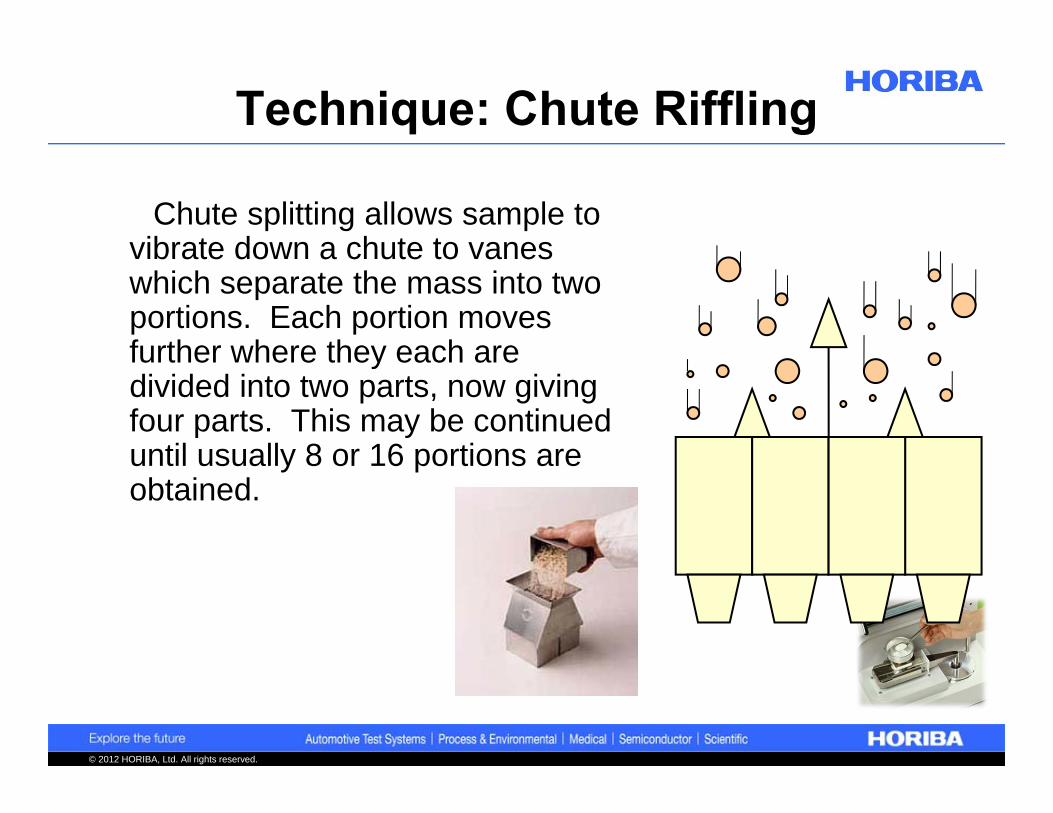
Chute splitting allows sample to vibrate down a chute to vanes which separate the mass into two portions. Each portion moves further where they each are divided into two parts, now giving four parts. This may be continued until usually 8 or 16 portions are obtained.
Technique: Chute Riffling

© 2012 HORIBA, Ltd. All rights reserved.
The best method of representative splitting of powders is the ROTARY RIFFLER. The complete sample to be split is directed down a chute into open containers. Each container will receive a sample which is representative of the original bulk material because the distribution of material is averaged over time. The complete amount of the original bulk sample must be consumed.
These splitters are commercially available from companies that market various types of sample splitters.
See: www.retsch.com
www.quantachrome.com
www.microscal.com
Technique: Rotary Riffling

© 2012 HORIBA, Ltd. All rights reserved.
Standard Deviation () in % Sugar-Sand Mixture
SCOOP SAMPLING 6.31 TABLE SAMPLING 2.11 CHUTE RIFFLER 1.10 SPINNING RIFFLER 0.27
Density of sand and sugar respectively 2.65 and 1.64 g/ml Reference: Allen, T. and Khan, A.A. (1934), Chem Eng, 238, CE 108-112
Sampling Technique Error Levels

© 2012 HORIBA, Ltd. All rights reserved.
WELL DISPERSED particles can be easily detected under an optical microscope. They are separated from one another and show no tendency to cling together.
AGGLOMERATED particles appear in clumps that can be separated easily by the application of moderate amounts of energy, such as ultrasonics.
AGGREGATED particles are tightly bound and must be treated with higher levels of energy. Usually an ultrasonic probe applied directly to the sample slurry will disperse the particles. If they are very tightly bound, they may fracture before they can be separated.
WELL DISPERSED AGGLOMERATED AGGREGATED
Dispersion Definitions

© 2012 HORIBA, Ltd. All rights reserved.
Particles are constantly moving with respect to one another. When they approach close enough to cross the potential barrier (when attractive forces exceed repulsive forces), they come together (agglomerate).
The object is to provide repulsive forces strong enough to keep particles apart, even during close approach. This can be accomplished by
surfactant coating of particle surfaces for wet dispersions or sufficient compressed air for dry dispersions.
ATTRACTIVE FORCES
(VAN DER WAALS)
REPULSIVE FORCES
(CHARGE)
REPULSIVE FORCES
(CHARGE)
CHARGE CHARGE
+
+
++
++
++
++
++
Particle Interactions

© 2012 HORIBA, Ltd. All rights reserved.
Vmax
Total Potential Energy VT
Distance Between Surfaces
0
VT = VA + VR
VA
Attraction
RepulsionVR
Pot
enti
al E
nerg
y
INTERACTION OF TWO CHARGED SURFACES
Stability of a system depends on forces between particles. Random motion brings them into close proximity. Whether two particles will combine depends on potential barrier between them. Potential energy consists of two forces, the ATTRACTIVE one due to Van der Waals, and the REPULSIVE one due to electrical double layers around particles.
If height of the barrier, VT, is lower than average thermal energy, KT, then probability is high that two adjacent particles will eventually collide. They will probably remain attached to each other due to strong Van der Waals forces at very close distances.
Electrical forces cause particles to remain apart.
Van der Waals forces cause particles to come together.
Energy of Interaction

© 2012 HORIBA, Ltd. All rights reserved.
Siz
e
Increasing energy
Stability
Theoretical Actual
Siz
e
Increasing energy
Higher air pressure or longer ultrasound duration
Dispersion vs. Breakage

© 2012 HORIBA, Ltd. All rights reserved.
Dispersion and milling can be parallel rather than sequential processes
Theoretical
Actual
Dispersion vs. Breakage

© 2012 HORIBA, Ltd. All rights reserved.
1 bar
2 bar
3 bar
Dispersing Agglomerates
Watch for no change in coarsest particles with changing energy

© 2012 HORIBA, Ltd. All rights reserved.
High = 3 barMid = 2 barLow = 1 bar
Breaking ParticlesWatch for finer particles being created with increasing
energy

© 2012 HORIBA, Ltd. All rights reserved.
What we’ll talk about
Why measure dry?
Sampling & dispersion tips
Unique PowderJet features
Method development studies

© 2012 HORIBA, Ltd. All rights reserved.
LA-950 PowderJet

© 2012 HORIBA, Ltd. All rights reserved.
Rocket Science
Keeps cell cleaner, longer
Mach 1 velocity
No impaction surfaces limits breakage
Supersonic flow “ignores” boundary layer

© 2012 HORIBA, Ltd. All rights reserved.
Dispersion and milling can be parallel rather than sequential processes
Theoretical
Actual
Dispersion vs. Breakage

© 2012 HORIBA, Ltd. All rights reserved.
Auto Measurement Setup
Fastest way to get great dataNeed to make three choices
What starts the measurement?
What scans are good?
What stops the measurement?

© 2012 HORIBA, Ltd. All rights reserved.
Auto Measurement Screens
Measurement Scans, possible Stop condition
Blank Scans, not important
Just a visual guide

© 2012 HORIBA, Ltd. All rights reserved.
Auto Measurement Screens
What gets turned OFF after measurement finished, generally leave all three checked

© 2012 HORIBA, Ltd. All rights reserved.
Auto Measurement Screens
What is turned ON to acquire the Blank

© 2012 HORIBA, Ltd. All rights reserved.
Auto Measurement Screens
Possible Start condition using intensity
Other possible Stop condition
What scans are “good”
© 2012 HORIBA, Ltd. All rights reserved.
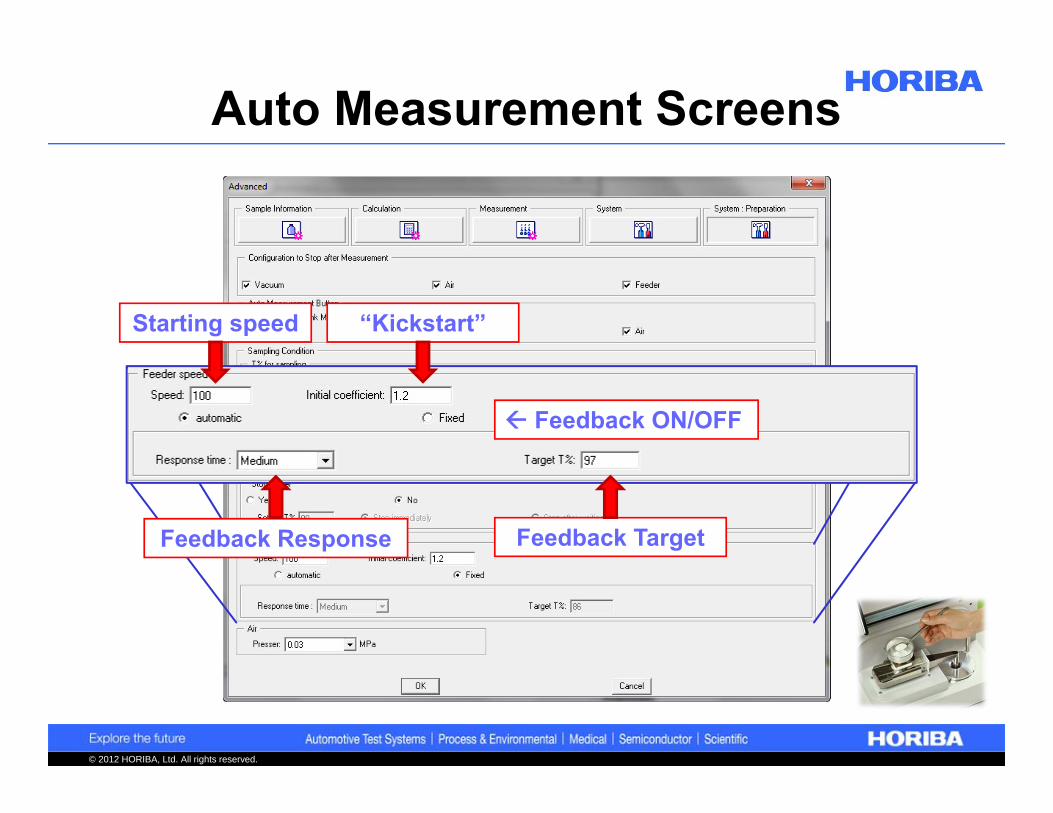
Auto Measurement Screens
Starting speed “Kickstart”
Feedback Target Feedback Response
Feedback ON/OFF
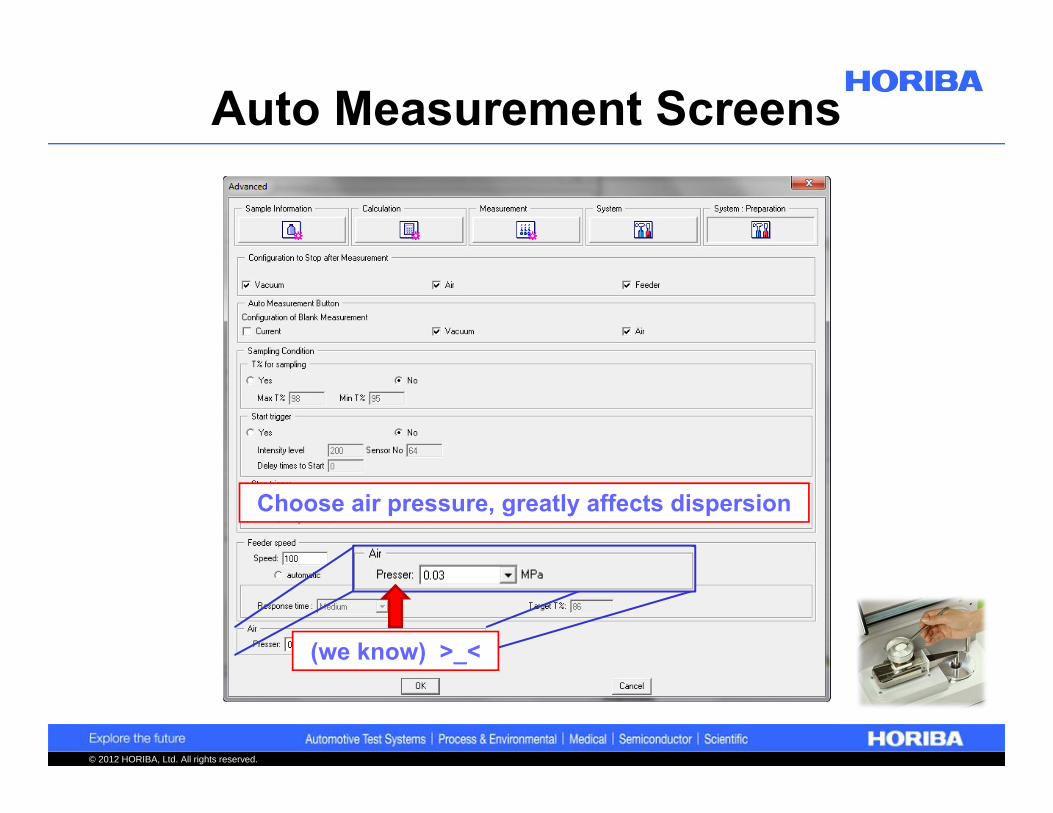
© 2012 HORIBA, Ltd. All rights reserved.
Auto Measurement Screens
Choose air pressure, greatly affects dispersion
(we know) >_<

© 2012 HORIBA, Ltd. All rights reserved.
Starting a Measurement
Two OptionsBegin collecting scans immediatelyWait for Detector/Channel/Sensor to
activate when powder flows (Start Trigger)
Typically, we choose Option 1
Take care with the Stop Trigger and powder loading on feeder tray

© 2012 HORIBA, Ltd. All rights reserved.
Stopping a Measurement
Two OptionsTimed measurement (number of Scans)Measure all powder (Stop Trigger)
Typically, sampling determines choiceChoose timed measurement for easy Measure entire tray for difficult sampling
Take care to use wait period (Delay)with Stop Trigger

© 2012 HORIBA, Ltd. All rights reserved.
During the Measurement
Collect all scans or only “good”?T% control improves precisionTight range = best precisionTake care with very agglomerated powders
To Feedback, or not to FeedbackWe always use thisTake care that Target T% is inside
T% range for “good” scans

© 2012 HORIBA, Ltd. All rights reserved.
Superior Dry Powder Feeder
Feedback control of sample flow rateThis is critical
– Maximum precision– No ghost peaks or funny business– Fewer headaches!
Unique to HORIBASupersonic dispersionAuto Measurement function

© 2012 HORIBA, Ltd. All rights reserved.
What we’ll talk about
Why measure dry?
Sampling & dispersion tips
Unique PowderJet features
Method development studies

© 2012 HORIBA, Ltd. All rights reserved.
First get sampling right & determine RI Measure at 3 different pressures (low, medium, high) Determine optimum pressure based on good
dispersion while not breaking particles Can also compare dry vs. wet measurements Adjust other settings to optimize sample
concentration & duration Ideally measure all of powder placed into the sampler
Segregation can occur on vibrating tray Constant mass flow rate important for stable concentration
during measurement
Once settings chosen, test reproducibility
Dry Method Workflow
© 2012 HORIBA, Ltd. All rights reserved.
Reproducible method that tracks product performance You might have other goals
Accuracy: tricky subject, is it the “real” particle size? Repeatability: liquid suspension re-circulating in sampler Reproducibility: prepare, measure, empty, repeat Resolution: optimize to find second populations Match historic data (sieves), but quicker, easier technique
Use structured approach for any decision/choice that may influence result
Have data to support selections made Document process so colleagues understand
your choices
Goals for any Method

© 2012 HORIBA, Ltd. All rights reserved.
(A) Low accuracy, low precision measurements form a diffuse, off-center cluster; (B) Low accuracy, high precision measurements form a tight off-center cluster; (C) High accuracy, low precision measurements form a cluster that is evenly distributed but distant from the center of the target; (D) High Accuracy, high precision measurements are clustered in the center of the target.
LOW ACCURACYLOW PRECISION LOW ACCURACY
HIGH PRECISION HIGH ACCURACYLOW PRECISION HIGH ACCURACY
HIGH PRECISION
Accuracy vs. Precision

© 2012 HORIBA, Ltd. All rights reserved.
Reproducibility!Prepare, measure, empty, repeat
What would be good reproducibility?Look at the accepted standards
ISO 13320COV < 3% at Median (D50) COV = 100*(StDev / Mean)COV < 5% at D10 and D90
USP <429>COV < 10% at Median (D50)COV < 15% at D10 and D90
Note: All limits double when D50 < 10 µmNote: Must acquire at least 3 measurements from unique samplings
The Basis for Reliable Data

© 2012 HORIBA, Ltd. All rights reserved.
Unique, automatic feature in LA-950 softwareSee Technical Note 169 in Download Center
for instructions to use these features
Calculation Automation

© 2012 HORIBA, Ltd. All rights reserved.
Dry Method DevelopmentCase Studies
Magnesium StearateMicrocrystalline Cellulose

© 2012 HORIBA, Ltd. All rights reserved.
High = 3 barMid = 2 barLow = 1 bar
Effect of Air Pressure: Mg Stearate

© 2012 HORIBA, Ltd. All rights reserved.
0
2
4
6
8
10
12
14
16
18
D90D50D10
D90 15.258 14.394 12.822
D50 8.626 8.149 7.502
D10 4.862 4.564 4.234
1 2 3
Effect of Air Pressure: Mg Stearate

© 2012 HORIBA, Ltd. All rights reserved.
Reproducibility Test at 3 Bar

© 2012 HORIBA, Ltd. All rights reserved.
Reproducibility Test at 2 Bar

© 2012 HORIBA, Ltd. All rights reserved.
Reproducibility Test at 1 Bar

© 2012 HORIBA, Ltd. All rights reserved.
Effect of Air Pressure: MCC

© 2012 HORIBA, Ltd. All rights reserved.
0
50
100
150
200
D90D50D10
D90 161.158 160.713 144.259
D50 65.938 64.599 58.578
D10 25.76 24.308 22.655
1 2 3
Effect of Air Pressure: MCC

© 2012 HORIBA, Ltd. All rights reserved.
Reproducibility Test at 3 Bar

© 2012 HORIBA, Ltd. All rights reserved.
Wet and Dry Comparison

© 2012 HORIBA, Ltd. All rights reserved.
PowderJet Applications (TiO2)

© 2012 HORIBA, Ltd. All rights reserved.
PowderJet Applications (Zirconia)

© 2012 HORIBA, Ltd. All rights reserved.
PowderJet Applications (Zirconia)

© 2012 HORIBA, Ltd. All rights reserved.
PowderJet Applications (Zirconia)

© 2012 HORIBA, Ltd. All rights reserved.
Large Particle Detection
q(
%)
Diameter(µm)
0
14
2
4
6
8
10
12
10.00 3000100.0 10000
100
10
20
30
40
50
60
70
80
90Coffee Results
Need exceptionally stable optical benchVertical design means no density limit
for dry

© 2012 HORIBA, Ltd. All rights reserved.
LA-950: Laser Diffraction
Particle size performance leaderNinth generationUltra durableLowest total cost of ownershipSuspension, emulsion, powder,
paste, gel10 nanometer – 3 mm

© 2012 HORIBA, Ltd. All rights reserved.
For More Details
Visit www.horiba.com/us/particle
Contact us directly at [email protected]
Visit the Download Center to find this recorded presentation and many more on other topics

© 2012 HORIBA, Ltd. All rights reserved.
Danke
Gracias
Большое спасибо
GrazieاُشْكرΣας ευχαριστούμε
감사합니다 Obrigado
Tacka dig
谢谢ขอบคุณครบั
ありがとうございました
धन्यवादநன்ற