holiday watch - icscholiday.icsc.org/2011/holidaywatch2011.pdf · holiday watch media guide. ......
TRANSCRIPT

Holiday WatchMedia Guide: 2011Holiday Facts & FiGures

table oF contents
Welcome Letter ...............................3
Media Alert ....................................4
Gifts: What’s the Consumer Buying?...5
Gifts: What’s Hot This Season? .........6
Holiday Fun Facts /Survey Results .....8
Holiday Forecasting ...................... 10
Michael P. Niemira Bio .................. 18
As the 2011 holiday season approaches, the International Council of
Shopping Centers (ICSC) is pleased to provide you with our annual
Holiday Watch Media Guide.
ICSC will be releasing weekly holiday sales figures throughout the holiday season, beginning Tuesday,
November 22, 2011. The sales figures, which provide a week-over-week and year-over-year comparison,
will be available on ICSC’s Holiday Watch Website: http://holiday.icsc.org at 7:45 a.m each Tuesday.
Once again, our Holiday Watch Media Guide contains the Hot Gifts List, Holiday Fun Facts, Holiday
Forecast and information on all holiday GAFO sales. For your reference, in this document these mea-
sures are referred to as:
• GAFO Store Sales are sales generated at stores that specialize in department-store type
merchandise (General Merchandise, Apparel and Accessory, Furniture, and Other which includes
electronics, computers, sporting goods, music, books, hobby, office supplies, stationery and gift
stores). These data are compiled by the U.S. Department of Commerce.
• ChainStoreSalesIndex are those receipts generated by non-anchor tenants at regional and
super-regional malls in the United States. These data are compiled by ICSC from a representative
sample of over 500 malls and cover stores selling apparel, furnishings, stationery/cards/gifts/novelty,
books, sporting goods/bicycles, toys/educational/hobby, personal care, jewelry, other GAFO-type
merchandise, food service and other non-GAFO merchandise and services.
• Shopping-Center-Inclined Retail Sales are compiled from U.S. Census Bureau retail sales
data. This series includes general merchandise, apparel, furniture, electronic and other store sales
(GAFO) plus health and personal care store sales, food and beverage sales and building materials.
In addition, ICSC will be releasing the results of a number of consumer surveys. Results will be posted
on ICSC Holiday Watch Website at: http://holiday.icsc.org throughout the holiday season. So, as you
begin to make your holiday season plans, remember to look to ICSC as your source for holiday related
information.
HappyHolidaysfromICSC!
from icsc
3
Happy Holidays

INTERVIEW OPPORTUNITY
ICSC’s staff vice president, chief economist and director of research, Michael P. Niemira, is available
to provide in-depth analysis, including consumer perceptions, purchasing patterns, and trends.
Telephone and in-person interviews can be arranged. Please call ICSC’s Media Relations Department
at: +1 728-3814/3515 to arrange an interview.
Founded in 1957, ICSC is the premier global trade association of the shopping center industry. Its
more than 55,000 members in over 90 countries include shopping center owners, developers, managers,
marketing specialists, investors, retailers and brokers, as well as academics and public officials. As the
global industry trade association, ICSC links with more than 25 national and regional shopping center
councils throughout the world. For more information, visit www.icsc.org.
4
Media Alert
contacts International Council of Shopping Centers (ICSC) Malachy Kavanagh +1 646 728-3495 Jesse Tron +1 646 728-3814 Brittany Hays +1 646 728-3515
what The International Council of Shopping Centers (ICSC) will release its Weekly Chain Store Sales Report, a weekly report that measures nominal same-store or comparable-store sales excluding restaurants and vehicles demand, throughout the holiday season beginning Tuesday, November 22, 2011.
when Retail sales reports will be released at 7:45 a.m. Eastern Standard Time on:
DATE OF RELEASE DATA PERIOD
Tuesday, November 22, 2011 November 13 -19
Tuesday, November 29, 2011 November 20 -26
*Thursday, December 1, 2011 Month of November
Tuesday, December 6, 2011 November 27 -December 3
Tuesday, December 13, 2011 December 4 -10
Tuesday, December 20, 2011 December 11-17
Tuesday, December 27, 2011 December 18 -24
*Thursday, January 5, 2012 Month of December
Tuesday, January 3, 2012 December 25 -December 31
Tuesday, January 10, 2012 January 1- January 7
*Thursday, February 2, 2012 Month of January
* Indicates monthly report, released at 12:00 p.m. EST
Gifts
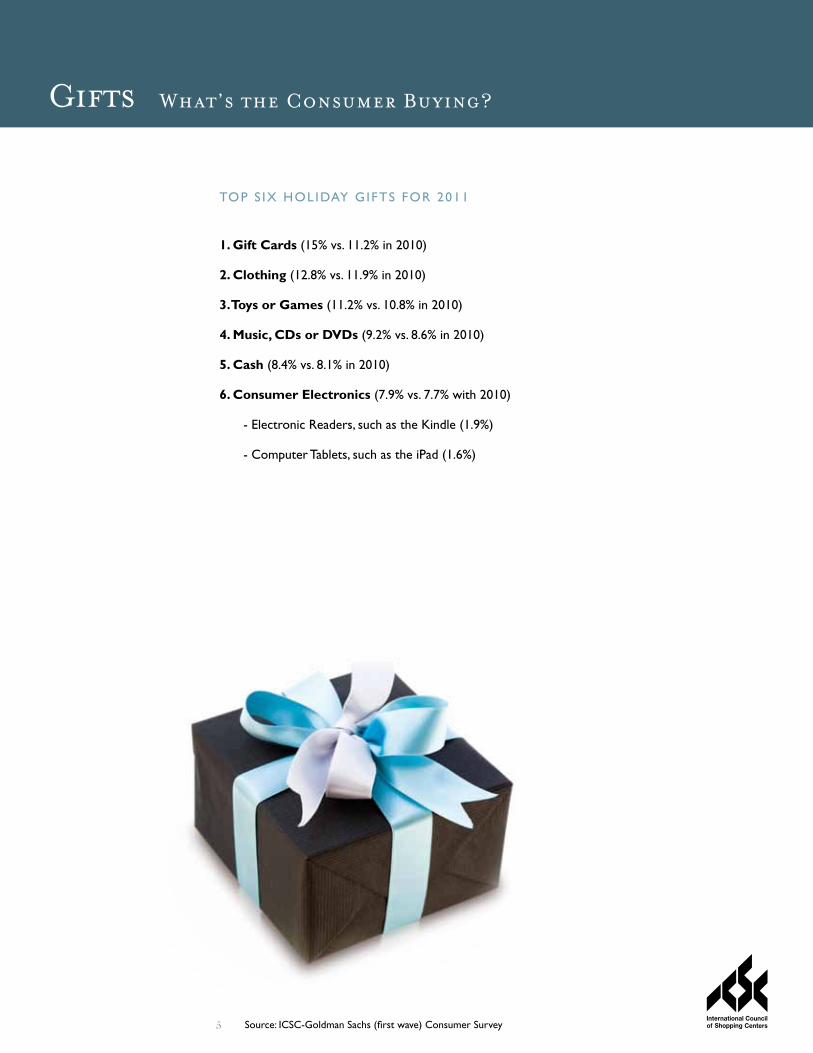
Source: ICSC-Goldman Sachs (first wave) Consumer Survey
What’s the Consumer Buying?
TOP S Ix HOLIDAY GIFTS FOR 2011
1.GiftCards(15% vs. 11.2% in 2010)
2.Clothing(12.8% vs. 11.9% in 2010)
3.ToysorGames(11.2% vs. 10.8% in 2010)
4.Music,CDsorDVDs(9.2% vs. 8.6% in 2010)
5.Cash(8.4% vs. 8.1% in 2010)
6.ConsumerElectronics(7.9% vs. 7.7% with 2010)
- Electronic Readers, such as the Kindle (1.9%)
- Computer Tablets, such as the iPad (1.6%)
5

Gifts
TOYS*
• AngryBirdsKnockonWoodGameMattel/ages 5 years & up Approx. Retail Price: $14.99
• Beyblade:MetalFusionHasbro/ages 8 years & up Approx. Retail Price: $24.00
• BigActionConstructionSiteFisher Price/ages 2.5 years & up Approx. Retail Price: $59.99
• DaGeDarCepia, LLC/ages 5 years & up Approx. Retail Price: $4.99
• FyrFlyzi-Star Entertainment ages 8 years & up Approx. Retail Price: $10.00
• HotWheelsWallTracksMattel/ ages 4 years & up Approx. Retail Price: $17.99
• InnoTabVtech/ages 4 years & up Approx. Retail Price: $79.99
• LalaloopsySillyHairJewelSparklesMGA Entertainment ages 4 years & up Approx. Retail Price: $34.99
• LazerStuntChaserDragonFireThinkway Toys/ages 4 years & up Approx. Retail Price: $39.99
• LeapPadExplorerLeapFrog/ages 4 years& up Approx. Retail Price: $99.99
• LEGOAlienConquestLEGO/ages 7 years & up Approx. Retail Price: $29.99
• LEGONinjagoLEGO/ages 8 years & up Approx. Retail Price: $69.99
• LiteSpritesWowWee/ages 4 years & up Approx. Retail Price: $29.99
• TheLogoBoardGameSpin Master/ages 12 years & up Approx. Retail Price: $24.99
• MonsterHighDeadTiredMattel/ages 6 years & up Approx. Retail Price: $11.99
• NerfVortexHasbro/ages 8 years & up Approx. Retail Price: $9.99
• RedakaiSpin Master/ages 6 & up Approx. Retail Price: $12.99
• SpyNetStealthVideoGlassesJakks Pacific/ages 8 & up Approx. Retail Price: $39.99
• 3DBreakThroughPuzzle-ClassicMickeyMouseMEGA Brands/ages 8 years & up Approx. Retail Price: $19.99
ELECTRONICS**
Phones:• iPhone 4S
• EVO 3D Smart Phone
• Galaxy S II Epic 4G
• Droid Bionic 4G Black Smartphone
DigitalCameras:• Canon EOS Rebel T3i Black SLR
Digital Camera Kit w/18-55mm Lens
• Nikon Coolpix L120 Black Digital Camera
• Canon PowerShot S95 Black Digital Camera
• Samsung SH100 Red Digital Camera (14MP, 5x Opt, microSD Slot, Wi-Fi)
MP3Players:• iPod Touch 8 GB White 4th
Generation
• Sansa Fuze 8GB Black MP3 Player
• iPod shuffle 4th Generation 2GB Blue MP3 Player
• iPod nano 6th Generation 8GB Silver MP3 Player
Televisions:• Sony BRAVIA KDL-32Ex720 32”
3D LED TV
• Panasonic Viera TC-P60ST30 60” 3D Plasma TV
• LG 55LW6500 55” 1080p LED TV With 240 Hz
• Samsung UN55D6300 55” LED TV (1920x1080, 120Hz, HDTV, LED Edgelight)
GamingConsuls:• PlayStation 3 Slim Black
160GB Console
• xbox 360 Black 4GB Console
• Nintendo Wii Console
VideoGames:• Battlefield 3 -
Limited Edition (PS3)
• Call of Duty: Modern Warfare 3 (xbox 360)
• Batman: Arkham City (PS3, 3D)
• The Sims 3: Pets (PC/Mac)
Other:• iPad 2 16 GB
• MacBook Air 11.6” Silver Netbook
• Kindle Fire
• Kindle 6”inch
* Source for toys: www.timetoplaymag.com ** Source for electronics: Yahoo
what’s hot this season?
6

Gifts
TRENDS:APPAREL&ACCESSORIES***
• “ShapeShifters”:Clothing that changes the silhouette, creating movement away from the body, changes a person’s natural shape, hem lines that “can not make up their minds”
• “SoftTop”: Sheer fabrics, flows softly, easy to wear
• “PalazzoPants”: long, loose, wide cut pants
• “TuxedoJackets”: sporty, dressy, men’s wear for women
• “RazzleDazzle”: sequence, sequence, and more sequence, sequence accents, and jeweled accessories
• “CostumeJewelry”: Big gems, oversized earrings, and bangle bracelets
• “ColorComeback”: bright colors, previous trend of mixing black with a color but now a new trend of color on color, various fabric types coming in bright colors and even colored furs
• “Warm&Fuzzy”: Big bulky sweaters, sweater wardrobe- dresses, skirts, and shirts
• “FurforAll”:Fake fur, real fur, fur accents, fur vests, fur handbags, and fur shrugs
• “AnimalMagnetism”: Animal print especially zebra and leopard accents, animal print on shoes, dresses, and shirts, feather accents, and feather earrings
• “Handcraft”:Accessory items that look like they are homemade
• “Personalization”: D.I.Y kits, creating unique designs with make-up and nail polish, monogramming accessory items such as watches and sneakers
• “Nordic”: Nordic/artic patterned sweaters, knits, and dresses
• “Travel”: Bright colored luggage, pocket sized technology “toys” such as pocket translators or alarm clocks
• “TechApparel”: high performance fabrics, lightweight, and multipurpose clothing
• “LabelHandbags:” Handbags with a “status” label, well known and easily recognizable name brands
• “WinterWarmers”: Plush slippers, mufflers, ski hats, boots, comfortable and warm lounge wear
• “Watches”: Coordinating a watch with every outfit, watch cuff links, bright colored watch faces and bands
• “WearNow”: Apparel that can be worn right away, more practical, in-season apparel, less “gifty” items more practical items that can be used everyday
*** Source for Apparel and Accessories: The Doneger Group
what’s hot this season?
7
f 34% of consumers will shop on the day after Thanksgiving which is equivalent to about 81 million
people, 16 years and over. This is up from 31% in 2010.
f 74% of all malls surveyed spend $20,000 or more on decorations for the holidays where as 26%
of malls will spend $10,000 or less.
f January is the most common month that “holiday” gift cards are redeemed.
f 98% of centers will participate in a holiday gift certificate incentive program or offer free giveaways.
f The most frequent denomination of gift cards sold in 2010 were $30 according to 44% of centers,
followed by $25 according to 30% of centers.
f 98% of centers typically start decorating for the holiday season during the first week of
November, where as 2% of centers will wait until after Thanksgiving to start decorating.
f All centers surveyed said they will offer extended operating hours during the 2011 holiday season
starting on or after Black Friday.
f 98% of centers surveyed said they will offer special amenities for holiday shoppers this year such
as gift wrap stations, valet parking, refreshments, and promotional gift cards with purchase.
f All centers surveyed will engage in a philanthropic campaign to raise money or merchandise for
the holidays this year. Campaigns include; entertainment concerts, toy drives, tree lightings, giving
trees, benefit walks, food drives, and clothing drives.
f All centers surveyed said they will advertise for the 2011 holiday season using TV, print, social
media, direct mail, e-blast, mobile messaging, radio, and billboards.
8
Holiday Fun Facts /Survey Results:
* Results based on a survey conducted by ICSC

9
Holiday Fun Facts /Survey Results:
f All centers surveyed said they will use a social media campaign to attract consumers to their malls
using the following platforms; Facebook, Twitter, YouTube, Foursquare, and mobile technologies.
f All centers surveyed said they will use mobile marketing or location technologies to drive
foot traffic.
f 55% of centers said they will employ two Santa’s for the holiday season, 44% of centers said the
will employ one Santa for the holiday season.
f Santa typically makes his “first appearance” in 75% of centers during the second week
of November.
f Jingle Bells is the most popular holiday song played in 98% of the centers.
f 56% of centers believe foot traffic will increase during this holiday season compared to last year.
f 30% of centers will make additional arrangements to deal with the increased amount of parking
spaces needed for the holiday shopping season.

2011 U.S . HOLIDAY SP IR IT RECOMMENCES
Momentum is Good, But Headwinds Intensify
The International Council of Shopping Centers (ICSC) forecasts that U.S. holiday sales in 2011 will
post a moderate gain, though somewhat subdued relative to its prior year’s pace. Based on ICSC’s
metric of industry performance, shopping-center sales are expected to increase by 2.2 percent
during November and December 2011 and relative to those same months of the prior year. In 2010,
the holiday season posted a 5.0 percent gain following two back-to-back declines, which were a result
of the severe 2007-09 recession.
More broadly, three common measures of U.S. industry holiday sales—shopping-center sales, ICSC’s
composite of major chains and “GAFO-store” sales—all are expected to increase in 2011 by a slower
pace of between 0.3 and 2.8 percentage points, depending on the metric, compared with its 2010 holiday
performance. [Editors Note: Please see below for description of each measure of U.S. industry holiday sales.]
“Although there are many statistics and surveys that convey the magnitude of holiday sales, the qualitative
themes are more important than a ‘point estimate’ based on any specific metric,” noted Michael P.
Niemira, ICSC’s chief economist and vice president for research.
“The ICSC holiday sales forecast contains at least four messages: (1) No matter which metric of perfor-
mance is used, ICSC projects 2011 U.S. holiday sales are likely to advance at a slower pace than in 2010 as
strong economic headwinds continue to persist; (2) The 2011 holiday season forecast also envisions a pace
of sales considerably slower than during the first half of 2011 since retail sales generally advanced at a faster
pace in early 2011 than during the 2010 holiday season; (3) Compared with the previous 10-year sales
performance, 2011 is likely to be near-to-above average depending on the sales metric; (4) The economic
and political risks are expected to be higher during the upcoming season than during 2010. But still, on
balance, ICSC’s 2011 holiday sales forecast portrays a moderately healthy performance,” Niemira added.
U.S. Holiday-Season SpendingNovember–December Periods, Not Seasonably Adjusted, Billions of Dollars Unless Otherwise Noted
Category 2006 2007 2008 2009 2010 ForecastICSC Index of Chain Store Sales (Same Store), 2005=100 % Change 4.4 1.1 -5.6 2.3 3.8Shopping-Center Sales (Billions of Dollars) $432 $439 $421 $418 $439
$248 $252 $236 $233 $243 % Change 3.0 1.8 -4.2 -0.6 5.0
3.6 1.6 -6.1 -1.3 4.1
2011
3.5$449.00
140.3 141.8 133.8 137.0 142.2 147.2
$2502.2
3.0GAFO-Store Sales (Billions of Dollars) % ChangeSources: U.S. Department of Commerce; ICSC Research.
Holiday Forecasting
U.S.HOLIDAY-SEASONSPENDINGNovember–December Per iods , Not Seasonably Adjusted
10

Holiday Forecasting
11
Year Jan-Oct Nov-Dec Difference
Length of the ShoppingSeason (Days Between
Thanksgiving and Christmasdays)
Day of theWeek forChristmas
Hanukkah(holiday startsnight before)
1993 2.9 3.7 0.8 29 Saturday 12/91994 3.9 3.3 -0.6 30 Sunday 11/281995 2.1 1.9 -0.2 31 Monday 12/181996 2.8 2.5 -0.3 26 Wednesday 12/61997 4.2 4.0 -0.2 27 Thursday 12/241998 5.0 4.1 -0.8 28 Friday 12/141999 6.5 5.1 -1.5 29 Saturday 12/42000 4.2 1.9 -2.3 31 Monday 12/222001 1.4 0.3 -1.0 32 Tuesday 12/102002 2.2 -0.3 -2.5 26 Wednesday 11/302003 2.4 4.1 1.7 27 Thursday 12/202004 4.6 2.5 -2.1 29 Saturday 12/82005 4.0 4.0 0.0 30 Sunday 12/262006 4.9 4.4 -0.5 31 Monday 12/162007 3.2 1.1 -2.1 32 Tuesday 12/52008 0.2 -5.6 -5.8 27 Thursday 12/222009 -3.1 2.3 5.4 28 Friday 12/12
3.2 2.9 -0.3 29
2010 3.2 3.8 0.6 29 Saturday 12/22011 F 5.2 3.5 3.5 30 Sunday 12/21Jan-Sep:
In 2011, Holiday Expenditures in the Form of a Gift Card: 15% expectedIn 2010 ……………………………………………………………… 14.6 In 2009 ……………………………………………………………… 13.1 In 2008…………………………………………………………….… 13.6In 2007 ……………………………………………………………… 14.7In 2006 ……………………………………………………………… 17.9In 2005 ……………………………………………………………… 13.1In 2004 ……………………………………………………………… 14.5In 2003 ……………………………………………………………… 13.5
Source: ICSC surveys
GIFTCARDIMPACTONSHOPPINGSEASON
Gi f t CardBenchmarks
ICSCCHAINSTORESALES INDExYEAR/YEAR %ChangeinSalesDuringJan-OctPeriodaheadofandDuringtheHolidaySeason
TRADITIONALHOLIDAYPERIOD CHAINSTORESALES
SamestoreBasisNovember-DecemberAverages
Source: ICSC Research
Source: ICSC Research
Segments2011
Forecast 2010 2009 2008 2007 2006 2005
TotalIndustrySales 3.5 3.8 2.3 -5.6 1.1 4.4 4.0
Apparel Specialty
Department Stores
Luxury
Discounters
Wholesale Clubs
Drug Stores
2.5
4.0
7.5
2.5
6.0
2.0
3.6
5.7
6.7
3.0
7.1
2.0
1.2
1.9
9.0
3.6
8.3
-1.0
-10.6
-9.5
-17.6
0.8
-2.5
2.0
-1.8
-6.4
-1.7
1.1
5.8
2.6
-0.4
5.1
9.7
2.4
4.4
7.9
2.4
3.1
6.0
3.1
6.7
5.8

Holiday Forecasting
Category 2001 2002 2003 2004 2005 2006 2007 2008 2009 20102011
Forecast
GAFOStoreSales%Change
$204.33.4
$206.31.0
$215.84.6
$226.85.1
$239.25.5
$247.83.6
$251.71.6
$236.3-6.1
$233.4-1.3
$242.94.1
$250.23.0
Electronics & Appliances% ChangeAppliances, TV & Camera% ChangeComputer & Software Sales% Change
Clothing & Accessory Stores% ChangeMen’s clothing stores% ChangeWomen’s clothing stores% ChangeShoe stores% Change
Sporting Good, Hobby, Book & Music% Change
General Merchandise% ChangeDept. stores (ex. leased depts.)% ChangeOther general merchandise % Change
Warehouse clubs & superstores% Change
All other general merchandise% Change
Electronic shopping & mail-order% Change
19.16.3
15.27.13.40.1
40.0-1.72.0
-12.06.7
-0.74.40.7
19.24.7
99.55.0
55.9-3.443.618.235.819.97.8
11.023.6-5.5
19.1 -0.3 15.3 0.4 3.2
-3.8 41.3 3.5 1.9
-4.1 6.7 0.9 4.4
-0.2 18.9 -1.5
100.1 0.6
52.1 -6.7 48.0 10.0 40.2 12.6 7.7
-1.7 25.5 8.0
20.8 9.4
16.7 9.4 3.5 8.4
43.4 5.0 2.0 4.8 7.3 8.2 4.5 2.7
18.8 -0.4
105.2 5.1
51.6 -1.0 53.6 11.7 45.0 11.8 8.6
11.3 28.3 11.1
22.2 6.4
18.2 8.8 3.7 5.5
45.7 5.3 2.1 5.0 7.5 3.8 4.6 1.7
19.0 1.3
111.0 5.5
52.5 1.7
58.5 9.2
49.6 10.4 8.8 2.8
33.0 16.7
23.7 6.9
19.4 6.5 4.0 7.2
48.8 6.7 2.1
-0.6 8.1 7.3 5.1
11.7 19.5 2.5
117.1 5.5
52.3 -0.5 64.9 10.9 55.6 12.1 9.2 4.7
38.2 15.8
25.6 8.1
21.0 8.3 4.5
14.1 50.9 4.4 2.1 3.3 8.4 3.3 5.3 3.2
19.2 -1.8
122.0 4.1
51.8 -0.8 70.1 8.1
60.5 8.8 9.6 4.4
42.8 11.8
26.3 2.5
21.4 2.1 4.6 1.5
51.3 0.8 2.0
-4.2 8.5 2.2 5.2
-0.3 19.5 1.7
125.8 3.2
50.4 -2.7 75.4 7.5
65.7 8.5 9.7 1.0
46.9 9.6
23.6 -10.0 19.2
-10.4 4.5
-1.5 45.6
-11.2 1.8
-13.3 7.4
-13.3 4.9
-7.2 18.3 -5.8
124.3 -1.3 46.8 -7.2 77.5 2.7
68.0 3.6 9.4
-3.4 45.2 -3.5
22.6 -4.5 18.4 -4.4 4.6 0.4
45.6 -0.1 1.6
-7.7 7.4
-0.4 4.9 0.0
18.1 -1.4
124.2 -0.0 45.2 -3.5 79.1 2.1
68.8 1.1
10.3 9.4
51.6 14.0
22.7 0.7
18.0 -1.9 5.1
11.2 48.6 6.7 1.8 8.4 7.8 6.2 5.2 7.2
19.4 7.4
128.5 3.5
45.3 0.4
83.2 5.2
72.2 5.0
11.0 6.7
60.2 16.8
23.6 4.0
- - - -
51.0 5.0
- - - - -
-19.4 0.0
131.8 2.5
- - - - - - - - -
66.2 10.0
ShoppingCenter-InclinedSales%Change
353.23.6
357.71.3
375.04.8
397.05.9
419.15.6
431.83.0
439.41.8
420.9-4.2
418.3-0.6
439.35.0
448.82.2
Online & Mail-Orders/S-C Sales PLUS (% Share)
6.3 6.6 7.0 7.7 8.4 9.0 9.6 9.7 11.0 12.1 12.9
ChainStoreSalesIndex 0.3 -0.3 4.1 2.5 4.0 4.4 1.1 -5.6 2.3 3.8 3.5
“TRADITIONAL”HOLIDAYSEASONSPENDINGTRENDSBillions of Dollars, November–December Periods, Not Seasonably Adjusted
Sources: U.S. Department of Commerce; ICSC Research.
12

Holiday Forecasting
Category 2001 2002 2003 2004 2005 2006 2007 2008 2009 20102011
Forecast
GAFOStoreSales%Change
$267.63.5
$271.51.5
$286.35.5
$299.94.8
$317.86.0
$330.13.9
$335.21.6
$318.4-5.0
$314.7-1.2
$324.93.2
$335.63.3
Electronics & Appliances% ChangeAppliances, TV & Camera% ChangeComputer & Software Sales% Change
Clothing & Accessory Stores% ChangeMen’s clothing stores% ChangeWomen’s clothing stores% ChangeShoe stores% Change
Sporting Good, Hobby, Book & Music% Change
General Merchandise% ChangeDept. stores (ex. leased depts.)% ChangeOther general merchandise % Change
Warehouse clubs & superstores% Change
All other general merchandise% Change
Electronic shopping & mail-order% Change
25.7 5.5
20.1 6.4 4.8
-0.5 50.3 -0.8 2.5
-12.3 8.6
-0.1 5.8 1.5
25.2 5.2
129.5 5.0
70.4 -3.5 59.1 17.4 48.9 19.2 10.2 9.3
33.5 -2.2
25.6 -0.5 20.3 0.7 4.6
-5.2 52.2 3.7 2.4
-3.1 8.8 1.5 5.8
-0.9 24.9 -1.1
131.6 1.6
66.1 -6.1 65.5 10.8 55..4 13.3 10.1 -0.8 36.0 7.3
28.0 9.5
22.2 9.7 5.0 8.2
55.2 5.8 2.5 5.1 9.5 8.7 6.0 3.8
25.2 1.0
139.6 6.0
65.7 -0.6 73.9 12.7 62.6 13.0 11.3 11.0 40.3 12.0
29.8 6.3
24.3 9.2 5.2 3.9
57.8 4.6 2.6 4.0 9.9 3.6 6.1 1.5
25.3 0.7
147.2 5.5
66.7 1.6
80.5 9.0
69.0 10.2 11.5 1.9
46.2 14.7
32.2 8.2
26.2 7.9 5.5 7.6
61.7 6.8 2.6
-0.6 10.6 7.5 6.8
11.8 26.3 3.7
155.8 5.8
66.3 -0.7 89.5 11.2 77.3 12.0 12.2 6.2
54.1 17.0
34.4 6.6
28.0 6.8 6.2
12.2 64.9 5.2 2.8 4.7
10.9 3.1 7.0 3.2
25.7 -2.1
162.9 4.6
65.9 -0.5 97.0 8.3
84.3 9.0
12.6 3.8
60.3 11.6
35.0 1.9
28.5 1.9 6.2 0.2
65.6 1.1 2.7
-3.6 11.1 1.3 7.0
-0.4 26.3 2.4
168.1 3.2
63.7 -3.4
104.4 7.7
91.5 8.4
13.0 2.6
65.5 8.6
32.0 -8.5 26.1 -8.5 6.1
-2.4 59.1 -9.9 2.3
-12.9 9.7
-12.7 6.5
-7.1 25.1 -4.7
167.9 -0.1 59.5 -6.6
108.4 3.8
95.8 4.7
12.6 -2.8 63.4 -3.2
30.3 -5.4 24.6 -5.9 6.2 1.8
58.9 -0.3 2.1
-7.6 9.7
-0.1 6.5 0.2
24.8 -1.2
168.5 0.4
57.6 -3.2
110.9 2.3
97.1 1.4
13.8 9.5
71.7 13.1
30.4 0.2
24.0 -2.1 6.8 9.2
62.3 5.8 2.3 7.4
10.1 4.5 6.9 5.8
26.2 5.6
173.3 2.9
57.3 -0.4
116.0 4.6
101.4 4.4
14.6 6.2
83.4 16.3
31.1 2.5
- - - -
65.7 5.5
- - - - - -
26.5 1.0
178.5 3.0
- - - - - - - -
93.4 12.0
ShoppingCenter-InclinedSales%Change
485.33.8
494.41.9
520.15.2
547.75.3
580.25.9
599.23.3
609.81.8
588.8-3.4
583.9-0.8
610.14.5
625.32.5
Online & Mail-Orders/S-C Sales PLUS (% Share)
6.5 6.8 7.2 7.8 8.5 9.1 9.7 9.7 10.9 12.0 13.0
“ExTENDED”HOLIDAYSEASONSPENDINGTRENDSBillions of Dollars, November–December Periods, Not Seasonably Adjusted
Sources: U.S. Department of Commerce; ICSC Research.
13
ECONOMIC COMMENTARY
2011 U.S. Holiday Hiring Subdued
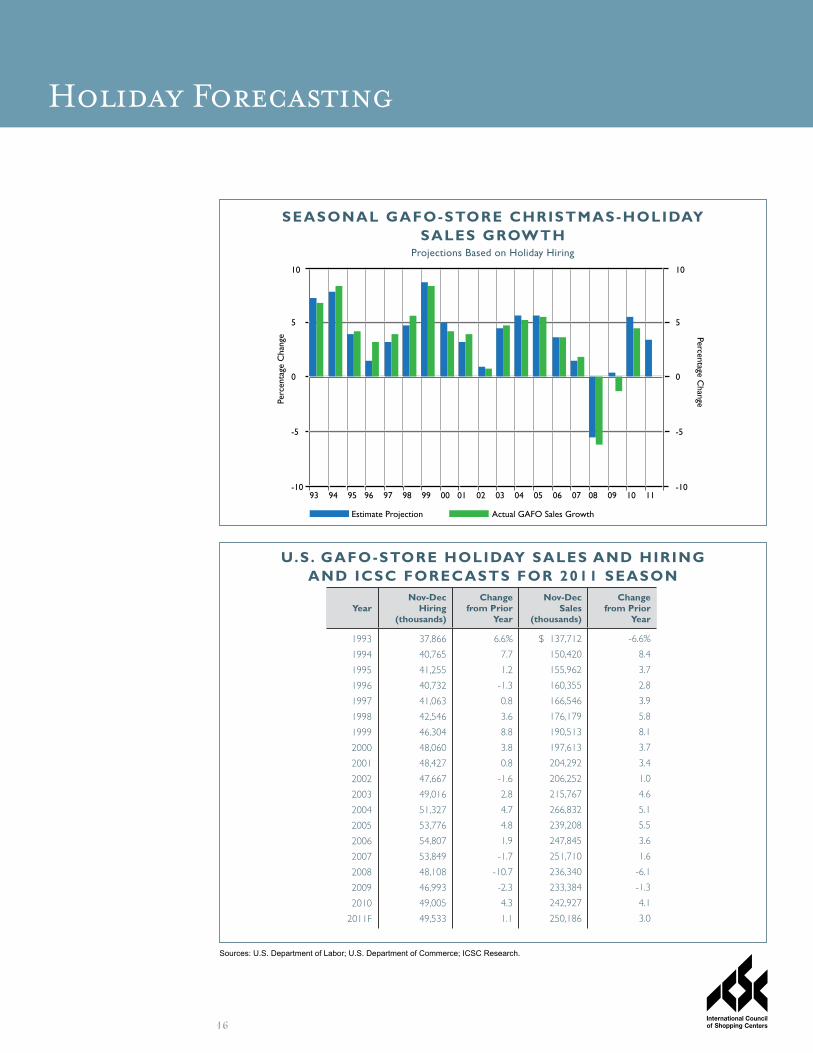
Exploring the Relationship Between Hiring and Sales
Over the past ten years, the average number of U.S. Christmas holiday full or part time retail jobs cre-
ated in November and December was about 50 million. But as Chart 1 shows, seasonal hiring built up
from year to year during the 1990s through its peak season in 2006. During the 2006 holiday season,
hiring at GAFO stores (general merchandise, apparel, furnishings and other similar type stores) reached
its peak at 54.8 million jobs.
To be sure, as companies built up their e-commerce businesses, holiday job hiring in their traditional
stores may have required a smaller in store need, but even if that is so, today’s overall non store (e-com-
merce) retail seasonal hiring for the Christmas holiday is tiny (0.1%) relative to brick and mortar stores.
During this past week, outplacement firm Challenger, Gray & Christmas’ CEO opined that “It would be
surprising if holiday hiring exceeded last year’s level.” ICSC’s 2011 holiday season employment forecast
at GAFO stores is slightly more optimistic than that calling for modest 12% hiring growth. Clearly,
company decisions about seasonal hiring are intertwined with the company’s financial health as well as
its sales expectations. But company staffing decisions seem to matter more for its Christmas holiday
sales performance than maybe widely perceived. As demonstrated in Chart 2, seasonal sales fluctuate
in lock step (but at a different magnitude) as seasonal hiring. Statistically harnessing this relationship
between hiring and sales suggests a close relationship as shown in Table 1 and Chart 3. Indeed, ICSC’s
GAFO holiday sales forecast of 3% (see last week’s report) is consistent with about 1.1% holiday hiring
growth in 2011. However, if Challenger CEO’s view is correct that 2011 holiday hiring will be flat, then
that would imply (statistically—based on our model that was estimated between 1993 and 2010) about
a 2.2% pace for holiday sales. Seasonal hiring is important for the economy, but even more importantly,
it is a driver of retail sales performance!
14
Holiday Forecasting

15
Holiday Forecasting
CHART1 :SEASONALGAFO-
StoreChr istmas-Hol iday Hir ing
CHART2 :HOLIDAYHIRINGHIGHLYCORRELATEDWITHSALESPERFORMANCE
BasedonGAFOStores
55
50
45
40
35
3092 93 94 95 96 97 98 99 00 01 02 03 04 05 06 07 08 09 10
55
50
45
Jobs (Millions)Jo
bs (
Mill
ions
)
40
35
30
10
5
0
-5
-10
-1593 94 95 96 97 98 99 00 01 02 03 04 05 06 07 08 09 10
10
5
0
Percentage Change
Holiday Hiring Growth (Left Scale)Holiday Sales Growth (Right Scale)
Perc
enta
ge C
hang
e
-5
-10
10
5
0
-5
-1093 94 95 96 97 98 99 00 01 02 03 04 05 06 07 08 09 10 11
Perc
enta
ge C
hang
e
Estimate Projection Actual GAFO Sales Growth
Percentage Change
10
5
0
-5
-10
16
Holiday Forecasting
YearNov-Dec
Hiring(thousands)
ChangefromPrior
Year
Nov-DecSales
(thousands)
ChangefromPrior
Year
1993
1994
1995
1996
1997
1998
1999
2000
2001
2002
2003
2004
2005
2006
2007
2008
2009
2010
2011F
37,866
40,765
41,255
40,732
41,063
42,546
46,304
48,060
48,427
47,667
49,016
51,327
53,776
54,807
53,849
48,108
46,993
49,005
49,533
6.6%
7.7
1.2
-1.3
0.8
3.6
8.8
3.8
0.8
-1.6
2.8
4.7
4.8
1.9
-1.7
-10.7
-2.3
4.3
1.1
$ 137,712
150,420
155,962
160,355
166,546
176,179
190,513
197,613
204,292
206,252
215,767
266,832
239,208
247,845
251,710
236,340
233,384
242,927
250,186
-6.6%
8.4
3.7
2.8
3.9
5.8
8.1
3.7
3.4
1.0
4.6
5.1
5.5
3.6
1.6
-6.1
-1.3
4.1
3.0
U.S.GAFO-STOREHOLIDAYSALESANDHIRINGANDICSCFORECASTSFOR2011SEASON
SEASONALGAFO-STORECHRISTMAS-HOLIDAYSALESGROWTH
Projections Based on Holiday Hiring
Sources: U.S. Department of Labor; U.S. Department of Commerce; ICSC Research.

TOP10HOLIDAYSALESDAYS–2010ACTUAL
BlackFriday, November 26
Thursday, December 23
SuperSaturday,December 18
Wednesday, December 22
Tuesday, December 21
Saturday, November 27
Saturday, December 11
Sunday, December 19
Friday, December 24
Sunday, December 26
TOP10HOLIDAYSALESDAYS–2011PREDICTED
BlackFriday, November 25
SuperSaturday,December 17
Friday, December 23
Monday, December 26
Thursday, December 22
Saturday, November 26
Sunday, December 18
Saturday, December 10
Monday, December 19
Saturday, December 3
Holiday Forecasting
17
Top Holiday Sales Days*
TOP10HOLIDAYTRAFFICDAYS–2010ACTUAL
BlackFriday, November 26
SuperSaturday,December 18
Saturday, December 11
Thursday, December 23
Sunday, December 26
Wednesday December 22
Tuesday, December 21
Saturday, November 27
Monday, December 20
Sunday, December 19
TOP10HOLIDAYTRAFFICDAYS–2011PREDICTED
BlackFriday, November 25
SuperSaturday,December 17
Monday, December 26
Friday, December 23
Saturday, December 10
Saturday, November 26
Thursday, December 22
Saturday, December 3
Sunday, December 18
Monday, December 19
Top Holiday Traffic Days*
* Source: ShopperTrak

Michael P. Niemira
Staff Vice President, Chief Economist & Director of Research International Council of Shopping Centers
Michael P. Niemira is the staff vice president, chief economist and director of research for the International Council of Shopping Centers (ICSC). As the director of research, he is responsible for the overall selection, design, implementation, and dissemination of all research projects undertaken worldwide by the ICSC. These projects are considered to be at the forefront of the recognized research in the field. He also oversees the collection and maintenance of ICSC e-data, the main statistical database for the industry, and the e-library, the largest online collection of shopping center related materials in the world. Mr. Niemira produces the ICSC – Goldman Sachs Weekly Chain Store Sales Snapshot – a retail sales monitor – as well as the monthly report, Chain Store Sales Trends. Before joining ICSC, Mr. Niemira held the position of vice president and senior economist for the Bank of Tokyo-Mitsubishi, Ltd. (BTM) in New York. Previously, he worked for PaineWebber, Chemical Bank and Merrill Lynch. Over the years, he has been an adjunct instructor at New York University’s Stern Graduate School of Business and at the New York Institute of Finance.
Mr. Niemira is on advisory panels for the Conference Board and the Institute for Supply Management. He has co-authored two books: “Forecasting Financial and Economic Cycles,” John Wiley & Sons, 1994, and “Trading the Fundamentals,” Revised Edition, McGraw Hill, 1998 and contributes numerous articles to books, journals and magazines.
INTERVIEW OPPORTUNITYMr. Niemira is available to provide in-depth analysis including consumer perceptions, purchasing patterns, and trends. Telephone and in-person interviews can be arranged. Please call ICSC’s Media Relations Department at 646-728-3814/3515 to arrange an interview.
MichaelP.Niemira Staff Vice President, Chief Economist &
Director of ResearchInternational Council of Shopping Centers
biographical information