hogs and pigs to 9.80 for operations with more than 5,000 ... · u.s. inventory of all hogs and...
TRANSCRIPT

Mt An 4 (12-09)
Quarterly Hogs and Pigs
Washington, D.C.
Released December 30, 2009, by the National Agricultural Statistics Service (NASS), Agricultural Statistics Board, U.S. Department
of Agriculture. For information on Quarterly Hogs and Pigs call Nick Streff at 202-720-3106, office hours 7:30 a.m. to 4:00 p.m. ET.
U.S. Hog Inventory down 2 Percent
U.S. inventory of all hogs and pigs on December 1, 2009 was 65.8 million head. This was down 2 percent
from December 1, 2008 and down 2 percent from September 1, 2009.
Breeding inventory, at 5.85 million head, was down 3 percent from last year and down slightly from the
previous quarter. Market hog inventory, at 60.0 million head, was down 2 percent from last year and down
2 percent from last quarter.
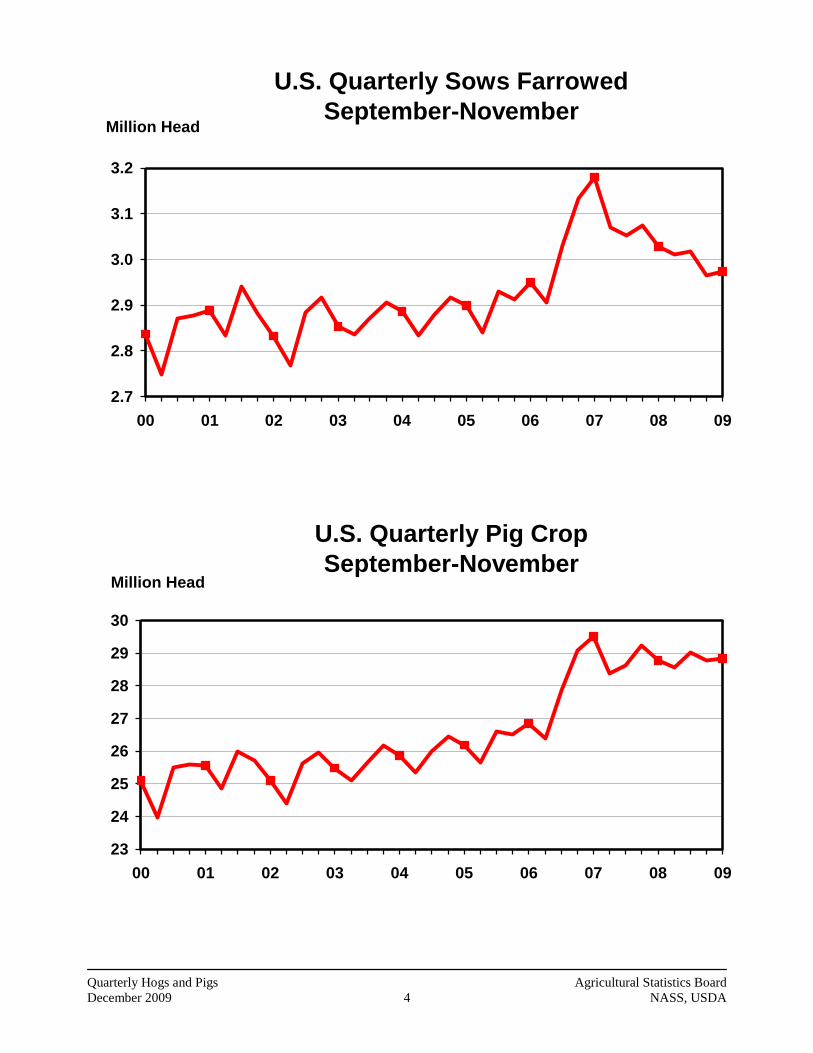
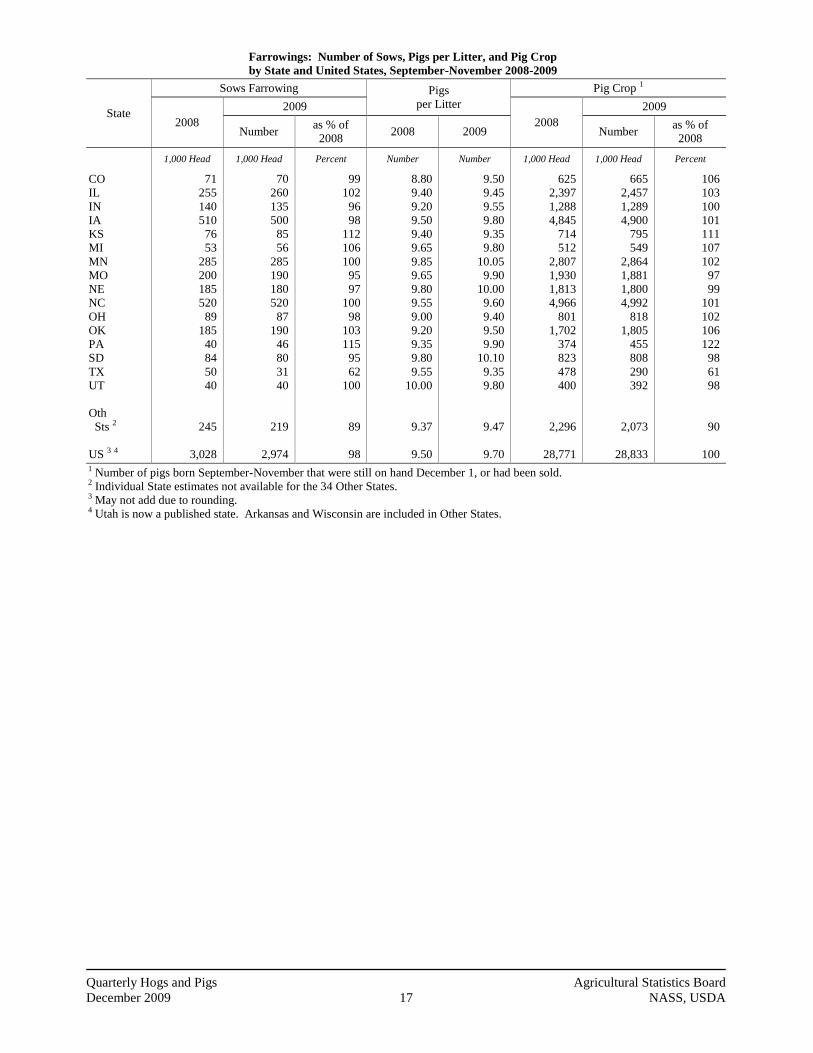
The September-November 2009 pig crop, at 28.8 million head, was up slightly from 2008 but down
2 percent from 2007. Sows farrowing during this period totaled 2.97 million head, down 2 percent from
2008 and down 6 percent from 2007. The sows farrowed during this quarter represented 51 percent of the
breeding herd. The average pigs saved per litter was 9.70 for the September-November 2009 period,
compared to 9.50 last year. The litter rate equaled the record for pigs saved per litter set during the June-
August 2009 period. Pigs saved per litter by size of operation ranged from 7.40 for operations with 1-99
hogs and pigs to 9.80 for operations with more than 5,000 hogs and pigs.
U.S. Quarterly Hogs and Pigs Inventory
December 1
56
58
60
62
64
66
68
70
00 01 02 03 04 05 06 07 08 09
Million Head
Quarterly Hogs and Pigs Agricultural Statistics Board
December 2009 NASS, USDA
U.S. hog producers intend to have 2.95 million sows farrow during the December 2009-February 2010
quarter, down 2 percent from the actual farrowings during the same period in 2009 and down 4 percent from
2008. Intended farrowings for March-May 2010, at 2.94 million sows, are down 3 percent from 2009 and
down 4 percent from 2008.
The total number of hogs under contract owned by operations with over 5,000 head, but raised by
contractees, accounted for 44 percent of the total U.S. hog inventory, up from 43 percent last year.
Revisions
All inventory and pig crop estimates for March 2008 through September 2009 were reviewed using
slaughter, death loss and current import and export data. Based on this review, adjustments of less than one
half of one percent were made to the December-February 2009 pig crop and September 2009 total inventory.
An adjustment of less than one percent was made to the June 2009 total inventory while an adjustment of
less than two percent was made to the March-May 2009 pig crop.
Special Note
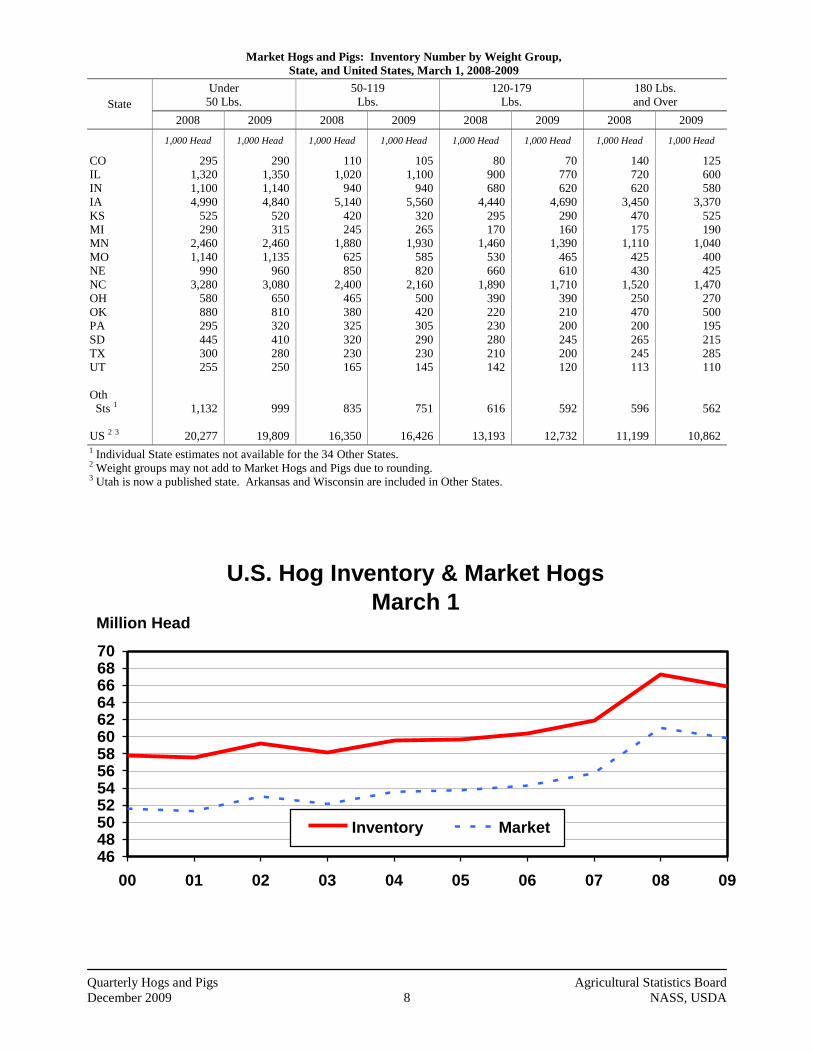
The market hogs and pigs weight groups have changed. The market weight group under 60 pounds has been
changed to under 50 pounds. The market weight group 60-119 pounds has been changed to 50-119 pounds.
The 120-179 pounds and 180 pounds and over weight groups remain the same. The changes align NASS
market hogs and pigs weight groups more closely with international trade data and allow for a more uniform
analysis of the North American hog inventory.
Estimates have been made for these new weight groups dating back to March of 2008 at the U.S. and State
level using slaughter data and current import and export data.
The quarterly estimating States will now include Utah but will exclude Arkansas and Wisconsin. This
change was due to increased production in Utah and decreased production in Arkansas and Wisconsin. Data
from March 2008 forward will reflect this change to provide the user with comparable data for 2008 and
2009.
This report was approved on December 30, 2009.
Acting Secretary of
Agriculture
Michael T. Scuse
Agricultural Statistics Board
Acting Chairperson
Joseph J. Prusacki

Quarterly Hogs and Pigs Agricultural Statistics Board
December 2009 i NASS, USDA
Contents
Page
Quarterly U.S. Inventory by Class and Weight Group, 2008-2009 ............................................................ 1
Quarterly U.S. Sows Farrowed, Pig Crop, and Pigs per Litter, 2008-2010 ................................................ 2
Quarterly U.S. Pigs per Litter by Size of Operations, 2008-2009 ................................................................ 2
Hogs and Pigs: Inventory by State and U.S., 2008-2009
December 1 .................................................................................................................................... 5
March 1 .......................................................................................................................................... 7
June 1 ............................................................................................................................................. 9
September 1 .................................................................................................................................. 11
Farrowings: Number of Sows, Pigs per Litter, Pig Crop by State and U.S., 2008-2010
December-November ................................................................................................................... 13
December-February ...................................................................................................................... 14
March-May ................................................................................................................................... 15
June-August .................................................................................................................................. 16
September-November ................................................................................................................... 17
Monthly U.S. Farrowings, December-November 2008-2009 ................................................................... 18
Reliability Statement ................................................................................................................................. 19
Information Contacts ................................................................................................................................. 20

Quarterly Hogs and Pigs Agricultural Statistics Board
December 2009 1 NASS, USDA
Hogs and Pigs: Inventory Number by Class, Weight Group,
and Quarter, United States, 2008-2009
Item 2008 2009
2009
as a %
2008
1,000 Head 1,000 Head Percent
March 1 Inventory 1
All Hogs and Pigs
Kept for Breeding
Market
Market Hogs and Pigs
by Weight Groups
Under 50 Pounds
50-119 Pounds
120-179 Pounds
180 Pounds and Over
June 1 Inventory 1
All Hogs and Pigs
Kept for Breeding
Market
Market Hogs and Pigs
by Weight Groups
Under 50 Pounds
50-119 Pounds
120-179 Pounds
180 Pounds and Over
September 1 Inventory 1
All Hogs and Pigs
Kept for Breeding
Market
Market Hogs and Pigs
by Weight Groups
Under 50 Pounds
50-119 Pounds
120-179 Pounds
180 Pounds and Over
December 1 Inventory 1
All Hogs and Pigs
Kept for Breeding
Market
Market Hogs and Pigs
by Weight Groups
Under 50 Pounds
50-119 Pounds
120-179 Pounds
180 Pounds and Over
67,218
6,200
61,018
20,277
16,350
13,193
11,199
67,400
6,131
61,269
19,807
17,711
12,892
10,860
68,196
6,061
62,135
20,643
17,437
12,855
11,201
67,148
6,062
61,087
19,428
17,396
12,731
11,533
65,819
5,992
59,828
19,809
16,426
12,732
10,862
66,809
5,968
60,842
19,554
17,838
12,604
10,847
66,826
5,875
60,952
19,838
17,178
12,684
11,253
65,807
5,850
59,957
19,085
17,062
12,529
11,282
98
97
98
98
100
97
97
99
97
99
99
101
98
100
98
97
98
96
99
99
100
98
97
98
98
98
98
98 1 May not add due to rounding.

Quarterly Hogs and Pigs Agricultural Statistics Board
December 2009 2 NASS, USDA
Farrowings: Number of Sows, Pig Crop, and Pigs per Litter,
United States, 2008-2010
Item 2008 2009 2010
2009
as % of
2008
2010
as % of
2009
1,000 Head 1,000 Head 1,000 Head Percent Percent
Sows Farrowing
Dec-Feb 1 2
Mar-May 2
Dec-May 1 3
Jun-Aug
Sep-Nov
Jun-Nov 3
Pig Crop
Dec-Feb 1
Mar-May
Dec-May 1 3
Jun-Aug
Sep-Nov
Jun-Nov 3
3,071
3,052
6,123
3,075
3,028
6,103
28,388
28,631
57,019
29,240
28,771
58,011
3,011
3,018
6,029
2,965
2,974
5,939
28,552
29,012
57,564
28,777
28,833
57,610
2,954
2,935
5,890
98
99
98
96
98
97
101
101
101
98
100
99
98
97
98
Number Number Number Percent Percent
Pigs per Litter
Dec-Feb 1
Mar-May
Dec-May 1
Jun-Aug
Sep-Nov
Jun-Nov
9.24
9.38
9.31
9.51
9.50
9.51
9.48
9.61
9.55
9.70
9.70
9.70
103
102
103
102
102
102
1 December preceding year. 2 Intentions for 2010. 3 May not add due to rounding.
Pigs per Litter: By Size of Operation, United States, 2008-2009
Pig Crop
Pigs per Litter on Operations Having 1
1-99
Head
100-499
Head
500-999
Head
1,000-1,999
Head
2,000-4,999
Head
5,000+
Head
Number Number Number Number Number Number
2008
Dec-Feb 2
Mar-May
Jun-Aug
Sep-Nov
2009
Dec-Feb 2
Mar-May
Jun-Aug
Sep-Nov
7.50
7.70
7.80
7.50
7.30
7.40
7.40
7.40
8.20
8.20
8.30
8.20
8.10
8.10
8.20
8.10
8.40
8.40
8.40
8.30
8.40
8.50
8.60
8.50
8.80
9.00
9.00
9.00
9.00
9.10
9.10
9.20
9.20
9.40
9.50
9.40
9.40
9.60
9.60
9.60
9.30
9.40
9.60
9.60
9.50
9.70
9.80
9.80 1 Pigs per litter rounded to the nearest tenth. 2 December preceding year.

Quarterly Hogs and Pigs Agricultural Statistics Board
December 2009 3 NASS, USDA
U.S. Quarterly Litter Rate
September-November
8.60
8.80
9.00
9.20
9.40
9.60
9.80
00 01 02 03 04 05 06 07 08 09
Number Head
U.S. Pigs per Litter
By Size of Operation, September-November 2009
9.70
7.40
8.50
9.20
9.609.80
8.10
7.00
7.50
8.00
8.50
9.00
9.50
10.00
10.50
All 1-99 100-499 500-999 1,000-1,999 2,000-4,999 5,000+
Number Head
Quarterly Hogs and Pigs Agricultural Statistics Board
December 2009 4 NASS, USDA
U.S. Quarterly Sows Farrowed
September-November
2.7
2.8
2.9
3.0
3.1
3.2
00 01 02 03 04 05 06 07 08 09
Million Head
U.S. Quarterly Pig Crop
September-November
23
24
25
26
27
28
29
30
00 01 02 03 04 05 06 07 08 09
Million Head

Quarterly Hogs and Pigs Agricultural Statistics Board
December 2009 5 NASS, USDA
Hogs and Pigs: Breeding, Market, and Total Inventory
by State and United States, December 1, 2008-2009
State
Breeding Market Total
2008
2009
2008
2009
2008
2009
Number as % of
2008 Number
as % of
2008 Number
as % of
2008
1,000 Head 1,000 Head Percent 1,000 Head 1,000 Head Percent 1,000 Head 1,000 Head Percent
AL
AK
AZ
AR
CA
CO
CT
DE
FL
GA
HI
ID
IL
IN
IA
KS
KY
LA
ME
MD
MA
MI
MN
MS
MO
MT
NE
NV
NH
NJ
NM
NY
NC
ND
OH
OK
OR
PA
RI
SC
SD
TN
TX
UT
VT
VA
WA
WV
WI
WY
US 1
17
0.2
17
90
10
150
0.6
2.5
5.0
37
2.8
6.0
490
280
1,070
165
40
2.0
1.0
4.0
1.5
110
580
36
370
22
380
0.5
0.5
1.0
0.5
13.0
980
39
170
400
4.0
90
0.5
18
155
20
100
75
0.6
30
4.0
1.5
40
29
6,062
16
0.3
20
65
7
150
0.6
2.0
5.0
32
2.9
7.0
480
280
1,020
180
35
2.0
1.1
4.0
1.0
110
560
35
360
23
370
0.6
0.4
1.0
0.4
11.0
930
38
165
410
3.0
100
0.4
14
145
17
60
75
0.6
25
5.0
1.5
50
28
5,850
94
150
118
72
70
100
100
80
100
86
104
117
98
100
95
109
88
100
110
100
67
100
97
97
97
105
97
120
80
100
80
85
95
97
97
103
75
111
80
78
94
85
60
100
100
83
125
100
125
97
97
158
0.7
148
190
70
580
2.5
6.5
15.0
198
10.2
27.0
3,860
3,270
18,830
1,575
315
9.0
3.4
27.0
8.5
920
6,920
339
2,780
153
2,970
3.0
2.3
7.0
1.5
82.0
8,720
112
1,770
2,000
16.0
1,030
1.3
227
1,125
185
1,020
665
2.2
325
21.0
5.5
320
60
61,087
124
1.1
147
135
93
570
2.3
5.5
15.0
178
10.1
29.0
3,870
3,370
18,280
1,630
315
8.0
3.8
26.0
10.0
970
6,840
330
2,740
152
2,780
2.3
2.0
7.0
1.1
66.0
8,770
122
1,855
1,900
14.0
1,080
1.3
211
1,025
168
710
655
2.4
340
18.0
3.5
310
59
59,957
78
157
99
71
133
98
92
85
100
90
99
107
100
103
97
103
100
89
112
96
118
105
99
97
99
99
94
77
87
100
73
80
101
109
105
95
88
105
100
93
91
91
70
98
109
105
86
64
97
98
98
175
0.9
165
280
80
730
3.1
9.0
20.0
235
13.0
33.0
4,350
3,550
19,900
1,740
355
11.0
4.4
31.0
10.0
1,030
7,500
375
3,150
175
3,350
3.5
2.8
8.0
2.0
95.0
9,700
151
1,940
2,400
20.0
1,120
1.8
245
1,280
205
1,120
740
2.8
355
25.0
7.0
360
89
67,148
140
1.4
167
200
100
720
2.9
7.5
20.0
210
13.0
36.0
4,350
3,650
19,300
1,810
350
10.0
4.9
30.0
11.0
1,080
7,400
365
3,100
175
3,150
2.9
2.4
8.0
1.5
77.0
9,700
160
2,020
2,310
17.0
1,180
1.7
225
1,170
185
770
730
3.0
365
23.0
5.0
360
87
65,807
80
156
101
71
125
99
94
83
100
89
100
109
100
103
97
104
99
91
111
97
110
105
99
97
98
100
94
83
86
100
75
81
100
106
104
96
85
105
94
92
91
90
69
99
107
103
92
71
100
98
98 1 May not add due to rounding.

Quarterly Hogs and Pigs Agricultural Statistics Board
December 2009 6 NASS, USDA
Market Hogs and Pigs: Inventory Number by Weight Group,
State, and United States, December 1, 2008-2009
State
Under
50 Lbs.
50-119
Lbs.
120-179
Lbs.
180 Lbs.
and Over
2008 2009 2008 2009 2008 2009 2008 2009
1,000 Head 1,000 Head 1,000 Head 1,000 Head 1,000 Head 1,000 Head 1,000 Head 1,000 Head
AL
AK
AZ
AR
CA
CO
CT
DE
FL
GA
HI
ID
IL
IN
IA
KS
KY
LA
ME
MD
MA
MI
MN
MS
MO
MT
NE
NV
NH
NJ
NM
NY
NC
ND
OH
OK
OR
PA
RI
SC
SD
TN
TX
UT
VT
VA
WA
WV
WI
WY
US 1
63
0.2
50
130
23
285
1.1
2.5
6.0
74
3.8
11.0
1,270
1,090
4,730
475
85
3.0
1.2
8.0
2.5
290
2,420
117
1,200
49
1,010
1.2
0.4
2.0
0.5
26.0
3,020
44
600
830
4.5
285
0.6
27
390
48
285
235
1.0
90
6.0
1.0
105
25
19,428
57
0.3
54
85
26
270
1.1
2.5
6.0
74
3.9
12.0
1,230
1,100
4,530
480
85
3.0
1.7
7.0
3.7
335
2,410
120
1,160
55
930
0.6
0.3
2.5
0.2
25.0
3,150
61
650
790
4.0
290
0.6
29
335
44
145
260
1.2
100
6.0
0.5
120
28
19,085
44
0.2
37
30
17
100
0.8
1.5
6.0
50
3.3
8.0
1,140
960
5,880
360
90
2.0
1.3
7.0
2.4
270
2,050
94
700
42
880
0.8
0.8
2.0
0.4
21.0
2,290
29
515
420
4.5
335
0.4
71
270
50
235
170
0.4
85
7.0
1.0
100
11
17,396
23
0.3
31
25
18
115
0.6
1.0
5.0
43
3.2
8.0
1,190
1,000
5,800
335
85
2.0
1.3
6.0
3.0
270
2,080
80
655
38
850
0.6
0.5
2.0
0.3
16.0
2,200
24
535
390
4.0
345
0.4
61
275
44
170
135
0.4
90
5.0
0.5
80
15
17,062
23
0.2
31
15
20
70
0.3
1.5
2.0
40
1.9
6.0
800
610
4,500
245
70
2.0
0.2
8.0
1.7
175
1,360
64
490
33
630
0.6
0.4
1.5
0.4
17.0
1,770
23
400
260
3.5
215
0.2
67
240
35
205
140
0.4
75
5.0
1.0
55
16
12,731
23
0.3
31
10
19
55
0.3
1.0
3.0
30
1.7
7.0
760
640
4,530
305
70
2.0
0.5
7.0
1.7
165
1,300
65
465
32
590
0.2
0.4
1.0
0.4
13.0
1,770
20
395
240
3.0
230
0.2
61
215
29
165
130
0.4
70
4.0
0.5
55
11
12,529
28
0.1
30
15
10
125
0.3
1.0
1.0
34
1.2
2.0
650
610
3,720
495
70
2.0
0.7
4.0
1.9
185
1,090
64
390
29
450
0.4
0.7
1.5
0.2
18.0
1,640
16
255
490
3.5
195
0.1
62
225
52
295
120
0.4
75
3.0
2.5
60
8
11,533
21
0.2
31
15
30
130
0.3
1.0
1.0
31
1.3
2.0
690
630
3,420
510
75
1.0
0.3
6.0
1.6
200
1,050
65
460
27
410
0.9
0.8
1.5
0.2
12.0
1,650
17
275
480
3.0
215
0.1
60
200
51
230
130
0.4
80
3.0
2.0
55
5
11,282 1 Weight groups may not add to Market due to rounding.

Quarterly Hogs and Pigs Agricultural Statistics Board
December 2009 7 NASS, USDA
U.S. Hog Inventory & Market Hogs
December 1
46485052545658606264666870
00 01 02 03 04 05 06 07 08 09
Million Head
Inventory Market
Hogs and Pigs: Breeding, Market, and Total Inventory
by State and United States, March 1, 2008-2009
State
Breeding Market Total
2008
2009
2008
2009
2008
2009
Number as % of
2008 Number
as % of
2008 Number
as % of
2008
1,000 Head 1,000 Head Percent 1,000 Head 1,000 Head Percent 1,000 Head 1,000 Head Percent
CO
IL
IN
IA
KS
MI
MN
MO
NE
NC
OH
OK
PA
SD
TX
UT
Oth
Sts 1
US 2 3
155
490
310
1,080
170
100
590
380
370
1,010
165
400
100
160
105
105
510
6,200
150
480
270
1,040
165
110
580
365
385
980
170
400
90
150
95
75
487
5,992
97
98
87
96
97
110
98
96
104
97
103
100
90
94
90
71
96
97
625
3,960
3,340
18,020
1,710
880
6,910
2,720
2,930
9,090
1,685
1,950
1,050
1,310
985
675
3,178
61,018
590
3,820
3,280
18,460
1,655
930
6,820
2,585
2,815
8,420
1,810
1,940
1,020
1,160
995
625
2,903
59,828
94
96
98
102
97
106
99
95
96
93
107
99
97
89
101
93
91
98
780
4,450
3,650
19,100
1,880
980
7,500
3,100
3,300
10,100
1,850
2,350
1,150
1,470
1,090
780
3,688
67,218
740
4,300
3,550
19,500
1,820
1,040
7,400
2,950
3,200
9,400
1,980
2,340
1,110
1,310
1,090
700
3,389
65,819
95
97
97
102
97
106
99
95
97
93
107
100
97
89
100
90
92
98 1 Individual State estimates not available for the 34 Other States. 2 May not add due to rounding. 3 Utah is now a published state. Arkansas and Wisconsin are included in Other States.
Quarterly Hogs and Pigs Agricultural Statistics Board
December 2009 8 NASS, USDA
Market Hogs and Pigs: Inventory Number by Weight Group,
State, and United States, March 1, 2008-2009
State
Under
50 Lbs.
50-119
Lbs.
120-179
Lbs.
180 Lbs.
and Over
2008 2009 2008 2009 2008 2009 2008 2009
1,000 Head 1,000 Head 1,000 Head 1,000 Head 1,000 Head 1,000 Head 1,000 Head 1,000 Head
CO
IL
IN
IA
KS
MI
MN
MO
NE
NC
OH
OK
PA
SD
TX
UT
Oth
Sts 1
US 2 3
295
1,320
1,100
4,990
525
290
2,460
1,140
990
3,280
580
880
295
445
300
255
1,132
20,277
290
1,350
1,140
4,840
520
315
2,460
1,135
960
3,080
650
810
320
410
280
250
999
19,809
110
1,020
940
5,140
420
245
1,880
625
850
2,400
465
380
325
320
230
165
835
16,350
105
1,100
940
5,560
320
265
1,930
585
820
2,160
500
420
305
290
230
145
751
16,426
80
900
680
4,440
295
170
1,460
530
660
1,890
390
220
230
280
210
142
616
13,193
70
770
620
4,690
290
160
1,390
465
610
1,710
390
210
200
245
200
120
592
12,732
140
720
620
3,450
470
175
1,110
425
430
1,520
250
470
200
265
245
113
596
11,199
125
600
580
3,370
525
190
1,040
400
425
1,470
270
500
195
215
285
110
562
10,862 1 Individual State estimates not available for the 34 Other States. 2 Weight groups may not add to Market Hogs and Pigs due to rounding. 3 Utah is now a published state. Arkansas and Wisconsin are included in Other States.
U.S. Hog Inventory & Market Hogs
March 1
46485052545658606264666870
00 01 02 03 04 05 06 07 08 09
Million Head
Inventory Market

Quarterly Hogs and Pigs Agricultural Statistics Board
December 2009 9 NASS, USDA
Hogs and Pigs: Breeding, Market, and Total Inventory
by State and United States, June 1, 2008-2009
State
Breeding Market Total
2008
2009
2008
2009
2008
2009
Number as % of
2008 Number
as % of
2008 Number
as % of
2008
1,000 Head 1,000 Head Percent 1,000 Head 1,000 Head Percent 1,000 Head 1,000 Head Percent
CO
IL
IN
IA
KS
MI
MN
MO
NE
NC
OH
OK
PA
SD
TX
UT
Oth
Sts 1
US 2 3
150
460
290
1,080
170
100
580
380
380
1,020
165
400
95
150
105
90
516
6,131
150
480
270
1,020
170
110
580
345
390
990
170
400
90
155
95
75
478
5,968
100
104
93
94
100
110
100
91
103
97
103
100
95
103
90
83
93
97
610
3,890
3,360
18,320
1,610
930
6,920
2,720
3,020
9,080
1,725
1,960
1,085
1,280
965
680
3,114
61,269
590
3,870
3,330
18,780
1,620
950
6,920
2,705
2,910
8,710
1,840
1,890
1,060
1,135
925
645
2,962
60,842
97
99
99
103
101
102
100
99
96
96
107
96
98
89
96
95
95
99
760
4,350
3,650
19,400
1,780
1,030
7,500
3,100
3,400
10,100
1,890
2,360
1,180
1,430
1,070
770
3,630
67,400
740
4,350
3,600
19,800
1,790
1,060
7,500
3,050
3,300
9,700
2,010
2,290
1,150
1,290
1,020
720
3,439
66,809
97
100
99
102
101
103
100
98
97
96
106
97
97
90
95
94
95
99 1 Individual State estimates not available for the 34 Other States. 2 May not add due to rounding. 3 Utah is now a published state. Arkansas and Wisconsin are included in Other States.
U.S. Hog Inventory & Market Hogs
June 1
46485052545658606264666870
00 01 02 03 04 05 06 07 08 09
Million Head
Inventory Market

Quarterly Hogs and Pigs Agricultural Statistics Board
December 2009 10 NASS, USDA
Market Hogs and Pigs: Inventory Number by Weight Group,
State, and United States, June 1, 2008-2009
State
Under
50 Lbs.
50-119
Lbs.
120-179
Lbs.
180 Lbs.
and Over
2008 2009 2008 2009 2008 2009 2008 2009
1,000 Head 1,000 Head 1,000 Head 1,000 Head 1,000 Head 1,000 Head 1,000 Head 1,000 Head
CO
IL
IN
IA
KS
MI
MN
MO
NE
NC
OH
OK
PA
SD
TX
UT
Oth
Sts 1
US 2 3
275
1,250
1,050
4,850
480
290
2,370
1,155
1,000
3,300
560
880
285
430
280
260
1,092
19,807
280
1,220
1,100
4,850
465
325
2,370
1,205
980
3,090
640
770
320
390
265
250
1,034
19,554
150
1,140
1,030
5,640
390
265
2,050
685
930
2,550
505
410
355
355
260
164
832
17,711
125
1,220
1,040
5,980
380
285
2,140
630
880
2,350
535
400
350
305
255
155
808
17,838
70
850
670
4,450
260
185
1,470
475
650
1,760
400
220
235
255
205
137
600
12,892
70
790
630
4,530
285
160
1,380
455
630
1,740
395
210
205
225
205
120
574
12,604
115
650
610
3,380
480
190
1,030
405
440
1,470
260
450
210
240
220
119
591
10,860
115
640
560
3,420
490
180
1,030
415
420
1,530
270
510
185
215
200
120
547
10,847 1 Individual State estimates not available for the 34 Other States. 2 Weight groups may not add to Market Hogs and Pigs due to rounding. 3 Utah is now a published state. Arkansas and Wisconsin are included in Other States.

Quarterly Hogs and Pigs Agricultural Statistics Board
December 2009 11 NASS, USDA
Hogs and Pigs: Breeding, Market, and Total Inventory
by State and United States, September 1, 2008-2009
State
Breeding Market Total
2008
2009
2008
2009
2008
2009
Number as % of
2008 Number
as % of
2008 Number
as % of
2008
1,000 Head 1,000 Head Percent 1,000 Head 1,000 Head Percent 1,000 Head 1,000 Head Percent
CO
IL
IN
IA
KS
MI
MN
MO
NE
NC
OH
OK
PA
SD
TX
UT
Oth
Sts 1
US 2 3
150
470
280
1,070
170
100
570
375
375
1,000
165
400
85
150
105
85
511
6,061
150
470
280
1,010
160
110
560
350
380
980
160
410
90
150
70
80
465
5,875
100
100
100
94
94
110
98
93
101
98
97
103
106
100
67
94
91
97
600
3,930
3,320
18,730
1,640
950
7,030
2,775
2,925
9,300
1,755
2,060
1,035
1,210
1,015
715
3,145
62,135
580
3,830
3,320
18,690
1,600
950
6,740
2,700
2,970
9,020
1,890
1,950
1,030
1,130
940
680
2,932
60,952
97
97
100
100
98
100
96
97
102
97
108
95
100
93
93
95
93
98
750
4,400
3,600
19,800
1,810
1,050
7,600
3,150
3,300
10,300
1,920
2,460
1,120
1,360
1,120
800
3,656
68,196
730
4,300
3,600
19,700
1,760
1,060
7,300
3,050
3,350
10,000
2,050
2,360
1,120
1,280
1,010
760
3,396
66,826
97
98
100
99
97
101
96
97
102
97
107
96
100
94
90
95
93
98 1 Individual State estimates not available for the 34 Other States. 2 May not add due to rounding. 3 Utah is now a published state. Arkansas and Wisconsin are included in Other States.
U.S. Hog Inventory & Market Hogs
September 1
46485052545658606264666870
00 01 02 03 04 05 06 07 08 09
Million Head
Inventory Market

Quarterly Hogs and Pigs Agricultural Statistics Board
December 2009 12 NASS, USDA
Market Hogs and Pigs: Inventory Number by Weight Group,
State, and United States, September 1, 2008-2009
State
Under
50 Lbs.
50-119
Lbs.
120-179
Lbs.
180 Lbs.
and Over
2008 2009 2008 2009 2008 2009 2008 2009
1,000 Head 1,000 Head 1,000 Head 1,000 Head 1,000 Head 1,000 Head 1,000 Head 1,000 Head
CO
IL
IN
IA
KS
MI
MN
MO
NE
NC
OH
OK
PA
SD
TX
UT
Oth
Sts 1
US 2 3
280
1,290
1,090
5,110
520
325
2,570
1,230
990
3,370
595
890
290
415
295
270
1,113
20,643
285
1,270
1,140
4,840
505
330
2,420
1,150
1,000
3,200
675
830
285
370
270
265
1,003
19,838
135
1,140
1,000
5,680
350
270
2,070
685
880
2,380
515
410
335
325
280
170
812
17,437
120
1,150
970
5,760
330
265
2,010
635
870
2,390
540
380
310
300
230
155
763
17,178
70
840
620
4,460
275
185
1,400
495
610
1,860
400
240
215
240
205
145
595
12,855
55
770
600
4,600
290
160
1,280
470
650
1,790
410
250
210
230
200
130
589
12,684
115
660
610
3,480
495
170
990
365
445
1,690
245
520
195
230
235
130
626
11,201
120
640
610
3,490
475
195
1,030
445
450
1,640
265
490
225
230
240
130
578
11,253 1 Individual State estimates not available for the 34 Other States. 2 Weight groups may not add to Market Hogs and Pigs due to rounding. 3 Utah is now a published state. Arkansas and Wisconsin are included in Other States.

Quarterly Hogs and Pigs Agricultural Statistics Board
December 2009 13 NASS, USDA
Annual Farrowings: Number of Sows, Pigs per Litter, and Pig Crop
by State and United States, December-November 2008-2009
State
Sows Farrowing 1 Pigs
per Litter 1
Pig Crop 1
2008
2009
2008
2009
Number as % of
2008 2008 2009 Number
as % of
2008
1,000 Head 1,000 Head Percent Number Number 1,000 Head 1,000 Head Percent
AL
AK
AZ
AR
CA
CO
CT
DE
FL
GA
HI
ID
IL
IN
IA
KS
KY
LA
ME
MD
MA
MI
MN
MS
MO
MT
NE
NV
NH
NJ
NM
NY
NC
ND
OH
OK
OR
PA
RI
SC
SD
TN
TX
UT
VT
VA
WA
WV
WI
WY
US 2
27.0
0.18
32.0
185
21.00
312
0.50
6.00
8.00
71.0
2.80
7.80
965
580
2,050
323
73.0
3.30
1.30
8.50
1.80
211
1,140
75.0
775
37.0
745
0.40
0.40
1.00
0.40
18.00
2,180
67.5
356
745
5.00
162
0.70
49.0
339
43.0
207
163
0.60
56.0
5.40
1.40
99
63.5
12,225
32.0
0.38
32.0
168
14.00
289
0.50
4.00
7.00
67.0
2.60
9.30
1,005
545
1,970
327
74.0
1.70
1.10
8.00
1.40
220
1,130
76.0
750
42.5
740
0.96
0.40
1.20
0.40
14.00
2,130
74.5
349
755
4.40
170
0.50
30.0
332
36.0
171
167
0.70
52.0
5.90
1.10
93
62.0
11,969
119
211
100
91
67
93
100
67
88
94
93
119
104
94
96
101
101
52
85
94
78
104
99
101
97
115
99
240
100
120
100
78
98
110
98
101
88
105
71
61
98
84
83
102
117
93
109
79
94
98
98
8.93
8.89
9.78
9.72
9.33
8.90
8.00
9.33
7.00
9.08
7.14
8.85
9.36
9.14
9.36
9.18
9.18
6.79
7.31
8.00
7.78
9.51
9.60
9.63
9.49
10.16
9.65
6.50
8.00
6.90
8.00
9.39
9.44
9.87
9.26
9.34
9.00
9.48
7.43
9.16
9.73
9.21
8.93
9.90
8.00
9.43
9.07
7.43
9.03
9.84
9.41
8.47
7.11
9.66
9.73
8.43
9.14
8.20
9.00
7.71
9.30
7.23
8.71
9.49
9.44
9.70
9.29
9.11
8.29
7.27
8.00
8.00
9.69
9.94
9.68
9.76
10.14
9.92
6.67
8.50
7.33
8.00
10.00
9.64
10.24
9.48
9.23
8.64
9.85
7.00
8.53
10.02
9.00
9.44
9.85
8.00
9.38
8.47
6.55
9.05
9.56
9.62
241.0
1.6
313.0
1,799.0
196.0
2,778.0
4.0
56.0
56.0
645.0
20.0
69.0
9,036.0
5,299.0
19,193.0
2,966.0
670.0
22.4
9.5
68.0
14.0
2,007.0
10,944.0
722.0
7,356.0
376.0
7,189.0
2.6
3.2
6.9
3.2
169.0
20,573.0
666.0
3,298.0
6,956.0
45.0
1,536.0
5.2
449.0
3,297.0
396.0
1,848.0
1,614.0
4.8
528.0
49.0
10.4
894.0
625.0
115,030
271.0
2.7
309.0
1,634.0
118.0
2,642.0
4.1
36.0
54.0
623.0
18.8
81.0
9,535.0
5,143.0
19,108.0
3,037.0
674.0
14.1
8.0
64.0
11.2
2,131.0
11,229.0
736.0
7,321.0
431.0
7,344.0
6.4
3.4
8.8
3.2
140.0
20,530.0
763.0
3,307.0
6,966.0
38.0
1,675.0
3.5
256.0
3,325.0
324.0
1,614.0
1,645.0
5.6
488.0
50.0
7.2
842.0
593.0
115,174
112
169
99
91
60
95
103
64
96
97
94
117
106
97
100
102
101
63
84
94
80
106
103
102
100
115
102
246
106
128
100
83
100
115
100
100
84
109
67
57
101
82
87
102
117
92
102
69
94
95
100 1 December preceding year. 2 May not add due to rounding.

Quarterly Hogs and Pigs Agricultural Statistics Board
December 2009 14 NASS, USDA
Farrowings: Number of Sows, Pigs per Litter, and Pig Crop
by State and United States, December-February 2008-2010
State
Sows Farrowing 1 Pigs
Per Litter 1
Pig Crop 1 2
2008 2009
2010 3
2008
2009
Number as % of
2009 2008 2009 Number
as % of
2008
1,000 Head 1,000 Head 1,000 Head Percent Number Number 1,000 Head 1,000 Head Percent
CO
IL
IN
IA
KS
MI
MN
MO
NE
NC
OH
OK
PA
SD
TX
UT
Oth
Sts 4
US 5 6
84
240
150
510
86
52
285
190
190
550
89
180
43
88
54
39
241
3,071
75
250
140
500
81
53
285
190
185
530
88
190
40
83
46
42
233
3,011
74
255
140
500
91
60
290
190
175
500
87
185
48
74
28
41
216
2,954
99
102
100
100
112
113
102
100
95
94
99
97
120
89
61
98
93
98
9.05
9.25
9.00
9.20
9.10
9.45
9.25
9.20
9.50
9.20
9.15
9.35
9.50
9.60
9.00
9.70
9.25
9.24
8.60
9.50
9.30
9.60
9.10
9.70
9.75
9.35
9.75
9.55
9.40
8.90
9.75
9.85
9.65
9.70
9.36
9.48
760
2,220
1,350
4,692
783
491
2,636
1,748
1,805
5,060
814
1,683
409
845
486
378
2,228
28,388
645
2,375
1,302
4,800
737
514
2,779
1,777
1,804
5,062
827
1,691
390
818
444
407
2,180
28,552
85
107
96
102
94
105
105
102
100
100
102
100
95
97
91
108
98
101 1 December preceding year. 2 Number of pigs born December-February that were still on hand March 1, or had been sold. 3 Intentions. 4 Individual State estimates not available for the 34 Other States. 5 May not add due to rounding. 6 Utah is now a published state. Arkansas and Wisconsin are included in Other States.

Quarterly Hogs and Pigs Agricultural Statistics Board
December 2009 15 NASS, USDA
Farrowings: Number of Sows, Pigs per Litter, and Pig Crop
by State and United States, March-May 2008-2010
State
Sows Farrowing Pigs
per Litter
Pig Crop 1
2008 2009
2010 2
2008
2009
Number as % of
2009 2008 2009 Number
as % of
2008
1,000 Head 1,000 Head 1,000 Head Percent Number Number 1,000 Head 1,000 Head Percent
CO
IL
IN
IA
KS
MI
MN
MO
NE
NC
OH
OK
PA
SD
TX
UT
Oth
Sts 3
US 4 5
81
230
145
520
80
53
285
190
185
550
89
185
41
85
51
41
241
3,052
72
250
135
495
81
54
285
185
190
540
88
185
42
86
48
43
239
3,018
75
260
140
500
90
55
295
190
180
470
88
190
47
76
28
40
211
2,935
104
104
104
101
111
102
104
103
95
87
100
103
112
88
58
93
88
97
8.85
9.35
9.10
9.35
9.10
9.70
9.50
9.40
9.60
9.35
9.40
9.45
9.45
9.70
8.60
10.00
9.47
9.38
9.00
9.50
9.40
9.65
9.40
9.65
9.95
9.80
9.90
9.70
9.50
9.00
9.75
10.10
9.70
9.90
9.28
9.61
717
2,151
1,320
4,862
728
514
2,708
1,786
1,776
5,143
837
1,748
388
825
439
410
2,279
28,631
648
2,375
1,269
4,777
761
521
2,836
1,813
1,881
5,238
836
1,665
410
869
466
426
2,221
29,012
90
110
96
98
105
101
105
102
106
102
100
95
106
105
106
104
97
101 1 Number of pigs born March-May that were still on hand June 1, or had been sold. 2 Intentions. 3 Individual State estimates not available for the 34 Other States. 4 May not add due to rounding. 5 Utah is now a published state. Arkansas and Wisconsin are included in Other States.

Quarterly Hogs and Pigs Agricultural Statistics Board
December 2009 16 NASS, USDA
Farrowings: Number of Sows, Pigs per Litter, and Pig Crop
by State and United States, June-August 2008-2009
State
Sows Farrowing Pigs
per Litter
Pig Crop 1
2008
2009
2008
2009
Number as % of
2008 2008 2009 Number
as % of
2008
1,000 Head 1,000 Head Percent Number Number 1,000 Head 1,000 Head Percent
CO
IL
IN
IA
KS
MI
MN
MO
NE
NC
OH
OK
PA
SD
TX
UT
Oth
Sts 2
US 3 4
76
240
145
510
81
53
285
195
185
560
89
195
38
82
52
43
246
3,075
72
245
135
475
80
57
275
185
185
540
86
190
42
83
46
42
227
2,965
95
102
93
93
99
108
96
95
100
96
97
97
111
101
88
98
92
96
8.90
9.45
9.25
9.40
9.15
9.25
9.80
9.70
9.70
9.65
9.50
9.35
9.60
9.80
8.55
9.90
9.50
9.51
9.50
9.50
9.50
9.75
9.30
9.60
10.00
10.00
10.05
9.70
9.60
9.50
10.00
10.00
9.00
10.00
9.44
9.70
676
2,268
1,341
4,794
741
490
2,793
1,892
1,795
5,404
846
1,823
365
804
445
426
2,337
29,240
684
2,328
1,283
4,631
744
547
2,750
1,850
1,859
5,238
826
1,805
420
830
414
420
2,148
28,777
101
103
96
97
100
112
98
98
104
97
98
99
115
103
93
99
92
98 1 Number of pigs born June-August that were still on hand September 1, or had been sold. 2 Individual State estimates not available for the 34 Other States. 3 May not add due to rounding. 4 Utah is now a published state. Arkansas and Wisconsin are included in Other States.
Quarterly Hogs and Pigs Agricultural Statistics Board
December 2009 17 NASS, USDA
Farrowings: Number of Sows, Pigs per Litter, and Pig Crop
by State and United States, September-November 2008-2009
State
Sows Farrowing Pigs
per Litter
Pig Crop 1
2008
2009
2008
2009
Number as % of
2008 2008 2009 Number
as % of
2008
1,000 Head 1,000 Head Percent Number Number 1,000 Head 1,000 Head Percent
CO
IL
IN
IA
KS
MI
MN
MO
NE
NC
OH
OK
PA
SD
TX
UT
Oth
Sts 2
US 3 4
71
255
140
510
76
53
285
200
185
520
89
185
40
84
50
40
245
3,028
70
260
135
500
85
56
285
190
180
520
87
190
46
80
31
40
219
2,974
99
102
96
98
112
106
100
95
97
100
98
103
115
95
62
100
89
98
8.80
9.40
9.20
9.50
9.40
9.65
9.85
9.65
9.80
9.55
9.00
9.20
9.35
9.80
9.55
10.00
9.37
9.50
9.50
9.45
9.55
9.80
9.35
9.80
10.05
9.90
10.00
9.60
9.40
9.50
9.90
10.10
9.35
9.80
9.47
9.70
625
2,397
1,288
4,845
714
512
2,807
1,930
1,813
4,966
801
1,702
374
823
478
400
2,296
28,771
665
2,457
1,289
4,900
795
549
2,864
1,881
1,800
4,992
818
1,805
455
808
290
392
2,073
28,833
106
103
100
101
111
107
102
97
99
101
102
106
122
98
61
98
90
100 1 Number of pigs born September-November that were still on hand December 1, or had been sold. 2 Individual State estimates not available for the 34 Other States. 3 May not add due to rounding. 4 Utah is now a published state. Arkansas and Wisconsin are included in Other States.

Quarterly Hogs and Pigs Agricultural Statistics Board
December 2009 18 NASS, USDA
Monthly Farrowings: Number of Sows, Pigs per Litter, and Pig Crop,
United States, December-November 2008-2009
Month Sows Farrowing 1 Pigs per Litter Pig Crop 1
2008 2009 2008 2009 2008 2009
1,000 Head 1,000 Head Number Number 1,000 Head 1,000 Head
Dec 2
Jan
Feb
Mar
Apr
May
Jun
Jul
Aug
Sep
Oct
Nov
Total
1,017
1,028
1,026
1,049
998
1,004
1,046
1,020
1,009
1,047
1,005
976
12,225
997
1,013
1,001
1,009
1,003
1,006
998
988
980
1,009
987
978
11,969
9.22
9.24
9.26
9.35
9.38
9.41
9.48
9.52
9.53
9.50
9.48
9.52
9.41
9.50
9.45
9.49
9.56
9.61
9.66
9.71
9.70
9.69
9.71
9.70
9.68
9.62
9,381
9,502
9,505
9,811
9,370
9,450
9,917
9,712
9,611
9,951
9,529
9,292
115,030
9,475
9,576
9,501
9,650
9,644
9,718
9,693
9,589
9,495
9,794
9,574
9,465
115,174 1 Monthly values may not add to quarterly or annual totals due to rounding. 2 December preceding year.

Quarterly Hogs and Pigs Agricultural Statistics Board
December 2009 19 NASS, USDA
Reliability of December 1 Hogs and Pigs Estimates
Survey Procedures: A random sample of roughly 11,700 U.S. producers was surveyed to provide data for
these estimates. Survey procedures ensured that all hog and pig producers, regardless of size, had a chance
to be included in the survey. Large producers were sampled more heavily than small operations. During the
first half of December 2009, data were collected from about 9,500 operations, 81 percent of the total sample.
The data collected were received by electronic data reporting (EDR), mail, telephone, and face-to-face
personal interviews. Regardless of when operations responded, they were asked to report inventories as of
December 1, 2009.
Estimation Procedures: Hogs and pigs estimates were prepared by the Agricultural Statistics Board after
reviewing recommendations and analysis submitted by each field office. National and State survey data
were reviewed for reasonableness with each other and with estimates from past years using a balance sheet.
The balance sheet begins with the previous inventory estimate, adds the estimates of births and imports, and
subtracts the estimates of slaughter, exports, and deaths. This indicated ending inventory level is compared
to the Agricultural Statistics Board estimate for reasonableness.
Revision Policy: Revisions to previous estimates are made to improve quarter to quarter relationships.
Estimates for the previous four quarters are subject to revision when current estimates are made. In
December, estimates for all quarters of the current and previous year are reviewed. The reviews are
primarily based on hog check-off receipts and slaughter. Estimates will also be reviewed after data from the
Department of Agriculture five-year Census of Agriculture are available. No revisions will be made after
that date.
Reliability: Since all operations raising hogs are not included in the sample, survey estimates are subject to
sampling variability. Survey results are also subject to non-sampling errors such as omissions, duplication,
and mistakes in reporting, recording, and processing the data. The affects of these errors cannot be measured
directly. They are minimized through rigid quality controls in the data collection process and through a
careful review of all reported data for consistency and reasonableness.
To assist users in evaluating the reliability of the estimates in this report, the "Root Mean Square Error" is
shown for selected items in the following table. The "Root Mean Square Error" is a statistical measure based
on past performance and is computed using the difference between first and final estimates. The "Root
Mean Square Error" for hog inventory estimates over the past 20 quarters is 1.6 percent. This means that
chances are 2 out of 3 that the final estimate will not be above or below the current estimate of 65.8 million
head by more than 1.6 percent. Chances are 9 out of 10 that the difference will not exceed 2.7 percent.

Quarterly Hogs and Pigs Agricultural Statistics Board
December 2009 20 NASS, USDA
Reliability of December 1 Hog Estimates
Item
Root
Mean
Square
Error
90%
Confidence
Level
Difference Between
First and Latest
Estimates
Quarters
First
Above
Latest
First
Below
Latest Average Smallest Largest
Percent Percent 1,000 Head 1,000 Head 1,000 Head 1,000 Head Number Number
All Hogs &
Pigs
Pig Crop
Expected
Farrowings
Next
Quarter
Following
Quarter
1.6
2.0
2.4
2.6
2.7
3.5
4.1
4.5
1,777
1,009
121
132
722
385
46
52
67
5
3
3
3,067
1,644
216
220
4
4
4
4
16
16
16
16
Information Contacts
Listed below are the commodity specialists in the Livestock Branch of the National Agricultural Statistics
Service to contact for additional information.
Dan Kerestes, Chief, Livestock Branch ............................................................................... (202) 720-3570
Livestock Section
Scott Hollis, Head, Livestock Section .................................................................................. (202) 690-2424
Jim Collom - Dairy Products ................................................................................... (202) 690-3236
Joe Gaynor - Dairy Products Prices ........................................................................ (202) 690-2168
Jason Hardegree - Cattle, Cattle on Feed ................................................................ (202) 720-3040
Sherry Bertramsen - Livestock Slaughter ............................................................... (515) 284-4340
Everett Olbert - Sheep and Goats ............................................................................ (202) 720-4751
Mike Miller - Milk Production and Milk Cows ...................................................... (202) 720-3278
Nick Streff - Hogs and Pigs ..................................................................................... (202) 720-3106
ACCESS TO REPORTS!!
For your convenience, there are several ways to obtain NASS reports, data products, and services:
INTERNET ACCESS
All NASS reports are available free of charge. For free access, connect to the Internet and go to the NASS Home
Page at: www.nass.usda.gov.
E-MAIL SUBSCRIPTION
All NASS reports are available by subscription free of charge direct to your e-mail address. Starting with the
NASS Home Page at www.nass.usda.gov, under the right navigation, Receive reports by Email, click on
National or State. Follow the instructions on the screen.
- - - - - - - - - - - - - - - - - - - - - - - - - - - - - - - - -
PRINTED REPORTS OR DATA PRODUCTS
CALL OUR TOLL-FREE ORDER DESK: 800-999-6779 (U.S. and Canada)
Other areas, please call 703-605-6220 FAX: 703-605-6880
(Visa, MasterCard, check, or money order acceptable for payment.)
- - - - - - - - - - - - - - - - - - - - - - - - - - - - - - - - - -
ASSISTANCE
For assistance with general agricultural statistics or further information about NASS or its products or services,
contact the Agricultural Statistics Hotline at 800-727-9540, 7:30 a.m. to 4:00 p.m. ET, or e-mail:
The U.S. Department of Agriculture (USDA) prohibits discrimination in all its programs and activities on the
basis of race, color, national origin, age, disability, and where applicable, sex, marital status, familial status,
parental status, religion, sexual orientation, genetic information, political beliefs, reprisal, or because all or a part
of an individual’s income is derived from any public assistance program. (Not all prohibited bases apply to all
programs.) Persons with disabilities who require alternative means for communication of program information
(Braille, large print, audiotape, etc.) should contact USDA’s TARGET Center at (202) 720-2600 (voice and
TDD).
To file a complaint of discrimination, write to USDA, Director, Office of Civil Rights, 1400 Independence
Avenue, S.W., Washington, D.C. 20250-9410, or call (800) 795-3272 (voice) or (202) 720-6382 (TDD). USDA
is an equal opportunity provider and employer.