hindalco industries ltd board meeting e mail [email protected] corporate identity no....
TRANSCRIPT

INVESTOR PRESENTATION
FY14
Performance and Financial Review
May 29, 2014

Contents
2
Projects
Aluminium Business
Highlights
Copper Business

HIGHLIGHTS
3 3

Global recovery continues, but so do
the risks …
3.0
5.2
4.4
7.7
1.5
-0.5
1.9
3.6
4.9
5.4
7.5
1.4
1.2
2.8
World
ASEAN
India
China
Japan
Euro Area
US
2013 2014
GDP Growth Projections (%)
Source: IMF World Economic Outlook, Apr’14
Advanced economies are
driving the gradual recovery
in economic conditions
Financial markets, however,
remain vulnerable to risks:
Geopolitical (Ukraine)
Disruptive slowdown in
China?
Stretched valuations in US
equity and / or fast-
tracking of monetary
stimulus withdrawal

Aluminium: Emergence of deficit after
years of excess supply With ~3 Mtpa capacity closures since 2012 and consumption expected to grow
at 5-6% p.a., World Aluminium market shifting to deficit scenario, especially in
World Ex-China
(0.6)
0.1
2.7
3.3
0.9 0.6
0.4 0.0
(0.1)
2006 2007 2008 2009 2010 2011 2012 2013 2014 2015
&
beyond
World Primary Aluminium – Market balance (Mn tonnes)
Projections
(0.4) to
(0.5)
China:
Surplus
0.2-0.3
RoW:
Deficit
(0.7-0.8)
While this is a positive sign for the industry, workout of existing
overhang of inventory (90+ days) continues to be a challenge

Aluminium Industry: Key developments
Changes to LME warehousing rules
postponed due to Court intervention
Physical shortages and continuation of
stocks locked in financing deals have
helped premium shoot up further
SHFE has crashed significantly in
recent months due to rising surplus
243 249 250 246 305
367
Japanese Ingot Premium
(cif, $/t)
2,177
1,799
1500
1600
1700
1800
1900
2000
2100
2200 LME + Premium
SHFE Ex-VAT
($/t) LME & SHFE – Divergent Paths

Aluminium Industry: Early signs of
recovery…
LME appears to have bottomed out
Physical premium expected to be strong
Environmental issues, policy interventions to curb unbridled
growth, Lower SHFE and tighter credit… resulting in
curtailments within China
If Indonesia’s bauxite exports dry up beyond 2014, curtailments could
be even higher…
Globally…. Outside China, Over 2.5 Mn tonnes capacity closure
as cost inflation makes them unviable…
Global Demand continues to remain strong…
Indian Demand expected to receive a boost….

Highlights: FY14
Aluminium Metal Volume (Upstream)
FY14 vs. FY13
Consolidated Revenue
13%
Standalone Revenue
Standalone EBITDA
7%
13%
9%
Strong All-round Performance Q4 FY14 vs.
Q3 FY 14
11%
16%
34%
Consolidated PBIDTA 5%

Strong Operational Result…
FY14 EBITDA up 13%, driven by better
operational results in both Al and Cu
Sequential improvement in EBITDA has
continued; Q4 EBITDA up 34%
Significant jump in Depreciation & Interest
– Higher by `395 crore in FY14
Trend will continue in coming quarters
Exceptional charges of `396 crore in Q4
pertaining to UP entry tax and MP GATSVA
tax have pulled down the Net profit
478 540
629
844
EBITDA (` Crore)

FY14: Snapshot of the year
Aluminium
(India)
Novelis
Copper
(India)
World class projects with tight supply chain logistics.. set to
deliver ….
Ramping up … Not only primary metal but also ready to
produce…. world class VAP
Strong Exit quarter EBIT margin..
Strategic initiatives playing out well; firmly leading & driving
the light-weighting story in Auto…
Building on Global Product Portfolio…set to take advantage
of Soccer World cup & Summer Olympics
$1-bn EBITDA run-rate regained in exit quarter
Record EBIT … at ` 938 crore …..Highest ever
Strong Operational performance
De-Risked Business Portfolio… to further enhance returns through both volume and
value maximization…
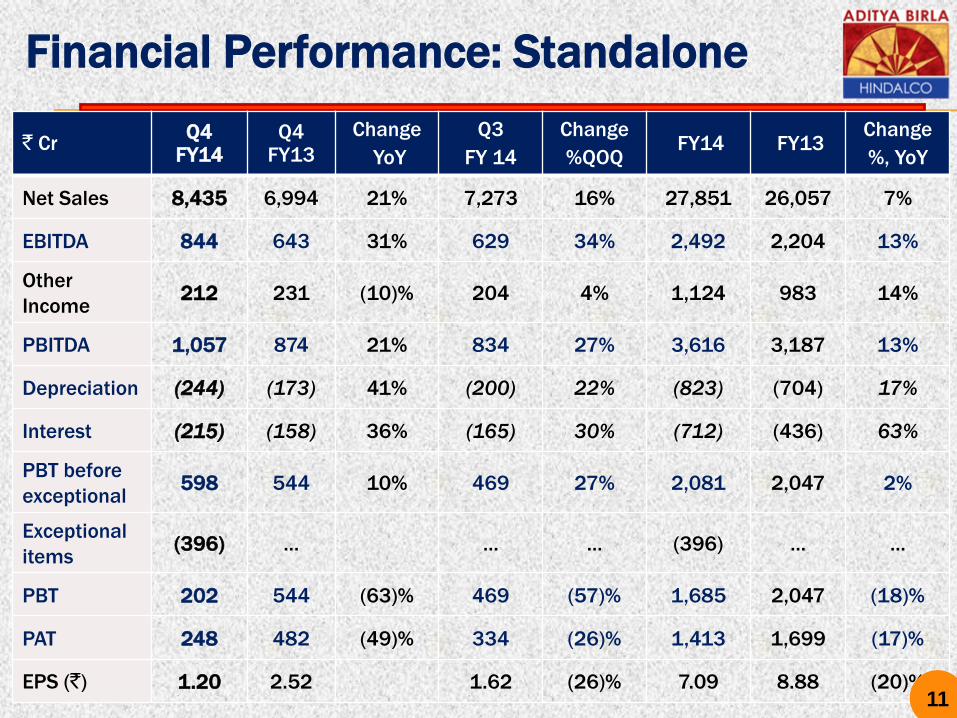
` Cr Q4
FY14 Q4
FY13
Change
YoY
Q3
FY 14
Change
%QOQ FY14 FY13
Change
%, YoY
Net Sales 8,435 6,994 21% 7,273 16% 27,851 26,057 7%
EBITDA 844 643 31% 629 34% 2,492 2,204 13%
Other
Income 212 231 (10)% 204 4% 1,124 983 14%
PBITDA 1,057 874 21% 834 27% 3,616 3,187 13%
Depreciation (244) (173) 41% (200) 22% (823) (704) 17%
Interest (215) (158) 36% (165) 30% (712) (436) 63%
PBT before
exceptional 598 544 10% 469 27% 2,081 2,047 2%
Exceptional
items (396) … … … (396) … …
PBT 202 544 (63)% 469 (57)% 1,685 2,047 (18)%
PAT 248 482 (49)% 334 (26)% 1,413 1,699 (17)%
EPS (`) 1.20 2.52 1.62 (26)% 7.09 8.88 (20)%
Financial Performance: Standalone
11

24%
50%
36%
13%
50%
64%
C.E
EBIT
SALES
Aluminium Greenfield Copper
62%
Segmental Performance – FY 14
12 *Standalone

13
ALUMINIUM BUSINESS
Aditya Aluminium,
Lapanga, Odisha

FY14 was a historic year for us
Six new facilities, all new-edge ‘Last-Man Standing’
assets, are on stream!
Mahan Utkal Aditya Mouda
Foils
H’kud
Exp.
H’kud
FRP
Expansion programme pursued since FY09 has is ready to
deliver….
Creating a ‘New Hindalco’,
Higher volumes, Improved efficiencies, Better product mix

Al: Rising Volumes ….
Production (Kt)
FY13 FY14 %
Alumina 1,320 1,619 23
Metal 542 613 13
FRP 220 238 8
Extrusions 34.5 38.2 11
Alumina output includes 277 kt at Utkal
Metal output includes 57 kt at Mahan &
Aditya
Q1
FY14
Q2
FY14
Q3
FY14
Q4
FY14
349 376 429 465
Alumina (Kt)
Q1
FY14
Q2
FY14
Q3
FY14
Q4
FY14
139 140 158
175
Metal (Kt)
Volumes to grow as projects ramp up to their
capacities

Al: Key Performance Drivers
LME dipped sharply, but depreciation of rupee cushioned the impact
Higher volumes
Higher VAP sales
Energy cost pressures have continued
Existing operations’ performance improved; but the result was
impacted by higher depreciation and start-up expenses from the new
sites
FY13 FY14
LME ($/t) 1,976 1,773
INRUSD 54.32 60.50
LME (`/Kg) 107.3 107.3

Al: Financial Performance (Standalone, w/o Utkal)
Quarterly Trend
Q1
FY14
Q2
FY14
Q3
FY14
Q4
FY14
2,211 2,343 2,471 3,025
Net Sales (` Cr)
Q1
FY14
Q2
FY14
Q3
FY14
Q4
FY14
249
166 170
350
EBIT (` Cr)
FY14 Performance
FY14
FY13 8779
Net Sales (` Cr)
FY14
FY13
934
930
EBIT (` Cr)
10,050
14%

NOVELIS : HIGHLIGHTS
Undisputed leader in Auto & Can FRP
18

Auto and Recycling: Key Strategies…
North America FRP Auto Demand
Auto Share of Novelis Portfolio
6%
> 25%
FY13 FY20
100
1425
2013 2014 2015 2016 2017 2018 2019 2020
North America Aluminum Auto FRP Demand Estimates (Kt)
Approaching
1.5M Tons
33% 39%
43% 50%
80%
30%
40%
50%
60%
70%
80%
FY10 FY12 FY13 FY15 FY20
Average Recycled Content in Novelis Products
Targets
Industry’s First
Independently
Certified 90%
Recycled Content
Can Body Sheet

Novelis: Shipments at a 3-yr high
Shipments up 4% yoy
990 958
861 911
562 640
395 447
FY13 FY14
South America
9%
Asia
13%
Europe
4%
North America
3%
2,786 kt 2,895 kt
Record production and
shipments in Asia and South
America on the back of
successful ramp-up of strategic
projects
Declining beverage can activity
and increased competitive
intensity affected shipments in
North America
Shipments up 8% in Q4 to reach
an 11-quarter high with
shipments growing in each
region

Novelis: Strong Cash Management in a
tough environment
FY14
FY13
885
961
Adj. EBITDA ($Mn)
8%
Oversupply induced pricing
pressures in North America and
Asia
However, registered a strong finish
to the year with Q4 FY14 EBITDA of
$250 Mn
Excellent cash management FY13 FY14
FCF before Capex ($Mn) 203 702
Yr-end Liquidity ($Mn) 760 1,020
Medium-term Outlook remains bright on the
back of strategic initiatives in recent years

Novelis: Strategic Goals on track …
Invested $2 Bn in last
3 years to solidify
Global Leadership
Auto Share in Product
Portfolio to lead the
Light-weighting trend
Sustainability : Goal of
80% recycling content
by 2020
Project SIG
– First Cast,
May 2014
570 kt of high quality
rolling capacity
600 kt of auto finishing
capability
~1mtpa of recycling
capacity
Europe auto shipments up
35% yoy on the back of
very strong partnership
with JLR
FY15 outlook bullish with
launch of new Ford supply
programme
4%
9%
20%
FY10
FY14
FY17 (P)
Auto Share in Portfolio (%)
Recycling content at 46%
in FY14 vs. 33% in FY10
Novelis EvercanTM now
commercially available

23
COPPER BUSINESS

Cu: Mixed Industry Trends…
FY14 vs.
FY13
Impact (YoY)
TCRC Higher
LME ($/t) Lower
Exch. Rate
(`/$) Favourable
Acid Price Significantly
lower
DAP
Realization Weaker

Cu: Robust Operational Performance
Higher production
Improved Cu-III performance post shutdown sustained
315 329
FY13 FY14
Cathode (kt)
209 229
FY13 FY14
DAP (kt)
Steadily improving performance from virtually same
asset base

Cu: Financial Performance
Quarterly Trend
Q1
FY14
Q2
FY14
Q3
FY14
Q4
FY14
3,636 3,974 4,817
5,422
Net Sales (` Cr)
Q1
FY14
Q2
FY14
Q3
FY14
Q4
FY14
81
239 300 318
EBIT (` Cr)
Planned
s/d
FY14 Performance
FY14
FY13
17848
17305
Net Sales (` Cr)
FY14
FY13
938
768
EBIT (` Cr) 22%
3%


ABML: Performance Update
Nifty copper production down 10% to 44kt in FY14
Impact of lower grade (2.08% in FY14 vs. 2.33% in the previous year)
Performance was supported by –
8% reduction in Nifty site costs
Slight improvement in LME in A$ terms
EBITDA for FY14 maintained at A$52 Mn – same as in FY13
Available options for divestment of Mt Gordon are under exploration
Nifty mine operations are currently suspended after an unfortunate
sinkhole incident on 21st March
Investigation drilling activities are in progress

Highlights: Consolidated Results, FY14
Revenues up 9% at `87,695 crore on the back of higher volumes in
Aluminium (India) and Novelis
PBITDA increased 5%; Aluminium margins came under pressure
Impact was cushioned by higher profitability in Copper segment
Despite better operational results, higher depreciation
(up ~` 700 cr) affected Aluminium EBIT
FY13 FY14 Ch.
Aluminium 62,259 69,218 11%
Copper 17,543 17,906 2%
Revenue (` crore)
FY13 FY14 Change
Aluminium 4,388 3,764 (14)%
Copper 740 1,025 38%
EBIT (` crore)

` Cr FY14 FY13 Change FY14 ($ mn)
Net Sales 87,695 80,193 9% 14,514
PBITDA 9,303 8,849 5% 1,540
Depreciation (3,553) (2,861) 24% (588)
Financing charge (2,702) (2,079) 30% (447)
PBT before exceptional items 3,049 3,909 (22)% 505
Exceptional items (396) … … (66)
PBT 2,653 3,909 (32)% 439
PAT 2,175 3,027 (28)% 360
EPS (`) 10.91 15.81 (31)% US c 18.1
Financial Performance: FY14 (Consolidated)

PROJECTS : ON STREAM
Aditya Smelter
31
Utkal Refinery
Mahan CPP Hirakud FRP

Mahan: Scaling up
Metal Production (kt)
32 Q2
FY14
Q3
FY14
Q4 FY
14
7
18
29

Utkal: Gaining momentum
33
Alumina Production (kt)
Q2
FY14
Q3
FY14
Q4
FY14
41
87
147

Aditya: Ramping up….
34

Summing up- FY 15.. Year of Consolidation
Uncertainty over access to captive coal when
Mahan and Aditya are ramping up
Appreciating rupee…
Depreciation & Interest burden from capitalization
of large investments
Challenges – from business
environment and some
growth pangs …
Ramp-up and stabilization of new factories, to achieve desired technical and
quality parameters
Re-balancing Novelis’ portfolio…. Thrust on Auto… Strengthening emerging
market presence…
Well poised for the discontinuous & sustainable
growth ….
Transition from Investment phase to Consolidation phase…..
Thank you
36
REGISTERED OFFICE
Century Bhavan, 3rd Floor, Dr. Annie
Besant Road, Worli, Mumbai 400 030
Telephone- +91 22 6662 6666
Website www.hindalco.com
E mail [email protected]
Corporate Identity No. L27020MH1958PLC011238

Certain statements in this report may be “forward looking statements” within the meaning of applicable securities laws and regulations. Actual results could differ materially from those expressed or implied. Important factors that could make a difference to the company’s operations include global and Indian demand supply conditions, finished goods prices, feed stock availability and prices, cyclical demand and pricing in the company’s principal markets, changes in Government regulations, tax regimes, economic developments within India and the countries within which the company conducts business and other factors such as litigation and labour negotiations. The company assume no responsibility to publicly amend, modify or revise any forward looking statement, on the basis of any subsequent development, information or events, or otherwise.
Forward Looking & Cautionary Statement
37