higher education comparative report - fiscal year 2017 · the commonwealth of virginia has 15...
TRANSCRIPT

HIGHER EDUCATION
COMPARATIVE REPORT
FISCAL YEAR 2017
Auditor of Public Accounts Martha S. Mavredes, CPA www.apa.virginia.gov
(804) 225-3350

EXECUTIVE SUMMARY The purpose of this report is to provide comparative financial information for Virginia’s four-year public institutions of higher education. The citizens of the Commonwealth partially fund the operations of each of these institutions with taxes paid to the Commonwealth and through tuition and fees paid by Virginia residents attending each institution. The basic mission of each of these institutions, providing post-secondary education to students, is essentially the same. However, the methodology for accomplishing this mission differs among institutions. Some examples of these differences in approach include the incorporation of military training in the educational environment, engagement of professors and students in various levels of research activities, and the inclusion of institution health systems or hospitals as part of the university-entity. In addition, both the age and location of the institution can cause large financial and physical resource differences. For example, older institutions have had a longer time to build financial reserves and expand their physical footprints. Smaller institutions, which may be attempting to achieve faster rates of growth, may be investing more heavily in their facilities and capital projects. This growth could contribute to lower reserves and higher levels of expense relative to total assets. To create this report, we primarily used amounts from state fiscal years 2015 through 2017, which covers the period from July 1, 2014, to June 30, 2017. We derived most of the information from the institutions’ individually published financial statements and footnotes. Annually, the Auditor of Public Accounts audits each of these institutions’ financial statements and provides an opinion on the fairness of those statements.
Although there are significant differences in how each institution operates, ratio analysis provides a methodology for beginning to understand the differences in financial activity at each institution and how changes in activity can be a reflection of each institution’s operating philosophy. In addition, as this report will be an ongoing analysis over time, future reports will continue to compare each institution’s ratios to those of previous years. Trend analysis will provide a well-rounded comparison of each institution’s figures to its own financial statements in previous years as well as to those of other institutions and attempt to show the impact of micro and macroeconomic shifts on the operations and financial stability of Virginia’s public four-year institutions of higher education.

- T A B L E O F C O N T E N T S - Pages EXECUTIVE SUMMARY BACKGROUND 1-4 INTRODUCTION 4 RATIOS AND ANALYSIS 5-20 TRANSMITTAL LETTER 21 BIBLIOGRAPHY 22-23 APPENDIX: INSTITUTION BACKGROUND INFORMATION 24-28 APPENDIX: CONDENSED FINANCIAL INFORMATION 29-30

1 Comparative Report as of Fiscal Year 2017
BACKGROUND The Commonwealth of Virginia has 15 four-year, public institutions of higher education as listed in Table 1 below. The basic mission of these institutions is to provide post-secondary education; however, the institutions can vary drastically based on several factors. Some of these factors include the age of the institution, the size of its endowments, and the setting in which it provides higher education. For instance, Virginia’s institutions range in age from just over 50 years old to over 320 years old. The size of each institution’s endowment ranges from the tens of millions to just over $6 billion. The Appendix: Institution Background Information includes additional biographical information regarding Virginia’s public four-year institutions. A comparative financial analysis of these institutions must consider a variety of factors including size, age, and type of institution.
Table 1. Institution Abbreviations
Abbreviation Institution
CNU Christopher Newport University
CWM The College of William and Mary in Virginia
GMU George Mason University
JMU James Madison University
LU Longwood University
NSU Norfolk State University
ODU Old Dominion University
RU Radford University
UMW University of Mary Washington
UVA University of Virginia
UVA-Wise University of Virginia’s College at Wise
VCU Virginia Commonwealth University
VMI Virginia Military Institute
VT Virginia Polytechnic Institute and State University
VSU Virginia State University
Endowments are donations of money or property, which provide ongoing support for an
organization. Institutions typically invest these funds and use the income and/or principal from those investments to support the institutions in accordance with the donors’ wishes. The original donation is typically not spendable, which allows for the continued earning of income to support future operations of the institution. Some institutions invest endowment funds directly, while affiliated university not-for-profit foundations primarily hold and invest endowment funds for other institutions. An understanding of how Virginia’s public institutions operate, at a minimum, must consider the size of the institutions and the institutions’ endowments. For purposes of this study, to obtain endowment asset amounts, we used self-reported data from each of the institutions to the National Association of Colleges and University Business Officers (NACUBO) Commonfund Study of Endowments (NCSE)1 as of fiscal year 2017, which was the latest data available at the time of our study. CNU and LU did not participate in the 2017 NCSE, and as such, we obtained their most recently submitted endowment data from the Integrated

2 Comparative Report as of Fiscal Year 2017
Postsecondary Education System (IPEDS).6 We obtained full-time equivalent enrollment information from the State Council for Higher Education in Virginia (SCHEV).
According to the NCSE, the average endowment of institutions who participated in their latest
study (809 institutions nationwide for fiscal year 2017) was about $704.5 million with a median endowment of $130.9 million; however, these averages include both public and private institutions. When considering public institutions alone, as in this comparative study, the average endowment per institution decreased to $476.3 million with a median endowment of $106.2 million. Based on an analysis of institutions submitting data to the NCSE, the average endowment for Virginia public institutions of higher education was $923.3 million, with a median endowment of $153.4 million. As noted in Table 2 below, four of Virginia’s 15 public four-year institutions have endowments larger than the national average for public institutions, while six of Virginia’s 15 institutions exceed the national median for endowment assets based on the information reported to the NCSE. Using NCSE data for institutions reporting enrollment statistics, the average endowment per full-time equivalent student for public four-year institutions nationally is $22,471 with a median endowment per full-time equivalent student of $9,423. The average endowment per full-time equivalent student for Virginia’s public four-year institutions reporting to the NCSE is $53,130 with a median endowment per full-time equivalent student of $10,834. This was the most current endowment-per-student data available at the time of this report. Although some institutions may not exceed national averages, many different factors contribute to the size of an institution’s endowment including the age of the institution, the alumni base and the pace at which they provide donations, the success of the endowment investment managers, and annual endowment spending percentages.
Table 2. Institution Endowment Data
Classification Institution
FY17 Endowment (in millions)1
Fall 2016 FTE
Enrollment2
Endowment per FTE Student
Highest Research GMU $ 77.7 29,377 $ 2,645
Highest Research UVA 6,400.0 24,329 263,061
Highest Research VCU 1,840.0 28,496 64,570
Highest Research VT 995.8 33,675 29,571
Higher Research CWM 874.1 8,610 101,521
Higher Research JMU 93.1 20,837 4,468
Higher Research ODU 213.5 20,031 10,658
Master’s and Baccalaureate CNU 24.1 4,986 4,834
Master’s and Baccalaureate LU 51.8 4,705 11,010
Master’s and Baccalaureate NSU 19.5 4,800 4,063
Master’s and Baccalaureate RU 50.1 9,165 5,466
Master’s and Baccalaureate UMW 47.9 4,296 11,150
Master’s and Baccalaureate VMI 435.1 1,953 222,785
Master’s and Baccalaureate VSU 36.1 4,505 8,013

3 Comparative Report as of Fiscal Year 2017
For purposes of this report, data presented for UVA includes UVA-Wise, as the institutions present consolidated financial statements for reporting purposes. For the same reason, CWM includes Richard Bland College, Virginia’s only junior college, as the institutions report to the same governing body and present consolidated financial statements for financial reporting purposes. The Virginia Community College System (VCCS) is not included in the comparative analysis, as this report does not intend to compare financial information of four-year institutions to financial information of the Commonwealth’s two-year institutions. The VCCS consists of 23 individual community colleges located throughout the Commonwealth of Virginia. The institutions that comprise the VCCS do not offer Bachelor’s Degrees; instead, they typically provide two-year Associate Degrees and certificates. With over 40 campuses and a total full-time equivalent student population of 105,242 as of the 2016-2017 academic year,2 it is difficult to provide a direct comparison between the VCCS and the Commonwealth’s four-year institutions. With the exception of VMI and UVA-Wise, all of Virginia’s four-year higher education institutions operate graduate programs with varying degree options. For the purposes of this report, we will refer to the universities as institutions even though some use “college” or “institute” as part of their formal name.
In addition to size of the institution and available resources, certain differences in organizational structure can impact comparability of financial information performed in this report. For example, the University of Virginia Medical Center (UVA Medical Center) is a division of UVA and accounting standards require the inclusion of its financial information with the financial activity of the UVA’s academic division. In contrast, accounting standards require reporting the VCU Health System Authority, a component unit of VCU, in a separate column alongside the institution’s information. For purposes of this report, we will use financial information of the primary university entity consistent with the presentation in the independently published financial statements of each institution. Except as otherwise noted, UVA Medical Center’s financial information will be combined with UVA, but the VCU Health System Authority will not be included with the information presented for VCU.
In most cases, the institutions present financial information pertaining to their non-profit foundations either alongside or immediately following the institution’s financial information. However, foundations support the institutions in different ways. For consistency throughout the remainder of this report, unless otherwise noted, we have included only the financial information of the institution and have excluded that of the institution’s respective foundations. It is important to note, however, that higher education foundations exist primarily to support the mission of the corresponding institution of higher education and will use their resources for various purposes to benefit the institution. In most cases, including foundation resources would significantly improve the financial position of each institution beyond what this report shows.
To aid in comparability among higher education institutions, we referred to four basic classifications prescribed by the Carnegie Foundation for the Advancement of Teaching.3 These Carnegie classifications include doctoral or research institutions (highest research activity, higher research activity, moderate research activity), master’s (larger programs, medium programs, and smaller
Certain differences in organizational structure impact comparability of
financial information performed in this report.

4 Comparative Report as of Fiscal Year 2017
programs), and baccalaureate colleges. We have classified Virginia’s state-supported institutions into three broad categories based on the above classifications: research institutions with the highest research activity, research institutions with higher research activity, and master’s and baccalaureate institutions. These classifications take into account research and development spending, science and engineering research staff, doctoral conferrals, program size, and number of master’s degrees awarded. The assumption is that institutions with similar levels of research activity and similar degrees awarded operate more similarly to each other than to other institutions outside of their assigned classification. Institutions operating similarly are likely to be more comparable in types and levels of expenses and investments. Research institutions with the highest research activity include GMU, UVA, VCU, and VT. Research institutions with higher research activity include CWM, JMU, and ODU. The master’s and baccalaureate institutions include CNU, LU, NSU, RU, UMW, VMI, and VSU.
INTRODUCTION TO FINANCIAL ANALYSIS
Ratios are quantitative relationships between two amounts showing the number of times one
value (denominator) is contained within the other (numerator). This report uses several ratios to compare balances and activities within institution financial statements. Ratios help to provide relative comparability of each institution’s activities, financial performance, and reserves rather than comparing total dollar values from one institution to the next. The tables, charts, and graphs below show summarized financial health and performance by assigned classification for the institutions. The Appendix: Condensed Financial Information provides additional detailed information for each institution.
Starting in fiscal year 2015, new accounting standards significantly affected financial information of each institution of higher education in Virginia. These standards require each institution to record a liability representing the institution’s share of the Commonwealth of Virginia’s overall net pension liability for employee pension benefits.4 Before these standards, it was uncommon for institutions to show a negative balance in unrestricted net position. However, following the implementation of the standards, only a few institutions continued to have a positive balance for this net position classification. As some uncertainty remains as to the best way to account for the impact of these new standards within the traditional ratio analysis model, we opted to exclude the impact from the ratios presented in this report. As these standards affect all institutions, we believe the exclusion of these liabilities should not significantly impact the comparability of ratios from one institution to another.

5 Comparative Report as of Fiscal Year 2017
RATIOS AND ANALYSIS
Financial Resource Ratios
The financial resource ratios focus on available resources and the returns generated from those resources. They intend to answer whether institutions have sufficient resources and whether they use those resources to support the mission and strategic direction of the institution.
Primary Reserve Ratio
The Primary Reserve ratio measures the financial strength of an institution by comparing expendable net position to total expenses. Expendable net position consists of resources the institution can access in a short amount of time to satisfy obligations. Expendable net position excludes an institution’s net investment in capital assets and other nonexpendable net position elements. Resources considered nonexpendable are generally not available to satisfy obligations unless the institution satisfies specific restrictions. For example, institutions do not generally sell their capital assets to cover obligations, except in extreme circumstances, and as such, resources invested in capital assets do not meet the liquidity requirement used in this ratio. A high Primary Reserve ratio indicates an institution can withstand times of economic downturn, decreases in enrollment, decreases in fundraising activities, or inability to secure debt. A low ratio indicates that during an economic downturn, an institution could encounter difficulty meeting its obligations.5 The ratio also indicates the length of time an institution could continue operations without additional revenue or support. In other words, the Primary Reserve ratio provides a snapshot of the financial strength and flexibility of an institution.5 A ratio of 1.0 generally indicates an institution could continue to meet obligations for a year without additional revenue, increased state appropriation support, or short-term borrowing.5 The accepted benchmark for this particular ratio is 0.40.5
As seen in Figure 1, UVA’s high Primary Reserve ratio of 1.90 in fiscal year 2017 is largely due to its significant investment and restricted, but expendable, funds. Investments comprise 62.7 percent of UVA’s total assets and UVA’s investments are reported as those held by the institution itself, whereas many other institutions consolidate giving and investment activities with their non-profit foundations. In contrast to UVA, where investments comprise a majority of the total assets, capital assets comprise
the majority of total assets for both NSU and UMW. NSU and UMW’s capital assets comprise 87.2 percent and 91.8 percent of total assets, respectively. When capital assets represent a large percentage of total assets, it limits the amount of expendable and unrestricted assets available to satisfy obligations. Additionally, capital expansion can temporarily cause the Primary Reserve ratio to decline. As such, it is important to view this ratio and others over time to account for periods of expansion.
Primary Reserve ratio provides a snapshot of the financial strength
and flexibility of an institution.5
Capital expansion can temporarily cause the Primary Reserve ratio
to decline.

6 Comparative Report as of Fiscal Year 2017
Both RU and VMI at 0.44 and 0.39, respectively, have significant Primary Reserve ratios relative to their peers, which result from lower debt levels and more liquid assets than other institutions. For example, RU’s cash, cash equivalents, and investments represent 22.6 percent of its total assets compared to an 8.7 percent average for the remaining institutions in the master’s and baccalaureate institution classification. In contrast, VMI’s total liabilities of $67.4 million represent just 17.1 percent of its total assets compared with an average of 44.6 percent for the remaining institutions in the classification. Although the institutions have chosen different strategies for their institutions, the result for both institutions is the accumulation of significant reserves of expendable resources. However, as noted previously, the Primary Reserve ratio for institutions directing endowment and investment activities toward not-for-profit foundations rather than to the institution directly is lower than when including those expendable resources held by the foundation for the direct benefit of the institution.
Figure 1. Primary Reserve Ratio
Viability Ratio
The Viability ratio measures one of the most basic determinants of clear financial health: the availability of expendable net position to cover long-term debt should the institution need to settle its obligations as of the statement of net position date.5 What this indicator tells the institution is that they either can or cannot settle long-term debt obligations as of the statement of net position date with expendable net position available. This ratio also indicates whether an institution can assume new debt. Although the institution will receive more funds as it continues to operate past the balance sheet date, this ratio is a good indicator of whether the existing debt assumed exceeds a level the institution can
0.32
1.90
0.370.42
0.150.25 0.28
0.120.15
0.05
0.44
0.05
0.39 0.32
-
0.25
0.50
0.75
1.00
1.25
1.50
1.75
2.00
GMU UVA VCU VT CWM JMU ODU CNU LU NSU RU UMW VMI VSU
Highest Research Higher Research Master's and Baccalaureate
2015 2016 2017 Benchmark

7 Comparative Report as of Fiscal Year 2017
afford to pay. A benchmark ratio of 1.0 or greater indicates sufficient expendable resources to cover outstanding debt obligations.5
Figure 2 shows each institution’s Viability ratio compared with average Viability ratio by institution type. For comparison purposes, we excluded UVA’s Viability ratio from the average Viability ratio calculation of the highest research institutions, as it is a clear outlier when compared with all other institutions due to the size of its expendable endowment and investment resources. To varying degrees, some institutions have directed giving activities toward not-for-profit foundations, which can deflate the expendable resources shown on the Statement of Net Position and deflate the Viability ratio. In addition, the extent to which an institution has arrangements with a not-for-profit affiliated foundation to provide resources to service long-term debt, these types of arrangements improve the viability of the institution, but the Viability ratio is unable to capture the impact. The chart below shows the Viability ratio of each institution when excluding the impact of pension accounting standards.
Figure 2. Viability Ratio
The institutions with the highest ratios over a baseline ratio of 1.0 are UVA (4.01), RU (1.65), VMI (1.55) and VT (1.17). The institutions with the lowest ratios include CNU (0.11), NSU (0.15), and UMW (0.04). UVA’s much larger Viability ratio is primarily due to a large amount of cash equivalents and investments at its disposal as expendable resources. As already noted above, UVA’s endowment and other investments make up a significant portion of its total assets. GMU has a lower Viability ratio than others classified as highest research institutions due to its significant investment in capital assets and corresponding long-term debt obligations incurred to finance those assets. GMU’s capital assets comprise approximately 75.1 percent of total assets and, as noted above, the Viability ratio does not consider capital assets to be expendable resources available to settle obligations. The Age of Facilities ratio shown later in this report corroborates this assessment, as GMU’s facilities are younger in age than the other institutions in the highest research category. Institutions in the higher research category remain somewhat consistent in viability as they maintain similar proportions of expendable assets to
0.43
4.01
0.851.17
0.29 0.39 0.57 0.11 0.33 0.15
1.65
0.04
1.55
0.47
0.00
0.50
1.00
1.50
2.00
2.50
3.00
3.50
4.00
4.50
GMU UVA VCU VT CWM JMU ODU CNU LU NSU RU UMW VMI VSU
Highest Research Higher Research Master's and Baccalaureate
Viability Ratio Average Viability by Institution Type Benchmark

8 Comparative Report as of Fiscal Year 2017
liabilities. VMI’s Viability ratio is larger than most other institutions in the master’s and baccalaureate category as it has a lower debt load relative to total assets. Similarly, as noted in the Primary Reserve ratio discussion, RU’s sizeable cash and cash equivalent balances have a similar impact in increasing its Viability ratio. UMW has a lower Viability ratio than others in the master’s and baccalaureate category primarily due to fewer expendable resources available to pay long-term debt obligations. UMW’s capital assets represent approximately 92 percent of total assets, leaving limited assets in expendable resources prior to considering liabilities. Additionally, UMW’s total liabilities represent 54.7 percent of total assets, which is roughly ten percent higher than other institutions in the master’s and baccalaureate classification.
A year-to-year comparison of Viability ratio is helpful to show trends at the individual institution level and across the various classifications of institutions. In some cases, the Viability ratio may experience a temporary decrease because of institution growth initiatives. For example, construction of a new building may result in an increase in debt, which may further constrain existing expendable resources. While these types of activities may temporarily decrease the Viability ratio for a particular institution, the ratio should trend upwards over the long term. Figure 3 shows a side-by-side analysis of fiscal year 2015 through 2017 Viability ratios for each institution. As noted, some institutions experienced small declines, while VMI notably experiences a large increase from 1.13 as of fiscal year 2016 to 1.55 as of fiscal year 2017, primarily due to an increase in assets and a corresponding decrease in liabilities, resulting in a year over year increase in expendable net position.
Figure 3. Viability Ratio Trends
0.43
4.01
0.85
1.17
0.29 0.390.57
0.11
0.33
0.15
1.65
0.04
1.55
0.47
-
0.50
1.00
1.50
2.00
2.50
3.00
3.50
4.00
4.50
GMU UVA VCU VT CWM JMU ODU CNU LU NSU RU UMW VMI VSU
Highest Research Higher Research Master's and Baccalaureate
2015 2016 2017 2017 Average (excluding UVA) Benchmark

9 Comparative Report as of Fiscal Year 2017
Return on Net Position Ratio
Another measurement of an institution’s operating performance is the Return on Net Position ratio, which measures total economic return. This ratio considers all forms of revenue and expense for a given fiscal year compared to the institution’s net position by dividing the change in net position by the total beginning net position. In general, a higher return on net position indicates a stronger year of financial performance. An institution with less long-term debt generally has a higher return on net position. Several different factors can impact this ratio, including periods of capital expansion or periods of high investment returns. There is generally not a fixed benchmark to apply or achieve for this ratio; however, institutions often look to make this ratio positive and improve over time.
Figure 4. Return on Net Position Ratio
As seen in Figure 4, GMU and NSU have the highest Return on Net Position ratios at 0.16 and 0.15, respectively, while LU has the lowest ratio at -0.04 for fiscal year 2017. GMU’s higher ratio is due to a smaller operating loss during fiscal year 2017 relative to peer institutions and significant capital appropriations and capital grants and contributions, which resulted in a larger increase in net position relative to total net position at the beginning of the year. Capital contributions increase the volatility in this ratio from year to year, as institutions record revenue in a given year when the Commonwealth
0.16
0.080.08
0.04
0.06
0.030.06
0.04
-0.04
0.15
0.04
0.01
0.040.05
(0.10)
-
0.10
0.20
0.30
GMU UVA VCU VT CWM JMU ODU CNU LU NSU RU UMW VMI VSU
Highest Research Higher Research Master's and Baccalaureate
2015 2016 2017 2017 Average
The Return on Net Position ratio
answers whether the university is
achieving a positive economic return on
its investment of resources.

10 Comparative Report as of Fiscal Year 2017
provides capital funding for selected projects; however, an institution may not receive funding every year. NSU’s Return on Net Position ratio also increased significantly from fiscal year 2016 to fiscal year 2017. The primary reason for the increase appears to be a decrease in the institution’s operating loss from fiscal year 2016 to 2017 and an increase in funding from state general fund appropriations and capital appropriations. The three-year downward trend in the ratios for RU and VSU further illustrates the impact of capital activity on these ratios, as both institutions experienced decreased capital appropriation support during fiscal year 2017 relative to previous fiscal years. LU experienced an overall decrease in operating revenues from fiscal year 2016 to 2017 and an increase in operating expenses resulting in a year over year increase in net operating loss. Additionally, as revenues from state appropriations and capital appropriations were not sufficient to offset the increase in operating loss, the institution experienced a decline in overall net position for fiscal year 2017. Like many institutions, the decrease in operating revenue is partially the result of declines in enrollment following the increases in enrollment during the recent nationwide recession. However, the increase in operating expenses is primarily due to the Vice Presidential debate, which LU hosted prior to the 2016 Presidential election. Age of Facilities Ratio
The Age of Facilities ratio is a comparison of the current year’s depreciation expense for buildings, infrastructure, and improvements compared to the total accumulated depreciation for those asset categories. This ratio provides an approximate average age of facilities in years by dividing the accumulated depreciation by the current year’s expense. This is an important ratio to take into consideration because this ratio can be an indicator of future building, infrastructure and maintenance needs. In general, a higher Age of Facilities ratio represents a greater immediate need for facility improvements. In Figure 5 below, we see a comparison of the Age of Facilities ratio across institutions, grouped according to institution classification.
Figure 5. Age of Facilities Ratio (in years)
0.00
2.00
4.00
6.00
8.00
10.00
12.00
14.00
16.00
18.00
20.00
GMU UVA VCU VT CWM JMU ODU CNU LU NSU RU UMW VMI VSU
Highest Research Higher Research Master's and Baccalaureate
Age of Facilities Ratio Average Age of Facilities
The Age of Facilities ratio roughly calculates the
average age of facilities and improvements in years.

11 Comparative Report as of Fiscal Year 2017
Figure 5, shows the highest and lowest Age of Facilities ratios are ODU (17.89) and CNU (8.94). Many different factors affect this ratio—the most prevalent of which is investment in capital assets. Based on review of CNU’s capital asset activity, the institution added $28.2 million in building and infrastructure capital assets in fiscal year 2017 and had approximately $24 million in ongoing capital projects at fiscal year end. CNU is the youngest comprehensive institution in the Commonwealth as they were part of CWM until 1977 and gained university status in 1992. Therefore, CNU’s expansion and investment in capital assets is consistent with a younger, growing institution. GMU’s long-term liabilities, excluding pension liabilities, are the highest relative to total assets of the institutions included in the highest research institution classification at 38.0 percent. This indicates GMU’s relative debt load compared with the other institutions is higher and helps to explain the lower Age of Facilities ratio as it has been building a higher proportion of new buildings than the other institutions over the last several years.
The extent to which the institution relies upon its foundation to finance capital projects may also impact this ratio. In many cases, an institution enters into operating leases with a related foundation or other entity to rent space. For example, as of the end of fiscal year 2017, ODU had future minimum rental payments of $33.9 million under leases for equipment and space, while CWM only reports $7.3 million in future rental payments as of this date. As operating leases may result in the use of new space, but not the recording of a newer asset on the Statement of Net Position, the use of operating leases can result in a higher Age of Facilities ratio relative to other institutions. Additionally, the geography or geographical location of an institution’s main campus may also impact its ability to construct new assets, particularly if land is limited based on the location of the campus in a major city.
Activity-Based Ratios
Below is an analysis of how activities of the institution relate to each other and are comparisons of activities in the institutions’ respective statements of changes in revenues, expenses and changes in net position. These ratios provide information on how the institutions allocate and prioritize resources in achieving their missions.
Functional Classification Ratios
We consider Educational Core Services, Educational Support, and General Support ratios to be Functional Classification ratios. Institution financial statements typically group expenses by the various functions of the institution. These ratios show expenses of certain functions as a percentage of an institution’s educational and general (E&G) revenue. For the purposes of this analysis, education and general revenue includes operating revenue, excluding patient services and auxiliary revenue, and including Pell grant and state appropriation revenue. The Educational Core Services ratio includes expenses related to instruction, research, and public service functions. The Educational Support ratio includes academic support and student services functions and the General Support ratio consists of expenses for institutional support
Functional Classification ratios show expenses of
certain functions as a percentage of E&G
revenue.

12 Comparative Report as of Fiscal Year 2017
functions. The operating expense classifications included in the institutions’ financial statements, but not included in these ratios are operation of plant, student aid, auxiliary services, depreciation, patient services, and other. Figure 6 below shows a compilation of each institutions’ Functional Classification ratios, taken from the individual institutions’ financial statements.
Figure 6. Combined Functional Classification Ratios
All institutions spend more on educational core services, educational support, and general support than they receive through operating revenue. As a result, institutions use non-operating revenue, specifically state appropriations, gifts, and non-operating grants and contracts, such as Pell grant revenue, to cover these expenses. The Functional Classification ratios presented account for the use of Pell grant revenue and state appropriations to support operating expenses, but do not include the impact of gifts or investment revenues on spending. Both UVA and VMI have combined ratios that exceed 1.0, indicating that educational core services, educational support, and general support spending exceeds the resources provided from state and federal entities and tuition and fees generated from student enrollment. Both institutions have significant endowments and revenues received from gifts, which provide funds to support institution operations. As a result, the institutions can use those resources to supplement state and federal resources and increase spending when compared to other institutions.
0.00
0.20
0.40
0.60
0.80
1.00
1.20
GMU UVA VCU VT CWM JMU ODU CNU LU NSU RU UMW VMI VSU
Highest Research Higher Research Master's and Baccalaureate
Axis Title
Educational Core Services Ratio Educational Support Ratio General Support Ratio

13 Comparative Report as of Fiscal Year 2017
Figure 7. Functional Classification Ratios Spending Distribution
Educational core services (instruction, research, and public service) are directly correlated to the mission of the institution. Figure 7 above shows the breakdown of institutional spending as a percentage of operating and nonoperating revenues excluding gifts and investment income. VT spends just over 80 percent of these revenue sources on educational core services and correspondingly smaller percentages on educational support and general support. UVA spends approximately 70 percent of these revenues on educational support services, but in absolute terms UVA spends more on educational core services and has a higher Educational Core Services ratio than any other institution (0.75). Analyzing this ratio by institutional classification is most appropriate as each grouping of institutions varies in how it accomplishes its institutional mission; for example, highest research activity institutions spend much more on research activities than master’s and baccalaureate institutions. Highest research activity institutions will generally have higher educational core service expenses and ratios due to the emphasis on research activity. Research expenses total approximately 17.4 percent of all operating expenses, when excluding hospital operations, for these institutions compared to 5.1 percent for institutions with higher research activity and 1.93 percent for master’s and baccalaureate institutions. ODU spends 2.7 percent of total operating expenses on research; however, this amount appears artificially low because ODU’s research activity runs primarily through the ODU Research Foundation. As the ODU Research Foundation spent $46.4 million on research during fiscal year 2017, including these expenses would result in a larger percentage of total expenses allocated to research increasing the institution’s Educational Core Services ratio. Additionally, public service expenses are comparable as a percentage of total expenses across all institutions, with small outliers in public service expenses at VT and VSU due to their agricultural extension offices. Instruction expenses for all institutions exceed 24 percent of operating expenses, excluding hospital operations at UVA and VCU. All institutions in the highest research and higher research classifications spend more on instruction than any other category as a percentage of total operating expenses. In the master’s and baccalaureate classification, institutions generally spend the most on instruction; however, CNU, LU, and VMI spent more on auxiliary
0%
10%
20%
30%
40%
50%
60%
70%
80%
90%
100%
GMU UVA VCU VT CWM JMU ODU CNU LU NSU RU UMW VMI VSU
Highest Research Higher Research Master's and Baccalaureate
Axis Title
Educational Core Services Ratio Educational Support Ratio General Support Ratio

14 Comparative Report as of Fiscal Year 2017
enterprises, such as housing and dining, as a percentage of total operating expenses than any other expense category.
Educational support expenses are supplemental, but necessary, expenses that relate to the
mission of the institution. These include expenses such as libraries, academic administration, admissions and registrar’s offices, and financial aid. UVA’s educational support ratio exceeds the average for the highest research activity institutions due to higher spending on academic support and student services. UVA spent 10.35 percent of total expenses excluding hospital expenses on academic support and 2.99 percent on student services. VT has a ratio that is below the mean for highest research activity institutions due to lower academic support expenses as a percentage of total expenses (6.41 percent) relative to peer institutions. Institutions in the higher research activity are comparable in relative spending on academic support and student services as a percentage of total operating expenses. The master’s and baccalaureate institutions vary the most with VMI having the highest ratio and VSU having the lowest. VMI has a higher Educational Support ratio due to higher overall spending relative to state and federal resources received as noted in Figure 6 above. VSU has a lower ratio as it allocates less to academic support and receives more federal grants and contracts than the other institutions in the category, resulting in higher research spending. This additional spending on research activities deflates percentages in other functional classifications as a percentage of total operating expenses.
General support expenses indirectly relate to the mission of the institution, and are directly
related to the day-to-day operations or business management of the institution. Examples of these expenses include fiscal operations, security, fundraising, and legal services. VT and GMU have lower ratios than other institutions due to lower spending on institutional support, ranging from five to six percent of total expenses. RU’s ratio is slightly higher than peer institutions in its classification due to higher overall spending on institutional support (11.09 percent) relative to the average of its peer institutions (9.00 percent). VMI’s spending is lower than the average of its peer institutions at 7.24 percent of total expenses; however, VMI generates a much larger percentage of total revenues from gifts at 17.88 percent compared with an average of 2.05 percent of total revenues from gifts for all other institutions, resulting in a slightly higher ratio. As these ratios are a function of spending compared to revenue sources like state appropriations, tuition and fees, and Pell grant revenue, VMI’s ratios will appear larger than other institutions as state and federal revenue sources are a relatively smaller portion of its total revenues and spending is higher due to the significant percentage of gifts received by the institution.

15 Comparative Report as of Fiscal Year 2017
Net Operating Revenues Ratio
The Net Operating Revenues ratio measures the operating performance of institutions and indicates whether an institution is living within its available resources. This ratio compares net income excluding capital revenues to the sum of total noncapital revenues. Operating revenues include student tuition, grants and contract revenue, sales and services of educational departments, auxiliary services, and other operating revenues. Nonoperating revenues include state appropriations, Pell grants, investment income, and gift revenue. Within Figure 8 below, we see a comparison of each institution’s Net Operating Revenues ratio over the last three fiscal years compared to those of their peers within the respective classifications.
Figure 8. Net Operating Revenues Ratio
The highest and lowest Net Operating Revenues ratios are those of UVA (0.14) and LU (-0.15). The large change from year to year at UVA is primarily due to performance of its sizeable endowment and investment portfolio, which sustained losses during fiscal year 2016, but recovered for significant gains during fiscal year 2017. The nature of investing activities can result in significant volatility in this ratio and contributes to the need to analyze the results of this ratio over several fiscal years. Additionally, capital related revenues excluded from the ratio include maintenance reserve funds provided by the Commonwealth. The exclusion of these revenues artificially lowers the Net Operating Revenues ratio as the net income used in the numerator includes the related maintenance reserve expenses. As noted in the Return on Net Position ratio, LU experienced a decline in enrollment and operating revenues and an increase in operating expense during fiscal year 2017. As the ratio is a measure of total surplus/deficit
0.07
0.14
0.02 0.01
-0.01
0.01 0.020.01
-0.15
-0.04
-0.02
-0.04 -0.06
0.01
(0.20)
(0.10)
-
0.10
0.20
GMU UVA VCU VT CWM JMU ODU CNU LU NSU RU UMW VMI VSU
Highest Research Higher Research Master's and Baccalaureate
Axis Title
2015 2016 2017
The Net Operating Revenues ratio indicates
whether an organization is living within its available
resources.

16 Comparative Report as of Fiscal Year 2017
to total noncapital revenues, any decrease in revenue and increase in deficit will result in a noticeable decrease in the ratio. Several other institutions show negative ratios for all three fiscal years; however, in most cases, these ratios improved from fiscal year 2015 through 2017. NSU’s ratio notably improved due to a narrowing of its operating loss and increased support from nonoperating revenue sources. Additionally, except for LU, net position increased for all institutions after the inclusion of capital-related revenues, like capital appropriations and capital gifts and grants. The primary explanation for the decline in LU’s ratio is additional one-time expenses from hosting the 2016 Vice Presidential debate.
Auxiliary Income Ratio
The Auxiliary Income ratio intends to show whether the revenues in support of auxiliary enterprises exceed the expenses for those services. Auxiliary services are all those not related to an institution’s core educational objectives and include housing, food services, bookstore operations, parking, and others. These enterprises do not receive state general fund support and should be self-sustaining in that the revenues they earn should equal or exceed the expenses. It is important to note that donors often restrict gifts given to institutions to be used for athletics and other auxiliary activities. As institutions receive donations restricted to auxiliary activities and earn auxiliary income, cash reserves can affect activities in the current period under analysis. Institutions with larger auxiliary cash reserves have more flexibility to set and adjust fees for auxiliary services than institutions relying on current period auxiliary income, such as student fees. Figure 9 below shows the Auxiliary Income ratio over a three-year period across institutions by classification. This measure compares auxiliary income to the amount of net auxiliary revenue.
Figure 9. Auxiliary Income Ratio
0.31
-0.22
0.27
0.13 0.10
0.25
0.10
0.20
-0.25
-0.32
0.11
0.27
-0.13
-0.14
(0.40)
(0.30)
(0.20)
(0.10)
-
0.10
0.20
0.30
0.40
GMU UVA VCU VT CWM JMU ODU CNU LU NSU RU UMW VMI VSU
Highest Research Higher Research Master's and Baccalaureate
Highest Research
2015 2016 2017
The Auxiliary Income ratio shows the extent to which
auxiliary services are self-sustaining.

17 Comparative Report as of Fiscal Year 2017
The highest and lowest Auxiliary Income ratios are GMU and NSU, which are 0.31 and -0.32, respectively. Although some institutions have negative auxiliary ratios and negative income in the area of auxiliaries services, this can indicate when an institution elects to use its auxiliary reserve funds or significant resources from endowments, gifts, or other investments to support auxiliary services as opposed to increasing fees for these types of services. Declines in enrollment can also result in significant swings in the Auxiliary Income ratio, particularly if expenses do not decline at the same rate as reduced auxiliary revenues from student fees. For example, NSU experienced significant declines in full-time equivalent enrollment from fiscal year 2013 through fiscal year 2016, with a slight increase in enrollment in fiscal year 2017, and relied on auxiliary reserves over the last several fiscal years to close budget gaps created by declining student enrollment.7 UVA and VMI rely heavily on contributions from individuals and affiliated foundations to aid in funding their athletic budget. As accounting standards require these items to be recorded in the Statement of Revenues, Expenses, and Changes in Net Position as nonoperating revenues, rather than auxiliary revenues, the ratio of auxiliary income to auxiliary revenue is artificially deflated and will likely continue to appear negative as a result of this accounting treatment and institutions’ operating philosophy. Of the institutions with negative ratios, only LU’s ratio moved from positive to negative during fiscal year 2017. A review of the institution’s revenues and expenses show a slight decrease in revenues consistent with the institution’s decline in enrollment noted previously and a large increase in auxiliary expenses. The large increase in expenses relates primarily to hosting the 2016 Vice Presidential debate and increased residential services expenses due to the opening of two new dorms during the fiscal year.
Composite Financial Index (CFI)
The Composite Financial Index or CFI combines four core ratios by assigning various weights to generate an aggregate score for financial strength and stability. These ratios: Primary Reserve ratio, Viability ratio, Net Operating Revenues ratio, and Return on Net Position ratio provide for an understanding of the institutions’ available resources and results of current operations, which when applied to certain benchmark factors generates a score from one to ten indicating strength of the institution. A score close to one indicates that the institution may be very light on expendable resources and have difficulty meeting operating demands in the current environment. On the contrary, a score of ten indicates that an institution has significant financial flexibility and is operating well within its means. A benchmark score of three generally indicates that an institution is financially healthy.5 In the event that a specific ratio is negative for an institution, the calculation uses a strength score of zero for that particular ratio, rather than using a negative number to avoid calculating a negative CFI score.

18 Comparative Report as of Fiscal Year 2017
Figure 10. Composite Financial Index (CFI)
As with other ratios, it is important to recognize that absolute comparisons between institutions are not usually appropriate. Each institution has different needs, both capital and operational, that may result in short-term increases or decreases in the CFI to fulfill programmatic requirements and the institution’s strategic plan. Reviewing trends in the CFI over time helps to adjust for the impact of significant one-time events that may disproportionately impact a ratio in a given fiscal year. Similar to the ratios that comprise the CFI, UVA shows its relative financial strength and flexibility with a calculated CFI of 8.63 compared with an average and median CFI of 4.46 and 3.27, respectively, for the institutions with the highest level of research activity. However, it should be noted that the CFI’s for the other institutions in this classification are either slightly above or below the benchmark ratio of 3.0, indicating relatively strong overall financial health. Institutions in the higher research classification are similar with an average and median CFI that approximate each other. ODU’s CFI of 2.09 is the highest in the group, with JMU and CWM consistently above 1.0. In the master’s and baccalaureate classification, the CFI scores range from 0.24 for UMW to 2.90 for RU. Four institutions exceeded the average CFI for the classification during fiscal year 2017 with VMI and RU exceeding the benchmark ratio of 3.0 in two of the last three fiscal years, while falling slightly below for the third year. UMW’s CFI ranged from a high of 0.54 in fiscal year 2015 to a low of 0.15 in fiscal year 2016 before rebounding slightly to 0.24 during fiscal year 2017. Despite the low ratio, UMW has seen an increase in its Primary Reserve ratio and Viability ratio over the last three fiscal years, which indicates the institution’s financial flexibility may be improving. LU’s dip in the CFI during fiscal year 2017 appears primarily the result of one-time outflows supporting the 2016 Vice Presidential debate, which resulted in a net decrease in net position from fiscal year 2016 to fiscal year 2017.
3.81
8.63
2.73 2.67
1.23
1.38 2.091.05 0.67 1.73
2.90
0.24
2.76
1.86
0.00
1.00
2.00
3.00
4.00
5.00
6.00
7.00
8.00
9.00
10.00G
MU
UV
A
VC
U VT
CW
M
JMU
OD
U
CN
U LU
NSU R
U
UM
W
VM
I
VSU
Highest Research Higher Research Master's and BaccalaureateHighest Research
2015 2016 2017 2017 Average CFI 2017 Median CFI
The CFI provides a snapshot of an
institution’s total financial health by
weighting four core ratios to develop a composite score.

19 Comparative Report as of Fiscal Year 2017
It is important to note that the degree to which institutions use foundations for fundraising and endowment support can have a tremendous impact on the CFI. Although the various ratios in this report do not reflect the financial information of the not-for-profit foundations of the Commonwealth’s four-year institutions of higher education, the Commonwealth’s Comprehensive Annual Financial Report (CAFR) prepared by the Department of Accounts each year does allow for a general calculation of CFI for the combined University/Foundation entity. Although the CAFR is not as detailed as each institution’s individually published financial statements, there is sufficient information to perform a quick calculation of CFI using the same framework as noted above for each individual institution.
Figure 11 below reflects CFI for the combined University/Foundation enterprise. Formulas for
ratios used in the combined CFI calculation are generally consistent with the CFI calculation shown for the institution as a standalone entity in Figure 10; however, the Viability ratio calculated for the combined entity uses total long-term liabilities rather than long-term debt in the denominator. This relative difficulty in obtaining detailed comparable data for long-term debt of the consolidated higher education entity from the CAFR is the reason for this variation. As a result, the CFI scores shown below are likely lower than they otherwise would be when excluding long-term liabilities other than long-term debt. Regardless, the ratios provide a relative understanding of the impact of foundations and affiliated organizations on the financial health of the combined enterprise.
Figure 11. Composite Financial Index (CFI) including Foundations
Certain entities experience a significant increase in CFI when adding the financial activity of their respective foundations into the calculation. VMI’s CFI increases from 2.76 to 8.39, representing the largest increase in CFI under the combined calculation. This increase is primarily the result of the large endowment held with the VMI Foundation, which is one of the largest for public institutions in the United States when considering endowment funds per full-time equivalent student. CWM also experiences a significant increase in CFI due to the size of the endowment held by its affiliated foundations, primarily the College of William and Mary Foundation. Lastly, VCU’s CFI increases due to improvement in all ratios
0.00
1.00
2.00
3.00
4.00
5.00
6.00
7.00
8.00
9.00
10.00
GM
U
UV
A
VC
U VT
CW
M
JMU
OD
U
CN
U LU
NSU R
U
UM
W
VM
I
VSU
Highest Research Higher Research Master's and Baccalaureate
Highest Research
CFI - institution only CFI - institution and foundation data

20 Comparative Report as of Fiscal Year 2017
supporting the CFI calculation due to the addition of its foundations, but also the activity of the VCU Health System Authority. Several institutions experience slight decreases in the CFI score after adding in foundation information; however, there are no decreases that are large enough to warrant significant additional attention for the purposes of this report.

21 Comparative Report as of Fiscal Year 2017
October 30, 2018 The Honorable Ralph S. Northam Governor of Virginia The Honorable Thomas K. Norment, Jr. Chairman, Joint Legislative Audit And Review Commission
Please find enclosed a comparative financial report for Virginia’s four-year public institutions of higher education. This report primarily uses ratio analysis as a means to analyze financial activity at each institution and shows changes in financial performance over time. We have compiled this report by analyzing financial statements audited by our office at each institution for the fiscal years ended June 30 2015, through June 30, 2017. Should you have any questions, please contact Eric Sandridge, Higher Education Programs Audit Director, or me. Sincerely,
Martha S. Mavredes Auditor of Public Accounts

22 Comparative Report as of Fiscal Year 2017
BIBLIOGRAPHY 1 2017 NACUBO – Commonfund Study of Endowments (NCSE), http://nacubo.org 2 State Council for Higher Education in Virginia (SCHEV), Annualized Student FTE and Credit Hours Research Report, Fall 2016, http://schev.edu 3 The Carnegie Classification of Institutions of Higher Education (n.d.), About Carnegie Classification, Retrieved (June 2018) from http://carnegieclassifications.iu.edu/ 4 Governmental Accounting Standards Board (GASB) Statement No. 68 Accounting and Financial Reporting for Pensions, http://www.gasb.org 5 Prager, Sealy & Co., LLC, Strategic Financial Analysis for Higher Education, 2005, https://www.prager.com/Public/raihe6.pdf 6 Integrated Postsecondary Education Data System, IPEDS, https://nces.ed.gov/ipeds/ 7 Notes to Schedule of Revenues and Expenses of Intercollegiate Athletics Programs, Norfolk State University, 2017, http://www.apa.virginia.gov/reports/NorfolkStateUniversityNCAA2017.pdf 8 George Mason University, A History, Retrieved (September 2018) from http://ahistoryofmason.gmu.edu/ 9 University of Virginia Facts and Figures, Retrieved (September 2018) from http://www.virginia.edu/facts 10 Virginia Commonwealth University Mission and History, Retrieved (September 2018) from https://www.vcu.edu/about-vcu/mission-and-history/
11 Virginia Tech Mission, Vision, and Core Values, Retrieved (September 2018) from https://www.provost.vt.edu/content/dam/provost_vt_edu/archives/long_range_plan/mission.pdf 12 James Madison University, Strategic Plan, Mission Retrieved (September 2018) from https://www.jmu.edu/jmuplans/about/ 13 Old Dominion University Mission Statement, Retrieved (September 2018) from https://www.odu.edu/about/planning/mission-statement 14 College of William and Mary Vision Statement, Retrieved (September 2018) from https://www.wm.edu/about/administration/provost/about/vision/index.php 15 Christopher Newport University Mission and Vision, Retrieved (September 2018) from http://cnu.edu/whoweare/missionvision/ 16 Longwood University Mission, Retrieved (September 2018) from http://www.longwood.edu/about/leadership/mission/

23 Comparative Report as of Fiscal Year 2017
17 Norfolk State University Mission Statement, Retrieved (September 2018) from http://www.nsu.edu/president/mission
18 Radford University, About, Our History, Retrieved (September 2018) from https://www.radford.edu/content/radfordcore/home/about/history.html 19 University of Mary Washington, Our History, Retrieved (September 2018) from https://www.umw.edu/about/our-history/ 20 Virginia Military Institute Mission, retrieved (September 2018) from https://www.vmi.edu/about/administration/superintendents-office/mission/ 21 Virginia State University, Our History, Retrieved (September 2018) from http://www.vsu.edu/about/history/index.php

APPENDIX: INSTITUTION BACKGROUND INFORMATION
24 Comparative Report as of Fiscal Year 2017
Highest Research Activity Category George Mason University George Mason University (GMU) began holding its first classes in 1949. Originally known as the Northern Virginia University Center, the intention for this institution was to provide two-year degrees and transfer students to four-year institutions, upon completion. In the 1950’s, GMU became a branch of the University of Virginia through an act of the Virginia General Assembly. Named after founding father, George Mason, who authored the Virginia Declaration of Rights, GMU began offering four-year degrees in 1966 and became an independent institution in 1972. GMU experienced rapid growth and, throughout the latter 20th century, was known as the most rapidly expanding state institution in Virginia. GMU is the largest public research institution in the Commonwealth based on unduplicated headcount.8 The University of Virginia Thomas Jefferson founded The University of Virginia (UVA) in 1817 before the first Board of Visitors officially chartered the institution in 1819. Today, UVA has three major divisions, including the Academic Division, the Medical Center, and the College at Wise. There are 11 UVA colleges in the Charlottesville area including public policy, arts and sciences, education, business, commerce, architecture, continuing and professional studies, engineering and applied science, law, medicine, and nursing. UVA considers its College at Wise a liberal arts institution, offering 30 different majors. The UVA Medical Center is part of the UVA Health System and is a functioning hospital, which provides medical care to patients.9
Virginia Commonwealth University What is known today as the Virginia Commonwealth University (VCU) Health System was founded in 1838 in Richmond, Virginia as the medical department of Hampden-Sydney College. This medical institution received its independent charter from the Virginia General Assembly in 1854 and officially became the Medical College of Virginia (MCV). In 1925, MCV established its institution of social work and public health as the Richmond Division of the College of William and Mary. This became Richmond Professional Institute (RPI) in 1939 and after adding several liberal arts, business, and other non-medical degrees; RPI dropped its affiliation with the College of William and Mary and combined with MCV to become VCU in 1968. The VCU Health System is a functioning hospital, providing health care to patients and medical education to students. VCU’s mission is to advance knowledge and student success through its commitments to an engaged, learner-centered environment; research; interdisciplinary collaborations; health care; diversity; and sustainable, university-community partnerships.10

APPENDIX: INSTITUTION BACKGROUND INFORMATION
25 Comparative Report as of Fiscal Year 2017
Virginia Polytechnic Institute and State University Virginia Polytechnic Institute and State University (VT) originally began in 1872 as a land-grant institution called Virginia Agricultural and Mechanical College. A land grant is a gift of federal land to an institution or organization, usually given to an institution so that they can focus on the teaching of practical agriculture, and other types of subjects outside the realm of liberal arts. After a couple of name changes, in 1970, the state legislature sanctioned university status for VT and gave it the legal name of Virginia Polytechnic Institute and State University, which it still holds today. VT is a science, technology, and engineering institution, with some degrees offered in the liberal arts and other fields of study. VT’s mission states that they are a “public land-grant university serving the Commonwealth of Virginia, the nation, and the world community. The discovery and dissemination of new knowledge are central to its mission. Through its focus on teaching and learning, research and discovery, and outreach and engagement, the university creates, conveys, and applies knowledge to expand personal growth and opportunity, advance social and community development, foster economic competitiveness, and improve the quality of life.”11 Higher Research Activity Category
The College of William and Mary Chartered in 1693, The College of William and Mary (CWM) is the oldest higher education institution in the Commonwealth of Virginia and is the second oldest functioning college in the nation. In the 17th century, King William III and Queen Mary II of England signed the charter for a "perpetual College of Divinity, Philosophy, Languages, and other good Arts and Sciences" to be founded in the Virginia Colony. CWM was also the first co-ed state college in the Commonwealth. CWM has had affiliations with and helped start Virginia Commonwealth University, Christopher Newport University, Old Dominion University, and today has affiliations with junior college, Richard Bland College and the Virginia Institute of Marine Science, which focuses on marine biology. CWM’s mission is a detailed approach to achieving their vision of “building on more than 300 years of innovation and excellence, breaking the boundaries between research and teaching, student and teacher, living and learning.”14 James Madison University Established in 1908, James Madison University (JMU) began as the State Normal and Industrial University for Women. The institution officially changed its name to Madison College in 1938 in honor of President James Madison and went onto become James Madison University in 1977. It was not until 1966 that the institution became a co-ed institution by an action of the Virginia General Assembly. Today, JMU offers more than 120 degree programs, predominately in the area of the liberal arts. JMU’s mission states that the University is “a community committed to preparing students to be educated and enlightened citizens who lead productive and meaningful lives.”12

APPENDIX: INSTITUTION BACKGROUND INFORMATION
26 Comparative Report as of Fiscal Year 2017
Old Dominion University Old Dominion University (ODU) was originally founded in 1930 as the Norfolk Division of the College of William and Mary. It became an independent institution in 1962 and was granted university status in 1969. ODU’s focuses on science, engineering, and technology, as these fields are important to the Hampton Roads region. The Institution’s mission states “ODU, located in the City of Norfolk in the metropolitan Hampton Roads region of coastal Virginia, is a dynamic public research institution that serves its students and enriches the Commonwealth of Virginia, the nation, and the world through rigorous academic programs, strategic partnerships, and active civic engagement.”13 Master’s and Baccalaureate Category
Christopher Newport University Christopher Newport University (CNU) started in 1960 as a full-time extension of the College of William and Mary. CNU was named after Captain Christopher Newport, who was an English sailor who brought settlers to Jamestown and the Virginia Colony and helped found Britain’s first permanent settlement in Bermuda. Christopher Newport College became independent in 1977, offering liberal arts degrees with the intention of becoming a university, which it did in 1992. CNU is the youngest comprehensive institution in the Commonwealth. The institution offers a range of different degrees, but is generally considered a liberal arts institution. CNU’s mission is to “provide educational and cultural opportunities that benefit CNU students, the residents of the Commonwealth of Virginia, and the nation.”15 Longwood University Originally called the Farmville Female Seminary Association, Longwood University (LU) was founded in 1839 with the intention of providing seminary education to women. It became Longwood College in 1949 and achieved university status in 2002. It became a co-ed institution in 1976. Today, LU is a liberal arts institution, offering over 100 different majors and minors. Longwood’s mission states that the institution is “dedicated to the development of citizen leaders who are prepared to make positive contributions to the common good of society. Building upon its strong foundation in the liberal arts and sciences, the University provides an environment in which exceptional teaching fosters student learning, scholarship, and achievement. As the only four-year public institution in south central Virginia, Longwood University serves as a catalyst for regional prosperity and advancement.”16 Norfolk State University Norfolk State University (NSU) was founded in 1935 with the intention of helping students become successful through higher education in the midst of the great depression. The Norfolk Unit of Virginia Union University, as it was known at its founding, went on to become the independent Norfolk Polytechnic College in 1942. Through an act of the General Assembly, NSU then became a public institution as a part of Virginia State College (now Virginia State University). NSU began offering its first baccalaureate degree in 1956 and separated from Virginia State, becoming fully independent in 1969.

APPENDIX: INSTITUTION BACKGROUND INFORMATION
27 Comparative Report as of Fiscal Year 2017
NSU achieved university status in 1979 and then began granting graduate degrees. NSU’s mission states it “is committed to transforming students’ lives through exemplary teaching, research and service. Offering a supportive academic and culturally diverse environment for all, the University empowers its students to turn their aspirations into reality and achieve their full potential as well rounded resourceful citizens and leaders for the 21st century.”17 Radford University The Commonwealth of Virginia established the State Normal and Industrial University for Women in 1910. The intent of this institution was to prepare female teachers for Virginia’s expanding public university system. In an effort to provide students with a broad professional and technical education, State Teachers College, as Radford was then known, merged with Virginia Polytechnic Institute in 1943. The institution was then the Women’s Division of VPI (now Virginia Tech). In 1964, Radford College split with Virginia Tech and, in 1972, Radford began admitting men into its undergraduate programs. In 1979, Radford College achieved university status and became Radford University, as it is known today.18 University of Mary Washington In 1908, the Commonwealth established the State Normal and Industrial School for Women to focus on providing women with preparatory training to become teachers. The institution was renamed Mary Washington College in 1938 after Mary Ball Washington, George Washington’s mother. In 1944, the Commonwealth affiliated the institution with the University of Virginia and operated as the women’s college for UVA. After becoming co-ed in 1970, Mary Washington College went on to become its own separate entity in 1972. Mary Washington College became the University of Mary Washington after achieving university status in 2004. UMW’s mission states that it is “one of Virginia’s outstanding public liberal arts universities, providing a superior education that inspires and enables our students to make positive changes in the world.”19
Virginia Military Institute In the early 19th century, the town of Lexington, Virginia was partially occupied by one of three arsenals in the Commonwealth. An arsenal guard of about 20 soldiers protected this facility. In 1834, the town of Lexington, Virginia proposed to transform this arsenal into a military college for the arsenal guard cadets, which led to the establishment of the Virginia Military Institute (VMI) in 1839. VMI ceased classes for the better part of the civil war. They were able to rebuild and re-open at the conclusion of the war in 1865. Today, VMI is the oldest state-supported military college in the United States. VMI became a co-educational institution in 1997. VMI continues to incorporate military-style training into its mission of providing of higher education. Students live in barracks, sleep on cots, give up television and other amenities, as well as undergo extensive military-style exercises and drills. VMI offers baccalaureate degrees in both engineering, liberal arts, and other fields. It is the mission of VMI “to produce educated, honorable men and women, prepared for the varied work of civil life, imbued with love of learning, confident in the functions and attitudes of leadership, possessing a high sense of public service, advocates of the American democracy and free enterprise system, and ready as citizen-soldiers to defend their country in time of national peril.”20

APPENDIX: INSTITUTION BACKGROUND INFORMATION
28 Comparative Report as of Fiscal Year 2017
Virginia State University The Virginia Normal and Collegiate Institute, now known as Virginia State University (VSU), was established by an act of the General Assembly in 1882. The institution became known as Virginia State College in 1946 and split from Norfolk State College in 1969. After achieving university status, the institution was renamed Virginia State University in 1979. VSU offers several different degrees, focusing more on agricultural and natural sciences, as well as engineering and technology. VSU’s mission states that it is a public comprehensive 1890 land grant institution and historically black college/institution and “is committed to the preparation of a diverse population of men and women through the advancement of academic programs and services that integrate instruction, research, extension, and outreach. The University endeavors to meet the educational needs of students, graduating lifelong learners who are well equipped to serve their communities as informed citizens, globally competitive leaders, and highly effective, ethical professionals.”21
APPENDIX: CONDENSED FINANCIAL INFORMATION
29 Comparative Report as of Fiscal Year 2017
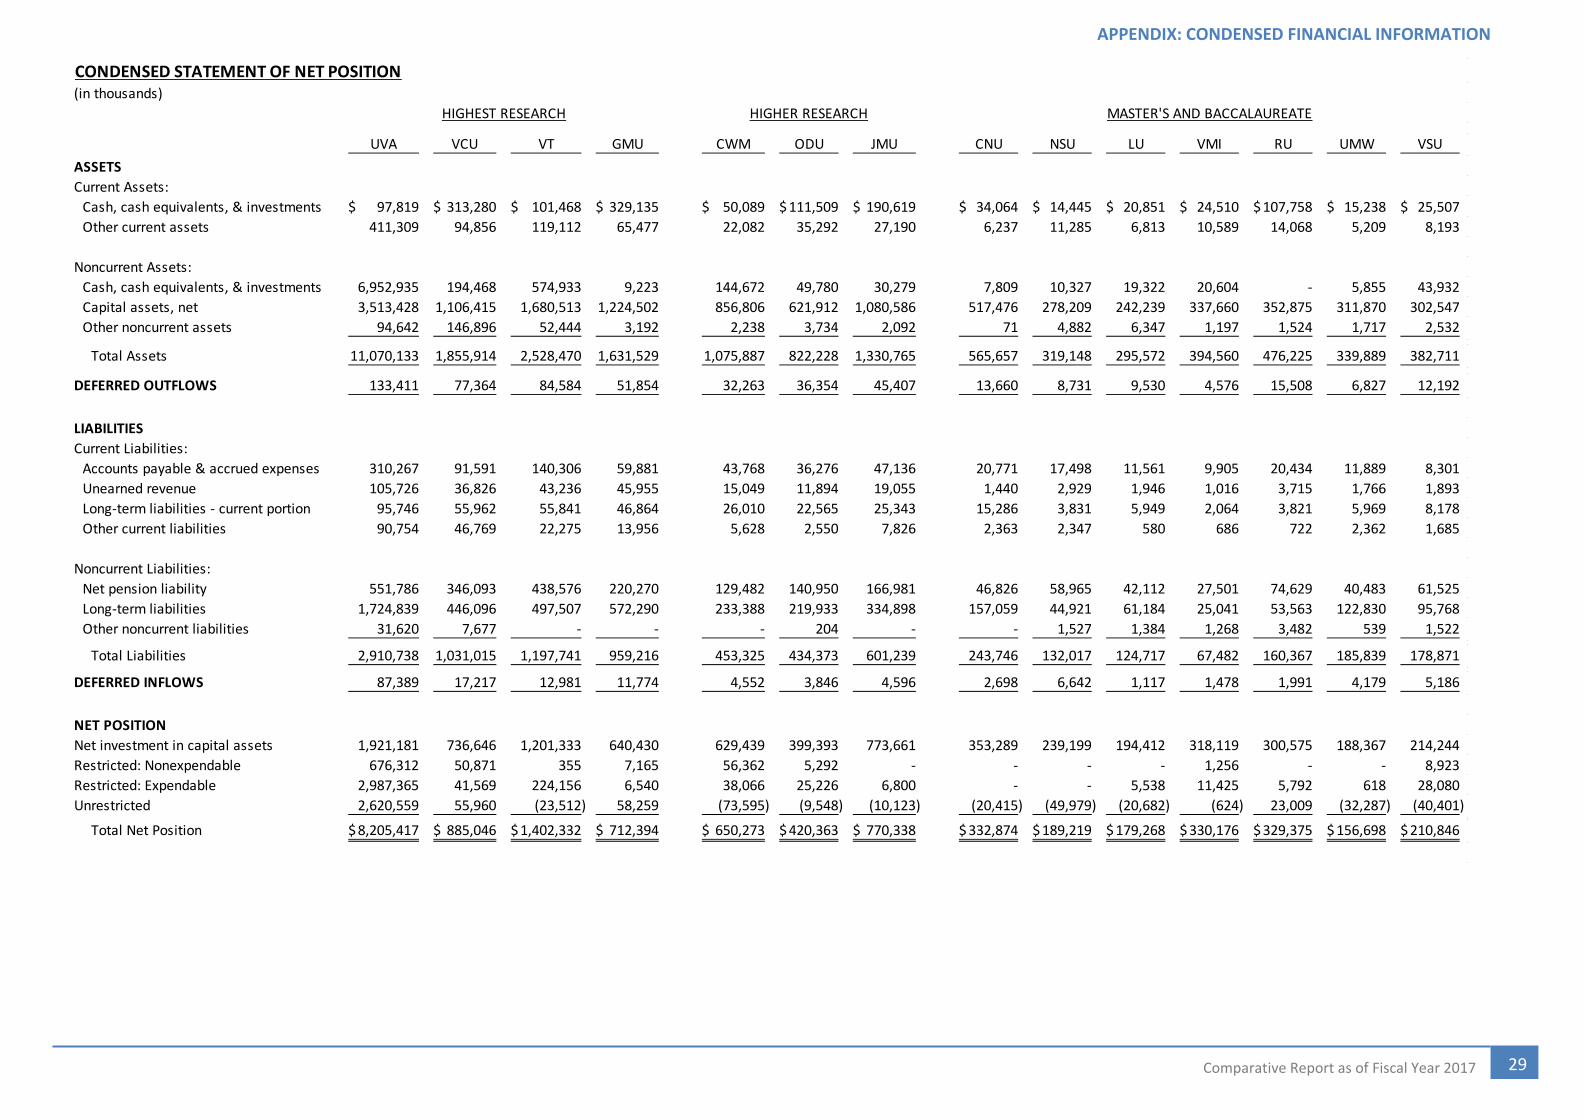
CONDENSED STATEMENT OF NET POSITION(in thousands)
UVA VCU VT GMU CWM ODU JMU CNU NSU LU VMI RU UMW VSU
ASSETS
Current Assets:
Cash, cash equivalents, & investments 97,819$ 313,280$ 101,468$ 329,135$ 50,089$ 111,509$ 190,619$ 34,064$ 14,445$ 20,851$ 24,510$ 107,758$ 15,238$ 25,507$
Other current assets 411,309 94,856 119,112 65,477 22,082 35,292 27,190 6,237 11,285 6,813 10,589 14,068 5,209 8,193
Noncurrent Assets:
Cash, cash equivalents, & investments 6,952,935 194,468 574,933 9,223 144,672 49,780 30,279 7,809 10,327 19,322 20,604 - 5,855 43,932
Capital assets, net 3,513,428 1,106,415 1,680,513 1,224,502 856,806 621,912 1,080,586 517,476 278,209 242,239 337,660 352,875 311,870 302,547
Other noncurrent assets 94,642 146,896 52,444 3,192 2,238 3,734 2,092 71 4,882 6,347 1,197 1,524 1,717 2,532
Total Assets 11,070,133 1,855,914 2,528,470 1,631,529 1,075,887 822,228 1,330,765 565,657 319,148 295,572 394,560 476,225 339,889 382,711
DEFERRED OUTFLOWS 133,411 77,364 84,584 51,854 32,263 36,354 45,407 13,660 8,731 9,530 4,576 15,508 6,827 12,192
LIABILITIES
Current Liabilities:
Accounts payable & accrued expenses 310,267 91,591 140,306 59,881 43,768 36,276 47,136 20,771 17,498 11,561 9,905 20,434 11,889 8,301
Unearned revenue 105,726 36,826 43,236 45,955 15,049 11,894 19,055 1,440 2,929 1,946 1,016 3,715 1,766 1,893
Long-term liabilities - current portion 95,746 55,962 55,841 46,864 26,010 22,565 25,343 15,286 3,831 5,949 2,064 3,821 5,969 8,178
Other current liabilities 90,754 46,769 22,275 13,956 5,628 2,550 7,826 2,363 2,347 580 686 722 2,362 1,685
Noncurrent Liabilities:
Net pension liability 551,786 346,093 438,576 220,270 129,482 140,950 166,981 46,826 58,965 42,112 27,501 74,629 40,483 61,525
Long-term liabilities 1,724,839 446,096 497,507 572,290 233,388 219,933 334,898 157,059 44,921 61,184 25,041 53,563 122,830 95,768
Other noncurrent liabilities 31,620 7,677 - - - 204 - - 1,527 1,384 1,268 3,482 539 1,522
Total Liabilities 2,910,738 1,031,015 1,197,741 959,216 453,325 434,373 601,239 243,746 132,017 124,717 67,482 160,367 185,839 178,871
DEFERRED INFLOWS 87,389 17,217 12,981 11,774 4,552 3,846 4,596 2,698 6,642 1,117 1,478 1,991 4,179 5,186
NET POSITION
Net investment in capital assets 1,921,181 736,646 1,201,333 640,430 629,439 399,393 773,661 353,289 239,199 194,412 318,119 300,575 188,367 214,244
Restricted: Nonexpendable 676,312 50,871 355 7,165 56,362 5,292 - - - - 1,256 - - 8,923
Restricted: Expendable 2,987,365 41,569 224,156 6,540 38,066 25,226 6,800 - - 5,538 11,425 5,792 618 28,080
Unrestricted 2,620,559 55,960 (23,512) 58,259 (73,595) (9,548) (10,123) (20,415) (49,979) (20,682) (624) 23,009 (32,287) (40,401)
Total Net Position 8,205,417$ 885,046$ 1,402,332$ 712,394$ 650,273$ 420,363$ 770,338$ 332,874$ 189,219$ 179,268$ 330,176$ 329,375$ 156,698$ 210,846$
HIGHEST RESEARCH HIGHER RESEARCH MASTER'S AND BACCALAUREATE

APPENDIX: CONDENSED FINANCIAL INFORMATION
30 Comparative Report as of Fiscal Year 2017
CONDENSED STATEMENT OF REVENUES, EXPENSES, AND CHANGES IN NET POSITION(in thousands)
UVA VCU VT GMU CWM ODU JMU CNU NSU LU VMI RU UMW VSU
OPERATING REVENUES:
Student tuition and fees, net of scholarship allowances 545,168$ 336,427$ 461,750$ 341,059$ 183,723$ 144,278$ 207,014$ 38,512$ 26,088$ 30,992$ 24,629$ 61,205$ 29,116$ 25,211$
Hospital and Patient services, net of charity care 1,545,404 24,841 - - - - - - - - - - - -
Federal grants, contracts, and appropriations 256,145 162,313 213,294 77,543 35,883 7,444 12,819 1,412 17,994 1,766 91 4,039 863 16,519
State and local grants and contracts 7,072 6,264 26,241 30,941 3,811 975 8,515 235 357 1,342 1 1,225 34 3,138
Nongovernmental grants and contracts 58,689 26,512 51,238 - 6,541 2,410 4,909 78 1,050 3,655 - 262 853 -
Sales and services of educational departments 43,134 54,182 17,979 - - - 2,052 - - - 346 - - -
Auxiliary enterprises, net of scholarship allowances 137,057 131,685 251,854 194,634 93,752 122,356 182,512 70,253 23,473 45,519 23,095 54,977 39,667 27,760
Unique military activities, net of scholarships allowances - - - - - - - - - - 3,297 - - -
Other operating revenues 60,423 18,342 9,154 19,746 6,086 3,522 1,848 4,115 689 384 1,354 1,877 1,602 1,378
Total operating revenues 2,653,092 760,566 1,031,510 663,923 329,796 280,984 419,668 114,606 69,653 83,658 52,814 123,585 72,135 74,005
OPERATING EXPENSES:
Instruction 431,214 360,175 357,871 284,234 125,405 166,846 162,056 35,500 37,509 34,763 22,780 70,208 29,404 39,811
Research 331,068 186,645 311,297 67,713 54,704 12,286 3,624 1,728 8,592 62 188 491 301 7,688
Public service 57,332 8,575 97,761 19,292 32 566 15,633 - 541 1,704 1,416 3,322 586 8,370
Academic support 171,604 99,490 87,416 62,582 35,845 42,407 46,945 9,133 12,712 6,957 7,854 10,904 9,030 5,847
Student services 49,515 16,334 18,627 29,392 17,976 18,309 18,609 7,334 5,255 4,437 4,114 6,678 8,069 4,653
Institutional support 144,948 81,918 70,276 47,809 47,133 33,495 34,010 9,870 14,029 11,237 6,454 22,429 9,861 14,902
Operation and maintenance of plant 126,559 81,186 84,917 43,695 26,411 32,739 44,345 9,103 10,376 9,077 8,443 12,828 7,609 9,793
Student aid 74,450 35,294 16,488 27,814 32,662 20,163 9,480 1,679 10,589 3,366 891 6,888 726 2,411
Auxiliary enterprises 166,822 96,633 218,712 133,788 84,583 110,507 136,066 56,438 30,942 56,744 26,111 48,999 29,111 31,619
Unique military activities - - - - - - - - - - 10,911 - - -
Depreciation and amortization 127,780 63,742 101,310 62,372 32,254 23,959 41,921 16,969 14,564 9,882 - 19,412 9,612 10,516
Hospital and Patient services 1,448,163 22,893 - - - - - - - - - - - -
Other (23,968) 16 55 - 429 - - - - 18 - - 2,598 -
Total operating expenses 3,105,487 1,052,901 1,364,730 778,692 457,435 461,278 512,688 147,755 145,108 138,247 89,161 202,159 106,908 135,610
Operating income (loss) (452,395) (292,336) (333,220) (114,770) (127,640) (180,293) (93,020) (33,149) (75,456) (54,590) (36,347) (78,575) (34,773) (61,605)
NON-OPERATING REVENUES/(EXPENSES):
State appropriations 168,664 230,834 261,717 161,356 76,480 150,135 91,681 33,191 57,166 32,320 14,741 60,760 30,846 47,001
Gifts 163,356 44,155 61,640 1,705 39,432 12,846 7 1,986 807 - 15,301 - - 658
Investment income, net 728,658 20,824 18,491 2,362 10,030 1,959 1,595 291 72 384 1,777 856 105 3,816
Pell grant revenue 12,485 29,314 17,620 30,167 5,558 32,375 12,490 3,038 14,014 4,322 930 12,243 3,532 13,323
Interest on capital asset related debt (69,062) (17,858) (14,851) (21,375) (5,914) (7,446) (7,963) (4,526) (1,518) (1,497) (676) (1,099) (4,674) (3,458)
Other non-operating revenues/(expenses) (24,374) 4,563 8,108 1,032 (2,529) 244 (1,520) 1,277 (487) 256 (420) 950 980 1,464
Total nonoperating revenue (expenses) 979,727 311,831 352,725 175,247 123,058 190,114 96,289 35,258 70,054 35,785 31,654 73,710 30,789 62,804
Income/(loss) before other revenues, gains, or losses 527,332 19,496 19,505 60,478 (4,582) 9,820 3,269 2,109 (5,401) (18,805) (4,694) (4,864) (3,983) 1,199
Capital Appropriations, Grants, and Contributions 46,294 64,855 44,507 64,462 42,813 16,967 18,650 12,629 39,628 10,188 19,503 16,515 6,304 12,215
Additions to Permanent Endowments 46,963 7 - 1 - - - - - - - - - 667
Other - - - - - (20) - - - 105 33 - - -
Change in net position 620,589 84,358 64,012 124,940 38,231 26,768 21,919 14,738 34,227 (8,511) 14,842 11,651 2,321 14,081
Total net position - beginning 7,584,828 800,688 1,338,320 587,453 612,042 393,596 748,418 318,136 154,992 187,779 315,334 317,724 154,377 196,765
Total net position - ending 8,205,417$ 885,046$ 1,402,332$ 712,394$ 650,273$ 420,363$ 770,338$ 332,874$ 189,219$ 179,268$ 330,176$ 329,375$ 156,698$ 210,846$
HIGHEST RESEARCH HIGHER RESEARCH MASTER'S AND BACCALAUREATE