high-resolution n cars measurements of pressure,home.wlu.edu/~kuehnerj/cv/gttcamtc2002_paper.pdf ·...
TRANSCRIPT

AIAA 2002-2915
HIGH-RESOLUTION N2 CARS MEASUREMENTS OF PRESSURE,TEMPERATURE, AND DENSITY USING A MODELESS DYE LASER
Joel P. Kuehner∗ J. Craig Dutton†
Department of Mechanical and Industrial EngineeringUniversity of Illinois at Urbana-Champaign
1206 West Green Street, Urbana, Illinois 61801
Robert P. Lucht‡
Department of Mechanical EngineeringTexas A&M University
College Station, Texas 77843-3123
Abstract
In this study, high-resolution N2 CARS measure-ments have been made using a modeless dye laseras the Stokes beam source to reduce the presenceof mode noise. Along with this modification to theCARS technique, a new spectra fitting procedure wasdeveloped to avoid a starting-point bias in the least-squares fitting results. Time-averaged and single-shotmeasurements of pressure were made in a static pres-sure vessel over the range of 0.1 to 4.0 atm to testthe pressure sensitivity of the technique. In addi-tion, the precision of single-shot measurements in thepressure vessel is indicative of the baseline pressure-fluctuation detection limit of the system. The preci-sion uncertainty of the measurements was studied toinvestigate the possibility of making property fluc-tuation measurements in high-speed flows. Center-line measurements of pressure and temperature inan underexpanded jet (Mj = 1.85) were also usedto determine the performance of the technique in acompressible flowfield. Improvements in accuracy fortime-averaged and single-shot mean measurementsand increased precision were found for pressure lev-els above 1.0 atm. For the subatmospheric pressurelevels that are important in high-speed flows, the re-sults indicated that the current method is incapableof making fluctuation measurements due to limitedprecision. Nevertheless, the increased precision above1.0 atm indicates that fluctuation measurements maybe possible with further modifications.
Introduction
As the demand for improved performance of high-speed missiles, projectiles, and aircraft increases, sodoes the requirement for extensive knowledge of thethermodynamic and kinematic properties of com-pressible flowfields. For the projectile and missiledesigner, the base drag1 and infrared plume signa-ture2 are important design criteria that are depen-dent on near-wake properties. Similarly, in aircraftdesign, structural fatigue due to acoustic fluctua-tions presents one of many issues to be dealt with.3
In addition, other important practical applications,such as supersonic combustion, gas dynamic lasers,and metal deposition, depend on an in-depth under-standing of compressible flows.4 Due to compressibil-ity effects in these flows, probe-based measurementsare limited in their accuracy by interference effects.Therefore, advances in nonintrusive, laser-based di-agnostics are required to assist in the design and im-plementation of the applications discussed above.
This paper presents the development and applica-tion of an innovative, broadband coherent anti-StokesRaman scattering (CARS) technique that has thecapability to obtain mean and fluctuating pressure,temperature, density, and velocity measurements ina compressible flow. A brief discussion of this CARStechnique is presented here, whereas a more thoroughreview of the theory can be found in the extensive re-views of CARS that exist in the literature.5—8 Theparticular method employed here probes the first vi-brational Raman transition (v = 0 → 1) of diatomicnitrogen found in the flowfield through a third-order,
∗Graduate Research Assistant. Student Member AIAA.†W. Grafton and Lillian B. Wilkins Professor. Associate Fellow AIAA.‡G. Paul Pepper Professor. Associate Fellow AIAA.
Copyright c° by Joel P. Kuehner. Published by the American Institute of Aeronautics and Astronautics,Inc. with permission.

nonlinear wave-mixing process. An energy level di-agram of the interaction is displayed in Figure 1.Two pump beams (νp1 and νp2) and a Stokes beam(νS) are focused and overlapped in the probe volume,where the signal is generated. The source for theStokes beam is broadband, allowing for multiple tran-sitions to be probed simultaneously and for instan-taneous, or single-shot, measurements to be made.Pressure and temperature are determined from thespectral shape of the signal, while density and veloc-ity are calculated from an equation of state and anenergy equation, respectively. For this study, com-mercially available software known as CARSFIT isemployed to least-squares fit the experimental spec-tra to theoretical spectra.9
Because the process relies on molecules alreadypresent in the flow, there is no need for tracermolecules or particles, such as required by fluores-cence techniques. Thus, this laser-based method isnonintrusive and nonperturbing. The coherent na-ture of the signal provides a high signal level andsignal-to-noise ratio (SNR). With the use of thefolded-BOXCARS phase-matching geometry,5 thesignal is spatially separated from the input beams.This phase-matching geometry also allows for user-specified spatial resolution (i.e., size) of the probevolume.
Additional benefits of the CARS process make thetechnique very attractive. With the use of pulsedlasers, the CARS signal is formed on a time scaleof the order of nanoseconds. Therefore, along withthe aforementioned spatial resolution characteristics,the CARS process provides excellent temporal reso-lution as well. Due to the relatively high SNR, theCARS process also provides the ability to probe areasof low molecular number densities.10 These benefitsoutweigh the complex implementation of the CARSmethod itself.
The development of CARS for measurements inhigh-speed flows has been ongoing at the Universityof Illinois for several years. The work started withdual-pump CARS11 measurements of pressure andtemperature.12 This method probed the vibrationaland pure rotational transitions of diatomic nitrogenin a stagnant gas cell and along the centerline of anunderexpanded jet. The technique provided accu-rate time-averaged pressure results above 1 atm, aswell as accurate mean and instantaneous temperatureresults throughout the range of 100 − 300 K. Un-fortunately, the method performed poorly for time-averaged pressure measurements below 1 atm and forinstantaneous pressure measurements below 3 atm.For instantaneous pressure measurements, the stan-dard deviation was reported at approximately 10% of
the mean for 3 atm, dropping to 4% at 18 atm. Thisbaseline noise level prohibits the technique’s use forobtaining meaningful pressure fluctuation measure-ments in many applications.
In light of these results, modifications to the dual-pump CARS technique were made in order to in-crease pressure sensitivity at lower pressure and toinvestigate the ability of the method to obtain accu-rate, instantaneous, single-shot measurements.10 In-stead of probing both pure rotational and vibrationalresonances of diatomic nitrogen, the modified tech-nique focused on vibrational resonances. Whereasin the previous study the CARS signal spanned arange between 40 and 100 cm−1, the modified CARSmeasurements only spanned 10 cm−1. Using a re-lay lens system to magnify the CARS signal spec-trally, this new, high-resolution technique was ableto resolve the CARS signal to within 0.10 cm−1, al-lowing pressure and temperature sensitivity of thediatomic nitrogen Q-branch (v = 0 → 1) to be in-vestigated. As before, the method was tested in astagnant gas cell and throughout the flowfield of anunderexpanded jet. The results from the gas cell re-vealed that only below 2 atm was the method capa-ble of making accurate time-averaged and ensemble-averaged single-shot measurements of mean pressure,therefore displaying the opposite pressure sensitiv-ity as compared to the previous dual-pump method.The high-resolution technique also provided accu-rate mean pressure and temperature measurementsin the underexpanded jet flowfield. Most notably,the method displayed the ability to generate usablesingle-shot signal levels at high spatial resolution evenat low molecular number densities.
One goal of this modified technique was to providethe ability to measure fluctuating thermodynamicproperties in compressible shear flows.13 While thetechnique could provide single-shot measurementswith accurate mean values, the ensemble-averagedfluctuations were not accurate. From the gas-cellexperiment, the baseline noise level over the 0.1 to5.0 atm range examined was approximately 12% ofthe mean value on average. These artificial fluctu-ations (precision uncertainty), which dominated theresults, were attributed to mode-noise contributionsfrom the conventional broadband dye laser (BDL)that was used as the source for the Stokes beam.14
An in-depth discussion of mode noise and its effectson the CARS method can be found in the work ofGreenhalgh and Whittley.15
Therefore, this study examines modifications tothe high-resolution CARS method to extend its ca-pabilities to measure mean and fluctuating thermo-dynamic and kinematic properties. To reduce the
2

effects of mode noise, a modeless broadband dyelaser (MDL), based on the design of Ewart,16 hasbeen implemented as the new source for the Stokesbeam. The capabilities of the method were bench-marked in two, well-defined experiments. First, thepressure-sensitivity and capability to make fluctu-ating pressure measurements were assessed in a gascell. Then, measurements were obtained along thecenterline of an underexpanded jet flowfield. Theresults of these investigations were used to determinethe accuracy and precision of the new CARS method.
Experimental Facilities and Equipment
The facilities and equipment described herein arelocated in the Gas Dynamics Laboratory at the Uni-versity of Illinois at Urbana-Champaign. A top viewof the CARS system can be seen in Figure 2. Onthe right-hand side of the figure is the Q-switched,injection-seeded, Nd:YAG laser (Continuum Power-lite 8010). This laser provides approximately 900 mJof energy per pulse at a wavelength of 532 nm anda repetition rate of 10 Hz. The beam is turned suchthat it passes through a quarter wave plate and aGlan polarizer; these two optics comprise the powerattenuation control for the rest of the CARS sys-tem. Following this, the beam is directed around thetranslation system, which will be discussed later. Abeamsplitter separates 20% of the beam to providethe pump beams in the CARS process (νp1 and νp2in Figure 1). The pump beam is then traversed overa distance in space to delay its arrival at the probevolume such that it is coincident in time with theStokes beam. This is the reason for the winding pathin the upper left-hand corner of the figure. Shortlybefore the beam is directed to the probe volume, it issplit equally to form the two necessary pump beams.
The remaining 80% of the initial Nd:YAG beam isused to pump the MDL. The MDL is derived from theEwart16 design, modified to include an additional am-plification stage. Rhodamine 640 perchlorate17 dis-solved in methanol provides the organic dye solutionused as the gain medium. The MDL emits coherentlight in the range of 607 nm at approximately 25 mJper pulse, and is the source for the Stokes beam inthe CARS process (νS in Figure 1). The Stokes beamis then directed into the probe volume. Note that thelast turn made by each of the three input beams isperformed by fixing a prism to a high-precision mirrormount (Newport 610 Series) to allow for fine tuning ofthe probe volume alignment. The timing of the threeinput beams is checked at this point in the system us-ing a fast photodiode and oscilloscope to ensure that
all beams reach the probe volume within 1 ns of eachother.
The path of the beams through the translationsystem can be seen in Figure 3. The system is basedon an earlier, successful design,18 and has a positionalrepeatability under 5 µm in each direction. In or-der to maintain beam alignment during translation,movement must occur along the path of beam propa-gation. For example, considering the beam propaga-tion into the translation system as shown in Figure 2,the first stage (Parker Hannifin 424012) is required tomove left-to-right. Returning attention to Figure 3,all three beams are turned 90o using one large prismattached to the first stage and directed at the nextstage (Parker Hannifin 412012). The beams are thenprojected upwards to the initial vertical stage (ParkerHannifin 404300) with a prism attached to the secondstage. Once on the initial vertical stage, the beamsare focused at the probe volume using a 250 mm focallength lens. The beams, including the newly formedCARS signal, are collimated using another 250 mmlens attached to an identical vertical stage. Usingtwo independent vertical stages allows for a test sec-tion to be placed between them. Once the systemis aligned, the motion of the two vertical stages iscoupled so that they move simultaneously. Beyondthe measurement volume, the three input beams arediscarded into beam dumps, as they are no longerneeded. The CARS signal follows a path similar tothe input beams as it leaves the translation system;however, in this case specially designed mirrors (CVITLM2-475) are substituted for the prisms.
The CARS signal is then directed to the 1.25 mspectrometer (SPEX 1250M); see Figure 2. A100 mm lens focuses the CARS signal onto theentrance slit. The spectrometer design is basedon a single-pass Czerny-Turner configuration19 us-ing a 3600 groove/mm holographic grating. Thisconfiguration provides a theoretical resolution of∆ω ≈ 0.09 cm−1. At the exit of the spectrome-ter, a relay lens pair disperses the signal onto theCCD (Roper Scientific NTE/2500PB). The CCD isa 2500 x 600 pixel, 16 bit array that provides on av-erage one count for every 3.5 incident photons. Therelay lens pair consists of 28 mm and 210 mm focallength Nikon camera lenses focused at infinity, re-sulting in a magnification factor of 7.5. The imageof the CARS signal is captured and binned on theCCD chip to provide the CARS spectra that will beanalyzed. In these experiments, two types of spectrawere obtained: time-averaged and single-shot. Theterm “time-averaged” is used here to indicate thatthe CCD camera was exposed for ten laser shots (onesecond) before the spectrum was read out. On the
3

other hand, “single-shot” spectra correspond to theCCD camera being exposed to only one laser shot.Therefore, single-shot spectra represent essentially in-stantaneous measurements for the pulsed lasers usedhere.
An optically-accessible gas chamber was modifiedfor use in this study. As seen in Figure 4, air, ar-gon, and propane can occupy the gas cell. Air isused to provide constant pressure levels in bench-marking the CARS technique. Because they containno resonant transitions in the frequency range be-ing probed, argon and propane are utilized to obtainnonresonant signals. Argon is also employed in thepropane line as a nonoxidizing purge gas. The vent isconnected to the building exhaust. To avoid surpass-ing the maximum operating pressure of the chamber(estimated at 250 psi), a 100 psi check valve was in-stalled in the system. In addition to pressurizing thetest gases, the cell can be evacuated using a vacuumpump. This allows subatmospheric pressure levels tobe investigated with the CARS system. Pressure ismonitored independently of the CARS measurementsby using digital pressure transducers: a 1000 torr ab-solute transducer (MKS 722A13TCE2FK) for sub-atmospheric studies, and a 5000 torr absolute trans-ducer (MKS 722A53TCE2FK) for above-atmosphericstudies. Both transducers are accurate to 0.5% of thepressure reading.
The underexpanded jet facility can be seen inFigure 5. It is similar in design to previous inves-tigations.12, 14 Dry, high-pressure air is supplied tothe horizontally mounted inlet pipe at approximately120 psig. A 4 in. control valve (Fisher EK-14/40)mounted far upstream and a 1 in. ball valve atthe start of the inlet pipe are employed to controlthe stagnation pressure. The stagnation pressureand temperature are monitored using the 5000 torrtransducer described above and a hermetically sealedthermistor (Omega ON-920-4007), respectively. Thenozzle exit is 10 mm in diameter, and the nozzlediameter contracts linearly from the inner pipe di-ameter of 19.3 mm to the exit. The area reduction,which occurs over 101.6 mm, results in an angle ofcontraction of 2.61o. The jet can be operated over afully expanded jet Mach number (Mj) range up to∼ 2. In the present work, the jet was operated ata nozzle pressure ratio (NPR = Po/Pamb) of 6.17,which corresponds to Mj = 1.85.
Spectra Fitting Procedure
When analyzing data for the pressure vessel, thefinal answer is known a priori from the transducer
measurements. However, in the flowfield investiga-tions, the pressure and temperature measured are notknown before the spectra are fit. This can present aproblem, as CARSFIT requires an initial value forall variables. If an individual spectrum is of poorquality or the specified initial values of the fit aretoo far from the true conditions, CARSFIT may re-turn the initial values as an indication that a fit couldnot be made. Therefore, a procedure was developedto determine if the returned values were an accurateprediction of pressure and temperature or if the spec-trum should be discarded. This eliminates the chanceof a starting-point bias. The procedure was thentested on the pressure vessel data to determine itseffectiveness.
The process begins by initially discarding anyspectra that saturated a CCD pixel or contained alow integrated signal intensity. The remaining spec-tra are fit starting from three unique points. If two ofthe three fitting results are within a preset percent-age of each other, the spectrum with the lowest chi-squared, goodness-of-fit value is kept, regardless ofthe prediction of temperature or pressure. However,if all three fitting results are separated by more thanthis preset percentage, the spectrum is discarded. Forthe pressure vessel, for which only pressure is allowedto float, each spectrum was started at 70%, 100%,and 130% of the transducer-measured pressure andwas kept if two of the results were within 10% of eachother. In the case of a flowfield where both pressureand temperature are allowed to float, then both pres-sure and temperature must simultaneously pass thiscriterion for the spectrum to be kept.
Using 70% and 130% starting points for compar-ison considerably relaxes the required accuracy inestimating the conditions at the probe volume foruse as initial values in the spectra fitting procedure.However, this advantage in turn brought about theconcern that CARSFIT may not be capable of start-ing this far from the true condition and still be able toreturn an accurate prediction. Hence, a test was per-formed on a small set of time-averaged pressure vesselspectra for which 70% and 130% starting points wereused, as well as 90% and 110% starting points forcomparison. As seen in Figure 6, the mean pressurelevels resulting from both sets of starting values arein excellent agreement. In addition, Figure 7 showsthe relatively good agreement between the standarddeviations of the time-averaged ensembles for eachcase. These results verify the integrity of the newlydeveloped spectra fitting procedure and lend con-siderable confidence to measurements obtained withthis method.
4

Pressure Vessel Results
The current results represent 100 time-averagedand 500 single-shot measurements made in the gascell at 25 pressure levels in the range from 0.1 to4.0 atm. Figure 8 displays time-averaged CARS spec-tra obtained in the gas cell at 0.1, 0.5, 1.0, 2.0, 3.0,and 4.0 atm and 292 K along with the theoretical re-sults from CARSFIT. For reference, each spectrum islabeled with the transducer pressure, PTRAN , and thepredicted CARSFIT pressure, PCARS . As CARSFITcompares the square root of intensity in the least-squares fitting process, all subsequent results will beplotted as such.
All spectra in Figure 8 display excellent agreementbetween data and theory. Not only are the peak in-tensities of each transition generally closely matchedby the theory, but the linewidth and lineshape are aswell. Of importance is the fact that these, and alltheoretical spectra presented herein, were generatedat a resolution of 0.10 cm−1, reinforcing the high-resolution nature of the experimental spectra. Noticethat the linewidths of the transitions broaden and in-terfere as pressure increases, denoting the competingeffects of collisional broadening and collisional nar-rowing. It is these features that give the techniqueits pressure sensitivity. This sensitivity is evident, asall the spectra produced accurate predictions of thetransducer pressure.
The low signal level seen in Figure 8(a) for 0.1 atmis a cause for concern, as the intensity will drop toapproximately one-tenth of this value for single-shotspectra. As the experimental setup closely resemblesa previous setup10 in all ways aside from the MDL,which is used in place of a conventional BDL, theMDL is considered the most probable cause for thislow signal level. While the total average power outof the MDL is 30% lower than previous experimentswith the BDL,10 this does not completely accountfor the drop in signal level. The low signal level ismost likely attributed to the decrease in spatial beamquality and transverse electromagnetic (TEM) modestructure provided by the MDL as compared to theprevious BDL, which employed an oscillator cavity.This decline in beam quality lowers the efficiency atwhich the CARS signal is generated in the nonlin-ear wave-mixing process. It was hoped during thisstudy that this decrease in signal strength would bemore than offset by the reduction of mode noise insingle-shot spectra.
A comparison of the time-averaged CARS-predicted pressure and transducer pressure over theentire range is shown in Figure 9(a), with Figure 9(b)displaying the subatmospheric portion of the results.Included in this figure are the results of a previous
study,13 which is used as a comparison for the cur-rent technique. Here, and in all plots, the uncertaintybars denote the standard deviation of the pressurelevels obtained from the ensemble of spectra at eachpressure level. Above 1.0 atm, the current resultscompare very well with the transducer values with anaccuracy slightly better than for the previous study.The deviation between the CARS and transducer val-ues seen at 3.4 atm is considered to be an isolatedincident associated with a temporary loss in single-mode operation of the Nd:YAG laser that was notimmediately noticed. As is seen in Figure 9(b), theaccuracy of the technique decreases for pressure lev-els below 1.0 atm, with CARS values that are consis-tently below the transducer values. This decrease inaccuracy is the direct result of the decrease in signallevel at these lower molecular number density levels.This discrepancy is unfortunate, as the results forpressure levels above 1.0 atm indicate that the inclu-sion of the MDL in the system improves the accuracyof the technique.
As a preliminary study of the precision of thetechnique, the standard deviations presented as un-certainty bars in the previous figure are plotted inFigure 10 and compared to previous results.13 Be-cause these are standard deviations of time-averagedspectra, they cannot be considered as an indication ofthe precision uncertainty of the method. However, itis promising that the modified method with the MDLproduces similar standard deviation results for pres-sure levels above 1.0 atm. Once again, the data pointat 3.4 atm is considered anomalous and its increasedstandard deviation not indicative of the method’sperformance. The increase in standard deviation be-low 1.0 atm compared to the previous results is notunexpected, as it is believed that the previous mea-surements were affected by the starting-point biasdiscussed earlier. Additionally, the decrease in sig-nal strength degrades current system performance atlow pressure.
Figure 11 presents the number of spectra thatwere kept at each pressure level using the new spec-tra fitting procedure described earlier. The dropoffseen at low and high pressure levels is expected. Atlow pressure, the low signal strength produces spectrathat cannot be fit by CARSFIT. The effects of col-lisional broadening at high pressure reduce the sen-sitivity of the technique, and this change in spectralbehavior also reduces the number of spectra that canbe fit. Aside from those effects and the obvious prob-lem discussed previously at 3.4 atm, nearly all of thetime-averaged spectra obtained were able to be fit
5

from at least two different starting points with best-fit pressure values falling within a prescribed toler-ance. Not only were these spectra able to be fit, butin addition, each data set provided accurate meanvalues, as seen in Figure 9. This result confirms theability of the technique to provide accurate predic-tions when the actual conditions at the probe volumeare not known.
Example spectra from the single-shot measure-ments in the pressure vessel are shown in Figure 12at the same pressure levels as in Figure 8. As ex-pected from the time-averaged spectra at 0.1 atm,low signal levels are evident in Figure 12(a). Evenwith the low signal strength, the single-shot spectragenerally match closely with the theoretical spectrafrom CARSFIT, except at the lowest pressure level of0.1 atm. The mean pressure results from the single-shot spectra are presented in Figure 13. For com-parison, the results of the previous study are againincluded.13 As seen with the mean time-averagedresults, the accuracy of the technique is improvedcompared to the previous experiments for pressurelevels above 1.0 atm. Figure 13(b) focuses on thesubatmospheric pressure levels, where the trend forthe time-averaged measurements is again exhibitedby the single-shot results. In particular, the accu-racy of the mean single-shot measurements is gen-erally poorer than that of the previous experimentswith most of the CARS pressure levels below thetransducer values. As discussed above, the currenttechnique suffers from low signal levels in this region,which is the cause of the errors in predicted pressure.
Figure 14 displays the precision of the techniqueby plotting the standard deviations of the single-shotmeasurements for the corresponding pressure level.In comparison to the previous study,13 the increasedaccuracy of the technique above 1.0 atm is comple-mented by a small but discernible increase in preci-sion as well. The subatmospheric trend seen in thestandard deviation of the time-averaged results is alsoduplicated by the single-shot data. While the previ-ous technique displayed better precision in this re-gion, it is believed that those results may have beeninfluenced by starting-point bias, as reported above.As a final note, the number of spectra kept from theensemble of 500 single-shot spectra at each pressurelevel is presented in Figure 15. As the technique losespressure sensitivity as pressure increases, there is adropoff in the number of spectra kept above 2.0 atm,similar to the trend seen in the time-averaged mea-surements. Still, the large number of spectra keptconfirms the ability of the technique to provide spec-tra that can be fit independently of the initial valuefor the least-squares fitting process.
Regardless of the reason for decreased precisionof the single-shot measurements below 1.0 atm, theseresults would indicate that meaningful fluctuationmeasurements may not be obtainable in a supersonicflowfield with this technique. In typical supersonicflowfields, regions of low pressure are often accom-panied by low to moderate temperature. While thismay correspond to low molecular number densitydepending on the specific pressure and temperature,previous experiments have shown improved perfor-mance of the CARS technique at the low tempera-tures encountered in an underexpanded jet.14 Thisimproved performance is due to the increased sig-nal strength encountered at low temperatures. Thisexperience provides the motivation to attempt theunderexpanded jet measurements described in thefollowing section.
Underexpanded Jet Results
The pertinent flow features of an underexpandedjet are sketched in Figure 16. For a jet to be un-derexpanded, the exit pressure of the nozzle mustbe greater than that of the ambient surroundings.This mismatch causes a Prandtl-Meyer expansionfan to form at the lip of the nozzle. These expan-sion waves propagate across the flow and reflect fromthe constant-pressure jet boundary as compressionwaves, which in turn coalesce to form the intercept-ing shock (or “barrel” shock) that is attached to thenozzle lip. The core flow is accelerated to supersonicspeeds by the expansion fan and travels downstreamto a point where the intercepting shock would crossthe centerline. Here, the flow will be recompressed. Ifthe exit pressure is great enough (NPR ≥ 3), the sim-ple crossing (i.e., regular reflection) of the intercept-ing shock along the centerline will no longer providesufficient pressure rise, and a minimally-curved nor-mal shock, or Mach disk, forms. Instead of crossing(reflecting) at the centerline, the intercepting shocknow attaches to the edge of the Mach disk, where thereflecting shock forms and propagates downstream tothe constant-pressure boundary. The triple point isthe intersection of the intercepting shock, reflectingshock, and Mach disk, and is the starting point forthe slip line or inner shear layer. The inner shearlayer complements the outer shear layer, which re-sides along the constant-pressure boundary. As thereflecting shock reflects from the outer shear layer, anew series of expansion waves form. The expansionwaves are the start of a semi-duplication of the firstseries of flow features at the nozzle exit that result in anew shock cell. The shock train that forms from thisrepeating shock cell pattern continues downstream
6

until the pressure mismatch is dissipated by viscos-ity. As in the subsonic case, the outer and inner shearlayers will grow until they close off the jet core region,and the jet becomes fully turbulent.
In this investigation, 50 time-averaged and 250single-shot spectra were obtained at nine locationsalong the centerline from the jet exit to just beyondthe Mach disk. Figure 17 displays time-averagedspectra at centerline positions corresponding to thejet exit, halfway to the Mach disk, just upstreamof, and just downstream of the Mach disk (z/dj =0.019, 0.870, 1.508, and 1.579) along with the fittedtheoretical spectra. Included in the plots are theCARSFIT (PCARS and TCARS) and CFD20 (PCFDand TCFD) predictions of pressure and temperaturefor comparison. As with the pressure vessel results,the experimental spectra exhibit the same spectralbehavior as the theoretical spectra. Special atten-tion is drawn to the differences between Figures 17(c)and 17(d), where the large differences in thermody-namic conditions upstream and downstream of theMach disk are readily apparent in the spectra. Thesespectra display the sensitivity of the technique tothese differing thermodynamic conditions. Moreover,for all of the spectra, there is a close correlationbetween the CFD and experimental predictions oftemperature and pressure, with pressure predictionsmarginally outperforming temperature predictions.The increased discrepancy in temperature and pres-sure predictions seen in Figures 17(c) and 17(d) canbe accounted for by considering the unsteady positionof the Mach disk, which will add to experimental er-ror in these locations, along with the inability of theCFD to accurately capture the shock location.
The mean results from the time-averaged spec-tra at all centerline locations examined are comparedto previous measurements13 and the CFD results20
in Figure 18. Clearly, there is a substantial improve-ment in agreement between the CARS measurementsand CFD results for pressure levels above 1.0 atm.This result is expected from the pressure vessel mea-surements. There is a small but consistent discrep-ancy between the CFD and experimental mean tem-perature results upstream of the Mach disk, with theCARS results always being lower. There are two pos-sible reasons for this offset. First, the stagnationtemperature in the current experiment (290 K) wasslightly lower than for the previous study (296 K).Second, the previous nozzle used a contraction angleof 4.1o, almost twice the current angle, thus provid-ing slightly different flow conditions at the jet exit.Overall, though, the current time-averaged measure-ments match well with the CFD predictions from thejet exit through the Mach disk.
The standard deviation of the time-averaged mea-surements is shown in Figure 19, along with thosefrom the comparison study.13 There is a noticeableincrease in standard deviation in both pressure andtemperature as compared to the previous work. Themost plausible explanation for this increase is dueto the low signal strength of the current technique.Adding another variable to the least-squares fittingprocess further exposes the low signal strength prob-lem of this method. This is again demonstrated inFigure 20, where the number of spectra kept dropsseverely in the region of low molecular number den-sity just upstream of the Mach disk. Note that thenumber of spectra fit is included in this plot, as someof the spectra were discarded before fitting becauseof saturated pixels or low signal conditions.
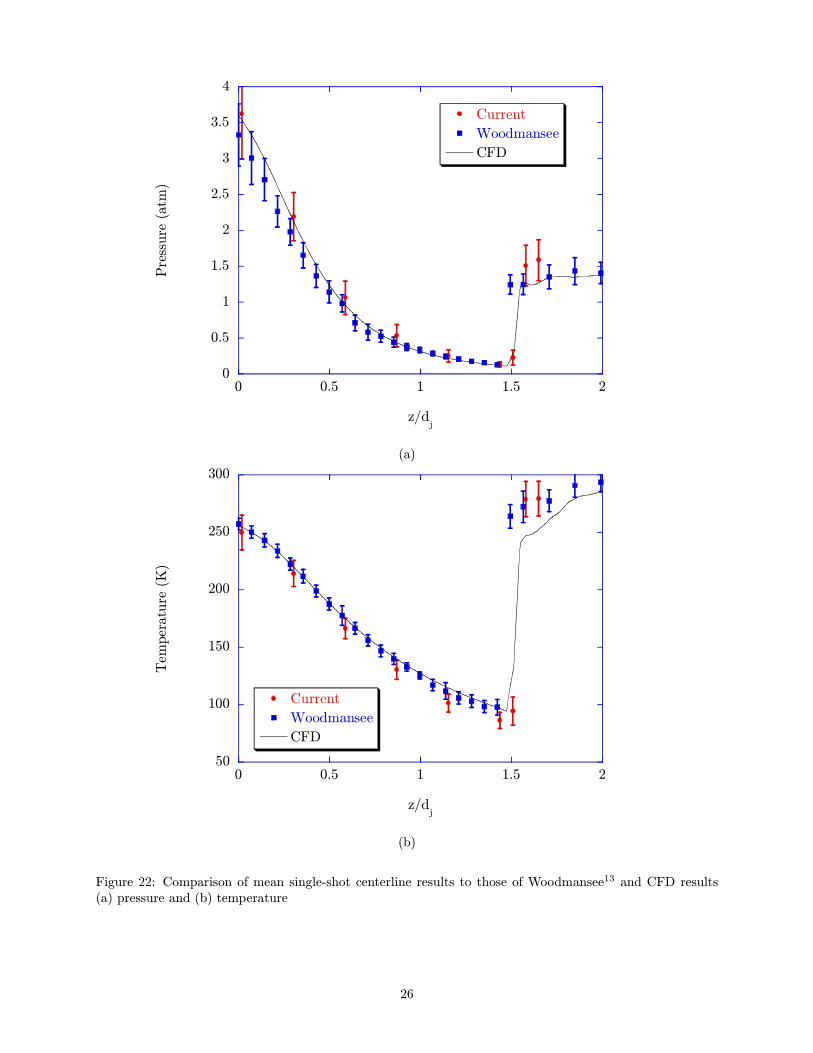
Turning to the single-shot centerline results, Fig-ure 21 shows sample spectra at the same locationsas in Figure 17 for the time-averaged measurements.Aside from a slight increase in noise level, all thespectra exhibit the same excellent agreement betweendata and theory that was seen in the time-averagedspectra. In addition, the predicted pressure and tem-perature levels agree relatively well with the CFDvalues, with the discrepancy in temperature and pres-sure predictions in Figures 21(c) and 21(d) likely oc-curing for the same reasons as discussed with respectto the time-averaged spectra in Figure 17. Ensemble-averaged pressure and temperature values from thesingle-shot data set at all centerline locations exam-ined are presented in Figure 22, which includes theprevious results13 and CFD predictions20 for com-parison. The current technique again displays betteraccuracy at high pressure and good agreement withthe CFD results through the first Mach disk. Fortemperature, a similar offset of the CARS measure-ments below the CFD predictions as was seen in thetime-averaged results exists.
The standard deviation of the current and pre-vious13 single-shot measurements, which is represen-tative of the precision of the method, is plotted inFigure 23. Because there is low turbulence intensityalong the centerline of the jet before the Mack disk,the standard deviation results here should representthe baseline detection limit of fluctuations nearly ex-actly. As expected from the time-averaged results,the technique displays an increase in standard devi-ation as compared to the previous technique, mostlikely due to the decreased signal strength of the cur-rent method. This increase indicates that fluctuationmeasurements will most likely not be possible in theshear layer of the underexpanded jet using this tech-nique, as the baseline detection limit is above thefluctuation level expected therein.
7

Conclusions
Reviewing the pressure vessel results, an im-provement in accuracy of time-averaged and single-shot mean measurements was shown as comparedto previous work for pressure levels above 1.0 atm.This result demonstrates the benefit of employingthe MDL. Decreased performance for subatmosphericpressure levels was attributed mainly to the low sig-nal strength at these conditions. Standard deviationsof the time-averaged results were similar to previ-ous results above 1.0 atm, and marginally higher be-low this level. A decrease in standard deviations forthe single-shot spectra was shown above atmosphericpressure, representing increased precision resultingfrom the use of the MDL. Below 1.0 atm, the single-shot standard deviations increased as compared toprevious results. Both time-averaged and single-shotCARS spectra displayed excellent spectral behavior,allowing for good agreement between theoretical andexperimental spectra.
Mean time-averaged and single-shot results fromthe centerline traverse of an underexpanded jet dis-played excellent agreement with CFD results, espe-cially for pressure levels above 1.0 atm. Slight offsetsin mean temperature were observed and explained.Experimental spectra from the centerline traverseprovided good predictions of pressure, with a minordecrease in agreement in temperature as comparedto previous results. Increases in standard deviationsfor both temperature and pressure occurred in thetime-averaged and single-shot measurements, whichis most likely indicative of low signal strength.
The possibility of fluctuation measurements usinghigh-resolution N2 CARS was displayed. The slightincrease in precision for pressure vessel measurementsabove 1.0 atm confirms that the baseline fluctuationdetection limit of the technique can be lowered. Un-fortunately, this increased precision falls outside ofthe thermodynamic property range that a majority ofcompressible flows operate in. The decrease in signalstrength at lower pressure levels (more representativeof compressible flows) degraded system measurementprecision from that seen in the previous experiment.13
In order to improve the performance of the currenttechnique, a new source for the Stokes beam shouldbe explored. A promising source would be a mode-less dye laser based upon the design of Hahn et al.21
This laser employs Bethune dye cells22 as opposedto the transversely pumped dye cells in the currentMDL, with a single, concentrated pass through the“oscillator” dye cell rather than four, distributedpasses. As seen in a previous experiment,23 this
dye laser provides low standard deviations in tem-perature measurements in a steady laminar flame.Another possible solution would be to incorporatetwo single-mode, solid-state, tunable sources into thesystem: one to replace the Stokes source and one toreplace a pump beam, in a dual-pump CARS tech-nique.11 With the correct choice of wavelengths forthese two sources, two transitions of the nitrogen Q-branch could be probed simultaneously. This secondoption is less attractive, as it involves a potentialdecrease in pressure sensitivity by not probing theentire linewidth of both transitions, and it is alsomore expensive to implement. Nevertheless, using allsingle-mode sources for the pump and Stokes beamswould provide excellent beam quality and TEM modestructure and would eliminate the possibility of modenoise.
Acknowledgments
This work is supported by the U.S. Army Re-search Office, under Grant No. DAAD19-01-1-0367,with Dr. Thomas L. Doligalski as technical monitor.In addition, the assistance of Dr. Mark A. Wood-mansee during the work completed herein is greatlyappreciated.
References
[1] J. Sahu. Numerical computations of supersonicbase flow with special emphasis on turbulencemodeling. AIAA Journal, Vol. 32(No. 7): pp.1547—1549, 1994.
[2] S. M. Dash, B. E. Pearce, H. S. Pergament, andE. S. Fishburne. Prediction of rocket plume flow-fields for infrared signature studies. Journal ofSpacecraft and Rockets, Vol. 17(No. 3): pp. 190—199, 1980.
[3] A. Krothapalli, E. Rajkuperan, F. Alvi, andL. Lourenco. Flow field and noise characteris-tics of a supersonic impinging jet. Journal ofFluid Mechanics, Vol. 392: pp. 155—181, 1999.
[4] E. J. Gutmark, K. C. Schadow, and K. H. Yu.Mixing enhancement in supersonic free shearflows. Annual Review of Fluid Mechanics, Vol.27: pp. 375—417, 1995.
[5] A. C. Eckbreth. Laser Diagnostics for Com-bustion Temperature and Species. Gordon andBreach Publishers, Amsterdam, 1996.
[6] W. M. Tolles, J. W. Nibler, J. R. McDonald,and A. B. Harvey. A review of the theory and
8

application of coherent anti-Stokes Raman spec-troscopy (CARS). Applied Spectroscopy, Vol.31(No. 4): pp. 253—271, 1977.
[7] L. P. Goss. CARS Instrumentation for Combus-tion Applications in Instrumentation for Flowswith Combustion. A. M. K. P. Taylor, ed. Aca-demic Press Ltd., London, 1993.
[8] S. A. J. Druet and J-P. E. Taran. CARS spec-troscopy. Progress in Quantum Electronics, Vol.7: pp. 1—72, 1981.
[9] R. E. Palmer. The CARSFT computer code forcalculating coherent anti-Stokes Raman spectra:User and programmer information. Sandia Re-port SAND89-8206, 1989.
[10] M. A. Woodmansee, R. P. Lucht, and J. C. Dut-ton. Development of high-resolution N2 coher-ent anti-Stokes Raman scattering for measuringpressure, temperature, and density in high-speedgas flows. Applied Optics, Vol. 39(No. 33): pp.6243—6256, 2000.
[11] R. P. Lucht, R. E. Palmer, and M. A. Maris.Simultaneous acquisition of pure rotational andvibrational nitrogen spectra using three-laser co-herent anti-Stokes Raman spectroscopy. OpticsLetters, Vol. 12(No. 6): pp. 386—388, 1987.
[12] R. E. Foglesong, S. M. Green, R. P. Lucht,and J. C. Dutton. Dual-pump coherent anti-Stokes Raman scattering for simultaneous pres-sure/temperature measurement. AIAA Journal,Vol. 36(No. 2): pp. 234—240, 1998.
[13] M. A. Woodmansee. Experimental Measure-ments of Pressure, Temperature, and DensityUsing High-Resolution N2 Coherent Anti-StokesRaman Scattering. PhD thesis, University of Illi-nois, 1999.
[14] M. A. Woodmansee, J. C. Dutton, and R. P.Lucht. Experimental measurements of pressure,
temperature, and density in an underexpandedsonic jet flowfield. AIAA 99-3600, 1999.
[15] D. A. Greenhalgh and S. T. Whittley. Modenoise in broadband CARS spectroscopy. AppliedOptics, Vol. 24(No. 6): pp. 907—913, 1985.
[16] P. Ewart. A modeless, variable bandwidth, tun-able laser. Optics Communications, Vol. 55(No.2): pp. 124—126, 1985.
[17] Exciton. Laser Dyes Catalog, 1997.
[18] R. E. Foglesong, J. P. Kuehner, T. R. Fra-zier, L. M. Flamand, J. E. Peters, and R. P.Lucht. Coherent anti-Stokes Raman scatteringmeasurements in a lean premixed gas turbinecombustor. Proceedings of the 8th InternationalSymposium on Transport Phenomena and Dy-namics of Rotating Machinery, ISROMAC - 8,Vol. II: pp. 849—856, 2000.
[19] M. Czerny and A. F. Turner. Uber den astigma-tismus bei spiegelspektrometern. Zeitschrift furPhysik, Vol. 61: pp. 792—797, 1930.
[20] C. D. Mikkelsen. Personal communication. 2001.
[21] J. W. Hahn, C. W. Park, and S. N. Park. Broad-band coherent anti-Stokes Raman spectroscopywith a modeless dye laser. Applied Optics, Vol.36(No. 27): pp. 6722—6728, 1997.
[22] D. S. Bethune. Dye cell design for high-powerlow-divergence excimer-pumped dye lasers. Ap-plied Optics, Vol. 20(No. 11): pp. 1897—1899,1981.
[23] R. P. Lucht, V. N. Velur, G. J. Fiechtner, D. C.Campbell, K. D. Grinstead Jr., J. R. Gord, P. M.Danehy, and R. L. Farrow. Measurements oftemperature and CO2 concentration by dual-pump coherent anti-Stokes Raman scattering.AIAA 2001-0417, 2001.
9

Figures
Figure 1: CARS energy-level diagram
Figure 2: Top view of CARS system
10

Figure 3: Translation system for CARS probe volume
Figure 4: Gas-cell facility
11

Figure 5: Underexpanded jet facility
0
0.5
1
1.5
0 0.4 0.8 1.2 1.6
90% and 110% Starting Points
70% and 130% Starting Points
Ideal
CA
RS P
ress
ure
(at
m)
Transducer Pressure (atm)
Figure 6: Comparison of the mean spectra fitting procedure results using different starting points
12

0.01
0.02
0.03
0.04
0.05
0.06
0.07
0 0.4 0.8 1.2 1.6
90% and 110% Starting Points
70% and 130% Starting Points
Sta
ndar
d D
evia
tion
(at
m)
Transducer Pressure (atm)
Figure 7: Comparison of the standard deviation of the spectra fitting procedure results using differentstarting points
13

0
50
100
150
200
250
300
2322 2324 2326 2328 2330 2332
DataTheory
Inte
nsi
ty1/
2 (
arb
. units)
Raman Shift (cm-1)
PTRAN
= 0.10 atm
PCARS
= 0.10 atm
0
100
200
300
400
500
600
2322 2324 2326 2328 2330 2332
DataTheory
Inte
nsi
ty1/
2 (
arb
. units)
Raman Shift (cm-1)
PTRAN
= 0.50 atm
PCARS
= 0.49 atm
(a) (b)
0
100
200
300
400
500
600
700
800
2322 2324 2326 2328 2330 2332
DataTheory
Inte
nsi
ty1/
2 (
arb
. units)
Raman Shift (cm-1)
PTRAN
= 1.00 atm
PCARS
= 0.99 atm
0
200
400
600
800
1000
1200
1400
2322 2324 2326 2328 2330 2332
DataTheory
Inte
nsi
ty1/
2 (
arb
. units)
Raman Shift (cm-1)
PTRAN
= 2.00 atm
PCARS
= 1.99 atm
(c) (d)
0
500
1000
1500
2000
2322 2324 2326 2328 2330 2332
DataTheory
Inte
nsi
ty1/
2 (
arb
. units)
Raman Shift (cm-1)
PTRAN
= 3.00 atm
PCARS
= 3.01 atm
0
500
1000
1500
2000
2500
2322 2324 2326 2328 2330 2332
DataTheory
Inte
nsi
ty1/
2 (
arb
. units)
Raman Shift (cm-1)
PTRAN
= 4.00 atm
PCARS
= 4.02 atm
(e) (f)
Figure 8: Comparison of time-averaged experimental CARS and theoretical CARSFIT spectra from thepressure vessel for (a) 0.1 atm, (b) 0.5 atm, (c) 1.0 atm, (d) 2.0 atm, (e) 3.0 atm, and (f) 4.0 atm
14

0
0.525
1.05
1.575
2.1
2.625
3.15
3.675
4.2
0 0.5 1 1.5 2 2.5 3 3.5 4
CurrentWoodmanseeIdeal
CA
RS P
ress
ure
(at
m)
Transducer Pressure (atm)
(a)
0
0.15
0.3
0.45
0.6
0.75
0.9
1.05
1.2
0 0.2 0.4 0.6 0.8 1 1.2
CurrentWoodmanseeIdeal
CA
RS P
ress
ure
(at
m)
Transducer Pressure (atm)
(b)
Figure 9: Comparison of time-averaged pressure vessel results to those of Woodmansee13 (a) full range and(b) low-pressure subset
15

0
0.05
0.1
0.15
0.2
0.25
0.3
0.35
0 0.5 1 1.5 2 2.5 3 3.5 4
Current
WoodmanseeSta
ndar
d D
evia
tion
(at
m)
Transducer Pressure (atm)
Figure 10: Comparison of time-averaged standard deviation results from the pressure vessel to those ofWoodmansee13
0
20
40
60
80
100
120
0 0.5 1 1.5 2 2.5 3 3.5 4
Num
ber
Kep
t
Transducer Pressure (atm)
Figure 11: Number of time-averaged pressure vessel spectra kept out of 100 in each data set
16

0
100
200
300
400
500
600
700
800
2322 2324 2326 2328 2330 2332
DataTheory
Inte
nsi
ty1/
2 (
arb
. units)
Raman Shift (cm-1)
PTRAN
= 0.10 atm
PCARS
= 0.14 atm
0
100
200
300
400
500
600
2322 2324 2326 2328 2330 2332
DataTheory
Inte
nsi
ty1/
2 (
arb
. units)
Raman Shift (cm-1)
PTRAN
= 0.50 atm
PCARS
= 0.49 atm
(a) (b)
0
100
200
300
400
500
600
700
800
2322 2324 2326 2328 2330 2332
DataTheory
Inte
nsi
ty1/
2 (
arb
. units)
Raman Shift (cm-1)
PTRAN
= 1.00 atm
PCARS
= 0.98 atm
0
200
400
600
800
1000
1200
1400
2322 2324 2326 2328 2330 2332
DataTheory
Inte
nsi
ty1/
2 (
arb
. units)
Raman Shift (cm-1)
PTRAN
= 2.00 atm
PCARS
= 1.98 atm
(c) (d)
0
500
1000
1500
2000
2322 2324 2326 2328 2330 2332
DataTheory
Inte
nsi
ty1/
2 (
arb
. units)
Raman Shift (cm-1)
PTRAN
= 3.00 atm
PCARS
= 3.03 atm
0
500
1000
1500
2000
2500
2322 2324 2326 2328 2330 2332
DataTheory
Inte
nsi
ty1/
2 (
arb
. units)
Raman Shift (cm-1)
PTRAN
= 4.00 atm
PCARS
= 4.02 atm
(e) (f)
Figure 12: Comparison of single-shot experimental CARS and theoretical CARSFIT spectra from the pres-sure vessel for (a) 0.1 atm, (b) 0.5 atm, (c) 1.0 atm, (d) 2.0 atm, (e) 3.0 atm, and (f) 4.0 atm
17

0
0.5
1
1.5
2
2.5
3
3.5
4
0 0.5 1 1.5 2 2.5 3 3.5 4
CurrentWoodmanseeIdeal
CA
RS P
ress
ure
(at
m)
Transducer Pressure (atm)
(a)
0
0.2
0.4
0.6
0.8
1
1.2
0 0.2 0.4 0.6 0.8 1 1.2
CurrentWoodmanseeIdeal
CA
RS P
ress
ure
(at
m)
Transducer Pressure (atm)
(b)
Figure 13: Comparison of mean single-shot pressure vessel results to those of Woodmansee13 (a) full rangeand (b) low-pressure subset
18

0
0.1
0.2
0.3
0.4
0.5
0.6
0.7
0 0.5 1 1.5 2 2.5 3 3.5 4
CurrentWoodmansee
Sta
ndar
d D
evia
tion
(at
m)
Transducer Pressure (atm)
Figure 14: Comparison of single-shot standard deviation results from the pressure vessel to those of Wood-mansee13
0
100
200
300
400
500
0 0.5 1 1.5 2 2.5 3 3.5 4
Num
ber
Kep
t
Transducer Pressure (atm)
Figure 15: Number of single-shot pressure vessel spectra kept out of 500 in each data set
19

Figure 16: Underexpanded jet flowfield
20

0
500
1000
1500
2000
2500
3000
2322 2324 2326 2328 2330 2332
DataTheory
Inte
nsi
ty1/
2 (
arb
. units)
Raman Shift (cm-1)
PCFD
= 3.53 atm
PCARS
= 3.53 atm
TCFD
= 254.40 K
TCARS
= 246.04 K
0
200
400
600
800
1000
1200
1400
2322 2324 2326 2328 2330 2332
DataTheory
Inte
nsi
ty1/
2 (
arb
. units)
Raman Shift (cm-1)
PCFD
= 0.43 atm
PCARS
= 0.43 atm
TCFD
= 139.70 K
TCARS
= 133.54 K
(a) (b)
0
500
1000
1500
2322 2324 2326 2328 2330 2332
DataTheory
Inte
nsi
ty1/
2 (
arb
. units)
Raman Shift (cm-1)
PCFD
= 0.25 atm
PCARS
= 0.28 atm
TCFD
= 128.30 K
TCARS
= 101.33 K
0
200
400
600
800
1000
2322 2324 2326 2328 2330 2332
DataTheory
Inte
nsi
ty1/
2 (
arb
. units)
Raman Shift (cm-1)
PCFD
= 1.27 atm
PCARS
= 1.29 atm
TCFD
= 247.00 K
TCARS
= 272.33 K
(c) (d)
Figure 17: Comparison of time-averaged experimental CARS and theoretical CARSFIT spectra along thecenterline of the underexpanded jet at z/dj = (a) 0.019, (b) 0.870, (c) 1.508, and (d) 1.579
21

0
0.5
1
1.5
2
2.5
3
3.5
4
0 0.5 1 1.5 2
Current
Woodmansee
CFDP
ress
ure
(atm
)
z/dj
(a)
50
100
150
200
250
300
0 0.5 1 1.5 2
Current
Woodmansee
CFD
Tem
per
atu
re (
K)
z/dj
(b)
Figure 18: Comparison of time-averaged centerline results to those of Woodmansee13 and CFD results(a) pressure and (b) temperature
22

0
0.05
0.1
0.15
0.2
0.25
0.3
0 0.5 1 1.5 2
Current
Woodmansee
Sta
ndard
Dev
iati
on (
atm
)
z/dj
(a)
0
2
4
6
8
10
0 0.5 1 1.5 2
Current
Woodmansee
Sta
ndar
d D
evia
tion
(K
)
z/dj
(b)
Figure 19: Comparison of time-averaged standard deviation centerline results to those of Woodmansee13
(a) pressure and (b) temperature
23

0
10
20
30
40
50
60
0 0.5 1 1.5 2
Number Kept
Number Fit
Num
ber
of Spec
tra
z/dj
Figure 20: Number of time-averaged centerline spectra fit and kept
24

0
500
1000
1500
2000
2500
3000
2322 2324 2326 2328 2330 2332
DataTheory
Inte
nsi
ty1/
2 (
arb
. units)
Raman Shift (cm-1)
PCFD
= 3.53 atm
PCARS
= 3.53 atm
TCFD
= 254.40 K
TCARS
= 260.17 K
0
500
1000
1500
2322 2324 2326 2328 2330 2332
DataTheory
Inte
nsi
ty1/
2 (a
rb. units)
Raman Shift (cm-1)
PCFD
= 0.43 atm
PCARS
= 0.44 atm
TCFD
= 139.70 K
TCARS
= 133.96 K
(a) (b)
0
200
400
600
800
1000
1200
1400
2322 2324 2326 2328 2330 2332
DataTheory
Inte
nsi
ty1/
2 (
arb
. units)
Raman Shift (cm-1)
PCFD
= 0.25 atm
PCARS
= 0.24 atm
TCFD
= 128.30 K
TCARS
= 98.75 K
0
200
400
600
800
1000
2322 2324 2326 2328 2330 2332
DataTheory
Inte
nsi
ty1/
2 (
arb
. units)
Raman Shift (cm-1)
PCFD
= 1.27 atm
PCARS
= 1.28 atm
TCFD
= 247.00 K
TCARS
= 281.25 K
(c) (d)
Figure 21: Comparison of single-shot experimental CARS and theoretical CARSFIT spectra along thecenterline of the underexpanded jet at z/dj = (a) 0.019, (b) 0.870, (c) 1.508, and (d) 1.579
25
0
0.5
1
1.5
2
2.5
3
3.5
4
0 0.5 1 1.5 2
Current
Woodmansee
CFDP
ress
ure
(atm
)
z/dj
(a)
50
100
150
200
250
300
0 0.5 1 1.5 2
Current
Woodmansee
CFD
Tem
per
atu
re (
K)
z/dj
(b)
Figure 22: Comparison of mean single-shot centerline results to those of Woodmansee13 and CFD results(a) pressure and (b) temperature
26

0
0.1
0.2
0.3
0.4
0.5
0.6
0.7
0 0.5 1 1.5 2
Current
WoodmanseeSta
ndard
Dev
iati
on (
atm
)
z/dj
(a)
0
2
4
6
8
10
12
14
16
0 0.5 1 1.5 2
Current
Woodmansee
Sta
ndar
d D
evia
tion
(K
)
z/dj
(b)
Figure 23: Comparison of single-shot standard deviation centerline results to those of Woodmansee13 (a) pres-sure and (b) temperature
27