high performance commercial building systems
TRANSCRIPT
California Energy Commission Public Interest Energy Research Program
LBNL No. 49977 (HPCBS No. E5P2.2T1b4)
Web-based Energy Information Systems for Large Commercial Buildings Element 5 - Integrated Commissioning & Diagnostics Project - Monitoring and Commissioning for Existing Buildings Task 2.2.1 - Develop Fault Detection and Diagnosis Procedures for Operators, Engineers, and Energy Services Personnel
Naoya Motegi and Mary Ann Piette Ernest Orlando Lawrence Berkeley National Laboratory May 2002
High Performance Commercial Building Systems
Web-based Energy Information Systems for Large Commercial Buildings
Naoya Motegi and Mary Ann Piette Lawrence Berkeley National Laboratory
Synopsis
Energy Information Systems (EIS), which monitor and organize building energy consumption and related trend data over the Internet, have been evolving over the past decade. This technology helps perform key energy management functions such as organizing energy use data, identifying energy consumption anomalies, managing energy costs, and automating demand response strategies. During recent years numerous developers and vendors of EIS have been deploying these products in a highly competitive market. EIS offer various software applications and services for a variety of purposes. Costs for such system vary greatly depending on the system’s capabilities and how they are marketed. Some products are marketed directly to end users while others are made available as part of electric utility programs. EIS can be a useful tool in building commissioning and retro-commissioning.
This paper reviews more than a dozen EIS. We have developed an analytical framework to characterize the main features of these products, which are developed for a variety of utility programs and end-use markets. The purpose of this research is to evaluate EIS capabilities and limitations, plus examine longer-term opportunities for utilizing such technology to improve building energy efficiency and load management.
About the Authors
Naoya Motegi is a Graduate Student Research Assistant in the Commercial Building Systems Group in the Building Technologies Department at LBNL. He is currently a graduate student of the Department of Architecture, University of California Berkeley. He has a Bachelor of Architecture and Master of Engineering in Architecture and Civil Engineering from Waseda University in Tokyo, Japan.
Mary Ann Piette is a Staff Scientist and the Deputy Group Leader of the Commercial Building Systems Group in the Building Technologies Department at LBNL. She has a B.A. in Physical Science and an M.S. in Mechanical Engineering, from U.C. Berkeley, and a Licentiate from the Department of Building Service Engineering, Chalmers University in Gothenburg, Sweden.

Background
Energy Information Systems (EIS) refer to software, data acquisition hardware, and communication protocols administered by a single company, a partnership, or a collective to provide energy information to commercial building energy managers and electric utilities. An EIS may include numerous classes of information such as energy use, building characteristics, HVAC or other building system data, weather data, energy price signals, or energy demand-response event information. This paper summarizes key features available in today’s EIS, along with a categorization framework to understand the relationship between EIS, EMCS, and similar technology.
In a typical EIS architecture, the EIS server hardware and software located at the EIS service provider’s physical site record interval data via the Internet, as shown in Figure 1. The EIS receives these data from signals dispatched by meters installed in a customer’s building, or directly communicates with meters. The EIS users can access the server with a password, and access the archived energy data either in real-time or in hourly, or daily updates from anywhere via a web browser. The typical functions of EIS are described in the following three features.
Visualizing tabular and graphical metered usage data. • • •
Comparing load profiles within and across multiple facilities. Varying degrees of billing and rate information.
Internet
EMCS
Revenue meter
Sub meter
Building site
EIS Host Server
Web browser
Communication device
Figure 1. Typical Architecture of EIS
This paper focuses on EIS for commercial buildings and does not discuss related technology for residential customers. It begins with a review of the history of EIS, followed by an overview of the market. The next section provides a detailed description of key features, which includes a series of tables comparing different EIS.
History of EIS
Until the mid-1980’s, commercial EMCS provided the only interface option for remote monitoring. Several vendors began to market specialized load monitors that displayed instantaneous demand (kW). These devices were functionally limited and expensive
(Levy, 2001). Cannon Technologies commercialized Readmeter in 1987 as a closed-network energy monitoring and tracking system.
Beginning in the early 1990s, Internet access to facility data began to supplement conventional EMCS offerings. The Internet provided flexibility in accessing facility data, particularly for those companies with multiple facilities dispersed over wide geographic areas. Another strong trend for energy providers was to combine energy information and cost analysis with their billing services. This permits their customers to have access to usage and billing details. In this area, Enerlink (originally a subsidiary of Southern Company), Avista (a subsidiary of Washington Water and Power) and Illinova Energy Partners were three of the industry leaders (Levy, 2001).
Enerlink had its official beginnings in 1988 for one of their major customers’ electric bill analysis. Early in the product evolution, it became evident that customers were interested in extending the services to energy cost analysis including historical bill retrieval and bill calculation. Commercially introduced in 1992, Enerlink could assist a customer with real-time cost monitoring, rate comparison, and analysis of complex “what if” scenarios. Enerlink provided constant online tracking directly from the customer’s meter to graphically show energy use at any specific moment, and to link usage to cost. Load profiles could be analyzed weekly, daily, and hourly (Hyde, 1995). Systems evolved incrementally from single facility to enterprise-wide applications that gave corporate management the ability to examine daily facility usage and performance nationwide. The Internet has since become the de-facto medium for providing access to facility data (Levy, 2001).
The web-based products introduced in the last three years include real-time access to meter data. Beginning in Spring 1999, a number of reports about flexible and experimental customer Demand Reduction Programs (DR Programs) run by utilities began to appear. These programs ranged from direct control of small facilities to voluntary load shedding by large commercial customers. For example, in November 1999, Silicon Energy released Curtailment Manager, providing load-curtailment services to large commercial and industrial customers.
Market Characterization
EIS features and capabilities have been designed to serve a variety of markets and different types of customers. We reviewed some key features of these markets and customer groups. Most of the EIS featured in this paper are targeted to commercial and industrial clients, which have large energy saving potential.
Multi-Facility Client Market
Multi-Facility Clients are defined to be enterprises or organizations that manage multiple buildings. These enterprises include large corporations, retail chains, restaurants, office buildings, governmental organizations, and higher education. This is a key segment for EIS. One advantage of EIS is the ability to easily look at multiple sites spread over a large geographical area. Thus EIS are powerful tools for multi-facility operations. In this

market, potential users of EIS are energy managers, financial managers, and operators at each site.
Individual Building Market
Some EIS provide large volumes of data. In this case individual buildings with complex building systems and high energy-use can take advantage of EIS. Some EIS vendors offer remote diagnostics services by professional analysts along with the software and hardware. These analysts and the on-site operators at each facility are potential users of EIS.
Energy Providers and Electric Utility Market
Since EIS are powerful for interactive communication between customers and energy providers, energy providers are also one of the major clients of EIS. EIS vendors sell customized products to energy providers, and then energy providers resell the EIS to their customers as an optional service, or they may provide it free to participants of load management programs. EIS vendors take care of the energy providers’ customers as well as the customers directly dealing with the EIS vendors. Therefore the basic needs for an EIS will be the same as for Multi-Facility Clients. EIS are necessary for energy providers to manage DR Programs that request customers to reduce load when the electric grid is taxed and energy supplies are limited.
EIS Market ─┬─ Commercial ─┬─ Multi-Facility Clients ─┬─ Large corporation ─│─ ─│─ ─├─ Office retail─│─ ─│─ ─├─ Chain company ─│─ ─│─ ─│─ hotel, grocery, restaurant, etc─│─ ─│─ ─├─ Governmental ─│─ ─│─ ─│─ administration, post office, library, etc─│─ ─│─ ─└─ Higher education (campus) ─│─ ─└─ Individual Buildings─├─ Industrial ─└─ Energy Providers
Figure 2. EIS Market.
Types of EIS
As discussed above, Energy Information Systems have evolved out of the electric utility industry in order to manage time-series electric consumption data. EIS are closely related to many remote-monitoring and control technologies. Many of these systems are quite new technologies, and are somewhat overlapping and changing quickly as the market unfolds. A description of these different systems is provided in this section. These descriptions provide an overview of key features in each category of systems.
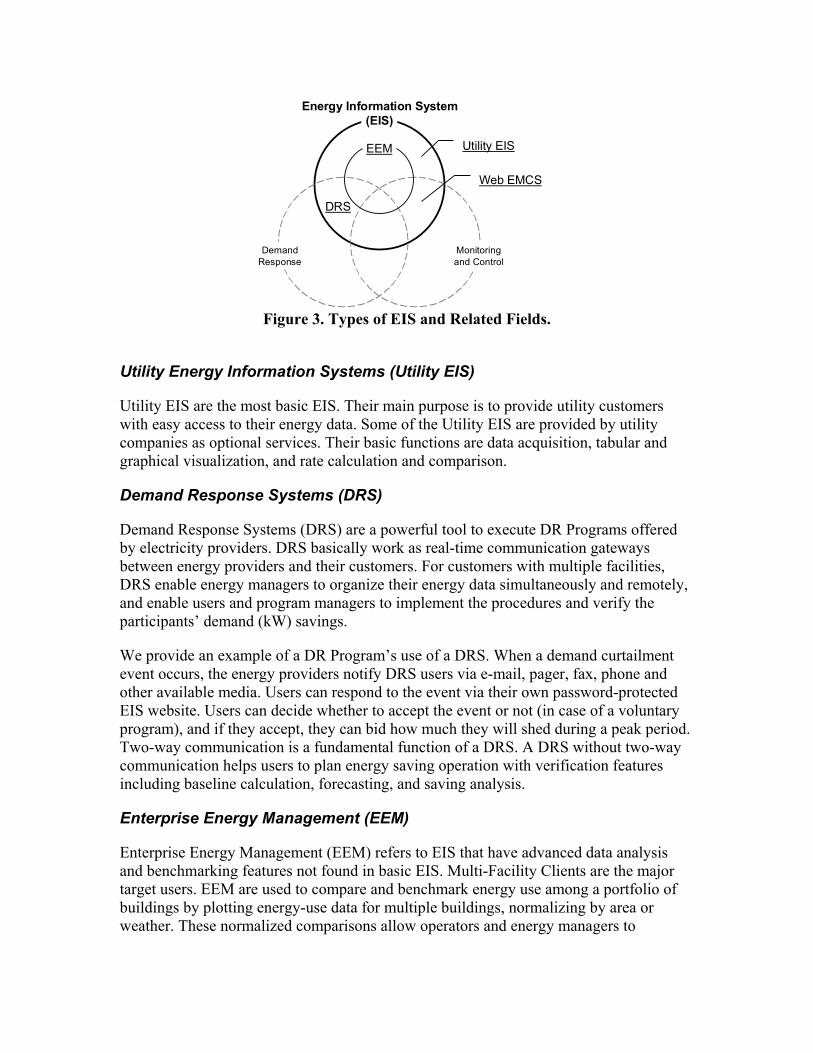
In this paper, EIS are categorized into 4 types. Some EIS may fit into more than one category. Figure 3 shows the relation among each type of EIS and related fields.
Energy Information System
Utility EISEEM
(EIS)
DRS
Monitoringand Control
DemandResponse
Web EMCS
Figure 3. Types of EIS and Related Fields.
Utility Energy Information Systems (Utility EIS)
Utility EIS are the most basic EIS. Their main purpose is to provide utility customers with easy access to their energy data. Some of the Utility EIS are provided by utility companies as optional services. Their basic functions are data acquisition, tabular and graphical visualization, and rate calculation and comparison.
Demand Response Systems (DRS)
Demand Response Systems (DRS) are a powerful tool to execute DR Programs offered by electricity providers. DRS basically work as real-time communication gateways between energy providers and their customers. For customers with multiple facilities, DRS enable energy managers to organize their energy data simultaneously and remotely, and enable users and program managers to implement the procedures and verify the participants’ demand (kW) savings.
We provide an example of a DR Program’s use of a DRS. When a demand curtailment event occurs, the energy providers notify DRS users via e-mail, pager, fax, phone and other available media. Users can respond to the event via their own password-protected EIS website. Users can decide whether to accept the event or not (in case of a voluntary program), and if they accept, they can bid how much they will shed during a peak period. Two-way communication is a fundamental function of a DRS. A DRS without two-way communication helps users to plan energy saving operation with verification features including baseline calculation, forecasting, and saving analysis.
Enterprise Energy Management (EEM)
Enterprise Energy Management (EEM) refers to EIS that have advanced data analysis and benchmarking features not found in basic EIS. Multi-Facility Clients are the major target users. EEM are used to compare and benchmark energy use among a portfolio of buildings by plotting energy-use data for multiple buildings, normalizing by area or weather. These normalized comparisons allow operators and energy managers to

determine how buildings compare and if one month, day, or hour has high energy-use or unusual operation relative to a baseline.
Web-base EMCS Interfaces (Web-EMCS)
Web-base EMCS Interfaces (Web-EMCS) have the capability to access an EMCS and retrieve monitored data, while Utility EIS usually (though not always) access only the electric meters installed by utility companies. In this case, each site is required to install additional communication devices. Popular types of data to retrieve are chiller power and tons, air temperature, and end-use electric loads which are useful for building system analysis. These detailed data allow users to perform component-level system diagnostics. Some EIS can remotely control the set points within an EMCS via a communication device. Popular control strategies include modifying thermostat settings, disabling or reducing chiller operation, dimming interior lighting, and disabling elevators. This functionality can be used to reduce electricity consumption during a demand curtailment event. In this case, Web-EMCS and DRS functionality overlap.
Table 1 summarizes critical features of each EIS type as defined in this paper. These are not restrictive categories and there is significant variation among the various systems. However, this framework allows us to understand the general nature of these tools as they currently exist on the market, and the key features that drive the architecture of each tool.
Table 1. Typical Features of each EIS Data
download Load profile Summary Bench
markingSub
meteringDRP
biddingRealtime
Remote control
Rate analysis
Utility EIS EEM DRS Web-EMCS
Definition: Load profile: Visualize hourly usage. Summary: Aggregate by week or month. Benchmark: Compare among multiple buildings. Sub metering: End-use metering such as chiller. Real-time: Update at least every 15 minutes. DRP bidding: Participate in DRP online. Remote control: Change EMCS settings via Internet.
Feature Comparison
LBNL conducted an analysis of over a dozen currently deployed EIS by compiling information on DR programs around California and throughout the US. We collected information using Internet searches, telephone interviews, online demonstrations, meetings, and tests. The following tables outline key features of current EIS that were evaluated. Since many of them can be widely customized depending on users’ needs, this comparison is based on their basic features and information made available through the methods described above. This is not an exhaustive list, but is designed to characterize the general capabilities of today’s EIS.
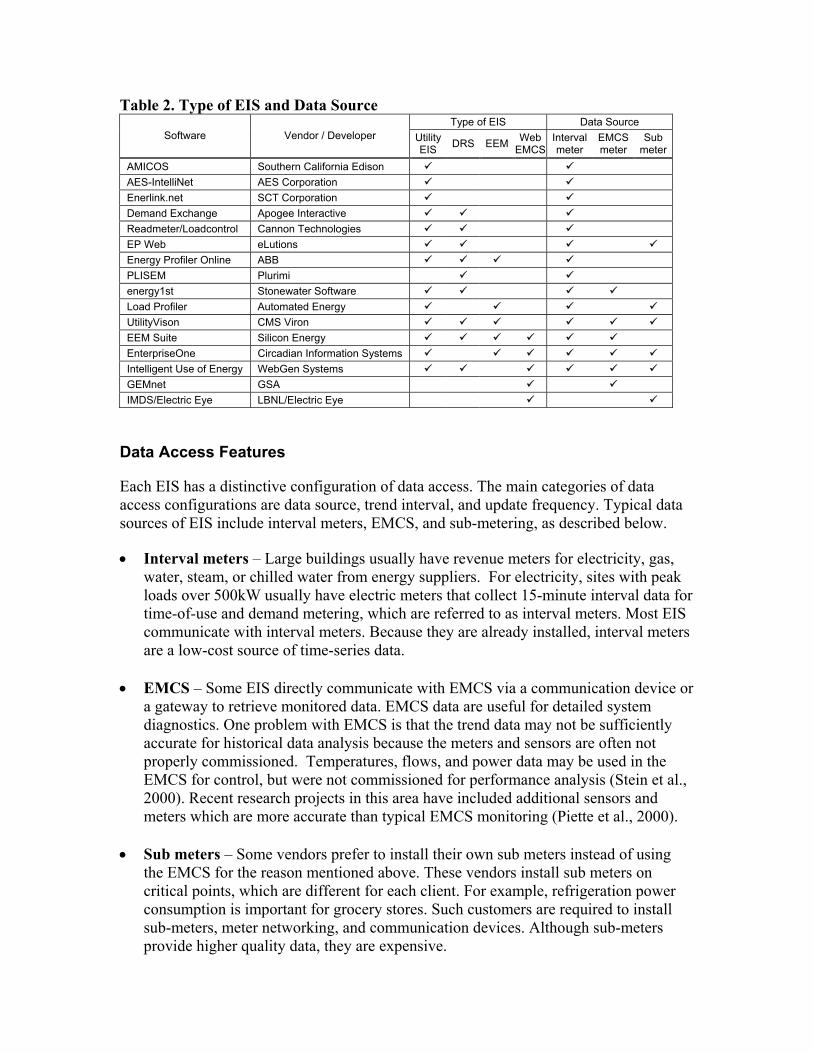
Table 2. Type of EIS and Data Source Type of EIS Data Source
Software Vendor / Developer UtilityEIS DRS EEM Web
EMCSInterval meter
EMCS meter
Submeter
AMICOS Southern California Edison AES-IntelliNet AES Corporation Enerlink.net SCT Corporation Demand Exchange Apogee Interactive Readmeter/Loadcontrol Cannon Technologies EP Web eLutions Energy Profiler Online ABB PLISEM Plurimi energy1st Stonewater Software Load Profiler Automated Energy UtilityVison CMS Viron EEM Suite Silicon Energy EnterpriseOne Circadian Information Systems Intelligent Use of Energy WebGen Systems GEMnet GSA IMDS/Electric Eye LBNL/Electric Eye
Data Access Features
Each EIS has a distinctive configuration of data access. The main categories of data access configurations are data source, trend interval, and update frequency. Typical data sources of EIS include interval meters, EMCS, and sub-metering, as described below.
•
•
•
Interval meters – Large buildings usually have revenue meters for electricity, gas, water, steam, or chilled water from energy suppliers. For electricity, sites with peak loads over 500kW usually have electric meters that collect 15-minute interval data for time-of-use and demand metering, which are referred to as interval meters. Most EIS communicate with interval meters. Because they are already installed, interval meters are a low-cost source of time-series data.
EMCS – Some EIS directly communicate with EMCS via a communication device or a gateway to retrieve monitored data. EMCS data are useful for detailed system diagnostics. One problem with EMCS is that the trend data may not be sufficiently accurate for historical data analysis because the meters and sensors are often not properly commissioned. Temperatures, flows, and power data may be used in the EMCS for control, but were not commissioned for performance analysis (Stein et al., 2000). Recent research projects in this area have included additional sensors and meters which are more accurate than typical EMCS monitoring (Piette et al., 2000).
Sub meters – Some vendors prefer to install their own sub meters instead of using the EMCS for the reason mentioned above. These vendors install sub meters on critical points, which are different for each client. For example, refrigeration power consumption is important for grocery stores. Such customers are required to install sub-meters, meter networking, and communication devices. Although sub-meters provide higher quality data, they are expensive.

We provide some comments on a few systems. UtilityVision install their own metering to insure data accuracy. AES-IntelliNet reads interval meters similar to other EIS, but it outputs metered data via a wireless system, which is more secure than telephone lines, which can be cut. For EMCS communication, GEMnet (GSA Energy and Maintenance Network) is a unique tool that builds its remote monitoring capabilities on the BACnet protocol (Piette, 2001). IMDS (Information and Monitoring Diagnostic System) demonstrated by LBNL has additional sensors and meters which are more accurate than typical EMCS sensors.
Another difference in data access is update frequency. Trend data are stored at a monitoring site, and uploaded to a host server at a specified monitoring interval. Recently, because of the increasing needs of DR programs, even 15-minute data are inefficient. In this case, monitoring frequencies may be shorter than the trend interval. Fifteen-minute updates are generally called “near real-time”, and “real-time” is considered to be every 1 to 2 minutes. Many “real-time” EIS update every few seconds. In some cases, although the meter communications occur every few seconds, the server stores data only once every 15 minutes to reduce disk space. Some EIS such as Load Profiler and AMICOS upload the interval data to a server on a daily basis because of their communications procedures. These EIS assume that users will only access the EIS once or twice per day, and daily updates are good enough for day-ahead procurement. Thus, update frequency should be selected according to users’ needs.
Visualization / Analysis Features
Most Utility EIS provide simple tabular and graphical visualization of revenue meter time-series data. Data summary features, which aggregate daily, weekly, monthly, or a selected time period, are useful and essential for analyzing energy usage history. Most Utility EIS are designed to be simple for non-technical personnel.
Some EIS, especially for those in the EEM and Web-EMCS categories, have a variety of visualization and analysis features, which may require expertise to understand and utilize. There are two kinds of visualization features: the ability to visualize any kind of data (user-defined analysis), and the ability to create pre-defined graphs (pre-defined analysis). For the user-defined analysis, the EIS may not recognize what the data represent (temperature, power, etc.) and simply provides graphing features like a spreadsheet program. The users then must know which variable to choose and how to graph and interpret the data. Even knowledgeable users may find this to be time-consuming. Moreover, user selections will not be consistent among all sites. The Data Analyst module of EEM Suite has flexibility in data visualization including time series, summary, overlay, X-Y scatter, and 3D charts. The IMDS uses ElectricEye for its data visualization software. This has the capability to visualize time series plots and scatter chart, though it doesn’t have any summary features.
Pre-defined charts provide immediate access to the most relevant information. Energy usage breakdown charts, chiller kW/ton vs tons scatter plots, and psychrometric charts are examples of pre-defined analysis charts. EEM Suite has a series of benchmark

comparison plots, such as pie charts showing total usage and bar charts showing energy use per floor area. These features are considered pre-defined analysis, but still have flexibility in variable selection. EnterpriseOne has specific pre-defined analysis features including Chiller Diagnostics, which develops kW/ton vs tons scatter plots and tons histograms. One of powerful features of EnterpriseOne is to aggregate multiple energy consumption variables by converting each unit into Mbtu.
Table 4. Visualization/Analysis Features
Software product
Time series
Day overlay
Average
Highs/low
s
Summ
ary
Point overlay
X-Y scatter
3D chart
Load duration
Calendar profile
Aggregation
OAT plot
Per sqft
Forecasting
AMICOS Enerlink.net Readmeter EP Web Energy Profiler Online Load Profiler UtilityVison EEM Suite EnterpriseOne Intelligent Use of Energy IMDS/Electric Eye Definitions: Time series: Plot single variable by hour. Day overlay: Overlay multiple days. Average: Calculate average of specified period. Highs/lows: Show max (peak) and min of the day or specified period in graph or tabular data. Summary: Aggregate by week or month. Point overlay: Plot multiple variables on same time series. X-Y scatter: Plot of two points against each other to visualize relationship. 3D chart: Plot of data point for vertical axis by hour – day horizontal axis. Load duration: Sort and bin data for plotting load (or load factor) and hours at each load. Calendar profile: Plot daily profiles of a month like calendar. Aggregation: Aggregate multiple buildings or sub-meters. OAT plot: Plot outside air temperature on a time series graph. Per sqft: Normalize consumption by area for power, gas or utility cost. Forecasting: Forecast day-ahead loads. Demand Response Features
Baseline calculations are critical for demand saving verification. The California ISO defined their baseline usage as a “Highest 10-of-11-Day Average” for their 2001 DR Programs. Curtailment Manager, one of the modules of EEM Suite, calculates 10-day baselines for savings verification. There are also other types of baseline calculation methods. Demand Exchange, EEM Suite and IUE provide forecasts that bring historical load data with weather data to predict the load shape for the next day.
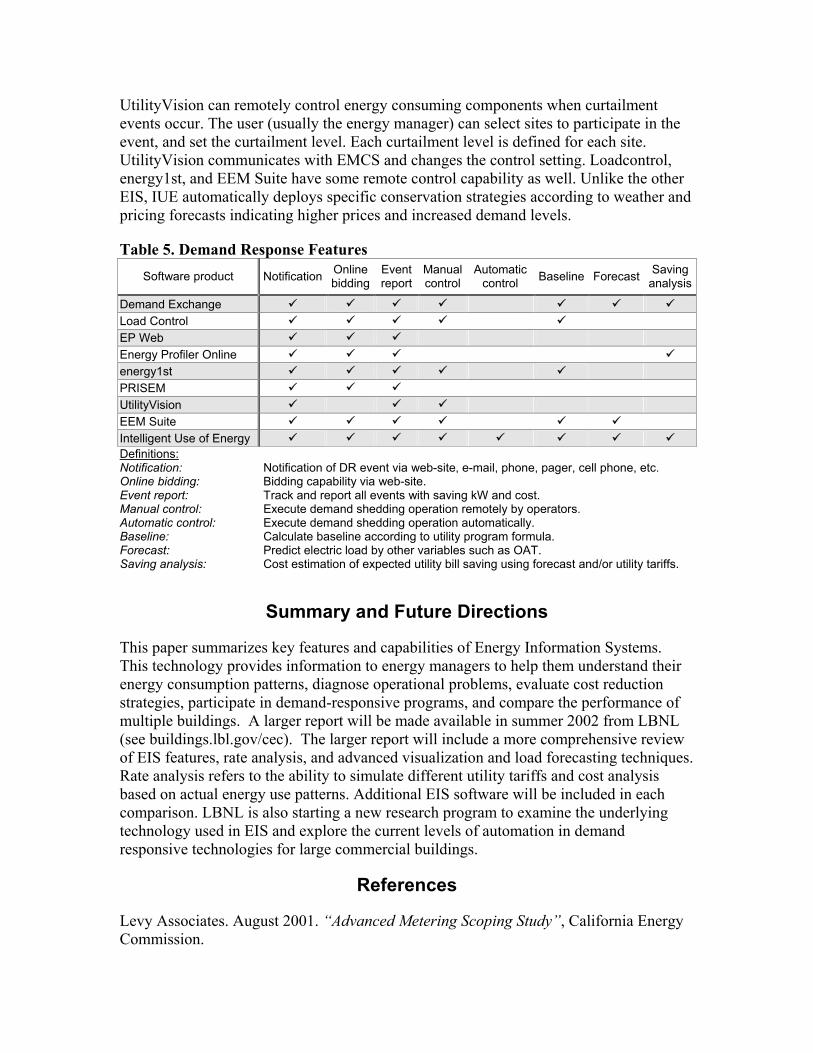
UtilityVision can remotely control energy consuming components when curtailment events occur. The user (usually the energy manager) can select sites to participate in the event, and set the curtailment level. Each curtailment level is defined for each site. UtilityVision communicates with EMCS and changes the control setting. Loadcontrol, energy1st, and EEM Suite have some remote control capability as well. Unlike the other EIS, IUE automatically deploys specific conservation strategies according to weather and pricing forecasts indicating higher prices and increased demand levels.
Table 5. Demand Response Features Software product Notification Online
biddingEventreport
Manualcontrol
Automaticcontrol Baseline Forecast Saving
analysis
Demand Exchange Load Control EP Web Energy Profiler Online energy1st PRISEM UtilityVision EEM Suite Intelligent Use of Energy Definitions: Notification: Notification of DR event via web-site, e-mail, phone, pager, cell phone, etc. Online bidding: Bidding capability via web-site. Event report: Track and report all events with saving kW and cost. Manual control: Execute demand shedding operation remotely by operators. Automatic control: Execute demand shedding operation automatically. Baseline: Calculate baseline according to utility program formula. Forecast: Predict electric load by other variables such as OAT. Saving analysis: Cost estimation of expected utility bill saving using forecast and/or utility tariffs.
Summary and Future Directions
This paper summarizes key features and capabilities of Energy Information Systems. This technology provides information to energy managers to help them understand their energy consumption patterns, diagnose operational problems, evaluate cost reduction strategies, participate in demand-responsive programs, and compare the performance of multiple buildings. A larger report will be made available in summer 2002 from LBNL (see buildings.lbl.gov/cec). The larger report will include a more comprehensive review of EIS features, rate analysis, and advanced visualization and load forecasting techniques. Rate analysis refers to the ability to simulate different utility tariffs and cost analysis based on actual energy use patterns. Additional EIS software will be included in each comparison. LBNL is also starting a new research program to examine the underlying technology used in EIS and explore the current levels of automation in demand responsive technologies for large commercial buildings.
References
Levy Associates. August 2001. “Advanced Metering Scoping Study”, California Energy Commission.

Frank Hyde. February 1995. “Software Helps Keep Customers Ttied to the Line. (Enerlink)”, Electrical World v209, n2: 43
Stein, Jeff Ross, Aditi Raychoudhury, Charles Eley. 2000. “The Jury is (Halfway) In: New Building Performance Contracting Results”, Proceedings of the 2000 ACEEE Summer Study on Energy Efficiency in Buildings.
Mary Ann Piette, Satkartar Kinney. October 1999. “Performance Assessment and Adoption Processes of an Information Monitoring and Diagnostic System Prototype”, Final Report for CEC/CIEE Project: Diagnostics for Building Commissioning and Operation.
Mary Ann Piette, Satkartar Kinney, Hannah Friedman. May 2001. “EMCS and Time-Series Energy Data Analysis in a Large Government Office Building”, Proceedings of the 9th National Conference on Builiding Commissioning.
Acknowledgements
The authors are grateful for assistance from Satkartar Kinney and Grayson Heffner (LBNL), and our sponsors Martha Brook, California Energy Commission (CEC), and David Hansen, US Department of Energy (DOE). This work is part of LBNL’s High Performance Commercial Building’s Program, Element 5 (Integrated Commissioning and Diagnostics). This program is supported by the CEC and by the Assistant Secretary for Energy Efficiency and Renewable Energy, Office of Building Technology, State and Community Programs of the U.S. DOE under Contract No. DE-AC03-76SF00098. We also thank the following people for their assistance.
Lee Eng Lock Electric Eye Pte. Ltd. www.eeye.com.sg Cody Graves Automated Energy, Inc. www.automatedenergy.com Kristopher Kinney Engineered Web Information Systems www.en-wise.com Frank Hyde SCT Corporation www.sctcorp.com Leslie Hummel Silicon Energy , Inc. www.siliconenergy.com Ron LaCombe CMS Viron Energy Services www.utilityvision.com Mark Levi General Services Administration Dirk Mahling Prof. Dr., University of Pittsburgh
WebGenSystems, Inc. www.webgensystems.com Gerard Manley eLutions, Inc. www.elutions.com Gerald Mimno AES Corporation www.aes-intellinet.com Beth Reid ABB, Inc. www.abb.com Roger Rognli Cannon Technologies, Inc. www.cannontech.com Christine Stell Circadian Information Systems www.circadianinfosystems.com Deborah Tillman Southern California Edison www.edisonamicos.com Eric Watson Apogee Interactive, Inc. www.demx.com