herb levine us epa, region ix serdp estcp · remediation and management of persistent technical...
TRANSCRIPT
Herb LevineUS EPA, Region IX
SERDP‐ESTCP
Report Documentation Page Form ApprovedOMB No. 0704-0188
Public reporting burden for the collection of information is estimated to average 1 hour per response, including the time for reviewing instructions, searching existing data sources, gathering andmaintaining the data needed, and completing and reviewing the collection of information. Send comments regarding this burden estimate or any other aspect of this collection of information,including suggestions for reducing this burden, to Washington Headquarters Services, Directorate for Information Operations and Reports, 1215 Jefferson Davis Highway, Suite 1204, ArlingtonVA 22202-4302. Respondents should be aware that notwithstanding any other provision of law, no person shall be subject to a penalty for failing to comply with a collection of information if itdoes not display a currently valid OMB control number.
1. REPORT DATE NOV 2010 2. REPORT TYPE
3. DATES COVERED 00-00-2010 to 00-00-2010
4. TITLE AND SUBTITLE CERCLA Site Close Out. How Clean is Clean? An EPA Perspective
5a. CONTRACT NUMBER
5b. GRANT NUMBER
5c. PROGRAM ELEMENT NUMBER
6. AUTHOR(S) 5d. PROJECT NUMBER
5e. TASK NUMBER
5f. WORK UNIT NUMBER
7. PERFORMING ORGANIZATION NAME(S) AND ADDRESS(ES) U.S. Environmental Protection Agency,Region 9,75 HawthorneStreet,San Francisco,CA,94105
8. PERFORMING ORGANIZATIONREPORT NUMBER
9. SPONSORING/MONITORING AGENCY NAME(S) AND ADDRESS(ES) 10. SPONSOR/MONITOR’S ACRONYM(S)
11. SPONSOR/MONITOR’S REPORT NUMBER(S)
12. DISTRIBUTION/AVAILABILITY STATEMENT Approved for public release; distribution unlimited
13. SUPPLEMENTARY NOTES Presented at the 15th Annual Partners in Environmental Technology Technical Symposium & Workshop,30 Nov ? 2 Dec 2010, Washington, DC. Sponsored by SERDP and ESTCP.
14. ABSTRACT This talk will focus on a regulatory perspective related to site closure and attainment of cleanup standards.Often two major questions arise in evaluating the attainment of a cleanup standard (1) Is the site reallycontaminated because a few samples are above the cleanup standard? (2) Is the site really ?clean? becausethe sampling shows that the majority of samples are below the cleanup standard? Statistical methods allowfor decision making under uncertainty and permit valid extrapolation of information which can be usedwith confidence to determine whether the site meets the cleanup standard. A case study will be presentedwhich presents some of these methods.
15. SUBJECT TERMS
16. SECURITY CLASSIFICATION OF: 17. LIMITATION OF ABSTRACT Same as
Report (SAR)
18. NUMBEROF PAGES
33
19a. NAME OFRESPONSIBLE PERSON
a. REPORT unclassified
b. ABSTRACT unclassified
c. THIS PAGE unclassified
Standard Form 298 (Rev. 8-98) Prescribed by ANSI Std Z39-18
Remediation and Management of Persistent Technical Session No. 1C Chlorinated Solvent Contamination
C-17
EPA PERSPECTIVE ON SITE CLOSURE: HOW CLEAN IS CLEAN?
MR. HERB LEVINE U.S. Environmental Protection Agency
Region 9 75 Hawthorne Street
San Francisco, CA 94105 (415) 972-3062
his talk will focus on a regulatory perspective related to site closure and attainment of cleanup standards. Often two major questions arise in evaluating the attainment of a cleanup
standard:
(1) Is the site really contaminated because a few samples are above the cleanup standard?
(2) Is the site really “clean” because the sampling shows that the majority of samples are below the cleanup standard?
Statistical methods allow for decision making under uncertainty and permit valid extrapolation of information which can be used with confidence to determine whether the site meets the cleanup standard. A case study will be presented which presents some of these methods.
T
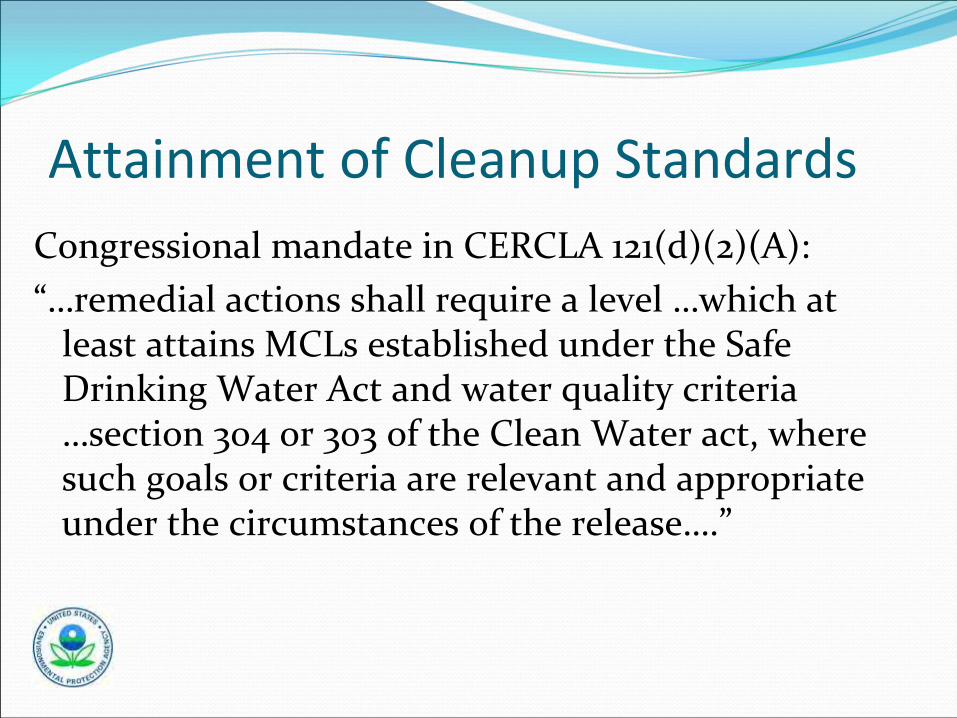
Attainment of Cleanup StandardsCongressional mandate in CERCLA 121(d)(2)(A):“…remedial actions shall require a level …which at
least attains MCLs established under the Safe Drinking Water Act and water quality criteria …section 304 or 303 of the Clean Water act, where
such goals or criteria are relevant and appropriate under the circumstances of the release….”
Attainment of Cleanup Standards Policy
NCP preamble sets forth EPA’s policy that for groundwater “ remediation levels generally should be attained throughout the contaminated plume, or at and beyond the edge of the waste management area when waste is left in place.”

Attainment of Cleanup Standards Technical Guidance
1992 Methods for Evaluating the Attainment of Cleanup Standards Volume 2:Groundwater, presents statistical methods which address attainment evaluation
1994 Methods for Monitoring Pump and Treat Performance, Chapter four updates statistical methods

Attainment of Cleanup Standards 1992 Guidance
Attainment hypotheses:
is the site really contaminated because of few samples are above the cleanup standard?
is the site really ‘clean’ because the sampling shows the majority of samples to be below the clean up standard?

Attainment of Cleanup Standards 1992 guidance
Definition of attainment:The groundwater in a well attains the cleanup standard
if, based on statistical tests, it is unlikely that the average concentration (or a percentile) is greater than
the cleanup standard.
Region IX Groundwater SitesRegion IX has 128 sites on the NPL, 113 have groundwater contaminationLike other Regional offices RPMs are assigned many sites and have to prioritize their timeMany sites are not addressed due to lack of resourcesLow hanging fruit, closeout sites which have attained cleanup goals

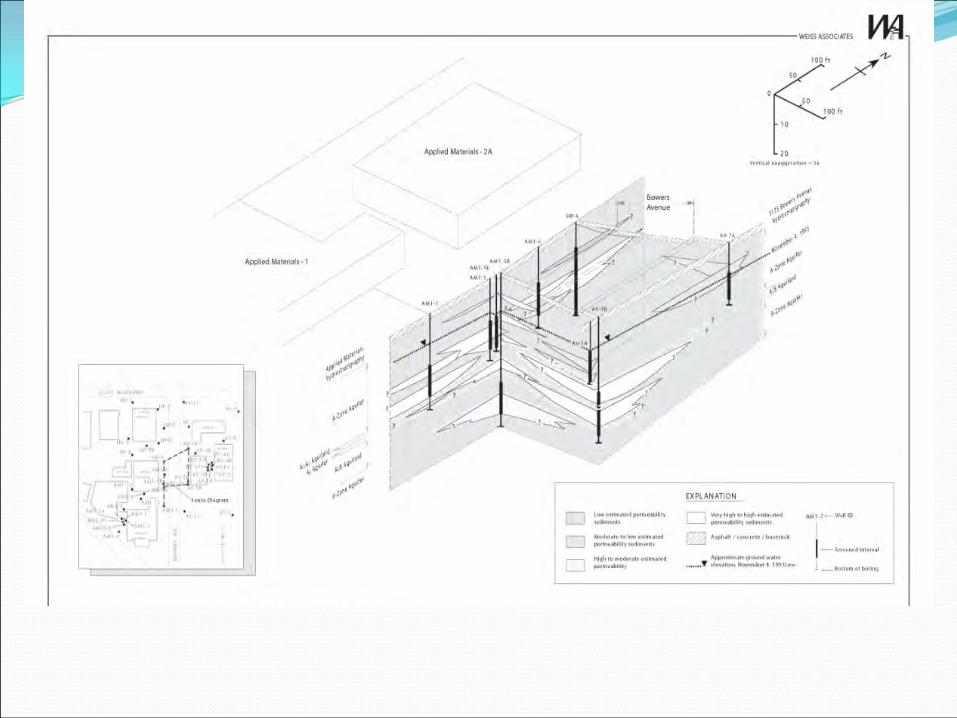
Background informationMany Superfund Sites in California had releases of solvents in the 1980sThese sites performed removal actions at their source areas and initiated ground water extractionAfter initial success the extraction remedy effectiveness declined and were optimized and later shut off, relied on MNA w/o ROD amendment (State lead)Long term monitoring depicted a slow and steady decline towards contaminant clean up levels

.
WEISS ASSOCIATES
~ 101
CENTRAL EXPRESSWAY
KIFER

\ e
FC- Bl FC-2 •
APPLIED
I\1ATERI ALS
"·" FC-B2e
• FC-1
APPLIED
~lATERJALS
6
N-2 • rc-3 0
•
AM1
A M3
AV
IM
EXPLANAT ION
Soil Boring
Monitoring WO;II
Sealed and al>andoo-..:•d monitoring w ell
Extraction w ell
Extraction w ell, destroyed
Applied Materials Build n g 1 Superfund site
Appl ied Materials Buildng 3 , formerly Hewlett-Packard (HP) RINOCB site
Avant.,k ~it .. (now HP) , I=!WOCB closure obtained i n September 2000
Intel Magnedcs Superfund sire
® IM 6
0 I
Weiss Associates ~
I
SCOTT BO [ TET :.--J.RD
AMl 1 -2 0
t:SH - 1
AM11·1 gJ-
'\PPI 11"1:..
'\,JATEIUALS
11
HP-3JZ1
.-----------. 0 H P - 7
HP-4 0
APPL. IED
:'\!ATERIALS - 3
0 AM3 HP-9 9
P1 SITE
HP - 2 llJ
HP -8 HP- 6
C AF tiTERI A rr --H-:--p-1=--E-~ -D--...,, AM :.6 0
l\IAfUK.l \ S
~ AM 1- SB
AM1-12 I !} AM1 -5E AM1·40 JZ1~soo.,-----..L.AM1-5
PARKING AM1-8
STRl CTl Rt: ~ 0 AM1·11
AM1-9 0
AM1 - 7 0
N
t
I ...-AMl- 1 M1 1 4 .{~ AMl - 2
01ff;c£ API' ~lED
AM 1 - 1 O~..t_ l\I \.TERIALS- 1
AM1 -EP JZ1 'K::'AM1-P3
200ft I
0 ~'!. ' AM1 - P2 AM1·3 '-AM1-P1
IM SITE
AM1 SITE
" P-2
AV-7A121
AV-7B 0
AV-1 B 0 0
AV- lA
AV SITE
AV-10 0
.7 .. .#-
..-- --------~ .-::~: -20
----; :::.:::-.::-_____ ~ ··----~- ~--
-10
·20
" .
..... ,
-·· ~ .......
~~ /..
·~' /
I ~
~o~Mtt ..... ._ """' .... Pf'JW ... pM4o .... l
tti_. ....... . !*..._.....,, HrMaMH
W!JSS ASSOOIJES
10
IOOit/ -t-
100ft
20 - ..

1 ~ t
1;1
' I
' -p \)
1 v
~··~ 1\ IMI'
UIUX
MIIS! RenlOI'II IIistorr· \I'd I,\ \li-S[ h ... Jm ll~n"'J11 Strlmill't IHI
Time
II•M Ktmo.ollh<lill') • \lrii A"III·I Ja-lflll '"-t;1t ..... ..., Jtf1
MauRrmonlllistery· Wtii AMI·IO Jo,,.J9fli ~mzir FtliN"J IH:
ftme
"""' ... .,., .. JIM
1n
l\
l l'J 5
~ "
II j ; -
~~ , •
ll i 1 i v

Weiss Associates JIM Hydrographs
A-Zone Wells AM1-5E,AMJ~, AMJ-7, & AivJJ-11
30 ~---------------------------------------------------------------------------------,
28
-c"ii 26 0 > ·.c ~ ~ -> 5 ~ "' ~ c I. ~ ~
~ 24 -~ ~ ~ > -= 0 C.&:l = c: o ... I. ~ (,j~ 22 -
20
_..,_ AM1.Q AM1-7 ~ AM1-11 -e- AM1-5E I 18 +---~----,---~----~----~---r----~--~----~--~----~--~~------------~
Dec-95 Dec-96 Dec-97 Dec-98 Dec-99 Dec-00 Dec-01 Dec-02 Jan-04 Dec-04 Jan-06 Jan-07 Jan-08 Jan-09 Ja n-1 0 Jan-11
Time
-. ,c. =-& ~
! 2 e u ~ = ~ .,...; ~ ~ u = ~ ,.;
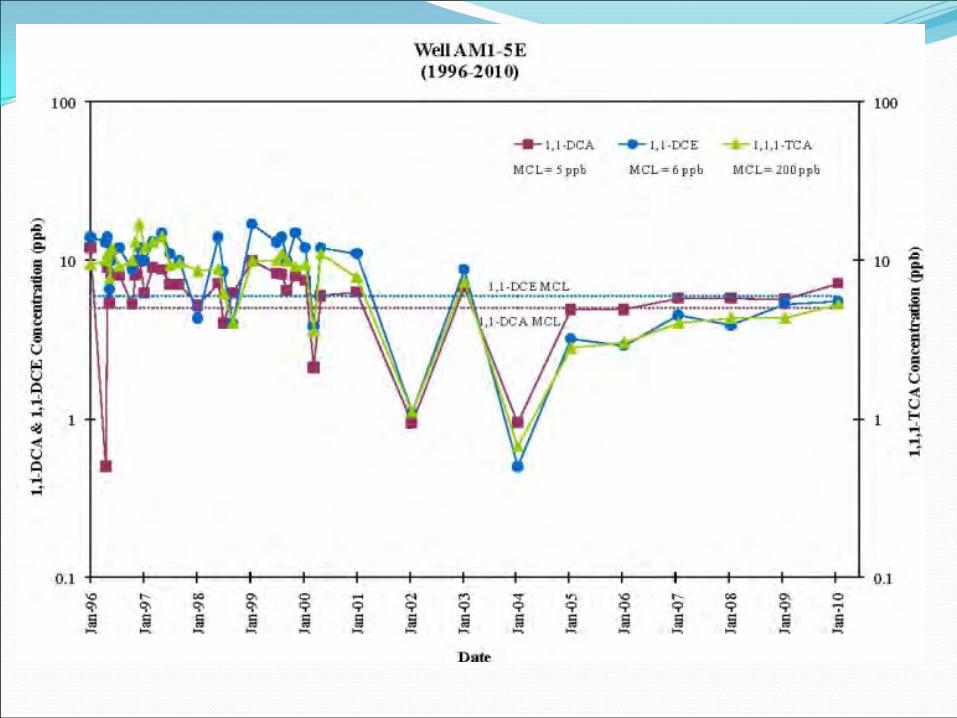
\VeliAMI-5E (1996-2010)
100 T----------------------------------------------------------------------------------r
10
l 1
0_1 '10 ........ = Q\ 0 - N ('l"'j
G" q-. q-. ~ ~ ~ ~ ~
! s ~ e c: ! ! a c:l ...... 1-> - ......, ~
Daft:
--- 1. 1-DCA -e- 1,l-OCE
MC L= 5 ppb MCL = 6 pph
"f" ,...,, '10 ~
C? 9 ~ 9 ~ § ! g:j ,_, - """'
1. 1.1 -TC A
MC L= 200 ppb
cc Q\
~ q a
"""' ~ I-•
0 -l = c:l n
100
-10 Q ~ e = ! ~ s u ~ u
1 !:-4 ~ .... ..... _..,
OJL

1:' I. ,.,
Jan·96
Jan-97
Jan-98
Jan-99
Jan-00
0 ........
Jan-01 -
Jan-02
Jan-03
Jan-04
Jan-05
Jan-06
Jan.07 I
Jan-08
Jan·09
1,1-DCA & 1~1-DCE Concentration (ppb)
........ "'"" 0
~ . r ...... II ;.....
...... ' "" I;J "" () a" >
~ + r~ II ......
:~ 'g. [II
3: 0 t'"' ...... II :_
N • Q 7'
~ d 'g. );>
..... 0 0
Jan-10 { I I I 0 ~
..... ....... 0
1,1,1-TCA Conomtradon (ppb)
.......
8
~~ 'Cil,; \&)-
~> ~a= I-< .......
Sb..

~ =-.e 10 s i
i 8 u ~
~ ..... ~ 1 ~
~ Q ~
4'> 1"'1
0.1 \0 ..... ICIO 0'\ Q _. c-l <?,I
~ ~ Q,\ ~ ~
c;>
! ! i a ~ ~ ~ ~ l=;
WellAMl-7 (1996-201 0)
_,.... L, L-OCA --- ~.1 - DC:E. 1,1,1-TCA
MCL= S ppb MCL= 6 ppb MCL= 200 ppb
1,1-0CA MCL
IC"'\ ~
V1 'I() ("-. co 0\
~ C? ~ c;> q 9
! ~ d a ! ~ ~~--. ~ ~ .......
Dait
10 -.Q
~ i ! 5 ~ = ~ ~
1 ~ I ~ ..... ....
OJ Q ~ • i ......,

Jan-96
Jan-97
Jan-98
Jan-99
Jan-00
Jan-01
Jan-02
t:; Jan-03 a ~
Jan-04
Jan-05
Jan-06
Jan-07
Jan-08
Jan-09
Jan-10
0 ......
0 ......
1, 1-DCA & 1, 1-DCE C oncentration (ppb)
......
: . : . . ! ..- : - . 0 • o :
o : ::r> ! ~ = (") : r : . . :
: . . . : . . I :If . . . . . . . .
; . -; . . -:o : o t trl : s:: : n : r : : . : :
......
...... 0
I
r
...... 0
1,1,1-TCA C oncentration (ppb)
s:: () r II
V'l
'<:) '<:)
o-
s:: () r II 0.
'<:) '<:)
o-
s:: ()
r II
N C)
C)
'<:) '<:) o-
+ --0
Cl ()
:;c.
+ -0
Cl ()
trl
~ . -~ () :;c.
...... 0 0
...... 0 0
~ ~ ~= 0\> N ~ 0 ~ ~ I 0 ~ - ~
Attainment Evaluation at SiteResponsible Party presented an evaluation of attainment using existing wells using 1992 guidance. That evaluation associated four wells into a group based on contaminant and sampling history, well construction, and geographical locationThe AM evaluation averaged the data into a single value and determined that the cleanup standard had been met everywhere throughout the plume

Attainment of Cleanup Standards 1992 Guidance
Two possible ways to evaluate attainment of multiple wells:
Assess each well individuallyAssociate selected wells into groups

Associate Wells 1992 guidance
Restrictions on associating wells into a group: wells should be within similar concentration contourwells must not be outside of the plumewells should be screened in the same intervalwells should be sampled and analyzed at the same event
Intended for data sets where concentrations fluctuate above and below the clean up standard.

DRAFT
1,1-0CE
1D
~
I~ '9
~ ..... ~ ~ c\ -
7
,- I.HXE I -l!t191"[1.1~; R•~ /
\ -r--v 2
D
J m-(13 ,Jui-Gl J.,-<04 J - J •-os JI:IKIS o~on-oE: J ..as .lll...al' ..ILIHI7 Jon-os .lul-oB JDft-o9
._.,ii>Dat.
Figure7. Ammal A11-erage 1,1-Dicbloroetbeoe Concentraticms in Representative A-~ Mooitoring Wells, Applied Materials Building 1 mJ Vicinity, Santa Clua, Ca]ifomia
:a
DRAFT
1,1-0CA
6.00 .,..-----------------------,
5.00 +---.--....... ---.... ------=.=--------------1 . --.. . ---.. .... _ --.. __ 4.00 +---------------• .;;:, .... ._~ ... ----!
; 3.00 +------------':":'y'""'~""''''"'l -u .. uuu~::":'lx-:'+"""· :.!~'~':J.,. ___ !; :'l"'"""";j - --1
0 R2 = 0.654
2.00 +-----------------------1
1.00 +----------------------1
0.00 +-~--"T""" ___ "T""" ___ "T""" ___ "T""" __ ---1
1-Sep-02 14"an-04 28-May-05 10-0ct-06 22-Feb-08 ~ul-09
Mid-point Date
I • 1.1-DCA two year avernge
---Linear (U -OCA two year average)
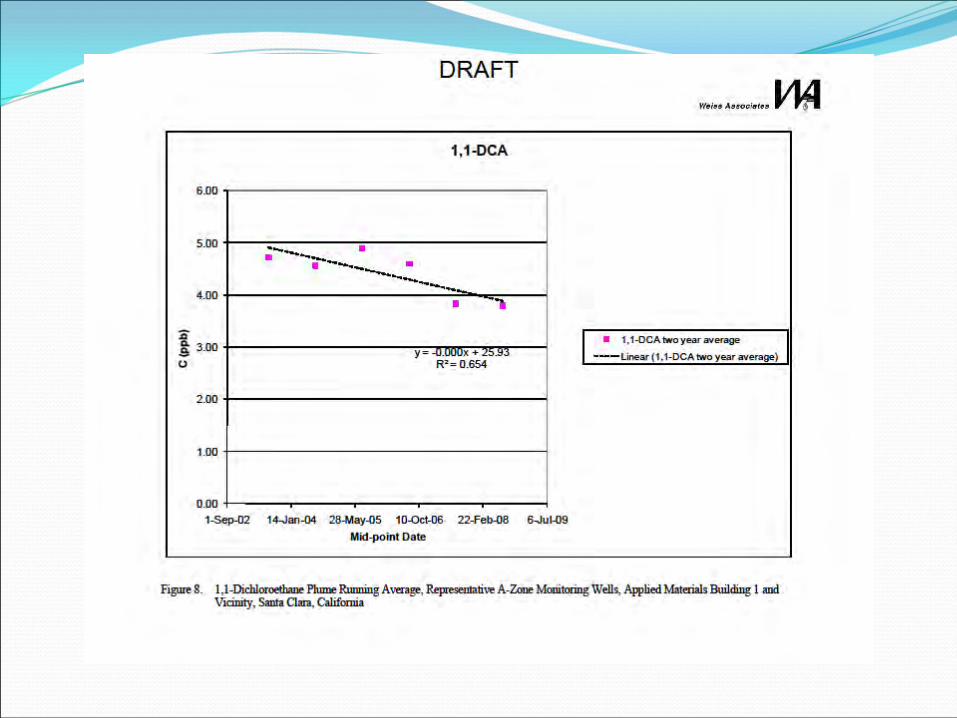
Figure 8. 1,1-Dichloroethane Phtme R:umring Avenge, R.epresemative A-Znoe Mooi.toring Wells, Awlied Materials Building 1 and Vicinity, Santa Cla:ra, California

DRAFT
6
1 --1 . 1~ I - Lbeor[1.1-oc.o\l
l ~
~ // ~ ~ / R' • ll210 '-. v
""'/ -
..
5
4
2
I
0 Jan-03 Ju-ro Jan-01 JU!-04 J~..a; .kf.(J5 J~-{)6 JIJ-Q; Jan.{J7 JLI-07 Jan.()6 Jd-{)8 Jan-m
$11111J1eoD
Figure 6. Amma1 Average 1,1-Dicbloroethane Concentrations in Representative A-'ZorY.! .Monitoring Wells, AwJ.ied Materials Building 1 and VIcinity, Santa Clara, California

DRAFT
1,1-DCE
9.00 .,..-----------------------,
....... 8.00 +------'=---~ .. =-.. ------------------t .... .... . ..... 7.00 +--------·.:. .... ,::'111., ....... --.. ----------t
6.00 +------------"'----~~--------1 ~ Ji" 5.00 +---------------..... ....:.0'0111::~~-----t
! y = -0.002x + 67.50 • 0 4.00 +-------------___._R.._'2 -=-......... 01.95.......,.3 ____ _,
3.00 +-----------------------t
2.00 +----------------------1
1.00 +------------------------4
0.00 +-----r-----,.r------,----.... -------4 1~Sep-02 14~an-(14 28-May-05 10-0ct-{)6 22-Feb-08
Mid·point Date
I • 1 , 1~CEbMlyearavemge I
- --· t inear (1,1-00E two year average)
Figure9. 1,1-Dichloroetbene PlumeR:umringAvenge, R.eprese.ntttiveA-'l.cmeMooitoring Wells, Applied Materials Building 1 and Vicinity, Santa Clara, California

Attainment of Cleanup Standards 1994 Guidance
Recommended time frame for attainment analysis is 2 to 5 years

Table 1: Spatial Average results and Statistics (2003 – 2010)
Sample Date
Spatial Average
Concentration [ug/L] All Wells
Standard Deviation
1,1-Dichloroethane (MCL 5) 1/9/2003 5.60 1.83 1/14/2004 3.84 2.36 1/12/2005 5.30 1.80 1/12/2006 4.51 1.60 1/16/2007 4.70 1.72 1/16/2008 2.97 1.95 1/20/2009 4.63 2.82 1/20/2010 4.20 2.72 1,1-Dichloroethene (MCL 6) 1/9/2003 9.18 1.45 1/14/2004 7.18 4.95 1/12/2005 7.65 3.53 1/12/2006 6.36 2.58 1/16/2007 6.88 1.95 1/16/2008 3.17 1.84 1/20/2009 5.45 2.21 1/20/2010 3.75 1.52 Notes: 1. Concentrations are averages for wells AM1-6, AM1-7, AM1-11 and AM1-5E for dates indicated. 2. The chart shows concentration vs. time with error bars representing the standard deviation for eachpoint 3. MCL are shown as straight line for DCA and DCE

Concentrations
2006‐2010
90% 95% 99%
Well LCL UCL LCL UCL LCL UCL
name Min Max Mean Median SD
1,1 Dichloroethane MCL 5
AM1‐11 1.8 4.6 2.96 2.2 1.33 1.69 4.22 1.309 4.611 0.22 5.698
AM1‐5E 4.9 7.2 5.88 5.8 0.83 5.09 6.67 4.85 6.9 4.17 7.59
AM1‐6 2 2.7 2.42 2.5 0.26 2.17 2.67 2.1 2.74 1.89 2.95
AM1‐7 2 8.1 5.68 6.2 2.24 3.55 7.82 2.9 8.46 1.07 10.29
1,1, Dichloroethene MCL 6
AM1‐11 2.2 8.8 5.22 3.4 3.3 2.1 8.36 1.13 9.31 ‐1.566 12
AM1‐5E 2.9 5.5 4.42 4.5 1.01 3.4 5.43 3.1 5.71 2.23 6.61
AM1‐6 2.8 6.1 4.84 5 1.23 3.67 6.01 3.32 6.36 2.32 7.37
AM1‐7 1.1 8.3 6.02 8.1 3.2 3 9.05 2.1 9.9 ‐0.52 12.6
Spatial Average
1,1 DCA 2.42 5.88 4.24 4.32 1.8 2.1 6.4 1.4 7.1 ‐1 9.5
1,1 DCE 4.42 6.02 5.13 5.03 0.7 4.3 6 4 6.2 3.1 7.1

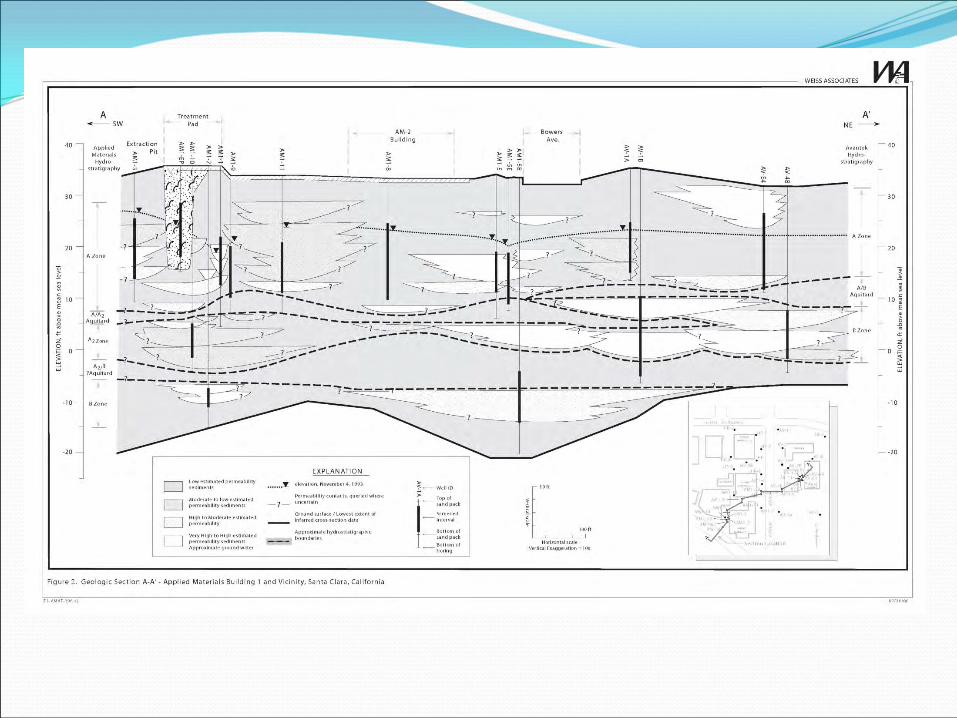
Attainment EvaluationSite conceptual model: site underlain by heterogeneous soils, remaining organic contaminants slowly diffusing out of marine mud into alluvial sandsRemedial actions taken: source removal, P&T with follow on MNA have reduced contaminant levels to or below the ROD specified cleanup levelsNo receptors at siteConclude site RAOs met using single well and
multiple well statistics

Attainment ConclusionFor sites with similar CSM and data sets EPA Region IX goal is to close out these sites and delist from the NPL
EPA Region IX prefers an open approach using existing guidance, either individual wells or well groups.
EPA Region IX currently developing a policy document which reiterates national EPA policy and guidance and clarifies associating wells into groups.