heath, a. and li, y. (2007) 'period, life-cycle and generational
TRANSCRIPT
Period, life-cycle and generational effects on ethnic minority success in the British labour market
Anthony Heath and Yaojun Li
(Forthcoming in the special issue of KZfSS, 2008) 1
1 We are grateful to the ESRC for funding this research (Socio-economic position and political support of the BMEs in Britain (1971-2004), ESRC (RES-163-25-0003)) and for the UK Data Archive for making data accessible to us. We alone are responsible for any error that might exist in the analysis and interpretation of the data reported in this paper.
1

IntroductionMany studies have demonstrated ethnic disadvantage in the labour market (Van Tubergen and Kalmijin, 2005; Kalter and Kogan, 2006; Heath and Cheung, 2007; Li and Heath, 2007). Most of this research, however, has been static and has relied on single cross-sectional analysis. A key unanswered question is whether this disadvantage is declining over time or across generations. A dynamic analysis is likely to give us a much better understanding of the generative processes that lies behind the cross-sectional picture of disadvantage. It is also likely to have some major policy implications.
The aim of this paper therefore is to use repeated cross-section data in order to trace the experiences of different generations of ethnic minorities over time in the British labour market. In particular, we propose to examine life cycle, generational and period effects on ethnic minority experience in the labour market. It is important to distinguish between these three processes, since it is well established that there are career processes within the labour market (for example career processes in attaining intra-generational mobility into professional and especially managerial work), period effects with labour market situation and unemployment rates changing over time, and generational change with younger generations being much more highly educated than older ones. The three processes are likely to be even more important in the case of migrants and their descendants, where they are also likely to take somewhat different characters from those in the majority workforce.
There have been many suggestions in the literature that life cycle or career processes will be important for new migrants. Migrants tend initially to be quite disadvantaged (at least with respect to income) on arrival in a foreign country but then gradually improve their position, relative to the native-born, as they acquire labour market experience and other skills, such as a degree of fluency in the domestic language, and an understanding of recruitment and work practices in the western labour market. In his classic work, Gordon (1964) referred to these as processes of acculturation and regarded them as among the first to occur. (Confusingly, economists often term these processes ‘assimilation’, which has a quite different meaning in the sociological literature.)
On somewhat similar grounds, it can be argued that there will be major generational processes, with the children of migrants having host country qualifications, fluency in the main language, host country work experience and social connections. They will also tend to have host-country expectations and frames of reference, whereas the migrant generation may be more oriented to their countries of origin, sending remittances home and in many cases perhaps expecting to return home themselves. On these grounds we would expect the second generation to experience much less disadvantage in the labour market than the parental generation experienced and for their outcomes to be more similar to those of the majority population.
We can also expect some period effects. A third set of arguments suggests that there will be a gradual improvement for both generations over time as the context in the destination country gradually changes. This might be expected to happen partly because younger generations in the majority population tend to be generally somewhat more liberal and less ethnocentric than older generations (Rothon and Heath, 2003), partly because of the passage of explicit anti-discrimination legislation
2

(such as the 1976 and 2001 Acts in Britain), and partly because of increased contact between members of majority and minority groups, which is often held to increase tolerance.
Historically, this picture of gradual progress across the life cycle, across generations and across time has been found to apply to the experience of migrants from Europe to the USA, and their descendants, over the course of the twentieth century. However, while we can in general expect to see some progress on all three counts in Western Europe in more recent decades, it is much less clear that the progress will be shared equally by all ethnic groups and whether the basically optimistic experience of white migrants to the USA will be repeated in the case of the ‘new’ migrants and their children from less developed countries. Indeed, there has been considerable discussion in the US too as to whether these processes apply to the more recent waves of migrants from less developed countries in the same way that they applied to the earlier waves of European ancestry.
In the case of life cycle processes, it has been suggested that while a process of intra-generational catching up may occur, parity may never be achieved by culturally-distant groups, especially since language is harder to acquire the later the stage at which it is learned. In the case of Britain too we might expect to find that the life cycle process of catching up may be more marked for white groups, such as Irish or European immigrants, than in the case of more culturally distant groups such as Pakistanis or Bangladeshis.
In the case of generational processes, Borjas (1992, 1995) has convincingly argued in the American context that human capital externalities may leave a legacy of disadvantage for later generations, delaying processes of inter-generational catching-up, perhaps indefinitely. Heath and Cheung (2007) have argued similarly that the conditions of the migrant generation in Western Europe may have implications for later generations, with groups that were composed largely of guest-workers in the first generation continuing to display disadvantage in later generations because of human capital externalities. This suggests that inter-generational progress may be greater for groups who initially had relatively high human capital, such as the Africans, Chinese and Indians, than for groups with low original human capital such as Pakistanis and Bangladeshis, and to a lesser extent, Caribbeans (although in the case of Caribbeans in Britain the first-generation women were relatively highly educated since there were special efforts to recruit qualified nurses from the Caribbean for the health service).
In the case of period effects, too, we might expect the catching-up process to be more marked for some minorities than for others. The contact hypothesis suggests that it is contact under conditions of equality that promotes tolerance. This suggests, first, that groups such as Indians and especially Pakistanis and Bangladeshis who have higher levels of community closure, as shown by their low intermarriage rates and higher geographic concentration, may not develop reciprocal tolerant attitudes at the same rate as those of, say, Chinese and Caribbeans. In addition, the war in Iraq and associated anti-Muslim feeling suggests that in the most recent period progress might be limited for Muslim groups. It has also been suggested in Britain this anti-Muslim feeling may have led to discrimination on religious grounds over and above the racial discrimination that has been in endemic in most western countries.
3

We hypothesize then that we should generally find life cycle, generational and period (over time) improvements in the position of migrants and their descendants in the British labour market. However, we also hypothesize that, for a variety of different reasons, there may be some ethnic variation within these broader ‘catching up’ processes. In particular we expect the catching up to be most noticeable for groups of European ancestry, such as the Irish, and least noticeable for groups such as the Pakistanis and Bangladeshis, with African, Indian and Caribbean groups in between.
The aims of this paper, therefore, are, first, to test whether immigrants and their descendants gradually ‘catch up’ with the majority population (white native-born British) over the life cycle, across generations, and across historical time and, second, to test whether there are ethnic variations in the extent of these ‘catching up’ processes. In this paper we focus on ‘catching up’ with respect to unemployment, rather than with respect to occupational attainment or income. Previous research in Britain has suggested that access to employment is the crucial hurdle that migrants and their descendants have to overcome and it therefore makes an appropriate starting point for analysis (Leslie et al., 1998; Model, 1999; Li, 2004; Heath and Yu, 2004; Cheung and Heath, 2007).
Our focus is particularly on what we have elsewhere termed ‘ethnic penalties’, that is to say the net unemployment rates of the different ethnic minorities when compared with those of members of the White British majority population at a similar stage of the life cycle and with similar qualifications (Heath and McMahon, 1997; Berthoud 2000). Gross unemployment rates can be very misleading since some groups’ disadvantage may be masked by their high level of qualifications. For example, in Britain Black Africans tend to have rather high qualifications and a low gross unemployment rate, but when we compare their unemployment rates with those of similarly-qualified members of the majority population we find that they experience major disadvantages. It is these net disadvantages, that is, the disadvantages observed when comparing members of a minority group with members of the majority with the same levels of education and experience in the labour market, on which we focus.
Data and methodsWe explore these issues using the pooled cross-sections of the General Household Survey (GHS) and the Labour Force Survey (LFS) from 1972-2005 following through the experiences of pseudo-cohorts of ‘early arrivals’ (people who had arrived in Britain by the 1970s), the ‘second generation’ (native-born ethnic minorities, the children of the early arrivals, entering the labour market in the 1990s and 2000s), and ‘recent arrivals’ (people who migrated to Britain and entered the labour market at the same time as the second generation).2
The pooled data set has around 4.7 million records with nearly 420 thousand minority ethnic members. This, to our knowledge, is the largest, most systematic, and most carefully-constructed data source ever assembled covering a long period of thirty-four consecutive years, with all the key variables coded to be consistent over time. The variables standardised include ethnicity, country of origin, time of arrival, age, marital
2 For the most recent period there will also have been some third-generation groups, particularly in the case of the Irish and Caribbeans. However, we are not able to distinguish these groups in the LFS, although we can in the GHS, and have therefore simply amalgamated them with the second generation.
4

status, educational qualifications, employment status, class, earnings from the labour market, number of children in family unit, limiting long-term illness and hours of work. For ethnicity, we differentiate nine main groups: White British, White Irish, White Other, Black Caribbean, Black African, Indian, Pakistani/Bangladeshi, Chinese and Other (including ‘Mixed’). (See Appendix 1 for details of the construction of this measure.) This kind of differentiation is more detailed than is available in most existing research on ethnic relations using quantitative data and it enables us to conduct a thorough investigation of the economic situation of the main minority ethnic groups in Britain in the period covered. In particular, we can investigate the socio-economic situation of one of the long-standing and largest immigrant groups to Britain, namely, the Irish (from the Republic of Ireland rather than from Northern Ireland) and to compare their experience with that of newer migrant waves from more distant and less developed countries.
With regard to generation status, we differentiate first and second (or later) generations, the former referring to people coming to the UK in their adult life (after the age of 16) and the latter to those born in the country or arriving by the age of 16 who thus received full or at least part of their education in Britain and whose English proficiency would not cause any major problems in job-seeking or career advancement.3 This is a rather broader definition of the second generation than is usual, but our checks have shown that those who arrive during the period of compulsory schooling have very similar outcomes to those who were born in Britain and rather different outcomes from those who arrived as adults. Unfortunately, our data sources do not allow us to make consistent distinctions of the third (or higher) generation from the second generation owing to the lack of relevant information on parental birthplace in the LFS as earlier noted. This is unlikely to be problem in the case of groups arriving more recently (such as the Black Africans and Pakistanis) but there could in our latest period be some third generation respondents of Black Caribbean ancestry and there will certainly be some of white Irish ancestry. This needs to be born in mind when interpreting our results.
Following from this, we construct a seventeen-category ethno-generational variable from the cross-classification of ethnicity and generation (but combining first-generation White British, who are a rather anomalous group comprising only 0.26% of the sample, with the other White British). In our statistical analyses we then take the White British as the reference category. We have found that this is preferable to including separate terms for ethnicity and generation. In particular, a term that simply distinguishes first from second generation is completely inappropriate in the case of the White British, the vast majority of whom are third or higher generation. We have also suggested that there will be interactions between ethnicity and generation. Our combined ethno-generational variable in effect fits all the interaction terms while
3 Some recent LFSs have included a question on whether respondents have had difficulty in the labour market because of lack of fluency in English. Very few of the second generation, as defined in this paper, reported any such difficulties. Pooling together LFS for 2002, 2003 summer and 2006 autumn with the relevant information, we find that none of the Black Caribbean, and only 2.7%, 1.3%, 4.5% and 3.2% of the 2 nd generation Black African, Indian, Pakistani/Bangladeshi and Chinese respondents reported having had language difficulty in getting or keeping a job (authors’ analysis). It is also noted here that as the samples for the Chinese were rather small before 1983 when we differentiate by generation and gender (under 30 in each year for the different sexes and generations), they were dropped from analysis in the paper.
5
simultaneously allowing us to compare the minority groups with the reference category of the White British.
As noted above, we focus in this paper on experiences of unemployment. We confine our analysis to those who are economically active, contrasting the unemployed with the employed. Notice that there will be important issues of selection bias, particularly in the case of women where rates of economic inactivity are especially high among some ethnic groups. We therefore use Heckman selection models in order to take account of this (see further below). Because these models make strong but unverifiable assumptions we have also compared our results to a standard probit analysis. Our analyses are conducted for men aged 16 to 64 and women aged 16 to 59, and resident in Great Britain at the time of interview. In our modelling work, we further restrict the samples to those with full valid data in the variables used. Even with such restrictions imposed, there are just under one million records both for men and for women.
Our major control variables are educational level, where we distinguish six levels, marital status, and potential years in the labour market (estimated as age at time of survey minus age on completing full-time education). These are taken to be proxies for the key aspects of human capital – skills and experience – that are usually taken to be associated with gaining employment. In our selection equation, we also include whether or not the respondent had a long-term illness that limits their labour-market participation and the number of dependent children under sixteen. (Further details of the coding of these variables are given in Appendix 1.) Table 1 summarizes the sample characteristics.
(Table 1 about here) The usual methods for analysing life cycle, generation and period effects from pooled cross-section data have to confront the well-known identification problem: once one knows the value of two of the three variables of age (indexing life-cycle), year of survey (indexing period) and birth cohort (indexing generation), one can logically derive the third. Thus if one know that a respondent was born in 1960 and interviewed in 1990, it follows that age must be 30. Hence one cannot include all three variables in the same model simultaneously. Other strategems have to be followed in order to obtain identifiability.
However, in our case the theoretical interest is not in generations defined by date of birth but in generations defined by place of birth (and age of arrival in Britain). Hence we do not have this particular identification problem. We can simultaneously include age (in our case years of potential labour market experience), year of survey (indexing period) and generation. Of course, the possibility remains that there are other generational effects based on differences between birth cohorts, of the sort that are the usual focus of APC analyses. For example, more recent generations, brought up in a multicultural Britain, might be less racist and less prone to discriminate against minorities than older generations. However, we do not on theoretical grounds expect major generational differences of this sort operating directly on the unemployment experiences of ethnic minorities.
6
Our modelling strategy therefore is to carry out multivariate analyses of unemployment in which we include as our main predictors ethnicity, generation (combined in our ethno-generational variable), years of potential labour market experience, and period (Model 1). Following standard procedures in the sociology of ethnicity we then add controls for marital status and educational level in order to estimate the ethnic penalties experienced by our different groups (Model 2). From this model we can also determine whether there has been any process of inter-generational ‘catching up’. The third stage is then to include interactions between ethnicity and experience, education and period respectively in order to test whether ethnic minorities are ‘catching up’ over the life cycle or across historical time (Models 3-5). We further include an interaction effect between ethnicity and labour market context (defined as the annual proportion in unemployment per region) to test the hypothesis of hypercyclical ethnic unemployment (Model 6). The key interest of the study then comes when we include these interactions to test our main theoretical claims.
As we noted earlier, one important issue is that of selection into economic activity. For example, people who believe that they have a low probability of obtaining work may decide not to look for work and may therefore be counted as economically inactive. ‘Discouraged workers’ might be an example of such a process. The standard econometric technique for dealing with this kind of selection issue is to fit a selection equation, which models the likelihood of being economically active. If we find that there is a correlation between the residuals from our selection equation and that from our outcome equation (the regression of the log odds of being unemployed), then we assume that some selective process of this sort is present. In our case, we do find that the residuals are correlated, and we therefore use the standard (Heckman) correction.
It should be recognized however that it is possible that the selection processes operate differently for ethnic minorities than for the majority population, or between generations, and this needs to be explored in further work.
ResultsWe begin with some simple descriptive results showing some of the main trends across time and then turn to the detailed statistical modelling of the effects. All analysis is conducted for men and women separately.
Patterns and trends in unemploymentThe data in Figure 1 show the percentages unemployed for men and women in Britain from 1972 to 2005 for the eight main groups (data for ‘Others’ are not shown). As is clearly seen in the figure, the White British men and women were generally less likely than other groups to face unemployment. Also evident in the figure is the feature that the period covered witnessed two peaks of unemployment, especially for men. In much of the mid 1980s and in the early 1990s the overall unemployment rates were over 10 per cent. In the 1970s and from the late 1990s onwards, the unemployment rates were much lower.
(Figure 1 about here)
7

The data show a marked feature of the ‘hyper-cyclical’ nature of unemployment for minority ethnic groups, that is, ‘when unemployment rates increase generally, those for ethnic minorities increase even more rapidly’ (Heath, 2007). The rates for Black Caribbean and Pakistani-Bangladeshi men in the two peaks, and that for the Black African men in the early 1990s, were two to three times higher than those of the White British. The rates for the Black Caribbean and Black African women in the two peaks were also around twice those of the White British women. It is noted here that further analysis reveals that around 70 per cent of Pakistani/Bangladeshi women were economically inactive throughout the period covered.
While the data in Figure 1 show the patterns and trends of unemployment for the different ethnic groups across time, they do not control for differences between generations, for changes across the life cycle, or according to level of human capital. Over time, an increasing proportion of the ethnic minority population will be second generation, with higher levels of domestic human capital, while some of the first generation will have had substantially longer periods in the British labour market than will the ‘early arrivals’ observed in the 1970s. We therefore turn to our multivariate analysis. Statistical modelling of unemployment: men Having looked at the raw patterns and trends associated with ethnicity in unemployment over time, we now move to the multivariate analysis, initially controlling for age and generational status as well as period (where we distinguish three periods corresponding to the low unemployment period up till 1980, the high unemployment period from 1981 to 1996, and the second low unemployment period from 1997 onwards). We conduct six models, running each analysis separately for men and women. In Model 1, we include indicators for generation differences (assessed by the seventeen category ethno-generational variable described above), life cycle effects (assessed by potential years in the labour market and years squared), and period effects (assessed by dummies for period). In Model 2, we include human capital indicators (assessed by educational qualifications and marital status, see Heath and Cheung, 2007; Li and Heath, 2007; Chun and Lee, 2001), and in Models 3 to 6, we further include interactions between ethnicity/generation and the other variables of theoretical interest. The data are presented in Tables 2 and 3 for men and women respectively.
(Table 2 about here)
Model 1 in Table 2 shows the expected patterns with risks of unemployment being much higher in the middle period and with the usual curvilinear relationship with life-cycle stage: new entrants to the labour market tend to have higher risks of unemployment which gradually decrease with age before levelling off later in one’s career. Most importantly, model 1 shows major ethnic differences in risks of unemployment but little variation across generations. Thus White Irish, Black Caribbean, Black African, Indian, Pakistani/Bangladedeshi and the ‘Other’ category all have significantly higher rates of unemployment than the White British at the same stage in the life cycle and in the same period. Only the White Other and the Chinese groups (again in both generations) show unemployment rates similar to or lower than
8
those of the White British. Generational differences are rather small with the same pattern in both generations of the Black African, Black Caribbean and Pakistani/Bangladeshi groups exhibiting the greatest disadvantages.
In model 2 we then include measures of highest qualification and marital status. Both variables operate in the expected way, with higher qualifications protecting against unemployment and the never married having the highest risks of unemployment. As other research has shown, controlling for educational qualifications accounts for a small amount of the Black Caribbean and Pakistani/Bangladeshi disadvantage (since these groups tend to be somewhat less well-educated than the reference group) but in the case of the more highly educated groups, especially Black Africans, the estimates of ethnic disadvantage actually increase in model 2. Model 2 then gives the standard picture of ‘ethnic penalties’ but with Black Africans now showing the largest ethnic penalty in the second generation, and with very little difference in the magnitude of the ethnic penalties across generation. There is certainly no general tendency for these penalties to be lower in the second generation.
In model 3 we then fit interactions with labour market experience in order to test whether life cycle effects vary across the different ethno-generational groups. Specifically, we are interested in testing whether the first generation groups catch up with the White British majority group (having started, we assume, well behind). We are also interested to see whether the second generation experience the same life cycle processes as the majority population. On theoretical grounds, since they are either native-born or have British qualifications, we expect them to show similar progress across the life cycle. We therefore add sixteen interaction terms, one for each ethno-generational group, with the linear LM term (LM meaning years in the labour market).
Here we see a rather striking pattern with positive interaction terms for every first generation group (statistically significant in four cases) and a tendency towards negative interaction terms for the second generation (significant in three cases). We also note that there are some marked changes in the size of the ethno-generational parameter estimates, these estimates now relating to respondents at labour market entry after completing full-time education. In particular we see that the first generation estimates are now much smaller in model 3 than they were in model 2.
In effect what this means is that, contrary to the conventional wisdom (which is based on research on earnings, not unemployment), the first generation were not especially disadvantaged at the beginning of their careers in the labour market, but then actually showed less progress across the life cycle than did comparable members of the majority population. So far from ‘catching up’, what we actually see here is a pattern of ‘falling behind’. This pattern is particularly striking in the case of the Pakistani/Bangladeshi and Black Caribbean groups. (Thus for the first generation Pakistani/Bangladeshi group the positive interaction term of 0.163 largely cancels out the overall LM effect of -0.225, giving an LM effect for the Pakistani/Bangladeshi group of only -0.62. In other words, increased experience in the labour market does not tend to reduce unemployment risks for the Pakistani/Bangladeshi group to anything like the same extent as it does for the majority population.)
9

This result is not perhaps quite so counter-intuitive as it at first appears. The first generation Pakistani/Bangladeshi and Black Caribbean groups were classic labour migrants who came in search of work and were often under familial obligations to send remittances home. As has often been noted, these labour migrants were willing to do the jobs that members of the majority population were unwilling to do at the low wages on offer. Hence the relatively high rates of employment for these labour migrants, and their low wages, are quite understandable. Also understandable is their inability to make the same progress over the life cycle that the majority population make.
This pattern of a relatively high initial employment rate but limited progress thereafter is not so evident for some of the other groups such as the Black Africans who were not composed to quite the same extent of labour migrants. Black Africans have for example been typified as ‘students who stayed on’ (Daley 1996), and with their high initial qualifications they certainly do not fit the standard picture of labour migrants.
This ‘labour migrant’ pattern of high initial employment but limited progress thereafter does not operate for any of the second-generation groups (with the single exception of the Pakistani/Bangladeshi group). For most second-generation groups life cycle processes seem to operate in much the same way as for the majority population while for the second-generation Black Caribbeans we do actually see some catching up.
In model 4 we explore a further process of generational catching up. We test whether there is a significant interaction between generation and the returns to education. It has often been suggested that, because of their foreign qualifications, the first generation will have lower returns to education while the second generation, with their domestic qualifications, will experience the same kinds of return on their educational investments as do the majority population (Heath and Cheung 2007). Again we fit sixteen interaction terms, one for each ethno-generational group, with education (treated as a continuous variable for the sake of parsimony). Our expectation is broadly confirmed for the first-generation groups, five of whom show significantly lower returns to education (the positive interaction terms tending to cancel out the negative signs of the main effects of education). More surprising, however, is the finding that for four second-generation groups – White Other, Pakistani/Bangladeshi, Chinese and Other – we also find lower returns to education. However, we need to be a little cautious here. In the case of the Chinese, for example, we see (from the main effect) that the unqualified Chinese have much lower rates of unemployment than comparable members of the majority population. The interaction term therefore indicates that this does not hold at all levels of education. In effect, then, highly qualified Chinese in the second generation will tend to have rather similar risks of unemployment to comparable members of the majority population, and what needs explaining is not so much the lower returns to education as the processes that lead unqualified Chinese to have such abnormally low levels of unemployment. One possibility here is that the ethnic enclave, or family businesses, provide employment for these Chinese men.
In model 5 we then move on to the process of catching up over historical time. Note that for the interaction term we treat period as a continuous variable although we
10
continue to treat period as a categorical term for the main effect. In effect, then, the interaction term tells us whether there is a gradual catching up process over time additional to the general increase in unemployment rates that occurred for all groups alike in the middle period. We follow exactly the same strategy as before, fitting sixteen interaction terms, one for each ethno-generational group. Here our expectation is that, for both first and second generation, general processes of reducing discrimination and racial prejudice will tend to equalize the ethnic minorities’ chances in the labour market with those of the majority population. What we are looking for therefore are negative interaction terms, at least for those groups that had higher unemployment risks in the earliest period.
However, we find very few significant interactions with period, with as many significant positive signs as negative ones. Here we have to be a little careful as there may be unmeasured compositional changes in the nature of some groups across time. This may be particularly true for the Black African group, which is itself a rather heterogeneous category comprising many different ethnicities. For example, early arrivals from Africa might have come more from West Africa while more recently there have been refugees from East Africa, such as Somalia. The impression of a deteriorating situation for Black Africans may instead, then, reflect a tendency for refugees in general, and perhaps Somalis in particular, to be especially disadvantaged. On balance, then, we incline to the conclusion that there has been little change overall in the position of ethnic minorities in the British labour market right across our thirty-two year period.
An alternative hypothesis about period effects is that the effects of labour market conditions on ethnic minority unemployment are hypercyclical. That is to say, rather than any continuing linear trend towards equalization of unemployment risks, ethnic minorities might have greater risks of unemployment when the labour market is very slack (as in our middle period) and relatively lower risks when the labour market is tight and there is greater demand for labour. To test this we include, in addition to our main period effects, a measure of the regional unemployment rate in the relevant year and an interaction between this measure and ethnicity. The results are shown in model 6.
If the period effect on ethnic minority unemployment is hypercyclical, then we expect to find positive interactions terms, and this is exactly what we do find. Only four of the interaction terms are significant, but in all four cases they are positive. It is particularly striking that two of these significant effects are for the Black Africans.
Our main conclusions for men, therefore, are that • the generational changes have been rather small with the same pattern of large
ethnic penalties for the Black African, Black Caribbean and Pakistani/Bangadeshi groups in both generations;
• there is no general tendency for the first generation to catch up over the life cycle – indeed the reverse holds for the classic labour migrant groups;
• the first generation tends to have lower returns to education, as do some second-generation groups; and
• there has been no general narrowing of the gap over historical time, and at least for some groups unemployment does seem to be hypercyclical.
11

Statistical modelling of unemployment: womenDo the same patterns also hold for women? To answer this question Table 3 shows the same sets of analyses for women. The results of models 1 and 2 are similar to what we would have expected from previous research, with most minority groups, both in the first and second generations having significantly higher risks of unemployment than the majority population. The one notable difference from the pattern for men is that first generation Pakistani and Bangladeshi women do not seem to suffer an ‘ethnic penalty’. However, as we noted earlier, around 70% of these first generation women were economically inactive, and while we have used a Heckman selection model to attempt to deal with this issue, it is likely that the selection processes for first-generation Muslim women are rather different from the overall processes and that the selective nature of this group accounts for this finding.
(Table 3 about here)
As with men, we also find little change across generations. In the second generation, we find that five of our groups – White Irish, Black Caribbean, Black African, Indian, Pakistani/Bangladeshi and Other – all have significantly higher risks of unemployment than the majority population. Overall the magnitudes of the ethnic penalties are rather similar to those in the first generation.
Turning to life cycle processes, we find fewer significant interactions than we did for men, and no clear pattern. This is consistent with our ‘labour migrant’ interpretation of the male pattern: for many groups women will have migrated for family reunion rather than as the primary migrants, and so the pressure to find work and send remittances home might not be so great. To be sure, many Black Caribbean women would have been primary migrants, but in their case there was direct recruitment for the health service rather than a need to take any job that was available.
In the case of the interactions with education, however, the pattern is quite similar to that for men, with many positive signs for the interaction terms, indicating lower returns to education. This is true both in the first and in the second generations, although as with men the interaction terms tend to be rather larger in the first generation.
As with men, we can also see that, once we include the interaction term with education, the main effect of ethnicity on unemployment often changes sign. In other words, the unqualified members of these ethnic groups appear to have lower risks of unemployment than do comparable members of the white majority, but this advantage does not hold at higher educational levels. (This can be seen more clearly in Figures 2-5 below.) We observe this pattern in the Chinese, Pakistani/Bangladeshi and Indian groups, all of whom have significant ethnic enclaves and opportunities for employment by co-ethnics, albeit in low-skilled low paid jobs. This is also consistent with much of the ethnographic literature. It is also striking that this pattern does not hold for the Black Caribbeans or the Black Africans, two groups that in Britain are generally held not to have ethnic employment enclaves (and indeed have rather low rates of self-employment generally, see Li, 2007). While of course we cannot directly confirm the ethnic enclave interpretation from these data, it does seem to make good sense of our pattern of results.
12

We also find very similar results for women as for men when we move on to the over-time trends. As with men, there are very few significant interactions with historical time, and the two that are significant are positive, indicating increasing risks of unemployment, relative to the majority population, in the later two periods. However, the hypercyclical pattern found for men does not appear to apply to ethnic minority women, perhaps reflecting the rather different kinds of labour market in which they operate.
Discussion We have, in this paper, used the most authoritative data source from the GHS/LFS with all key variables standardised and the data spanning a long period of thirty-four years. We have focused on the unemployment risks experienced by first and second generation minority ethnic groups in the British labour market. Our analysis has been conducted in the framework of disclosing life cycle, generation and period effects, and the ways in which these vary for the different minority groups, while also taking into account indicators of human capital.
Given the amount of the data and given our main interest in exploring the net disadvantages or ethnic penalties experienced by the minority ethnic groups in the first and the second generation, we believe that the patterns could be best summarised by looking at the net effects revealed by Model 6. To facilitate the discussion, we have presented the net disadvantages in graphs (Figures 2-5), showing predicted values for the ethnic groups controlling for all the variables in Model 6 (since this model provides the fullest account). Figures 2-5 thus show the generation, life cycle, education and period effects separately for men and women.
(Figures 2a and 2b about here)
In Figure 2a we look at the generational differences in male unemployment. We have calculated the predicted probabilities of unemployment in the 1997-2005 period for married men with secondary educational qualifications and with ten to fifteen years’ of potential labour market experience. So on the y axis we show the predicted probability of unemployment, and on the x axis we array our seven minority ethnic groups (excluding the residual ‘Other’ group), ranked in order of their unemployment in the second generation. For each ethnic group we show two predictions, one for the second generation (in the upper panel) and one for the first generation (in the lower panel). The horizontal line shows the predicted unemployment rate for White British men of 4.3%. The predictions can be thought of as representing the ethnic penalties experienced by a ‘typical’ man in mid-career in the most recent period.
Two points stand out. First, the ethnic groups divide into two, with people of Black African, Black Caribbean and Pakistani/Bangladeshi ancestry on the one hand showing very much higher ethnic penalties than the other groups, and the groups of Indian and Chinese ancestry lying much closer to the White British, White Irish and White Other groups. This is not a simple split between ‘visible’ and ‘non-visible’ minorities, nor is it a simple split between those from developed and from developing countries. There is also a considerable range of ethnic penalties, with the Black Africans having unemployment rates almost three times that of the White British, and
13

the Black Caribbean and Pakistani/Bangladeshi groups having rates that are around twice as high as the White British one.
Second, the change between generations tends to be for the worse, with the two Black groups in particular showing considerably higher rates of unemployment in the second generation than in the first.
In Figure 2b we find a very similar picture for women, with the three most disadvantaged groups being once again the Black African, Black Caribbean and Pakistani/Bangladeshi groups and with no sign of inter-generational decline in their (net) disadvantages.
The absence of any generational improvement is particularly surprising, given the advantages that the second generation have in terms of language fluency and British qualifications. One possibility here is that lack of language fluency or British qualifications were partly compensated for, at least with respect to employment, by the willingness of the migrant generation to take low paid jobs.
(Figures 3a and 3b about here)
In our next figure (3a and 3b) we turn to the process of catching up over the life cycle. This time we show years in the labour market on the x axis and separate lines for our main ethno-generational groups. Again we focus on predictions for married men and women with secondary qualifications in the third period. As before we show separate lines for the first and second generations.
In the case of the first generation men we see rather clearly that, at early stages of the labour market career, the first generation members of our two main labour migrant groups – the Pakistani/Bangladeshis and Black Caribbeans - have unemployment rates of 8 or 9 percent, only a little above those of the White British. However, over the course of the life cycle, the White British unemployment rate falls to around 3 percent while the first generation labour migrant rates remain around 8 percent or even higher (especially for the Pakistani/Bangladeshi group), thus gradually diverging from the White British over the life cycle. In contrast, the White Irish, White Other, Chinese and Indian ancestry groups all follow life-cycle trajectories close to those of the White British. At the other extreme people of Black African ancestry have very high unemployment rates at all stages of their labour market careers.
In the second generation, we see that most groups now follow the same kind of trajectory over the life cycle as the White British, although from very different starting levels. Once again, the Black African and Pakistani/Bangladeshi men stand out with very high net unemployment rates throughout the life cycle. In contrast, second-generation Black Caribbean men, although starting from a very disadvantaged position, move closer to the White British levels over the life cycle, the one clear example of ‘catching up’ to be observed among the men.
As we can see from Figure 3b, these differences in trajectory over the life cycle are much less marked for women, both in the first and in the second generations. In the second generation in particular we can see that, for all groups alike, the net
14

unemployment rates decline over the life cycle and converge with that of the White British.
The absence of any ‘catching up’ over the life cycle of the first-generation men is one of our most striking and unexpected findings, and is in contrast to the usual finding of catching up in terms of income over the life cycle. Again, however, we can perhaps make sense of it in terms of the distinctive frames of reference of the labour migrants.
(Figures 4a and 4b about here)
Next, in Figures 4a and 4b we focus on the interactions with educational level. As in the case of the life cycle, we see rather different patterns of returns to education among the first and second generations. Once again, we see the familiar pattern of Black Africans, Black Caribbeans and Pakistani/Bangladeshis having higher unemployment rates at all educational levels. But the striking feature here is that, in the case of first-generation men, the percentage point gaps are very similar at all levels of education. Thus there is a gap of around six percentage points between the Black African and White British rates for men with primary qualifications and for those with degree qualifications. In the case of second generation men, however, there is a clear narrowing of the gap as we move from lower to higher qualification levels. This gradual narrowing of the gap is what we would expect given the likelihood of ‘floor’ and ‘ceiling’ effects and represents the normal profile. Once again, the difference between the first and second generations is less clear in the case of women.
(Figures 5a and 5b about here)
Finally in Figures 5a and 5b we focus on the patterns across periods. Here we show line graphs comparing net unemployment rates (for married men and women with secondary qualifications and 10-15 years in the labour market). Here we see clearly the net unemployment rates rising for all groups alike in the middle period before declining in the third period. But even in the third period the ethnic penalties are in absolute terms larger than in the first period. Whereas the percentage point gaps in the first period were only around a couple of points, the gaps reach six points or more in the third period for the three most disadvantaged groups.
We began this paper asking about the extent to which ethnic minorities have ‘caught up’ with the majority population across the life-cycle, across generations and across time and whether the extent of the ‘catching up’ varied between minority groups with those from developing countries making less progress than groups from developed countries.
The story is a complex one, and varies somewhat for men and women. But in general there is little evidence of catching up on the part of the most disadvantaged groups – Black Africans, Black Caribbeans and Pakistanis and Bangladeshis - either over the life cycle, generations, or historical time. However, the main dividing line is not a simple one between migrants from developing and developed countries. While the various White groups had relatively little catching up to do and show trajectories that are fairly similar to those of the White British majority population, they are also joined by the Indians and Chinese minorities. We do not find, then, a simple
15

distinction between visible and white minorities or those from developed and developing countries.
How are we to account for these patterns? One possibility is that there is more discrimination against the Black Africans, Black Caribbeans and Pakistanis/Bangladeshis than there is against Indians and Chinese. It is likely that racial discrimination is wide-spread in Britain, but it is not at all clear that Indians suffer less discrimination than Pakistanis. While there have been no recent field experiments that would permit a rigorous test of this, self-report evidence indicates that Indians, Black Caribbeans and Pakistanis experience rather similar levels of discrimination (Heath and Cheung 2006). We think it is more likely, then, that the Indians and Chinese have other features, perhaps community structures and enclave economies, that allow them to offset discrimination.
As we have noted throughout this paper, processes may operate rather differently for the classic migrant worker groups and for other groups who were ‘human capital rich’. While all groups alike probably include some less-skilled migrant workers, it is probably fair to say that both the Chinese and Indian groups included proportions of highly-qualified migrants and of entrepreneurs who could take the lead in developing ethnic enclave economies. This would have been particularly true for the East African Indians many of whom held dominant positions in the economy prior to independence and were expelled from these countries following independence and Africanization. Both Indians and Chinese may thus have benefited from ethnic enclave economies which might have provided the employment opportunities denied to their peers in the wider economy.4
In addition, the fact that Indian and Chinese communities are socially and occupationally more diverse, with highly qualified members as well as low skilled ones, may have other benefits for their members in addition to the provision of employment opportunities in ethnic businesses. Wilson has powerfully suggested the importance of community leaders and community structures in the context of African American disadvantage and recent discussions of social capital suggest further possible mechanisms. Our focus here would not be so much on the social capital that bridges the minority/majority divide as on that which, within the ethnic community, bridges high-skilled and low-skilled members and hence can provide assistance to the more disadvantaged members of the community.
While we suspect that community structures may be important in explaining differences between the more and less disadvantaged minorities, frames of reference may be important in explaining patterns of catching up, or failure to catch up, across the life cycle, across generations and across time.
Our explanation for the failure to catch up across generations is that the first generation had what economists term lower ‘reservation wages’ than the native-born British. These low reservation wages would have masked their other disadvantages in 4 Further analysis confirms this hypothesis. Constructing a variable for annual proportion of non-White self-employed by region as a contextual variable for ethnic enclave and including this in an interaction with ethno-generation, we find, controlling for all other variables in Model 6, that where there is a high concentration of ethnic entrepreneurship, second-generation Indian men were less likely to be unemployed whereas the two Black groups and the Pakistani/Bangladeshi men of both generations were, if anything, more likely to be unemployed. Data are not presented but are available on request.
16
the labour market such as lack of fluency in English, lack of British qualifications, and so on. However, the second generation will likely have similar expectations to their White British peers and similar conceptions of reservation wages. In other words, the first generation, particularly members of the migrant labour groups, may not have expected to be treated in the same was as the White British or to have the same opportunities, and their comparative reference group might be their families and peers in their country of origin. But this will not hold for the second generation, who will expect to be treated like their White British peers. Changing frames of reference between the first and second generations may therefore help to explain the absence of inter-generational progress.
Changing frames of reference might also explain some of the life cycle processes. Just as the second generation might come to have different frames of reference from the first generation, so might the first generation develop different frames of reference the longer they remain in Britain. Expectations about the kind of wage that was acceptable might gradually assimilate to that of the White British the longer they remained in Britain. It should also be noted that there might be some selection effects, since we do not have an actual panel study, with some new migrants later returning to their countries of origin and those who remained longer in Britain being perhaps less oriented to their home countries and with higher reservation wages. Length of residence might also increase familiarity with, and eligibility for, the British social security system and the ability to secure benefits when out of work.
Turning to trends over historical time, we suggested in the introduction that we might expect some narrowing of gaps over time because of the passing of anti-discrimination legislation and the gradual development, especially among younger people, of tolerance and an ethos of multiculturalism. But the anticipated narrowing of the gaps over historical time has not occurred. This suggests that legislation, official ethos, and indeed public attitudes may be very weak drivers of change.
Alternatively, it may well be that any improvement in the treatment experienced by minorities has been matched by rising expectations on their part about the standards of fair treatment to which they are entitled. Legislation outlawing racial discrimination may not only affect the behaviour of White employers but may also affect the expectations of minority workers. Increased contact between minorities and majorities may increase tolerance but may also lead to a convergence in expectations. In other words, there may be a revolution of rising expectations over time.
It is not of course possible to test these suggestions from the data currently available. We would however suggest that changing expectations may well be a parsimonious explanation for some of the puzzling findings that our research has generated.
17

ReferencesBerthoud, R. (2000). Ethnic employment penalties in Britain. Journal of Ethnic and
Migration Studies, 26, 389-416.Borjas, G. (1992) ‘Ethnic Capital and Intergenerational Mobility’, Quarterly Journal
of Economics, 107: 123-50.Borjas, G. (1995) ‘Ethnicity, Neighborhoods and Human Capital Externalities’,
American Economic Review, 85: 365-90.Cheung, S. and Heath, A. (2007) ‘N ICE WORK IF YOU CAN GET IT: ETHNIC PENALTIES IN
GREAT BRITAIN’, in Heath, A. and Cheung, S. (2007) (eds) Unequal Chances: Ethnic Minorities in Western Labour Markets. Oxford University Press.
Chun, H. and Lee, I. (2001) ‘Why do married men earn more: productivity or marriage selection? Economic Inquiry 39(2): 307-19.
Daley, P. (1996) Black-African: students who stayed. In C. Peach (ed.) Ethnicity in the 1991 Census, volume 2. London: HMSO, pp. 44-65.
Daniel, W.W. (1968) Racial Discrimination in England, London: Penguin.Gordon, M. (1964) Assimilation in American Life: The role of race, religion and
national origins, New York: OUP.Heath, A. F. (1981) Social Mobility, London: Fontana.Heath, A. and McMahon, D. (1997) ‘Education and occupational attainments: the impact
of ethnic origins’, in Karn, V. (ed.) Ethnicity in the 1991 Census: Employment, education and housing among the ethnic minority populations of Britain. London: HMSO.
Heath, A. F. and Yu, S. (2004) ‘The puzzle of ethnic minority disadvantage’. In A F Heath, J Ermisch and D Gallie (eds) Understanding Social Change. Proceedings of the British Academy. Oxford: Oxford University Press.
Heath, A. F. and Cheung, S. (2006) Ethnic Penalties in the Labour Market: Employers and Discrimination, Department for Work and Pensions, Research Report No 341. Published for the Department for Work and Pensions by Corporate Document Services, Leeds. www.dwp.gov.uk/asd/asd5/rrs2006.asp
Heath, A. (2007) ‘Ethnic minority disadvantage in cross-national perspective’, in Heath, A. and Cheung, S. (2007) (eds) Unequal Chances: Ethnic Minorities in Western Labour Markets. Oxford University Press, Chapter 1.
Heath, A. and Y. Li. (2007) ‘Measuring the size of the employer contribution to the ethnic minority employment gap’, consultation paper for NEP.
Kalter, F. and Kogan, I. (2006) ‘Ethnic inequalities at the transition from school to work in Belgim and Spain: Discrimination or self-exclusion?’ Research in Social Stratification and Mobiliity, 24: 259-74.
Leslie, D., Drinkwater, S. and O'Leary, N. (1998). Unemployment and earnings among Britain's ethnic minorities: some signs for optimism. Journal of Ethnic and Migration Studies, 24, 489-506.
Li, Y. (2007) ‘Assessing Data Needs and Gaps for Researching Ethnic Minority Entrepreneurship’, for the ESRC/DTI/CRE/EMDA.
Li, Y. and Heath, A. (2007) ‘Ethnic minority men in British labour market (1972-2005)’, International Journal of Sociology and Social Policy.
Li, Y. (2004) ‘Samples of Anonymised Records (SARs) from the UK Censuses: A Unique Source for Social Science Research’, Sociology 38(3): 553-72.
Model, S. (1999). Ethnic inequality in England: an analysis based on the 1991 Census. Ethnic and Racial Studies, 22, 966-990.
18

Rothon C and Anthony Heath (2003) Trends in racial prejudice. Pp 189-213 in Alison Park et al (eds) British Social Attitudes, the 20th Report: Continuity and change over two decades. London: Sage.
Van Tubergen, F. & Kalmijn, M. (2005) ‘Destination-Language Proficiency in Cross-National Perspective: A Study of Immigrant Groups in Nine Western Countries’, American Journal of Sociology, 110, pp. 1412-1457.
19

Table 1 Sample characteristics on key variables (column % or means)
Men WomenEthnicity
W British 90.7 89.92ndg W Irish 0.4 0.42ndg W Other 1.3 1.42ndg B Caribbean 0.5 .072ndg B African 0.2 0.22ndg Indian 0.9 0.82ndg Pakistani/Bangladeshi 0.7 0.52ndg Chinese 0.1 0.12ndg Other 0.8 0.81stg W Irish 0.6 0.61stg W Other 1.3 1.71stg B Caribbean 0.3 0.31stg B African 0.3 0.31stg Indian 0.8 0.81stg Pakistani/Bangladeshi 0.5 0.61stg Chinese 0.2 0.21stg Other 0.6 0.6
Employment statusEmployed 79.0 64.7Unemployed 7.4 4.9Inactive 13.6 30.4
Educational qualificationsNo qualifications 28.7 33.6Primary 12.2 14.9O Levels or equivalent 15.9 22.6A Levels or equivalent 24.9 12.7First degree 15.7 14.6Higher degree 2.6 1.6
Marital statusMarried/cohabiting 66.7 65.8Once married (separated, divorced, widowed) 6.3 10.7Never married (single) 27.0 23.5
Having limiting long-term illness 14.8 13.3Years in the labour market (mean) 21.4 19.7Number of dependent children under 16 (mean) 0.69 0.83
N 989,407 963,489
Notes: 1. For men aged 16-64 and women aged 16-59 in Great Britain (same below).2. 2nd generation refers to ethnic minority groups who were born in or who came
to the UK by the age of 16. 0.26% of White British were born overseas but are coded as the UK-born into ‘White British’ (same below).
3. Respondents with missing data on the key variables in the table are omitted from analysis here (same below in the modelling tables and in the figures based on the predicted values from the models).
Source: The pooled GHS/LFS (1972-2005) (same below).
20

Figure 1 Unemployment rates for men and women
010
20
30
40
50
Pe
rcen
t
1972 1975 1978 1981 1984 1987 1990 1993 1996 1999 2002 2005Year
W British W Irish W Other B CaribbeanB African Indian Pak/Bang Chinese
Probablity of being unemployed for men
Note: Data for Chinese and Pakistani/Bangladeshi not presented before 1983 due to small samples.
Source: Pooled data of GHS/LFS (1972-2005).
01
02
03
04
05
0P
erc
en
t
1972 1975 1978 1981 1984 1987 1990 1993 1996 1999 2002 2005Year
W British W Irish W Other B CaribbeanB African Indian Pak/Bang Chinese
Probablity of being unemployed for women
Note: Data for Chinese and Pakistani/Bangladeshi not presented before 1983 due to small samples.
Source: Pooled data of GHS/LFS (1972-2005).
21

Table 2 Heckman’s Probit Model on Men’s Unemployment
(1) (2) (3) (4) (5) (6)APG +HC +Gen*Year +Gen*Ed +Gen*Per +Gen*%Un
Probit models2ndg W Irish 0.261*** 0.199*** 0.215*** 0.257** 0.296* 0.2562ndg W Other -0.036* 0.030 0.041 -0.119* -0.222* -0.0042ndg B Caribbean 0.452*** 0.398*** 0.477*** 0.516*** 0.374*** 0.295*2ndg B African 0.333*** 0.422*** 0.399*** 0.317** -0.018 -0.668**2ndg Indian 0.079*** 0.121*** 0.133*** 0.073 -0.016 0.0402ndg Pak/Ban 0.450*** 0.369*** 0.284*** 0.141** 0.142 0.1352ndg Chinese -0.180** -0.126 0.008 -0.822*** -1.048** -0.2082ndg Other 0.199*** 0.199*** 0.218*** 0.051 -0.306*** -0.420***1stg W Irish 0.262*** 0.202*** 0.178** 0.305*** 0.513*** 0.587***1stg W Other -0.014 -0.017 -0.070 -0.400*** -0.419*** -0.323*1stg B Caribbean 0.402*** 0.295*** -0.024 -0.306* -0.345* -0.1961stg B African 0.395*** 0.467*** 0.355*** 0.058 -0.166 -0.723**1stg Indian 0.148*** 0.144*** -0.019 -0.059 0.073 0.1201stg Pak/Ban 0.592** 0.498** 0.093 -0.026 0.205 -0.0421stg Chinese -0.010 -0.051 -0.164 -0.128 -0.215 0.5021stg Other 0.203*** 0.213*** 0.059 -0.206** -0.279 -0.390Years in LM/10 -0.269*** -0.226*** -0.225*** -0.225*** -0.226*** -0.228***Years in LM/10 sq 0.039*** 0.020*** 0.020*** 0.020*** 0.020*** 0.021***1980-1996 0.381*** 0.487*** 0.486*** 0.486*** 0.365*** 0.077***1997-2005 0.060*** 0.241*** 0.241*** 0.242*** Primary -0.230*** -0.230*** -0.059*** -0.058*** -0.039***O Levels -0.395*** -0.396*** -0.058*** -0.058*** -0.045***A Levels -0.497*** -0.498*** 0.010 0.010 0.019First degree -0.720*** -0.721*** -0.049*** -0.049*** -0.046**Higher Degree -0.820*** -0.819*** Once Married 0.377*** 0.377*** 0.377*** 0.377*** 0.385***Never married 0.140*** 0.139*** 0.139*** 0.139*** 0.143***2ndg W Irish*Years -0.006 -0.013 -0.010 -0.0042ndg W Other*Years -0.009 0.000 -0.001 -0.0032ndg B Car*Years -0.068** -0.070** -0.082*** -0.076**2ndg B Afr*Years 0.022 0.020 0.017 0.0032ndg Indian*Years -0.016 -0.009 -0.013 -0.0132ndg Pak/Ban*Years 0.070*** 0.093*** 0.093*** 0.096***2ndg B Chinese*Years -0.163* -0.015 -0.017 -0.0182ndg B Other*Years -0.023 -0.009 -0.003 -0.0091stg W Irish*Years 0.009 -0.008 -0.003 -0.0171stg W Other*Years 0.025 0.061*** 0.061*** 0.058***1stg B Car*Years 0.096** 0.128*** 0.126*** 0.121***1stg B Afr*Years 0.059 0.083** 0.076* 0.0631stg Indian*Years 0.063*** 0.067*** 0.070*** 0.069***1stg Pak/Ban*Years 0.163*** 0.171*** 0.166*** 0.159***1stg Chinese*Years 0.057 0.049 0.049 0.0441stg Other*Years 0.077*** 0.102*** 0.099*** 0.097***Education -0.172*** -0.172*** -0.166***2ndg W Irish*education -0.014 -0.012 -0.0072ndg W Other*education 0.046** 0.044** 0.044**2ndg B Car*education -0.016 -0.023 -0.0232ndg B Afr*education 0.024 0.009 0.0082ndg Indian*education 0.015 0.011 0.0072ndg Pak/Ban*education 0.048*** 0.048** 0.044**2ndg Chinese*education 0.206** 0.200** 0.195**2ndg Other*education 0.054*** 0.026 0.0161stg W Irish*education -0.041* -0.030 -0.0301stg W Other*education 0.095*** 0.095*** 0.095***1stg B Car*education 0.098*** 0.096*** 0.096***1stg B Afr*education 0.076** 0.075** 0.070**
22

1stg Indian*education 0.014 0.017 0.0141stg Pak/Ban*education 0.053** 0.055** 0.052**1stg Chinese*education -0.012 -0.013 -0.0181stg Other*education 0.075*** 0.075*** 0.071***period 0.117*** 0.082***2ndg W Irish*period -0.024 -0.0512ndg W Other*period 0.050 -0.0062ndg B Car*period 0.078 0.0632ndg B Afr*period 0.168* 0.207**2ndg Indian*period 0.047 0.0272ndg Pak/Ban*period 0.001 -0.0032ndg Chinese*period 0.103 -0.0952ndg Other*period 0.197*** 0.201***1stg W Irish*period -0.120* -0.153**1stg W Other*period 0.008 -0.0301stg B Car*period 0.024 -0.0191stg B Afr*period 0.099 0.185**1stg Indian*period -0.067 -0.096*1stg Pak/Ban*period -0.096* -0.0531stg Chinese*period 0.039 -0.1311stg Other*period 0.033 0.037Annual % Un by region 0.051***2ndg W Irish*annual%un_reg 0.0092ndg W Other*annual%un_reg -0.0072ndg B Car*annual%un_reg 0.0112ndg B Afr*annual%un_reg 0.058***2ndg Indian*annual%un_reg -0.0002ndg Pak/Ban*annual%un_reg 0.0022ndg Chinese*annual%un_reg -0.0382ndg Other*annual%un_reg 0.016**1stg W Irish*annual%un_reg 0.0051stg W Other*annual%un_reg 0.0011stg B Car*annual%un_reg -0.0051stg B Afr*annual%un_reg 0.038***1stg Indian*annual%un_reg 0.0021stg Pak/Ban*annual%un_reg 0.016*1stg Chinese*annual%un_reg -0.0311stg Other*annual%un_reg 0.011
Constant -1.422*** -1.270*** -1.266*** -1.088*** -1.200*** -1.440***Rho 0.788*** 0.696*** 0.691*** 0.692*** 0.690*** 0.709***N 989407 989407 989407 989407 989407 989407
LR test of ind. eqn.(rho=0):chi2(df) 4263.87*** 3450.71*** 3411.39*** 3426.01*** 3405.47*** 3558.26***
LR test of add. var:chi2(df) 26044.82*** 2068.57*** 612.36*** 241.83*** 187.87***
Notes:1. Significance tests are conducted for the ethnic minority groups with White British as the reference group.
*p<0.05, ** p<0.01 and *** p<0.001 (same below).2. The coefficients for the selection model is placed in Appendix 2.
23
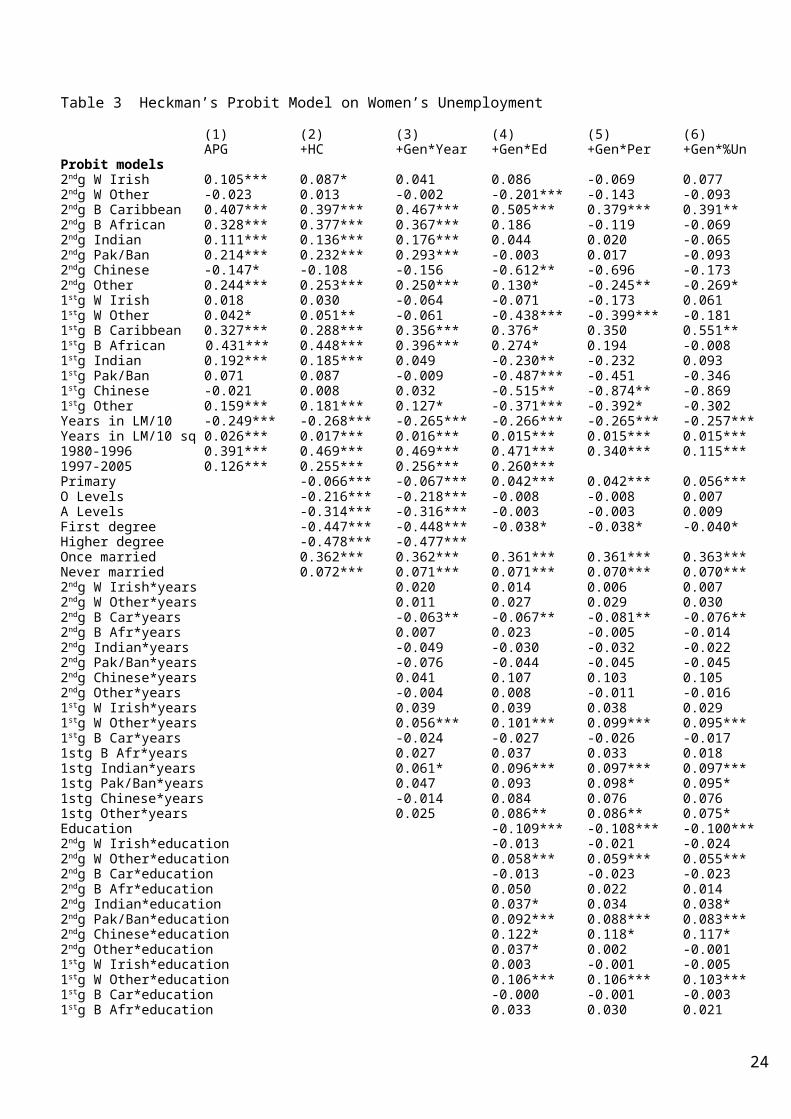
Table 3 Heckman’s Probit Model on Women’s Unemployment
(1) (2) (3) (4) (5) (6)APG +HC +Gen*Year +Gen*Ed +Gen*Per +Gen*%Un
Probit models2ndg W Irish 0.105*** 0.087* 0.041 0.086 -0.069 0.0772ndg W Other -0.023 0.013 -0.002 -0.201*** -0.143 -0.0932ndg B Caribbean 0.407*** 0.397*** 0.467*** 0.505*** 0.379*** 0.391**2ndg B African 0.328*** 0.377*** 0.367*** 0.186 -0.119 -0.0692ndg Indian 0.111*** 0.136*** 0.176*** 0.044 0.020 -0.0652ndg Pak/Ban 0.214*** 0.232*** 0.293*** -0.003 0.017 -0.0932ndg Chinese -0.147* -0.108 -0.156 -0.612** -0.696 -0.1732ndg Other 0.244*** 0.253*** 0.250*** 0.130* -0.245** -0.269*1stg W Irish 0.018 0.030 -0.064 -0.071 -0.173 0.0611stg W Other 0.042* 0.051** -0.061 -0.438*** -0.399*** -0.1811stg B Caribbean 0.327*** 0.288*** 0.356*** 0.376* 0.350 0.551**1stg B African 0.431*** 0.448*** 0.396*** 0.274* 0.194 -0.0081stg Indian 0.192*** 0.185*** 0.049 -0.230** -0.232 0.0931stg Pak/Ban 0.071 0.087 -0.009 -0.487*** -0.451 -0.3461stg Chinese -0.021 0.008 0.032 -0.515** -0.874** -0.8691stg Other 0.159*** 0.181*** 0.127* -0.371*** -0.392* -0.302Years in LM/10 -0.249*** -0.268*** -0.265*** -0.266*** -0.265*** -0.257***Years in LM/10 sq 0.026*** 0.017*** 0.016*** 0.015*** 0.015*** 0.015***1980-1996 0.391*** 0.469*** 0.469*** 0.471*** 0.340*** 0.115***1997-2005 0.126*** 0.255*** 0.256*** 0.260*** Primary -0.066*** -0.067*** 0.042*** 0.042*** 0.056***O Levels -0.216*** -0.218*** -0.008 -0.008 0.007A Levels -0.314*** -0.316*** -0.003 -0.003 0.009First degree -0.447*** -0.448*** -0.038* -0.038* -0.040*Higher degree -0.478*** -0.477*** Once married 0.362*** 0.362*** 0.361*** 0.361*** 0.363***Never married 0.072*** 0.071*** 0.071*** 0.070*** 0.070***2ndg W Irish*years 0.020 0.014 0.006 0.0072ndg W Other*years 0.011 0.027 0.029 0.0302ndg B Car*years -0.063** -0.067** -0.081** -0.076**2ndg B Afr*years 0.007 0.023 -0.005 -0.0142ndg Indian*years -0.049 -0.030 -0.032 -0.0222ndg Pak/Ban*years -0.076 -0.044 -0.045 -0.0452ndg Chinese*years 0.041 0.107 0.103 0.1052ndg Other*years -0.004 0.008 -0.011 -0.0161stg W Irish*years 0.039 0.039 0.038 0.0291stg W Other*years 0.056*** 0.101*** 0.099*** 0.095***1stg B Car*years -0.024 -0.027 -0.026 -0.0171stg B Afr*years 0.027 0.037 0.033 0.0181stg Indian*years 0.061* 0.096*** 0.097*** 0.097***1stg Pak/Ban*years 0.047 0.093 0.098* 0.095*1stg Chinese*years -0.014 0.084 0.076 0.0761stg Other*years 0.025 0.086** 0.086** 0.075*Education -0.109*** -0.108*** -0.100***2ndg W Irish*education -0.013 -0.021 -0.0242ndg W Other*education 0.058*** 0.059*** 0.055***2ndg B Car*education -0.013 -0.023 -0.0232ndg B Afr*education 0.050 0.022 0.0142ndg Indian*education 0.037* 0.034 0.038*2ndg Pak/Ban*education 0.092*** 0.088*** 0.083***2ndg Chinese*education 0.122* 0.118* 0.117*2ndg Other*education 0.037* 0.002 -0.0011stg W Irish*education 0.003 -0.001 -0.0051stg W Other*education 0.106*** 0.106*** 0.103***1stg B Car*education -0.000 -0.001 -0.0031stg B Afr*education 0.033 0.030 0.021
24

1stg Indian*education 0.092*** 0.092*** 0.089***1stg Pak/Ban*education 0.189*** 0.187*** 0.178***1stg Chinese*education 0.127*** 0.119*** 0.119***1stg Other*education 0.134*** 0.133*** 0.132***Period 0.122*** 0.110***2ndg W Irish*period 0.092 0.0692ndg W Other*period -0.029 -0.0452ndg B Car*period 0.078 0.0392ndg B Afr*period 0.180* 0.1242ndg Indian*period 0.015 0.0022ndg Pak/Ban*period 0.000 0.0082ndg Chinese*period 0.045 -0.0882ndg Other*period 0.219*** 0.197***1stg W Irish*period 0.053 0.0111stg W Other*period -0.014 -0.073*1stg B Car*period 0.011 -0.0311stg B Afr*period 0.041 0.0341stg Indian*period 0.001 -0.0731stg Pak/Ban*period -0.013 -0.0501stg Chinese*period 0.166 0.1501stg Other*period 0.011 -0.029Annual % Un by region 0.051***2ndg W Irish*annual%_un_reg -0.0122ndg W Other*annual%_un_reg 0.0012ndg B Car*annual%_un_reg 0.0062ndg B Afr*annual%_un_reg 0.0132ndg Indian*annual%_un_reg 0.0122ndg Pak/Ban*annual%_un_reg 0.0162ndg Chinese*annual%_un_reg -0.0272ndg Other*annual%_un_reg 0.0111stg W Irish*annual%_un_reg -0.0141stg W Other*annual%_un_reg -0.0081stg B Car*annual%_un_reg -0.0181stg B Afr*annual%_un_reg 0.032*1stg Indian*annual%_un_reg -0.020*1stg Pak/Ban*annual%_un_reg -0.0011stg Chinese*annual%_un_reg 0.0041stg Other*annual%_un_reg 0.003
Constant -1.632*** -1.532*** -1.531*** -1.415*** -1.530*** -1.785***Rho 0.805*** 0.746*** 0.741*** 0.756*** 0.758*** 0.773***N 963489 963489 963489 963489 963489 963489
LR test of ind. eqn.(rho=0):chi2(df) 4113.20*** 3274.23*** 3257.01*** 3295.47*** 3311.48*** 3399.83***
LR test of add. var:chi2(df) 30019.49*** 743.72*** 678.35*** 611.57*** 129.58***
Notes:1. Significance tests are conducted for the ethnic minority groups with White British as the reference group.
*p<0.05, ** p<0.01 and *** p<0.001 (same below).2. The coefficients for the selection model is placed in Appendix 2.
25
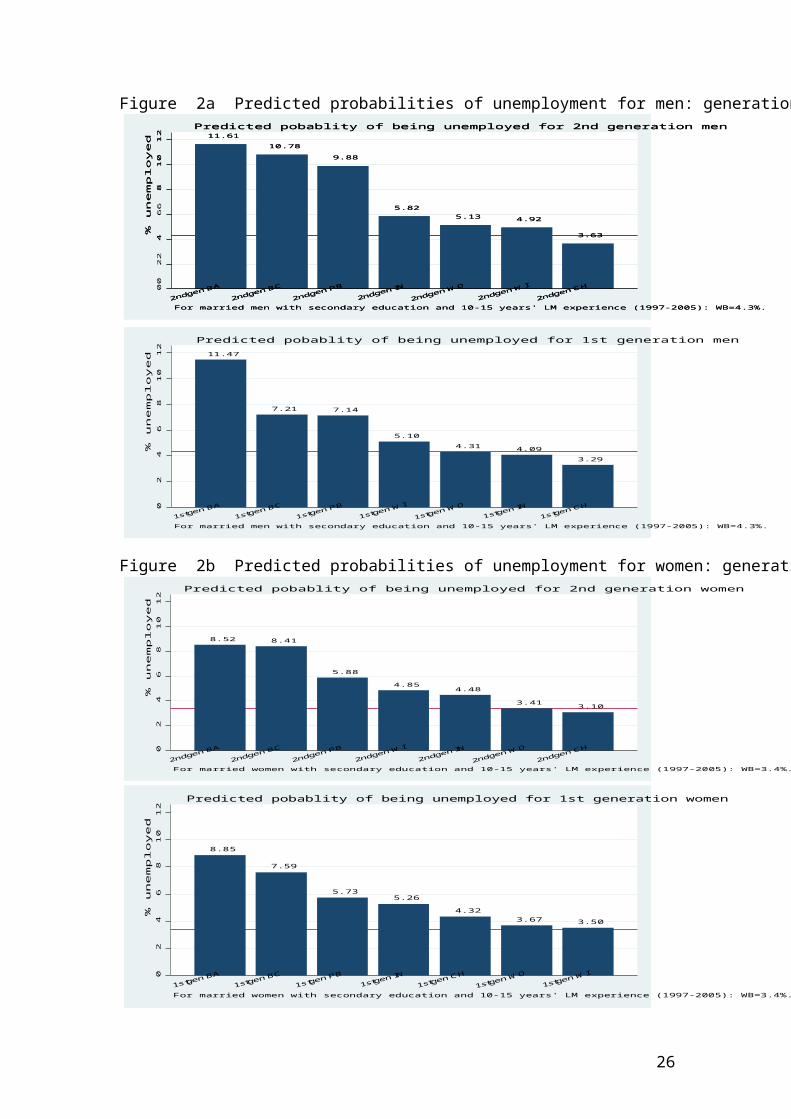
Figure 2a Predicted probabilities of unemployment for men: generational effects
11.6111.61
10.7810.78
9.889.88
5.825.825.135.13 4.924.92
3.633.63
00
22
4466
8810
10
12
12
% u
ne
mp
loyed
% u
ne
mp
loyed
2ndgen BA
2ndgen BA
2ndgen BC
2ndgen BC
2ndgen PB
2ndgen PB
2ndgen IN
2ndgen IN
2ndgen WO
2ndgen WO
2ndgen WI
2ndgen WI
2ndgen CH
2ndgen CH
Predicted pobablity of being unemployed for 2nd generation menPredicted pobablity of being unemployed for 2nd generation men
For married men with secondary education and 10-15 years' LM experience (1997-2005): WB=4.3%.For married men with secondary education and 10-15 years' LM experience (1997-2005): WB=4.3%.
11.47
7.21 7.14
5.10
4.31 4.09
3.29
02
46
810
12
% u
ne
mp
loye
d
1stgen BA
1stgen BC
1stgen PB
1stgen WI
1stgen WO
1stgen IN
1stgen CH
Predicted pobablity of being unemployed for 1st generation men
For married men with secondary education and 10-15 years' LM experience (1997-2005): WB=4.3%.
Figure 2b Predicted probabilities of unemployment for women: generational effects
8.52 8.41
5.88
4.854.48
3.413.10
02
46
81
012
% u
ne
mplo
ye
d
2ndgen BA
2ndgen BC
2ndgen PB
2ndgen WI
2ndgen IN
2ndgen WO
2ndgen CH
Predicted pobablity of being unemployed for 2nd generation women
For married women with secondary education and 10-15 years' LM experience (1997-2005): WB=3.4%.
8.85
7.59
5.735.26
4.323.67 3.50
02
46
81
01
2
% u
ne
mp
loye
d
1stgen BA
1stgen BC
1stgen PB
1stgen IN
1stgen CH
1stgen WO
1stgen WI
Predicted pobablity of being unemployed for 1st generation women
For married women with secondary education and 10-15 years' LM experience (1997-2005): WB=3.4%.
26

Figure 3a Predicted probabilities of unemployment for men: life cycle effects
03
69
12 1
5 1
8 2
1 2
4
% u
ne
mp
loye
d
0 3 6 9 12 15 18 21 24 27 30 33 36 39 42 45 48Years in the labour market
W British W IrishW Other B CaribbeanB African IndianPak/Bang Chinese
Predicted pobablity of being unemployed for 2nd generation men
For married men with secondary education (1997-2005).
03
69
12 1
5 1
8 2
1 2
4
% u
ne
mp
loye
d
0 3 6 9 12 15 18 21 24 27 30 33 36 39 42 45 48Years in the labour market
W British W IrishW Other B CaribbeanB African IndianPak/Bang Chinese
Predicted pobablity of being unemployed for 1st generation men
For married men with secondary education (1997-2005).
Figure 3b Predicted probabilities of unemployment for women: life cycle effects
03
69
12
15
18
21
24
% u
ne
mplo
ye
d
0 2 4 6 8 10 12 14 16 18 20 22 24 26 28 30 32 34 36 38 40 42 44Years in the labour market
W British W IrishW Other B CaribbeanB African IndianPak/Bang Chinese
Predicted pobablity of being unemployed for 2nd generation women
For married women with secondary education (1997-2005).
03
69
12 1
5 1
8 2
1 2
4
% u
nem
plo
yed
0 2 4 6 8 10 12 14 16 18 20 22 24 26 28 30 32 34 36 38 40 42 44Years in the labour market
W British W IrishW Other B CaribbeanB African IndianPak/Bang Chinese
Predicted pobablity of being unemployed for 1st generation women
For married women with secondary education (1997-2005).
27

Figure 4a Predicted probabilities of unemployment for men: educational effects
03
69
12 1
5 1
8 2
1 2
4
% u
ne
mp
loyed
No qual
No qual
Primary
No qual
Primary
O Level
No qual
Primary
O Level
A Level
No qual
Primary
O Level
A LevelDegree
No qual
Primary
O Level
A LevelDegree
Hi Deg
Educational qualifications
W British W IrishW Other B CaribbeanB African IndianPak/Bang Chinese
Predicted pobablity of being unemployed for 2nd generation men
For married men with 10-15 years' experience in the labour market (1997-2005).
03
69
12 1
5 1
8 2
1 2
4
% u
ne
mp
loye
d
No qualNo qual
Primary
No qualPrim
aryO Level
No qualPrim
aryO Level
A LevelNo qual
Primary
O LevelA Level
DegreeNo qual
Primary
O LevelA Level
DegreeHi Deg
Educational qualifications
W British W IrishW Other B CaribbeanB African IndianPak/Bang Chinese
Predicted pobablity of being unemployed for 1st generation men
For married men with 10-15 years' experience in the labour market (1997-2005).
Figure 4b Predicted probabilities of unemployment for women: educational effects
03
69
12
15
18
21
24
% u
ne
mplo
ye
d
No qualNo qual
Primary
No qualPrim
aryO Level
No qualPrim
aryO Level
A LevelNo qual
Primary
O LevelA Level
DegreeNo qual
Primary
O LevelA Level
DegreeHi Deg
Educational qualifications
W British W IrishW Other B CaribbeanB African IndianPak/Bang Chinese
Predicted pobablity of being unemployed for 2nd generation women
For married women with 10-15 years' experience in the labour market (1997-2005).
03
69
12 1
5 1
8 2
1 2
4
% u
ne
mp
loye
d
No qualNo qual
Primary
No qualPrim
aryO Level
No qualPrim
aryO Level
A LevelNo qual
Primary
O LevelA Level
DegreeNo qual
Primary
O LevelA Level
DegreeHi Deg
Educational qualifications
W British W IrishW Other B CaribbeanB African IndianPak/Bang Chinese
Predicted pobablity of being unemployed for 1st generation women
For married women with 10-15 years' experience in the labour market (1997-2005).
28
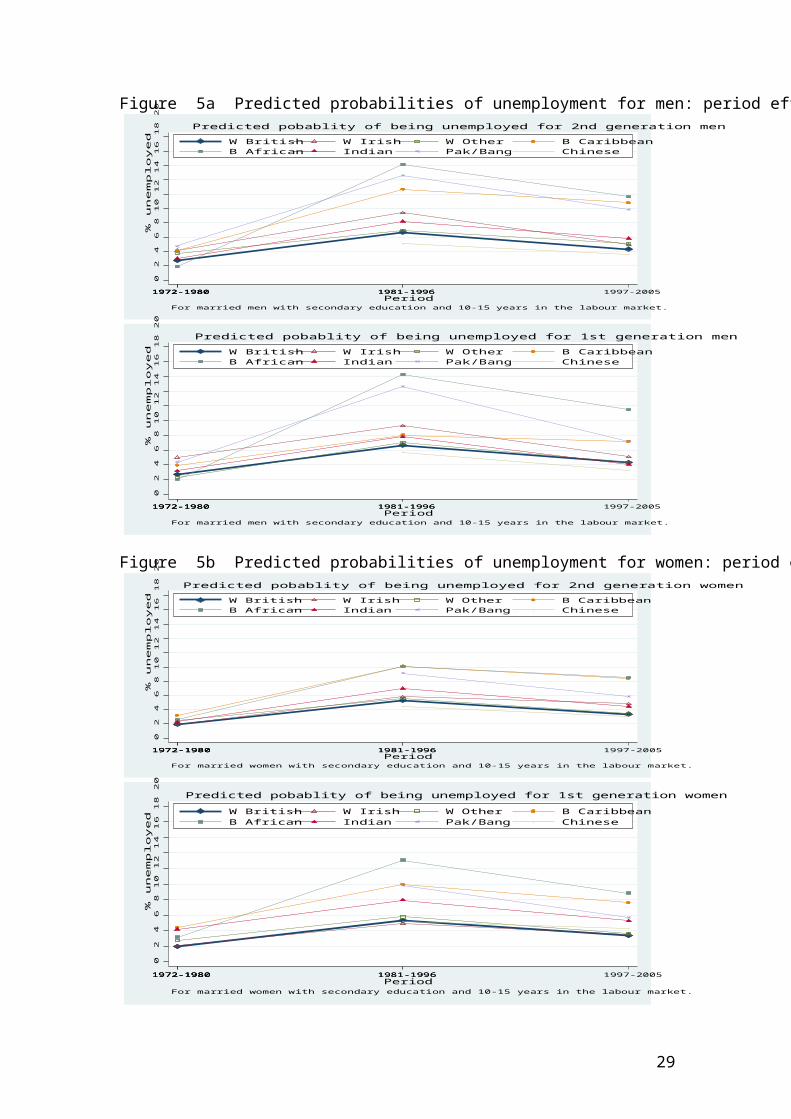
Figure 5a Predicted probabilities of unemployment for men: period effects
02
46
8 1
0 1
2 1
4 1
6 1
8 2
0%
une
mp
loyed
1972-19801972-1980 1981-19961972-1980 1981-1996 1997-2005Period
W British W Irish W Other B CaribbeanB African Indian Pak/Bang Chinese
Predicted pobablity of being unemployed for 2nd generation men
For married men with secondary education and 10-15 years in the labour market.
02
46
8 1
0 1
2 1
4 1
6 1
8 2
0%
un
em
plo
ye
d
1972-19801972-1980 1981-19961972-1980 1981-1996 1997-2005Period
W British W Irish W Other B CaribbeanB African Indian Pak/Bang Chinese
Predicted pobablity of being unemployed for 1st generation men
For married men with secondary education and 10-15 years in the labour market.
Figure 5b Predicted probabilities of unemployment for women: period effects
02
46
8 1
0 1
2 1
4 1
6 1
8 2
0%
une
mplo
ye
d
1972-19801972-1980 1981-19961972-1980 1981-1996 1997-2005Period
W British W Irish W Other B CaribbeanB African Indian Pak/Bang Chinese
Predicted pobablity of being unemployed for 2nd generation women
For married women with secondary education and 10-15 years in the labour market.
02
46
8 1
0 1
2 1
4 1
6 1
8 2
0%
une
mp
loye
d
1972-19801972-1980 1981-19961972-1980 1981-1996 1997-2005Period
W British W Irish W Other B CaribbeanB African Indian Pak/Bang Chinese
Predicted pobablity of being unemployed for 1st generation women
For married women with secondary education and 10-15 years in the labour market.
29

Appendix 1: Variable construction in the GHS/LFS
As noted in the text, we pooled together all the GHS and the LFS datasets available in the UK Data-Archive (up to Jan. 2007). Thus all the GHS datasets from 1972 to 2005 and all the LFS datasets from 1983 to 2005 were used (there were insufficient ethnic data in the earlier years of the LFS). The LFS became quarterly with a panel structure from the spring season of 1992 onwards. As Wave 1 data are obtained from face-to-face interviews (Waves 2-5 were telephone interviews with about 30% proxy answers), the data are presumably more reliable. We pooled all wave 1 data in each season of each year from 1992 to 2005 and sorted out the files by year. Altogether, 110 datasets were used in the GHS/LFS series. The pooled data set has around 4.7 million records with nearly 420 thousand minority ethnic members. This, to our knowledge, is the largest, most systematic, and most carefully-constructed data source ever assembled covering a long period of thirty-four consecutive years, with all the key variables coded to be consistent over time.
The construction of COT (consistent over time) variables for the GHS/LFS surveys was an exceedingly difficult and time-consuming task, demanding meticulous care to detail. This is because 110 datasets were involved and most of them used different coding schemes in the original data sets. Sometimes, the variable names lack any indication of the content (such as var28 for sex in GHS 1983). Frequently, many seemingly similar variables were available for a theme of interest and one had to inspect the questionnaire, coding and patterns in the adjacent years to find out exactly which of these were to be used. Every key variable in every dataset thus had to be thoroughly checked and the results recorded. Tens of hundreds or even thousands of hours were spent on finding out each of the key variables and their categories in the original data sets, and to be coded in a harmonised way.
The variables selected for standardisation were those that we deemed to be essential for our analysis, such as ethnicity, generation status, age, marital status, educational qualifications, employment status, class, earnings from the labour market, number of children in family unit, limiting long-term illness, and hours of work. For ethnicity, we differentiated nine main groups: White British, White Irish, White Other, Black Caribbean, Black African, Indian, Pakistani/Bangladeshi, Chinese and Other (including ‘Mixed’). This kind of differentiation is more detailed than is available in most existing research on ethnic relations using quantitative data and it has enabled us to conduct a thorough investigation of the economic situation of the various minority ethnic groups in Britain in the period covered. The ethnicity variable, combined with the generation variable discussed in the text, produced the 17-category variable on ethno-generation used in this paper. With regard to years in the labour market, we used the formula [yearlm = age – tea] where tea (terminating education age) is set at 16 for people with less than or equal to O Level or equivalent, 18 for people with A Level or equivalent, 22 for people with first degree and 25 for people with higher degrees (Masters and/or PhDs).
We would like to take this opportunity to thank Jane Roberts, Nuffield College, Oxford University, for coding some of the data in the earlier GHS series.
30

Appendix 2 Coefficients for selection models for Tables 2 and 3AT 1 Selection Models for Table 2
Selection models2ndg W Irish -0.097*** -0.068* -0.253*** -0.382** -0.189 -0.0332ndg W Other -0.116*** -0.137*** -0.260*** -0.398** -0.471*** -0.1792ndg B Caribbean -0.325*** -0.288*** -0.333*** -0.602*** -0.466*** -0.404**2ndg B African -0.676*** -0.688*** -0.839*** -1.409*** -1.451*** -1.561***2ndg Indian -0.412*** -0.433*** -0.697*** -1.256*** -1.318*** -1.202***2ndg Pak/Ban -0.561*** -0.550*** -0.757*** -0.921*** -0.788*** -0.528***2ndg Chinese -0.681*** -0.696*** -0.961*** -1.479*** -1.627*** -1.091**2ndg Other -0.387*** -0.377*** -0.561*** -0.698*** -0.467*** -0.214*1stg W Irish -0.037 -0.023 -0.177** -0.225* -0.207 -0.0151stg W Other -0.249*** -0.308*** -0.813*** -1.101*** -1.203*** -0.886***1stg B Caribbean -0.014 0.054 -1.040*** -1.055*** -0.692*** -0.3961stg B African -0.863*** -0.925*** -1.468*** -1.979*** -2.841*** -2.517***1stg Indian -0.117*** -0.175*** -0.398*** -0.395*** -0.326** -0.308*1stg Pak/Ban -0.393*** -0.410*** -0.747*** -0.624*** -0.617*** -0.524**1stg Chinese -0.833*** -0.876*** -1.677*** -1.988*** -2.228*** -2.163***1stg Other -0.782*** -0.847*** -1.551*** -1.884*** -2.549*** -2.287***Years in LM/10 1.289*** 1.227*** 1.211*** 1.212*** 1.212*** 1.213***Years in LM/10 sq -0.291*** -0.279*** -0.278*** -0.279*** -0.279*** -0.279***1980-1996 -0.494*** -0.510*** -0.512*** -0.513*** -0.511*** -0.499***1997-2005 -0.719*** -0.768*** -0.769*** -0.768*** -0.769*** -0.761***Primary 0.288*** 0.291*** 0.293*** 0.292*** 0.293***O Levels 0.135*** 0.132*** 0.122*** 0.123*** 0.123***A Levels 0.135*** 0.136*** 0.120*** 0.120*** 0.121***First degree 0.249*** 0.254*** 0.225*** 0.225*** 0.227***Higher degree 0.330*** 0.359*** 0.299*** 0.297*** 0.299***Once Married -0.322*** -0.324*** -0.324*** -0.325*** -0.325***Never married -0.208*** -0.210*** -0.209*** -0.209*** -0.211***2ndg W Irish*Years 0.067*** 0.080*** 0.086*** 0.086***2ndg W Other*Years 0.070*** 0.077*** 0.076*** 0.075***2ndg B Car*Years 0.032 0.044* 0.054* 0.054*2ndg B Afr*Years 0.182*** 0.191*** 0.192*** 0.192***2ndg Indian*Years 0.288*** 0.352*** 0.349*** 0.348*8*2ndg Pak/Ban*Years 0.209*** 0.232*** 0.239*** 0.239***2ndg Chinese*Years 0.346*** 0.419*** 0.417*** 0.414***2ndg Other*Years 0.178*** 0.187*** 0.183*** 0.178***1stg W Irish*Years 0.050** 0.055** 0.056** 0.056**1stg W Other*Years 0.207*** 0.237*** 0.241*** 0.242***1stg B Car*Years 0.304*** 0.305*** 0.312*** 0.320***1stg B Afr*Years 0.297*** 0.338*** 0.316*** 0.323***1stg Indian*Years 0.080*** 0.077*** 0.079*** 0.078***1stg Pak/Ban*Years 0.131*** 0.117*** 0.116*** 0.117***1stg Chinese*Years 0.401*** 0.446*** 0.446*** 0.446***1stg Other*Years 0.354*** 0.385*** 0.384*** 0.385***2ndg W Irish*education 0.041 0.049* 0.048*2ndg W Other*education 0.040*** 0.038*** 0.037***2ndg B Car*education 0.097*** 0.103*** 0.102***2ndg B Afr*education 0.172*** 0.171*** 0.172***2ndg B Indian*education 0.161*** 0.158*** 0.158***2ndg Pak/Ban*education 0.054** 0.061** 0.060**2ndg Chinese*education 0.136** 0.133** 0.131**2ndg Other*education 0.043*** 0.054*** 0.058***1stg W Irish*education 0.014 0.016 0.0131stg W Other*education 0.081*** 0.080*** 0.079***1stg B Car*education 0.003 0.020 0.0191stg B Afr*education 0.133*** 0.132*** 0.136***1stg Indian*education 0.000 0.002 0.0021stg Pak/Ban*education -0.047** -0.047** -0.047**
31

1stg Chinese*education 0.079*** 0.076** 0.076**1stg Other*education 0.093*** 0.097*** 0.099***2ndg W Irish*period -0.103* -0.124*2ndg W Other*period 0.034 -0.0202ndg B Car*period -0.070 -0.0802ndg B Afr*period 0.021 0.0202ndg Indian*period 0.032 0.0162ndg Pak/Ban*period -0.061 -0.113**2ndg Chinese*period 0.064 -0.0512ndg Other*period -0.112*** -0.133***1stg W Irish*period -0.011 -0.0331stg W Other*period 0.040 -0.0141stg B Car*period -0.187** -0.228***1stg B Afr*period 0.370*** 0.328***1stg Indian*period -0.033 -0.0351stg Pak/Ban*period -0.003 -0.0231stg Chinese*period 0.101 0.0881stg Other*period 0.260*** 0.210***2ndg W Irish*annual%un_reg -0.0122ndg W Other*annual%un_reg -0.019**2ndg B Car*annual%un_reg -0.0042ndg B Afr*annual%un_reg 0.0132ndg Indian*annual%un_reg -0.0092ndg Pak/Ban*annual%un_reg -0.015*2ndg Chinese*annual%un_reg -0.0292ndg Other*annual%un_reg -0.026**1stg W Irish*annual%un_reg -0.015*1stg W Other*annual%un_reg -0.023***1stg B Car*annual%un_reg -0.024**1stg B Afr*annual%un_reg -0.028***1stg Indian*annual%un_reg -0.0011stg Pak/Ban*annual%un_reg -0.0051stg Chinese*annual%un_reg -0.0041stg Other*annual%un_reg -0.017**LLT illness -1.299*** -1.267*** -1.270*** -1.272*** -1.272*** -1.273***No. dep. children -0.025*** -0.036*** -0.040*** -0.040*** -0.040*** -0.040***
Constant 1.281*** 1.322*** 1.356*** 1.368*** 1.367*** 1.356***Rho 0.788*** 0.696*** 0.691*** 0.692*** 0.690*** 0.709***
32

AT 2 Selection Models for Table 3
Selection models2ndg W Irish -0.019 -0.002 -0.071 0.158* 0.370*** 0.437***2ndg W Other -0.037** -0.088*** -0.097*** -0.081* -0.091 0.0842ndg B Caribbean 0.048** 0.009 -0.127*** -0.282*** 0.254*** 0.518***2ndg B African -0.363*** -0.417*** -0.614*** -0.880*** -0.426*** -0.360*2ndg Indian -0.168*** -0.167*** -0.336*** -0.577*** -0.350*** -0.411***2ndg Pak/Ban -0.635*** -0.571*** -0.474*** -0.798*** -0.109 0.1322ndg Chinese -0.377*** -0.393*** -0.661*** -0.728*** -0.230 -1.120**2ndg Other -0.128*** -0.143*** -0.266*** -0.276*** 0.102 0.190*1stg W Irish 0.027 0.006 -0.163*** -0.131* 0.020 0.0551stg W Other -0.266*** -0.320*** -0.508*** -0.384*** -0.298*** -0.1211stg B Caribbean 0.359*** 0.353*** 0.018 0.577*** 1.244*** 1.250***1stg B African -0.373*** -0.421*** -0.844*** -1.419*** -0.968*** -0.666***1stg Indian -0.300*** -0.261*** -0.294*** -0.338*** -0.065 0.0241stg Pak/Ban -1.380*** -1.254*** -1.302*** -1.652*** -1.001*** -0.874***1stg Chinese -0.564*** -0.584*** -1.006*** -1.265*** -0.706*** -0.821**1stg Other -0.557*** -0.577*** -1.003*** -1.348*** -1.093*** -0.690***Years in LM/10 0.668*** 0.715*** 0.708*** 0.707*** 0.707*** 0.707***Years in LM/10 sq -0.181*** -0.173*** -0.172*** -0.172*** -0.173*** -0.173***1980-1996 0.108*** 0.019*** 0.019*** 0.021*** 0.032*** 0.037***1997-2005 0.206*** 0.032*** 0.032*** 0.034*** 0.062*** 0.065***Primary 0.314*** 0.314*** 0.313*** 0.312*** 0.312***O Levels 0.369*** 0.367*** 0.363*** 0.359*** 0.359***A Levels 0.310*** 0.308*** 0.303*** 0.297*** 0.297***First degree 0.643*** 0.644*** 0.636*** 0.629*** 0.629***Higher degree 0.880*** 0.892*** 0.878*** 0.870*** 0.870***Once married 0.003 0.001 0.001 0.000 0.001Never married 0.171*** 0.170*** 0.170*** 0.170*** 0.170***2ndg W Irish*years 0.029 0.001 0.020 0.0192ndg W Other*years 0.004 0.003 0.003 0.0012ndg B Car*years 0.103*** 0.115*** 0.174*** 0.168***2ndg B Afr*years 0.214*** 0.233*** 0.237*** 0.237***2ndg Indian*years 0.149*** 0.185*** 0.195*** 0.198***2ndg Pak/Ban*years -0.123*** -0.081*** -0.053* -0.058*2ndg Chinese*years 0.278*** 0.286*** 0.309*** 0.323***2ndg Other*years 0.101*** 0.102*** 0.097*** 0.094***1stg W Irish*years 0.066*** 0.061*** 0.066*** 0.066***1stg W Other*years 0.089*** 0.074*** 0.073*** 0.074***1stg B Car*years 0.117*** 0.032 0.093*** 0.093**1stg B Afr*years 0.233*** 0.300*** 0.317*** 0.320***1stg Indian*years 0.015 0.021 0.034* 0.034*1stg Pak/Ban*years 0.023 0.056* 0.071** 0.071**1stg Chinese*years 0.210*** 0.254*** 0.264*** 0.264***1stg Other*years 0.210*** 0.253*** 0.255*** 0.258***2ndg W Irish*education -0.075*** -0.062*** -0.063***2ndg W Other*education -0.005 -0.005 -0.0062ndg B Car*education 0.051*** 0.090*** 0.088***2ndg B Afr*education 0.078*** 0.100*** 0.100***2ndg Indian*education 0.070*** 0.085*** 0.086***2ndg Pak/Ban*education 0.107*** 0.142*** 0.140***2ndg Chinese*education 0.017 0.040 0.0512ndg Other*education 0.003 0.040*** 0.040***1stg W Irish*education -0.009 0.001 0.0011stg W Other*education -0.035*** -0.032*** -0.032***1stg B Car*education -0.154*** -0.101*** -0.101***1stg B Afr*education 0.164*** 0.170*** 0.173***1stg Indian*education 0.013 0.025* 0.025*1stg Pak/Ban*education 0.159*** 0.172*** 0.173***1stg Chinese*education 0.064*** 0.073*** 0.074***
33

1stg Other*education 0.098*** 0.102*** 0.101***2ndg W Irish*period -0.139*** -0.139***2ndg W Other*period 0.004 -0.0252ndg B Car*period -0.314*** -0.344***2ndg B Afr*period -0.226*** -0.226***2ndg Indian*period -0.121*** -0.115***2ndg Pak/Ban*period -0.317*** -0.361***2ndg Chinese*period -0.241** -0.0572ndg Other*period -0.214*** -0.218***1stg W Irish*period -0.088** -0.088**1stg W Other*period -0.040* -0.065***1stg B Car*period -0.460*** -0.459***1stg B Afr*period -0.199*** -0.228***1stg Indian*period -0.146*** -0.156***1stg Pak/Ban*period -0.294*** -0.318***1stg Chinese*period -0.245*** -0.219**1stg Other*period -0.109*** -0.181***2ndg W Irish*annual%_un_reg -0.0082ndg W Other*annual%_un_reg -0.015***2ndg B Car*annual%_un_reg -0.023***2ndg B Afr*annual%_un_reg -0.0092ndg Indian*annual%_un_reg 0.0062ndg Pak/Ban*annual%_un_reg -0.018*2ndg Chinese*annual%_un_reg 0.056**2ndg Other*annual%_un_reg -0.0111stg W Irish*annual%_un_reg -0.0051stg W Other*annual%_un_reg -0.018***1stg B Car*annual%_un_reg -0.0011stg B Afr*annual%_un_reg -0.035**1stg Indian*annual%_un_reg -0.0091stg Pak/Ban*annual%_un_reg -0.0101stg Chinese*annual%_un_reg 0.0071stg Other*annual%_un_reg -0.033***LLT illness -0.837*** -0.807*** -0.808*** -0.808*** -0.809*** -0.810***No. dep. Children -0.361*** -0.331*** -0.332*** -0.332*** -0.333*** -0.333***
Constant 0.536*** 0.176*** 0.191*** 0.193*** 0.182*** 0.178***Rho 0.805*** 0.746*** 0.741*** 0.756*** 0.758*** 0.773***
34