hdr03-17 backmatter2-051903.qxd 02/06/03 14:45 page …. calculating... · sudhir anand and amartya...
TRANSCRIPT

340 HUMAN DEVELOPMENT REPORT 2003
Knowledge
Gross enrolment ratio(GER)
Adult literacy rate
GER indexAdult literacy index
Education indexLife expectancy index
Human development index (HDI)
Life expectancyat birth
GDP index
GDP per capita(PPP US$)
DIMENSION
INDICATOR
DIMENSIONINDEX
A long andhealthy life
A decent standardof living
Political participationand decision-making
Economic participationand decision-making
Gender empowerment measure (GEM)
Power overeconomic resources
Female and male sharesof parliamentary seats
EDEP forparliamentary representation
EDEP foreconomic participation
EDEP forincome
Female and male sharesof positions as legislators,
senior officials and managers
Female and male sharesof professional andtechnical positions
Female and maleestimated earned
income
DIMENSION
INDICATOR
EQUALLY DISTRIBUTEDEQUIVALENTPERCENTAGE(EDEP)
GEM
A long andhealthy life Knowledge
FemaleGER
MaleGER
Femaleadult literacy
rate
Maleeducation
index
Equally distributededucation index
Equally distributedlife expectancy
index
Gender-related development index (GDI)
Femaleeducation
index
Maleadult literacy
rate
A decent standardof living
Female lifeexpectancy
at birth
Male lifeexpectancy
at birth
Equally distributedincome index
Femaleestimated
earnedincome
Maleestimated
earnedincome
DIMENSION
INDICATOR
DIMENSIONINDEX
EQUALLYDISTRIBUTEDINDEX
Malelife expectancy
index
Femalelife expectancy
index
Maleincomeindex
Femaleincomeindex
Knowledge
Human poverty index for selected OECD countries (HPI-2)
A decent standard of living
Socialexclusion
Probability at birthof not surviving
to age 60
Percentage of people living below the
poverty line
Long-termunemployment rate
DIMENSION
INDICATOR
A long andhealthy life
Knowledge
Human poverty index for developing countries (HPI-1)
Deprivation in a decent standard of living
A decent standard of livingProbability at birth
of not surviving to age 40
Percentage of populationwithout sustainable access to
an improved water source
Percentage of childrenunder weight for age
DIMENSION
INDICATOR
HPI-1 A long and healthy life
HPI-2
GDI
TECHNICAL NOTE 1CALCULATING THE HUMAN DEVELOPMENT INDICES The diagrams here offer a clear overview of how the five human development indices used in the Human Development Report are constructed, highlighting both their similarities and their differences. The text on the following pages provides a detailed explanation.
HDI
Adult illiteracy rate
Percentage of adults lacking functional
literacy skills
hdr03-17 backmatter2-051903.qxd 02/06/03 14:45 Page 340
TECHNICAL NOTES 341
1.00
.800
.600
.400
.200
0
IndicatorDimension
index
Goalpost formaximum
value
Goalpost forminimum
value
Indicatorvalue
Indexvalue
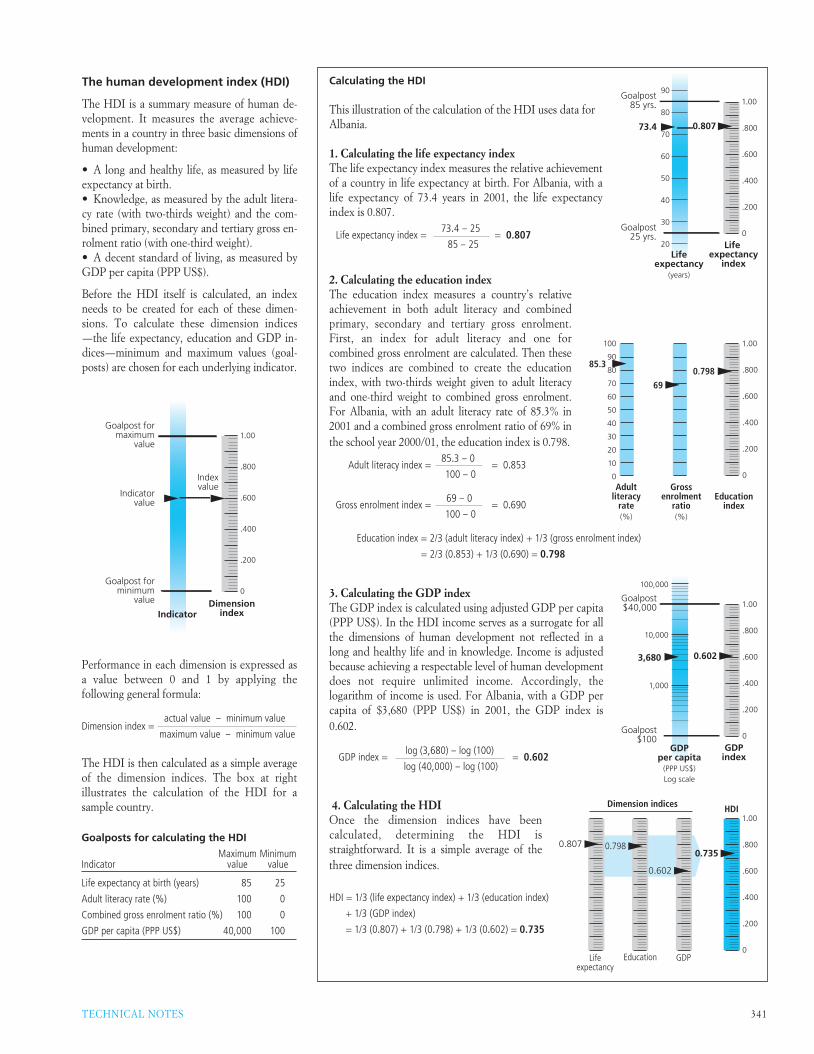
The human development index (HDI)
The HDI is a summary measure of human de-velopment. It measures the average achieve-ments in a country in three basic dimensions of human development:
• A long and healthy life, as measured by life expectancy at birth.• Knowledge, as measured by the adult litera-cy rate (with two-thirds weight) and the com-bined primary, secondary and tertiary gross en-rolment ratio (with one-third weight).• A decent standard of living, as measured by GDP per capita (PPP US$).
Before the HDI itself is calculated, an index needs to be created for each of these dimen-sions. To calculate these dimension indices—the life expectancy, education and GDP in-dices—minimum and maximum values (goal-posts) are chosen for each underlying indicator.
Goalposts for calculating the HDI
Maximum MinimumIndicator value value
Life expectancy at birth (years) 85 25
Adult literacy rate (%) 100 0
Combined gross enrolment ratio (%) 100 0
GDP per capita (PPP US$) 40,000 100
1.00
.800
.600
.400
.200
0
Lifeexpectancy
(years)
Life expectancy
index
Goalpost85 yrs.
Goalpost25 yrs.
90
80
70
60
50
40
30
20
73.4 0.807
1.00
.800
.600
.400
.200
0
Adultliteracy
rate(%)
Grossenrolment
ratio(%)
Educationindex
100
90
80
70
60
50
40
30
20
10
0
85.3
69
0.798
Calculating the HDI
This illustration of the calculation of the HDI uses data for Albania.
1. Calculating the life expectancy indexThe life expectancy index measures the relative achievement of a country in life expectancy at birth. For Albania, with a life expectancy of 73.4 years in 2001, the life expectancy index is 0.807.
Life expectancy index = 73.4 – 25
= 0.80785 – 25
GDPper capita
(PPP US$)Log scale
Goalpost$40,000
Goalpost$100
1.00
.800
.600
.400
.200
0
GDPindex
0.602
100,000
10,000
1,000
3,680
3. Calculating the GDP indexThe GDP index is calculated using adjusted GDP per capita (PPP US$). In the HDI income serves as a surrogate for all the dimensions of human development not reflected in a long and healthy life and in knowledge. Income is adjusted because achieving a respectable level of human development does not require unlimited income. Accordingly, the logarithm of income is used. For Albania, with a GDP per capita of $3,680 (PPP US$) in 2001, the GDP index is 0.602.
GDP index = log (3,680) – log (100)
= 0.602 log (40,000) – log (100)
Performance in each dimension is expressed as a value between 0 and 1 by applying the following general formula:
Dimension index = actual value – minimum value
maximum value – minimum value
The HDI is then calculated as a simple average of the dimension indices. The box at right illustrates the calculation of the HDI for a sample country.
2. Calculating the education indexThe education index measures a country’s relative achievement in both adult literacy and combined primary, secondary and tertiary gross enrolment. First, an index for adult literacy and one for combined gross enrolment are calculated. Then these two indices are combined to create the education index, with two-thirds weight given to adult literacy and one-third weight to combined gross enrolment. For Albania, with an adult literacy rate of 85.3% in 2001 and a combined gross enrolment ratio of 69% in the school year 2000/01, the education index is 0.798.
Adult literacy index =85.3 – 0
= 0.853 100 – 0
Gross enrolment index = 69 – 0
= 0.690 100 – 0
Education index = 2/3 (adult literacy index) + 1/3 (gross enrolment index)
= 2/3 (0.853) + 1/3 (0.690) = 0.798
4. Calculating the HDIOnce the dimension indices have been calculated, determining the HDI is straightforward. It is a simple average of the three dimension indices.
HDI = 1/3 (life expectancy index) + 1/3 (education index)
+ 1/3 (GDP index)
= 1/3 (0.807) + 1/3 (0.798) + 1/3 (0.602) = 0.735
1.00
.800
.600
.400
.200
0Life
expectancy
0.807 0.7980.735
0.602
GDP
HDI
Education
Dimension indices
hdr03-17 backmatter2-051903.qxd 02/06/03 14:45 Page 341
342 HUMAN DEVELOPMENT REPORT 2003
The human poverty indexfor developing countries (HPI-1)
While the HDI measures average achievement, the HPI-1 measures deprivations in the three basic dimensions of human development captured in the HDI:
• A long and healthy life—vulnerability to death at a relatively early age, as measured by the probability at birth of not surviving to age 40.• Knowledge—exclusion from the world of reading and communications, as measured by the adult illiteracy rate.• A decent standard of living—lack of access to overall economic provisioning, as measured by the unweighted average of two indicators, the percentage of the population without sustainable access to an improved water source and the percentage of children under weight for age.
Calculating the HPI-1 is more straightforward than calculating the HDI. The indicators used to measure the deprivations are already normalized between 0 and 100 (because they are expressed as percentages), so there is no need to create dimension indices as for the HDI.
Originally, the measure of deprivation in a decent standard of living also included an indicator of access to health services. But because reliable data on access to health services are lacking for recent years, in this year’s Report deprivation in a decent standard of living is measured by two rather than three indicators—the percentage of the population without sustainable access to an improved water source and the percentage of children under weight for age.
The human poverty index for selected OECD countries (HPI-2)
The HPI-2 measures deprivations in the same dimensions as the HPI-1 and also captures social exclusion. Thus it reflects deprivations in four dimensions:
• A long and healthy life—vulnerability to death at a relatively early age, as measured by the probability at birth of not surviving to age 60.• Knowledge—exclusion from the world of reading and communications, as measured by the percentage of adults (aged 16–65) lacking functional literacy skills.• A decent standard of living—as measured by the percentage of people living below the income poverty line (50% of the median adjusted household disposable income).• Social exclusion—as measured by the rate of long-term unemployment (12 months or more).
Calculating the HPI-1
1. Measuring deprivation in a decent standard of livingAn unweighted average of two indicators is used to measure deprivation in a decent standard of living.
Unweighted average = 1/2 (population without sustainable access to an improved water source)+ 1/2 (children under weight for age)
A sample calculation: Central African RepublicPopulation without sustainable access to an improved water source = 30%Children under weight for age = 23%
Unweighted average = 1/2 (30) + 1/2 (23) = 26.5%
2. Calculating the HPI-1The formula for calculating the HPI-1 is as follows:
HPI-1 = [1/3 (P1α +P2
α + P3α)]1/α
Where:P1 = Probability at birth of not surviving to age 40 (times 100)P2 = Adult illiteracy rateP3 = Unweighted average of population without sustainable access to an improved water source
and children under weight for ageα = 3
A sample calculation: Central African RepublicP1 = 55.3%P2 = 51.8%P3 = 26.5%
HPI-1 = [1/3 (55.33 + 51.83+ 26.53)]1/3 = 47.8
Calculating the HPI-2
The formula for calculating the HPI-2 is as follows:
HPI-2 = [1/4 (P1α +P2
α + P3α + P4
α)]1/α
Where:P1 = Probability at birth of not surviving to age 60 (times 100)P2 = Adults lacking functional literacy skillsP3 = Population below income poverty line (50% of median adjusted household disposable income)P4 = Rate of long-term unemployment (lasting 12 months or more)α = 3
A sample calculation: United KingdomP1 = 8.9%P2 = 21.8%P3 = 12.5%P4 = 1.3%
HPI-2 = [1/4 (8.93 + 21.83 + 12.53 + 1.33)]1/3 = 14.8
Why α = 3 in calculating the HPI-1 and HPI-2
The value of α has an important impact on the value of the HPI. If α = 1, the HPI is the average of its dimensions. As α rises, greater weight is given to the dimension in which there is the most deprivation. Thus as α increases towards infinity, the HPI will tend towards the value of the dimension in which deprivation is greatest (for the Central African Republic, the example used for calculating the HPI-1, it would be 55.3%, equal to the probability at birth of not surviving to age 40.
In this Report the value 3 is used to give additional but not overwhelming weight to areas of more acute deprivation. For a detailed analysis of the HPI’s mathematical formulation, see Sudhir Anand and Amartya Sen’s “Concepts of Human Development and Poverty: A Multidimensional Perspective” and the technical note in Human Development Report 1997 (see the list of selected readings at the end of this technical note).
hdr03-17 backmatter2-051903.qxd 02/06/03 14:45 Page 342

TECHNICAL NOTES 343
The gender-related development index (GDI)
While the HDI measures average achievement, the GDI adjusts the average achievement to reflect the inequalities between men and women in the following dimensions:
• A long and healthy life, as measured by life expectancy at birth.• Knowledge, as measured by the adult literacy rate and the combined primary, secondary and tertiary gross enrolment ratio.• A decent standard of living, as measured by estimated earned income (PPP US$).
The calculation of the GDI involves three steps. First, female and male indices in each dimension are calculated according to this general formula:
Dimension index =actual value – minimum value
maximum value – minimum value
Second, the female and male indices in each dimension are combined in a way that penalizes differences in achievement between men and women. The resulting index, referred to as the equally distributed index, is calculated according to this general formula:
Equally distributed index= {[female population share (female index1–�)] + [male population share (male index1–�)]}1/1–�
� measures the aversion to inequality. In the GDI � = 2. Thus the general equation becomes:
Equally distributed index= {[female population share (female index–1)]
+ [male population share (male index–1)]}–1
which gives the harmonic mean of the female and male indices.
Third, the GDI is calculated by combining the three equally distributed indices in an unweighted average.
Goalposts for calculating the GDI
Maximum MinimumIndicator value value
Female life expectancy at birth (years) 87.5 27.5
Male life expectancy at birth (years) 82.5 22.5
Adult literacy rate (%) 100 0
Combined gross enrolment ratio (%) 100 0
Estimated earned income (PPP US$) 40,000 100
Note: The maximum and minimum values (goalposts) for life expectancy are five years higher for women to take into account their longer life expectancy.
Calculating the GDI
This illustration of the calculation of the GDI uses data for Thailand.
1. Calculating the equally distributed life expectancy indexThe first step is to calculate separate indices for female and male achievements in life expectancy, using the general formula for dimension indices.
FEMALE MALELife expectancy: 73.2 years Life expectancy: 64.9 years
Life expectancy index = 73.2 – 27.5
= 0.762 Life expectancy index = 64.9 – 22.5
= 0.70787.5 – 27.5 82.5 – 22.5
Next, the female and male indices are combined to create the equally distributed life expectancy index, using the general formula for equally distributed indices.
FEMALE MALEPopulation share: 0.508 Population share: 0.492Life expectancy index: 0.762 Life expectancy index: 0.707
Equally distributed life expectancy index = {[0.508 (0.762–1)] + [0.492 (0.707–1)]}–1 = 0.734
2. Calculating the equally distributed education indexFirst, indices for the adult literacy rate and the combined primary, secondary and tertiary gross enrolment ratio are calculated separately for females and males. Calculating these indices is straightforward, since the indicators used are already normalized between 0 and 100.
FEMALE MALEAdult literacy rate: 94.1% Adult literacy rate: 97.3%Adult literacy index: 0.941 Adult literacy index: 0.973Gross enrolment ratio: 69.3% Gross enrolment ratio: 74.6%Gross enrolment index: 0.693 Gross enrolment index: 0.746
Second, the education index, which gives two-thirds weight to the adult literacy index and one-third weight to the gross enrolment index, is computed separately for females and males.
Education index = 2/3 (adult literacy index) + 1/3 (gross enrolment index)
Female education index = 2/3 (0.941) + 1/3 (0.693) = 0.858
Male education index = 2/3 (0.973) + 1/3 (0.746) = 0.897
Finally, the female and male education indices are combined to create the equally distributed education index.
FEMALE MALEPopulation share: 0.508 Population share: 0.492Education index: 0.858 Education index: 0.897
Equally distributed education index = {[0.508 (0.858–1)] + [0.492 (0.897–1)]}–1 = 0.877
3. Calculating the equally distributed income indexFirst, female and male earned income (PPP US$) are estimated (for details on this calculation, see the addendum to this technical note). Then the income index is calculated for each gender. As for the HDI, income is adjusted by taking the logarithm of estimated earned income (PPP US$):
Income index =log (actual value) – log (minimum value)
log (maximum value) – log (minimum value)
FEMALE MALEEstimated earned income (PPP US$): 4,875 Estimated earned income (PPP US$): 7,975
Income index = log (4,875) – log (100)
= 0.649 Income index = log (7,975) – log (100)
= 0.731log (40,000) – log (100) log (40,000) – log (100)
Calculating the GDI continues on next page
hdr03-17 backmatter2-051903.qxd 02/06/03 14:45 Page 343

344 HUMAN DEVELOPMENT REPORT 2003
Calculating the GDI (continued)
Second, the female and male income indices are combined to create the equally distributed income index:
FEMALE MALEPopulation share: 0.508 Population share: 0.492Income index: 0.649 Income index: 0.731
Equally distributed income index = {[0.508 (0.649–1)] + [0.492 (0.731–1)]}–1 = 0.687
4. Calculating the GDICalculating the GDI is straightforward. It is simply the unweighted average of the three component indices—the equally distributed life expectancy index, the equally distributed education index and the equally distributed income index.
GDI = 1/3 (life expectancy index) + 1/3 (education index) + 1/3 (income index)= 1/3 (0.734) + 1/3 (0.877) + 1/3 (0.687) = 0.766
Why � = 2 in calculating the GDI
The value of � is the size of the penalty for gender inequality. The larger the value, the more heavily a society is penalized for having inequalities.
If � = 0, gender inequality is not penalized (in this case the GDI would have the same value as the HDI). As � increases towards infinity, more and more weight is given to the lesser achieving group.
The value 2 is used in calculating the GDI (as well as the GEM). This value places a moderate penalty on gender inequality in achievement.
For a detailed analysis of the GDI’s mathematical formulation, see Sudhir Anand and Amartya Sen’s “Gender Inequality in Human Development: Theories and Measurement,” Kalpana Bardhan and Stephan Klasen’s “UNDP’s Gender-Related Indices: A Critical Review” and the technical notes in Human Development Report 1995 and Human Development Report 1999 (see the list of selected readings at the end of this technical note).
hdr03-17 backmatter2-051903.qxd 02/06/03 14:45 Page 344

TECHNICAL NOTES 345
The gender empowerment measure (GEM)
Focusing on women’s opportunities rather than their capabilities, the GEM captures gender in-equality in three key areas:
• Political participation and decision-making power, as measured by women’s and men’s per-centage shares of parliamentary seats.• Economic participation and decision-making power, as measured by two indicators—women’s and men’s percentage shares of posi-tions as legislators, senior officials and manag-ers and women’s and men’s percentage shares of professional and technical positions.• Power over economic resources, as measured by women’s and men’s estimated earned income (PPP US$).
For each of these three dimensions, an equally distributed equivalent percentage (EDEP) is calculated, as a population-weighted average, according to the following general formula:
EDEP = {[female population share (female index1–�)]+ [male population share (male index1–�)]}1/1–�
� measures the aversion to inequality. In the GEM (as in the GDI) � = 2, which places a moderate penalty on inequality. The formula is thus:
EDEP = {[female population share (female index–1)]+ [male population share (male index–1)]}–1
For political and economic participation and decision-making, the EDEP is then indexed by dividing it by 50. The rationale for this indexation: in an ideal society, with equal empowerment of the sexes, the GEM variables would equal 50%—that is, women’s share would equal men’s share for each variable.
Finally, the GEM is calculated as a simple average of the three indexed EDEPs.
Calculating the GEM
This illustration of the calculation of the GEM uses data for Venezuela.
1. Calculating the EDEP for parliamentary representationThe EDEP for parliamentary representation measures the relative empowerment of women in terms of their political participation. The EDEP is calculated using the female and male shares of the population and female and male percentage shares of parliamentary seats according to the general formula.
FEMALE MALEPopulation share: 0.497 Population share: 0.503Parliamentary share: 9.7% Parliamentary share: 90.3%
EDEP for parliamentary representation = {[0.497 (9.7–1)] + [0.503 (90.3–1)]}–1 = 17.60
Then this initial EDEP is indexed to an ideal value of 50%.
Indexed EDEP for parliamentary representation = 17.60
= 0.35250
2. Calculating the EDEP for economic participationUsing the general formula, an EDEP is calculated for women’s and men’s percentage shares of positions as legislators, senior officials and managers, and another for women’s and men’s percentage shares of professional and technical positions. The simple average of the two measures gives the EDEP for economic participation.
FEMALE MALEPopulation share: 0.497 Population share: 0.503Percentage share of positions as legislators, Percentage share of positions as legislators, senior officials and managers: 24.3% senior officials and managers: 75.7%Percentage share of professional and Percentage share of professional and technical positions: 57.6% technical positions: 42.4%
EDEP for positions as legislators, senior officials and managers = {[0.497 (24.3–1)] + [0.503 (75.7–1)]}–1 = 36.90
Indexed EDEP for positions as legislators, senior officials and managers = 36.90
= 0.73850
EDEP for professional and technical positions = {[0.497 (57.6–1)] + [0.503 (42.4–1)]}–1 = 48.80
Indexed EDEP for professional and technical positions = 48.80
= 0.97650
The two indexed EDEPs are averaged to create the EDEP for economic participation:
EDEP for economic participation = 0.738 + 0.976
= 0.8572
3. Calculating the EDEP for incomeEarned income (PPP US$) is estimated for women and men separately and then indexed to goalposts as for the HDI and the GDI. For the GEM, however, the income index is based on unadjusted values, not the logarithm of estimated earned income. (For details on the estimation of earned income for men and women, see the addendum to this technical note.)
FEMALE MALEPopulation share: 0.497 Population share: 0.503Estimated earned income (PPP US$): 3,288 Estimated earned income (PPP US$): 8,021
Income index = 3,288 – 100
= 0.080 Income index = 8,021 – 100
= 0.19940,000 – 100 40,000 – 100
The female and male indices are then combined to create the equally distributed index:
EDEP for income = {[0.497 (0.080–1)] + [0.503 (0.199–1)]}–1 = 0.114
4. Calculating the GEMOnce the EDEP has been calculated for the three dimensions of the GEM, determining the GEM is straightforward. It is a simple average of the three EDEP indices.
GEM = 0.352 + 0.857 + 0.114
= 0.441 3
hdr03-17 backmatter2-051903.qxd 02/06/03 14:45 Page 345

346 HUMAN DEVELOPMENT REPORT 2003
Selected readings
Anand, Sudhir, and Amartya Sen. 1994. “Human Development Index: Methodology and Measurement.” Occasional Paper 12. United Nations Development Programme, Human Development Report Office, New York. (HDI)
———. 1995. “Gender Inequality in Human Development: Theories and Measurement.” Occasional Paper 19. United Nations Development Programme, Human Development Report Office, New York. (GDI, GEM)
———. 1997. “Concepts of Human Development and Poverty: A Multi-dimensional Perspective.” In United Nations Development Programme, Human
Development Report 1997 Papers: Poverty and Human Development. New York. (HPI-1, HPI-2)
Bardhan, Kalpana, and Stephan Klasen. 1999. “UNDP’s Gender-Related Indices: A Critical Review.” World Development 27 (6): 985–1010. (GDI, GEM)
United Nations Development Programme. 1995. Human Development Report 1995. New York: Oxford University Press. Technical notes 1 and 2 and chapter 3. (GDI, GEM)
———. 1997. Human Development Report 1997. New York: Oxford University Press. Technical note 1 and chapter 1. (HPI-1, HPI-2)
———. 1999. Human Development Report 1999. New York: Oxford University Press. Technical note. (HDI, GDI)
TECHNICAL NOTE 1 ADDENDUM
Female and male earned income
Despite the importance of having gender-disaggregated data on income, direct measures are unavailable. For this Report crude estimates of female and male earned income have therefore been derived.
Income can be seen in two ways: as a resource for consumption and as earnings by individuals. The use measure is difficult to disaggregate between men and women because they share resources within a family unit. By contrast, earnings are separable because different members of a family tend to have separate earned incomes.
The income measure used in the GDI and the GEM indicates a person’s capacity to earn income. It is used in the GDI to capture the disparities between men and women in command over resources and in the GEM to capture women’s economic independence. (For conceptual and methodological issues relating to this approach, see Sudhir Anand and Amartya Sen’s “Gender Inequality in Human Development” and, in Human Development Report 1995, chapter 3 and technical notes 1 and 2; see the list of selected readings at the end of this technical note.)
Female and male earned income (PPP US$) are estimated using the following data:
• Ratio of the female non-agricultural wage to the male non-agricultural wage.• Male and female shares of the economically active population.• Total female and male population.• GDP per capita (PPP US$).
KeyWf / Wm = ratio of female non-agricultural wage to male non-agricultural wageEAf = female share of economically active populationEAm = male share of economically active populationSf = female share of wage billY = total GDP (PPP US$)Nf = total female populationNm = total male populationYf = estimated female earned income (PPP US$)Ym = estimated male earned income (PPP US$)
Note
Calculations based on data in the technical note may yield results that differ from those in the indicator tables because of rounding.
Estimating female and male earned income
This illustration of the estimation of female and male earned income uses 2001 data for Ethiopia.
1. Calculating total GDP (PPP US$)Total GDP (PPP US$) is calculated by multiplying the total population by GDP per capita (PPP US$).
Total population: 67,266 (thousand)GDP per capita (PPP US$): 810Total GDP (PPP US$) = 810 (67,266) = 54,485,460 (thousand)
2. Calculating the female share of the wage billBecause data on wages in rural areas and in the informal sector are rare, the Report has used non-agricultural wages and assumed that the ratio of female wages to male wages in the non-agricultural sector applies to the rest of the economy. The female share of the wage bill is calculated using the ratio of the female non-agricultural wage to the male non-agricultural wage and the female and male percentage shares of the economically active population. Where data on the wage ratio are not available, a value of 75% is used.
Ratio of female to male non-agricultural wage (Wf /Wm ) = 0.75Female percentage share of economically active population (EAf ) = 40.9%Male percentage share of economically active population (EAm ) = 59.1%
Female share of wage bill (Sf ) = Wf /Wm (EAf ) =
0.75 (40.9) = 0.342
[Wf /Wm (EAf )] + EAm [0.75 (40.9)] + 59.1
3. Calculating female and male earned income (PPP US$)An assumption has to be made that the female share of the wage bill is equal to the female share of GDP.
Female share of wage bill (Sf ) = 0.342Total GDP (PPP US$) (Y ) = 54,485,460 (thousand)Female population (Nf ) = 33,892 (thousand)
Estimated female earned income (PPP US$) (Yf ) = Sf (Y )
= 0.342 (54,485,460)
= 550 Nf 33,892
Male population (Nm ) = 33,374 (thousand)
Estimated male earned income (PPP US$) (Ym ) = Y – Sf (Y )
= 54,485,460 – [0.342 (54,485,460)]
= 1,074 Nm 33,374
hdr03-17 backmatter2-051903.qxd 02/06/03 14:45 Page 346
TECHNICAL NOTES 347
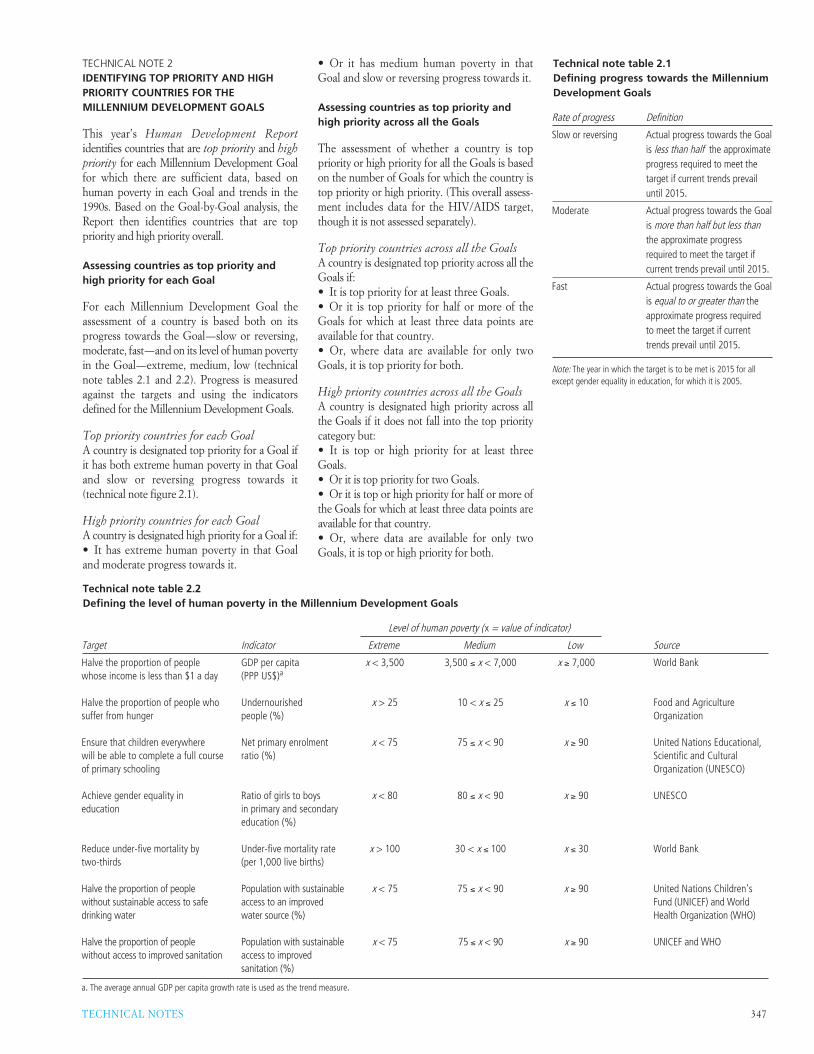
TECHNICAL NOTE 2IDENTIFYING TOP PRIORITY AND HIGH PRIORITY COUNTRIES FOR THE MILLENNIUM DEVELOPMENT GOALS
This year’s Human Development Report identifies countries that are top priority and high priority for each Millennium Development Goal for which there are sufficient data, based on human poverty in each Goal and trends in the 1990s. Based on the Goal-by-Goal analysis, the Report then identifies countries that are top priority and high priority overall.
Assessing countries as top priority and high priority for each Goal
For each Millennium Development Goal the assessment of a country is based both on its progress towards the Goal—slow or reversing, moderate, fast—and on its level of human poverty in the Goal—extreme, medium, low (technical note tables 2.1 and 2.2). Progress is measured against the targets and using the indicators defined for the Millennium Development Goals.
Top priority countries for each GoalA country is designated top priority for a Goal if it has both extreme human poverty in that Goal and slow or reversing progress towards it (technical note figure 2.1).
High priority countries for each GoalA country is designated high priority for a Goal if:• It has extreme human poverty in that Goal and moderate progress towards it.
• Or it has medium human poverty in that Goal and slow or reversing progress towards it.
Assessing countries as top priority and high priority across all the Goals
The assessment of whether a country is top priority or high priority for all the Goals is based on the number of Goals for which the country is top priority or high priority. (This overall assess- ment includes data for the HIV/AIDS target, though it is not assessed separately).
Top priority countries across all the GoalsA country is designated top priority across all the Goals if:• It is top priority for at least three Goals.• Or it is top priority for half or more of the Goals for which at least three data points are available for that country.• Or, where data are available for only two Goals, it is top priority for both.
High priority countries across all the GoalsA country is designated high priority across all the Goals if it does not fall into the top priority category but:• It is top or high priority for at least three Goals.• Or it is top priority for two Goals.• Or it is top or high priority for half or more of the Goals for which at least three data points are available for that country.• Or, where data are available for only two Goals, it is top or high priority for both.
Technical note table 2.2Defining the level of human poverty in the Millennium Development Goals
Level of human poverty (x = value of indicator)
Target Indicator Extreme Medium Low Source
Halve the proportion of people GDP per capita x < 3,500 3,500 ≤ x < 7,000 x ≥ 7,000 World Bankwhose income is less than $1 a day (PPP US$)a
Halve the proportion of people who Undernourished x > 25 10 < x ≤ 25 x ≤ 10 Food and Agriculture suffer from hunger people (%) Organization
Ensure that children everywhere Net primary enrolment x < 75 75 ≤ x < 90 x ≥ 90 United Nations Educational,will be able to complete a full course ratio (%) Scientific and Cultural of primary schooling Organization (UNESCO)
Achieve gender equality in Ratio of girls to boys x < 80 80 ≤ x < 90 x ≥ 90 UNESCOeducation in primary and secondary education (%)
Reduce under-five mortality by Under-five mortality rate x > 100 30 < x ≤ 100 x ≤ 30 World Banktwo-thirds (per 1,000 live births)
Halve the proportion of people Population with sustainable x < 75 75 ≤ x < 90 x ≥ 90 United Nations Children’swithout sustainable access to safe access to an improved Fund (UNICEF) and Worlddrinking water water source (%) Health Organization (WHO)
Halve the proportion of people Population with sustainable x < 75 75 ≤ x < 90 x ≥ 90 UNICEF and WHOwithout access to improved sanitation access to improved sanitation (%)
a. The average annual GDP per capita growth rate is used as the trend measure.
Technical note table 2.1 Defining progress towards the Millennium Development Goals
Definition
Actual progress towards the Goal is less than half the approximate progress required to meet the target if current trends prevail until 2015.
Actual progress towards the Goal is more than half but less than the approximate progress required to meet the target if current trends prevail until 2015.
Actual progress towards the Goal is equal to or greater than the approximate progress required to meet the target if current trends prevail until 2015.
Rate of progress
Slow or reversing
Moderate
Fast
Note: The year in which the target is to be met is 2015 for all except gender equality in education, for which it is 2005.
hdr03-17 backmatter2-051903.qxd 02/06/03 14:45 Page 347

348 HUMAN DEVELOPMENT REPORT 2003
Calculating progress towards each Goal
Progress towards each Goal is assessed by comparing actual annual progress if current trends were to prevail until 2015 with the annual progress needed to meet the target, under the assumption of linear progress.
Assessing actual progress The actual annual rate of progress is calculated using the general formula:
Actual annual rate of progress =
where t0 is 1990 or the year closest to 1990 for which data are available; t1 is the most recent year for which data are available, generally 2001; and xt0
and xt1 are the values of the indicator for those years.
For rates of hunger, poverty and under-five mortality, for which the most desirable value is 0, the formula is applied without modification.
For the net primary enrolment ratio, gender equality in education (ratio of girls to boys) and the proportion of the population with access to safe water and sanitation, for which the most desirable value is 100%, progress is expressed as “shortfall reduction” according to the following formula:
Actual annual rate of progress =
Assessing required progress The rate of progress required to meet a target by 2015 (by 2005 for gender equality in education) is dictated by the target: α is –1/2 for poverty and hunger, 1/2 for safe water and sanitation, –2/3 for under-five mortality and 1 for primary enrolment and gender equality in education. The annual rate of progress required is then calculated by simply dividing α by the number of years between tMDG, the year by which the target is to be met, and t0, the year closest to 1990 for which data are available:
Required annual rate of progress =
Technical note figure 2.1Identifying top priority and high priority countries
Medium
Leve
l of
hum
an p
over
ty in
Goa
l
Extreme
Moderate
Progress towards Goal
FastSlow orreversing
Top priority
High priority
High priority
Low
( xt1 – xt0
) / xt0
t1 – t0
tMDG – t0
α
( xt1 – xt0
) / ( 100 – xt0 )
t1 – t0
hdr03-17 backmatter2-051903.qxd 02/06/03 14:45 Page 348

TECHNICAL NOTES 349
Determining priority status: an example
This illustration of determining priority status uses data on the under-five mortality rate for Chad.
Calculating progress Data for the under-five mortality rate are available for 1990 and 2001:t0 = 1990t1 = 2001
The under-five mortality rate is 203 per 1,000 live births for 1990 and 200 for 2001:xt0
= 203xt1
= 200
The required reduction is two-thirds:α = –2/3
Therefore:
Actual annual rate of progress = = –0.13%
Required annual rate of progress = = –2.67%
The actual progress towards the Goal is less than half the approximate progress required to meet the target. Therefore, Chad is making slow or reversing progress towards the Goal of reducing under-five mortality.
Determining the level of human povertyThe under-five mortality rate for Chad in 2001 is 200 per 1,000 live births. Therefore, Chad has an extreme level of human poverty in under-five mortality (see technical note table 2.2).
Determining the priority status for under-five mortalityChad has an extreme level of human poverty in under-five mortality and slow or reversing progress. Therefore, Chad is categorized as top priority for the Goal of reducing under-five mortality.
Determining the priority status across all GoalsOf the eight indicators for which Chad has data, it is identified as top priority for five and high priority for another two. Therefore, Chad is categorized as a top priority country overall.
Note
To measure progress in income poverty, the GDP per capita growth rate in 1990–2001 is used. It is estimated that average annual growth of 1.4% is required in 1990–2015 to meet the income poverty target. Accordingly, the threshold for slow or reversing progress is annual per capita income growth of less than 0.7%; for moderate progress, 0.7% to 1.4%; and for fast progress, 1.4% or more. Trend data for the prevalence of HIV/AIDS among adults (age 15 and above) in 1990 and 2000 are also used in the overall assessment of countries as top priority and high priority (UNAIDS and WHO 2003). For determining the level of human poverty in HIV/AIDS, a prevalence rate of more than 3% is considered extreme; 3% or less but greater than 1%, medium; and 1% or less, low. Since the target is to halt and begin to reverse the spread of HIV/AIDS, an increase in the prevalence rate of less than 1 percentage point is considered fast progress; an increase of 1 percentage point or more but less than 3, moderate progress; and an increase of 3 percentage points or more, slow or reversing progress.
(200 – 203) / 203
2001 – 1990
2015 – 1990
–2/3
hdr03-17 backmatter2-051903.qxd 02/06/03 14:45 Page 349

Agriculture, OECD country support to domesticTransfers from taxpayers and consumers arising frompolicy measures that support agriculture (net of theassociated budgetary receipts), regardless of theirobjectives and impacts on farm production andincome or on consumption of farm products.
Armed forces, total Strategic, land, naval, air, com-mand, administrative and support forces. Alsoincluded are paramilitary forces such as the gen-darmerie, customs service and border guard, if theseare trained in military tactics.
Arms transfers, conventional Refers to the volun-tary transfer by the supplier (and thus excludes cap-tured weapons and weapons obtained throughdefectors) of weapons with a military purpose des-tined for the armed forces, paramilitary forces orintelligence agencies of another country. Theseinclude major conventional weapons or systems in sixcategories: ships, aircraft, missiles, artillery, armouredvehicles and guidance and radar systems (excludedare trucks, services, ammunition, small arms, supportitems, components and component technology andtowed or naval artillery under 100-millimetre calibre).
Births attended by skilled health personnel Thepercentage of deliveries attended by personnel(including doctors, nurses and midwives) trained togive the necessary care, supervision and advice towomen during pregnancy, labour and the postpar-tum period, to conduct deliveries on their own andto care for newborns.
Birth-weight, infants with low The percentage ofinfants with a birth-weight of less than 2,500 grams.
Carbon dioxide emissions Anthropogenic (human-originated) carbon dioxide emissions stemming fromthe burning of fossil fuels, gas flaring and the pro-duction of cement. Emissions are calculated from dataon the consumption of solid, liquid and gaseousfuels, gas flaring and the production of cement.
Cellular subscribers (also referred to as cellularmobile subscribers) Subscribers to an automatic
public mobile telephone service that provides accessto the public switched telephone network using cel-lular technology. Systems can be analogue or digital.
Children reaching grade 5 The percentage of chil-dren starting primary school who eventually attaingrade 5 (grade 4 if the duration of primary school isfour years). The estimates are based on the recon-structed cohort method, which uses data on enrol-ment and repeaters for two consecutive years.
Chlorofluorocarbons, consumption of ozonedepleting The sum of production and imports minusexports of chlorofluorocarbons (CFCs) controlledunder the Montreal Protocol on Substances ThatDeplete the Ozone Layer. CFCs are synthetic com-pounds formerly used as refrigerants and aerosolpropellants and known to be harmful to the ozonelayer of the atmosphere. Under the Montreal Pro-tocol, the CFCs to be measured are those found inprepolymers; aerosol products; portable fire extin-guishers; vehicle air conditioning units; insulationboards, panels and pipe covers; and domestic andcommercial refrigeration, air conditioning and heatpump equipment.
Cigarette consumption per adult The sum of pro-duction and imports minus exports of cigarettesdivided by the population aged 15 and above.
Computers in use, personal Self-contained com-puters in use that are designed to be operated by asingle user at a time.
Consumer price index Reflects changes in the costto the average consumer of acquiring a basket ofgoods and services that may be fixed or may changeat specified intervals.
Contraceptive prevalence The percentage of mar-ried women (including women in union) aged 15–49who are using, or whose partners are using, any formof contraception, whether modern or traditional.
Contributing family worker Defined according tothe 1993 International Classification by Status in
350 HUMAN DEVELOPMENT REPORT 2003
Definitions of statistical terms
hdr03-17 backmatter2-051903.qxd 02/06/03 14:45 Page 350

Employment (ICSE) as a person who works withoutpay in an economic enterprise operated by a relatedperson living in the same household.
Crime, people victimized by The percentage of thepopulation who perceive that they have been vic-timized by certain types of crime in the preceding year,based on responses to the International Crime Vic-tims Survey.
Debt relief committed under HIPC initiative For-giveness of loans as a component of official develop-ment assistance under the Debt Initiative for HeavilyIndebted Poor Countries (HIPCs). The initiative isthe first comprehensive approach to reducing theexternal debt of the world’s poorest, most heavilyindebted countries, which total 42 in number.
Debt service, total The sum of principal repaymentsand interest actually paid in foreign currency, goodsor services on long-term debt (having a maturity ofmore than one year), interest paid on short-termdebt and repayments to the International MonetaryFund.
Drugs, affordable essential, population with sus-tainable access to The estimated percentage of thepopulation for whom a minimum of 20 of the mostessential drugs—those that satisfy the health careneeds of the majority of the population—are con-tinuously and affordably available at public or pri-vate health facilities or drug outlets within one hour’stravel from home.
Earned income (PPP US$), estimated (femaleand male) Roughly derived on the basis of the ratioof the female non-agricultural wage to the male non-agricultural wage, the female and male shares of theeconomically active population, total female andmale population and GDP per capita (PPP US$). Fordetails on this estimation, see technical note 1.
Earned income, ratio of estimated female to maleThe ratio of estimated female earned income to esti-mated male earned income. See earned income (PPPUS$), estimated (female and male).
Economic activity rate The share of the populationaged 15 and above who supply, or are available to sup-ply, labour for the production of goods and services.
Education expenditure, public Includes both cap-ital expenditures (spending on construction, reno-vation, major repairs and purchase of heavy equipmentor vehicles) and current expenditures (spending ongoods and services that are consumed within the cur-
rent year and would need to be renewed the follow-ing year). It covers such expenditures as staff salariesand benefits, contracted or purchased services, booksand teaching materials, welfare services, furnitureand equipment, minor repairs, fuel, insurance, rents,telecommunications and travel. See education levels.
Education index One of the three indices on whichthe human development index is built. It is based onthe adult literacy rate and the combined primary, sec-ondary and tertiary gross enrolment ratio. For detailson how the index is calculated, see technical note 1.
Education levels Categorized as pre-primary, pri-mary, secondary or tertiary in accordance with theInternational Standard Classification of Education(ISCED). Pre-primary education (ISCED level 0) isprovided at such schools as kindergartens and nurs-ery and infant schools and is intended for childrennot old enough to enter school at the primary level.Primary education (ISCED level 1) provides thebasic elements of education at such establishmentsas primary and elementary schools. Secondary edu-cation (ISCED levels 2 and 3) is based on at least fouryears of previous instruction at the first level and pro-vides general or specialized instruction, or both, atsuch institutions as middle schools, secondary schools,high schools, teacher training schools at this level andvocational or technical schools. Tertiary education(ISCED levels 5–7) refers to education at such insti-tutions as universities, teachers colleges and higher-level professional schools—requiring as a minimumcondition of admission the successful completion ofeducation at the second level or evidence of theattainment of an equivalent level of knowledge.
Electricity consumption per capita Refers to grossproduction, in per capita terms, which includes con-sumption by station auxiliaries and any losses in thetransformers that are considered integral parts ofthe station. Also included is total electric energy pro-duced by pumping installations without deductionof electric energy absorbed by pumping.
Employment by economic activity Employment inindustry, agriculture or services as defined accord-ing to the International Standard Industrial Classi-fication (ISIC) system (revisions 2 and 3). Industryrefers to mining and quarrying, manufacturing, con-struction and public utilities (gas, water and elec-tricity). Agriculture refers to activities in agriculture,hunting, forestry and fishing. Services refer to whole-sale and retail trade; restaurants and hotels; transport,storage and communications; finance, insurance, realestate and business services; and community, socialand personal services.
DEFINITIONS OF STATISTICAL TERMS 351
hdr03-17 backmatter2-051903.qxd 02/06/03 14:45 Page 351
Energy use, GDP per unit of The ratio of GDP (PPPUS$) to commercial energy use, measured in kilo-grams of oil equivalent. This ratio provides a measureof energy efficiency by showing comparable and con-sistent estimates of real GDP across countries rela-tive to physical inputs (units of energy use). See GDP(gross domestic product) and PPP (purchasingpower parity).
Enrolment ratio, gross The number of studentsenrolled in a level of education, regardless of age, asa percentage of the population of official school agefor that level. The gross enrolment ratio can be greaterthan 100% as a result of grade repetition and entryat ages younger or older than the typical age at thatgrade level. See education levels.
Enrolment ratio, net The number of students enrolledin a level of education who are of official school agefor that level, as a percentage of the population of offi-cial school age for that level. See education levels.
Exports, high technology Exports of products witha high intensity of research and development. Theyinclude high-technology products such as in aero-space, computers, pharmaceuticals, scientific instru-ments and electrical machinery.
Exports, manufactured Defined according to theStandard International Trade Classification to includeexports of chemicals, basic manufactures, machineryand transport equipment and other miscellaneousmanufactured goods.
Exports of goods and services The value of allgoods and other market services provided to the restof the world. Included is the value of merchandise,freight, insurance, transport, travel, royalties, licencefees and other services, such as communication, con-struction, financial, information, business, personaland government services. Excluded are labour andproperty income and transfer payments.
Exports, primary Defined according to the Stan-dard International Trade Classification to includeexports of food, agricultural raw materials, fuels andores and metals.
Fertility rate, total The number of children thatwould be born to each woman if she were to live tothe end of her child-bearing years and bear childrenat each age in accordance with prevailing age-specificfertility rates.
Foreign direct investment, net inflows of Net inflowsof investment to acquire a lasting management inter-
est (10% or more of voting stock) in an enterprise oper-ating in an economy other than that of the investor.It is the sum of equity capital, reinvestment of earn-ings, other long-term capital and short-term capital.
Fuel consumption, traditional Estimated consumptionof fuel wood, charcoal, bagasse (sugar cane waste) andanimal and vegetable wastes. Total energy use comprisescommercial energy use and traditional fuel use.
GDP (gross domestic product) The sum of valueadded by all resident producers in the economy plusany product taxes (less subsidies) not included inthe valuation of output. It is calculated without mak-ing deductions for depreciation of fabricated capitalassets or for depletion and degradation of naturalresources. Value added is the net output of an indus-try after adding up all outputs and subtracting inter-mediate inputs.
GDP (US$) GDP converted to US dollars usingthe average official exchange rate reported by theInternational Monetary Fund. An alternative con-version factor is applied if the official exchange rateis judged to diverge by an exceptionally large marginfrom the rate effectively applied to transactions in for-eign currencies and traded products. See GDP (grossdomestic product).
GDP index One of the three indices on which thehuman development index is built. It is based onGDP per capita (PPP US$). For details on how theindex is calculated, see technical note 1.
GDP per capita (PPP US$) See GDP (gross domes-tic product) and PPP (purchasing power parity).
GDP per capita (US$) GDP (US$) divided bymidyear population. See GDP (US$).
GDP per capita annual growth rate Least squaresannual growth rate, calculated from constant priceGDP per capita in local currency units.
Gender empowerment measure (GEM) A com-posite index measuring gender inequality in threebasic dimensions of empowerment—economic par-ticipation and decision-making, political participationand decision-making and power over economicresources. For details on how the index is calculated,see technical note 1.
Gender-related development index (GDI) A com-posite index measuring average achievement in thethree basic dimensions captured in the human devel-opment index—a long and healthy life, knowledge
352 HUMAN DEVELOPMENT REPORT 2003
hdr03-17 backmatter2-051903.qxd 02/06/03 14:45 Page 352

and a decent standard of living—adjusted to accountfor inequalities between men and women. For detailson how the index is calculated, see technical note 1.
Gini index Measures the extent to which the distri-bution of income (or consumption) among individ-uals or households within a country deviates from aperfectly equal distribution. A Lorenz curve plots thecumulative percentages of total income receivedagainst the cumulative number of recipients, startingwith the poorest individual or household. The Giniindex measures the area between the Lorenz curveand a hypothetical line of absolute equality, expressedas a percentage of the maximum area under the line.A value of 0 represents perfect equality, a value of 100perfect inequality.
GNI (gross national income) The sum of valueadded by all resident producers in the economy plusany product taxes (less subsidies) not included inthe valuation of output plus net receipts of primaryincome (compensation of employees and propertyincome) from abroad. Value added is the net outputof an industry after adding up all outputs and sub-tracting intermediate inputs. Data are in current USdollars converted using the World Bank Atlas method.
Grants by NGOs, net Resource transfers by nationalnon-governmental organizations (private non-profit-making agencies) to developing countries or territoriesidentified in part I of the Development AssistanceCommittee (DAC) list of recipient countries. They arecalculated as gross outflows from NGOs minus resourcetransfers received from the official sector (which arealready counted in official development assistance).
Health expenditure per capita (PPP US$) Thesum of public and private expenditure (in PPP US$),divided by the population. Health expenditureincludes the provision of health services (preventiveand curative), family planning activities, nutritionactivities and emergency aid designated for health, butexcludes the provision of water and sanitation. Seehealth expenditure, private; health expenditure,public; and PPP (purchasing power parity).
Health expenditure, private Direct household (outof pocket) spending, private insurance, spending bynon-profit institutions serving households and directservice payments by private corporations. Togetherwith public health expenditure, it makes up totalhealth expenditure. See health expenditure percapita (PPP US$) and health expenditure, public.
Health expenditure, public Current and capitalspending from government (central and local) budgets,
external borrowings and grants (including donationsfrom international agencies and non-governmentalorganizations) and social (or compulsory) health insur-ance funds. Together with private health expendi-ture, it makes up total health expenditure. See healthexpenditure per capita (PPP US$) and health expen-diture, private.
HIPC completion point The date at which a coun-try included in the Debt Initiative for HeavilyIndebted Poor Countries (HIPCs) successfully com-pletes the key structural reforms agreed on at theHIPC decision point, including developing andimplementing a poverty reduction strategy. Thecountry then receives the bulk of its debt reliefunder the HIPC initiative without further policyconditions.
HIPC decision point The date at which a heavilyindebted poor country with an established trackrecord of good performance under adjustment pro-grammes supported by the International MonetaryFund and the World Bank commits, under the DebtInitiative for Heavily Indebted Poor Countries(HIPCs), to undertake additional reforms and todevelop and implement a poverty reduction strategy.
HIV/AIDS, people living with The estimated num-ber of people living with HIV/AIDS at the end of theyear specified.
HIV prevalence among pregnant women The per-centage of pregnant women in the specified age groupwho are infected with HIV.
Human development index (HDI) A compositeindex measuring average achievement in three basicdimensions of human development—a long andhealthy life, knowledge and a decent standard of liv-ing. For details on how the index is calculated, seetechnical note 1.
Human poverty index (HPI-1) for developingcountries A composite index measuring depriva-tions in the three basic dimensions captured in thehuman development index—a long and healthy life,knowledge and a decent standard of living. For detailson how the index is calculated, see technical note 1.
Human poverty index (HPI-2) for selected OECDcountries A composite index measuring depriva-tions in the three basic dimensions captured in thehuman development index—a long and healthy life,knowledge and a decent standard of living—and alsocapturing social exclusion. For details on how theindex is calculated, see technical note 1.
DEFINITIONS OF STATISTICAL TERMS 353
hdr03-17 backmatter2-051903.qxd 02/06/03 14:45 Page 353

Illiteracy rate, adult Calculated as 100 minus theadult literacy rate. See literacy rate, adult.
Immunization, one-year-olds fully immunizedagainst measles or tuberculosis One-year-oldsinjected with an antigen or a serum containing spe-cific antibodies against measles or tuberculosis.
Imports from developing countries admitted freeof duties The value of exports of goods (excludingarms) from developing countries that are admittedwithout a tariff.
Imports of goods and services The value of allgoods and other market services received from therest of the world. Included is the value of merchan-dise, freight, insurance, transport, travel, royalties,licence fees and other services, such as communica-tion, construction, financial, information, business,personal and government services. Excluded arelabour and property income and transfer payments.
Income poverty line, population below The per-centage of the population living below the specifiedpoverty line:• $1 a day—at 1985 international prices (equivalent
to $1.08 at 1993 international prices), adjusted forpurchasing power parity.
• $2 a day—at 1985 international prices (equivalentto $2.15 at 1993 international prices), adjusted forpurchasing power parity.
• $4 a day—at 1990 international prices, adjustedfor purchasing power parity.
• $11 a day (per person for a family of three)—at1994 international prices, adjusted for purchas-ing power parity.
• National poverty line—the poverty line deemedappropriate for a country by its authorities. Nationalestimates are based on population-weighted sub-group estimates from household surveys.
• 50% of median income—50% of the medianadjusted household disposable income.
See PPP (purchasing power parity).
Income or consumption, national, share of poor-est 20% in The share of income or consumptionaccruing to the poorest 20% of the population.Data on personal or household income or con-sumption come from nationally representativehousehold surveys.
Income or consumption, shares of The shares ofincome or consumption accruing to subgroups ofpopulation indicated by deciles or quintiles, based onnational household surveys covering various years.Consumption surveys produce results showing lower
levels of inequality between poor and rich than doincome surveys, as poor people generally consume agreater share of their income. Because data comefrom surveys covering different years and using dif-ferent methodologies, comparisons between countriesmust be made with caution.
Infant mortality rate The probability of dyingbetween birth and exactly one year of age, expressedper 1,000 live births.
Internally displaced people People who are dis-placed within their own country and to whom theUnited Nations High Commissioner for Refugees(UNHCR) extends protection or assistance, or both,generally pursuant to a special request by a compe-tent organ of the United Nations.
Internet users People with access to the worldwidenetwork.
Labour force All those employed (including peopleabove a specified age who, during the referenceperiod, were in paid employment, at work, self-employed or with a job but not at work) and unem-ployed (including people above a specified age who,during the reference period, were without work, cur-rently available for work and seeking work).
Land covered by forest Forest and other woodedland, as defined in the Food and Agriculture Orga-nization’s Global Forest Resources Assessment2000 (FAO 2001), as a share of the total land area.
Legislators, senior officials and managers, femaleWomen’s share of positions defined according to theInternational Standard Classification of Occupations(ISCO-88) to include legislators, senior governmentofficials, traditional chiefs and heads of villages, seniorofficials of special interest organizations, corporatemanagers, directors and chief executives, productionand operations department managers and other depart-ment and general managers.
Life expectancy at birth The number of years anewborn infant would live if prevailing patterns of age-specific mortality rates at the time of birth were to staythe same throughout the child’s life.
Life expectancy index One of the three indices onwhich the human development index is built. Fordetails on how the index is calculated, see technicalnote 1.
Literacy rate, adult The percentage of people aged15 and above who can, with understanding, both
354 HUMAN DEVELOPMENT REPORT 2003
hdr03-17 backmatter2-051903.qxd 02/06/03 14:45 Page 354

read and write a short, simple statement related totheir everyday life.
Literacy rate, youth The percentage of people aged15–24 who can, with understanding, both read andwrite a short, simple statement related to their every-day life.
Literacy skills, functional, people lacking The shareof the population aged 16–65 scoring at level 1 on theprose literacy scale of the International Adult Liter-acy Survey. Most tasks at this level require the readerto locate a piece of information in the text that is iden-tical to or synonymous with the information given inthe directive.
Malaria cases The total number of malaria casesreported to the World Health Organization by coun-tries in which malaria is endemic. Many countriesreport only laboratory-confirmed cases, but many inSub-Saharan Africa report clinically diagnosed casesas well.
Malaria prevention, children under five The per-centage of children under five sleeping underinsecticide-treated bed nets.
Malaria-related mortality rate The total number ofdeaths caused by malaria per 100,000 people.
Malaria treatment, children under five with feverThe percentage of children under five who were illwith fever in the two weeks before the survey andreceived antimalarial drugs.
Market activities Defined according to the 1993revised UN System of National Accounts to includeemployment in establishments, primary productionnot in establishments, services for income and otherproduction of goods not in establishments. See non-market activities and work time, total.
Maternal mortality ratio The annual number ofdeaths of women from pregnancy-related causes per100,000 live births.
Military expenditure All expenditures of the defenceministry and other ministries on recruiting and train-ing military personnel as well as on construction andpurchase of military supplies and equipment. Militaryassistance is included in the expenditures of thedonor country.
Non-market activities Defined according to the1993 revised UN System of National Accounts toinclude household maintenance (cleaning, laundry and
meal preparation and cleanup), management andshopping for own household; care for children, thesick, the elderly and the disabled in own household;and community services. See market activities andwork time, total.
Official aid Grants or loans that meet the same stan-dards as for official development assistance (ODA)except that recipient countries do not qualify asrecipients of ODA. These countries are identified inpart II of the Development Assistance Committee(DAC) list of recipient countries, which includesmore advanced countries of Central and EasternEurope, the countries of the former Soviet Union andcertain advanced developing countries and territories.
Official development assistance (ODA), net Dis-bursements of loans made on concessional terms (netof repayments of principal) and grants by officialagencies of the members of the Development Assis-tance Committee (DAC), by multilateral institutionsand by non-DAC countries to promote economicdevelopment and welfare in countries and territoriesin part I of the DAC list of aid recipients. It includesloans with a grant element of at least 25% (calculatedat a rate of discount of 10%).
Official development assistance (ODA) providedto help build trade capacity ODA directed to activ-ities intended to enhance the ability of the recipientcountry to formulate and implement a trade devel-opment strategy and create an enabling environmentfor increasing the volume and value added of exports,diversifying export products and markets and increas-ing foreign investment to generate jobs and trade; stim-ulate trade by domestic firms and encourageinvestment in trade-oriented industries; or participatein and benefit from the institutions, negotiations andprocesses that shape national trade policy and the rulesand practices of international commerce.
Official development assistance (ODA) to basicsocial services ODA directed to basic social ser-vices, which include basic education (primary edu-cation, early childhood education and basic life skillsfor youth and adults), basic health (including basichealth care, basic health infrastructure, basic nutri-tion, infectious disease control, health education andhealth personnel development) and population poli-cies and programmes and reproductive health (pop-ulation policy and administrative management,reproductive health care, family planning, control ofsexually transmitted diseases, including HIV/AIDS,and personnel development for population and repro-ductive health). Aid to water supply and sanitationis included only if it has a poverty focus.
DEFINITIONS OF STATISTICAL TERMS 355
hdr03-17 backmatter2-051903.qxd 02/06/03 14:45 Page 355
356 HUMAN DEVELOPMENT REPORT 2003
Official development assistance (ODA) to leastdeveloped countries See official development assis-tance (ODA), net and country classifications forleast developed countries.
Official development assistance (ODA), untiedbilateral ODA for which the associated goods andservices may be fully and freely procured in sub-stantially all countries and that is given by one coun-try to another.
Oral rehydration therapy use rate The percentageof all cases of diarrhoea in children under age five inwhich the child received increased fluids and con-tinued feeding.
Orphans’ school attendance rate As reported inhousehold surveys, the proportion of children aged10–14 who have lost both natural parents and are cur-rently attending school. It is shown as a percentageof the proportion of non-orphaned children of thesame age who live with at least one parent and areattending school.
Patents granted to residents Refers to documentsissued by a government office that describe an inven-tion and create a legal situation in which the patentedinvention can normally be exploited (made, used,sold, imported) only by or with the authorization ofthe patentee. The protection of inventions is gener-ally limited to 20 years from the filing date of the appli-cation for the grant of a patent.
Physicians Includes graduates of a faculty or schoolof medicine who are working in any medical field(including teaching, research and practice).
Population growth rate, annual Refers to the aver-age annual exponential growth rate for the periodindicated. See population, total.
Population, total Refers to the de facto population,which includes all people actually present in a givenarea at a given time.
Poverty gap ratio The mean distance below the $1(1993 PPP US$) a day poverty line, expressed as apercentage of the poverty line. The mean is taken overthe entire population, counting the non-poor as hav-ing zero poverty gap. The measure reflects the depthof poverty as well as its incidence.
PPP (purchasing power parity) A rate of exchangethat accounts for price differences across countries,allowing international comparisons of real output andincomes. At the PPP US$ rate (as used in this Report),
PPP US$1 has the same purchasing power in thedomestic economy as $1 has in the United States.
Private flows, other A category combining non-debt-creating portfolio equity investment flows(the sum of country funds, depository receipts anddirect purchases of shares by foreign investors),portfolio debt flows (bond issues purchased byforeign investors) and bank and trade-related lend-ing (commercial bank lending and other commer-cial credits).
Probability at birth of not surviving to a specifiedage Calculated as 1 minus the probability of surviv-ing to a specified age for a given cohort. See proba-bility at birth of surviving to a specified age.
Probability at birth of surviving to a specified ageThe probability of a newborn infant surviving to aspecified age if subject to prevailing patterns of age-specific mortality rates.
Professional and technical workers, femaleWomen’s share of positions defined according tothe International Standard Classification of Occu-pations (ISCO-88) to include physical, mathematicaland engineering science professionals (and associateprofessionals), life science and health professionals(and associate professionals), teaching professionals(and associate professionals) and other professionalsand associate professionals.
Protected area, as a ratio to surface area Refersto totally or partially protected areas of at least1,000 hectares that are designated as national parks,natural monuments, nature reserves or wildlife sanc-tuaries, protected landscapes and seascapes or sci-entific reserves with limited public access. The datado not include sites protected under local or provin-cial law.
Refugees People who have fled their country becauseof a well-founded fear of persecution for reasons oftheir race, religion, nationality, political opinion ormembership in a particular social group and who can-not or do not want to return. Country of asylum isthe country in which a refugee has filed a claim of asy-lum but has not yet received a decision or is other-wise registered as an asylum seeker. Country oforigin refers to the claimant’s nationality or countryof citizenship.
Research and development expenditures Currentand capital expenditures (including overhead) oncreative, systematic activity intended to increase thestock of knowledge. Included are fundamental and
hdr03-17 backmatter2-051903.qxd 02/06/03 14:45 Page 356
applied research and experimental developmentwork leading to new devices, products or processes.
Royalties and licence fees, receipts of Receipts byresidents from non-residents for the authorized useof intangible, non-produced, non-financial assets andproprietary rights (such as patents, trademarks, copy-rights, franchises and industrial processes) and for theuse, through licensing agreements, of produced orig-inals of prototypes (such as films and manuscripts).Data are based on the balance of payments.
Sanitation facilities, population with access toimproved The percentage of the population withaccess to adequate excreta disposal facilities, such asa connection to a sewer or septic tank system, a pour-flush latrine, a simple pit latrine or a ventilatedimproved pit latrine. An excreta disposal system isconsidered adequate if it is private or shared (but notpublic) and if it can effectively prevent human, ani-mal and insect contact with excreta.
Science, math and engineering, tertiary students inThe share of tertiary students enrolled in natural sci-ences; engineering; mathematics and computer sci-ences; architecture and town planning; transport andcommunications; trade, craft and industrial pro-grammes; and agriculture, forestry and fisheries. Seeeducation levels.
Scientists and engineers in R&D People trained towork in any field of science who are engaged in pro-fessional research and development (R&D) activity.Most such jobs require the completion of tertiaryeducation.
Seats in parliament held by women Refers to seatsheld by women in a lower or single house or an upperhouse or senate, where relevant.
Solid fuels, population using The share of the pop-ulation using solid fuels, which include traditional fuelssuch as fuel wood, charcoal, bagasse (sugar canewaste) and animal and vegetable wastes.
Tariffs on agricultural products, textiles and cloth-ing from developing countries, average The simpleaverage of all ad valorem tariff rates applied to importsof agricultural products (plant and animal products,including tree crops but excluding timber and fishproducts), textiles and clothing (including naturaland man-made fibres and fabrics and articles of cloth-ing made from them) from developing countries.The tariff rates used are the available ad valoremrates, including most favoured nation (MFN) and non-MFN (largely preferential) rates.
Telephone mainlines Telephone lines connecting acustomer’s equipment to the public switched tele-phone network.
Tenure, households with access to secure House-holds that own or are purchasing their homes, are rent-ing privately or are in social housing or subtenancy.
Terms of trade The ratio of the export price indexto the import price index measured relative to abase year. A value of more than 100 means that theprice of exports has risen relative to the price ofimports.
Tuberculosis cases The total number of tuberculo-sis cases reported to the World Health Organiza-tion. A tuberculosis case is defined as a patient inwhom tuberculosis has been bacteriologically con-firmed or diagnosed by a clinician.
Tuberculosis cases cured under DOTS The per-centage of estimated new infectious tuberculosiscases cured under the directly observed treatment,short course (DOTS) case detection and treatmentstrategy.
Tuberculosis cases detected under DOTS Thepercentage of estimated new infectious tuberculosiscases detected (diagnosed in a given period) underthe directly observed treatment, short course (DOTS)case detection and treatment strategy.
Tuberculosis-related mortality rate The total num-ber of deaths caused by tuberculosis per 100,000people. The data are compiled from reports pro-vided at registration of death.
Under-five mortality rate The probability of dyingbetween birth and exactly five years of age, expressedper 1,000 live births.
Under height for age, children under age fiveIncludes moderate and severe stunting, defined asmore than two standard deviations below the medianheight for age of the reference population.
Undernourished people People whose food intakeis chronically insufficient to meet their minimumenergy requirements.
Under weight for age, children under age fiveIncludes moderate underweight, defined as morethan two standard deviations below the medianweight for age of the reference population, and severeunderweight, defined as more than three standarddeviations below the median weight.
DEFINITIONS OF STATISTICAL TERMS 357
hdr03-17 backmatter2-051903.qxd 02/06/03 14:45 Page 357

Unemployment Refers to all people above a speci-fied age who are not in paid employment or self-employed, but are available for work and have takenspecific steps to seek paid employment or self-employ-ment.
Unemployment, long term Unemployment lasting12 months or longer. See unemployment.
Unemployment rate The unemployed divided by thelabour force (those employed plus the unemployed).
Unemployment, youth Refers to unemploymentbetween the ages of 15 or 16 and 24, depending onthe national definition. See unemployment.
Urban population The midyear population of areasclassified as urban according to the criteria used byeach country, as reported to the United Nations. Seepopulation, total.
Water source, improved, population without sus-tainable access to Calculated as 100 minus the per-centage of the population with sustainable access to
an improved water source. Unimproved sourcesinclude vendors, bottled water, tanker trucks andunprotected wells and springs. See water source,improved, population with sustainable access to.
Water source, improved, population with sustainableaccess to The share of the population with reasonableaccess to any of the following types of water supply fordrinking: household connections, public standpipes,boreholes, protected dug wells, protected springs andrainwater collection. Reasonable access is defined as theavailability of at least 20 litres a person per day from asource within one kilometre of the user’s dwelling.
Women in government at ministerial level Definedaccording to each state’s definition of a national exec-utive and may include women serving as ministers andvice ministers and those holding other ministerialpositions, including parliamentary secretaries.
Work time, total Time spent on market and non-market activities as defined according to the 1993revised UN System of National Accounts. See mar-ket activities and non-market activities.
358 HUMAN DEVELOPMENT REPORT 2003
hdr03-17 backmatter2-051903.qxd 02/06/03 14:45 Page 358
Aten, Bettina, Alan Heston and Robert Summers. 2001. “PennWorld Tables 6.0.” University of Pennsylvania, Center forInternational Comparisons, Philadelphia.
———. 2002. “Penn World Tables 6.1.” University of Pennsylva-nia, Center for International Comparisons, Philadelphia.
Birzeit University. 2002. Palestine Human Development Report2002. Ramallah, Occupied Palestinian Territories.
CDIAC (Carbon Dioxide Information Analysis Center). 2003.Trends: A Compendium of Data on Global Change.[http://cdiac.esd.ornl.gov/trends/trends.htm]. March 2003.
FAO (Food and Agriculture Organization of the United Nations).2001. Global Forest Resources Assessment 2000. Rome.
Goldschmidt-Clermont, Luisella, and Elisabetta PagnossinAligisakis. 1995. “Measures of Unrecorded Economic Activ-ities in Fourteen Countries.” Background paper for HumanDevelopment Report 1995. United Nations DevelopmentProgramme, Human Development Report Office, New York.
Harvey, Andrew S. 1995. “Market and Non-Market ProductiveActivity in Less Developed and Developing Countries: Lessonsfrom Time Use.” Background paper for Human DevelopmentReport 1995. United Nations Development Programme,Human Development Report Office, New York.
———. 2001. “National Time Use Data on Market and Non-Market Work by Both Women and Men.” Background paperfor Human Development Report 2001. United NationsDevelopment Programme, Human Development ReportOffice, New York.
Hijab, Nadia. 2003. “Using Process Indicators to Monitor Mater-nal Health.” Background note for Human DevelopmentReport 2003. United Nations Development Programme,Human Development Report Office, New York.
IISS (International Institute for Strategic Studies). 2002. The Mil-itary Balance 2002–2003. Oxford: Oxford University Press.
ILO (International Labour Organization). 2002a. Estimates andProjections of the Economically Active Population,1950–2010. 4th ed., rev. 2. Database. Geneva.
———. 2002b. Key Indicators of the Labour Market 2001–2002.[http://kilm.ilo.org/kilm/]. March 2003.
———. 2002c. Yearbook of Labour Statistics. Geneva.———. 2003a. ILO Database on International Labour Standards
(ILOLEX). [http://ilolex.ilo.ch:1567/english/index.htm].February 2003.
———. 2003b. Laboursta Database. [http://laborsta.ilo.org].March 2003.
IPU (Inter-Parliamentary Union). 1995. Women in Parliaments1945–1995: A World Statistical Survey. Geneva.
———. 2001. Correspondence on women in government at the min-isterial level. March. Geneva.
———. 2003a. Correspondence on year women received the rightto vote and to stand for election and year first woman waselected or appointed to parliament. March. Geneva.
———. 2003b. Parline Database and World Classification of Womenin National Parliaments. [http://www.ipu.org]. March 2003.
ITU (International Telecommunication Union). 2003a. Corre-spondence on telephone mainlines, cellular subscribers, Inter-net users and personal computers. April. Geneva.
———. 2003b. World Telecommunication Indicators. Database.Geneva.
LIS (Luxembourg Income Study). 2002. “Population below Income Poverty Line.” [http://lisweb.ceps.lu/keyfigures/povertytable.htm]. February 2002.
———. 2003. “Relative Poverty Rates for the Total Population,Children and the Elderly.” [http://www.lisproject.org/keyfigures/povertytable.htm]. March 2003.
Mathers, Colin D., Ritu Sadana, Joshua A. Salomon, Christopher J.L. Murray and Alan D. Lopez. 2001. “Healthy Life Expectancyin 191 Countries, 1999.” Lancet 357 (9269): 1685–91.
Milanovic, Branko. 2002. Correspondence on income, inequalityand poverty during the transition from planned to market econ-omy. March. World Bank, Washington, DC.
OECD (Organisation for Economic Co-operation and Develop-ment). 2002a. Economic Outlook. 2 (72). Paris.
———. 2002b. Employment Outlook 2002. Paris.OECD (Organisation for Economic Co-operation and Development),
Development Assistance Committee. 2003a. Correspondence onofficial development assistance disbursed. February. Paris.
———. 2003b. DAC Online. Database. Paris.OECD (Organisation for Economic Co-operation and Develop-
ment) and Statistics Canada. 2000. Literacy in the Infor-mation Age: Final Report on the International AdultLiteracy Survey. Paris.
SIPRI (Stockholm International Peace Research Institute). 2001.SIPRI Yearbook: Armaments, Disarmament and Inter-national Security. Oxford: Oxford University Press.
———. 2003a. Correspondence on military expenditure. March.Stockholm.
———. 2003b. SIPRI Arms Transfers. Database. February. Stock-holm.
Smeeding, Timothy M. 1997. “Financial Poverty in DevelopedCountries: The Evidence from the Luxembourg IncomeStudy.” In United Nations Development Programme, HumanDevelopment Report 1997 Papers: Poverty and HumanDevelopment. New York.
Smeeding, Timothy M., Lee Rainwater and Gary Burtless. 2002.“United States Poverty in a Cross-National Context.” InSheldon H. Danziger and Robert H. Haveman, eds., Under-standing Poverty. New York: Russell Sage Foundation; andCambridge, Mass.: Harvard University Press.
UN (United Nations). 2002a. Correspondence on time use surveys.February. Department of Economic and Social Affairs, Sta-tistics Division, New York.
———. 2002b. World Urbanization Prospects: The 2001 Revi-sion. Department of Economic and Social Affairs, PopulationDivision, New York.
———. 2003a. Millennium Indicators Database. Department ofEconomic and Social Affairs, Statistics Division, New York.[http://millenniumindicators.un.org]. March 2003.
———. 2003b. “Multilateral Treaties Deposited with the Secretary-General.” [http://untreaty.un.org]. February 2003.
———. 2003c. United Nations Population Division Database onContraceptive Use. March. Department of Economic andSocial Affairs, Population Division, New York.
STATISTICAL REFERENCES 359
Statistical references
hdr03-17 backmatter2-051903.qxd 02/06/03 14:45 Page 359

———. 2003d. World Population Prospects 1950–2050: The2002 Revision. Database. Department of Economic andSocial Affairs, Population Division, New York.
UNAIDS (Joint United Nations Programme on HIV/AIDS) andWHO (World Health Organization). 2003. Correspondenceon adult HIV/AIDS prevalence rates. March. Geneva.
UNAIDS (Joint United Nations Programme on HIV/AIDS). 2002.Report on the Global HIV/AIDS Epidemic 2002. Geneva.
UNCTAD (United Nations Conference on Trade and Develop-ment). 2001. “Third United Nations Conference on the LeastDeveloped Countries.” [http://www.unctad.org/conference/].April 2002.
UNDP (United Nations Development Programme). 2002. Bosniaand Herzegovina Human Development Report 2002. Sara-jevo.
UNEP (United Nations Environment Programme) World Conser-vation Monitoring Centre and IUCN (The World Conserva-tion Union) World Commission on Protected Areas. 2003.World Database on Protected Areas. [http://sea.unep-wcmc.org/wdbpa/UN.cfm]. April 2003.
UNESCO (United Nations Educational, Scientific and CulturalOrganization). 1997. International Standard Classification ofEducation 1997. [http://portal.unesco.org/uis/TEMPLATE/pdf/isced/ISCED_A.pdf]. March 2003.
———. 1999. Statistical Yearbook 1999. Paris.UNESCO Institute for Statistics. 2001. Correspondence on com-
bined gross enrolment ratio. March. Paris.———. 2003a. Correspondence on adult and youth literacy rates.
January. Montreal.———. 2003b. Correspondence on combined gross enrolment
ratios. March. Montreal.———. 2003c. Correspondence on education expenditure. Febru-
ary. Montreal.———. 2003d. Correspondence on gross and net enrolment ratios
and children reaching grade 5. February. Montreal.———. 2003e. “Literacy Assessment and Monitoring Programme.”
Background note for Human Development Report 2003.United Nations Development Programme, Human Devel-opment Report Office, New York.
UNFPA (United Nations Population Fund). 2003. “BuildingCapacity to Ensure the Continuity of Population Censuses.”Background note for Human Development Report 2003.United Nations Development Programme, Human Devel-opment Report Office, New York.
UNHCR (United Nations High Commissioner for Refugees). 2002.Statistical Yearbook 2001. Geneva.
UNICEF (United Nations Children’s Fund). 2000. The State of theWorld’s Children 2001. New York: Oxford University Press.
———. 2003a. Correspondence on infant and under-five mortalityrates. January. New York.
———. 2003b. The State of the World’s Children 2003. New York:Oxford University Press.
UNICEF (United Nations Children’s Fund), WHO (World HealthOrganization) and UNFPA (United Nations PopulationFund). 1997. Guidelines for Monitoring the Availability andUse of Obstetric Services. New York.
UNICRI (United Nations Interregional Crime and Justice ResearchInstitute). 2002. Correspondence on crime victims. March.Turin.
WHO (World Health Organization). 1994. Indicators to Moni-tor Maternal Health Goals: Report of a Technical Work-ing Group, Geneva, 8–12 November 1993. Geneva.
———. 2002. World Health Report 2002: Reducing Risks, Pro-moting Healthy Life. Geneva.
———. 2003a. Correspondence on cigarette consumption. March.Geneva.
———. 2003b. Correspondence on health expenditure. March.Geneva.
———. 2003c. Correspondence on health personnel. March. Geneva.———. 2003d. Correspondence on immunization against tuber-
culosis and measles. March. Geneva.———. 2003e. Global Tuberculosis Control: WHO Report 2003.
[http://www.who.int/gtb/publications/globrep/]. March2003.
———. 2003f. “Measuring Healthy Life Expectancy.” Backgroundnote for Human Development Report 2003. United NationsDevelopment Programme, Human Development ReportOffice, New York.
———. Forthcoming. World Health Report 2003. Geneva.WIPO (World Intellectual Property Organization). 2003. Intel-
lectual Property Statistics. Publication B. Geneva.World Bank. 2002. World Development Indicators 2002.
CD-ROM. Washington, DC.———. 2003a. Correspondence on GDP per capita annual growth
rates. March. Washington, DC.———. 2003b. “HIPC Initiative: Status of Country Cases Considered
under the Initiative, March 2003.” [http://www.worldbank.org/hipc/progress-to-date/status_table_Mar03.pdf]. March 2003.
———. 2003c. World Development Indicators 2003. CD-ROM.Washington, DC.
———. Forthcoming. Global Development Finance 2004. Wash-ington, DC.
360 HUMAN DEVELOPMENT REPORT 2003
hdr03-17 backmatter2-051903.qxd 02/06/03 14:45 Page 360

CLASSIFICATION OF COUNTRIES 361
Classification of countries
High human development (HDI 0.800 and above)
Medium human development(HDI 0.500–0.799)
Low humandevelopment(HDI below 0.500)
ArgentinaAustraliaAustriaBahamasBahrainBarbadosBelarusBelgiumBrunei DarussalamCanadaChileCosta RicaCroatiaCubaCyprusCzech RepublicDenmarkEstoniaFinlandFranceGermanyGreeceHong Kong, China (SAR)HungaryIcelandIrelandIsraelItalyJapanKorea, Rep. ofKuwaitLatviaLithuaniaLuxembourgMaltaMexicoNetherlandsNew ZealandNorwayPolandPortugalQatarSaint Kitts and NevisSeychelles
SingaporeSlovakiaSloveniaSpainSwedenSwitzerlandTrinidad and TobagoUnited Arab EmiratesUnited KingdomUnited StatesUruguay(55 countries or areas)
AlbaniaAlgeriaAntigua and BarbudaArmeniaAzerbaijanBangladeshBelizeBhutanBoliviaBosnia and HerzegovinaBotswanaBrazilBulgariaCambodiaCape VerdeChinaColombiaComorosCongoDominicaDominican RepublicEcuadorEgyptEl SalvadorEquatorial GuineaFijiGabonGeorgiaGhanaGrenadaGuatemalaGuyanaHondurasIndiaIndonesiaIran, Islamic Rep. ofJamaicaJordanKazakhstanKyrgyzstanLao People’s Dem. Rep.LebanonLesothoLibyan Arab Jamahiriya
Macedonia, TFYRMalaysiaMaldivesMauritiusMoldova, Rep. ofMongoliaMoroccoMyanmarNamibiaNicaraguaOccupied Palestinian TerritoriesOmanPanamaPapua New GuineaParaguayPeruPhilippinesRomaniaRussian FederationSaint LuciaSaint Vincent and
the GrenadinesSamoa (Western)São Tomé and PrincipeSaudi ArabiaSolomon IslandsSouth AfricaSri LankaSudanSurinameSwazilandSyrian Arab RepublicTajikistanThailandTogoTunisiaTurkeyTurkmenistanUkraineUzbekistanVanuatuVenezuelaViet Nam(86 countries or areas)
AngolaBeninBurkina FasoBurundiCameroonCentral African RepublicChadCongo, Dem. Rep. of theCôte d’IvoireDjiboutiEritreaEthiopiaGambiaGuineaGuinea-BissauHaitiKenyaMadagascarMalawiMaliMauritaniaMozambiqueNepalNigerNigeriaPakistanRwandaSenegalSierra LeoneTanzania, U. Rep. ofUgandaYemenZambiaZimbabwe(34 countries or areas)
Countries in the human development aggregates a
a. Excludes the following UN member countries for which the HDI cannot be computed: Afghanistan, Andorra, Iraq, Kiribati, the Democratic Republic of Korea, Liberia,Liechtenstein, the Marshall Islands, the Federated States of Micronesia, Monaco, Nauru, Palau, San Marino, Serbia and Montenegro, Somalia, Timor-Leste, Tonga and Tuvalu.
hdr03-17 backmatter2-051903.qxd 02/06/03 14:45 Page 361
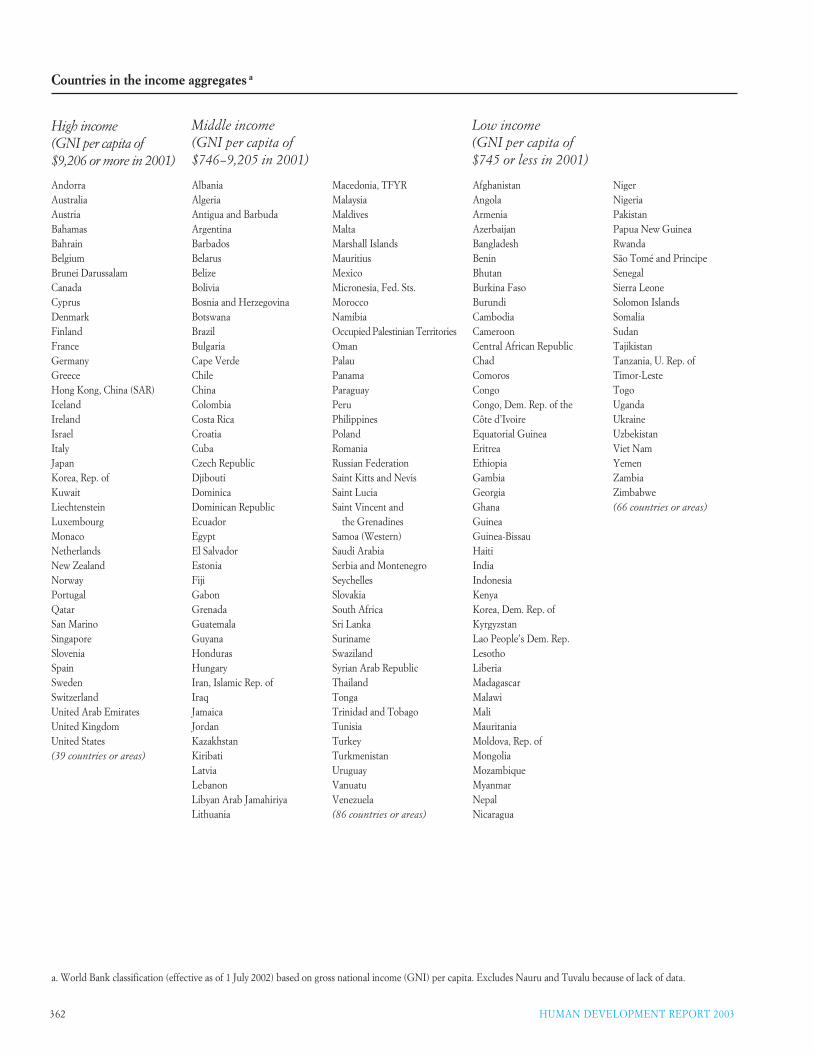
362 HUMAN DEVELOPMENT REPORT 2003
a. World Bank classification (effective as of 1 July 2002) based on gross national income (GNI) per capita. Excludes Nauru and Tuvalu because of lack of data.
High income(GNI per capita of$9,206 or more in 2001)
Middle income(GNI per capita of$746–9,205 in 2001)
Low income(GNI per capita of$745 or less in 2001)
AndorraAustraliaAustriaBahamasBahrainBelgiumBrunei DarussalamCanadaCyprusDenmarkFinlandFranceGermanyGreeceHong Kong, China (SAR)IcelandIrelandIsraelItalyJapanKorea, Rep. ofKuwaitLiechtensteinLuxembourgMonacoNetherlandsNew ZealandNorwayPortugalQatarSan MarinoSingaporeSloveniaSpainSwedenSwitzerlandUnited Arab EmiratesUnited KingdomUnited States(39 countries or areas)
AlbaniaAlgeriaAntigua and BarbudaArgentinaBarbadosBelarusBelizeBoliviaBosnia and HerzegovinaBotswanaBrazilBulgariaCape VerdeChileChinaColombiaCosta RicaCroatiaCubaCzech RepublicDjiboutiDominicaDominican RepublicEcuadorEgyptEl SalvadorEstoniaFijiGabonGrenadaGuatemalaGuyanaHondurasHungaryIran, Islamic Rep. ofIraqJamaicaJordanKazakhstanKiribatiLatviaLebanonLibyan Arab JamahiriyaLithuania
Macedonia, TFYRMalaysiaMaldivesMaltaMarshall IslandsMauritiusMexicoMicronesia, Fed. Sts.MoroccoNamibiaOccupied Palestinian TerritoriesOmanPalauPanamaParaguayPeruPhilippinesPolandRomaniaRussian FederationSaint Kitts and NevisSaint LuciaSaint Vincent and
the GrenadinesSamoa (Western)Saudi ArabiaSerbia and MontenegroSeychellesSlovakiaSouth AfricaSri LankaSurinameSwazilandSyrian Arab RepublicThailandTongaTrinidad and TobagoTunisiaTurkeyTurkmenistanUruguayVanuatuVenezuela(86 countries or areas)
AfghanistanAngolaArmeniaAzerbaijanBangladeshBeninBhutanBurkina FasoBurundiCambodiaCameroonCentral African RepublicChadComorosCongoCongo, Dem. Rep. of theCôte d’IvoireEquatorial GuineaEritreaEthiopiaGambiaGeorgiaGhanaGuineaGuinea-BissauHaitiIndiaIndonesiaKenyaKorea, Dem. Rep. ofKyrgyzstanLao People’s Dem. Rep.LesothoLiberiaMadagascarMalawiMaliMauritaniaMoldova, Rep. ofMongoliaMozambiqueMyanmarNepalNicaragua
NigerNigeriaPakistanPapua New GuineaRwandaSão Tomé and PrincipeSenegalSierra LeoneSolomon IslandsSomaliaSudanTajikistanTanzania, U. Rep. ofTimor-LesteTogoUgandaUkraineUzbekistanViet NamYemenZambiaZimbabwe(66 countries or areas)
Countries in the income aggregates a
hdr03-17 backmatter2-051903.qxd 02/06/03 14:45 Page 362
CLASSIFICATION OF COUNTRIES 363
AfghanistanAlgeriaAngolaAntigua and BarbudaArgentinaBahamasBahrainBangladeshBarbadosBelizeBeninBhutanBoliviaBotswanaBrazilBrunei DarussalamBurkina FasoBurundiCambodiaCameroonCape VerdeCentral African RepublicChadChileChinaColombiaComorosCongoCongo, Dem. Rep. of theCosta RicaCôte d’IvoireCubaCyprusDjiboutiDominicaDominican RepublicEcuadorEgyptEl SalvadorEquatorial GuineaEritreaEthiopiaFijiGabonGambiaGhanaGrenadaGuatemalaGuineaGuinea-BissauGuyanaHaiti
HondurasHong Kong, China (SAR)IndiaIndonesiaIran, Islamic Rep. ofIraqJamaicaJordanKenyaKiribatiKorea, Dem. Rep. ofKorea, Rep. ofKuwaitLao People’s Dem. Rep.LebanonLesothoLiberiaLibyan Arab JamahiriyaMadagascarMalawiMalaysiaMaldivesMaliMarshall IslandsMauritaniaMauritiusMexicoMicronesia, Fed. Sts.MongoliaMoroccoMozambiqueMyanmarNamibiaNauruNepalNicaraguaNigerNigeriaOccupied Palestinian
TerritoriesOmanPakistanPalauPanamaPapua New GuineaParaguayPeruPhilippinesQatarRwandaSaint Kitts and NevisSaint Lucia
Saint Vincent and the Grenadines
Samoa (Western)São Tomé and PrincipeSaudi ArabiaSenegalSeychellesSierra LeoneSingaporeSolomon IslandsSomaliaSouth AfricaSri LankaSudanSurinameSwazilandSyrian Arab RepublicTanzania, U. Rep. ofThailandTimor-LesteTogoTongaTrinidad and TobagoTunisiaTurkeyTuvaluUgandaUnited Arab EmiratesUruguayVanuatuVenezuelaViet NamYemenZambiaZimbabwe(137 countries or areas)
Least developedcountriesAfghanistanAngolaBangladeshBeninBhutanBurkina FasoBurundiCambodiaCape VerdeCentral African RepublicChadComorosCongo, Dem. Rep. of the
DjiboutiEquatorial GuineaEritreaEthiopiaGambiaGuineaGuinea-BissauHaitiKiribatiLao People’s Dem. Rep.LesothoLiberiaMadagascarMalawiMaldivesMaliMauritaniaMozambiqueMyanmarNepalNigerRwandaSamoa (Western)São Tomé and PrincipeSenegalSierra LeoneSolomon IslandsSomaliaSudanTanzania, U. Rep. ofTogoTuvaluUgandaVanuatuYemenZambia(49 countries or areas)
Central andEastern Europeand theCommonwealth of IndependentStates (CIS)
AlbaniaArmeniaAzerbaijanBelarusBosnia and HerzegovinaBulgaria
CroatiaCzech RepublicEstoniaGeorgiaHungaryKazakhstanKyrgyzstanLatviaLithuaniaMacedonia, TFYRMoldova, Rep. ofPolandRomaniaRussian FederationSerbia and MontenegroSlovakiaSloveniaTajikistanTurkmenistanUkraineUzbekistan(27 countries or areas)
OECD
AustraliaAustriaBelgiumCanadaCzech RepublicDenmarkFinlandFranceGermanyGreeceHungaryIcelandIrelandItalyJapanKorea, Rep. ofLuxembourgMexicoNetherlandsNew ZealandNorwayPolandPortugalSlovakiaSpainSwedenSwitzerland
TurkeyUnited KingdomUnited States(30 countries or areas)
High-income OECD countriesa
AustraliaAustriaBelgiumCanadaDenmarkFinlandFranceGermanyGreeceIcelandIrelandItalyJapanKorea, Rep. ofLuxembourgNetherlandsNew ZealandNorwayPortugalSpainSwedenSwitzerlandUnited KingdomUnited States(24 countries or areas)
Developing countries
Countries in the major world aggregates
a. Excludes the Czech Republic, Hungary, Mexico, Poland, Slovakia and Turkey.
hdr03-17 backmatter2-051903.qxd 02/06/03 14:45 Page 363

364 HUMAN DEVELOPMENT REPORT 2003
Arab States Sub-Saharan AfricaAsia and the PacificLatin America andthe Caribbean Southern Europe
AlgeriaBahrainDjiboutiEgyptIraqJordanKuwaitLebanonLibyan Arab JamahiriyaMoroccoOccupied Palestinian
TerritoriesOmanQatarSaudi ArabiaSomaliaSudanSyrian Arab RepublicTunisiaUnited Arab EmiratesYemen(20 countries or areas)
East Asia and the PacificBrunei DarussalamCambodiaChinaFijiHong Kong, China (SAR)IndonesiaKiribatiKorea, Dem. Rep. ofKorea, Rep. ofLao People’s Dem. Rep.MalaysiaMarshall IslandsMicronesia, Fed. Sts.MongoliaMyanmarNauruPalauPapua New GuineaPhilippinesSamoa (Western)SingaporeSolomon IslandsThailandTimor-LesteTongaTuvaluVanuatuViet Nam(28 countries or areas)
South AsiaAfghanistanBangladeshBhutanIndiaIran, Islamic Rep. ofMaldivesNepalPakistanSri Lanka(9 countries or areas)
Antigua and BarbudaArgentinaBahamasBarbadosBelizeBoliviaBrazilChileColombiaCosta RicaCubaDominicaDominican RepublicEcuadorEl SalvadorGrenadaGuatemalaGuyanaHaitiHondurasJamaicaMexicoNicaraguaPanamaParaguayPeruSaint Kitts and NevisSaint LuciaSaint Vincent and
the GrenadinesSurinameTrinidad and TobagoUruguayVenezuela(33 countries or areas)
Cyprus Turkey(2 countries or areas)
AngolaBeninBotswanaBurkina FasoBurundiCameroonCape VerdeCentral African RepublicChadComorosCongoCongo, Dem. Rep. of theCôte d’IvoireEquatorial GuineaEritreaEthiopiaGabonGambiaGhanaGuineaGuinea-BissauKenyaLesothoLiberiaMadagascarMalawiMaliMauritaniaMauritiusMozambiqueNamibiaNigerNigeriaRwandaSão Tomé and PrincipeSenegalSeychellesSierra LeoneSouth AfricaSwazilandTanzania, U. Rep. ofTogoUgandaZambiaZimbabwe(45 countries or areas)
Developing countries in the regional aggregates
hdr03-17 backmatter2-051903.qxd 02/06/03 14:45 Page 364

INDEX TO INDICATORS 365
INDEX TO INDICATORS
Indicator Indicator tables
Indicator Indicator tables
AAgriculture, OECD country support to domestic MDG 7 Armed forces index 20total 20
Arms transfers, conventional exports share 20total 20
imports, total 20
BBirths attended by skilled health personnel MDG 3, 6Birth-weight, infants with low 7
CCarbon dioxide emissions per capita MDG 5, 19share of world total 19
Cellular mobile subscribers 11Children reaching grade 5 MDG 1, 10Chlorofluorocarbons, consumption of MDG 5Cigarette consumption per adult 7Computers in use, personal MDG 10Condom use at last high-risk sexfemale MDG 4male MDG 4
Consumer price index, average annual change in 12Contraceptive prevalence 6Contributing family workers female 25male 25
Crime, people victimized by assault 21bribery (corruption) 21property crime 21robbery 21sexual assault 21total crime 21
DDebt relief committed under HIPC initiative MDG 9Debt service, totalas % of exports of goods and services MDG 9, 16as % of GDP 16, 17
Drugs, essential, population with access to MDG 10, 6
EEarned income, estimatedfemale 22
male 22ratio of female to male 23
Economic activity rate, female 25as % of male rate 25index 25
Education expenditure, public as % of GDP 9, 17as % of total government expenditure 9pre-primary and primary 9secondary 9tertiary 9
Education index 1Electricity consumption per capita 19Employment by economic activity agriculturefemale 25male 25
industry female 25male 25
non-agricultural wage employment, female share of MDG 2services female 25male 25
Energy use, GDP per unit of MDG 5, 19Enrolment ratio, gross combined primary, secondary and tertiary 1, 30female 22male 22
tertiaryfemale 24female as % of male 24
Enrolment ratio, net primary MDG 1, 10female 24female as % of male 24
secondary 10female 24female as % of male 24
Enrolments, ratio of girls to boysprimary MDG 2secondary MDG 2tertiary MDG 2
Environmental treaties, ratification of 19Exports high technology 14of goods and services 14manufactured 14primary 14
FFertility rate, total 5, 30Foreign direct investment, net inflows of 16Fuel consumption, traditional 19
hdr03-17 backmatter2-051903.qxd 02/06/03 14:45 Page 365

366 HUMAN DEVELOPMENT REPORT 2003
GGDP index 1GDP per capita (PPP US$) 1, 12, 30annual growth rate 12highest value during 1975–2001 12year of highest value 12
GDP per capita in constant US$ 12GDP, total in PPP US$ billions 12in US$ billions 12
Gender empowerment measure (GEM) 23Gender-related development index (GDI) 22
HHealth expenditure per capita 6private 6public 6, 17
HIV/AIDSadults living with 7, 30children living with 7prevalence among pregnant women aged 15–24in major urban areas MDG 4outside major urban areas MDG 4
women living with 7Human development index (HDI) 1trends in 2
Human poverty index (HPI-1) for developing countries 3
Human poverty index (HPI-2) for selected OECD countries 4
Human rights instruments, status of major international 28
IIlliteracy rate, adult 3Immunization of one-year-oldsagainst measles MDG 3, 6against tuberculosis 6
Imports by developed countries admitted free of dutiesfrom developing countries MDG 7 from least developed countries MDG 7
Imports of goods and services 14Income inequality measures Gini index 13income ratio, richest 10% to poorest 10% 13income ratio, richest 20% to poorest 20% 13
Income or consumption, share of poorest 10% 13poorest 20% MDG 1, 13richest 10% 13richest 20% 13
Infant mortality rate MDG 3, 8, 30Internally displaced people 20Internet users MDG 10, 11
LLabour rights conventions, status of fundamental 29Land areacovered by forest MDG 5protected area to surface area MDG 5
Life expectancy at birth 1, 8, 30female 22male 22
Life expectancy index 1Literacy rate, adult 1, 10, 30female 22, 24female as % of male MDG 2, 24male 22
Literacy rate, youth MDG 1, 10female 24female as % of male 24
Literacy skills, functional, people lacking 4
MMalaria cases MDG 4, 7prevention, children under five with
insecticide-treated bed nets MDG 4related mortality rateall ages MDG 4children aged 0–4 MDG 4
treatment, children under five with fever treated with antimalarial drugs MDG 4
Maternal mortality ratio MDG 3, 8Military expenditure 17
OOfficial development assistance (ODA) disbursed, net as % of GNI MDG 7, 15net grants by NGOs 15per capita of donor country 15to basic social services MDG 7to build trade capacity MDG 7 to least developed countries MDG 7, 15total 15untied bilateral MDG 7
Official development assistance (ODA) received (net disbursements)
as % of GDP 16by landlocked countries MDG 8by small island developing states MDG 8per capita 16total 16
INDEX TO INDICATORS
Indicator Indicator tables
Indicator Indicator tables
hdr03-17 backmatter2-051903.qxd 02/06/03 14:45 Page 366

INDEX TO INDICATORS 367
Oral rehydration therapy use rate 6Orphans’ school attendance rate MDG 4
PPatents granted to residents 11Physicians 6Populationaged 65 and above 5annual growth rate 5total 5, 30under age 15 5urban 5
Poverty gap ratio MDG 1Poverty, income population living below $1 a day MDG 1, 3population living below $2 a day 3population living below $4 a day 4population living below $11 a day 4population living below 50% of median income 4population living below national poverty line 3
Private flows, other 16
RRefugees by country of asylum 20by country of origin 20
Research and development (R&D) expenditures 11scientists and engineers in 11
Royalties and licence fees, receipts of 11
SSanitation facilities, population with access to improved 6urban MDG 6
Science, math and engineering, tertiary students in 10Survival probability at birth of not surviving to age 40 3probability at birth of not surviving to age 60 4probability at birth of surviving to age 65female 8male 8
TTariffs, by developed countries on imports from
developing countriesof clothing MDG 7 of textiles MDG 7
Telephone mainlines 11and cellular subscribers MDG 10
Terms of trade 14Tuberculosiscases MDG 4, 7cases cured under DOTS MDG 4cases detected under DOTS MDG 4related mortality rate MDG 4
UUnder-five mortality rate MDG 3, 8, 30Under height for age, children under age five 7Undernourished people MDG 1, 7, 30Under weight for age, children under age five MDG 1, 3, 7Unemployment 18Unemployment, long term 4female 18male 18
Unemployment rate 18average annual 18female as % of male 18youth MDG 10, 18female MDG 10female as % of male 18male MDG 10
WWater source, improved population without sustainable access to 3population with sustainable access to 6, 30rural MDG 6urban MDG 6
Women’s economic participation female legislators, senior officials and managers 23female professional and technical workers 23
Women’s political participation seats in parliament held by women MDG 2, 23, 27women in government at ministerial level 27year first woman elected or appointed to parliament 27year women received right to stand for election 27year women received right to vote 27
Work time females 26as % of males 26market activities 26non-market activities 26
males 26market activities 26non-market activities 26
totalmarket activities 26non-market activities 26
INDEX TO INDICATORS
Indicator Indicator tables
Indicator Indicator tables
hdr03-17 backmatter2-051903.qxd 02/06/03 14:45 Page 367

hdr03-17 backmatter2-051903.qxd 02/06/03 14:45 Page 368