havells india ltd - ace analyser meet/117354_20100331.pdfmajor presence through havells india 45% of...
TRANSCRIPT
1
Havells India LtdMarch 2010
2
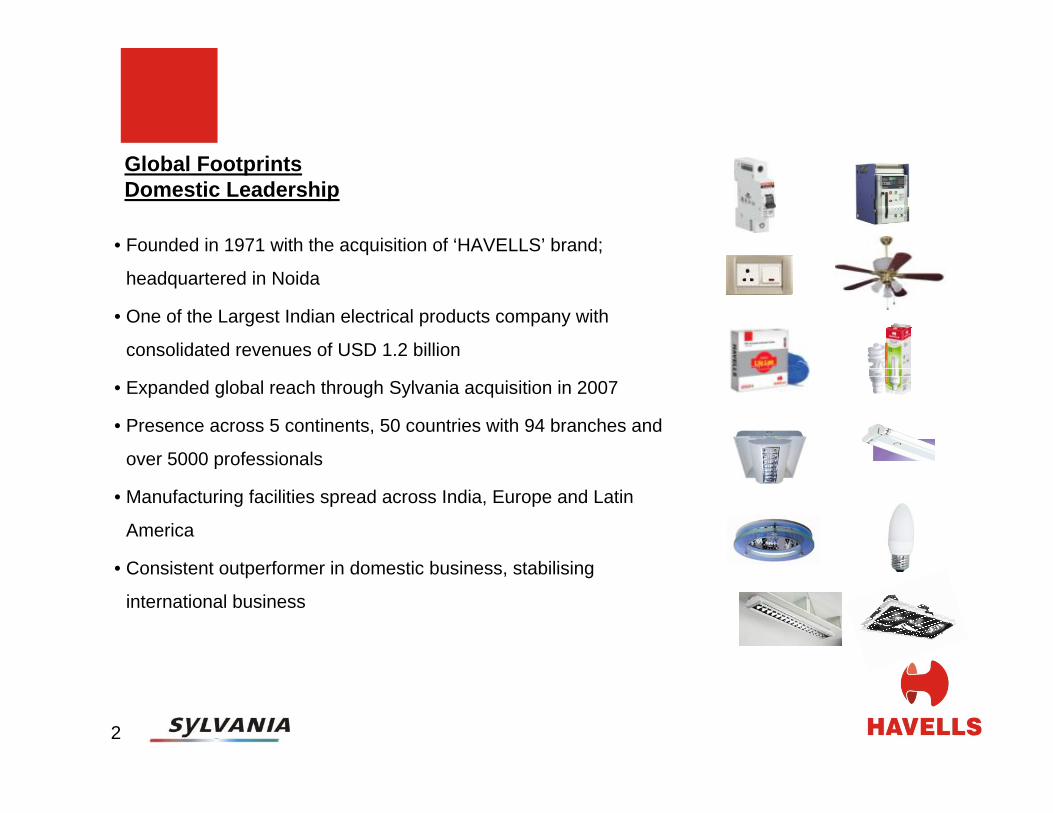
• Founded in 1971 with the acquisition of ‘HAVELLS’ brand;
headquartered in Noida
• One of the Largest Indian electrical products company with
consolidated revenues of USD 1.2 billion
• Expanded global reach through Sylvania acquisition in 2007
• Presence across 5 continents, 50 countries with 94 branches and
over 5000 professionals
• Manufacturing facilities spread across India, Europe and Latin
America
• Consistent outperformer in domestic business, stabilising
international business
Global Footprints Domestic Leadership
3
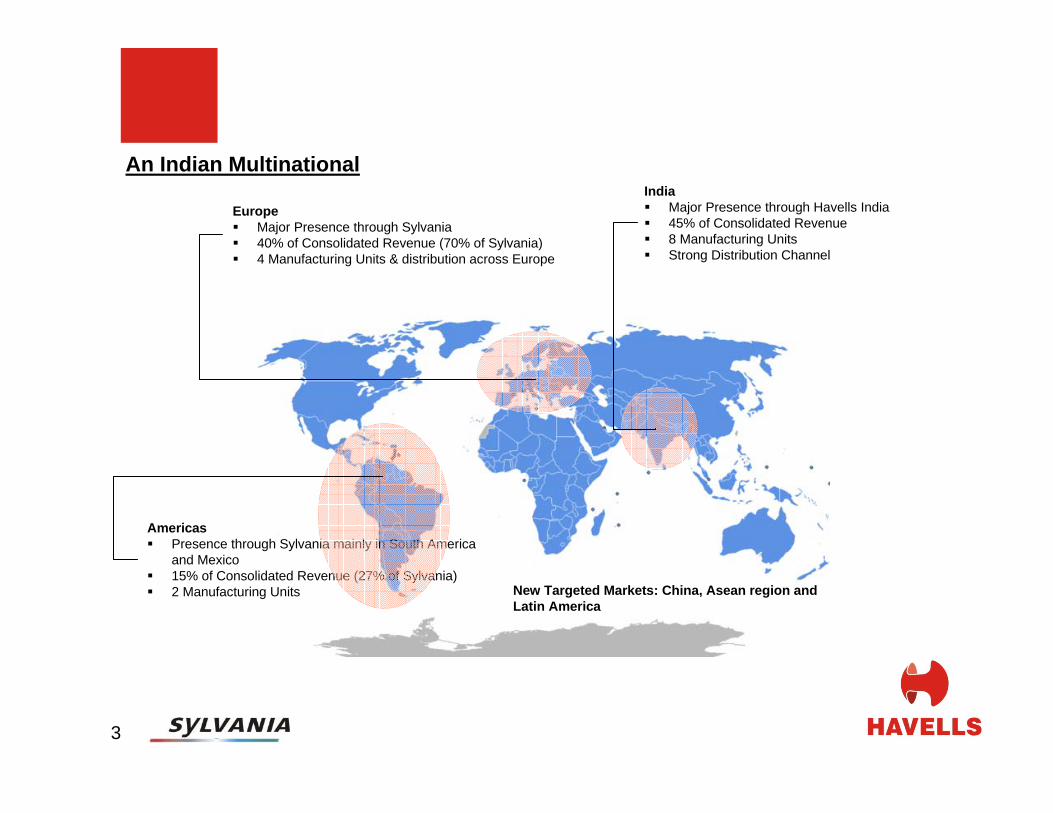
EuropeMajor Presence through Sylvania 40% of Consolidated Revenue (70% of Sylvania)4 Manufacturing Units & distribution across Europe
India Major Presence through Havells India45% of Consolidated Revenue8 Manufacturing UnitsStrong Distribution Channel
An Indian Multinational
New Targeted Markets: China, Asean region and Latin America
AmericasPresence through Sylvania mainly in South America and Mexico15% of Consolidated Revenue (27% of Sylvania)2 Manufacturing Units
4
DOMESTIC BUSINESS
5
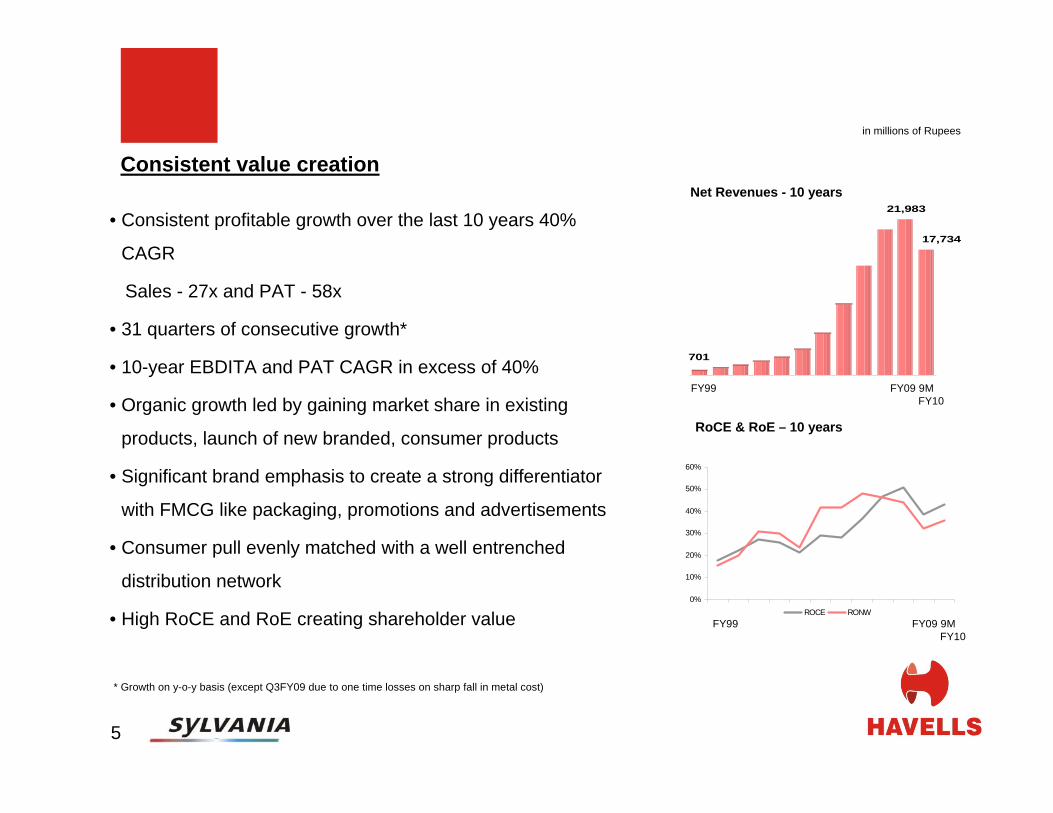
• Consistent profitable growth over the last 10 years 40%
CAGR
Sales - 27x and PAT - 58x
• 31 quarters of consecutive growth*
• 10-year EBDITA and PAT CAGR in excess of 40%
• Organic growth led by gaining market share in existing
products, launch of new branded, consumer products
• Significant brand emphasis to create a strong differentiator
with FMCG like packaging, promotions and advertisements
• Consumer pull evenly matched with a well entrenched
distribution network
• High RoCE and RoE creating shareholder value
Consistent value creation
* Growth on y-o-y basis (except Q3FY09 due to one time losses on sharp fall in metal cost)
Net Revenues - 10 years
RoCE & RoE – 10 years
in millions of Rupees
701
21,983
17,734
0%
10%
20%
30%
40%
50%
60%
ROCE RONW
FY99 FY09 9M FY10
FY99 FY09 9M FY10
6
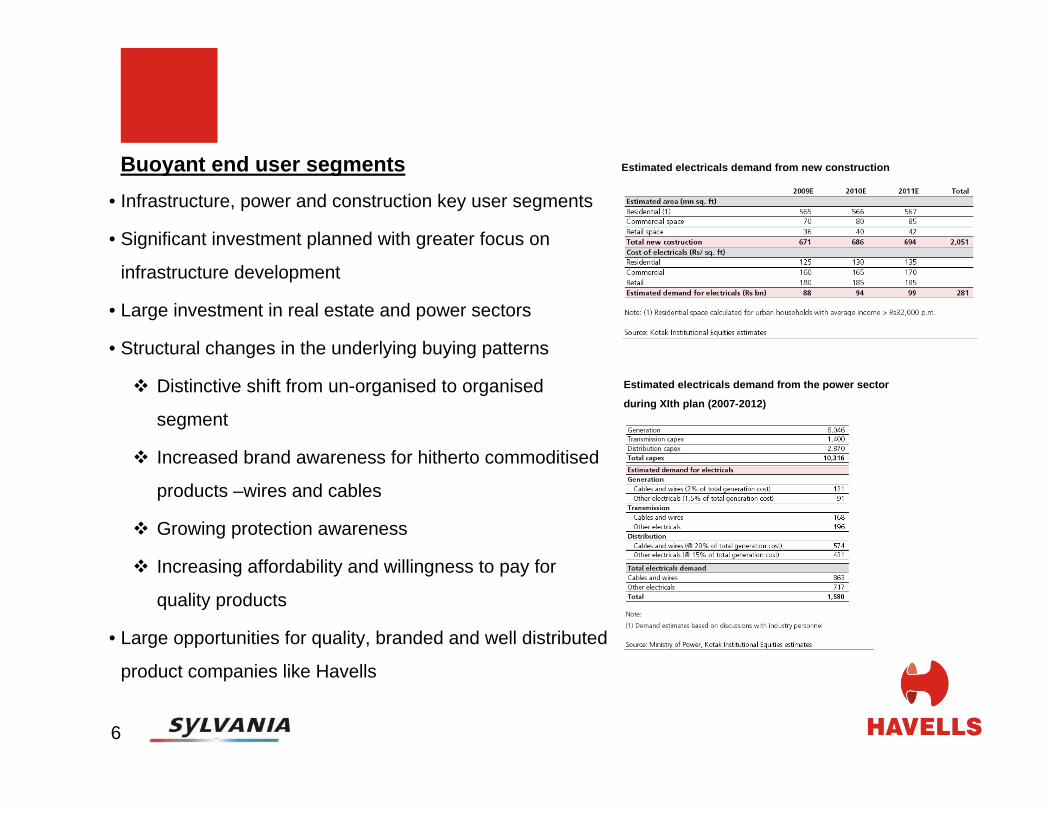
Buoyant end user segments• Infrastructure, power and construction key user segments
• Significant investment planned with greater focus on
infrastructure development
• Large investment in real estate and power sectors
• Structural changes in the underlying buying patterns
Distinctive shift from un-organised to organised
segment
Increased brand awareness for hitherto commoditised
products –wires and cables
Growing protection awareness
Increasing affordability and willingness to pay for
quality products
• Large opportunities for quality, branded and well distributed
product companies like Havells
Estimated electricals demand from new construction
Estimated electricals demand from the power sector
during XIth plan (2007-2012)
14%
14%
1%
29%
42%
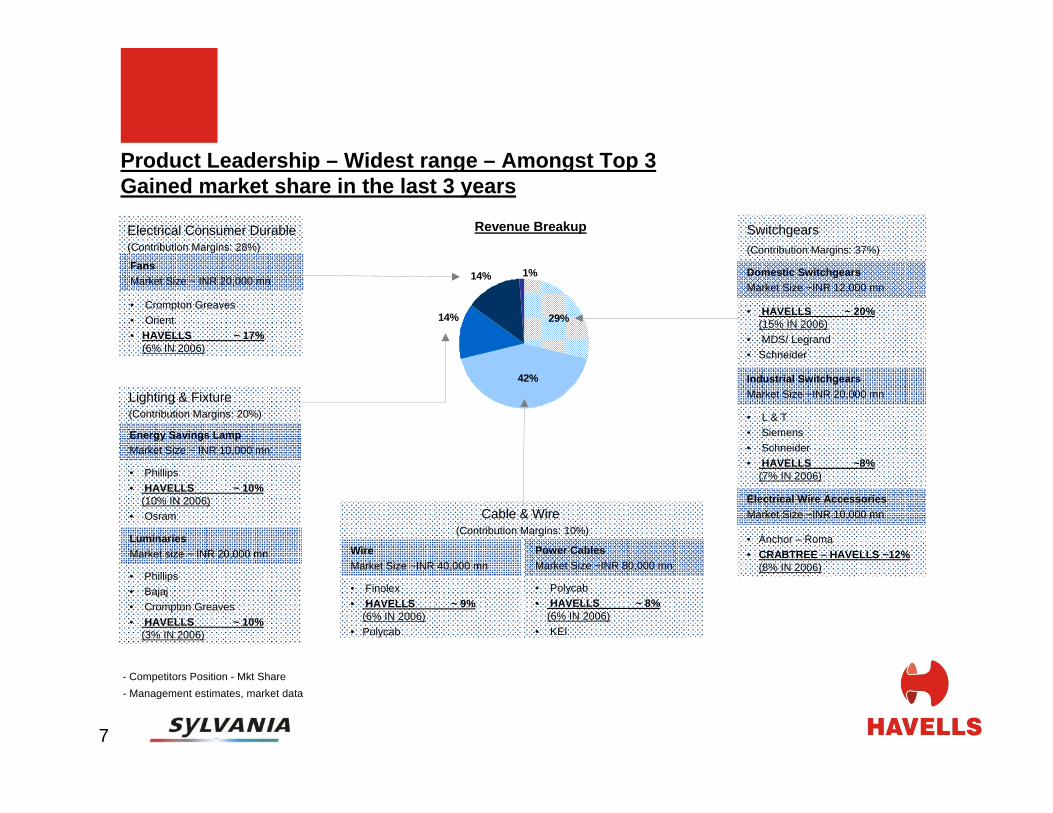
7
- Management estimates, market data
Domestic SwitchgearsMarket Size ~INR 12,000 mn
• HAVELLS ~ 20% (15% IN 2006)
• MDS/ Legrand• Schneider
Industrial SwitchgearsMarket Size ~INR 20,000 mn
• L & T• Siemens• Schneider• HAVELLS ~8%
(7% IN 2006)
Electrical Wire AccessoriesMarket Size ~INR 10,000 mn
• Anchor – Roma• CRABTREE – HAVELLS ~12%
(8% IN 2006)Power CablesMarket Size ~INR 80,000 mn
• Polycab• HAVELLS ~ 8%
(6% IN 2006)• KEI
WireMarket Size ~INR 40,000 mn
• Finolex• HAVELLS ~ 9%
(6% IN 2006)• Polycab
Energy Savings LampMarket Size ~ INR 10,000 mn
• Phillips• HAVELLS ~ 10%
(10% IN 2006)• Osram
LuminariesMarket size ~ INR 20,000 mn
• Phillips• Bajaj• Crompton Greaves• HAVELLS ~ 10%
(3% IN 2006)
FansMarket Size ~ INR 20,000 mn
• Crompton Greaves• Orient• HAVELLS ~ 17%
(6% IN 2006)
Cable & Wire (Contribution Margins: 10%)
Lighting & Fixture(Contribution Margins: 20%)
Electrical Consumer Durable(Contribution Margins: 28%)
Product Leadership – Widest range – Amongst Top 3 Gained market share in the last 3 years
Switchgears(Contribution Margins: 37%)
Revenue Breakup
- Competitors Position - Mkt Share

8
Well entrenched brand and distribution network
• Brand focused approach on FMCG lines adapted in
packaging, media spends, one-stop electrical shops
• Consumer pull through branding ably matched with a
strong dealer network
• Significant focus on dealer relationship and management -
a key trait instilled by Chairman (himself being a dealer in
the past)
• The entire sales transacted through dealers ensuring their
commitment and entrepreneurial push
• The widest product range providing a larger share of
dealer shelf space and a greater control over him
• Continue to focus on deeper distribution penetration and
stronger brand awareness
Revenues
North – 34% East – 22%
West – 15%
South – 28%
9
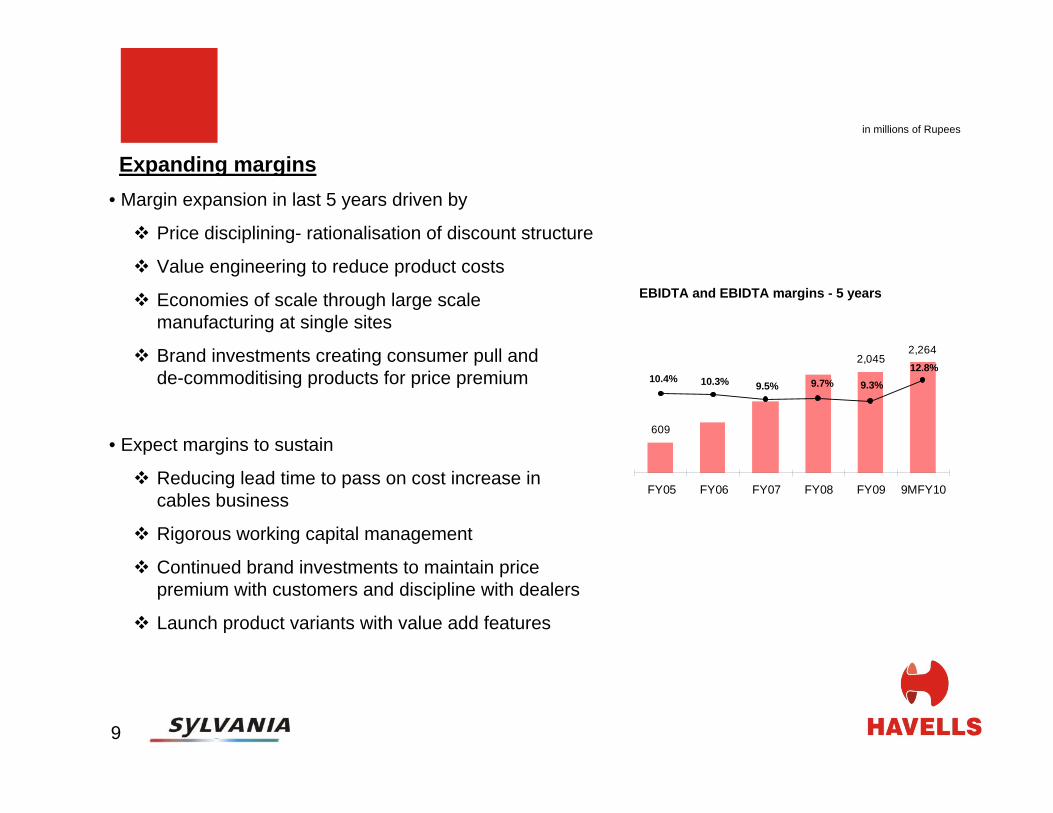
• Margin expansion in last 5 years driven by
Price disciplining- rationalisation of discount structure
Value engineering to reduce product costs
Economies of scale through large scale manufacturing at single sites
Brand investments creating consumer pull and de-commoditising products for price premium
• Expect margins to sustain
Reducing lead time to pass on cost increase in cables business
Rigorous working capital management
Continued brand investments to maintain price premium with customers and discipline with dealers
Launch product variants with value add features
in millions of Rupees
Expanding margins
EBIDTA and EBIDTA margins - 5 years
609
2,0452,264
9.3%9.7%12.8%
10.3% 9.5%10.4%
FY05 FY06 FY07 FY08 FY09 9MFY10
10
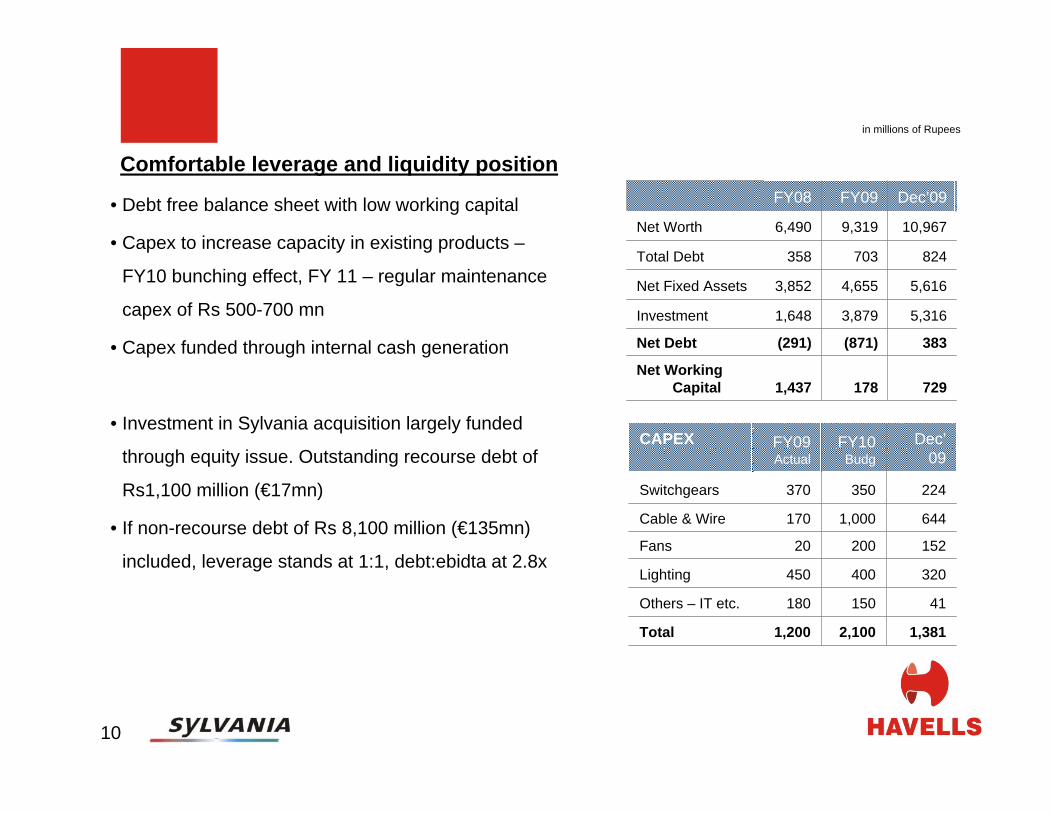
CAPEX FY09 Actual
FY10 Budg
Dec’09
Switchgears 370 350 224
Cable & Wire 170 1,000 644
Fans 20 200 152
Lighting 450 400 320
Others – IT etc. 180 150 41
Total 1,200 2,100 1,381
• Debt free balance sheet with low working capital
• Capex to increase capacity in existing products –
FY10 bunching effect, FY 11 – regular maintenance
capex of Rs 500-700 mn
• Capex funded through internal cash generation
• Investment in Sylvania acquisition largely funded
through equity issue. Outstanding recourse debt of
Rs1,100 million (€17mn)
• If non-recourse debt of Rs 8,100 million (€135mn)
included, leverage stands at 1:1, debt:ebidta at 2.8x
Comfortable leverage and liquidity positionFY08 FY09 Dec’09
Net Worth 6,490 9,319 10,967
Total Debt 358 703 824
Net Fixed Assets 3,852 4,655 5,616
Investment 1,648 3,879 5,316
Net Debt (291) (871) 383
Net Working Capital 1,437 178 729
in millions of Rupees
11
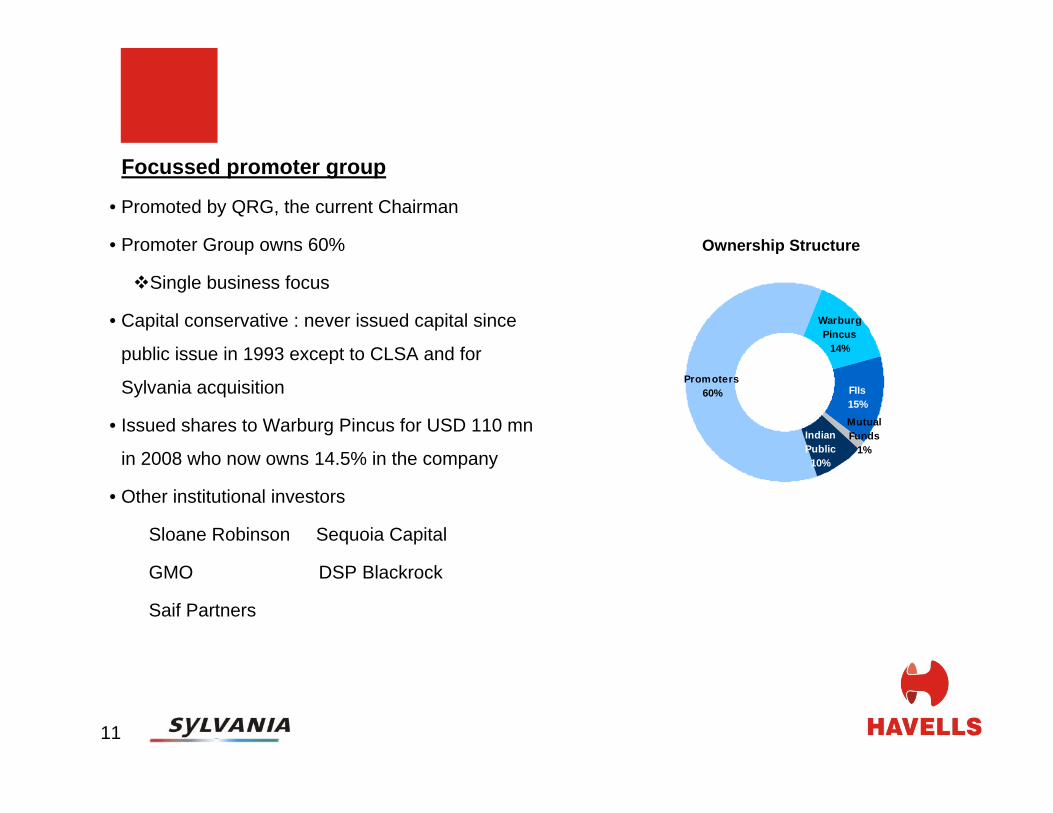
Focussed promoter group
• Promoted by QRG, the current Chairman
• Promoter Group owns 60%
Single business focus
• Capital conservative : never issued capital since
public issue in 1993 except to CLSA and for
Sylvania acquisition
• Issued shares to Warburg Pincus for USD 110 mn
in 2008 who now owns 14.5% in the company
• Other institutional investors
Sloane Robinson Sequoia Capital
GMO DSP Blackrock
Saif Partners
Ownership Structure
Promoters60%
Warburg Pincus
14%
FIIs15%Mutual Funds
1%Indian Public10%

12
INTERNATIONAL BUSINESS
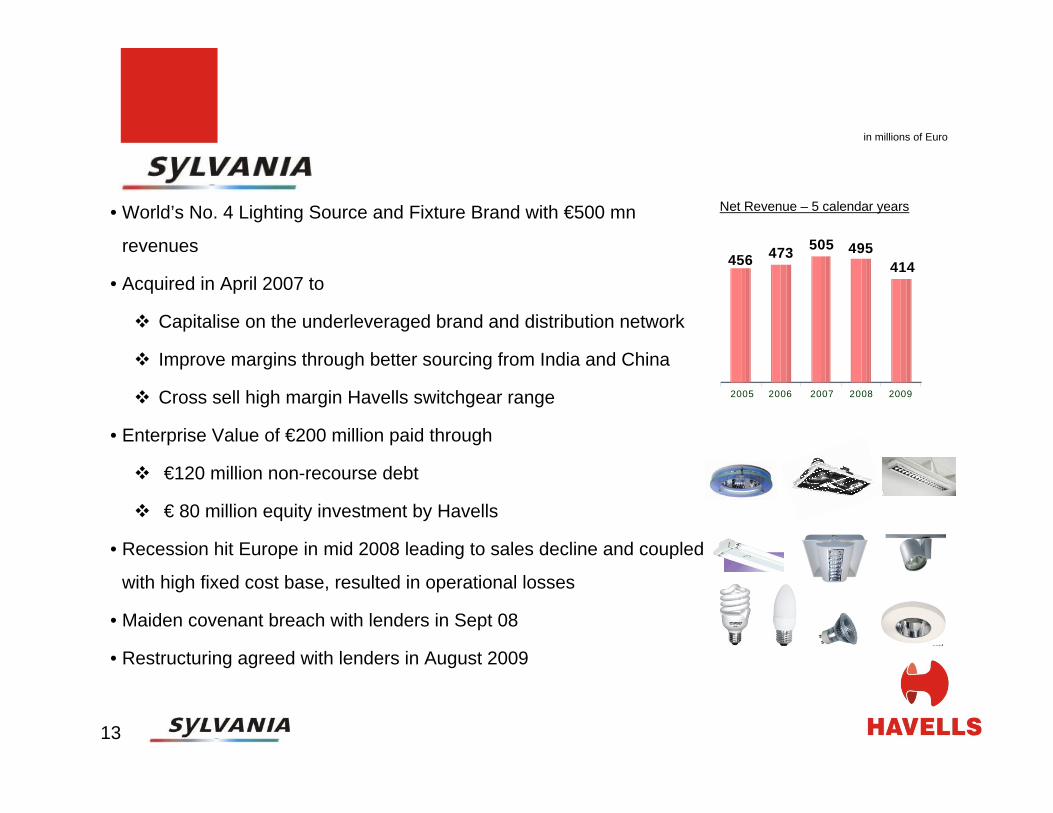
2005 2006 2007 2008 2009
456 473 505 495414
13
• World’s No. 4 Lighting Source and Fixture Brand with €500 mn
revenues
• Acquired in April 2007 to
Capitalise on the underleveraged brand and distribution network
Improve margins through better sourcing from India and China
Cross sell high margin Havells switchgear range
• Enterprise Value of €200 million paid through
€120 million non-recourse debt
€ 80 million equity investment by Havells
• Recession hit Europe in mid 2008 leading to sales decline and coupled
with high fixed cost base, resulted in operational losses
• Maiden covenant breach with lenders in Sept 08
• Restructuring agreed with lenders in August 2009
Net Revenue – 5 calendar years
in millions of Euro

14
Key Restructuring terms
• Key terms
Long term facility of € 120 mn available till 2013
Lenders defer amortisations for 2009 and 2010 aggregating € 24 mn
Havells invested € 12 mn to finance Prakram plan
• Restructuring plan focussed on
reducing fixed cost base through reduction in work force
variablising fixed cost through increased outsourcing from China and India
the costs primarily constitute severance payments with payback of 9-12 months
• The first restructuring plan Phoenix has been successfully completed and second restructuring
plan Prakram is under implementation focusing on factories in mainland Europe, to be
completed by mid 2010.
• Both plans cost € 34 million with payback of around 12 months.
15
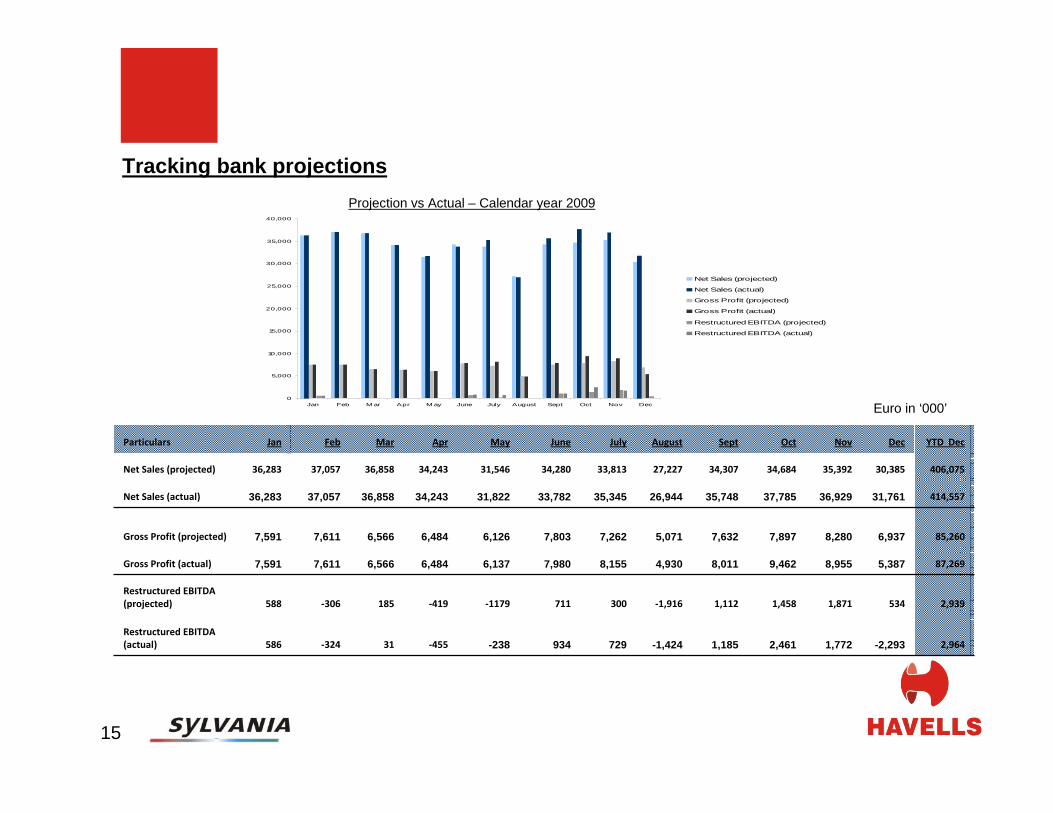
Tracking bank projections
Euro in ‘000’
Projection vs Actual – Calendar year 2009
Particulars Jan Feb Mar Apr May June July August Sept Oct Nov Dec YTD Dec
Net Sales (projected) 36,283 37,057 36,858 34,243 31,546 34,280 33,813 27,227 34,307 34,684 35,392 30,385 406,075
Net Sales (actual) 36,283 37,057 36,858 34,243 31,822 33,782 35,345 26,944 35,748 37,785 36,929 31,761 414,557
Gross Profit (projected) 7,591 7,611 6,566 6,484 6,126 7,803 7,262 5,071 7,632 7,897 8,280 6,937 85,260
Gross Profit (actual) 7,591 7,611 6,566 6,484 6,137 7,980 8,155 4,930 8,011 9,462 8,955 5,387 87,269
Restructured EBITDA (projected) 588 ‐306 185 ‐419 ‐1179 711 300 ‐1,916 1,112 1,458 1,871 534 2,939
Restructured EBITDA (actual) 586 ‐324 31 ‐455 -238 934 729 -1,424 1,185 2,461 1,772 -2,293 2,964
0
5,000
10,000
15,000
20,000
25,000
30,000
35,000
40,000
Jan Feb M ar Apr M ay June July August Sept Oct Nov Dec
Net Sales (projected)
Net Sales (actual)
Gross Profit (projected)
Gross Profit (actual)
Restructured EBITDA (projected)
Restructured EBITDA (actual)
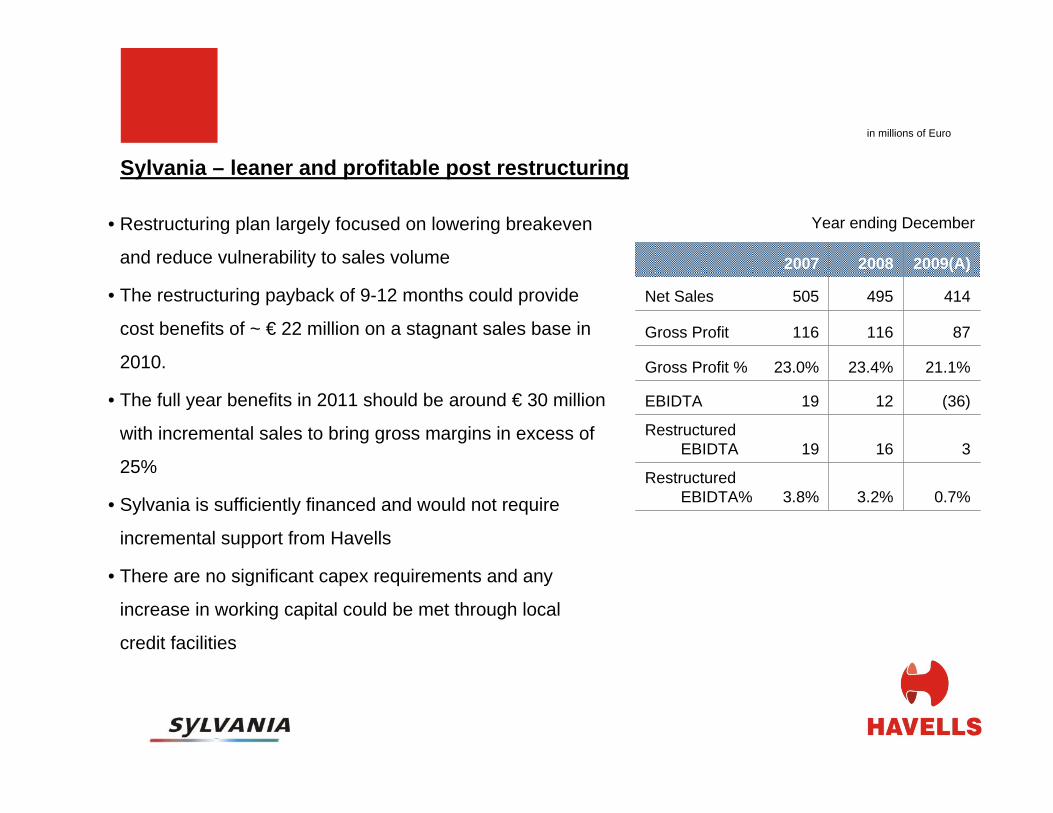
2007 2008 2009(A)
Net Sales 505 495 414
Gross Profit 116 116 87
Gross Profit % 23.0% 23.4% 21.1%
EBIDTA 19 12 (36)
Restructured EBIDTA 19 16 3
Restructured EBIDTA% 3.8% 3.2% 0.7%
Year ending December• Restructuring plan largely focused on lowering breakeven
and reduce vulnerability to sales volume
• The restructuring payback of 9-12 months could provide
cost benefits of ~ € 22 million on a stagnant sales base in
2010.
• The full year benefits in 2011 should be around € 30 million
with incremental sales to bring gross margins in excess of
25%
• Sylvania is sufficiently financed and would not require
incremental support from Havells
• There are no significant capex requirements and any
increase in working capital could be met through local
credit facilities
Sylvania – leaner and profitable post restructuring
in millions of Euro

17
in millions of rupees Havells Sylvania Consolidated Consolidated9MFY10
Actual9MFY10
Actual9MFY10
ActualFY10
Budget
Net Revenue 17,734 21,969 39,703 52,937
EBIDTA 2,264 (404) 1,860 3,013
As % to NR 12.8% -- 4.7% 5.7%
Depreciation 168 461 629 839
Interest 48 499 547 729
Add: other Income 66 90 156 156
Profit before tax 2,114 (1,274) 840 1,601
Tax 490 (21) 469 625
Profit after tax 1,624 (1,253) 371 976
As % to NR 9.2% -- -- --
Exceptional Item* -- 2,557 2,557 2,887
Consolidated Performance – 9MFY10
* Exceptional items would be directly treated with business reconstruction reserves in the consolidated balance sheet without recourse to profit and loss account
18
• Havells is well positioned for growth in domestic markets through a stronger brand, distribution
network and vast product range
• Sylvania would be cost competitive through current restructuring and presents a good platform for
electrical products having a strong brand lineage and distribution network across Europe and
Americas
• Havells has robust cash flows and comfortable leverage to meet its planned capital expenditure for
medium term
• The economic environment including the thrust on infrastructure and upturn in real estate markets
augur well for Havells end user markets
• Havells provides an attractive play on branded, electrical products industry in India with a niche
brand portfolio in international markets
Epilogue
19
The information contained in this presentation is only current as of its date. All actions and statements made herein or otherwise shall be subject to the applicable laws and regulations as amended from time to time. There is no representation that all information relating to the context has been taken care off in the presentation and neither we undertake any obligation as to the regular updating of the information as a result of new information, future events or otherwise. We will accept no liability whatsoever for any loss arising directly or indirectly from the use of, reliance of any information contained in this presentation or for any omission of the information. The information shall not be distributed or used by any person or entity in any jurisdiction or countries were such distribution or use would becontrary to the applicable laws or Regulations. It is advised that prior to acting upon this presentation independent consultation / advise may be obtained and necessary due diligence, investigation etc may be done at your end. You may also contact us directly for any questions or clarifications at our end.
This presentation contain certain statements of future expectations and other forward-looking statements, including those relating to our general business plans and strategy, our future financial condition and growth prospects, and future developments in our industry and our competitive and regulatory environment. In addition to statements which are forward looking by reason of context, the words ‘may, will, should, expects, plans, intends, anticipates, believes, estimates, predicts, potential or continue’ and similar expressions identify forward looking statements. Actual results, performances or events may differ materially from these forward-looking statements including the plans, objectives, expectations, estimates and intentions expressed in forward looking statements due to a number of factors, including without limitation future changes or developments in our business, our competitive environment, technology and application, and political, economic, legal and social conditions. It is cautioned that the foregoing list is not exhaustive This presentation is not being used in connection with any invitation of an offer or an offer of securities and should not be used as a basis for any investment decision.
Disclaimer