hasdeo sub-basin report
TRANSCRIPT

PREPARED FOR – FORUM FOR POLICY DIALOGUE ON WATER CONFLICTS IN INDIA
HASDEO SUB-BASINREPORT
THEME- ENVIRONMNETAL FLOWS
PREPARED BY-PRERNA PRASAD, Pursuing Masters in Water Policy and Governance
from Tata Institute of social Sciences
THE PREPRATION OF THIS REPORT WAS UNDERTAKEN AS PART OF A 2 MONTH INTERNSHIP (1st APRIL – 2nd JUNE 2015) WITH THE FORUM FOR POLICY
DIALOGUE ON WATER CONFLICTS IN INDIA, OPERATING FROM SOPPECOM, PUNE.

2
ACKNOWLEDGEMENT
Human Interaction is the best source of knowledge acquisition, one which cannot be surpassed by all
the combined knowledge available on the internet. Learning from a fellow human’s own vivid
personal experiences is unmatched by any other till date. In search of information we dive deep into
the domains of the internet, and yet the most profound form of information is the one that you receive
from an unanticipated respondent. All these interactions, key information from secondary sources
have helped me in compiling this report in this form today. This report is one tangible output of the 2
month internship that I had an opportunity of doing with the Forum for Policy Dialogue on Water
Conflicts in India. The entire reading and secondary source gathering was done from the SOPPECOM
office based in Pune.
Countless individuals have played a very eminent role in shaping this report and structuring the
associated field work component. I would like to extend my gratitude to the members of the E Flows
theme: Dr. Latha Anantha, Shripad Dharmadhikary, Partha Das, Gorky Chakraborty and Malavika
Chauhan. A commendable add on to the E Flows team is the SOPPECOM team working on the
agriculture-industry theme. They have been a great support and for which I would also like to extend
my gratitude to K.J. Joy, Seema Kulkarni, Pratima Medhekar, Sneha Bhat, Sarita Bhagat, Craig
D’Souza and Tanaji Nikam.
Morning coffee, hour long meetings over skype, hearing those little anecdotes by Joy Sir over lunch
are but some memories of a journey enjoyed. And contrary to these, the experiences in Chhattisgarh,
meeting people across varying geographies but united in their oppression by that one link that
connected them, the Hasdeo River. So it’s the simplicity of life in this area that never fails to keep
people like us in awe. An amalgamation of academicians, activists, and the common man and their
experiences has played a pivotal role in content to the report. Their names are made part of the
appendix at the end of the report.
Moreover I would like to thank my faculty at TISS, Dr. Nirmalya Choudhary and Pranjal Deekshit for
encouraging me to apply for the internship and making all documents available in time. I would also
like to thank my senior Sridhar A. for sharing all his collected data and key contacts. I extend my
sincere gratefulness to Sameer Lakra, Jainandan Ji for accompanying me in the field work. Moving so
fearlessly in the jungle and comprehending the language in the remote areas would not have been
possible without them. Sincere thanks to Mr. Manish Rathod (environmental activist) and Satya
Prakash (Social Worker) for helping us in our field work in Korba. Lastly I would like to thank my
parents and friends, for their constant financial and moral support.
-Prerna Prasad

3
CONTENTS
S.No. Title Page No.
I Acknowledgement 2
II Summary – Forum’s Work 5
III List of Tables 6
IV List of Figures 7
1. Environmental Flows- Unfolding the Concept 8
2. Introduction to the Hasdeo Sub Basin 12
2.1 Hasdeo Sub Basin Profile 12
2.2 Contour Characteristics of the Hasdeo Sub Basin 14
2.3 Tributaries of the river Hasdeo 14
2.4 Climate 14
2.5 Soil 15
2.6 Status of aquifer in the Hasdeo Sub Basin 15
3. Districts and Demography 18
3.1 Districts 18
3.1.1 Korea 18
3.1.2 Surguja 19
3.1.3 Korba 21
3.1.4 Bilaspur 21
3.1.5 Janjgir Champa 22
3.2 Demography 23
4. Livelihoods in the Hasdeo Sub Basin 26
4.1 Agriculture in the Hasdeo Sub Basin 26
4.2 Tendu Patta Collection & Saw Mills 28
4.3 River Bed Cultivation and Flood Plain Farming 29
4.4 Fisheries 29
5. Ecology of the Hasdeo Sub Basin 31
5.1 Plant Diversity 31
5.2 Wildlife 36
6. Human Interventions : Dams 37
6.1 Impact on the lives of the people affected by the construction of
the Dam
42
6.1.1 Excerpts from an FGD conducted in the village
Khotkhorri
42

4
7. Human Interventions : Coal Mines 44
7.1 Impact of Coal Mines on the life of people in the basin 47
7.1.1 Excerpts from an FGD conducted with the people
affected by the coal mines in Village Basan
47
7.1.2 Excerpts from an FGD conducted in the village Ghat
Barra
47
8. Human Interventions : Industries 49
9. Water Quality Status in the Hasdeo Sub Basin 58
10. Research Methodology 66
11. Appendix I 68
12.s Appendix II 74
5
SUMMARY
Forum for Policy Dialogue on Water Conflicts in India (Forum) is a conglomeration of 150
individuals and organisations which came up to document and map conflicts over water. As part of its
work it has also undertaken outreach campaigns involving media and the civil society to attract the
attention of the mainstream towards regional and local cases of water conflicts. Society for Promoting
Participative Ecosystem Management (SOPPECOM), Pune anchors and co-ordinates forums work.
The research on the Mahanadi Basin is being done under 4 thematic heads: right to water and
sanitation, groundwater, agricultural and industrial use and environmental flows and river basin
management. A sub part of the Mahanadi Basin, Hasdeo Sub Basin was chosen for study under the E-
Flows component. Spanning across 5 districts of Chhattisgarh, it shows a clear amalgamation of
conflicting water uses. From the origin to the point where it surrenders itself to the Mahanadi River, it
serves a variety of functions. Rivers are ecosystems in themselves performing vital ecological and
evolutionary functions including providing basic and livelihood needs of millions. They cannot be
merely treated as drains. But at present rivers have lost their natural functions due to anthropogenic
interventions.
To combat this head on crisis, one needs a comprehensive inventory of all the vital functions that the
river performs and how in this constantly changing world, the nature of these functions is getting
altered. This minute change then initiates a series of changes in the ecosystem, because everything
works as a response. The exploitation of natural resources taking place in the Hasdeo Sub Basin is
now taking a toll on the people and terrestrial and aquatic ecosystems of the region. Conflict has
reached an altogether new level which makes it all the more important to study it.

6
LIST OF TABLES
Table No. Table Title Page No.
2.1 Sub Watersheds of the Hasdeo Sub Basin 12
2.2 Land Characteristics in the Bamni, Upper Hasdeo, Tan and Chornai Sub Watershed 13
2.3 Contour Characteristics of the Hasdeo Sub Basin 14
2.4 District wise distribution of Principal Aquifer systems 16
2.5 Summary of the Ground Water conditions in the Hasdeo Basin 16
2.6 District wise area prioritized for artificial recharge 17
3.1 Administrative Division (Hasdeo Sub Basin) 18
3.2 Peaks of the District 19
3.3 Population Statistics 2011- Census Of India 23
3.4 Percentage decadal growth 2001-2011 24
3.5 Percentage Share of Total Population and Sex Ratio 24
3.6 Sub Districts, Towns and Villages 25
4.1 Agro Climatic Zones of Chhattisgarh 26
5.1 District Wise Forest Cover 31
5.2 Forest Cover and their corresponding Canopy density 31
5.3 Plant diversity of the Hasdeo Sub Basin 32
5.4 Medicinal Plants obtained from the forests of the Hasdeo Sub Basin 34
6.1 Dams and Barrages on the River Hasdeo 38
6.2 Total Estimated water requirement for various needs 38
6.3 Other anicuts/check dams in the catchment of the Hasdeo Sub Basin 39
7.1 Area wise details of Underground, open cast and mixed type mines of SECL as on 31st March
2014
44
7.2 Coal Mines and their associated forest area diversion and their water requirement 44
8.1 Sponge/Pig Iron Plants 49
8.2 Cement Plant 49
8.3 National Thermal Power Plants 50
8.4 Chhattisgarh State Electricity Board 50
8.5 Independent Power Producers 50
8.6 Captive Power Plants 50
8.7 Upcoming Power Plants in the Hasdeo Sub Basin 50
8.8 Aluminium Plants 53
8.9 Bauxite Blocks in the Hasdeo Sub Basin 54
8.10 Water Allocation 56
9.1 Industrial area located within the critical areas 61
9.2 Expansion Units under construction that have been granted environmental clearance by GOI
via notification dated 13/01/2010 (Situated within the Critical area)
62
7
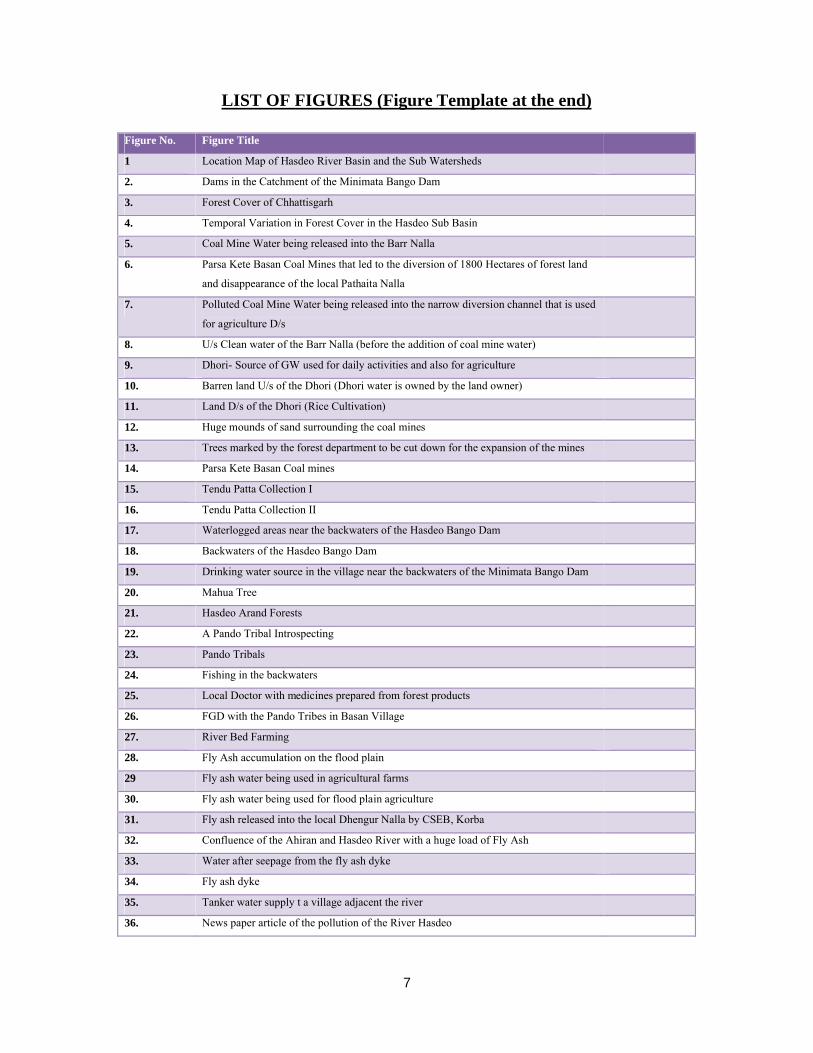
LIST OF FIGURES (Figure Template at the end)
Figure No. Figure Title
1 Location Map of Hasdeo River Basin and the Sub Watersheds
2. Dams in the Catchment of the Minimata Bango Dam
3. Forest Cover of Chhattisgarh
4. Temporal Variation in Forest Cover in the Hasdeo Sub Basin
5. Coal Mine Water being released into the Barr Nalla
6. Parsa Kete Basan Coal Mines that led to the diversion of 1800 Hectares of forest land
and disappearance of the local Pathaita Nalla
7. Polluted Coal Mine Water being released into the narrow diversion channel that is used
for agriculture D/s
8. U/s Clean water of the Barr Nalla (before the addition of coal mine water)
9. Dhori- Source of GW used for daily activities and also for agriculture
10. Barren land U/s of the Dhori (Dhori water is owned by the land owner)
11. Land D/s of the Dhori (Rice Cultivation)
12. Huge mounds of sand surrounding the coal mines
13. Trees marked by the forest department to be cut down for the expansion of the mines
14. Parsa Kete Basan Coal mines
15. Tendu Patta Collection I
16. Tendu Patta Collection II
17. Waterlogged areas near the backwaters of the Hasdeo Bango Dam
18. Backwaters of the Hasdeo Bango Dam
19. Drinking water source in the village near the backwaters of the Minimata Bango Dam
20. Mahua Tree
21. Hasdeo Arand Forests
22. A Pando Tribal Introspecting
23. Pando Tribals
24. Fishing in the backwaters
25. Local Doctor with medicines prepared from forest products
26. FGD with the Pando Tribes in Basan Village
27. River Bed Farming
28. Fly Ash accumulation on the flood plain
29 Fly ash water being used in agricultural farms
30. Fly ash water being used for flood plain agriculture
31. Fly ash released into the local Dhengur Nalla by CSEB, Korba
32. Confluence of the Ahiran and Hasdeo River with a huge load of Fly Ash
33. Water after seepage from the fly ash dyke
34. Fly ash dyke
35. Tanker water supply t a village adjacent the river
36. News paper article of the pollution of the River Hasdeo

8
CHAPTER 1: ENVIRONMENTAL FLOWS – UNFOLDING THE
CONCEPT
From its origin to the point where the river surrenders itself to the sea, it performs innumerable
functions and homes one third of the global vertebrate biodiversity. As they drain 75% of the earth’s
land, they leave behind the most conducive environment for countless habitats to flourish. Currently
rivers are the central concern of a wide range of environmental issues.
The fact that rivers serve us in innumerable ways is an established fact. But on the contrary the way
we view our rivers in this rapidly “progressing” world is a matter of contention. Rivers have
transitioned from being the arteries of this life supporting system to becoming the stagnant
storehouses of our development waste which has led quite a few rivers to even cease flowing.
Environmental Flows as a concept evolved for this very crisis management which brings in the voices
of the voiceless backed by the developments in the scientific understanding of our ecosystem. It poses
a very direct question to all of us who are in some way responsible for the filth flowing in our rivers.
It is up to us to decide what state do we want to keep our rivers in and if we are at all ready to
compromise our arterial strength for long term development objectives that live a short life. This
necessarily means a very strong adherence to trade-offs in the decision making process which will
leave behind a bunch of losers and winners which will then in a way spark off a very differently
constructed inequality.
Reverting back to this enormous entity called river, there are a few nuanced understandings that
modern scientific research has given us. Rivers own their identity to an amalgamation of three key
factors: flow, water quality and sediment transport. A simultaneous alteration in these three factors
can create different ecosystems and all unique in nature. This is primarily because the associated
biodiversity shows a very strong response to alterations in the above features. It is now an established
fact that animals and plants found in riverine ecosystems are largely controlled by physical rather than
biological processes1. Infact the riverine species have evolved primarily in response to natural flow
regimes. This is because rivers are highly variable and unpredictable especially with respect to the
flows. One could easily demarcate the periods of low and high flows in a river which thereby has an
influence on the ecosystem. So out of the three factors, flows have been regarded as the master
variable. High flows provide shape and texture to the channel they flow into. Moreover they aid in the
transportation of sediments. During high flows, fast moving creatures are in their full form and
gradually as low flows set in; the more sedentary ones are given way. It forms a natural resetting
mechanism in the words of Jay O’Keeffe and Tom Le Quesne.
1 Jay O’Keeffe; Tom Le Quesne; 2009; Keeping Rivers Alive: A Primer on environmental flows; WWF Water Security Series; Pg -8.

9
In this age where we have caused more harm to our rivers than repair, Environmental Flows intend to
mimic this natural variability of flow in rivers. But increasing flows is not always the best resort.
Maintaining the natural variability of the flows in the river is a very context specific endeavour. To
artificially replicate this earlier natural behaviour in rivers, one needs a well structures flow regulation
regime. Increasing or decreasing flows in a river not suited for the same can create havoc in the
ecosystem.
To provide a global picture of the level of alteration of the world’s largest river systems, a River
Fragmentation and Flow Regulation indicator2 was developed in the year 2005. The prime purpose
behind the development of this indicator was to study the degree to which the flow regime and
connectivity of the rivers had been altered. Laterally dams disconnect the rivers from the adjacent
floodplains and longitudinally it blocks the flow of sediments and nutrients that nurture the
downstream ecosystems. This fragmentation impedes the ecological functions which are
indispensable for supporting life dependent on freshwater. Flowing water when suddenly rendered
stagnant, leads to disappearance of fish species adapted to riverine habitats and the proliferation of
other often exotic species adapted to still waters3. Globally, 2/3rd of all large river systems are
moderately or highly fragmented by dams and reservoirs. Industrialized regions such as USA and
Europe and heavily populated countries like China and India encompass the most fragmented rivers4.
Environmental Flows as an area of study envisages arriving at that point where we can decide on the
quantum of change that we are prepared to accept. How much of the flow regime are we willing to
modify before we reach a threshold beyond which our actions just backfires.
In order to acknowledge this right of the river to flow, various institutions have come up with
definitions regarding environmental flows. As per the International Union for Conservation of nature
(IUCN) environmental flow has been defined as the water regime provided within a river, wetland or
coastal zone to maintain ecosystems and their benefits, where there are competing water uses and
2 Fragmentation Rankings (i.e., highly affected, moderately affected and unaffected) are assigned to each large river system using its location, storage capacity, proportion of free flowing miles of river length and annual runoff that is stored behind the dam throughout the year.Highly Fragmented and regulated rivers include those with less that 1 quarter of their main channel left without dams, where the largest tributary has at least 1 dam, and where the reservoirs retain a considerable portion of a year’s flow.Unaffected rivers are those without dams in the main channel of the river and if tributaries have been dammed, the flow of the river has not changed substantially (less than 2% of the natural flow has been affected).3 www.bipindicators.net/riverfragmentation4 www.bipindicators.net/riverfragmentation

10
where flows are regulated5. International Water Management Institute (IWMI) describes
environmental flows regime as discharges of a particular magnitude, frequency and timing which are
necessary to ensure that a river remains environmentally, economically and socially healthy.
Environmental Flowss are a regime of flow in a river or stream that describes the temporal and spatial
variations in quantity and quality of water required for freshwater as well as estuarine systems to
perform their natural ecological functions (including sediment transport) and support the spiritual,
cultural and livelihood activities that depend on these ecosystems was the definition proposed by the
National Ganga River Basin Management Plan. And as per Forum the definition speaks as the flow
regime to be left for the environment, right from the 1st order stream watersheds to the main river
basin, denotes the water for environmental needs at a river basin level6.
Although the term “Environmental Flow” has other names or variants like “Environmental Water
Requirements”, “Environmental Water Demand”, it should not be mixed up with terminologies like In
stream Flow Requirement (IFR)7 or Drought IFR or even for that matter Minimum Flow8. The
concept of minimum flows was floated in order to reserve an amount of water to help sustain the in
stream water ecosystem and was essentially borrowed from the Western water law. The concept
gained momentum amidst rising concerns for the protection of fish that suffered most due to the low
summer flows in the river. But Stalnaker in his paper “Minimum Flow is a Myth9” written way back
in the 90’s made an outright criticism of the concept. The myth here denotes the single minimum
discharge value that is assigned to the river which in the long run fails to “move bed load, flush
sediments, rejuvenate the floodplains and thus maintain the structural characteristics of the stream
channel.”
Amidst all the different articulations on the subject, there are some key concerns that are kept beyond
the domain of the E Flows. Problems like pollution that is caused by poor land management needs to
be addressed at the source itself. Overgrazing, water quality problems due to sewage effluents
released into the river stream and increased input of sediment into the river due to erosion needs
monitoring and mitigation at the source. All these concerns if brought under the ambit of E Flows will
5 D.Megan, B.Ger, S.John; Flow, The Essentials of environment flows; International Union for Conservation of Nature and Natural Resources, Pg. v.6 Joy K.J., S.Priya, A.Latha, D. Shripad, K.P.Soma, 2011, Life, Livelihoods, Ecosystems, Culture : Entitlements and Allocation of Water for Competing Uses, Position Paper by the thematic subgroup on Water Entitlements and Allocations for Livelihoods and Ecosystem Needs, Forum for Policy Dialogue on Water Conflicts in India.7 The term “Instream Flow” is used to designate a specific stream flow, measured in cubic feet per second (cfs), at a particular location for a defined time, and typically follows seasonal variations. In-stream flows are needed to protect and preserve resources, such as fish, wildlife and recreation, in a waterway. (http://www.dfg.ca.gov/water/instream_flow.html ) 8 http://www.eoearth.org/view/article/152624/
9 Stalnaker, C. B.; 1990; Minimum Flow is a Myth; Ecology and assessment of warm water streams: workshop synopsis; US Fish and Wildlife Services; Biological Report; 31-33.

11
make an already difficult endeavour even more difficult to analyse and implement. Allocation of high
flows for the artificial dilution of pollutants will be at odds with increased extraction.
A huge gap lies between the assessment and implementation of E Flows which comes as a major
limitation in the endeavour of improving the status of rivers in the world. Achievement of the
predicted ecological state of the river is a farfetched idea and the decision making revolving the same
is one that is laden with a lot of trade-offs and also possible conflicts. An integrated effort on the part
of the scientific and social community will help in arriving at a consensus. Undermining the
importance of even a single stakeholder will perish this noble undertaking.
One needs to understand that there is a very fine line between development of the resource and
exploitation of the same. And the very base of knowledge that is required to determine or rather take a
decision to forge ahead with the project is absent in our country. There is dearth of quality river flow
data and a very weak documentation of the biodiversity that has evolved in millions of years as a
response to the flows in the river. Only when an inventory of all the relevant data is made available
can one actually assess the real consequences of a project.

12
CHAPTER 2: INTRODUCTION TO THE HASDEO SUB BASIN
2.1 HASDEO SUB BASIN PROFILE
Mahanadi River Basin occupies 4.3% of the total geographical area of the country of which 7.35% is
made up by the Hasdeo Basin. Mahanadi is drained by its 14 major tributaries of which 12 join it U/s
of the Hirakud Reservoir and 2 D/s. The rivers Sheonath, Hasdeo, Mand, Ib, Kelo and Boras drain in
the U/s portion.
Hasdeo River Basin is part of the Mahanadi middle sub basin (400-750 m above mean sea level) and
is the 2nd largest branch of Mahanadi after Sheonath River. It originates from the hill region of
Deogarh in Sonhat Taluka at an elevation of 1052m above msl in Koriya district of Chhattisgarh and
then flows through Korba and Janjgir Champa districts of Chhattisgarh before joining Mahanadi near
Seorinarayan which is a famous pilgrim centre.
The River Hasdeo Contributes 5389 MCM of water to the Mahanadi River. The total length of the
Hasdeo River is 333 Kms. The total catchment of this river is 10535.96 sq. Kms, thus the contribution
is 13.9% to the Mahanadi Basin within Chhattisgarh state10. The rivers Gej, Bamni and Atem meet
Hasdeo U/s of the Minimata Bango Dam whereas Tan and Ahiran meet it D/s.
It flows from North to South direction and has 8 watersheds located between 21°45’ N to 23°37’ N
latitude and 82°00’ E to 83°04’ E longitude. The eight different watersheds are upper Hasdeo, Gej
Nala, Bamni Nadi, Tan Nadi, Chornai, Ahiran Nadi, Lower Hasdeo and Lower Basin Mahanadi11.
Table 2.1: Sub Watersheds of the Hasdeo Sub Basin
S.No. Sub Watershed Area (sq. Kms) Percentage of the
Hasdeo Basin
1. Upper Hasdeo 1448 13.9%
2. Gej Nala 2109 20.3%
3. Bamni Nadi 1567 15.1%
4. Tan Nadi 870.44 8.4%
5. Chornai 1792 17.2%
6. Ahiran Nadi 905 8.7%
7. Lower Hasdeo 998 9.6%
8. Lower Basin Mahanadi 768 7.4%
10 Water Year Book 2013, Water Resource Department, Government of Chhattisgarh11 Source – Central Ground Water Board, India

13
Table 2.2: Land Characterization in the Bamni, Upper Hasdeo, Tan and Chornai Sub
Watershed12
Sub Watershed Bamni Sub
Watershed
Upper Hasdeo Sub
Watershed
Chornai Sub
Watershed
Tan Sub Watershed
Actual
area
% of the
total
watershed
Actual area % of the
total
watershed
Actual
Area
% of the
total
watershed
Actual
area
% of the
total
watershed
Area(Sq. Kms) 1567.09 15.1% 1448.52 13.92% 1792.30 17.22% 870.44 8.4%
Dense Forest
(Sq. Kms)
401.01 25.59% 426.867 29.48% 656.668 37.97% 308.81 35.48
Open Forest
(Sq. Kms)
363.49 23.19% 219.255 15.13% 192.59 11.14% 186.406 21.42
Scrubland (Sq.
Kms)
8.80 0.56% 1.768 0.13%
Water Bodies
(Sq. Kms)
257.74 16.44% 255.055 17.61% 662.657 38.32% 156.869 18.02
Non Forest
Area(Sq. Kms)
536.03 34.20% 549.322 37.65% 217.385 12.57% 218.357 25.09
Agricultural
Land without
Crop (Sq.
Kms)
288.658 53.85% 78.204 14.34% 135.983 62.56% 164.738 75.44
Agricultural
Land With
Crop (Sq.
Kms)
247.381 46.15% 467.118 85.66% 81.402 37.44% 53.619 24.56
12 This table is a compilation of information from 3 research papers namely and 1 presentation.
1. Ajay K. Singh & S. S. Singh, Upper Hasdeo Watershed Status in Hasdeo River Basin at Chhattisgarh, India, FIG Congress 2010, Facing the Challenges- Building the Capacity, Sydney, Australia.
2. Ajay K. Singh & S. S Singh, FLULC Mapping and assessment of a typical sub watershed of Central India using IRS- P6 LISS 3 data, Journal Of Biodiversity and Environmental Sciences, Vol. 2, No. 9, pg 26-32, 2012.
3. Ajay K. Singh, S. S. Singh & Vandana, Forest Land Cover Variation and Catchment status in the Bamni sub watershed of Hasdeo River Basin in Central India, Journal of Biodiversity and Ecological Sciences, No. 1, Vol. 1, Issue 1.
4. Ajay K. Singh, Forest Vegetation Analysis and Land Cover Assessment in Tan Sub Watershed of Hasdeo River Basin, Chhattisgarh, India.
14
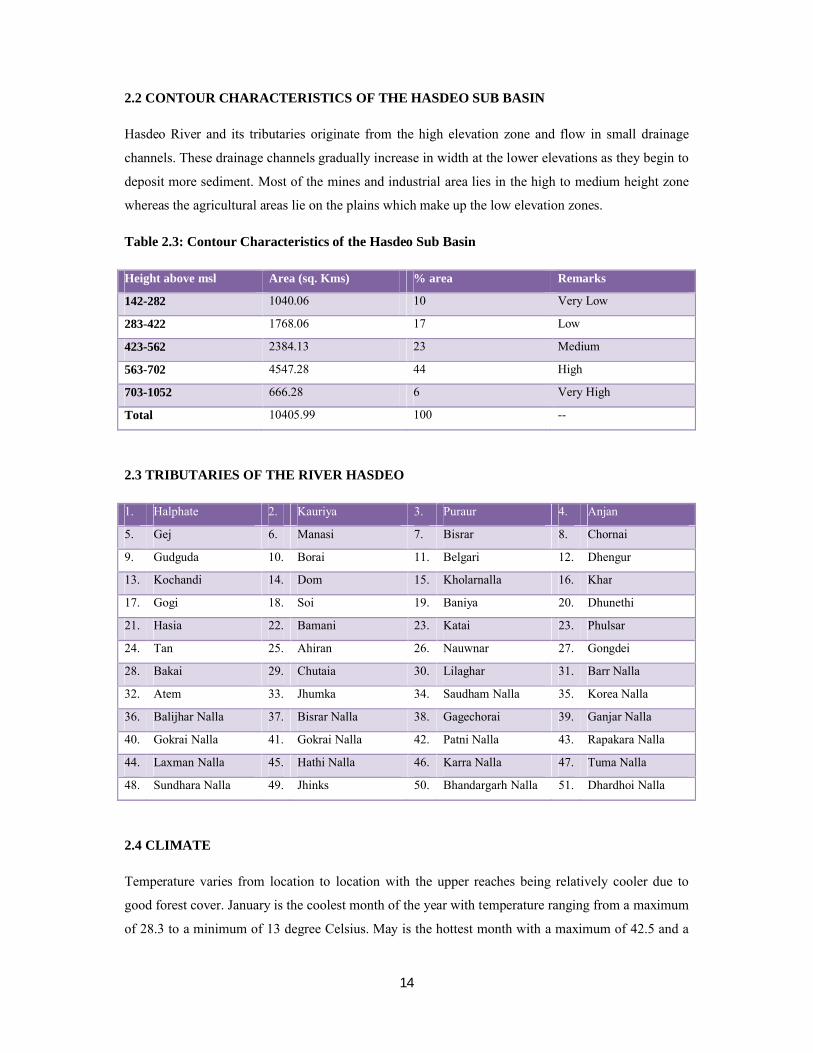
2.2 CONTOUR CHARACTERISTICS OF THE HASDEO SUB BASIN
Hasdeo River and its tributaries originate from the high elevation zone and flow in small drainage
channels. These drainage channels gradually increase in width at the lower elevations as they begin to
deposit more sediment. Most of the mines and industrial area lies in the high to medium height zone
whereas the agricultural areas lie on the plains which make up the low elevation zones.
Table 2.3: Contour Characteristics of the Hasdeo Sub Basin
Height above msl Area (sq. Kms) % area Remarks
142-282 1040.06 10 Very Low
283-422 1768.06 17 Low
423-562 2384.13 23 Medium
563-702 4547.28 44 High
703-1052 666.28 6 Very High
Total 10405.99 100 --
2.3 TRIBUTARIES OF THE RIVER HASDEO
1. Halphate 2. Kauriya 3. Puraur 4. Anjan
5. Gej 6. Manasi 7. Bisrar 8. Chornai
9. Gudguda 10. Borai 11. Belgari 12. Dhengur
13. Kochandi 14. Dom 15. Kholarnalla 16. Khar
17. Gogi 18. Soi 19. Baniya 20. Dhunethi
21. Hasia 22. Bamani 23. Katai 23. Phulsar
24. Tan 25. Ahiran 26. Nauwnar 27. Gongdei
28. Bakai 29. Chutaia 30. Lilaghar 31. Barr Nalla
32. Atem 33. Jhumka 34. Saudham Nalla 35. Korea Nalla
36. Balijhar Nalla 37. Bisrar Nalla 38. Gagechorai 39. Ganjar Nalla
40. Gokrai Nalla 41. Gokrai Nalla 42. Patni Nalla 43. Rapakara Nalla
44. Laxman Nalla 45. Hathi Nalla 46. Karra Nalla 47. Tuma Nalla
48. Sundhara Nalla 49. Jhinks 50. Bhandargarh Nalla 51. Dhardhoi Nalla
2.4 CLIMATE
Temperature varies from location to location with the upper reaches being relatively cooler due to
good forest cover. January is the coolest month of the year with temperature ranging from a maximum
of 28.3 to a minimum of 13 degree Celsius. May is the hottest month with a maximum of 42.5 and a

15
minimum of 26.3°C. Relative humidity ranges from 93% to 25%. Average rate of evaporation
(mm/day) ranges from 2.5 in the month of December to 7 in the month of April.
The average rainfall in the Hasdeo Sub Basin’s catchment is around 1400 mm, ranging from 900 –
1500 mm over the last 10 years. 80% of the rainfall is received from the months of June to August.
Monsoon enters the state slowly and makes its way slowly to the north, while leaving it quits at once
from the state. So the onset of monsoon at different stations in the state is mostly delayed but the
withdrawal date remains constant throughout the state. Thus there is a decrease in the length of
monsoon. The average period of monsoon is 116.87 days which is less than the normal period of 123
days13. The rainfall stations14 in the Hasdeo Sub Basin are located in Pendra Road (Bilaspur),
Baikunthpur , Manendragarh (Koriya), Gharghoda (Korba), Janjgir, Champa, Sakti (Janjgir Champa),
Pali, Katghora (Korba), Ambikapur (Sarguja).
2.5 SOIL
The predominant soil type is loamy as above 62% of the area consists of fine loamy to loamy soils
followed by different types of clayey soils and coarse skeletal loamy varieties. Chhattisgarh plains are
composed of Bhata (lateritic), Matasi (Sandy Loam), Dorsa (Clay Loam) and Kanhar (Clay) while the
northern hills are composed of hilly soils, tikra, Goda Chawar and Bahara. Among these, the Bhata,
Matasi hilly soils and tikra are very light type of soils with very low water retentive capacity. So if
ever there is a break in the monsoon for 5 to 7 days or just after the monsoons withdraws, a water
stress like situation occurs in the soil thus making it difficult for the plants to extract water.
2.6 STATUS OF AQUIFERS IN THE HASDEO SUB BASIN
As per the report “Aquifer systems of Chhattisgarh” released in the year 2012, 14 blocks have been
declared as semi-critical. Out of these 14, 1 lies in Bilaspur which clearly indicates that caution has to
be exercised while planning ground water development in the block15.
Hasdeo River forms the tributary of the largest river basin in Chhattisgarh, The Mahanadi. The
Hasdeo River is part of the middle sub basin of the Mahanadi.
13 Water Year Book 2013, Water Resources Department, Government of Chhattisgarh. 14 The places in parenthesis indicates the district.15 Aquifer Systems in Chhattisgarh- Report prepared by Central Groundwater Board, North Central Chhattisgarh Region, Ministry of Water Resources, Government of India, 2012.

16
Table 2.4: District Wise Distribution of Principal Aquifer Systems16
District Name
Aquifer System
Koriya Surguja Korba Bilaspur Janjgir
Champa
Alluvium Area
%
Laterite Area 622.91 26.60
% 3.95 0.32
Basalt Area 11.35 219.74 62.68
% 0.17 1.39 0.75
Sandstone Area 6460.17 6859.87 4115.70 409.10 180.66
% 97.24 43.48 62.15 4.90 4.66
Shale Area 81.47 1467.48 2213.72
% 1.23 17.59 57.09
Limestone Area 2345.00 1126.43
% 28.11 29.05
Granite Area
%
Schist Area 8.47 23.48
% 0.05 0.35
Quartzite Area 35.79
% 0.43
Charnockite Area
%
BGC17 Area 29.95 6782.96 2270.85 3021.62 75.27
% 0.45 42.99 34.29 36.22 1.94
Gneiss Area 142.37 1283.98 130.25 974.65 281.56
% 2.14 8.14 1.97 11.68 7.26
Total Area 6643.85 15777.93 6621.75 8342.91 3877.63
Table 2.5: A Summary of the Ground Water Condition in the Hasdeo Sub Basin18
District Name Area (Sq. Kms.) Condition
Koriya 6643.8 Major Part of the district is covered with semi-consolidated shale and
sandstone aquifer of the Gondwana Formation. Due to argillaceous nature,
these formations are less productive
Surguja 15777.9 Major part of the district is covered with semi consolidated shale and
16 Aquifer Systems in Chhattisgarh- Report prepared by Central Groundwater Board, North Central Chhattisgarh Region, Ministry of Water Resources, Government of India, 2012.17 BGC – Banded Gneissic Complex18 Aquifer Systems in Chhattisgarh- Report prepared by Central Groundwater Board, North Central Chhattisgarh Region, Ministry of Water Resources, Government of India, 2012

17
sandstone aquifer of Gondwana formation. Due to argillaceous nature, these
formations have low productivity.
Korba 6621.8 Major Part of the district is covered with semi-consolidated shale and
sandstone aquifer of the Gondwana Formation. Due to argillaceous nature,
these formations are less productive
Bilaspur 8342.9 District is partly covered by crystalline aquifer and sedimentary aquifer.
Sedimentary aquifer mainly consists of limestone and shale. Discharge
potential of this aquifer is very high (upto 20lps). Groundwater gradient is
very low.
Janjgir champa 3877.6 About 50% area of the district is covered with sedimentary formation and
remaining part by crystalline aquifer. Yield potential of sedimentary
formation is moderate.
Groundwater samples collected from Korba, Janjgir Champa, Surguja and Koriya only show Nitrate
contamination (Nitrate > 45ppm). Samples from Surguja and Koriya have also shown fluoride
contamination above the permissible limit (Fluoride > 1.5 ppm).
Table 2.6: District Wise Area Prioritised for Artificial Recharge19
District Name
Aquifer System
Koriya Surguja Korba Bilaspur Janjgir
Champa
Total Area Prioritized for
artificial recharge
1164.7 2597.9 292.3 2401.6 126.2
Actual Total Area 6643.85 15777.93 6621.75 8342.91 3877.63
% of area being prioritized for
artificial recharge
17.53 16.47 4.41 29.79 3.25
Total area delineated for Water
conservation and Harvesting
4372.1 6303.3 2779.0 2187.7 96.2
Area suitable for groundwater
development
3771.1 12493.8 6621.8 8342.9 3877.6
19 Compilation of data from different tables from Aquifer Systems in Chhattisgarh- Report prepared by Central Groundwater Board, North Central Chhattisgarh Region, Ministry of Water Resources, Government of India, 2012

18
CHAPTER 3: DISTRICTS AND DEMOGRAPHY
The Hasdeo River passes through 5 districts namely, Koriya, Surguja, Korba, Bilaspur and Janjgir
Champa. The river acquires a variety of forms and serves different purposes as it flows through these
areas. From its origin in the Sonhat Mountains to its final surrender to the Mahanadi in Janajgir
Champa, the river supports an enormous variety of livelihoods and creates a conducive environment
for the establishment for different ecosystems.
Table 3.1: Administrative Division (Hasdeo Sub Basin)20
District Name Area (sq. Kms) Number of
Tehsils
Number of
Development
Blocks
Number of
Towns
Koriya 6643.8 4 5 7
Surguja 15777.9 9 19 7
Korba 6621.8 4 5 4
Bilaspur 8342.9 8 10 14
Janjgir Champa 3877.6 8 9 8
Total 41264 33 48 40
3.1 DISTRICTS
3.1.1 KOREA
Korea, a north western district of Chhattisgarh was earlier a princely state. Korea is composed of 5
tehsils and 653 villages. The earlier resource rich region’s exploitation history is nothing but a 100
year old story. Under the leadership of Raja Ramanuj Pratap Singh Deo, the princely state was
merged with Independent India and the treasury expanded from 2.25 lakh to 44 lakh. It also marked
the construction of the Bijuri Chirmiri Railway lines that then aided in the colliery works of Khurasia,
Chirmiri and Jagarkhand. According to the Korea government portal, 59% of the total district is under
forest cover, but this figure has to be seen in association with the resource exploitation that is
occurring at a rapid rate in the region.
Korea is home to a very complicated biodiversity that encompasses the Guru Ghasidas National Park,
Amritdhara Ramdhaha and Gaurghat waterfalls. Apart from Hasdeo which actually finds its origin in
the dense forests of the region, Banas and Gopad rivers also flow. The region is predominantly tribal
and hence one could easily witness the celebration of the Karma festival, which marks the completion
20 Censusindia.gov.in (Census 2011)

19
of the agricultural operations. It signifies the celebration of hard labour in which the Karam Tree is
worshipped. Saila and Suga dance are performed in its full splendour. Tribal life is one that defines
cooperation rather than competition. Sarhul, Navakhai, Charta and Ganga Dusshera are among the
other festivals that one could witness in Korea which still shows a sense of cultural responsiveness in
sync with the place humans hold in the species evolution graph.
The original inhabitants of the region are the Pando’s whose population in the last one decade has
reduced to half due to the activities that were meant to bring progress to the nation. Rest others are
migrants of their own accord and include cherwa, rajwars, sahu, ahir, gwala, oraon, gadaria, koir,
bargah, basod, kahar, muslim, kunbi, kewat, gupta, jaiswal, agarwal, jains and other scheduled castes.
What really is the remarkable feature of the region is the practice of hunting by the Pando’s. These
traditional hunters used poisoned arrows along with musical sounds to divert the attention of the
animals. The Jhumka which produced this hypnotic music often attracted much more than just rabbits.
Its music brought tigers and panthers in their vicinity. Their way of life was one in which a sense of
harmony existed between man and nature.
The Hasdeo River flows in the form of an upturned S for about 95 Kms in the district. It receives
water from the rivers Gej and Chornai on the left bank and the Tan and Ahiran on the right bank
before meeting the Mahanadi. Forests and coal play a very important role in the economy of the
district.
3.1.2 SURGUJA
Surguja which forms the northern part of the Chhattisgarh state has a rich historical background which
is evident from the presence of various temples and stone carvings. It is said that Lord Rama had
visited Surguja during his period of exile hence one can find places named after them like Ramgarh,
Sita Bhengra and Laxmangarh. The most prominent tribes in the region are the Pandos and the
Korwas which are thought to be the members of the Pandavas and the Kaurava clan. The district falls
in the Tropical thermal belt. The high altitude region of Surguja are characterised by “pat” formations.
The major peaks are:
Table 3.2: Peaks of the District21
Peak Height in Feet
Mailan 4024
Jam 3827
Parta Ghasra 3804
21 http://surguja.nic.in/historical_background.htm#top

20
Kanda Dara 3770
Chutai 3713
Karo 3628
Bamlan 3505
Gungru 3491
Benda 3473
Bhunsa 3424
Bhura Murio 3390
Bijatili 3215
Ambera 3183
Maragarh 3027
The lower portions of the basin comprise of three river basins namely the Hasdeo, Rihand and the
Kanhar. The Hasdeo basin encompasses the Gej, Jhink and the Atem basins.
The Saila, Suwa and the Karma dance speak volumes about their culture and ways of enjoyment.
These dances are performed in a variety of occasions. After the performance of the Suwa dance, a boy
intending to get married puts up a proposal before the girls’ family to get things rolling. Karma dance
is performed to revere the Karam tree that saved a young couple by hiding them in its hollow trunk.
Overnight dancing marks the celebrations. Moreover they are performed by forming a human chain
which symbolizes their unified community setup and way of living.
Nearly 58% of the area is under forests which occupy 10849.079 sq Kms while the rest is either under
agriculture or habitation. Soil here is of 4 major type’s namely red, alluvial, laterite and medium blue.
Surguja also boasts of rich bauxite reserves which are mostly concentrated in the pat formations. It
contains nearly 57% of the total bauxite reserves in the state. Rich deposits of coal can also be found
here cocooned by the rich forest cover. The district is also home to two wildlife sanctuaries Semarsot
Wildlife Sanctuary and Timor Pingla Wildlife Sanctuary.
A study22 taken up in Dhanwar in the Surguja District brought into light the following facts:
1. Tribal’s reside in the forests and hilly region with scattered houses. Although they do like to
live in a united setup with land, water and forests. Only in the absence of basic amenities do
they migrate. There is a precedence of Kachhaa and semi pacca houses over pacca houses.
22 Dr Seraphinus Kispotta, A Socio Economic miserable condition of the tribals in Chhattisgarh (A Case Study of Dhanwar, Surguja District, CG, Journal of Humanities and Social Sciences, Vol. 19, Issue 6, Ver 1, Pg 26-29.

21
2. The literacy rate is very low and consequently a very high dependence on moneylenders.
Their asset formation is very limited.
3. Occupations vary from food gatherers to landless to agriculturists. But most of all they are
dependent on the forest produce for their livelihood. They are highly involved in the
collection of Non Timber Forets Produce (NTFP) eg. Tendu (fruit and leaves), mahua
flowers, mahul patta, chironjee, harra, bheda, amla, Gond, honey, tamarind, chalroot, sal. A
major portion of the produce is sold in the local village markets.
4. Tribals are animists and celebrate festivals like hariyali, naya khani and karma.
5. Malaria is a common health problem among the people along with others such as cold, cough,
pneumonia and diarrhoea for which they prefer to visit the quack doctors instead of private or
government hospital doctors.
6. One reason for the above is the poor connectivity of their settlements through transports.
7. Local markets are within a range of 10 Kms.
8. They mostly depend on dug wells for drinking water. Later on comes hand pumps ponds,
jharnas and lastly rivers. Pure drinking water availability has become a serious problem with
the depletion or pollution of resources. Sanitation facilities are absent
3.1.3 KORBA
The city of Korba forms the district Headquarters of the district and lies on the confluence of the
Hasdeo and the Ahiran River. It has been accorded the name of the power capital of Chhattisgarh as
maximum number of thermal power plants is situated in this district due to its closeness to the Hasdeo
River. Moreover the Darri Reservoir in Korba aids in the easy extraction of water. Earlier this district
was home to huge expanse of forests but now is shrouded in fly ash.
It falls in the hot temperate climatic zone with an average rainfall of 1506.7mm. Hasdeo is the main
river flowing through the district on which are dependent a large number of thermal power plants that
accord the name power hub to it. Korba is further divided into 4 constituencies namely Rampur,
Korba, Katghora and Pali- Tanakhar.
Korba is known for its Gevra coal mines which are the biggest in Asia. Moreover the Kusmunda and
the Dipka mines are also located in the Korba coalfields.
But despite all this exploitation, there are places like Ratanpur, Lafagarh, Chaiturgarh, Tumhan and
the Kendai Waterfalls that still hold up its rich heritage.
3.1.4 BILASPUR – Bilaspur is famous for a set of very different reasons now as compared to its rich
past. Currently the only 2 things that define its presence in the nation is the Kosa industry and the
contribution that it has to the production of rice so thoughtfully named as the “Dhan Ka Katora.” The
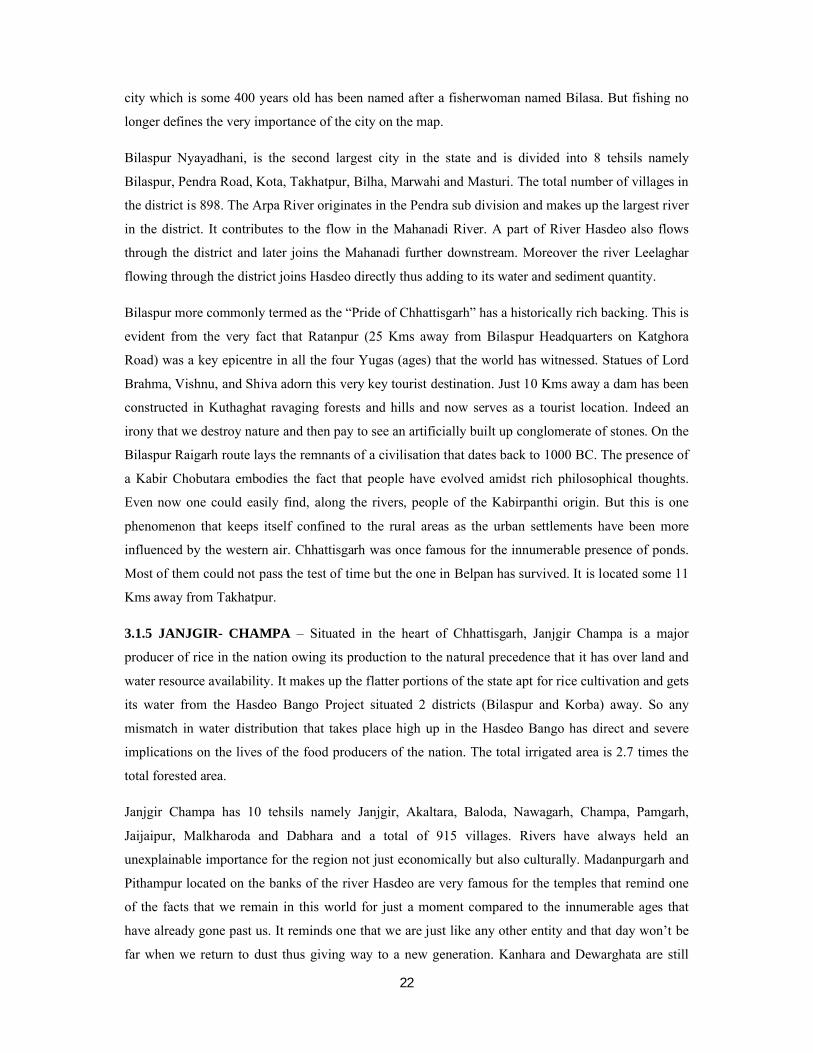
22
city which is some 400 years old has been named after a fisherwoman named Bilasa. But fishing no
longer defines the very importance of the city on the map.
Bilaspur Nyayadhani, is the second largest city in the state and is divided into 8 tehsils namely
Bilaspur, Pendra Road, Kota, Takhatpur, Bilha, Marwahi and Masturi. The total number of villages in
the district is 898. The Arpa River originates in the Pendra sub division and makes up the largest river
in the district. It contributes to the flow in the Mahanadi River. A part of River Hasdeo also flows
through the district and later joins the Mahanadi further downstream. Moreover the river Leelaghar
flowing through the district joins Hasdeo directly thus adding to its water and sediment quantity.
Bilaspur more commonly termed as the “Pride of Chhattisgarh” has a historically rich backing. This is
evident from the very fact that Ratanpur (25 Kms away from Bilaspur Headquarters on Katghora
Road) was a key epicentre in all the four Yugas (ages) that the world has witnessed. Statues of Lord
Brahma, Vishnu, and Shiva adorn this very key tourist destination. Just 10 Kms away a dam has been
constructed in Kuthaghat ravaging forests and hills and now serves as a tourist location. Indeed an
irony that we destroy nature and then pay to see an artificially built up conglomerate of stones. On the
Bilaspur Raigarh route lays the remnants of a civilisation that dates back to 1000 BC. The presence of
a Kabir Chobutara embodies the fact that people have evolved amidst rich philosophical thoughts.
Even now one could easily find, along the rivers, people of the Kabirpanthi origin. But this is one
phenomenon that keeps itself confined to the rural areas as the urban settlements have been more
influenced by the western air. Chhattisgarh was once famous for the innumerable presence of ponds.
Most of them could not pass the test of time but the one in Belpan has survived. It is located some 11
Kms away from Takhatpur.
3.1.5 JANJGIR- CHAMPA – Situated in the heart of Chhattisgarh, Janjgir Champa is a major
producer of rice in the nation owing its production to the natural precedence that it has over land and
water resource availability. It makes up the flatter portions of the state apt for rice cultivation and gets
its water from the Hasdeo Bango Project situated 2 districts (Bilaspur and Korba) away. So any
mismatch in water distribution that takes place high up in the Hasdeo Bango has direct and severe
implications on the lives of the food producers of the nation. The total irrigated area is 2.7 times the
total forested area.
Janjgir Champa has 10 tehsils namely Janjgir, Akaltara, Baloda, Nawagarh, Champa, Pamgarh,
Jaijaipur, Malkharoda and Dabhara and a total of 915 villages. Rivers have always held an
unexplainable importance for the region not just economically but also culturally. Madanpurgarh and
Pithampur located on the banks of the river Hasdeo are very famous for the temples that remind one
of the facts that we remain in this world for just a moment compared to the innumerable ages that
have already gone past us. It reminds one that we are just like any other entity and that day won’t be
far when we return to dust thus giving way to a new generation. Kanhara and Dewarghata are still

23
other places located on the banks of the river Leelaghar which do the same. All these places which
have now become tourist destinations were settlements in a time gone by.
The river Hasdeo bisects the district into two parts23. About 98% of the district is covered by plain
land. The Hasdeo Bango Project brings water all the way to Janjgir Champa to irrigate its plains. The
irrigation intensity in the district is the highest in the state24. Only about 2% of the total area is
covered by alluvium.
3.2 DEMOGRAPHY
As per the Census of India 2011 Chhattisgarh on a whole has 18 districts with 182 towns and 20126
villages.
Table 3.3- Population Statistics 2011 – Census of India25
District Population Males Females
Total Rural Urban Total Rural Urban Total Rural Urban
Koriya 659039 453476 205563 334336 228004 106332 324703 225472 99231
Surguja 2261329 2116312 245017 195145 1068423 126722 1166184 1047889 118295
Korba 1206563 760360 446203 612158 380997 231161 594405 379363 215042
Janjgir
Champa
1620632 1395433 225199 816057 701632 114425 804575 693801 110774
Bilaspur 2662077 1983255 678822 1349928 1001592 348336 1312149 981663 330486
TOTAL 8409640 6708836 1121982 3307624 3380648 926976 4202016 3328188 873828
Chhattisgarh 25540196 19603658 5936538 12827915 9792514 3035401 12712281 9811144 2901137
Among the five districts encompassing the Hasdeo Sub Basin, Bilaspur shows the maximum
population whereas Koriya shows the least. One can also conclude from the above data that, Surguja
has the maximum proportion of their total population living in the rural areas which is nearly 93% and
then comes Janjgir Champa with 86% of its population living in the rural areas. Since a huge
population lives in Rural areas, they are predominantly consumed up in rural sources of livelihoods.
While Janjgir Champa, accorded the status of Dhan Ka Katora, gets water for irrigation via the
Hasdeo Bango Dam, located 2 districts away, the ones residing in the uphill regions of the Surguja
district are at the mercy of the Governments PDS. No irrigation facility plus rampant exploitation of
23,2 Groundwater Brochure of Janjgir Champa District, CGWB, North Central Chhattisgarh Region, Ministry of Water Resources, Governmnet of India, 2010.
25,2 – Provisional Population Totals, Paper 2, Volume 1 of 2011, Data on Rural and Urban Areas, Chhattisgarh Series 23. Census Of India 2011.

24
coal from the forest region, they survive in the bare minimum, ie., subsistence agriculture and income
generation activities like collection of tendu leaves which is very short lived. The irony lies in the fact
that this development equation is destroying one ecosystem for flourishing another. The very region is
responsible for the maximum contribution in terms of tributaries to the Hasdeo River. All this flow
being contained in the dam and then changing an ecosystem Kms downstream means that the original
characteristics of this D/s ecosystem have been altered. All this being done is a manner that in the
long run will not attribute any sustainability.
Table 3.4- Percentage Decadal Growth 2001-201126
District Percentage Decadal Growth
(Persons) 2001-2011
Percentage Decadal Growth
(Males) 2001-2011
Percentage Decadal Growth
(Females) 2001-2011
Total Rural Urban Total Rural Urban Total Rural Urban
Koriya 12.40 10.19 17.61 10.98 9.20 15.00 13.90 11.21 20.53
Surguja 19.74 15.34 78.61 19.51 15.13 75.90 19.97 15.55 81.60
Korba 19.25 17.91 21.59 18.83 17.69 20.77 19.68 18.14 22.49
Janjgir
Champa
23.01 19.05 54.97 23.76 20.04 52.84 22.27 18.08 57.24
Bilaspur 33.21 31.20 39.48 33.15 31.44 38.29 33.28 30.95 40.74
Chhattisgarh 22.59 17.75 41.83 22.47 17.88 40.09 22.71 17.63 43.69
On computing ratios of urban to rural percentage decadal growth, it can be seen that in Surguja, for
every 1% growth in rural population, there is an almost simultaneous 5% growth in the urban
population. While for Koriya, Korba and Bilaspur the percentage decadal growth has been going hand
in hand in the last 1 decade.
Table 3.5- Percentage share of Total Population and Sex Ratio27
District Percentage
Share of Total
Population 2001
Percentage Share
of Total
Population 2011
Sex Ratio (No. Of Females per
1000 males ) 2001
Sex – Ratio (No. Of Females
per 1000 males ) 2011
Rural Urban Rural Urban Total Rural Urban Total Rural Urban
Koriya 70.19 29.81 68.81 31.19 946 971 890 971 989 933
Surguja 93.04 6.96 89.62 10.38 972 977 904 976 981 934
Korba 63.73 36.27 63.02 36.98 964 992 917 971 996 930
Janjgir 88.97 11.03 86.10 13.90 998 1005 941 986 989 968
27 ,4- Provisional Population Totals, Paper 2, Volume 1 of 2011, Data on Rural and Urban Areas, Chhattisgarh Series 23. Census Of India 2011.
25
Champa
Bilaspur 75.65 24.35 74.50 25.50 971 984 932 972 980 949
Chhattisgarh 79.91 20.09 76.76 23.24 989 1004 932 991 1002 956
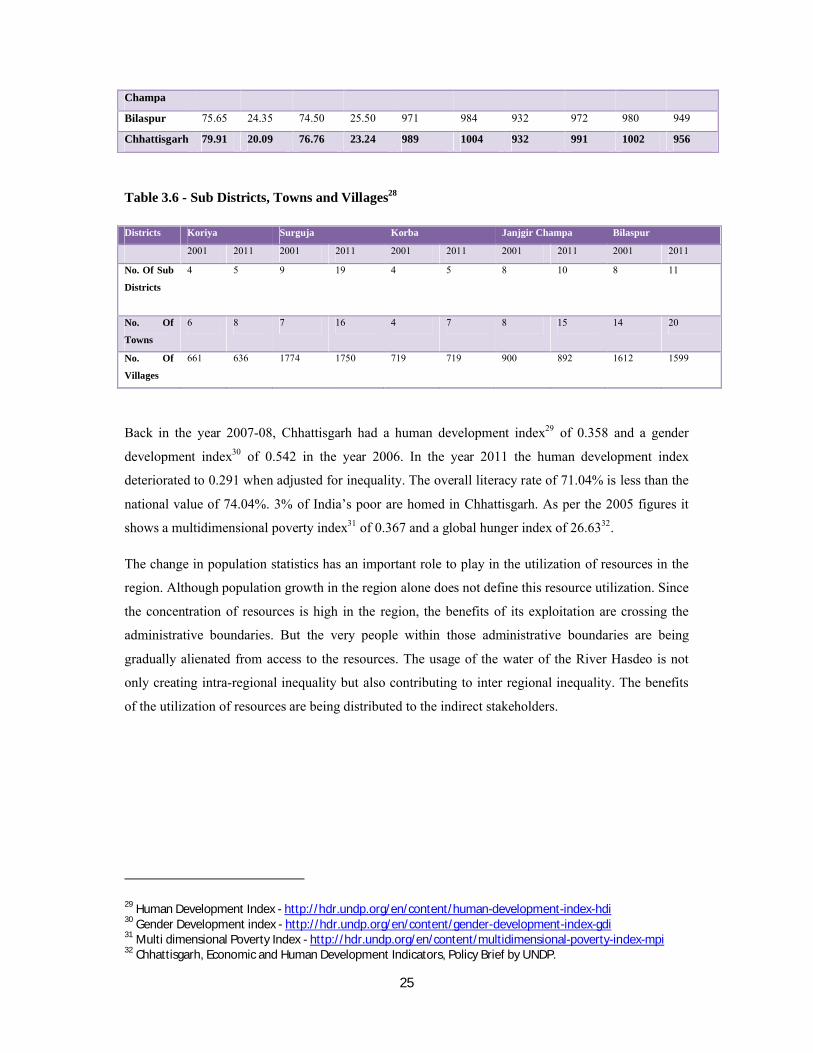
Table 3.6 - Sub Districts, Towns and Villages28
Districts Koriya Surguja Korba Janjgir Champa Bilaspur
2001 2011 2001 2011 2001 2011 2001 2011 2001 2011
No. Of Sub
Districts
4 5 9 19 4 5 8 10 8 11
No. Of
Towns
6 8 7 16 4 7 8 15 14 20
No. Of
Villages
661 636 1774 1750 719 719 900 892 1612 1599
Back in the year 2007-08, Chhattisgarh had a human development index29 of 0.358 and a gender
development index30 of 0.542 in the year 2006. In the year 2011 the human development index
deteriorated to 0.291 when adjusted for inequality. The overall literacy rate of 71.04% is less than the
national value of 74.04%. 3% of India’s poor are homed in Chhattisgarh. As per the 2005 figures it
shows a multidimensional poverty index31 of 0.367 and a global hunger index of 26.6332.
The change in population statistics has an important role to play in the utilization of resources in the
region. Although population growth in the region alone does not define this resource utilization. Since
the concentration of resources is high in the region, the benefits of its exploitation are crossing the
administrative boundaries. But the very people within those administrative boundaries are being
gradually alienated from access to the resources. The usage of the water of the River Hasdeo is not
only creating intra-regional inequality but also contributing to inter regional inequality. The benefits
of the utilization of resources are being distributed to the indirect stakeholders.
29 Human Development Index - http://hdr.undp.org/en/content/human-development-index-hdi30 Gender Development index - http://hdr.undp.org/en/content/gender-development-index-gdi31 Multi dimensional Poverty Index - http://hdr.undp.org/en/content/multidimensional-poverty-index-mpi32 Chhattisgarh, Economic and Human Development Indicators, Policy Brief by UNDP.

26
CHAPTER 4: LIVELIHOODS IN THE HASDEO SUB BASIN
The economy of the tribal people revolves around 3 spheres: Forests, Agriculture and Migration.
Forests form a sort of sustenance employment mainly by the collection and consumption of roots,
tubers and fruits. Employment is generated by the collection of Non Timber Forest Produce as well.
The second sphere is agriculture which the tribal people either practice on their own lands or disputed
forest lands on which they claim titles. This form of agriculture is mostly rain fed. The third sphere is
of post harvest migration for work. This migration occurs to distant agricultural land or as casual
labourers. The level of technology ranges from primitive extensive cultivation in the upper districts to
intensive irrigated agriculture in the lower portion of the basin.
4.1 Agriculture in the Hasdeo Basin
Agriculture is predominantly rainfed in the upper reaches and seasonally irrigated in the lower areas.
In the upper districts of Surguja and Koriya there are dense forests and very little agriculture. People
usually cultivate rice and that too is at a subsistence level. Jeera Phul is one of the unique rice
varieties grown in the upper reaches but due to the rampant mining activities and depletion in the
quality of water the variety has lost its inherent flavour and aroma. On moving further south, one can
find large scale rice production aided by irrigation water from the Hasdeo River catchment. The area
under “Whole Year” crop such as sugarcane, onion, sweet potato and chillies is very low in the
Hasdeo Basin.
In Chhattisgarh about 73% area make up the plains and 95% area in the northern hills are rain fed:
Table 4.1: Agro Climatic Zones of Chhattisgarh
Agro Climatic Zone Districts
Chhattisgarh Plains Raipur, Mahasamund, Dhamtari, Durg,
Rajnandgaon, Kabirdham, Bilaspur, Korba,
Janjgir, and parts of Kanker District
Northern Hills Surguja, Koriya, Jashpur andRaigarh
Chhattisgarh has often been dubbed as the rice bowl of Central India with the main crop being paddy.
Apart from paddy, cereals like maize, kodo-kutki and other small millets, pulses like tur, kulthi and
oilseeds like groundnut, soybean, niger and sunflower are also grown. The major fruit crops grown
are mango, cashew nut, guava, banana, papaya, lime, jackfruit, litchi etc. Apart from these sitaphal,
bael, ber, anola, sapota are also grown both as a cultivated and wild crop.

27
The northern hilly areas of Surguja and Jashpur districts are suitable for production of Litchi. Chilli,
ginger, garlic, turmeric, coriander and methi are the major spices grown in the state.
In a study undertaken to assess the production potential of wheat varieties under changing climate in
rice based cropping system in Chhattisgarh, it was revealed that the growth and yield showed
considerable reduction when the sowing was delayed to December. Hasdeo Bango command area is
under assured irrigation and there is a predominance of rice based cropping system. As a result of
which the sowing of wheat is often delayed and influenced by short winters and high fluctuation of
temperatures, the wheat crop becomes adversely affected. Research is being done to create thermal
stress tolerant varieties for optimum production33.
In an FGD conducted in the Ghatbarra Village in Surguja District, it was found that agriculture was
practiced twice a year, once in the rainy season and the other in the summer season. During the rainy
season rice, maize and pulses like arhar and urad were grown. Since there was no irrigation facility
available in the village, supplemental water requirement was fulfilled by the wells. Rice was so
abundantly grown in the region that it was given in return for a day’s labour. But now there has been a
drastic reduction in the cultivation of rice mainly due to the Government’s scheme of rice provision at
Rs. 1 for 35 Kl to the tribal populace of the region and due to non availability of a clean source of
water. Currently “Jethwa Dhan” or “Jethi Dhan” is being grown. The Jethi Rice was not grown in the
rainy season as it gets damaged and contaminated with excess water pressure. Along with all this
other versions of rice called “Harihar Patti,” “Ten Ten” and “Kalinga” were also being grown. These
varieties first had to undergo seed treatment by the agriculture department and were then available for
Rs.450 for 25 Kgs in Udaypur. Agriculture in the village at least ensured an income of Rs. 25000 a
year but due to the disruption of forests for mining, and disappearance of the local nallas, the
livelihoods dependent on agriculture are at great risk.
The people involved in the cultivation of rice usually make small huts near their fields and stay there
temporarily till the crop has been harvested. The produce is just enough for the family’s personal
consumption and is not sold in the market for commercial gains. So the farmers U/s of the Hasdeo
Bango Dam are clearly involved in subsistence agriculture.
The Barr Nalla passed through this village which was earlier used to water the crops but due to release
of coal laden water, it has now been rendered useless. The people who used to earlier cultivate along
the nalla have stopped cultivating. The only alternative source of natural water left is a “Dhori.”
33 S. R. Patel, A. S. R. A. S. Sastri, R. Singh & D. Naidu; Production Potential of Wheat Varieties Under Changing Climate In Rice Based Cropping System In Chhattisgarh, India, ISPRS Archives XXXVIII-8/W3 Workshop Proceedings, Impact of Climate change on Agriculture, 404.

28
Vagetables like bottle gourd, cucumber, bitter gourd, potato and cauliflower are grown in the rainy
season. Apart from these items collected from the forest are chirco, kumha, bhoru, patiyari, putu, lal
badal, patra, jithi, dhal, dhalwa, bhaisa, dobri dobara, dug dauwa (treats snake bites) and keva kanda
(treats dog bites) which is then further bought from the village people by the local traders and the
forest department. The average landholding in the area is less than 7 acres
In another FGD held at Devarmal Village, but this time D/s of the Hasdeo Bango Dam, 600 families
were dependent on agriculture for atleast 1 season. Devarmal village was close to the city of Korba.
Here also people predominantly cultivated rice. The local varities being Swarna, HMT, Vishnu Bhog
and Dubraj. Watering was done mainly by pumps that lifted water from the river. Since the water
table was low in the region, borewells were not a very successful venture. Each family had an average
land holding of 1.5 to 2 acres. During summers, the crops were watered once in a week. In extreme
summers, people do have to face drinking water shortage. The river flowing along this village
contains fly ash but in a much diluted form so the people have not perceived and changes in yield due
to the use of contaminated water.
One major problem faced by the people of this village and the adjacent ones is the opening fo dam
gates, which submerges their crops for a continuous period of 3 days and sometimes even more. This
comes as a lethal blow to their sole source of livelihood.
4.2 Tendu Patta Collection & Saw Mills – It is collected for 15 to 20 days in a year. It forms one of
the main sources of income for the local tribal population. They begin collecting the tendu leaves
from 4 o’clock in the morning and continue till 12noon. Thereafter they spend their time packing
them in bundles of 50 for which they get Rs 1.35 from the middleman. These leaves receive the
tobacco to be filled in from West Bengal and then finally processed to make “Beedis.”
The tribals also collect sal seed from the forests of Surguja which is sold in the Market for
Rs.200/sack. The oil extracted from the seeds is used to make chocolates.
In the year 1975-78, there were around 150-200 saw mills near the mountainous regions of the Basin.
Later on in order to stop the practice, the auctioning of forest wood was stopped. The people who
derived their livelihood via this medium gradually migrated to other regions or took up a different
kind of job. At present only 25-50 saw mills are present in Ambikapur. The most important depots
where the cut wood was stationed were Tara, Ambikapur and Balrampur. The jungles were also rich
in Saguan which was constantly under the pressure of theft for the furniture industry as it can be
carved into any shape very easily when compared to sal. Saguan fetched nothing less than Rs. 3000-
3500/feet. Even the remnants (Bhusi) were sold at Rs 150/sack.

29
In order to sustain the livelihoods of the people who were dependent on the forests directly for their
livelihoods, the government began distributing “Van Patta Adhikar” but in the long run it only
became a medium to capture the lands of the tribal populace. It was analogous to buying land from the
tribal and handing it over to the corporate. So in one hand the government put an end to the livelihood
generation activities of thousands of people in the region and transferred this right to the corporate in
the name of conservation. So a region which was earlier conservation centric now became a prey to
the throwaway culture.
4.3 River Bed Cultivation and Flood Plain Farming
When the flow in the river decreases post monsoon, large parts of the river beds open up. People on
the banks of the river then cultivate the river bed, the sand beds, growing large number of crops like
water melons, musk melons, cucumber, vegetables pumpkins etc. This is a very important source of
livelihood and incomes, especially as many of those engaged in such cultivation are landless families.
Nearly 5000- 6000 families are dependent on the riverbed cultivation.
People who are involved in River bed cultivation suffer from gastric, cancer, asthama and TB.
Moreover flood plain agriculture si usually done with polluted water. They use it to grow cucumber,
watermelon and other allied vegetables.
4.4 Fisheries:
The fishermen community and the fishes move and live together. If this movement is in a sustainable
manner, then fish diversity flourishes adding to the species richness of the region. This then brings a
continuous source of income as well as fish protein to the most vulnerable group of the fisheries
sector that is the fishermen community. A high socio economic standard of living is a direct indicator
of the rich biodiversity in the river. Tamboli and Jha reported some 58 species of fish in the Mahanadi
river in Janjgir Champa district of Chhattisgarh. Moreover a network of 3573 Kms length of the rivers
Mahanadi, Indrawati, Hasdeo and Sheonath is available for capture fisheries. In a study conducted by
Tambilo in the Bilaspur Division 45 species of fish were observed in the Hasdeo River during 2008 to
2012. Tilapia mossambicus were reported in rare numbers in the Hasdeo River. Gudusia chapra fish
was found in abundance in the Hasdeo River amounting to 87. In the year of study some 1223 fish of
different species were caught from the river Hasdeo depicting the rich piscine diversity.
Excerpts from the FGD conducted with the Fishermen Community in Korba
1. The fishermen only catch food fish and there are no ornamental fishes found in the river.
They include Catla, Rohu, Mirgal, Singhar, Balm, Bata, Cheetal, Sarangi, Chinati, Kari,
Ghorcha, Kulsi, Kotiya, Dengna, Mangur, Singhi, Parhan, Munda, Patola, Chingri, Puthi,
Pacheri, Revcha.

30
2. Cheetal fetches a high price in the market.
3. Location- Kalmedu Ghat. There are 8 to 10 such ghats where fishing contracts have been
given. Some of these locations are Roomgara, Dandpara, Nawagaon, Terai Daand, Songura,
Jhaaku.
4. Women are mostly involved in selling the fish whereas the men are mostly involved in
catching them.
5. During the monsoons the fish catch is high amounting to 20-40 Kg a day. But in the other
seasons it is just 5 – 6 Kl. In summer it reduces to 1 – 2 Kg or even none.
6. Some 10 years back there were incidences of bumper fish weighing up to 100 Kg.
7. There are instances of dead fish due to the polluted water and the extreme water temperature.
8. The people have been involved in fishing for more than 2 generations.
9. The Revcha, Shilang and Bacheri fish is not found today. This is primarily because they
require fast moving water to lay their eggs. Due to the construction of the dam the water
which has now been rendered stagnant does not provide a conducive environment for it to
survive.
10. Because of the dam the water has been rendered stagnant and proper fishing can be done only
in the monsoon season. And because of the accumulation of fly ash on the river bed, the
effective depth of the river has also reduced.
11. The indigenous fish of the river was catla and Rohu, but after the damming operations, the
fishery department put a fish called Kulsi Bata in the river. The former fetched them much
more money in the market than the latter. This is primarily due to the difference in taste.
12. At present a major portion of the fish that is sold in the market comes from Andhra Pradesh or
from the private ponds where fisheries have been developed.

31
CHAPTER 5: ECOLOGY OF THE HASDEO SUB BASIN
5.1 Plant Diversity:
Chhattisgarh covers an area of 135191 square Kms which makes up 4.1% of the land area of the
country and can thus be divided into three climatic zones namely Chhattisgarh plains, the Northern
Hills of Chhattisgarh and the Bastar Plateau.
The data below has been extracted from the Forest Survey of India 2011. The forest cover assessment
is done on a two year cycle. Forest cover is defined as an area more than 1 Ha in extent and having
tree canopy density of 10 percent and above34.
Table 5.1- District wise forests cover (Area in square Kms)35
District Geographical
Area
2011 Assessment Percentage of
geographical
area
Change Scrub
Very
Dense
Forest
Moderately
Dense Forest
Open
Forest
Total
Koriya 6604 79 2605 1423 4107 62.19 0 3
Surguja 15731 320 4836 1977 7133 45.34 0 16
Korba 6599 203 2306 840 3349 50.75 0 6
Janjgir
Champa
3852 4 26 125 155 4.02 0 2
Bilaspur 8270 338 1623 533 2494 30.16 0 6
Traditionally the tribal populace has thrived in the forests as it plays a very important role in their
economy providing them with a source of livelihood. They are the ones who have always lived in
harmony with nature and protected the forests. Hence assessment of forest cover has a special
significance in this regard. As per the FSI survey data only Bilaspur and Surguja have been marked as
tribal dominated. But apart from these two, Korba and Koriya also form a part of the tribal belt.
Table 5.2- Forest Cover and their corresponding canopy density
Forest Cover Canopy Density Range
Very Dense Forest (VDF) >70 %
Moderately Dense Forest (MDF) 40-70 %
34 Forest Cover Methodology, Forest Survey Of India.35 Change figures are based on comparison of 2011 assessment with that of 2009 after incorporating interpretational changes. Source – Forest and Tree Resources in States and Union Territories, Forest Survey of India.

32
Open Forest (OF) 10-40 %
Scrub36 <10%
In the forests of Sarguja, Dr. Ashok Kumar Shukla had earlier identifies 118 different species of
plants which have now reduced to 84. More than 30 different kinds of mushrooms have been found in
the region which is effective against 200 different types of cancers.
Table 5.3: Plant Diversity of the Hasdeo Sub Basin
S.No. Local Name Scientific Name
1. Sal Shorea robusta
2. Teak Tectona grandis
3. Haldu Adina cordifolia
4. Saja Terminalia tomentosa
5. Salai Bosewellia serata
6. Mahul Bauhinia vahlii
7. Semal Bombax ceiba
8. Mahua Madhuca indica
9. Aonwla Phyllantus emblica
10. Harra Terminalia chebula
11. Ber Zizyphus zuzuba
12. Bamboo species Dendrocalamus strictus & Bambusa bambos & Bambusa
arundinaceae
13. Kikar/abul Acasia Arabica
14. Goriar Acasia caesia
15. Khair Acacia catechu
16. Bel Aegle marmelos
17. Akol Ailangium salvifolium
18. Siris Albizzia lebbek
19. Chhatrak Alstonia scolaris
20. Dhawada Anogeissus latifolia
21. Sheetaphal Annona squamosa
22. Ramphal Annona reticulate
23. Kadamb Anthocephalus cadamba
24. Neem Azadirachta indica
25. Kachnar Bauhinia variegate
26. Samel Bombax ceiba
27. Chironjee Buchania lanzan
28. Chhoela Butea monosperma
36 Highly degraded forest or wastelands with stumped trees having canopy density less than 10% are classified as scrubs, which is a category of non forest cover.

33
29. Kumahi Careya arborea
30. Flem Caesalpinia bonducella
31. Kusum Carthamus tinctorius
32. Amaltas Cassia fistula
33. Nimbu Citrus medica
34. Lasoda Cordia mixa
35. Unjain Celastrus peniculata
36. Sisham Dalbergia sisso
37. Dhobin Dalbergia paniculata
38. Tendu Diospyrus melanoxylon
39. Makar Tendu Ciospyrus ebenum
40. Amla Embilica officinalis
41. Munga Erythrinia indica
42. Neilgiri Eucalyptus grandis
43. Jamun Eugenia heyneana
44. Bargad Ficus bengalensis
45. Pipal Ficus religiosa
46. Anjeer Ficus carica
47. Rubber Ficus elastic
48. Pakri Ficus infectoria
49. Gular Ficus glomerata
50. Piprol Gardenia latifolia
51. Khenkara Garur pinnata
52. Khamer Gmelina arborea
53. Koriya Holarrhena hantidysenerica
54. Anjan Hardwikia binata
55. Rattanjote Jatropha curcus
56. Nana Lagestoromea lanciota
57. Subabul Lauceenea leucocephala
58. Litchi Litchi chinensis
59. Maida Litsea chinensis
60. Mahua Maduca indica
61. Aam Mangifera indica
62. Mulberry Morus alba
63. Senjhra Moringa oleifera
64. Bachain Melia azadirachta
65. Mithineem Murraya koenigii
66. Tilsa Ougenia dalbergia
67. Chinar Plantanus orientalis
68. Katanj Pongamia pinnata
69. Almond Prunus amygdalus
70. Guava Psidium guyava

34
71. Bija Plerocarpus marsupium
72. Menda Randia duetorum
73. Chandan Santalum album
74. Ashoka Saraca indica
75. Bhelwa Semecarpus anacardium
76. Sarai Shorea robusta
77. Rohina Soymida febrifuge
78. Lodh Symplocos racemosa
79. Imali Tamarindus indica
80. Kahua Terminalia arjuna
81. Baihra Terminalia bellerica
82. Saj Terminalia tomentosa
83. Asan Terminalia aliptica
84. Sagwan Tectona grandis
In the interview with the local doctor it was found that he went once a week to the forests to collect
the required plants. He particularly mentioned that earlier i.e., 14 to 15 years back he used to get most
of the plants within half an hour but at present it takes the whole day sometimes to find just one plant.
That severe has been the level of forest degradation.
Table 5.4: Medicinal plants obtained from the forests of the Hasdeo sub Basin
S.No. Name of the Species Local Name Scientific Name Useful part Nature
1. Bel Bel, Bild, Shree Phal Aegle marmelos Fruit Tree
2. Chironjee Char, Chironjee, Reka, Aachar Buchanania lanzan Seed Tree
3. Amaltas Amaltas, Raela, Dhan Bahar,
Sonrali, Bhalu Masruli
Cassia fistula Fruit Tree
4. Aavla Aavla, Aunra, Aamliki Phyllanthus emblica Fruit Tree
5. Mahua Mahua, Idukamra, Moda,
Mauha
Madhuca indica Flower and
seed
Tree
6. Karanj Karanj Pongamia pinnata Seed Tree
7. Bhilwa Bhilwa, Kohka Semecarpus
anacardium
Fruit Tree
8. Imli Imli Tamarindus indica Fruit Tree
9. Bahera Bahera, Tanka Terminalia bellirica Fruit cover Tree
10. Harra Harra Terminalia chebula Fruit cover Tree
11. Palash Palash, Dhak, Teshu Butea monosperma Flower, seed Tree
12. Aak Fudhar, Aakvan, Jiludih,
madaar
Calotropis gigantea Flower Shrub
13. Baybiding Baybidding, Dulli Embelia tsjerium Fruit Shrub

35
cottam
14. Marorfalli Aenthi, Marorfalli, Aatan Helicteres isora Fruit Shrub
15. Indrajow Kuranchi, Dudhi, Koriya, Kutaj,
Kuda
Holarrhena
antidysenterica
Seed Tree
16. Jatropha Jatropha, Ratanjyot Jatropha curcas Seed Shrub
17. Kateri Katri, Bhojra, Koi, Kantkakkari,
Bharkatiya, Bhatkataiya
Solanum surattense Root Herb
18. Nirgundi Nigur, Sandor, Shivari VItex negundo Leaf, seed Shrub
19. Dhavai Phul Dhavai, Dhaaru, Dhaav, Dhaay Woodfordia fruticosa Flower Shrub
20. Apamarg Chirchira, Latjeera, Bichauti Achyranthes aspera Root and
seed
Herb
21. Bach Bach, Bacha, Ghurvach Acorus calamus Rhysome Herb
22. Kaal megh Bhui Neem, Kadu chiraita,
chiraita
Andrographis
paniculata
Root Herb
23. Punarnava Punarnava Boerhavia diffusa Root Herb
24. Mandukparni Brahmi Centella asiatica Dry leaves Creeper
25. Safed Musli Safed Musli Chlorophytum
tuberosum
Tuber Herb
26. Kali Musli Kauwa Kanda, Kanva,
Kauwapaar
Curculigo orchioides Tuber Herb
27. Giloy Giloy, Gurchi, Gulbel Tinospora cordifolia Bark -
28. Mahul Patta Mahul Patta, Mohline, Siyari Bauhinia vahlii Leaf -
29. Vanjeera Vanjeera Vernonia
anthelmintica
Seed Herb
30. Bhui Aavla Hazardana, jarmala, Junglee
aavla
Phyllanthus amarus Root Herb
31. Makoy Makoy, Kakamachi Solanum nigrum Fruit Herb
32. Sarphonk Sarphonk, Bajradanti Tephrosia purpurea Root Herb
33. Laal Gunja Ratti Abrus precatorius Seed -
34. Tikhur Tikhur Curcuma angustifolia Tuber -
35. Salparni Chipi, Latkan Desmodium
gangeticum
- Herb
36. Bhringraj Bhengra, Kankiphul, Bhringraj Eclipta alba Root Herb
37. Shikakhai Cheel, shikakhai Acacia sinuata Dry fruit Shrub
38. Satavar Satavar, Dashmool, satavari,
Chedavari
Asparagus racemosus Tuber -
39. Maalkangni Peng, Khujuri Celastrus paniculatus Seed -
40. Hatjor Harjuri Cissus quadrangularis - -
41. Gurmaar Gurmaar Gymnema sylvestre Leaf -
42. Anantmool Khaprijari, Pitt Bela, Sugandhi
jari
Hemidesmus indicus Root -

36
43. Kevanch Kevanch, Kaunch, khajohra Mucuna pruriens Seed -
44. Van Tulsi Van Tulsi, Kali tulsi Ocimum gratissimum Seed -
45. Bechandi Bechandi Dioscorea Tuber -
46. Bidari Kand Van Kumhanda, Bhui
Kumhanda, Patal Kumhanda,
Bidari Kand
Pueraria tuberosa Tuber -
5.2 Wildlife
Chhattisgarh is blessed with some of the most endangered and rare wildlife species. They include wild
buffaloes, hill myna, wild boar, Indian gazelle, chital, nilgai, sloth bear, sambars, guars, barking deer,
bison, four horned antelope, chinkara, muntjac, dhole, jackal, striped hyena, porcupine. Birds found in
the region are parrots, green pigeons, storks, darters, wood peckers, jungle fowls, quails, peacocks,
gray partridges.
As per Meetu Gupta, a wildlife conservationist, increased mining in Jharkhand and Odisha has forced
a large number of elephants to migrate to the forests of Surguja, Jashpur and Korba in Chhattisgarh. A
proposal for an elephant reserve of over 384 sq. Kms in Hasdeo Arand Forests was sent to the centre
in the year 2002 by the state forest department but in the year 2006 it was found that a coal block of
100 sq. Kms fell within the elephant reserve. And thus the elephant reserve could not see the light of
the day37.s
37 filse:///D:/WCF%20E-Flows/dam%20weblinks/ArtWin.asp.html

37
CHAPTER 6: HUMAN INTERVENTIONS: DAMS
In accordance to the latest report of the National Register of Large Dams, there are 4857 large dams38
that have been completed and other 345 large dams which are under construction in India. As per the
report the data for Chhattisgarh (updated 8/2014) says that there are 248 dams that have already been
completed and 10 are under construction and this nearly comprises 5% of the total dams present in
India. Chhattisgarh saw its peak dam building phase from 1971 – 1991 where 150 dams were
sanctioned and completed. During this phase Chhattisgarh was part of Madhya Pradesh.
39As of now Chhattisgarh has one dam of National Importance40 which is the Minimata (Hasdeo)
Bango, 128 dams whose height lies between 10m – 15m and 130 dams whose height is greater than
15m. In the state wise distribution of large dam, Chhattisgarh ranks 4th.
The result of the formation of dams and barrages on the River Hasdeo has created a number of deep
pools known as “dahars.’ As of now the Government of Chhatisgarh is planning to come up with 3
barrages in Basantpur, Mironi and Saradih, all of them in the Janjgir Champa District that too without
any Environmental Impact Assessment. One may argue that since barrages do not cause any
submergence then why they at all need to conduct EIA’s41. After monsoons when the flow of the river
recedes, then large portions of the river bed are used by the people to cultivate water melons, musk
melons, cucumber, pumpkins and other allied vegetables which make up a considerable source of
their income. This becomes all the more important for the landless families. Impounding of water
converts the flowing river to “dahars” which impacts the fish population and in turn the people who
rely on it for nutrition and income generation42.
In its 333 Km long stretch, the River Hasdeo has been blocked twice. The first being the Hasdeo
Bango Dam and the second being the Darri Reservoir.
38 International Commission on Large Dams (ICOLD) – A Large Dam is classified as one with a maximum height of more than 15m from its deepest foundation to the crest. A dam between 10-15 m in height from its deepest foundation is also included in the classification of a large dam provided it complies with one of the following conditions : a) length of crest of the dam is not less than 500m or b) capacity of the reservoir formed by the dam is not less than 1Mcubic m or c)the maximum flood discharge dealt with by the dam is not less than 2000m3 /sec or d) the dam has specially difficult foundation problems or e) the dam is of unusual design.39 Data Source – National Register of Large Dams 40 Dam of National Importance is such dams with height 100 m and above or gross storage capacity of 1 Billion cubic meters and above.41, 20 D. Shripad, Powerful Forces get water for Power, Dated 5th December, 2013. http://indiatogether.org/barrage-environment

38
Table 6.1: Dams and Barrages on the River Hasdeo
Features Minimata (Hasdeo) Bango Hasdeo Barrage (Darri Reservoir)
Code CG03HH0173 CG03MH0025
Year of Completion 1990 1967
River Hasdeo Hasdeo
Type TE- Earthwork TE- Earthwork
Height above the lowest Foundation 87 m 17.15 m
Length of the Dam 2509 m 283.76 m
Volume content of the Dam NA NA
Gross Storage Capacity 3420 MCM 80.1 MCM
Reservoir Area 188.47 Sq Kms 25.9 Sq. Kms
Effective Storage Capacity 3050 MCM 81.1 MCM
Purpose I/H- Irrigation & Hydel I- Irrigation
Designed Spillway Capacity 42842.00 m3/sec 19820.00 m3/sec
The catchment area of the Minimata Bango Dam is nearly 6730 sq Kms and the average annual
precipitation is 1505 mm (Maximum 1920 mm and minimum 940mm).
The Hasdeo Bango Multipurpose Project comprises of Hasdeo Project Phase I and II. They include a
4.40 Kms long left bank canal to supply water to the TPP’s and a right bank canal for supplying
irrigation water . Phase III and IV included the construction of the Minimata Bango Dam 42 Kms
upstream of the barrage for hydropower generation and additional water for irrigation and industries.
At present the project is declared complete although the lining of the canal and development of field
channels remains incomplete43. As per the India WRIS website, all 4 phases of the project has
receives investment clearances from the planning commission.
Table 6.2: The total estimated water requirement for various needs is as follows:
Irrigation 2578 MCM
Industrial & Municipal 455 MCM
Reservoir Losses 229 MCM
In the course of a discussion with Alok Putul (BBC News Reporter), it was revealed that earlier the
provision of drinking water was the priority for water distribution. After drinking water, irrigation and
then industries assumed importance. But then back at a point in time when Ajit Jogi was the chief
Minister of Chhattisgarh, then a request was made to the farmers to not take up rice cultivation in
summer as they would not be able to provide them with water.
43 Hasdeo Sub Basin Agriculture Theme- Craig D’Souza

39
Apart from the above two mentioned impoundments, there are more than 50 anicuts/check dams that
have been constructed in the catchment area at different places from its origin to the confluence with
Mahanadi. But the exact number of dams and the nalla on which they have been constructed is still
unclear.s
Table 6.3: Other anicuts/ check dams in the catchment area of the Hasdeo Sub Basin44
S.N
o
Name of the
Dam
Year of
Completion
River District Type Height Length Purpose Status
1. Agaria Dam 1977 Local
Nalla
Bilaspur TE 16.89 1080 - C
2. Amachuwa Dam 1917 Local
Nalla
Korba TE 11.88 223 - C
3. Amakhokhra Dam 1985 Local
Nalla
Korba TE 10.8 744 - C
4. Badesathi Dam 1987 Local
Nalla
Korea TE 17 450 Irrigation C
5. Badra Dam 1988 Local
Nalla
Korea TE 20.58 288 Irrigation C
6. Badrika Ashram
Dam
1986 Local
Nalla
Suarguja TE 10.5 690 Irrigation C
7. Banjaridand Dam 1982 Local
Nalla
Korea TE 17.92 780 Irrigation C
8. Barat Sagar Dam 2004 Local
Nalla
Bilaspur TE 13.5 1600 Irrigation C
9. Bardar Dam 2004 Local
Nalla
Bilaspur TE 18.3 810 Irrigation C
10. Barkela Dam 1999 Local
Nalla
Korea TE 17.6 610 Irrigation C
11. Barpara Dam 1980 Local
Nalla
Korea TE 12.4 840 Irrigation C
12. Belbehra Dam 1967 Local
Nalla
Korea TE 14.16 1035 Irrigation C
13. Champi Dam 2003 - Bilaspur TE 15.42 2160 Irrigation C
14. Charpara Dam 1986 Local
Nalla
Korea TE 19.16 570 Irrigation C
15. Charcha Dam 1987 Local
Nalla
Korea TE 17.56 429 Irrigation C
16. Dandgaon Dam 1994 Local
Nalla
Surguja TE 17.12 1410 Irrigation C
44 Chalked out from the NRLD documentThese dams have been chalked out on the basis of the district in which they lie. A more nuanced assessment needs to be conducted to determine as to exactly how many of them are in the Hasdeo Sub Basin.

40
17. Deoripali Dam 1986 Local
Nalla
Janjgir
Champa
TE 11.7 570 Irrigation C
18. Dhanras Dam 1911 Local
Nalla
Bilaspur TE 11 450 Irrigation C
19. Dhawanpur Dam 1970 Local
Nalla
Bilaspur TE 10.1 1204 Irrigation C
20. Fulwari Dam 1991 Local
Nalla
Bilaspur TE 11 1525 Irrigation C
21. Ganeshpur Dam 1985 Local
Nalla
Korea TE 19 405 Irrigation C
22. Gej Dam 2002 Gej Korea TE 27.5 4065 Irrigation C
23. Ghatoi Dam 1992 Local
Nalla
Janjgir
Champa
TE 10.15 1950 Irrigation C
24. Ghogra Dam 1981 Local
Nalla
Surguja TE 20.97 347 Irrigation C
25. Ghongha Dam 1981 Ghong
ha
Bilaspur TE 17.88 720 Hydroelectri
city,
Irrigation
C
26. Gobari Dam 1976 Local
Nalla
Korea TE 16.15 430 Irrigation C
27. Gursia Dam 1992 Local
Nalla
Korba TE 17.15 130 Irrigation C
28. Jagatpur Dam 2004 Local
Nalla
Korea TE 18.86 180 Irrigation C
29. Jhumka Dam 1981 Gej Korea TE 29.8 2820 Hydroelectri
city,
Irrigation
C
30. Junwani Dam 1988 Local
Nalla
Korba TE 10.5 675 Irrigation C
31. Kehra Dam 1991 Local
Nalla
Korba TE 11.8 1320 Irrigation C
32. Khadgawan Dam 1971 Local
Nalla
Korea TE 15 130 Irrigation C
33. Khanda Dam 1986 Local
Nalla
Korea TE 10.3 510 Irrigation C
34. Kharung Dam 1930 Kharu
ng
Bilaspur TE 21.31 495 Irrigation C
35. Kopra Dam 1993 Local
Nalla
Bilaspur TE 10.96 1680 Irrigation C
36. Kothari Dam 1980 Local
Nalla
Korba TE 13 660 Irrigation C
37. Koushalpur Dam 1986 Local
Nalla
Surguja TE 11 660 Irrigation C

41
38. Kunkuna Dam 1991 Local
Nalla
Korba TE 12.1 720 Irrigation C
39. Kusmaha Dam 1986 Local
Nalla
Korea TE 15.34 580 Irrigation C
40. Lai Dam 2004 Local
Nalla
Korea TE 16.5 518 Hydroelectri
city,
Irrigation
C
41. Maharajpur Dam - Local
Nalla
Korea TE 16.5 518 Irrigation C
42. Malhania Dam 2002 - Bilaspur TE 21.8 2700 Irrigation C
43. Maniyari Dam 1930 Maniy
ari
Bilaspur TE 28.96 2095 Hydroelectri
city,
Irrigation
C
44. Morga Dam 1987 Local
Nalla
Korea TE 21 495 Irrigation C
45. Murma Dam 1986 Local
Nalla
Korea TE 14.2 1035 Irrigation C
46. Murwadand Dam 1992 Local
Nalla
Korba TE 15.9 210 Irrigation C
47. Nawkerra Dam 1981 Local
Nalla
Surguja TE 18.89 518 - C
48. Parasrampur Dam 2006 Garasil
i
Surguja TE 20.7 1260 Irrigation C
49. Rajoli Dam 1986 Local
Nalla
Korea TE 18.76 585 Irrigation C
50. Rajpuri Dam 2005 Local
Nalla
Korea TE 15.6 1260 Irrigation C
51. Ramanujganj
Dam
1990 Local
Nalla
Surguja TE 13.98 1390 Irrigation C
52. Rikhi Dam 1991 Local
Nalla
Surguja TE 14.4 810 Irrigation C
53. Sadamar Tank 1988 Local
Nalla
Korba TE 10.67 610 Irrigation C
54. Saila Dam 1991 Local
Nalla
Korba TE 11.96 1500 Irrigation C
55. Salihabhata Dam 1991 Local
Nalla
Korba TE 11.5 690 Irrigation C
56. Salihapara Dam 1991 Local
Nalla
Korba TE 10.1 960 Irrigation C
57. Saliyadih Dam 2004 Local
Nalla
Surguja TE 15.9 465 Irrigation C
58. Sawatpur Dam 1977 Local
Nalla
Bilaspur TE 16.89 1080 Irrigation C

42
59. Sawla Dam 1984 Local Korea TE 15.3 990 Irrigation C
60. Shivepur Dam 1981 Local
Nalla
Surguja TE 10 600 Irrigation C
61. Silphoda Dam 1986 Local
Nalla
Korea TE 15.9 645 Irrigation C
62. Sonhat Dam 1986 Local
Nalla
Korea TE 15.6 230 Irrigation C
63. Tamdand Dam 1980 Local
Nalla
Korea TE 17 425 Irrigation C
64. Tulutolia Dam 1975 Local
Nalla
Bilaspur TE 13.87 1187 Irrigation C
6.1 IMPACT ON THE LIVES OF THE PEOPLE AFFECTED BY THE CONSTRUCTION OF
THE DAM
6.1.1 Excerpts of an FGD conducted in the Village Khotkhorri (close to the backwaters of the
Hasdeo Bango Dam)
1. This village has a population of nearly 300 and most of the people are “Manikpuri Bhagat”
which means that they do not consume alcohol, mahua and non vegetarian food. These people
are Kabirpanthi (followers of Kabir).
2. When the dam was constructed then they had to move up higher up in the hills as they did not
get a compensation in spite of the fact that they did have a house in the area that was about to
be submerged. Only those families that had agricultural land in the area were compensated.
3. But most of the families that did not have agricultural land used to cultivate vegetables when
the water receded. So the main source of income for many of the families in the region got
hampered. The people of the village are now solely dependent on the forest for their
livelihoods.
4. Along with Khotkhorri, some other villages were also completely displaced. They include
Bhurmahua, Banragarh, Durghattiyayi, Saraibhadra, Amlitikra and Gavarpahar.
5. The people of the village are of the opinion that even if now the dam gates are opened at the
appropriate time then they can still cultivate on the flood plains. They could cultivate around
100-150 man of rice (1man = 40 kl). Land is mostly required for 4 to 5 months at a stretch.
Effective dam regulation could help them regenerate their livelihood. Earlier when the dam
was not there then clear drinking water was available at a distance of 0.5 kms from their
homes. The movement of water was also slow and it easily spread across the flood plains. But
since the construction of the dam, the land adjacent to the backwaters have been waterlogged
and are of no use.

43
6. The backwaters contained different kinds of fish namely Mirkal, Mirga, Bangur, Jhori,
Chinati, Bambi, Singi, Perna, Kekdou, Ghonghi, Singhar, Baliya, Mangur, Saour, Rohu,
Catla,Jhinga, Pothi, Mehrali, Ketu, Thondo and Gina.
7. Since the village was just next to the forest there were incidences of snake bites very common
in the area by Ghamna, Gehua, Karait and Tardomi(Viper). But before the construction of the
dam the village was located near the confluence of the Chornai river, Bandhargarh Nalla and
Dhardhoi Nalla. But this displaced village was highly isolated from the other areas.

44
CHAPTER 7: HUMAN INTERVENTIONS – COAL MINES
As per the Mineral Resources Department Website of the Government of Chhattisgarh, the state has 16% of the
total coal deposits in the country and all of this is concentrated in 12 coalfields located in Surguja, Koriya,
Korba and Raigarh. The former three districts form a part of the Hasdeo River Basin. Moreover the state ranks
2nd in coal production and thus contributes 18% to the production that takes place at the national level45.
Table 7.1: Area Wise details of Underground, Open cast and Mixed Mines of SECL as on 31st March
201446. (Figures indicate the number of mines)
Areas of SECL Underground Opencast Mixed
Hasdeo Arand 4 - -
Chirmiri 6 1 1
Baikunthpur 5 - -
Bisrampur 5 3 -
Bhatgaon 5 3 -
Korba 10 2 -
Kusmunda - 1 -
Gevra - 1 -
Dipka - 1 -
TOTAL 35 12 1
Table 7.2: Coal Mines and their associated forest area diversion and daily water requirement (Source –
EIA Reports)
Coal Mine District Forest Area
Diverted
(Ha)
Daily
Water
Requirement
Source of
Water
Notes
Chirmiri 47(OCM)
EIA by Ecomen
Laboratories Pvt.
Ltd.
Koriya 332.986 0.50 MCM/day Mine Water Saudham Nallah flows through the northern
part of Chirmiri Hill and joins Korea Nalla
which in turn drains into Hasdeo River.
EIA also speaks about one Balijhar Nalla.
Nawapara
Underground
Project
(Underground
Mine)
Sendurpara
Geological
Block of
Bisrampur
Coalfields,
District-
Surguja
71.98 - - -
45 http://chhattisgarhmines.gov.in/coal.htm46 https://www.coalindia.in/DesktopModules/DocumentList/documents/SECL_08082014.pdf47 http://www.enviscecb.org/180/Executive%20Summary_English.pdf
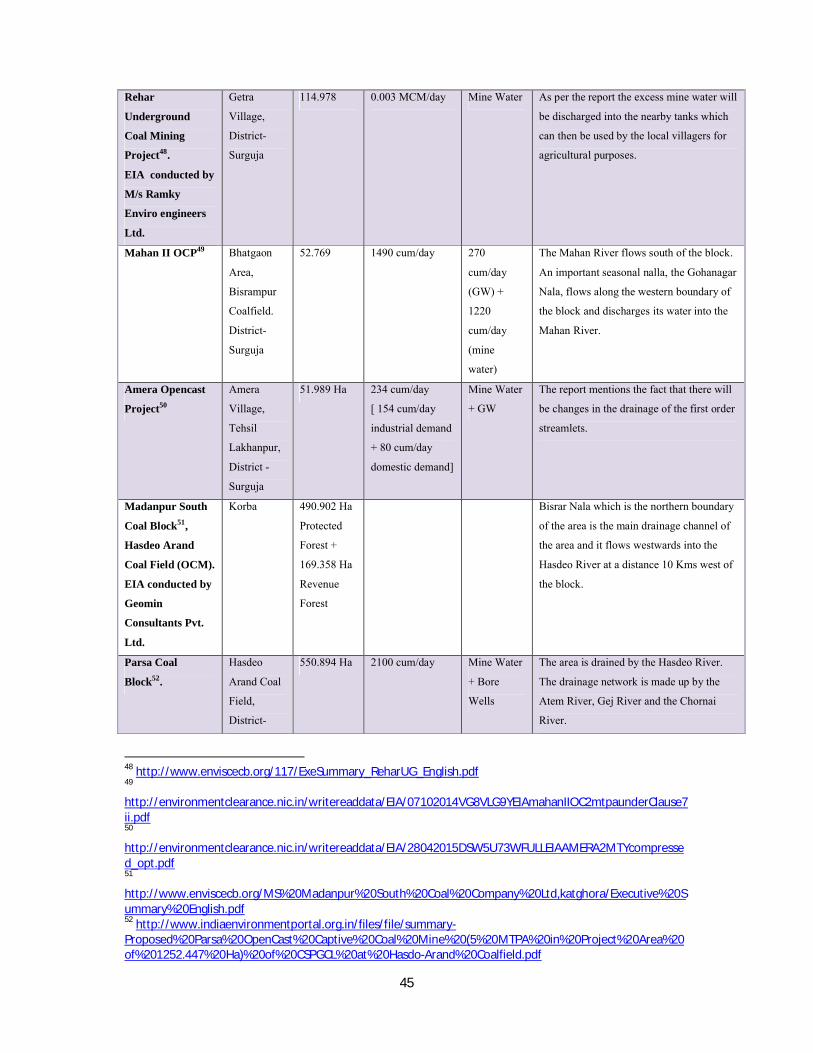
45
Rehar
Underground
Coal Mining
Project48.
EIA conducted by
M/s Ramky
Enviro engineers
Ltd.
Getra
Village,
District-
Surguja
114.978 0.003 MCM/day Mine Water As per the report the excess mine water will
be discharged into the nearby tanks which
can then be used by the local villagers for
agricultural purposes.
Mahan II OCP49 Bhatgaon
Area,
Bisrampur
Coalfield.
District-
Surguja
52.769 1490 cum/day 270
cum/day
(GW) +
1220
cum/day
(mine
water)
The Mahan River flows south of the block.
An important seasonal nalla, the Gohanagar
Nala, flows along the western boundary of
the block and discharges its water into the
Mahan River.
Amera Opencast
Project50
Amera
Village,
Tehsil
Lakhanpur,
District -
Surguja
51.989 Ha 234 cum/day
[ 154 cum/day
industrial demand
+ 80 cum/day
domestic demand]
Mine Water
+ GW
The report mentions the fact that there will
be changes in the drainage of the first order
streamlets.
Madanpur South
Coal Block51,
Hasdeo Arand
Coal Field (OCM).
EIA conducted by
Geomin
Consultants Pvt.
Ltd.
Korba 490.902 Ha
Protected
Forest +
169.358 Ha
Revenue
Forest
Bisrar Nala which is the northern boundary
of the area is the main drainage channel of
the area and it flows westwards into the
Hasdeo River at a distance 10 Kms west of
the block.
Parsa Coal
Block52.
Hasdeo
Arand Coal
Field,
District-
550.894 Ha 2100 cum/day Mine Water
+ Bore
Wells
The area is drained by the Hasdeo River.
The drainage network is made up by the
Atem River, Gej River and the Chornai
River.
48 http://www.enviscecb.org/117/ExeSummary_ReharUG_English.pdf49
http://environmentclearance.nic.in/writereaddata/EIA/07102014VG8VLG9YEIAmahanIIOC2mtpaunderClause7ii.pdf50 http://environmentclearance.nic.in/writereaddata/EIA/28042015DSW5U73WFULLEIAAMERA2MTYcompressed_opt.pdf51
http://www.enviscecb.org/MS%20Madanpur%20South%20Coal%20Company%20Ltd,katghora/Executive%20Summary%20English.pdf52 http://www.indiaenvironmentportal.org.in/files/file/summary-Proposed%20Parsa%20OpenCast%20Captive%20Coal%20Mine%20(5%20MTPA%20in%20Project%20Area%20of%201252.447%20Ha)%20of%20CSPGCL%20at%20Hasdo-Arand%20Coalfield.pdf

46
Surguja and
Surajpur
Balgi
Underground
Project53.
Tehsil
Katghora,
District
Korba
Nil - - The drainage network is made up by the
Ahiran River and the Kholar Nalla that
ultimately join the Hasdeo River.
Manikpur Coal
Project 54(Proposed
Expansion)
EIA conducted by
Ramky Enviro
Engineers Ltd.
District-
Korba
371.619 1.212 MLD GW +
Hasdeo
River +
Mine water
+ Canal
Water
The main river that flows through the
region is Hasdeo and its tributaries
Gagechorai, Tan and Ahiran.
Tha Rapakara Nallah flows into the core
zone from the eastern side of the core zone
and then ultimately joins the Hasdeo River.
Gevra Opencast
Project55
Gevra
Village,
Ponri,
Bareli,
Tehsil-
Katghora,
District
Korba.
1038.63 - - Hasdeo River is the master drainage of the
area. The mine block is drained by Laxman
Nallah which joins the Ahiran River, a
tributary of Hasdeo River. Lilaghar River
and Gangdel Nala also control the flow in
the southern portion of the block.
Proposed
Kusmunda Open
Cast Expansion
Project56
Eastern
Sector of
Jatraj, Resdi
and
Sonpuri,
South
Central Part
of Korba
Coalfields,
District-
Korba
582.883 16447 cum/day Mine Water
+ Hasdeo
Right Bank
Canal
+Ahiran
River+ Tube
Well
Dipka OCP 57 Dipka and
Hardi
Blocks,
South
Central Part
of Korba
Coalfields,
409.180 4360 cum/day Drained mainly by the Lilaghar River
which makes the South Western Boundary
of the Block
53 http://www.enviscecb.org/113/Balgi%20PH_Eng_.pdf54 http://environmentclearance.nic.in/writereaddata/EIA/1111291220121211129-2007.pdf55 http://www.environmentclearance.nic.in/writereaddata/EIA/18112014T1V5B4NKEIAgevra.pdf56 http://www.ercindia.org/files/eiadocuments/eiareports/2015/11022015_CG_KUSMUNDA%20(ENGLISH).pdf57
http://www.environmentclearance.nic.in/writereaddata/EIA/31102014PJRZBJV2eiaempdipkaocClause7[ii].pdf

47
District
Korba
7.1 IMPACT OF COAL MINES ON THE LIFE OF PEOPLE IN THE BASIN
7.1.1 Excerpts of an FGD conducted with the people affected by the coal mines in Village Basan
1. The Pathaita Nalla used to pass through their village and contained water throughout the year but due
to the mining activity, the nalla has disappeared. This Nalla earlier joined the Hasdeo but at present has
no water contribution to the Hasdeo River. Drinking water is now obtained from the tube well. The
drying up of the Nalla has wrecked havoc on the animals who are now left with no source of water.
2. The people who work in the mines complain of severe cough, body pain as a result of ingestion of the
coal dust. So much so that even their spit is black in colour.
3. Due to the complete diversion of their village and forest land they have lost access to the common
forest resources like mahua. Earlier they used to collect 2-3 quintal but now there is none. As a result of
which their source of income has been destroyed. 36 Hectares of forest land was diverted for the mines.
Birds like vultures and peacock have also disappeared. The drinking water source which was just 5
minutes away is now 15 mins to 0.5 hrs away.
4. They clearly accepted the precedence of the Dhori Water quality when compared to the tube well
water.
7.1.2 Excerpts of an FGD conducted with the people affected by the coal mines in Village Ghar Barra
1. Ghatbarra, Fatehpur, Parogiya, Saidur and Sushkan made up one Gram Panchayat.
2. In the last one year due to the setting up of the Parsa Kete Basan Coal Mines58, 5000 to 6000 trees
have already been cut and another 20-25 acres of forest has been bleached. Shoddy Gram Sabha’s
were conducted without the mandatory 33% women representation.
3. The main sources of drinking water in the village are wells and tube wells. Every 5 to 6 houses
have either one of them.
4. Mostly agriculture is done twice in a year, once in the rainy season and the other in the summer
season. During the rainy season rice, maize and pulses like arhar and urad are grown. There is no
irrigation facility in the village. So any supplemental water requirement is fulfilled by the wells.
Rice was so abundantly grown in the region that it was given in return for a day’s labour. But now
there has been a drastic reduction in the cultivation of rice mainly due to the government’s scheme
58 Information obtained from Alok Putul (BBC Hindi Reporter)- Kete Besan Coal Fields which are a part of the Hasdeo Arand Forest. The Chhattisgarh government allotted the coal block to Rajasthan Government. Rajasthan Government in turn handed it over to the Adani’s. It is now a joint venture between the Adani and the Rajasthan government in which the former owns a stake worth 74% while the latter owns the remaining that is 26%. Since it was a part of one of the most pristine forests in the country, the National Green Tribunal gave orders to stop mining in the area. Adani’s then went to the Supreme Court. But even the SC judged against the Adani’s. The villages present in the location have not been rehabilitated yet. PESA has been violated as permission from the Gram Sabha’s have not been taken. 800 cases of bear human conflicts have been reported by the reporter but the EIA does not mention this fact.

48
of rice provision at Rs 1 for 35 kl to the tribal populace of the region and due to the non-
availability of a clean source of water. Curently “Jethva Dhan or Jethi Dhan is being grown. The
Jethi Rice was not grown in the rainy season as it gets damaged and contaminated with excess
water pressure. Along with all this another version of rice called “Hariar Patti” is also being
grown.
5. The people involved in the cultivation of rice usually make small huts near their fields and stay
there temporarily till the crop has been harvested. The produce is just enough for the family’s
personal consumption and is not sold in the market for commercial gains. So the farmer’s u/s of
the Hasdeo Bango dam is clearly involved in subsistence agriculture.
6. The respondent has observed some changes in the area: Dense jungles have now become quite
scattered, Earlier the rainfall was distributed well both temporally and spatially but now it rains
every month and the amount needed during the rainy season is not sufficient. Use of chemicals like
urea, potash and DAP has increased the land under irrigation but the quality of produce has
decreased.
7. Due to the setting up of the Parsa Kete Basan Coal Mines, there is an inherent smell of coal in
everywhere. Moreover early in the morning the air is filled with coal giving it a foggy appearance.
8. Just a month ago, 12-15 male cows (bael) died after consuming the water from the nalla. After
they died, the village people threw their bodies in the forest. But the body was so highly
contaminated that even the wild dogs of the forest did not eat it.
9. 3 to 4 years back one could find fishes in the nalla but after the opening up of the mine the natural
ground water level went down plus the water released in the diversion channel was reduced which
has now led to the very low discharge in the nalla.
10. Due to the mines present in the region, and trucks carrying coal plying on the adjacent roads day
and night, there has been a heavy accumulation of coal dust on the roof tops of the nearby houses.
During the rainy season the water washes the coal dust and black coloured water falls down the
houses and gets collected around them. Even the leaves of the forest have turned black. 80% of the
people in the village have stopped doing agriculture and are now solely dependent on the
remaining forests. Agriculture in the village at least ensured an income of 25000 in a year. “Aavla”
used to grow abundantly in the forests but has now totally disappeared. Its bark was earlier
extracted for medicinal purposes.
11. “Barr Nalla” is one of the nalla that flows through the village and later on goes and joins the River
Hasdeo. On one side of the nalla are the forests that have already been marked by the forest
department for cutting and on the other side are the Parsa Kete Basan Mines. The flow of the water
in the nalla has been blocked on all sided by a barricade of sand and a narrow diversion has been
made for the passage of the nalla water. The water from the coal mines is discharged via pumps
into the blocked nalla and further d/s it is slowly discharged into the diversion channel. So in half a
kilometre stretch the colour of the water has changed from greenish blue to black and the flowing
water has been rendered stagnant. This has had its consequences further downstream.

49
CHAPTER 8: INDUSTRIES IN THE HASDEO BASIN
Chhattisgarh has emerged as the power hub of the nation at the cost its natural resource exploitation. Nearly
every raw material is available in Chhattisgarh for it to garner huge investments in the industrial sectors. The
state government has made a very conducive environment for these industrial units to operate sometimes even
bypassing the other ministries. Below is compilation of the different industrial establishments in the Hasdeo
Basin.
Table 8.1 Sponge/Pig Iron Plants
S. No. Name of Unit Location
1. M/s Airan Ispat & Power Ltd. Silpahari Industrial Area, Bilaspur
2. M/s Geetanjali Ispat & Power Pvt. Ltd. Village Hardikona, Bilaspur
3. M/s Indo Sponge Iron & Steel Pvt. Ltd. Village- Jhagraha , Korba
4. M/s Kalindi Ispat Pvt. Ltd. Village- Belpan, Bilaspur
5. M/s Mangal Sponge & Steel Pvt. Ltd. Bilha, Bilaspur
6. M/s Nova Iron & Steel Ltd. Village- Dagori, Bilaspur
7. M/s Phil Ispat Pvt. Ltd. Village- Dhaorabhataha, Bilaspur
8. M/s Prakash Industries Ltd. Village- Hathnewra, Janjgir Champa
9. M/s Radha Madhav Sponge Pvt. Ltd. Village- Silpahari, Bilaspur
10. M/s Satya Power & Ispat Pvt. Ltd. Village- Gatori, Bilaspur
11. M/s Shakun Sponge Pvt. Ltd. Village- Silpahari, Bilaspur
12. M/s Shree Radhey industries Ltd. Village- Silpahari, Bilaspur
Table 8.2 Cement Plant
S. No. Name of Company and Location Year of Establishment Annual Production
Capacity (Lakh Tonne)
1. Lafarge India Limited, Gopalnagar, Janjgir 1982 22.40
Thermal Power Plants
Chhattisgarh is presently one of the few states that have surplus power. It is also among the few profitable states
in terms of utility based electricity. The GDP of the state is expected to reach US $46.8 billion in FY 17 from
US $ 29.2 billion in FY1459
59 file:///D:/WCF%20E-Flows/dam%20weblinks/About%20Chhattisgarh,%20Industries,%20Geography,%20Development,%20Information.html
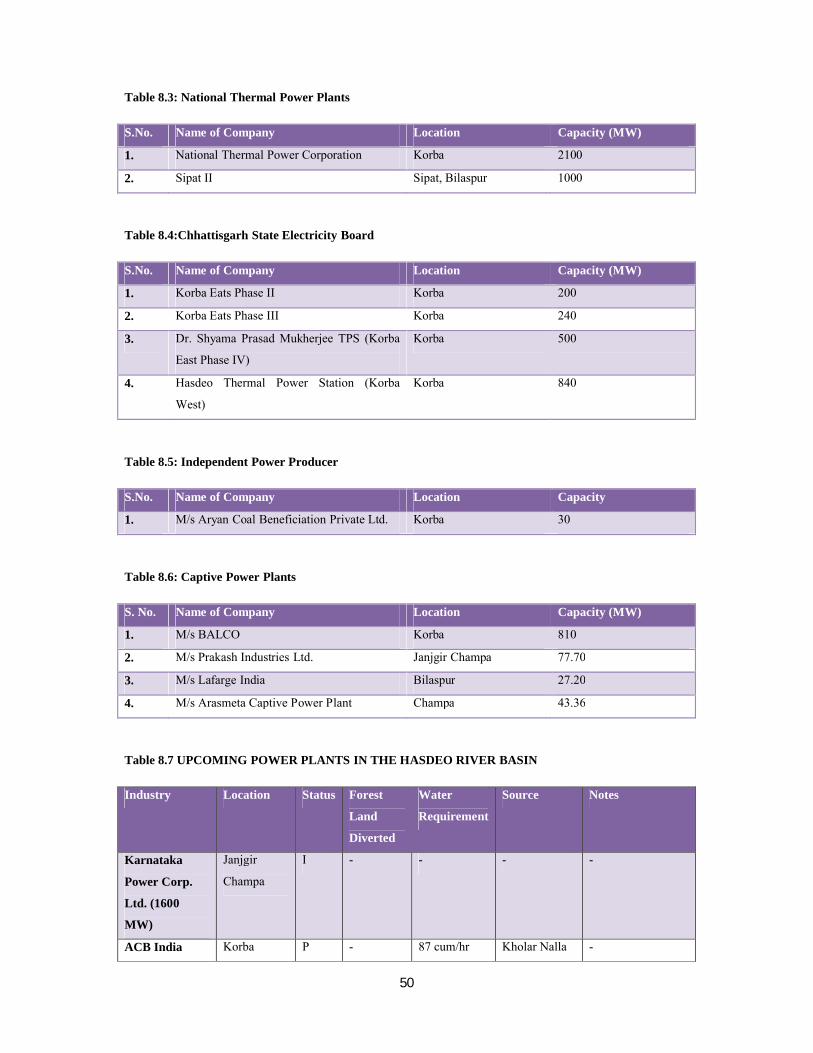
50
Table 8.3: National Thermal Power Plants
S.No. Name of Company Location Capacity (MW)
1. National Thermal Power Corporation Korba 2100
2. Sipat II Sipat, Bilaspur 1000
Table 8.4:Chhattisgarh State Electricity Board
S.No. Name of Company Location Capacity (MW)
1. Korba Eats Phase II Korba 200
2. Korba Eats Phase III Korba 240
3. Dr. Shyama Prasad Mukherjee TPS (Korba
East Phase IV)
Korba 500
4. Hasdeo Thermal Power Station (Korba
West)
Korba 840
Table 8.5: Independent Power Producer
S.No. Name of Company Location Capacity
1. M/s Aryan Coal Beneficiation Private Ltd. Korba 30
Table 8.6: Captive Power Plants
S. No. Name of Company Location Capacity (MW)
1. M/s BALCO Korba 810
2. M/s Prakash Industries Ltd. Janjgir Champa 77.70
3. M/s Lafarge India Bilaspur 27.20
4. M/s Arasmeta Captive Power Plant Champa 43.36
Table 8.7 UPCOMING POWER PLANTS IN THE HASDEO RIVER BASIN
Industry Location Status Forest
Land
Diverted
Water
Requirement
Source Notes
Karnataka
Power Corp.
Ltd. (1600
MW)
Janjgir
Champa
I - - - -
ACB India Korba P - 87 cum/hr Kholar Nalla -
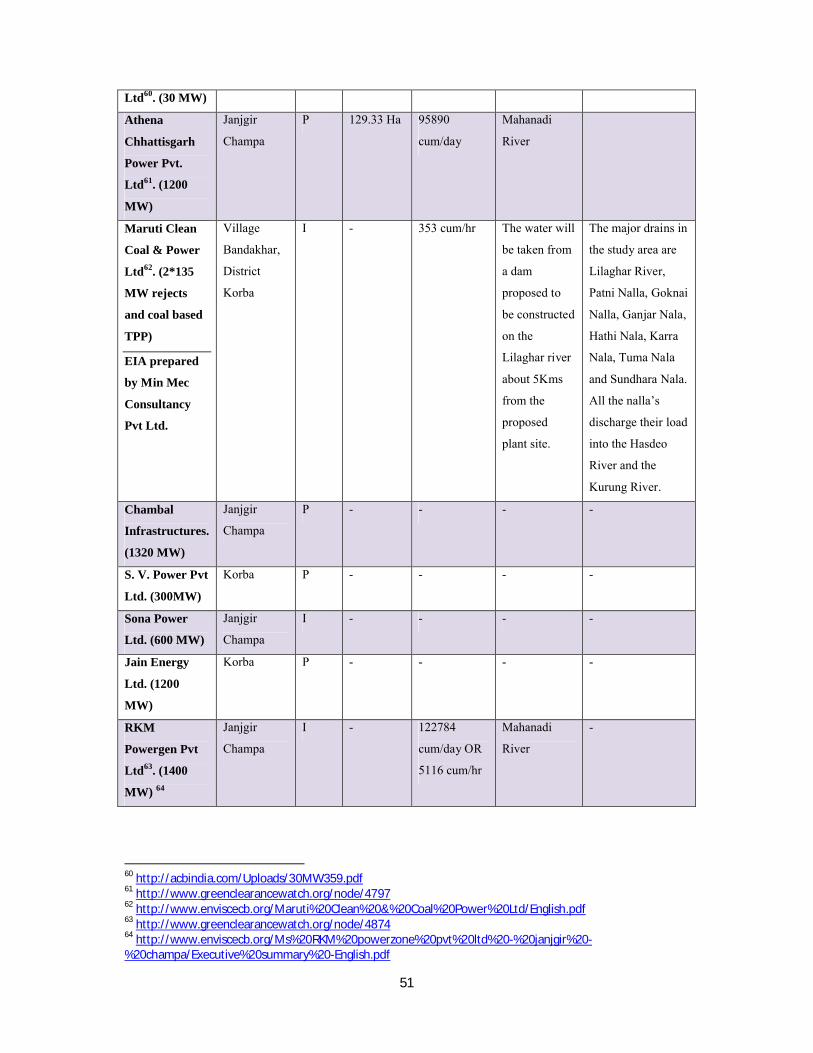
51
Ltd60. (30 MW)
Athena
Chhattisgarh
Power Pvt.
Ltd61. (1200
MW)
Janjgir
Champa
P 129.33 Ha 95890
cum/day
Mahanadi
River
Maruti Clean
Coal & Power
Ltd62. (2*135
MW rejects
and coal based
TPP)
EIA prepared
by Min Mec
Consultancy
Pvt Ltd.
Village
Bandakhar,
District
Korba
I - 353 cum/hr The water will
be taken from
a dam
proposed to
be constructed
on the
Lilaghar river
about 5Kms
from the
proposed
plant site.
The major drains in
the study area are
Lilaghar River,
Patni Nalla, Goknai
Nalla, Ganjar Nala,
Hathi Nala, Karra
Nala, Tuma Nala
and Sundhara Nala.
All the nalla’s
discharge their load
into the Hasdeo
River and the
Kurung River.
Chambal
Infrastructures.
(1320 MW)
Janjgir
Champa
P - - - -
S. V. Power Pvt
Ltd. (300MW)
Korba P - - - -
Sona Power
Ltd. (600 MW)
Janjgir
Champa
I - - - -
Jain Energy
Ltd. (1200
MW)
Korba P - - - -
RKM
Powergen Pvt
Ltd63. (1400
MW) 64
Janjgir
Champa
I - 122784
cum/day OR
5116 cum/hr
Mahanadi
River
-
60 http://acbindia.com/Uploads/30MW359.pdf61 http://www.greenclearancewatch.org/node/479762 http://www.enviscecb.org/Maruti%20Clean%20&%20Coal%20Power%20Ltd/English.pdf63 http://www.greenclearancewatch.org/node/487464 http://www.enviscecb.org/Ms%20RKM%20powerzone%20pvt%20ltd%20-%20janjgir%20-%20champa/Executive%20summary%20-English.pdf

52
Vandana
Vidyut (540
MW)65
EIA Prepared
by Anacon
Laboratories
Pvt. Ltd.
Salora,
Chhuti,
Gangpur,
Darrabhata
and Jhora,
District
Korba
I 9763 2100 cum/hr Hasdeo River -
KSK Energy
Ventures Ltd.
(3600 MW)
Janjgir
Champa
I - - - -
Adhunik Power
& Natural
Resources
Ltd66. (1320
MW)
EIA prepared
by Sun
Consultancy
and Services
Villages
Sakreli,
Dumarpara,
Deragarh,
District
Janjgir
Champa
P 68.27 3650 cum/hr River
Mahanadi
-
State Power
Generation
Company Ltd.
(500 MW)
Korba P - - - -
Dheeru
Powergen Pvt.
Ltd67. (1050
MW)
Korba P 130.84 80832
cum/day
Sarveshwar
and
Sarvamangala
anicuts and
Darri Barrage
on the Hasdeo
River
-
Power Finance
Corporation
Ltd. (4000
MW)
Surguja P - - - -
Lanco Pathadi, P - 254502 River Hasdeo The figure in the
65 http://www.enviscecb.org/MS%20vandana%20Vidyut%20Ltd/Executive%20Summary%20(English).pdf66 http://www.enviscecb.org/115/Executive%20Summary-English.pdf67 http://www.greenclearancewatch.org/node/4798

53
Amarkantak
Pvt. Ltd68.
(Proposed
Expansion 1320
MW)
Pahanda,
Khoddel,
Saragbundia,
Dandhani,
Sandil,
Katbitla and
Baridih
Villages,
District
Korba
cum/day water requirement
column denotes the
total for generating
3240 MW power.
Jaiswal Neco
Urja Ltd. (100
MW)69.
(Proposed
Integrated Steel
Plant)
Village
Dagori,
Ameri
Akhberi and
Udgaon.
District
Bilaspur
I - 19800 kl/day Sheonath
River
-
India Bulls Pvt.
Ltd. (1320
MW)
Korba P - - - -
Amarkantak
Pvt. Ltd70. (600
MW). EIA
Report
Prepared by B
S. Envi Tech
Pvt. Ltd.
Pathadi,
Pahanda,
Khoddal and
Saragbundia
Villages.
District
Korba
I 65400
cum/day
Hasdeo River -
Table 8.8 Aluminium Plant
Bauxite exploitation in the state is reserved for Public Sector undertakings. This bauxite is used for aluminium
extraction and calcinations plants. Aluminium extraction plant of BALCO is operational at Korba. The ore is
concentrated in Surguja and Korba district in the Hasdeo Basin.
68 http://www.enviscecb.org/156/Executive%20Summary_English.pdf69 http://www.enviscecb.org/168/Executive%20Summary_English.pdf70
http://ifcextapps.ifc.org/ifcext/spiwebsite1.nsf/0/032BB72660FE8C2C852576BA000E2B0D/$File/Lanco%20Amarkantak%20CEIA%20-%20November%202005.pdf

54
S. No Name of the Company Location Product and
Production
Capacity
Water
Requirement and
Source
1 Bharat Aluminium Co. Ltd. Korba Aluminium Wire
(55750 Tonnes)
Rolled Products
(43600 Tonnes)
Ingots and Others
(18000 Tonnes)
Table 8.9 Bauxite Blocks in the Hasdeo Sub Basin
District Name of the Block Area(Sq. Kms) Reserve (million
Tonnes)
Nearest source of
water
Surguja Chutai, Tehsil
Samri
1 0.15
Chutai and Gopatu,
Tehsil Samri
2.60 and 0.65 0.38 proved and
1.85 possible
Chutai, Tatijharia,
Samri Block
10.18 4.91 estimated
Samripat block
(Jamirapat area)
Tehsil- Samri
3.50 3.37
Sarangdag, Tehsil
Samri
4.20 9.17
Samri Block(Kutku
Sector)
Kudag Block
(Dumarkholi
Sector)
Tehsil Samri
3 1.33
2.15
Tatijharia, Tehsil
Samri
4.50 9.30
Jamirapat, Tehsil
Samri
1.88 4.37
Nagardand, Tehsil
Sitapur
5.46 10.161
Sapnadand, Tehsil
Sitapur
2.88 11.468

55
Kudaridih, Tehsil-
Sitapur
11.63 11.924
Kesara, Tehsil
Sitapur
6.18 8.873
Barima. Tehsil
Sitapur
3.00 2.39
Kandraja, Tehsil
Sitapur
11.50 10.10
Barima, Tehsil-
Sitapur
8 3.1775
East Barima, Tehsil
Sitapur
1.27 0.1934
North Narvadpur 5.01 0.2553
South Narvadpur 3.55 0.9285
South Narvadpur 5.20 0.0255
South
Barimauranga,
Tehsil Sitapur
4 2.97
Parpatia, Tehsil
Sitapur
0.70 0.994 probable
Uranga, Tehsil
Sitapur
0.36 0.1866
Kesara & Lurena,
Tehsil Sitapur
1.05 0.271
North
Kameleshwarpur,
Tehsil Sitapur
1.18 0.240
Bijlahawa, Tehsil
Sitapur
0.805 0.25
Pathrai, Tehsil
Sitapur
3.82 1.876
Pathrai North East,
Tehsil sitapur
4.05 2.631
Sarbhanja, Tehsil
Sitapur
1.92 0.20
Korba Paunakhara Pahar,
Ranaikhet Pahar,
Gaurduari Pahar
- 0.20

56
As per Sudiep Srivastava, a Bilaspur based lawyer and activist, the Chhattisgarh Government has signed 102
MoU’s with industrial houses. On the one hand where the government claims to have brought Rs 165000 crore
investment to the state, they are also being questioned on the sanctity of the deals. These deals are doubted to be
privately negotiated without any competitive bidding. Contentions also revolve around the fact that the
Chhattisgarh government’s MoU’s assure assistance full support in the form of land, minerals, water and
infrastructure, the cost of which is paid by the voiceless environment and the people dependent on them for their
livelihoods.
The table below shows clearly the over allocation of the river’s water. This information was obtained by Manish
Rathod who is a Korba based Environmental activist.
Table 8.10: Water allocation – Information obtained under RTI filed by Manish Rathod (Korba based
environmental activist)
S.No Name Water Allocation (MCM)
Current Water allocation
1. CSEB (east) 37.50
2. CSEB (west) 26.00
3. NTPC (2100 MW) 110.00
4. IBP Korba 0.156
5. SECL Korba 0.963
6. SECL Kusmunda 1.490
7. BALCO Korba 10.200
Total 186.309
Water allocation to other industries
1. NTPC Seepat 120.00
2. CSEB Korba (East and West) new thermal power project 50.00
Total 170.00
Others industries

57
1. BCCP Balco Korba 18.00
2. BALCO Korba Expansion Project 27.00
Total 45.00
Grand Total (186.309+170.00+45.00) =401.309 MCM > 400 MCM
Incidences of Water Theft in the Region- As per the government rules, industries can source water only from
the downstream areas of barrage or dams. At the time of securing permission for its plant, Vandana Vidhyut had
pledged that it would set up two anicuts (small dams) downstream of Minimata Hasdeo Bango barrage and lay a
15 km-long-pipeline for carrying water to the plant. The works would have cost the company Rs 25 crore. Now
the decision to allow the company to source water from Savamanglamandir upstream of Hasdeo barrage means
it does not need to build anicuts. All it has to do is to lay two kilometres of pipeline (DTE, June 1, 2012).

58
CHAPTER 9: WATER QUALITY STATUS IN THE HASDEO SUB
BASIN
The quality of the River Hasdeo is severely affected in its downward journey at 4 places namely
Manendreagarh, Chirmiri, Korba and Champa71. All these 4 locations are industrial centres. At
Manendragarh and Chirmiri are located the coal mines which compose of the first form of pollution
that the river is subjected to. The Koria Nalla carries the waste water from the coal mining areas as
well as urban wastewater into the Hasdeo River. In Korba lies the Thermal Power Plants that release
their effluents via the Belgiri, Dhengur Nalla and the Ahiran River. Lastly in Champa, lies the paper
mills that release the effluents via the Hasia Nalla into the river Hasdeo. High Pesticide load was
observed in the very origin of the River at Amritdhara mainly because of the agricultural practices.
The run-off in the catchment area has been accorded as the main reason for the high pesticide load in
the river. As per the report River Hasdeo has a high carrying/purification capacity. After its quality
getting highly deteriorated at Korba, the river regenerates itself by the time it reaches Champa. But
then again due to the paper mills it gets polluted and again undergoes self purification after travelling
for 30-40 Kms.
In an attempt to document the water quality status of the River Hasdeo, a physico chemical analysis of
the river water was taken up by M.M. Vaishnav and Dineshwari Sahu72. Water samples were collected
from 6 different stations namely Kohadia, Darri NTPC (National Thermal Power Corporation), CSEB
(Chhattisgarh State Electricity Board) power plants, Ayodhyapuri, Purani Basti and Sitamani. All
these points were located either near the discharge point of industrial effluents or near the domestic
sewage discharge joint. The results showed that the pH of the water samples rendered it alkaline.
Moreover the quantity of the total dissolved solids was also found in excess. Atleast 4 out of the 6
samples showed a TDS value of more than 2000 ppm. This led to a lower quantity of dissolved
oxygen which had direct consequences on the aquatic life. The chloride, nitrate and fluoride content
were also found to be in excess of the permissible limit.
M.M. Vaishnav alongwith Milan Hait73 conducted a study to understand the effect of paper mill
effluents on Ground and surface water bodies in some selected areas of Janjgir Champa in
Chhattisgarh. This particular district is homes many manufacturing and production units like Madhya
Bharat Paper Limited, Prakash industries Ltd. And a few others that are still under construction. Due
to the fast paced industrialization huge quantities of untreated or partially treated waste in entering the
71 CPCB Highlights 2003.72 M.M. Vaishnav & Dineshwari Sahu, Study of Some Physico-Chemical Characteristics of Hasdeo River Water at Korba (India), Journal of Environmental Research and Development, Vol. 1, No. 2, October- December 2006, Pg 140-142.73 M.M. Vaishnav & H. Milan, Effect Of Paper Mills effluents On Ground and Surface Water Bodies of Some Selected areas of Janjgir Champa, C.G., India, India Journal of Science Research, Vol. 4(2), 119-126, 2013.

59
water bodies and in turn deteriorating its quality. Out of the 8 samples collected, 4 are directly from
the river. The minimum conductivity was found to be 852 μ mhos/cm while the range for required for
the healthy survival of aquatic organisms is between 150- 500 μ mhos/cm. The maximum TSS value
exceeded the permissible value. High suspended dissolved particles adversely affect those who are
suffering from kidney and constipation problems. The WQI (Water quality Index) calculated indicated
high loading of various kinds of pollutants. The values ranged from 93.2 to 98.53. This high pollutant
loading has been attributed to leaching and percolation of surface water via domestic garbage and
paper mill industrial effluent.
In yet another similar study taken up by the authors mentioned in the earlier paragraph, but this time
specifically targeting the discharged effluent of the Madhya Bharat Paper Mill in Champa74. The
paper and pulp industry has been considered as one of the largest polluting industries in the world.
Their consumption of fresh water is also very high. The effluents released are dark brown in colour
and are toxic in nature. The experiments concluded that the water was polluted as the values of EC,
turbidity, TSS, DO, COD, phosphate, sodium, potassium, iron, copper, manganese and phenol were
above the permissible limit for drinking water. Moreover the Water Quality Index (WQI) was also
higher than 100 at all the sampling points which directly indicate the high pollution load in the river.
In the light of the blatant coal extraction taking place in the upper regions of the Hasdeo Basin, a
study75 was conducted to study the river water quality, but this time in the Koriya District. This time
water samples were collected from 9 points in the Hasdeo River flowing in the Koriya District. These
sampling points were Jhagrakhand, Kujra, Ramnagar, Rajnagar, Bijuri, Katkona, Pandavpara, Jhilmili
and West Chirmiri. Unlike the previous study results, this study concluded that all the parameters
ranging from pH, alkalinity, hardness, turbidity, chloride, iron, Dissolved Oxygen, TDS, sulphate,
fluoride and nitrate were found to be within the permissible limits. These results can be accorded to
the fact that before being impounded the relative contamination in water is reduced as compared to
the one that is released from the industries. And moreover Koriya is an important portion of the
catchment having a rich tree cover so natural treatment takes place simultaneously. To understand
these results in its entirety, one needs to know the exact location of water sampling and how far is it
really from the coal mine area.
While Koriya is having relatively clean river water, Janjgir Champa which marks the last district of
the Hasdeo River Basin has community ponds which are highly polluted and unsafe for human
74 M.M. Vaishnav, M. Hait & P.K.Rahangdale, Paper Mills Pollution Hazards on Ground and Surface Water Bodies of Adjoining Areas of Hasdeo River in Champa, C.G. (India), International Journal of Science and Research, Vol. 3, Issue 11, 2014, 1146-1151.75 P.R. Dwivedi, Dr. M.R. augur & Dr. A. Agarwal, Assessment of Water Quality of Hasdeo River, Koriya District, Chhattisgarh: with Special reference to Pollution due to Coal Mines, International Journal of Engineering Sciences & Research Technology, 2014, Vol. 3(6) Pg 854-857.

60
consumption76. Temple ponds were comparatively less polluted than small and large community
ponds. But the river water on the other hand did not show appreciable signs of pollution which means
that all the tested parameters were within their permissible limit. The reference taken was IS 10500-
1989. But a deeper look into the methodology reveals the fact that out of the 12 samples taken, only
one was from the Hasdeo River while the rest were from the ponds. Concluding the purity of a 333
Km long river with just I sample is not methodologically correct as it does not represent the river in its
entirety.
Along the entire stretch of the Hasdeo River Basin, Industries have been lined. These industries
release toxic and hazardous waste and thus directly cause harm to the life of living organisms77. It was
observed in a study that fertilizer factories were discharging liquid effluents into the open area which
gradually then mixed with the groundwater.
To study the role played by the city drainage effluents in polluting the rivers, a comparative study78
was conducted by Reeta Bajpai. A comparison was made with water samples taken from the Hasdeo
River Barrage near Seepat NTPC and Tovra Dam of Arpa Dam in Bilaspur. Bajpai clearly states the
fact that urban areas of the developing countries treat rivers as their end points of effluent discharge.
The effluents released from Seepat NTPC plant and drainage system of Bilaspur city has greatly
distressed the geochemistry of the soil. As per the study the water of the river Hasdeo is cleaner as
compared to that of River Arpa due to the barrage which keeps the water free from rural and urban
drainage system. On the contrary the River Arpa is highly polluted and unsafe for domestic use.
Sediment quality is runs hand in hand with the water quality. River Ahiran which is the main source
of water for the Katghora Block in Korba District has been greatly influenced by the effluents
released by an array of industries that lie alongside. The waste products that are directly released into
the river contain trace and toxic elements which either move downstream in the dissolved state or
settle down on the river bed and the flood plains and being devoid of nutrients renders harm to aquatic
organisms. The phosphate content79 in the River Ahiran was recorded between 0.3mg/L to 2.7
mg/Lwhile its concentration should not actually exceed 0.1 mg/L. Phosphate increases the growth rate
of blue green algae ans thereby reducing the dissolved oxygen level of the water. During the study the
concentration of lead and cadmium was also found to be high in the sediments. The reason accorded
76 U. Manish & B. Subhash, Study of Physico Chemical Properties of Surface Water (Hasdeo River & Ponds) in Champa and Janjgir Region, International Journal of Current Pharmaceutical and Clinical Research, Vol. 4, Issue 2, 2014, 126-128.77 M. R. Augur & R. Verma, Impact Assessment of Ground Water Quality by Waste Water Outfall from a Fertilizer Factory, Journal of Chemistry and Chemical Sciences, Vol. 2, Issue (2&3), 2012, 92-137.78 R. Bajpai, Comparative Analysis of Physicochemical Parameters of Hasdeo River Barrage & Arpa Water Samples of Bilaspur Region, International Journal of Scientific and Research Publications, Vol. 2, Issue 9, 2012, 1-5.79 S. Dhanesh, S.J. Prasad & J. K. Ashok, Characterization of Water and Sediment quality of River Ahiran in Korba Chhattisgarh, Research Journal of Recent Sciences, Vol. 3(5), 21-25, May 2014.

61
was the deposition of industrial and auto mobile waste. The authors have suggested a thorough
monitoring of heavy metals pollution in the sediment of the River before taking up farming so as to
prevent the entry of these toxic elements from entering the food chain.
A similar study was undertaken on the Belgarinalla80, which also is a tributary of the River Hasdeo
and passes through Korba. NTPC, BALCO, Vedanta, CSEB all of them releases their waste into this
nalla. In its stretch of 20-22 Kms the river carries nothing but an enormous load of fly ash and from
the power generating units, red mud from aluminium smelting unit, fertilizers, pesticides, domestic
adn other wastes and thereby cause various kinds of skin diseases to the people who are forced to use
it in the absence of an alternative source of water. All parameters including temperature, conductivity,
turbidity, TS, TDS, TSS, BOD, COD, hardness, nitrite nitrogen, lead and cadmium were found to
exceed its permissible limits. It’s important to realize that we as humans lie at the top of the food
chain and thereby receive these toxic elements which gradually accumulate as they are not susceptible
to easy biodegradation.
CPCB had earlier declared Korba as one of the 24 critically polluted areas in 2009. The industrial
activities within 15 Kms of Korba town is considered as critically polluted and with a CEPI index of
74.581 (83 in 2009 , 5th critically polluted area in India).
Table 9.1: Industrial areas located within the Critical areas:
S.No Name of the Industry Capacity
1. M/s NTPC Ltd , Korba Super Thermal Power Station,
Jamnipali, Korba
(3*200=600MW) + (3*500)
=2100MW
2. M/s Chhattisgarh State Electricity Board (CSEB), Hasdeo
Thermal Power Station, Korba (West), Korba
4*210 =840 MW
3. M/s Chhattisgarh State Electricity Board (CSEB), Korba
Thermal Power Station, Korb a(East), Korba
(4*50=200MW) + (2*120
=240MW = 440MW
4. M/s Chhattisgarh state Electricity Board (CSEB) Dr.
Shyama Prasad Mukherjee Thermal Power Plant, Korba
(East), Korba
2*250=550MW
5. M/s Bharat Aluminium Co.Ltd, Balco Nagar, Korba (Aluminium Smelter Plant
(Alumina 330000TPA & hot
Metal (Fabrication) – 370000
TPA
80 S.Dhanesh & J.K. ashok, Study of Physico Chemical Parameters of Belgarinalla, Chhattisgarh, India, International Research Journal of Environmental Sciences, Vol 2(3), 41-45, March 2013.81 Final Technical Report of CEPI 2015 from IIT Kharagpur – Monitoring in Critically Polluted area (CPA), Korba of Chhattisgarh for Assessment of Comprehensive Environmnetal Pollution Index (CEPI).

62
6. M/s Bharat Aluminium Co. Ltd, Balco Nagar, Korba (CPP-
2)
4*135=540MW
7. M/s Bharat Aluminium Co.Ltd. Balco Nagar Korba (CPP-
1) Balco Captive Power Plant, Jamnipali, Korba
4*65.5=270MW
8. M/s Gevra Open Cast Mines, SECL, Korba 35 MTPA
9. M/s Dipka Open Cast Mines, SECL, Korba 25 MTPA
10. M/s Kusmunda Open Cast Mines, SECL, Korba 10 MTPA
11. M/s Lanco Amarkantak Power Private Limited, Village-
Pathadi, Tehsil- Korba, Korba
2*300 = 600MW TPP
Table 9.2: Expansion units under construction, which have been granted environmental
clearance before government of India notification dated 13/01/2010 (Situated within the Critical
area)
S.No. Name of the Industry Capacity
1. M/s NTPC Ltd. Korba Super Thermal Power Statiob,
Jamnipali, Korba
500MW
2. M/s Chhattisgarh State Electricity Board, Hasdeo Thermal
Power Station, Korba (West), Korba
500MW
3. M/s Bharat Aluminium Co. Ltd, Balco Nagar, Korba 4*300 = 1200 MW
4. M/s Bharat Aluminium Co. Ltd, Balco Nagar, Korba 300 MW
5. M/s Bharat Aluminium Co. Ltd, Balco Nagar, Korba Aluminium smelter 5.5 LTPA
6. M/s Lanco Amarkantak Power Private Limited, Village-
Pathadi, Tehsil- Korba, Korba
660 MW + 660 MW TPP
7. M/s Indo Sponge Power & Steel Private Limited,
Rajgamar Road, Korba
Sponge Iron 100TPD
8. M/s Himadri Chemicals industries, Jaghara, Korba Liquid Coal tar Pitch
30000TPD
9. SSI located in the industrial area Korba All the SSI unit sare complying
with the standards prescribed by
the Board and regular
monitoring is being carried out
by Regional office, Korba.
9.1 M/s Shiva industries
9.2 M/s Star Ferro Alloys
9.3 M/s R.R. Ferro Alloys
9.4 M/s Bhajanka Ferro Alloys
9.5 M/s Vinay Industries
9.6 M/s Jaiswal Oxides

63
Currently the River Hasdeo is of Class B as per the IS 2296 i.e., water is fit for bathing purpose only.
Total waste water generated from the critically polluted area is approximately 2,00,000 KLPD. Fly
ash from these industries find their way into the Dhengur Nalla, Jharia Nalla and the Belgari Nalla
which travel about 7 Kms to finally join the River Hasdeo.
Excerpts From an Interview with Manish Rathod (Right To Information Activist based in
Korba)-
1. The Dhengur Nalla and the Ahiran River carry nothing but fly ash and then mix with the
Hasdeo River
2. Water Allocation to industries has increased which results in loss of water for the farmers.
The farmers receive water via the canals.
3. The Hydroelectric power projects release water as part of their operations as a result of which
the contaminants in the water get diluted otherwise they flow as a thick white fluid.
4. Industries prefer to lift water directly from the canal as the head is maintained and it is also
cheaper to do so while lifting water from the dam is relatively expensive in terms of the
pressure required and the setting up of pipelines.
5. The catchment area of the Hasdeo Bango Dam is 100 sq. Kms. The Darri reservoir was
constructed only to ease the distribution of water. The Dhengur Nalla only carries the fly ash
that is generated. When animals venture near these nalla’s then the most often get trapped in
them and thereby drown. The animals even consume the fly ash water which then enters the
food chain and the harmful effects then get manifested in its milk. CSEB or Dr Shyama
Prasad Mukherjee Plant is located just adjacent to the Darri Reservoir. Hot water is also
released from the industries which take us water to use it as a coolant. This hot water that is
released thus alters the aquatic ecosystem in the region.
6. The canals irrigate nearly 1.5 lakh acres of land but providing water to BALCO will mean
that 10000 acres of land will remain deprived from water.
7. The entire Hasdeo River has been divided in terms of allocation by 2 projects. One is the
Hasdeo Bango Project (U/S of the Darri Reservoir) and the other is the Hasdeo Nadi Project
(D/S of the Darri Reservoir).
8. The Hasdeo Bango Project has a total carrying capacity of 3000 MCM of water in which 400
MCM has been allocated to industries and nearly 1000-1600 MCM has been reserved for
agriculture. The allocation to industries cannot exceed more than 400 MCM. CSEB west
extracts 26 MCM of water directly from the reservoir itself owing to its closeness to it.
9. The Hydel Power Projet runs for 7 to 8 hours every day as a result of which water is released
in the river which washes away the fly ash that is collected. But after the month of October
and November the Hydel Power Projects are not run so water is not released hence higher

64
concentration of fly ash in the river thereby greater risks to human and animal life all along
the river and the various nalla’s that carry the fly ash.
10. 2 new industries have come up but have not as yet begun operations. They are Dheeru Power
Gen and Vandana Vidyut. Both these industries have been allocated water from the Hasdeo
Nadi Project which means that they are supposed to set up the relevant infrastructure to
extract water from D/s of the Darri reservoir. Vandana Vidyut prior to beginning of
operations were supposed to construct an anicuts 10 Kms D/s of the Darri Reservoir and set
up a pipeline 30 Kms long to pump the water up to its premises. This alone would have cost
Rs. 150 – 200 crore alone. This venture was not only expensive but also did not assure the
stipulated quantity of water. So to tide over this problem it began construction of a 5 km
pipeline extracting water from U/s of the Darri Reservoir. The case is in the court as of now
and all operations are at a standstill. If Vandana Vidyut is allowed to extract water from its
new 5 Kms. pipeline then it will be a problem for NTPC Seepat which is located D/s. VV was
asked to extract water from the D/s because of two reasons. One that the U/s portion had
already reached its extraction limit and secondly it was supposed to take water from the D/s
that further received it from the many small nalla’s that joined the Hasdeo River D/s.
11. The new plant of BALCO which is located U/s of the reservoir with a total water
requirement of 28 MCM has been allotted 8 MCM from the Hasdeo Bango Project, 4
MCM from the Tan River and 16 MCM from the Hasdeo Nadi Project. But this 16
MCM is also being extracted from the Hasdeo Bango Project. So already the 400 MCM
allocation has been exceeded by 16 MCM. Moreover once Vandana Vidyut begins
extracting 26 MCM from U/s will lead to a shortage of 42 MCM D/s. This will have its
implications D/s where 10000- 15000 acres will receive less water across 3-4 villages.
12. The irrigated area starts 20Kms after the canal.
13. In Korba the area covered by the industries is much more than that covered by the city.
14. NTPC brings coal via a conveyor belt from a distance of 14-15 Kms.
15. People who are involved in River bed cultivation suffer from gastric, cancer, asthama and TB.
16. There are hills and reservoirs constructed for containing the fly ash that is generated. It covers
an area of 8000-10000 acres in the city. Soil is put over the fly ash and then trees are planted.
Settlement time has to be given for the fly ash to get separated from water but there is not
sufficient land to allow it to settle and hence is directly discharged in the river. When this fly
ssssash mixes with the sand then it deteriorates the quality of the sand and soil also.
17. Flood plain agriculture is usually done with polluted water. They use it to grow cucumber,
watermelon and other allied vegetables.
18. Swastik Industries (appears blue on Google Maps) has not begun operations but is located just
20 m away from the Hasdeo River.

65
19. Only 5% of the fly ash is actually recycled by using it up in bricks and cement. When 1 Lakh
tonnes of coal is burnt then 50000 tonnes of fly ash is generated.

66
RESEARCH METHODOLOGY
EMPIRICAL FIELD OF RESEARCH:
In order to study the impact of human interventions on the Hasdeo river and its associated catchment
and command, the entire study are was divide into 4 zones. The zonation was done to encapsulate the
different dependencies on the river ecosystem and track the manner in which this relationship has
transitioned in the light of the developmental activities undertaken in the state after its formation.
Zone A: Mountainous-forested catchment in the forests of Surguja
Zone B: Urban and Industrial areas (Coal Mines + Thermal Power Plants)
Zone C: Just Upstream of the Minimata Bango Dam
Zone D: Downstream of the Minimata Bango Dam near the confluence of the Hasdeo and
Ahiran River
DATA COLLECTION:
Type of Data- For this field work, a mix of primary and secondary data was used.
Source of Secondary Data: Research Papers, Newspaper articles, EIA documents, Web Portals.
METHODS OF DATA COLLECTION
In Depth Interviews- As part of information collection, in depth interviews were conducted. These
interviews lasted for 30-40 minutes. Since the interview guide was semi structured, the respondents
were encouraged to speak from their personal experience and expertise in their fields.
Focussed Group Discussions- FGD’s were conducted with the prospective groups to gain deeper
understanding of the impacts that dams and coal mines had on their lives and sources of livelihoods.
From time to time the discussion did digress from the E Flows issue to very basic human struggles of
survival in the region. The minimum number of participants available per FGD was 4.
EXPERIENCE IN THE FIELD:
This was indeed a unique opportunity to conduct research independently and because of the
background reading done prior to the field work, it helped in gaining a nuanced understanding of the
issues that concern the environment and the people. In the peak of summer, this region close to the
tropic of cancer had almost all the natural barriers for the completion of the field work. The first base
was Ambikapur form where we covered the first 3 zones. The travelling was done mainly with the
help of public busses. But inside the jungle and near the backwaters of the Hasdeo Bango Dam , our
67
local guide and activist made arrangements to move. Nearly all the FGD’s were arranged with the
help of Jaynandan Ji. Amidst all its exoticness, there was a gloomy silence which indicated that things
were not aligned. And indeed it was so. The construction of the dam, and the rampant exploitation of
coal buried underneath the forests had wrecked havoc on the lives and livelihood of the people. These
three zones clearly indicated the manner in which the catchment of the Hasdeo Sub Basin was being
destroyed. The consequences of which were clearly visible in the form of pollution and disappearance
of local nallas.
To cover the 4th Zone, we moved to Korba. Korba acclaimed as the power hub clearly showed the
ways in which it was ravaging the Hasdeo River and its tributary Ahiran. The fly ash generated in the
TPP’s was being released into the river and had thereby accumulated in on the river beds and the flod
plains.
The local people are fully aware of the adverse situation in which their rivers are and be it rural or
urban, the people condemn the costs that development is causing. But at the same time, their decisions
are also being juggled by the local leaders and administrators who themselves are caught up in the
trap of the industrialists. The chain of interdependency was clearly visible and so were the little efforts
on the part of the locals to save their rivers.
This field work could not cover the further d/s regions of Janjgir Champa which may impart a degree
of skewness to the analysis. Due to time and resource constraints and the natural constraints of the
human mind, a lot has also been missed out. But further research in the domain will answer the
currently unanswered questions.
A lot of work still needs to be done in the direction of identifying all the tiny sources that add into the
Hasdeo River for which a very comprehensive field survey of the basin need to be conducted.
Moreover the difficulties in tracking the changes in the ecosystem are due to the lack of a base
inventory of all the resources. The little work that has been done in this direction is all by independent
researchers. A thorough follow up regime needs to be put in place to be constantly updated. Moreover
close monitoring of water allocations and pollution levels is a key requirement to assess the E Flows
requirement of the river. All this cannot be done without the local people who live and breathe the
disguised development. Thus an amalgamation of the social and scientific is the most urgent
requirement.
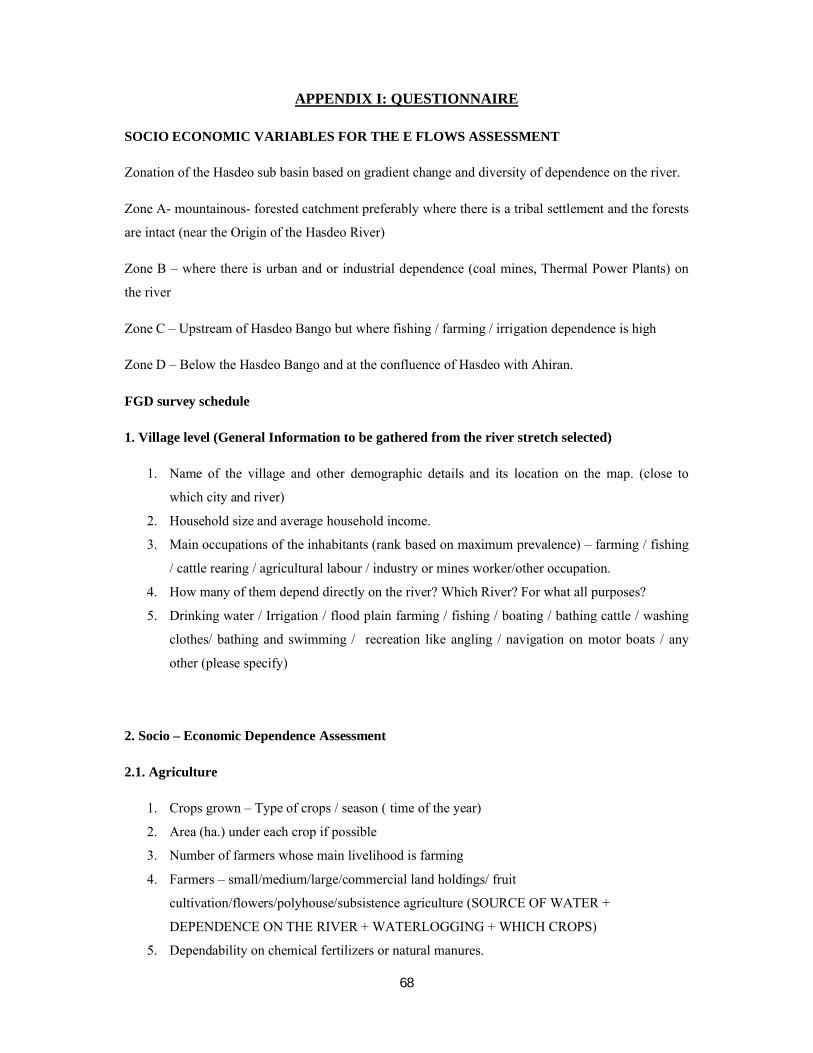
68
APPENDIX I: QUESTIONNAIRE
SOCIO ECONOMIC VARIABLES FOR THE E FLOWS ASSESSMENT
Zonation of the Hasdeo sub basin based on gradient change and diversity of dependence on the river.
Zone A- mountainous- forested catchment preferably where there is a tribal settlement and the forests
are intact (near the Origin of the Hasdeo River)
Zone B – where there is urban and or industrial dependence (coal mines, Thermal Power Plants) on
the river
Zone C – Upstream of Hasdeo Bango but where fishing / farming / irrigation dependence is high
Zone D – Below the Hasdeo Bango and at the confluence of Hasdeo with Ahiran.
FGD survey schedule
1. Village level (General Information to be gathered from the river stretch selected)
1. Name of the village and other demographic details and its location on the map. (close to
which city and river)
2. Household size and average household income.
3. Main occupations of the inhabitants (rank based on maximum prevalence) – farming / fishing
/ cattle rearing / agricultural labour / industry or mines worker/other occupation.
4. How many of them depend directly on the river? Which River? For what all purposes?
5. Drinking water / Irrigation / flood plain farming / fishing / boating / bathing cattle / washing
clothes/ bathing and swimming / recreation like angling / navigation on motor boats / any
other (please specify)
2. Socio – Economic Dependence Assessment
2.1. Agriculture
1. Crops grown – Type of crops / season ( time of the year)
2. Area (ha.) under each crop if possible
3. Number of farmers whose main livelihood is farming
4. Farmers – small/medium/large/commercial land holdings/ fruit
cultivation/flowers/polyhouse/subsistence agriculture (SOURCE OF WATER +
DEPENDENCE ON THE RIVER + WATERLOGGING + WHICH CROPS)
5. Dependability on chemical fertilizers or natural manures.

69
6. Dependence on river for irrigation – direct manual irrigation / Lift Irrigation / diesel pumps
7. Water used for irrigation from river ( this may not be available directly – will have to be
estimated from the amount of water that is lifted from the river using various devices )
8. Has there been increase in number of crops in a year since irrigation facilities – if so which all
crops benefitted and extent of area increase over last 25 years?
9. Are the present flows / depth adequate for meeting the farming requirements during summer
( February – May )/ monsoon ( June – October ) / winter ( November – January) ?
10. Has there been a lowering of depth or decrease in flows over the years? If so how much and
why in their opinion?
11. Do they perceive increasing water scarcity / shortage for irrigation over the years? If so since
when and why?
12. What are the optimum flows / depth required during summer / monsoon / winter in the river
to meet irrigation requirements in their opinion ?
2.2 Water for Domestic Consumption
1. What is the average household consumption?
2. What is the source of domestic / drinking water – river direct / river through pipe supply /
wells / ponds / check dams across the river / nallah diverting water from river / any other ?
3. Is water fit enough for drinking or do they need to purify it.
4. Any alternative sources of getting water for drinking.
5. Degree of reliance on the main source and alternative source of water (x days/365 days OR x
months/12 months)
6. Perceived water scarcity over the years – if so since when and why?
7. Perceived change in water quality over the years – if so since when and why?
2.3 Livestock
1. No and type of livestock owned – cows / buffaloes/ goat / poultry / any other
2. Dependence on river and flood plains for different activities related to livestock rearing –
frequency and season
3. Any other dependence – preparing fuel dung?
4. Is the present depth / flows adequate for livestock bathing.
2.4 Flood Plain farming
1. Is flood plain farming prevalent? If so the season / area / location ( name of the place )
2. The type of crops grown and average yield from each crop
3. Number of farmers / families involved in flood plain farming

70
4. Number of days flood plains remain submerged during monsoon ( approx )
5. Perceived changes in flood plain area / submergence over years (increased or decreased) if so
why and to what extent?
6. Perceived changes in fertility of flood plains over the years ( this is to get information on
nutrient and sediment transport by the river which it deposits along flood plains )
2. 5. Fisheries
1. Types of fishes – food and ornamental seen or known to the fishing communities
2. Number of families / persons engaged in fisheries
3. Caste and class dominance in the occupation of fishing.
4. Age group involved in fishing and gender roles.
5. From how long have they been fishing?
6. Types of fishing usually practiced –
7. Staple food – is it the fish caught or do they buy from outside?
8. River and stretch on which they do fishing.
9. Perception about high flows and low flows and fish availability corresponding to the same.
10. Average fish catch and market to which sold usually (how has the number transitioned?
11. Alternative source of income in the non-fishing season (agriculture/ handicrafts)
12. Any changes perceived in fish catch / fish species over the years? If so since when and why?
(quantity and quality)
13. Bumper fishing in an earlier time?
14. Has lowering of water depth / flow reduction been perceived affecting the fish catch / fish
species? If so how much and why and which all species affected ?
15. Migration due to non-availability of fish?
16. Water quality affecting fish catch / during which season / fish kills reports if any ?
17. Incidences of dead fish.
18. Which fish fetches good price in the market? (Current status of availability and its nutritional
information)
19. Incidences of being stopped by fishing (any penalty or legal action or resistance)
20. What did they do about it in response?
21. Collect information about the fishing gear. How has it transitioned?
22. Do they have boats or not?
23. Initial investment on fishing gear / any recurrent expenses?
24. Indigenous method of fish catching, is it still practiced or they have changed?
25. Government interventions for their welfare.
26. Their perceptions about damming the river?
27. Do they derive any benefits from the project?

71
28. Try collecting information about the gauge, discharge, nallahs, their location, wetted
perimeter, wildlife and plant species found in them.
29. Provision of basic amenities
30. Their interests in the river, being a stakeholder
31. Time dependency on the river- how many generations have depended on the river?
2.6. River Sand Mining
1. Is river sand mining prevalent at the site? If so since how many years
2. Number of families / persons engaged in river sand mining
3. The method by which sand is mined from river bed / flood plain and the ghats from where
sand is loaded and transported
4. Average income from sand mining and the mode of sale
5. Has sand mining increased / decreased over years? If so extent and reason ?
6. Perceived changes in the river flows / depth affecting deposition of sand / sand mining
2.5. Small Scale Industries ( SSI )
1. Number and Type of SSI units operating at the site – ( give the list / since when started and
type of raw materials used )
2. Their dependence on the river / nallahs / ponds / check dams/ river side wells for water and
quantity of water used
3. The extent of pollution to the river caused by the SSI units if any and the polluting materials
4. Does the SSI unit perceive water scarcity / water quality reduction over the years if so how
much?
2.6. Large Industries – Coal Mining, Thermal Power Plants
1. Number and details of large scale industries operating near the site and depending for water
on the river? – Name / since when operational / type / area allotted / raw materials / product /
production figures ( per annum / per month )
2. Any forest diversion involved? If so how much and
3. Number of employees – from locality / from distant places and average income to the family
from the industry
4. Water dependence by each industry – quantity per day / how water is drawn from river /
distance from river to the industry / how water is transported from river / what it is used for in
the production process

72
5. Pollution of river and nearby water bodies by the industry – Is any pollutant or effluent
dumped or discharged into the river? If so type of pollutant / quantity of pollution per day /
effluent treatment facilities / treatment ponds if any
6. Any CSR activity by the Industry towards river upkeep / social activities?
7. Number of new industries planned and their details – list / product / raw materials / capacity /
employment/ water requirement / effluent treatment
2.7. Boating / Ferrying / Inland navigation
1. Is there ferry service / boating / inland navigation operation at the site selected ? Of so how
many people are engaged / the number of people on average who depend upon the services
per day or week / for what all purposes / income on daily or weekly basis
2. What is the optimum depth required for smooth operation of the ferry during summer / winter
3. Are they experiencing change in flows / depth of the river affecting the ferry / inland
navigation services? If so how much and since when?
4. Has there been reduction in the ferrying / inland navigation over years. If so why and since
when?
5. How much is the optimum flow/ depth in their opinion required for smooth ferrying /
boating?
6. Any perceived reduction in income from ferrying / inland navigation? If so how much and
why ?
2.8 Cultural / Religious dependence
1. Are there culturally / religiously important sites in the river site selected? if so, name /
location/ which religion/ how old is the site / annual festival time or season
2. The type of dependence of the site on the river stretch
3. The depth / flows required for the religious / cultural purpose
4. Reduction in quantity and quality of flows / depth perceived
5. Optimum flows / depth required for the cultural / religious purpose
2.9 Medicinal Plants
1. Names and pictures of the different medicinal plants and the name and picture of the
product made from them
2. The purpose of that medicinal plant.
3. Source (Water body/ forest)

73
4. Area in which it is found (Like if it is found in the forest then, where, at the fringe
areas which implies easy collection, or deep inside which implies difficulty in
collection)
5. Height at which it is found.
6. Availability has increased or decreased.
2.10 Natural Resources
1. Names of the raw materials people take from the forests and pictures
2. Method of processing
3. Final product – name and picture
4. Price it fetches in the market
5. Changes in availability across years.
6. Have they resorted to any alternate product .
7. The dam or any developmental activity like coal mining or TPP, has disrupted their use of
natural resources in any way and if yes then from when.
What was there earlier in the land that was submerged? Which villages and approximately how many
people lived there? Where have they been shifted? What was the occupation did they practice?
TRIBUTARIES – What is the condition now? Still perennial or not? Disappearance of certain fish
due to low water level or overfishing by commercial fisheries
Details of commercial fisheries if they exist in the region – Try to meet them
Cross check names of all anicuts
Stake Holders – Farming Community, Forest dependent, fisher community, hunters, mining,
quarrying, manufacturing small products, TPP, Water supply, Bee-keeping, Sand mining,
construction, trade, transport and communication, public administration.

74
APPENDIX II: RESPONDENTS AND KEY CONTACTS
S. No. Name and Designation E- Mail Contact Number
1. Dr. Ashok Kumar Shukla,
Department of Microbiology,
Holy cross Womens College,
Ambikapur, CG
[email protected] 09826158414
2. Alok Shukla, Activist [email protected] 09977634040
3. Alok Putul, BBC Radio [email protected] 09826020625
4. Sandeep, Activist [email protected] 08109046007
5. Jaynandan, Activist - 09713677886
6. Lakshmi Chauhan,
Environmental activist
- 09893189955
7. Manish Rathod,
Environmental Activist
- -
8. Sameer Lakra - 09693561768
08969188142
9. Salman Ravi, BBC - 09873603590
10. Satya Prakash - -
11. Santosh Patel - 08103506415
12. Raj Kumar Srinivas - 09617541640