hanifa thesis-eau-7775770 by hanifa mohamad salah
TRANSCRIPT

LABOR SKILLS AND PRODUCTIVITY IN SMALL INDUSTRIES
CASE STUDY FOR ILO-TANGO COMPANY IN BOSASO PUNTLAND /SOMALIA
___________________
A research thesis
Presented to the
East Africa University
Bosaso, Somalia
__________________
In Partial Fulfillment of the Requirements for the bachelor
Degree of Economics
_______________
By:
Mohamed Ahmed Saalah
May, 2015

Page | ii
DECLARATION A
I, Mohamed Ahmed Saalah declare to the best of my ability that this report is as a result
of my own efforts and has never been submitted for any academic award to this university
and any other university or institution.
SIGNATURE:………………………………….. DATE: …………………………
STUDENT: Mohamed Ahmed Saalah

Page | iii
DECLARATION B
“I confirm that the work reported in this thesis was carried out by the candidate
under my consultant and submitted to the faculty of Economics of for examination
with my approval as the guide and Supervisor”.
Signature
_______________________
Abdinur Farah Yusuf
(Supervisor)
Date:
____/________/_______
Signature
_______________________
Abdinur Farah Yusuf
(Research Guide)
Date:
____/________/_______

Page | iv
APPROVAL
This thesis entitled “Labor skills and productivity in small industries in Bosaso, Somalia as
a case study for Ilo-Tango Company” was prepared and submitted by Mohammed Ahmed
Saalah in partial fulfillment of the requirement for the degree of Bachelor of Economics
has been examined and approved by the panel on oral examination with a grade of pass.
SIGNATURE:……………………………… DATE:……………………………...
Dean faculty of Economics: MR. Jama Esse

Page | v
DEDICATION
I dedicate this work to my dear mum Osob Muse Saed, Dear dad Ahmed Saalah and all
my family members for their comfort during the period of writing this report.

Page | vi
ACKNOWLEDGEMENT
My sincere gratitude to my research supervisor, prof. Abdinur Farah Yusuf for his expert
advice, guidance, and for awakening my enthusiasm for carrying out this study.
The respondents who took part in this study especially the staff and employees from Ilo-
Tango Company, first manager Khalid Hassan Ali and Saed, Hurre, Fahin and Hamari, I
salute them for their courage, commitment and pioneering spirit.
Everyone who assist me through this study process, in particular all my dear teachers
specially Ahmed Jama Shibiin and Abdiqani Ahmed Mohamed, my close friends Salman,
Aidid, Jodha, Jagta, Abdulkadir and Abdisahal and also all of my classmates.
My brothers Abdikani and Sekeria, my sisters Ifraah, farduus, fousia, Noura and Asiya to
all the family members with whom we have shared great love and also helped me not to
give up because of their inspiration moments.
Above of all to the Almighty God, whose blessings allowed me the privilege of completing
this study in time, without his compassion, generosity and love I can do nothing.

Page | vii
ABSTRACT
This study was set out to establish the extent to which labor skills and productivity in
small industries in Puntland Somalia as a case study for Ilo-tango Company. Specifically
the study wanted to establish the effect of (i) profile of the respondents, (ii) level of labor
skills (iii) level of productivity (iii) whether there is a significant difference in the level of
labor skills and productivity, (iv) whether there is a relationship in the level labor skills
and productivity in Ilo-tango Company in Puntland Somalia. The study used a survey
design, data were collected from 29 respondents using self-administered questionnaires
as the key data collection instruments. The study findings revealed that there was a good
level of labor skills, there was also high/good level of productivity, the level of labor skills
and productivity is significantly correlated and there is good relationship between them.
From the above findings appropriate conclusions and recommendations including those
for further research were made. Recommendations from the study were
(i) Small industries should increase level of their labor skills through training,
(ii) small industries should improve productivity by using advanced technology
(iii) small industries should prefer high skilled labors when hiring new employees,
(iv) small industries should increase employee remuneration to increase productivity.

Page | viii
Contents DECLARATION A ........................................................................................................................... ii
DECLARATION B .......................................................................................................................... iii
APPROVAL .................................................................................................................................... iv
DEDICATION ..................................................................................................................................v
ACKNOWLEDGEMENT ................................................................................................................. vi
ABSTRACT ................................................................................................................................... vii
LIST OF TABLES ............................................................................................................................x
LIST OF FIGURES ........................................................................................................................ xi
CHAPTER ONE ................................................................................................................................1
THE PROBLEM AND ITS SCOPE ........................................................................................1
Introduction ............................................................................................................................1
Background of the Study ......................................................................................................1
Statement of the Problem ....................................................................................................4
Purpose of the study .............................................................................................................5
Research objectives ..............................................................................................................5
Research questions ...............................................................................................................6
Hypothesis ..............................................................................................................................6
SCOPE OF STUDY ...................................................................................................................6
Content Scope ........................................................................................................................6
Geographical scope ...............................................................................................................7
Theoretical Scope ..................................................................................................................7
Time Scope .............................................................................................................................7
SIGNIFICANCE OF THE STUDY ........................................................................................7
Operational definitions of key Terms .................................................................................8
CHAPTER TWO ...............................................................................................................................9
REVIEW OF RELATED LITERATURE ................................................................................9
Introduction ............................................................................................................................9
Concepts, Opinions, Ideas from Authors/Experts ............................................................9
Theoretical perspectives .....................................................................................................13
Related studies ....................................................................................................................14
CHAPTER THREE .........................................................................................................................16
RESEARCH METHODOLOGY .............................................................................................16

Page | ix
Research Design ..................................................................................................................16
Research population............................................................................................................16
Sample Size ..........................................................................................................................17
Sampling procedure ............................................................................................................18
Research Instrument ..........................................................................................................18
Validity and Reliability of the instrument .........................................................................18
Data gathering procedure ..................................................................................................19
Data analysis ........................................................................................................................19
Ethical Consideration ........................................................................................................20
Limitations of the study ......................................................................................................20
CHAPTER FOUR ...........................................................................................................................22
PRESENTATION, ANALYSIS AND INTERPRETATION OF DATA ..........................22
OVERVIEW ............................................................................................................................22
Personal Information ..........................................................................................................22
Section A: personal information of the respondents ....................................................23
Section B Labor skills in small industries in bosaso Puntland. .....................................28
Section C: level of respondent’s productivity. .................................................................35
Section D: relationship between labor skills and productivity. .....................................39
CHAPTER FIVE .............................................................................................................................43
FINDINGS, CONCLUSION AND RECOMMENDATIONS ...........................................43
Introduction ..........................................................................................................................43
Summary of Findings ..........................................................................................................43
Recommendations of the study. .......................................................................................44
Conclusion ............................................................................................................................44
Suggested Further Research .............................................................................................44
Anticipated problems to the study ....................................................................................44
Bibliography ..................................................................................................................................46
APPENDIX I: QUESTIONNAIRE .................................................................................................48
APPENDIX II TIME FRAME .........................................................................................................52
APPENDIX III: RESEARCH PROJECT BUDGET ........................................................................53
APPENDIX IV Shots of Ilo-tango when data collecting. ........................................................54

Page | x
LIST OF TABLES
TABLE 1 RESPONDENTS OF THE STUDY............................................................................................................... 17 TABLE 2 GENDER OF THE RESPONDENTS ............................................................................................................ 23 TABLE 3 RESPONDENT’S LEVEL OF EDUCATION ................................................................................................. 24 TABLE 4 MARITAL STATUS OF THE RESPONDENTS ........................................................................................... 25 TABLE 5 AGE OF THE RESPONDENTS ................................................................................................................... 26 TABLE 6 RESPONDENT’S LEVEL OF EXPERIENCE ................................................................................................ 27 TABLE 7 EMPLOYEE NEEDS ADDITIONAL TRAINING TO INCREASE THEIR SKILLS ...................................... 28 TABLE 8 ALL THE EMPLOYEES IN YOUR COMPANY HAVE SKILLS TO USE AND ADAPT TECHNOLOGY ..... 29 TABLE 9 SKILLS CAN RECEIVE THROUGH EDUCATION, TRAINING OR EXPERIENCE ................................... 30 TABLE 10 STAFF RECEIVES TRAINING THEY NEED WHEN THEY ARE NEW FOR THE WORK OF YOUR
COMPANY .......................................................................................................................................................... 31 TABLE 11 YOU CONTACT YOUR STAFF/MANAGERS BY TELEPHONE, MAIL AND LETTER. ........................... 32 TABLE 12 THERE ARE OPPORTUNITIES IN YOUR WORKPLACE FOR ALL STAFF TO HAVE A FORMAL
LEARNING. ........................................................................................................................................................ 33 TABLE 13 ALL STAFF IN YOUR COMPANY HAVE EXCELLENT SKILLS ON READING, WRITING, MATH AND
COMPUTER SKILLS. ......................................................................................................................................... 34 TABLE 14 YOUR STAFF SHARE THE SAME GOALS AND VALUES TO IMPROVE YOUR PRODUCTIVITY. ..... 35 TABLE 15 SMALL INDUSTRIES CAN INCREASE PRODUCTIVITY THROUGH INCREASING EMPLOYEE’S PAY
........................................................................................................................................................................... 36 TABLE 16 YOUR PRODUCTIVITY INCREASE DAY AFTER DAY BECAUSE OF ADAPTING WORK AND
GETTING IT EXPERIENCE. ............................................................................................................................. 37 TABLE 17 YOUR COMPANY NEEDS ADVANCED TECHNOLOGY TO IMPROVE PRODUCTIVITY ..................... 38 TABLE 18 SMALL INDUSTRIES CAN INCREASE PRODUCTIVITY BY INCREASING EMPLOYEE’S SKILLS
THROUGH TRAINING. ..................................................................................................................................... 39 TABLE 19 THERE IS A CHALLENGE FACE YOUR COMPANIES PRODUCTIVITY BECAUSE OF SOME TASKS
NEEDS ADDITION OR ENOUGH TRAINING. ................................................................................................ 40 TABLE 20 HIGH SKILLED LABORS HAVE GREATER PRODUCTIVITY THAN UNSKILLED AND SEMI-SKILLED
LABORS ............................................................................................................................................................. 41 TABLE 21 THERE IS A POSITIVE RELATIONSHIP BETWEEN LABOR SKILLS AND PRODUCTIVITY. ............ 42

Page | xi
LIST OF FIGURES
FIGURE 1 GENDER OF RESPONDENTS .................................................................................................................. 23 FIGURE 2 LEVEL OF EDUCATION ........................................................................................................................... 24 FIGURE 3 MARITAL STATUS OF THE RESPONDENTS ......................................................................................... 25 FIGURE 4 AGE OF THE RESPONDENTS ................................................................................................................. 26 FIGURE 5 LEVEL OF EXPERIENCE .......................................................................................................................... 27 FIGURE 6 EMPLOYEE NEEDS ADDITIONAL TRAINING TO INCREASE SKILLS ................................................ 28 FIGURE 7 EMPLOYEES HAVE SKILLS TO USE ADAPT TECHNOLOGY ............................................................... 29 FIGURE 8 SKILLS RECEIVES THROUGH TRAINING EDUCATION AND EXPERIENCE...................................... 30 FIGURE 9 STAFF RECEIVES ENOUGH TRAINING WHEN THEY ARE NEW FOR WORKS ................................ 31 FIGURE 10 EMPLOYEES AND MANAGERS CONTACTS BY TELEPHONE, MAIL AND LETTER. ........................ 32 FIGURE 11 THERE ARE OPPORTUNITIES IN WORKPLACES FOR STAFFS TO HAVE FORMAL LEARNING. . 33 FIGURE 12 ALL STAFFS HAVE SKILLS ON READING, WRITING AND COMPUTING SKILLS .......................... 34 FIGURE 13 STAFF SHARE THE SAME GOALS AND VALUES TO IMPROVE PRODUCTIVITY. .......................... 35 FIGURE 14 SMALL INDUSTRIES CAN INCREASE PRODUCTIVITY THROUGH INCREASING EMPLOYEES
PAY. .................................................................................................................................................................... 36 FIGURE 15 EMPLOYEES PRODUCTIVITY INCREASE DAY AFTER DAY BECAUSE OF ADAPTING WORK AND
GETTING IT EXPERIENCE. ............................................................................................................................. 37 FIGURE 16 SMALL INDUSTRIES NEEDS ADVANCED TECHNOLOGY TO IMPROVE ITS PRODUCTIVITY. .... 38 FIGURE 17 PRODUCTIVITY CAN INCREASE BY INCREASING EMPLOYEES PRODUCTIVITY THROUGH
TRAINING. ........................................................................................................................................................ 39 FIGURE 18 SOME TASKS NEEDS ADDITIONAL TRAINING AND ENOUGH SKILLS.......................................... 40 FIGURE 19 HIGH SKILLED LABORS GREATER PRODUCTIVITY THAN UNSKILLED. ....................................... 41 FIGURE 20 THERE IS A POSITIVE RELATIONSHIP BETWEEN SKILLS AND PRODUCTIVITY. ....................... 42

Page | 1
CHAPTER ONE
THE PROBLEM AND ITS SCOPE
Introduction
This chapter looks at; the background to the study, statement of the problem, purpose
of the study, objective of the study, research questions, scope of the study which includes
the conceptual scope, geographical scope and time scope and finally the significance of
the study.
Background of the Study
Skills have become the global currency of the 21st century. Without proper investment in
skills, people languish on the margins of society, technological progress does not translate
into economic growth, and countries can no longer compete in an increasingly
knowledge-based global society. Some 25% of firms in OECD countries are concerned
about the availability of adequately trained workers. In sub-Saharan Africa, 40% of firms
share this concern, while in East Asia and the Pacific, 50% of firms do. For the productivity
and growth of industries not only the number of employ important, but also the skills
profiles of these employees. More and better skills are essential for economy they make
it easier to innovate, adopt new technologies, attract investment, com new markets, and
diversify the economy. This, in turn, increases job growth along with productivity’.
For the productivity and growth of industries not only the number of employees is
important, but also the skills profiles of these employees. The knowledge, skills and
competences that Europe needs to be competitive on the global labour market have a
high priority on the EU policy agenda. More and better skills are essential for economies
as they make it easier to innovate, adopt new technologies, attract investment, compete
in new markets, and diversify the economy. This, in turn, increases job growth along with
productivity.

Page | 2
Productivity is a measure of how efficiently a firm, or an economy, uses inputs such as
labour and capital, to produce goods and services. Changes in productivity are not the
same as changes in levels of production. An increase in productivity can mean that more
goods and services have been produced with the same amount of capital and labour, or
that the same amount of goods and services has been produced with less capital and
labour. Furthermore, the usual measure of productivity is the growth in productivity, that
is, the extent to which efficiency is increasing.
Low growth in productivity in the period from 1991 to 2002, economic growth averaged
3.5 percent per annum. Over the same period, labour productivity growth was between
2 and 3 percent and multifactor productivity growth around 2 percent. In the period from
2002 to 2006, economic growth increased to an average of over 4 percent per annum.
However, labour productivity growth decreased to 1.5 percent and multifactor
productivity growth to less than one percent. As economic growth slowed from 2006 to
2008, productivity growth also continued to decline.
The global slowdown in economic growth has an immediate impact on the world’s
productivity performance, as lower investment and less innovation make workers less
productive. According to the latest estimates by The Conference Board global output-per-
worker growth has dropped off to 1.8 percent in 2012, which except for the 2008/09
recession was seen last in 2001/2002.
We project global labor productivity growth to remain fairly sluggish at 1.9 percent in
2013. This weak productivity performance means that global GDP growth, currently
forecasted around 3.2 percent for 2013 (compared to 3.1 percent in 2012) creates little
upside for GDP growth even if labor markets recover more strongly than predicted
because the employment gains are likely to be offset by slowing labor productivity growth.
In Africa, South Africa under apartheid the development of skilled workers was
concentrated on the white inhabitants but after the socio-political upheaval of the 1990s,
these same skilled workers are emigrating, a highly sensitive subject in contemporary

Page | 3
South African Society. The media in South Africa has increasingly covered the "brain
drain" in the 1990s. Starting in 1994, when a democratically elected government took
control of the reins of power, official South African statistics show a greater emigration
of skilled workers. The validity of this data has been questioned
Labor productivity growth in Africa remained relatively modest compared to other
emerging and developing regions at 0.8 percent in 2012. The slow productivity growth in
Africa resulted from a significant increase in the size of labor force, which for a region
with a relative low productivity level of 6.5 percent of the United States, makes much
sense.
In Somalia, labor need to empower their productivity through the provision of skills such
qualification, training and work experience, this is one of the ways the community gets
uplifted economically since with productivity of workers not only gets more productivity
levels but can also establish their own productivity and increasing wages. In Somalia the
workers have been effected by the inter clan wars such that most of them have weak
productivity background.
Skill is a very important to the employers and they respect the high skilled workers than
unskilled workers or low skill workers, but there is other things effected the labor force
in Somalia since central government was corrupted that is the inter clan or family
members employment that is very harm full the workers and forced many young people
of the labor force to emigrate.
In Somalia The modest industrial sector, based on the processing of agriculture products,
accounts for 10% of the Somalia GDP prior to the outbreak of the civil war in 1990, the
roughly 53 state-owned small, median and large manufacturing firms were foundering,
with the ensuing conflict destroying many of the remaining industries. However, primarily
as a result of substantial local investments by the Somali Diaspora,

Page | 4
Many of these Small-scale plants have re-opened and newer ones have been created.
The latter include fishing canning and meat-processing plants in the north, as well about
as about 5 factories in Mogadishu area, which manufacture pasta , mineral water ,
confections , plastic bags, fabric, hides and skins , detergent and soap aluminum, foam
mattresses and pillows, fishing boats, carry out packaging, and stone processing.
In Puntland, Industries productivity are the parts of private sector and the government
of Puntland has no much interferences, the role of the government on industries is to
extend of any possible support in view of developing Puntland small and medium size of
industries which accommodates Puntland resources such as meat, milk, bones, blood and
skins. The ministry of commerce and industries urging to all local businessmen to create
of industries and the authority contribution is to make discount of taxation and other
facilities for encouragement and provide with trading license, the government also
scrutinizing industries in many aspects, including sanitary conditions, labour skills, row
materials received, production per day, and producing quality goods etc. the government
also registered the number of industries has already been implemented in Puntland.
In Bosaso 45 small industries which produced different quality of goods In Garowe 5
small industries In Galka’ayo 17 small industries, which produces refining water, electricity
generators and other sweet beverages. Industries of Puntland are growing day by day.
Statement of the Problem
The global economy witnessed a deceleration in labor productivity growth for the third
consecutive year. Yet, compared to the intensity of the slowdown in previous years, the
2013 decline was modest. Labor productivity growth, measured as the average change
in output per person employed, declined from 3.9 percent in 2010 to 2.6 percent in 2011,
1.8 percent in 2012, and 1.7 percent in 2013.
Labor productivity growth in sub-Saharan Africa has remained at 2.1 percent in 2013, the
same as in 2012, accompanied by stable output and employment growth rates. Africa
still, however, has the lowest level of productivity (at about 5 percent of the US level),

Page | 5
with South Africa at the top with 28 percent of the US productivity level. Estimates for
South Africa, the largest economy in the region, suggest relatively solid labor productivity
growth of more than 3 percent, but there is still much scope for a more efficient use of
resources since total factor productivity growth is declining. There are also large
variations in productivity growth between African economies, ranging from more than 4
percent in large economies such as Ghana, and Côte d’Ivoireto contractions in economies
such as Zimbabwe and Madagascar.
In Somalia, like other developing countries low productivity is a big problem as there are
limited educated people means of reducing the problem. There are low skilled labors to
increase efficient productivity of small industries, where the most production for small
industries are very few and cause the high price level of their goods.
As we discuss our study the labor productivity is an indicator as well as measurement for
the productivity level and there is low productivity among sub-Saharan African countries
include Somalia, so there is low productivity in the small industries in Bosaso district,
Puntland Somalia.
Purpose of the study
The study aimed to recognize the relationship between labor skills and level of
productivity in selected Small industry (Ilo-Tango) to improve the general output among
the producers in Bosaso, Puntland, Somalia.
Research objectives
General Objective
This study will determine the correlation between labor skills and level of productivity
among small industries in Bosaso, Puntland, Somalia.

Page | 6
Specific objective
1. To determine the profile characteristics of the respondents in terms of: Gender,
Age, educations Level and experiences.
2. To determine the level of labor skills in Bosaso district, Puntland, Somalia.
3. To determine the levels of productivity in selected company (Ilo-tango) in Bosaso
district, Puntland, Somalia.
4. To establish whether there is a significant difference of labor skills and productivity
of Small industries in Bosaso District, Puntland, Somalia.
5. To determine whether there is a significance relationship the degree of labor skills
and level of productivity among small industries.
Research questions
1. What are profile characteristics of the respondents in terms of Gender, age,
educational level, experience, number of years working?
2. What is level of labour skills in Puntland, Somalia?
3. What is the level of productivity among small industries in Puntland, Somalia?
4. Is there a significant relationship between labor skills and productivity among small
industries in Puntland, Somalia?
Hypothesis
H01: there is no significant relationship and significant difference between the labor skills
and level of productivity among small industries.
SCOPE OF STUDY
Content Scope
The study concern the labor skills and productivity in small industries (as a case study for
ILO-TANGO company) in Bosaso, Puntland, Somalia, the study was aimed to find out the
labor skills and level of productivity and the challenges of small industries face and as
well as their contribution on level of productivity.

Page | 7
Geographical scope
Furthermore the geographical scope of the study was conducted in Somalia especially
Bosaso district, Bosaso is the largest town of the Puntland State Somalia. It locates
Northeast region of Somalia, the reason of selecting Bosaso district is that the majority
of the small industries in Puntland state is stationed in Bosaso. Other motives that drive
the researcher to select Bosaso is that, there are the highest population in Puntland and
estimated at about 700,000 residents. Is the third largest city in the country after
Mogadishu and Hargeisa.
Theoretical Scope
The study theories of Shifts and Twists in the Relative Productivity of Skilled Labor
(Arnaud Dupuy and Philip S. Marey 2007) will be proven or disproved in this study.
Time Scope
On the hand, in regard with the time scope the study was targeted those small industries
who have been working the last one decade or last ten years.
SIGNIFICANCE OF THE STUDY
i. The findings of the study will specifically help industries especially small industries
to improve their productivity through increase the skills of their labor.
ii. The study will also help policy makers to formulate ways on how to improve the
country’s employee skills and quality to improve whole the production in the
economy.
iii. The study findings shall be used as reference for future researchers in the area of
productivity and related fields having contributed to operational definition of
concepts, literature and methodology to guide such future studies.

Page | 8
Operational definitions of key Terms
Skilled worker is any worker who has special skill, training, knowledge, and (usually
acquired) ability in their work. A skilled worker may have attended
a college, university or technical school. Or, a skilled worker may have learned their skills
on the job.
Productivity is an average measure of the efficiency of production. It can be expressed
as the ratio of output to inputs used in the production process, i.e. output per unit of
input.
Labor productivity measures the amount of goods and services produced by one hour
of labor.
Skill is a measure of the amount of worker's expertise, specialization, wages, and
supervisory capacity.
Labor efficiency is a measure of how efficiently a given workforce accomplishes a task,
when compared to the standard in that industry or setting.
Skill level is defined as a function of the complexity and range of tasks and duties to be
performed in an occupation.

Page | 9
CHAPTER TWO
REVIEW OF RELATED LITERATURE
Introduction
This chapter discusses in detail the variables under study (labor skills and productivity),
the theory to which the study is based and related studies.
Concepts, Opinions, Ideas from Authors/Experts
Labor skills, According to Cowan, Ruth Schwartz (1997), Skill is a measure of the amount
of worker's expertise, specialization, wages, and supervisory capacity. Skilled workers are
generally more trained, higher paid, and have more responsibilities than unskilled
workers.
Crown (2006) defines Skills are capabilities and expertise in a particular occupation or
activity. There are a large number of different types of skills and they can be split into a
number of different categories. Basic skills, such as literacy and numeracy, and generic
skills, such as team working and communication, are applicable in most jobs. Specific
skills tend to be less transferable between occupations. Most occupations use a mix of
different types of skills. The most common measures of skills are qualifications. On the
job training in the workplace is a vital source of skills development and career progression.
ILO (2012) Skill is defined the ability to carry out the tasks and duties of a given job. Skill
level is defined as function of complexity and range of tasks and duties to be performed
in an occupation. Skill specialization is considered in terms of four concepts: 1) the field
of knowledge required, 2) the tools and machinery used 3) the materials worked on or
with and 4) kinds of goods and services produced

Page | 10
Three Types of Skills, to complete a task, there may be many steps that require various
skills. These skills can come from life, work, or education. A good way to organize skills
is to divide them into three basic types: job-related skills, transferable skills, and self-
management skills.
Job-related skills are abilities that you learn in a particular job or type of job. These relate
to four different areas: data, people, things, and ideas. Data relates to numbers of any
kind (percentages, frequency, and money), research, codes, or surveys. People
include what kind of people you work with (coworkers, customers, vendors, etc.) and
what you do with, for, or to each of them. Things refer to tools, machines, or
pieces of equipment you know how to use. Ideas are suggestions you came up with to
make the job easier, more efficient, or more profitable.
Transferable skills can be used in a variety of jobs. They are skills you can transfer from
one job or career to another without much training. In an interview you may be asked
to describe a time when you used a certain skill. Some examples of transferable skills
are: Write clearly, file records, listen, handle money, organize tasks, gather information,
train and teach others
Self-Management skills tell the employer if you would fit in with the personality of the
company, the management, and the coworkers. You may be asked when you have used
one of these skills, so be sure to pick those you have used. Some examples of self-
management skills are:
Honesty, adaptable, enthusiasm, creative, responsible, energetic, dependable, sincere,
dedicated and conscientious

Page | 11
Skills Employers Want: According to a recent survey, employers consider these 10 skills
and qualities very important in the workforce: Communication skills, computer skills,
customer care skills, team-working, flexibility, practical and technical skills, motivation,
quality control, learning skills and problem-solving skills.
Productivity, According to Zandin, (2001) is defined as a measure of quantifying the
output against the amount of input. It expresses the relationship between the quantity
of goods and services produced (output) and the quantity of labour, capital, land, energy,
and other resources to produce it (input).
Paul Krugman, (1994) define Productivity isn’t everything, but in the long run it is almost
everything. A country’s ability to improve its standard of living over time depends almost
entirely on its ability to raise its output per worker. His only meaningful measure of
industrial competitiveness is productivity (Khurana & Talbot, 1998).
Productivity is commonly defined as a ratio of a volume measure of output to a volume
measure of input use. (OECD 2001) productivity is the relationship between output of
goods and services and the inputs of resources, human and non-human used in the
production process, with the relationship usually expressed in ratio form.
Productivity is increasingly driven by skills. The ability of firms to succeed in the face of
growing international competition depends increasingly on the skilled labour force they
can draw from. Skilled workers are better able to adapt to new technologies and market
opportunities. Higher levels of skills drive innovation facilitate investment and improve
leadership and management. For innovation to be effectively implemented, businesses
must be able to draw on a flexible, skilled workforce. (Crown 2006).
Productivity is the quality or state of being productive. Productivity is the measure of how
specified resources are managed to accomplish timely objectives stated in terms of quality
and quantity. Indicate how well labor, capital, materials and energy are used. Bates

Page | 12
(2001) explains that the main determinants of output growth are input growth (the
growth of capital and labour inputs) and the growth of Total Factor Productivity (TFP).
There are three standard measures of productivity: labour productivity measures the
output achieved per worker or per hour worked; capital productivity measures the output
achieved per unit of capital input; and multifactor productivity takes account of both
labour and capital inputs and represents the portion of output growth that cannot be
attributed directly to growth in labour or capital inputs. As such, it can be taken to
represent improvements due to other sources, such as technology change, new
knowledge and skills, and improved methods and processes (The Treasury, 2008a and
Statistics New Zealand, 2009a).
Productivity is considered a key source of economic growth and competitiveness and, as
such, is basic statistical information for many international comparisons and country
performance assessments. There are different measures of productivity and the choice
among them depends either on the purpose of the productivity measurement and/or data
availability. One of the most widely used measures of productivity is Gross Domestic
Product (GDP) per hour worked. (OECD 2008,11)
Another productivity measure is so called multi factor productivity (MFP) also known
as total factor productivity (TFP). It measures the residual growth that cannot be
explained by the rate of change in the services of labour, capital and intermediate
outputs, and is often interpreted as the contribution to economic growth made by factors
such as technical and organizational innovation. (OECD 2008,11).
Partial Productivity: It is the ratio of output to one class of input. For example, labor
productivity (the ratio of output to labor input) is a partial productivity measure. Similarly,
capital productivity (the ratio of output to capital input) and material productivity (the
ratio of output to materials input) are examples of partial productivity.

Page | 13
Total-factor productivity: It is the ratio of net output to the sum of associated labor and
capital (factor) inputs. By ―net output, ‖ we mean total output minus intermediate goods
and services purchased. Notice that the denominator of this ration is made up of only the
labor and capital input factors.
Total productivity: It is the ratio of total output to the sum of all input factors. Thus, a
total productivity measure reflects the joint impact of all the inputs in producing the
output.
Productivity vs. Inflation: While increased inflation rates in an economy must be explained
by the joint effect of several factors, economists do agree that a lack of productivity
growth contributes to the increase. As expected, this is because price inflation of goods
and services results from the excessive increases in sales prices of products or services.
Such increases are mostly due to the management’s intention to meet their sales revenue
targets, even if it means increasing the selling price just to hold the profits margins. Also,
since the path of least resistance is to pass the increases in input costs on to the customer,
many companies resorts to that strategy rather than consistently increasing total
productivity, a practice that can actually reduce, if not hold, the total cost of manufacture.
Theoretical perspectives
There are number of theories related to our area of labor productivity, this theory
suggested by NZIER (2004) stipulates that industry training should enhance productivity
it is very much an initial investigation into this area.
Industry training is essentially an investment in human capital, the economic benefits of
which can be thought of as being shared between: The individual trainee, through higher
wages (a proxy for labour productivity. The firm, through enhanced profitability (a proxy
for capital productivity) and the Society as a whole, through “externalities” (returns over
and above the private returns to the individual trainee or firm who pays for the training).

Page | 14
These benefits are difficult to measure. However, there is a weight of evidence from the
literature relating to the positive wage effects of training. From the literature, we can
infer that an industry training qualification is likely to increase the earnings of an individual
by between 5% and 20%. This means that, on average, a trainee after industry training
is likely to be 5-20% more productive than they would have otherwise have been.
Researcher’s labor productivity can explore the relevance of such theories of Shifts and
Twists in the Relative Productivity of Skilled Labor by Arnaud Dupuyand Philip S. Marey
(2007) which postulates relative productivity of skilled workers changes proportionally in
all tasks and skill-biased technical change is usually interpreted in terms of the efficiency
parameters of skilled and unskilled labor.
All the theories related to this study are not focused on the level of the labor skills and
its effect of productivity in figures and also they are not all related to our area, also there
is a time gap between those theories and the current time so it is possible to show this
study a different case of past theories.
Related studies
Niringiye Aggrey (2013) was study its authors among other things wanted to
establish the effect of human capital on labor productivity in sub-Sahara African
manufacturing firms, its findings indicated that High proportion of skilled workers was
shown to be positively associated with labor productivity in Ugandan and Tanzanian
manufacturing firms. In Tanzania manufacturing firms, the education of the manager was
shown to be positively associated with labor productivity. Consistent with the human
capital theory, average education variable was shown to be positively associated with
labor productivity in Kenyan and Ugandan manufacturing firm. The findings indicated that
labors that have skills is more productivity than another one with no skills.
Also the related studies of labor productivity are more and we cannot take it all to here
so there is another study prepared by the Centre for the Study of Living Standards for
the Atlantic Canada Opportunities Agency (1998) concerning Productivity and its findings

Page | 15
was The only sustained manner in the long run to increase per capita income is by
increasing the amount of output produced per worker, that is by raising labour
productivity. The findings of this study is the only can increase productivity is increasing
labour productivity first through increasing their skills including education, training and
practicing.
Link between labor skills and productivity
To examine the link between skill and productivity, skill needs to be measured.
However, the concept of skills include many elements such as personal characteristics,
skills developed through formal education and training, and skills developed through work
experience and informal training which makes the direct measurement difficult. Skills of
workers influence productivity directly, as they define the capabilities that the labour force
can contribute to the production process, and indirectly, where the contribution of skill is
mediated through other drivers, for example, enterprise and innovation.

Page | 16
CHAPTER THREE
RESEARCH METHODOLOGY
Research Design
The study was quantitative and was used it a descriptive correlational design. The
descriptive correlation quantitative design was used to establish the relationship between
the independent and dependent variable through quantitative results. Descriptive studies
are non-experimental researches that describe the characteristics of a particular
individual, or of a group. It deals with the relationship between variables, testing of
hypothesis and development of generalizations and use of theories that have universal
validity. It also involves events that have already taken place and may be related to
present conditions Kothari, (2004). On the other hand, Survey are used to collect data
from sample of population at a particular time (Amin, 2005)
The research design is about the arrangement of variables, conditions and participants
for the study. It is also implies arrangement that aid conceptualizing of variables handling
of research methods, sampling of respondents and handling of data analysis techniques.
Research population
The study primarily was focused on small industries as case study for Ilo-Tango
Company in Bosaso Puntland Somalia, Target population consisting of 32 staffs and
administrators from Ilo-tango Company 20 respondents and other small industries 9
respondents. This population will get from information because they possesses an
adequate understanding of productivity growth and aware the weaknesses of the labor
skills and their effect of productivity.

Page | 17
Sample Size
A total of 29 subjects were selected using The Sloven’s formula to determine the
minimum sample size. Table 1 below shows the respondents of the study with the
following categories.
From this formula, the sample was calculated as flows
𝒏 =𝑵
𝟏 + 𝑵(𝒆𝟐)
N=sample size
N= the population size
e =level of significance,fixed
Table 1 Respondents of the study
Source: Primary source
Categories Target
population
Sample size Sampling
methods
1. Ilo-tango Company 22 20 Stratified
2. Other industries 10 9 Stratified
Total 32 29

Page | 18
Sampling procedure
Stratified sampling technique was used to select the respondents to be included
in the sample. Stratified sampling was used to make sure that the target population is
divided into different homogenous strata and that each stratum is represented in the
sample in a proportion equivalent to its size in the accessible population.
The study was used stratified sampling which is proportionate to stratum size to reach as
the sample of each strata using a fraction 29/32 * population of each stratum Amin,
(2005).
Research Instrument
The research tools that are utilize in this study include the following: (1) face sheet to
gather data on the respondents’ demographic characteristics (gender, age, qualifications,
number of years working experience, number of qualified workers and number of trained
workers); (2) researcher devised questionnaires to determine the levels of labor skills and
productivity.
Validity and Reliability of the instrument
In this research validity of the respondent’s instruments questionnaire was
established through a content validity index CVI by given the instrument to expert in
his/her field and they judge whether the instrument is valid or not.
The researcher was computed the content validity from experts judgments by using
content validity index formula𝐂𝐕𝐈 =number ofquestions declared valid
Total number of questions.
The test-retest technique was used to determine the reliability (accuracy) of the
researcher devised instruments to eight qualified respondents. These respondents were
not being included in the actual study. In this test- retest technique, the questionnaires
was administered twice to the same subjects.

Page | 19
Data gathering procedure
Before the administration of the questionnaires
The first the researcher was got an introduction letter was obtained from the East
Africa University, for the researcher to solicit approval to conduct the study from
respective respondents.
Researcher was appointed a research assistant who would assist in the data collection;
brief and orient them in order to be consistent in administering the questionnaires.
During the administration of the questionnaires
During the data collection the researcher was asked the respondents to sign the
informed content. And also will request to the respondents to answer kindly all questions.
After the administration of the questionnaires
After the receiving the questionnaires back in a time, the researcher was check the
completeness of all answers that whether the respondents answered the entire
questionnaire. After checking the researcher will arrange the data and edit the data for
the errors and completeness of whether the respondents have left unfulfilling
questionnaires.
Data analysis
The frequency and percentage distribution was used to determine the profile of
respondents.
The mean and standard deviations was used for the levels of labor skills and,
productivity that is to demonstrate the strengths and the weaknesses of the labor skills
and productivity. From these strengths and weaknesses, the recommendations will be
derived.

Page | 20
The t-test and one way Analysis of Variance (ANOVA) was used to analyze if there
is significant relationship in the level of labor skills and productivity on their profile
characteristics.
Ethical Consideration
Bearing in mind the ethical issues, the researcher was provided the respondents
with the necessary information as regards the main purpose of the research, expecting
duration and procedures to following, and be in position to keep privacy and not disclose
the confidentiality of respondents and researchers responsibility.
Solicit permission through a written request to the concerned officials of the ministries
Limitations of the study
There may be some problems which can reduce the validity of this study such problems
include the following
Extraneous variables: This was beyond the researcher’s control such as
respondents’ honesty, personal biases and uncontrolled setting of the study.
Testing: The use of research assistants can bring about inconsistency in the
administration of the questionnaires in terms of time of administration, understanding of
the items in the questionnaires and explanations given to the respondents. To minimize
this threat, the research assistants was oriented and briefed on the procedures to be
done in data collection.
Attrition/Mortality: Not all questionnaires maybe returned neither completely
answered nor even retrieved back due to circumstances on the part of the respondents
such as travels, sickness, hospitalization and refusal/withdrawal to participate. In
anticipation to this, the researcher will reserve more respondents by exceeding the
minimum sample size. The respondents will also be reminded not to leave any item in
the questionnaires unanswered and will be closely followed up as to the date of retrieval.

Page | 21
Environmental challenges which can disturb that researcher were not able to collect
data from the respondents because there is some sensitive areas where by respondents
can against this study.

Page | 22
CHAPTER FOUR
PRESENTATION, ANALYSIS AND INTERPRETATION OF DATA
OVERVIEW
The study was set to establish relationship between labor skills and Productivity in small industries in Bossaso Puntland Somalia.
This chapter presents data collected, analysis and interpretation from the field. The data was collected using instruments like questionnaire, interview guide and documentation, which was highlighted under the researcher’s methodology. In this chapter, more emphasis has been placed on the interpretation of raw data in relation to the set objectives and the research question as set for the study.
Personal Information
The researcher prepared questionnaires appropriate for this study. The questionnaires were administered using both personal administrations with on the spot collection where the researcher delivered the questionnaire in person and waited for the respondents to fill them then went back with them. Personal administration with collection after time was employed to give the respondents sample time to answer the questionnaire and consult other sources resource material and other documents. The researcher distributed 29 questionnaires to the respondent of Small industries in Bosaso. All the questionnaires were completed and returned back.
This means that questionnaires which have been completed represented a good response rate which was considered sample for the objectives of the study (Amin 2005). The researcher later purposively sampled and interviewed the entire labors of small industries.

Page | 23
Section A: personal information of the respondents
Respondent Sex
Only male respondents were interviewed during the data collection by the researcher as shown in the results table below
Table 2 Gender of the Respondents
Frequency Percent Cumulative Percent
Male 29 100.0 100.0
Source: primary data
Figure 1 Gender of respondents
The analysis of respondents vote were 100% male, that means all the labors of Small industries in Bosaso Puntland are male,
100%
GANDR OF THE RESPONDENTS

Page | 24
Respondent’s level of education
Table 3 Respondent’s level of Education
Level of Education Frequency Percent Cumulative Percent
Certificate 11 37.9 37.9
Diploma 6 20.7 58.6
Degree 6 20.7 79.3
Master 0 0 79.3
None of the above 6 20.7 100
Total 29 100
Source: primary data
Figure 2 Level of education
Analysis of respondent’s questionnaire in level of education is that 37.93% percent of respondents had school certificate, were 20.7% had diploma, and other 20.7% had degree level, no respondents had master level, were 20.7% had no any education, this means the most labors in small industries near 38% are low level education and have only certificate were other more than 20% have none of education or literacy.
0%
5%
10%
15%
20%
25%
30%
35%
40%
Certificate Diploma Degree Master None of theabove
37.90%
20.70% 20.70%
0.00%
20.70%
Per
cen
t
Level of measurement
Level of education

Page | 25
Marital status of the Respondents
Table 4 Marital Status of the respondents
Frequency Percent Cumulative Percent
Single 8 27.6 27.6
Married 21 72.4 100.0
Total 29 100.0
Source: primary data
Figure 3 Marital status of the respondents
The level marital status of respondents show us that 72% were married, and 28% were not married, this means most labor of small industries in Bosaso were married and only there is less than 30% of workers were not married.
28%
72%
Marital status of the respondents
Single
Married

Page | 26
Age of the respondents
Table 5 Age of the Respondents
Age of the respondents
Mid-point Frequency Percent
Cumulative Percent
Mid-point F X Frequency X
20-30 25 12 41.4 41.4 300
30-40 35 11 37.9 79.3 385
40-50 45 3 10.3 89.7 135
50-above 55 3 10.3 100 165
Total 160 29 100 985
Source: primary data
Figure 4 Age of the respondents
This figure show us 41.38% of respondent’s age were 20-30, 37.93% were between 30-40, 10.34 were between 40-50, and 10.34% were over 50years old, the analysis of this graph is that major respondents of my questionnaire are young age between 20-30 that are the most labors work in small industries in Bosaso, Punland, where the next respondents were 30-40 years while above 40years were less than 21%.
41.40%
37.90%
10.30% 10.30%
0%
5%
10%
15%
20%
25%
30%
35%
40%
45%
20-30 30-40 40-50 50-above
Per
cen
tage
level of Measurement
Age of the respondents

Page | 27
Respondent’s level of experience
Table 6 Respondent’s level of experience
Frequency Percent Cumulative Percent
less than 1 year 4 13.8 13.8
1 year - 2 year 2 6.9 20.7
2 year - 3 year 7 24.1 44.8
3 year - over 16 55.2 100
Total 29 100
Source: Primary data
Figure 5 Level of Experience
This graph shows there were 13.8% of respondents new for industries and working less than a year, were 6.9% worked 1-2years, and 24.1% worked 2-3years and the 55.2% were worked more than 3years, this means the most number of workers near 56% in small industries in Bosaso are working more than 3years, were less than 14% and new for industries.
13.79%
6.90%
24.14%
55.17%
0%
10%
20%
30%
40%
50%
60%
less than 1 year 1 year - 2 year 2 year - 3 year 3 year - over
fre
qu
en
cy
Years
RESPONDENT 'S EXPERIENCE

Page | 28
Section B Labor skills in small industries in bosaso Puntland.
Employee needs additional training to increase their skills
Table 7 Employee needs additional training to increase their skills
Level of measure Frequency Percent Cumulative Percent
Strongly Disagree 7 24.1 24.1
Dis agree 1 3.4 27.6
Agree 4 13.8 41.4
Strongly Agree 17 58.6 100
Total 29 100
Source: primary data
Figure 6 Employee needs additional training to increase skills
The result from this graph shows that respondents vote 24.1% Strongly Disagree, 3.4% Disagree, 13.8% Agree and 58.6% Strongly agree, this shows the most respondents near 59% strongly agree with us that Employee needs additional training while small number near 24% Strongly Disagree.
24.10%
3.40%
13.80%
58.60%
0%
10%
20%
30%
40%
50%
60%
70%
Strongly Disagree Dis agree Agree Strongly Agree
PER
CEN
TAG
E
MEASUREMENT
Employee needs additional training to increase skills

Page | 29
All the employees in your company have skills to use and adapt technology
Table 8 All the employees in your company have skills to use and adapt technology
Frequency Percent Cumulative Percent
Strongly disagree 0 0 0
Disagree 7 24.1 24.1
Agree 15 51.7 75.9
Strongly Agree 7 24.1 100
Total 29 100
Source: primary data
Figure 7 Employees have skills to use adapt technology
as table 8 and figure 7 shown 24.1% employees in small industries in Bosaso have skills to use and adapt technology, while 51.7% agree that, 24.1% disagree and there is no one respondents selected strongly disagree.
0%
10%
20%
30%
40%
50%
60%
Strongly disagree Disagree Agree Strongly Agree
0.00%
24.10%
51.70%
24.10%
Fre
qu
en
cy
Level of Measure
EMPLOYEES HAVE SKILLS TO USE ADAPT TECHNOLOGY

Page | 30
Skills can receive through education, training or experience
Table 9 Skills can receive through education, training or experience
Frequency Percent Cumulative Percent
Strongly disagree 1 3.4 3.4
Disagree 1 3.4 6.9
Agree 9 31 37.9
Strongly agree 18 62.1 100
Total 29 100
Source: primary data
Figure 8 skills receives through training education and experience.
Respondents vote this question 3.4% strongly disagree, 3.4% disagree, 31% agree, and 62.1% strongly agree, this interpretation is the most 62.1% vote strongly agree or that skills receive through education, training and experience, were less than 7% disagree that.
3.40% 3.40%
31.00%
62.10%
0%
10%
20%
30%
40%
50%
60%
70%
Strongly disagree Disagree Agree Strongly agree
pe
rce
nta
ge
level of measurement
skills receives through training education and experience

Page | 31
Staff receives the training they need when they are new for the work of your company.
Table 10 Staff receives training they need when they are new for the work of your
company
Frequency Percent Cumulative Percent
Strongly disagree 0 0 0
Disagree 2 6.9 6.9
Agree 8 27.6 34.5
Strongly agree 19 65.5 100
Total 29 100
Source: primary data
Figure 9 staff receives enough training when they are new for works
This graph and table shows there is no respondents vote strongly disagree, 6.9% were disagree, 27.6% agree and the 65.5% strongly agree, this means there is high number 65.5% select strongly agree and we can interpret that most labors get enough training when hired.
0
10
20
30
40
50
60
70
Strongly disagree Disagree Agree Strongly agree
0%
6.9%
27.6%
65.5%
Per
cen
tage
Level of measurement
staff receives enough training when they are new for works

Page | 32
You contact your staff/managers by Telephone, mail or a letter
Table 11 You contact your staff/managers by telephone, mail and letter.
Frequency Percent Cumulative Percent
Strongly agree 2 6.9 6.9
Disagree 2 6.9 13.8
Agree 11 37.9 51.7
Strongly agree 14 48.3 100
Total 29 100
Source: primary data
Figure 10 Employees and managers contacts by Telephone, Mail and Letter.
Respondents of this graph vote 6.9% strongly disagree, 6.9% disagree, 37.9% agree and 48.3% strongly agree, there is view number less than 7% vote strongly disagree and there is 48.3% were selected strongly agree means near 50% use technology to contact their boss/employee.
0%
5%
10%
15%
20%
25%
30%
35%
40%
45%
50%
Strongly disagree Disagree Agree Strongly agree
6.90% 6.90%
37.90%
48.30%
per
cen
tage
Level of measurement
Employees and managers contacts by Telephone, Mail and Letter

Page | 33
There are opportunities in your workplace for all staff to have formal learning
Table 12 There are opportunities in your workplace for all staff to have a formal learning.
Frequency Percent Cumulative Percent
Strongly disagree 0 0 0
Disagree 4 13.8 13.8
Agree 11 37.9 51.7
Strongly agree 14 48.3 100
Total 29 100
Source: Primary data
Figure 11 There are Opportunities in workplaces for staffs to have formal learning.
This graph shows 0% selected strongly disagree, 13.8% disagree, 37.9% agree and the 48.3% selected strongly agree, near 50% selected strongly agree that means there is opportunity labors get their workplace to learn formal education.
0%
5%
10%
15%
20%
25%
30%
35%
40%
45%
50%
Strongly disagree Disagree Agree Strongly agree
0.00%
13.80%
37.90%
48.30%
Pe
rce
nta
ge
Level of measurement
THERE ARE OPPORTUNITIES IN WORKPLACES FOR STAFFS TO HAVE FORMAL LEARNING

Page | 34
All staff have excellent skills on reading, writing, maths and computer skills
Table 13 all staff in your company have excellent skills on reading, writing, math and
computer skills.
Frequency Percent Cumulative Percent
Strongly disagree 2 6.9 6.9
Disagree 6 20.7 27.6
Agree 10 34.5 62.1
Strongly agree 11 37.9 100
Total 29 100
Source: primary
Figure 12 All staffs have skills on reading, writing and computing skills
This graph shows respondents vote 6.9% strongly disagree, 20.7% disagree, 34.5% agree and 37.9%, this means near 40% of respondents were vote strongly agree and 34.5% selected agree, there is only few respondents 6.9% selected strongly disagree.
0%
5%
10%
15%
20%
25%
30%
35%
40%
Strongly disagree Disagree Agree Strongly agree
6.90%
20.70%
34.50%
37.90%
Per
cen
t
Level of measurement
All staffs have skills on reading, writing and computing skills

Page | 35
Section C: level of respondent’s productivity.
Your staff share the same goals and values to improve your productivity.
Table 14 Your staff share the same goals and values to improve your productivity.
Frequency Percent Cumulative Percent
Strongly disagree 5 17.2 17.2
Disagree 1 3.4 20.7
Agree 5 17.2 37.9
Strongly agree 18 62.1 100
Total 29 100
Source: primary data
Figure 13 Staff share the same goals and values to improve productivity.
This graph shows 17.2% of respondents vote strongly disagree, 3.4% disagree, 17.2% agree and 62.1% strongly agree, this shows there small industries in Bosaso have shared goals and values with their employees.
0%
10%
20%
30%
40%
50%
60%
70%
Strongly disagree Disagree Agree Strongly agree
17.20%
3.40%
17.20%
62.10%
PER
CEN
T
LEVEL OF MEASUREMENT
STAFF SHARE THE SAME GOALS AND VALUES TO IMPROVE PRODUCTIVITY

Page | 36
Small industries can increase productivity through increasing employee’s pay
Table 15 Small industries can increase productivity through increasing employee’s pay
Frequency Percent Cumulative Percent
Strongly disagree 4 13.8 13.8
Disagree 4 13.8 27.6
Agree 11 37.9 65.5
Strongly agree 10 34.5 100
Total 29 100
Source: primary data
Figure 14 Small industries can increase productivity through increasing employees pay.
Respondents selected strongly disagree are 13.8%, disagree 13.8%, agree 37.9%, and strongly agree are 34.5%, near 38% respondents tells that industries can increase their productivity through increasing employee’s pay, where near 35% strongly agree that, only 13.8% selected strongly disagree, and 13.8% others disagree that.
0%
5%
10%
15%
20%
25%
30%
35%
40%
Strongly disagree Disagree Agree Strongly agree
13.80% 13.80%
37.90%34.50%
pe
rce
nt
Level of measurement
SMALL INDUSTRIES CAN INCREASE PRODUCTIVITY THROUGH INCREASING EMPLOYEES PAY

Page | 37
Your productivity increase day after day because of adapting work and getting it experience
Table 16 Your productivity increase day after day because of adapting work and getting
it experience.
Frequency Percent Cumulative Percent
Strongly disagree 1 3.4 3.4
Disagree 1 3.4 6.9
Agree 7 24.1 31
Strongly agree 20 69 100
Total 29 100
Source: primary data
Figure 15 Employees productivity increase day after day because of adapting work and getting it experience.
This question respondents selected 3.4% strongly disagree, 3.4% disagree, 24.1% agree, and 69% strongly agree that means 69% labors productivity increase day after day.
0%
10%
20%
30%
40%
50%
60%
70%
Strongly disagree Disagree Agree Strongly agree
3.40% 3.40%
24.10%
69.00%
Per
cen
t
Level of respondents
Employees productivity increase day after day because of adapting work and getting it experience

Page | 38
Your company needs advanced technology to improve its productivity
Table 17 Your Company needs advanced technology to improve productivity
Frequency Percent Cumulative Percent
Strongly agree 1 3.4 3.4
Disagree 1 3.4 6.9
Agree 10 34.5 41.4
Strongly agree 17 58.6 100
Total 29 100
Source: primary data
Figure 16 Small industries needs advanced technology to improve its productivity.
The respondents in this question vote 3.4% strongly disagree, 3.4% disagree, 34.5% agree and 58.6% strongly agree, most employees 58.6% identifies that small industries needs advanced technology to improve their productivity.
0%
10%
20%
30%
40%
50%
60%
Strongly agree Disagree Agree Strongly agree
3.40% 3.40%
34.50%
58.60%
Per
cen
t
Level of measurement
Small industries needs advanced technology to improve its productivity

Page | 39
Section D: relationship between labor skills and productivity.
Your company can increase productivity by increasing employee’s skills through training.
Table 18 Small industries can increase productivity by increasing employee’s skills through
training.
Frequency Percent Cumulative Percent
Strongly disagree 0 0 0
Disagree 10 34.5 34.5
Agree 6 20.7 55.2
Strongly agree 13 44.8 100
Total 29 100
Source: primary data
Figure 17 Productivity can increase by increasing employee’s productivity through
training.
There is no respondents selected strongly disagree, 34.5% respondents selected disagree, where 20.7% selected agree and 44.8% selected strongly agree, there is near 45% respondents selected that productivity can increase by increasing employee’s skills through training, there is a 34.5% respondents denied that.
0%
5%
10%
15%
20%
25%
30%
35%
40%
45%
Strongly disagree Disagree Agree Strongly agree
%
34.50%
20.70%
44.80%
Per
cen
t
Level of measurement
Productivity can increase by increasing employee’s productivity through training.

Page | 40
There is a challenge face your company’s productivity because of some tasks need additional or enough skills.
Table 19 There is a challenge face your company’s productivity because of some tasks
needs addition or enough training.
Frequency Percent Cumulative Percent
Strongly disagree 1 3.4 3.4
Disagree 4 13.8 17.2
Agree 13 44.8 62.1
Strongly agree 11 37.9 100
Total 29 100
Source: primary data
Figure 18 Some tasks needs additional training and enough skills.
The respondents of this question tells 3.4% vote strongly disagree, 13.8% disagree, 44.8% agree, and 37.9% selected strongly agree, and there is challenges face productivity in small industries in Bosaso as graph tells 37.9% strongly agree that, where other 44.8% agree that.
3.40%
13.80%
44.80%
37.90%
0%
5%
10%
15%
20%
25%
30%
35%
40%
45%
50%
Strongly disagree Disagree Agree Strongly agree
Pe
rce
nt
Level of measurement
Some tasks needs additional training and enough skills

Page | 41
High skilled labors have greater productivity than unskilled and semi-skilled labors
Table 20 High skilled labors have greater productivity than unskilled and semi-skilled
labors
Frequency Percent Cumulative Percent
Strongly disagree 1 3.4 3.4
Disagree 0 0 3.4
Agree 7 24.1 27.6
Strongly agree 21 72.4 100
Total 29 100
Source: primary data
Figure 19 high skilled labors greater productivity than unskilled.
This graph and table shows there is few respondents 3.4% selected strongly disagree, and there is no respondents selected disagree, 24.1% were selected agree, while most respondents 72.4% selected strongly agree they told labors have high labor skills greater productivity than those have not skills or low skills.
0%
10%
20%
30%
40%
50%
60%
70%
80%
Strongly disagree Disagree Agree Strongly agree
3.40%0.00%
24.10%
72.40%
PER
CEN
T
LEVEL OF MEASUREMENT
high skilled labors greater productivity than unskilled
Page | 42
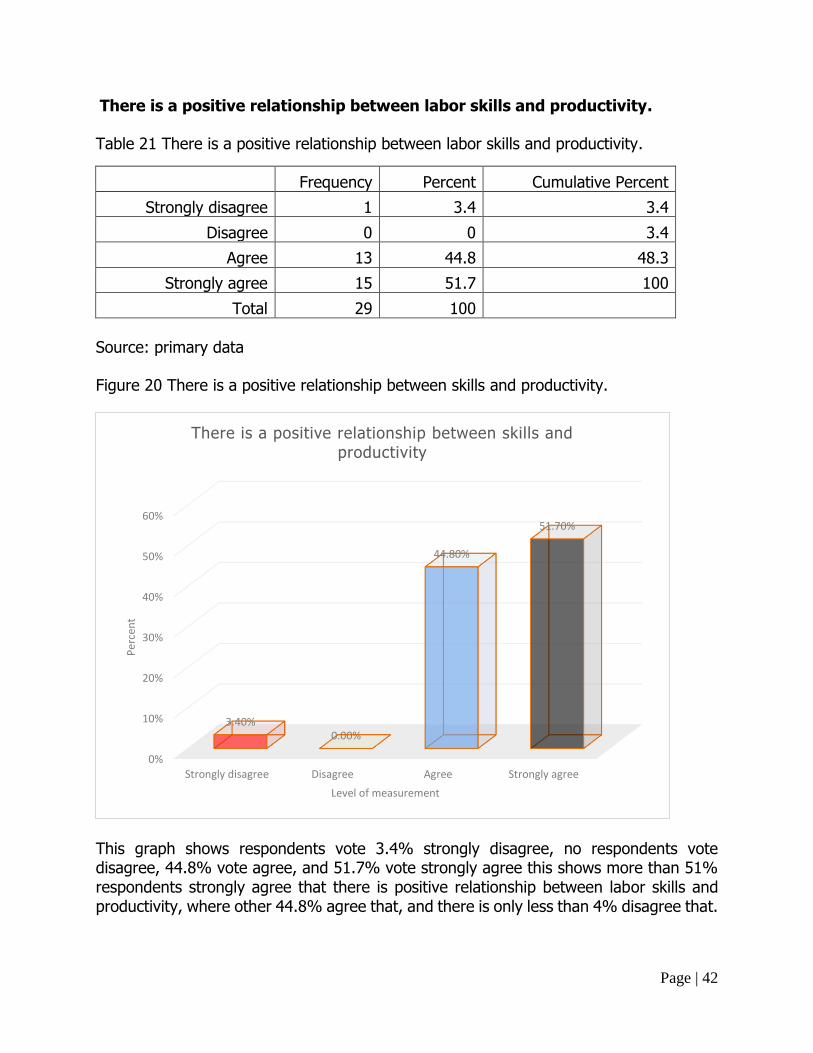
There is a positive relationship between labor skills and productivity.
Table 21 There is a positive relationship between labor skills and productivity.
Frequency Percent Cumulative Percent
Strongly disagree 1 3.4 3.4
Disagree 0 0 3.4
Agree 13 44.8 48.3
Strongly agree 15 51.7 100
Total 29 100
Source: primary data
Figure 20 There is a positive relationship between skills and productivity.
This graph shows respondents vote 3.4% strongly disagree, no respondents vote disagree, 44.8% vote agree, and 51.7% vote strongly agree this shows more than 51% respondents strongly agree that there is positive relationship between labor skills and productivity, where other 44.8% agree that, and there is only less than 4% disagree that.
0%
10%
20%
30%
40%
50%
60%
Strongly disagree Disagree Agree Strongly agree
3.40%0.00%
44.80%
51.70%
Per
cen
t
Level of measurement
There is a positive relationship between skills and productivity

Page | 43
CHAPTER FIVE
FINDINGS, CONCLUSION AND RECOMMENDATIONS
Introduction
This chapter presents the summary of findings, conclusion and recommendations of the results from chapter four as related to the views of scholars in the literature review and the background of the study. The summary and discussion given in this chapter, aim at answering the research questions. The conclusion reached is based on the discussion of the findings. The recommendations are made from the conclusion. The areas of further research have been explored emanating from the questions in the entire study.
Summary of Findings
Respondents’’ Personal Profile:
The study comprises of 29 respondents of whom 100% percent were male and there is no female works small industries in Bosaso. Their level of education included 20.7 percent had not attained any level of education and these were the casual laborers, followed by 37.9 percent with certificates, 20.7 percent with diplomas, 20.7 percent with degrees and lastly there is no master level Of these respondents, 28 percent of the respondents were still single while 72 percent were married.
Level of Labor skills:
The researcher was found that 58.6% employee needs additional training to increase their skills as table 7 and graph 6 indicates, 51.7% labors have skills to use and adapt technology as table 8 and figure7 shows, and 65.5% staff receives training they need when they are new for the work for table 10 and figure.
48.3% employees have opportunities in their workplace to have formal learning as table 12 and figure 11 shows, 37.9% staff of small industries have excellence skills on reading, writing, maths and computer skills.
Level of productivity:
Some findings of productivity are, 61.2% small industries In Bosaso share same goals and values to improve their skills as table 14 and figure 13 defines, 34.5% small industries can increase their productivity through increasing employee’s pay shown by table 15 and figure 13, 58.6% Bosaso small industries needs advanced technology to increase their productivity as table 17 and figure 18 identifies,

Page | 44
Relationship between labor skills and productivity:
The researcher found that 72.4% high skilled labors have greater productivity than semi-skilled and unskilled labors, also there is a 51.7% positive relationship between labor skills and productivity.
Recommendations of the study.
Regular training should be conducted to ensure employees greater productivity through increasing labor skills.
Small industries should use advanced technology since their labors can adapt 51.7% to increase industries’ productivity and should give training labors for new technology to remove some challenges faces small industries.
Small industries should increase employee’s pay such salary and bonus and even holydays because this is encouragement for labors to increase their productivity.
Also small industries are advised to hire skilled labors.
Conclusion
From the study findings there is a positive relationship between labor skills and productivity about 51.7%, this is identifies if labor have high skills means their productivity high and if labor have low skills means their productivity are low, so to increase labor productive should increase labor skills through education, training or experience.
Suggested Further Research
Further research should be carried out to find out the relationship between labor skills and employee remuneration.
Also other research should be carried out to find why local industries failed to their production,
Anticipated problems to the study
While carrying out the study the researcher faced the following problems;
Financial problems in terms of photocopying, secretarial services, transport costs
were faced. However the researcher solicited funds from family and also savings
from work.

Page | 45
The researcher also faced problems of unresponsive respondents in conducting
the research. This was dealt with by giving them ample time to fill the
questionnaires during their free time.
Time frame in which the researcher was required to produce a final report was not
enough. This was dealt with by using the project schedule accurately.
Also there reputation of collecting questionnaire since first questionnaire was
corrupted and filled same levels of responses and it took again to complete correct
questionnaire.

Page | 46
Bibliography
Oko John Ameh (2011) Study of relationship between time overrun and
productivity on construction sites. University of lagos, Nigeria
Sebnem Oguz and Jonathan Knight(2011)Regional economic indicators with a
focus on the relationship between skills and productivity. Office for National
Statistics.UK
Allister Slingenberg Koen Rademaekers Ekim Sincer Ruud van der Aa (2008)
Environment and labour force skills Final report. ECORYS Nederland BV Rotterdam
Arnaud Dupuy and Philip S. Marey(2007) Shifts and Twists in the Relative
Productivity of Skilled Labor. Germany IZA Discussion Paper No. 2694
The Conference Board(2014) Global Productivity Slowdown Moderated in 2013 –
2014 May See Better Performance The Conference Board, Inc.Inc.
Vilasini P P G N, Gamage J R, Kahangamage U P and ThibbotuwawaNLow
Productivity and Related Causative Factors: A Study Based on Sri Lankan
Manufacturing Organisations.
Eocd(2001) Measuring Productivity, MEASUREMENT OF AGGREGATE AND
INDUSTRY-LEVEL PRODUCTIVITY GROWTH. OECD Manual.
Cowan, Ruth Schwartz (1997), A Social History of American Technology, New York:
Oxford University Press, p. 179, ISBN 0-19-504605-6
Crown (2006)Prosperity for all in the global economy - world class skills. Published
with the permission of HM Treasury on behalf of the Controller of Her Majesty ’s
Stationery Office.

Page | 47
ILO(2012)INTERNATIONAL STANDARD CLASSIFICATION OF OCCUPATIONS
ISCO-08.International Labour Organization.Geneva
Report prepared by the Centre for the Study of Living Standards forThe Atlantic
Canada Opportunities Agency(March 1998) about Productivity: Key to Economic
Success
NiringiyeAggrey, LuvandaEliab and ShitunduJosep (2010)human Capital and Labor
Productivity in East African Manufacturing Firms. Kampala Uganda, Maxwell
Scientific Organization
Amin,m,E (2005) social science research: concept methologlyanalysis.
Makarerey.University Kampala.
Mugenda and mugenda (2003) research methods, Kenyatta university printers.
Mooney A L (2000) sampling approaches and collective thinking
Salkind, N.(2000).Exploring research. New York: Macmillan Publishing Co
Organizations for Economic Co- operation and development (OECD) (1996):
development co-Operation report, OECD,
Krejcie,R.V&morgan, D. W.(1970) “ Determining sample Size for research
Activities’’ Educational and psychological measurement services. Towards synergy,
world institute for Development economics research limited.

Page | 48
APPENDIX I: QUESTIONNAIRE
Dear respondents,
I am Mohamed Ahmed Saalah a bachelor of Economics student of East Africa University carrying out a study on the impact of labor skills on the productivity in small industries in Bosaso Puntland Somalia as case study for Ilo-Tango Company.
I humbly request you to spare some few minutes of your time and answer these questions below.
The study is strictly for academic purposes and will be treated with utmost confidentiality.
Your cooperation is highly appreciated.
Section A
Please tick in the boxes provided
Personal data
1. Gender of the respondents
a) Male
b) Female
2. Respondents level of education
a) Certificate
b) Diploma
c) Degree
d) Masters
e) None of the above
3. Marital status
a) Single
b) married
4. Age
a) 20 – 30

Page | 49
b) 30 – 40
c) 40 – 50
d) 50 – above
5. How long have you been working here
a) Less than- 1 year
b) 1 year – 2 years
c) 2 years – 3 years
d) 3 years – over

Page | 50
Section B
Labor skills
Direction: Please describe the level of labor skills in your organization and respond to each item by using the scoring guide below. Kindly write your best choice in the space before each item. Be honest about your options as there is no right or wrong answers.
Score Response Description
4 Strongly Agree You agree with no doubt at all
3 Agree You agree with some doubt
2 Disagree You disagree with some doubt
1 Strongly Disagree You disagree with no doubt at all
Question 1 2 3 4
6 Employee needs additional training to increase their
skills
7 All the employees in your company have skills to use
and adapt technology
8 Skills can receive through Education, Training or Experience
9 Staff receives the training they need when they are new for the work of your company.
10 You contact your staff/managers by Telephone, mail
or a letter
11 There are opportunities in your workplace for all staff
to have formal learning (e.g. Industry qualifications,
job specific training).
12 All staff have excellence skill on reading, writing,
maths and computer skills

Page | 51
Section C
Productivity
1: strongly disagree 2: disagree 3: agree 4: strongly agree
Question 1 2 3 4
13 Your staff share the same goals and values to
improve your productivity
14 Your company can increase productivity through
increasing employee’s pay
15 Your productivity increase day after day because of
adapting work and getting it experience.
16 Your company needs advanced technology to
improve its productivity.
Section D
Relationship between Labor skills and productivity
1: strongly disagree 2: disagree 3: agree 4: strongly agree
Question 1 2 3 4
17 Your company can increase productivity by
increasing employee’s skills through training.
18 There is a challenge face your company’s productivity because of some tasks need additional or enough skills.
19 High skilled labors have greater productivity than unskilled and semi-skilled labors
20 There is a positive relationship between labor skills and productivity
THANK YOU VERY MUCH FOR YOUR COOPERATION

Page | 52
APPENDIX II TIME FRAME
Activity Sep Oct Nov Dec Jan Feb Mar Apr May Jun Jul Aug
Topic selection
Proposal writing
Distribution of
questionnaires
and interview
guides (data
collection)
Editing and coding
Data entry
Data presentation
and interpretation
of findings
Presentation of
1st draft Thesis
Correction of the
draft Thesis
Submission of final
report
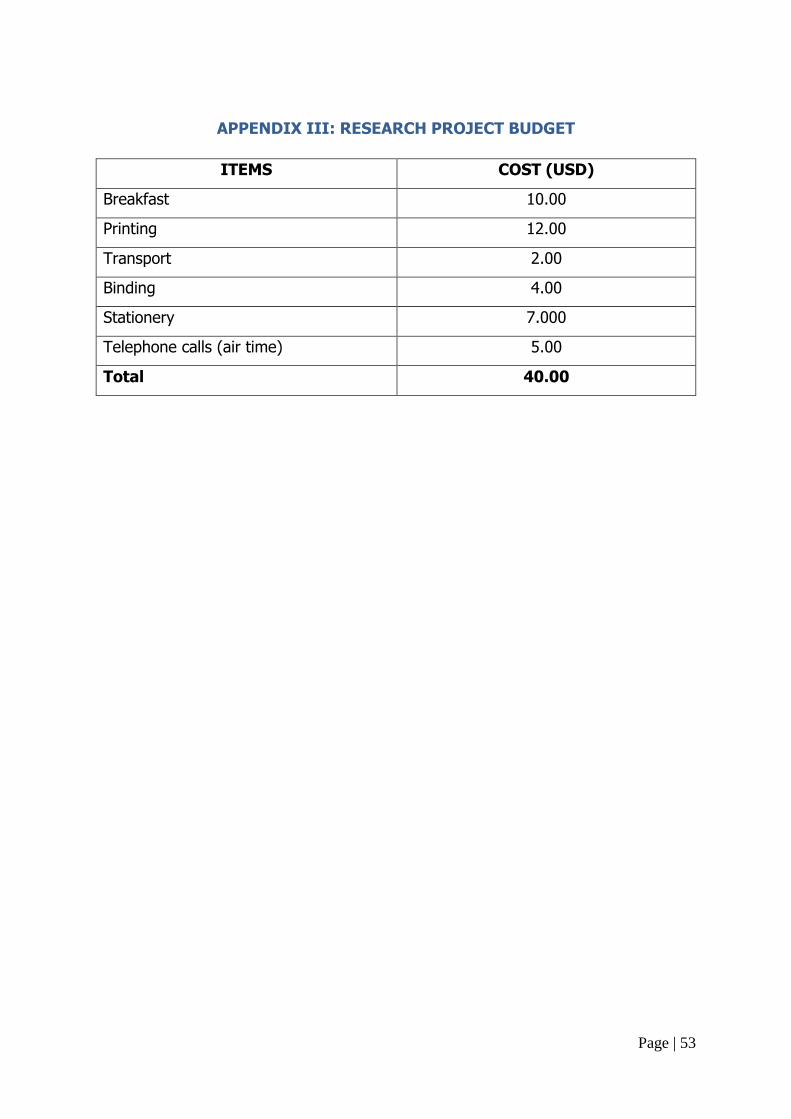
Page | 53
APPENDIX III: RESEARCH PROJECT BUDGET
ITEMS COST (USD)
Breakfast 10.00
Printing 12.00
Transport 2.00
Binding 4.00
Stationery 7.000
Telephone calls (air time) 5.00
Total 40.00

Page | 54
APPENDIX IV Shots of Ilo-tango when data collecting.

Page | 55

Page | 56