guyana: poverty reduction strategy paper …guyana: poverty reduction strategy paper progress report...
TRANSCRIPT

© 2006 International Monetary Fund October 2006 IMF Country Report No. 06/364
Guyana: Poverty Reduction Strategy Paper Progress Report 2005
Poverty Reduction Strategy Papers (PRSPs) are prepared by member countries in broad consultation with stakeholders and development partners, including the staffs of the World Bank and the IMF. Updated every three years with annual progress reports, they describe the country’s macroeconomic, structural, and social policies in support of growth and poverty reduction, as well as associated external financing needs and major sources of financing. This country document for Guyana is being made available on the IMF website by agreement with the member country as a service to users of the IMF website.
To assist the IMF in evaluating the publication policy, reader comments are invited and may be sent by e-mail to [email protected].
Copies of this report are available to the public from
International Monetary Fund • Publication Services 700 19th Street, N.W. • Washington, D.C. 20431
Telephone: (202) 623-7430 • Telefax: (202) 623-7201 E-mail: [email protected] • Internet: http://www.imf.org
Price: $18.00 a copy
International Monetary Fund
Washington, D.C.


VERTY REDUCTION STRATEGY – PROGRESS REPORT 2005
AACCRROONNYYMMSS
ACP African, Caribbean and Pacific States AIDS Acquired Immune Deficiency Syndrome AML/CFT Anti Money Laundering/Combating the Financing of Terrorism API Annual Production Incentive ARV Antiretroviral Therapy BCCP Basic Competency Certificate Programme BEAMS Basic Education Access & Management Support BCGI Bauxite Company of Guyana Inc. BNTF Basic Needs Trust Fund BoG Bank of Guyana BSCP Building Social Cohesion Programme BSD Bank Supervision Department CARICOM Caribbean Community CBO Community Based Organisation CDB Caribbean Development Bank CDC Community Development Council CH&PA Central Housing & Planning Authority CIDA Canadian International Development Assistance CJIA Cheddi Jagan International Airport COTED Council of Trade and Economic Development CPCE Cyril Potter College of Education CRFM Caribbean Regional Fisheries Management CSO Civil Society Organisation CXC Caribbean Examinations Council D&I Drainage and Irrigation DFID Department for International Development DOTS Direct Observed Treatment IDA International Development Association E-HIPC Enhanced Heavily Indebted Poor Country Initiative EPA Environmental Protection Agency EPMU Expenditure Programming Management Unit ERC Ethnic Relations Commission EU European Union FAO Food and Agriculture Organisation FDI Foreign Direct Investment FIA Financial Institutions Act
VERTY REDUCTION STRATEGY – PROGRESS REPORT 2005
GBET Guyana Basic Education Teacher Training Programme GDP Gross Domestic Product GEAP Guyana Education Access Project GGMC Guyana Geology and Mines Commission GIS ARCVIEW Geographic Information System GIS/SME Geographical Information System/School Mapping Exercise GLSC Guyana Lands and Survey Commission GMA Guyana Manufacturing Association GNBS Guyana National Bureau of Standards GNCB Guyana National Cooperative Bank GOG Government of Guyana GOINVEST Guyana Office for Investment GPAS Guyana Protected Area System GPF Guyana Police Force GPHC Georgetown Public Hospital Corporation GPL Guyana Power and Light GRA Guyana Revenue Authority GT&T Guyana Telephone and Telegraph Company GUYSUCO Guyana Sugar Corporation GUYWA Guyana Water Authority GWI Guyana Water Incorporated HIES Household Income and Expenditure Survey HIPC Heavily Indebted Poor Country Initiative HIV Human Immuno-deficiency Virus IAST Institute of Applied Science & Technology ICT Information and Communications Technology IDB Inter-American Development Bank IFMAS Integrated Financial Management Accounting System IMF International Monetary Fund IPED Institute of Private Enterprise Development IRA Interactive Radio Instruction ISO International Standards Organisation IT Information Technology LEAF Linden Economic Advancement Fund LEAP Linden Economic Advancement Project LINMINE Linden Mining Company LSMS Living Standards Measurement Survey LTR Land Tenure Regularisation M&E Monitoring and Evaluation

VERTY REDUCTION STRATEGY – PROGRESS REPORT 2005
MDGs Millennium Development Goals MIS Management Information System MLHSS Ministry of Labour, Human Services and Social Security MoE Ministry of Education MoF Ministry of Finance MoH Ministry of Health MoHW Ministry of Housing and Water MOU Memorandum of Understanding NCERD National Centre for Educational Resources and Development NDC Neighbourhood Development Council NDDP National Dairy Development Programme NGMC New Guyana Marketing Corporation NGO Non Governmental Organisation NHP National Health Plan NIS National Insurance Scheme NPTB National Procurement and Tender Board OAS Organisation of American States OBMI Omai Bauxite Mines Inc. PAHO Pan American Health Organisation PCMS Project Cycle Management System PCPMU Policy Coordination and Programme Management Unit PCU Project Cycle Unit PEU Project Execution Unit PLWHA Persons Living with HIV/AIDS PMTCT Prevention of Mother to Child Transmission PPC Public Procurement Commission PRGF Poverty Reduction Growth Facility PRS Poverty Reduction Strategy PRSP Poverty Reduction Strategy Paper PSCES Parliamentary Sectoral Committee on Economic Services PSM Public Service Ministry RDCs Regional Democratic Councils RUSAL Russion Aluminium Company SIMAP Social Impact Amelioration Program SIP School Improvement Plans SMIS School Management Information System SSRP Secondary Schools Reform Programme TB Tuberculosis TIN Tax Identification Number
VERTY REDUCTION STRATEGY – PROGRESS REPORT 2005
TVET Technical and Vocational Education and Training UG University of Guyana UNDP United Nations Development Programme VAT Value Added Tax WB World Bank WHO World Health Organisation WWF World Wildlife Fund
EXECUTIVE SUMMARY ……………………………… i
C H A P T E R 1
The Domestic Environment ……………………………… 1The External Situation ……………………………… 1Major Challenges ……………………………… 2
……………………………… 3Organisation of the Report ……………………………… 3
C H A P T E R 2
Introduction ……………………………… 5Measuring Poverty ……………………………… 5Poverty Trends ……………………………… 6
Population ……………………………… 6Tenure Status of Dewlings ……………………………… 8Water ……………………………… 8Sanitation ……………………………… 9Electricity ……………………………… 9Education ……………………………… 9Health ……………………………… 11Labour Force Participation ……………………………… 12
Poverty and Vulnerability ……………………………… 12Disability ……………………………… 13Geographic Distribution of Access ……………………………… 13HIV/AIDS ……………………………… 14
C H A P T E R 3Review of the Economy, Governance and Institutional and Regulatory Framework The Macro Economic Framework ……………………………… 15
Prudent Macroeconomic Policies ……………………………… 15Debt Management ……………………………… 16Fiscal and Monetary Reforms ……………………………… 17
Creating Opportunitiies for Private Sector Growth ……………………………… 18Investment Promotion ……………………………… 18Export Promotion ……………………………… 19Expanding the Economic Base to Benefit the Poor ……………………………… 20
Restructuring and Modernising the Traditional Sector ……………………………… 20Agriculture ……………………………… 20Rural Agriculture ……………………………… 20The Sugar Sub-Sector ……………………………… 21
Introduction: The Context
Guyana’s Long Term Poverty Profile & Trends
Achieving PRSP Targets and the Millenium Development GoalsTA
BLE
OF
CO
NTE
NTS
The Rice Sub-Sector ……………………………… 21Forestry Sector ……………………………… 24Mining Sector ……………………………… 24
Developing New Sectors to Support Growth ……………………………… 25Institutional and Regulatory Reforms ……………………………… 25
Reforms to Enhance the Business Environment ……………………………… 25Land Development and Allocation ……………………………… 27Public Accountability & Governance ……………………………… 28Local Government ……………………………… 29Decentralisation of Public Services ……………………………… 29The Justice System & Crime Prevention ……………………………… 30The Disciplined Forces Commission ……………………………… 31
C H A P T E R 4
Investment in Human Capital ……………………………… 33Education ……………………………… 34
……………………………… 35Teacher Training ……………………………… 35Improving Equity in the Education Sector ……………………………… 36Increasing the Level of Commitment of Students, Parents & Communities ……………………………… 37Strengthening Financial & Management Systems ……………………………… 37National Assessments ……………………………… 37
Health ……………………………… 38The Legislative Framework ……………………………… 38Human Resources Development ……………………………… 38
Doctors ……………………………… 39Nurses ……………………………… 41Medexes ……………………………… 41
Improving & Expanding Health Infrastructure ……………………………… 42Drug Procurement & Distribution ……………………………… 42Technological Capacity ……………………………… 43Health Promotion ……………………………… 43
Water ……………………………… 43Housing ……………………………… 44Social Safety Nets ……………………………… 45
Social Impact Amelioration Programme (SIMAP) ……………………………… 46Basic Needs Trust Fund (BNTF) ……………………………… 47
The Environment ……………………………… 47Conservation & Sustainable Use of Biodiversity ……………………………… 47Environmental Management ……………………………… 48Education Information & Training ……………………………… 49Support Systems ……………………………… 49
TAB
LE O
F C
ON
TEN
TS
Improvement in the Quality of the Delivery of Education
Investment in Human and Social Services

C H A P T E R 5
Sea Defences ……………………………… 50Roads & Bridges ……………………………… 50River Transport ……………………………… 51Air Transport ……………………………… 51Drainage and Irrigation ……………………………… 51Maritime Affairs ……………………………… 51Unserved Areas Electrification Programme ……………………………… 52Special Intervention Strategies ……………………………… 52
Hinterland Development ……………………………… 52Region 1 – Barima-Waini ……………………………… 53Region 8 – Potaro-Suparuni ……………………………… 53Region 9 – Upper Takatu-Upper Essequibo ……………………………… 54Region 10– Upper Demerara -Upper Berbice ……………………………… 54Linden Economic Advancement Programme ……………………………… 55
C H A P T E R 6
The Progress Report Consultation Process ……………………………… 56Regional Consultations ……………………………… 56Parliamentary Consultations ……………………………… 57Dissemination of the Draft Report and Leaflets ……………………………… 57Public Awareness ……………………………… 57Participation and Feedback ……………………………… 58
Feedback from Public Consultations ……………………………… 58
C H A P T E R 7
The Context ……………………………… 65Medium Term Macroeconomic Outlook ……………………………… 65The Investment Programme ……………………………… 69Policies and Reforms to Promote Growth ……………………………… 70
……………………………… 70Agriculture ……………………………… 70
Rural Agriculture, Fishing and Livestock Sub-Sectors ……………………………… 70The Sugar Sub-sector ……………………………… 72
Skeldon Factory ……………………………… 72Cogeneration ……………………………… 72Cane Production ……………………………… 72
Forestry ……………………………… 73
Accelerating the Restructuring and Modernisation of Traditional Sectors
The Poverty Reduction Programme: Medium Term Prospects
Infrastructure to Support Growth
Public Consultations and Feedback
TAB
LE O
F C
ON
TEN
TS
Mining ……………………………… 73Tourism ……………………………… 73
Improving Competitiveness ……………………………… 74Implementing Tax and Expenditure Reforms ……………………………… 74Monetary and Financial Sector Reforms ……………………………… 75Export Promotion ……………………………… 75Investment Promotion ……………………………… 76Governance and Institutional Regulatory Reforms ……………………………… 77
Improving Transparency and Accountability ……………………………… 77Procurement Reforms ……………………………… 77Land Tenure Security & Land Administration ……………………………… 78Local Government ……………………………… 78Reducing Crime and Improving Justice Administration ……………………………… 78Improving Political Governance ……………………………… 80
C H A P T E R 8
Sea Defences ……………………………… 83The Transport Sector ……………………………… 83
……………………………… 84Air Transport ……………………………… 84River Transport ……………………………… 85
Unserved Areas Electrification Programme (UAEP) ……………………………… 85Drainage and Irrigation ……………………………… 85Telecommunications ……………………………… 87The Environment ……………………………… 87Medium Term Social Sector Programme ……………………………… 87
Education ……………………………… 88Improving the Quality of the Delivery of Education ……………………………… 89
Teacher Taining ……………………………… 89Improving Levels of Literacy and Numeracy ……………………………… 89
Improving Equity in the Education Sector ……………………………… 90
……………………………… 90Strengthening the Ministry of Education ……………………………… 91
Health ……………………………… 91Training ……………………………… 92Infrastructure & Technological Capacity ……………………………… 92Accelerating Health Sector Reforms ……………………………… 92Legal Framework ……………………………… 92Regulatory & Quality Assurance Systems ……………………………… 93Health Promotion & Primary Health Care ……………………………… 93Maternal & Child Health ……………………………… 93Disease Control ……………………………… 94
HIV/ AIDS ……………………………… 94
Roads
Increasing the Level of Commitment of Students, Parents & Communities
Infrastructure Development to Support Growth and Social Services: The Medium Term
TAB
LE O
F C
ON
TEN
TS

TB and Malaria ……………………………… 94Other Diseases ……………………………… 94
Dental & Eye Care Services ……………………………… 95Health Information System ……………………………… 95
Sanitation ……………………………… 95Water ……………………………… 95Housing ……………………………… 97Social Safety Nets ……………………………… 97
SIMAP ……………………………… 97Hinterland Development ……………………………… 98Special Intervention Programmes ……………………………… 98
Region 1 – Barima-Waini ……………………………… 99Region 8 – Potaro- Suparuni ……………………………… 100Region 9 – Upper Takatu-Upper Essequibo ……………………………… 100Region 10 – Upper Demerara-Upper Berbice ……………………………… 101LEAP ……………………………… 102
Sports Facilities: The Cricket Stadium ……………………………… 102
C H A P T E R 9
Analysis of the Poverty Indicators ……………………………… 104Data & Programme Monitoring ……………………………… 106
PRS M&E Unit ……………………………… 107Training ……………………………… 112Applied Budget Analysis ……………………………… 113Skills Register ……………………………… 113Citizen Report Cards ……………………………… 113Expansion of Regional Committees ……………………………… 113Strengthening the Feedback Mechanism ……………………………… 113
Steering Committee ……………………………… 114Focal Point in Ministries and Agencies ……………………………… 114Thematic Groups ……………………………… 114PRS Regional Committees ……………………………… 115
The Bureau of Statistics ……………………………… 115
C H A P T E R 10
National Consensus ……………………………… 117Civil Society ……………………………… 117Policies and the Economy ……………………………… 117
Implementation Capacity ……………………………… 117Availability of External Resources ……………………………… 118Developments in the World Economy ……………………………… 118Natural Disasters ……………………………… 119
Monitoring and Evaluation
Risks to the Strategy
TAB
LE O
F C
ON
TEN
TS
C H A P T E R 11
……………………………… 120
Population, 1980-2002 ……………………………… 7
Dwellings, 1980-2002 ……………………………… 8
Safe Water, 1990 & 2002 ……………………………… 8
Access to Improved Sanitation by Region, 1991-2002 ……………………………… 9
Highest Level of Education by Region, 1990-2002 ……………………………… 10
Primary and Secondary Enrollment Rates, 1980-2002 ……………………………… 10
Key Health Indicators, 1980-2002 ……………………………… 11
Principle Activity of Population - 15 Years & Older by Sex, 1980-2002………..….. 12
……………………………… 16
……………………………… 22
Guyana- Summary Indicators of Violence/Crime, 2001-2004………………………. 31
Central Government Social Spending by Sector, 1997-2004……………………….. 33
Key Education Indicators, 2000-2004 ……………………………… 34
Doctors in the Public Sector ……………………………… 39
Key Water Indicators, 2001-2004 ……………………………… 44
Land Distribution & Housing Indicators, 2001-2004 ……………………………… 45
Public Consultations, Participants by Regions, 2005 ……………………………… 58
National Level Analysis of Feedback Forms by Sector ……………………………… 59
Key Medium Term Economic Indicators, 2003-2009 ……………………………… 67
Guyana:Public Sector Investment Programme, 2004-2009…………………………. 82
Projected Social Sector Spending, 2004-2009 ……………………………… 88
Guyana-PRSP Indicators, 2000-2004 ……………………………… 103
LIST
OF
TAB
LES
4.5
4.4
Guyana-Key Economic Indicators, 1998-2004
Rice Production & Export Statistics, 1999-2004
Summary and Conclusions
4.3
9.1
8.2
8.1
7.1
6.2
3.1
2.3
4.1
3.3
6.1
4.2
2.6
2.5
2.4
3.2
2.8
2.1
2.7
2.2

Guyana- Revised Quantitative Goals of the PRS, 2004-2009……………………… 106
Monitoring & Evaluation Work Programme ……………………………… 1109.3
9.2
FIG
UR
ES
Trends In Investment and Expenditure
……………………………… 70
……………………………………………
The Impact of Guyana's National Disaster on Poverty………………………….. 66
External Borrowing & Debt Sustainability ……………………………… 68
Mobilising Private Initiative ……………………………… 84
Can Guyana Achieve the Millenium Development Goals?............................. 107
Monitoring Outcomes of the Poverty Reduction Programme…………………… 108
Annex A Policy Matrix 2004
Annex B Policy Matrix 2005-2007
Annex C Regional Feedback Reports
Annex D Feedback Forms
Annex E Macroeconomic Projections
Annex F Public Sector Investment Programme, 2000 - 2004; 2004-2009
Annex G List of Invitees to the National Review
AN
NEX
ES
7.1
BO
XES
Box 5
Box 4
Box 3
Box 2
Box 1
POVERTY REDUCTION STRATEGY – PROGRESS REPORT 2005
i
EEXXEECCUUTTIIVVEE SSUUMMMMAARRYY
Introduction
This second annual progress report covers the periods from January through December 2004, and January 2005 to December 2009. It reflects Guyana's achievements and shortcomings in the implementation of the Poverty Reduction Strategy (PRS), and presents an action plan for 2005 and beyond. Despite the continued vulnerability of the economy to exogenous shocks, the inadequacy of infrastructure and the weakness of existing institutional capacity, there has been considerable progress in actions and reforms initiated by the Government within the framework of poverty reduction strategy. After three years of implementation, the PRS has become established as the overall framework for sector strategies and increasingly, has been used to focus partners’ contributions around the Government's priorities.
The Issues and Challenges
The key issues identified in the 2004 Poverty Reduction Strategy Progress Report included the (i) difficult external environment, (ii) low absorptive capacity, (iii) challenging sociopolitical conditions, and (iv) the weak monitoring and evaluation of the poverty reduction strategy programme. Although some success was achieved, many of these problems persist. In addition, 2004 and 2005 presented unique setbacks. For an oil dependent country, the oil price hikes in 2004 adversely impacted the cost of living, external balances and the competitiveness of Guyana’s products on the world market. Further, in late December 2004 and the first half of January 2005, Guyana experienced a national disaster with possible long-term implications. Unprecedented rainfall and accompanying flooding resulted in the displacement of 70,000 households and caused economic damage in excess of 57 percent of GDP, that is projected to cost US$200-300 million in recovery and reconstruction. Other issues presented different challenges for the Government. First, political instability exacerbated by pockets of organized and violent crime persist and must not be allowed to derail Guyana’s development agenda; second, domestic investments continue to be low and concerted efforts will have to be made to market Guyana’s substantial natural resources and strategic geographic location to the international investment community; finally, additional resources will have to be mobilized for Guyana to continue to improve its productive capacity, and to improve and maintain its infrastructure. Population and Poverty Trends Guyana’s population over the last 20 years has changed marginally. At 751,223 in 2001, it was actually 35,894 or 1.2 percent below the 1980 population. Underlying what appears to be a minor change over the past 20 years, however, are major shifts in inter-census data and regional changes in population. Between 1980 and 1990, the population fell by 4.8 percent.

POVERTY REDUCTION STRATEGY – PROGRESS REPORT 2005
ii
With natural rate of increase of 1 percent per year, this represented about a 15 percent decline in Guyana’s population. Between 1990 and 2001, the population increased by 3.8 percent, much less than the cumulative natural rate of increase. In part, the decline in the population was a result of the high levels of migration brought about by the harsh economic, social and political conditions that prevailed especially in the period 1980 and 1990. Consistent with the difficult economic conditions, poverty was pervasive in the 1980s. A survey carried out in 1971 by the Pan American Health Organisation found 38 percent of the population living below the poverty line. In 1988, Boyd found that about 65 percent of the population lived below the poverty line and in a World Bank Living Standards Measurement Survey (LSMS) conducted in 1993, about 43 percent of the population was found to live below the poverty line. The 1999 UNDP Living Conditions Survey (LCS) placed the population under absolute poverty at 38 percent. Although different methodologies were used to calculate poverty, the trend seems to indicate that poverty is on the decline from the 1980 levels. Even so, the low and/or negative growth rates over the last 5 years may adversely affect poverty indicators. However, there is no recent data to determine the level of poverty. A Household Income and Expenditure Survey will begin in September 2005 and the results of this will become available in 2006. In the absence of any recent poverty measurements, the report examines trends in access to basic needs indicators as a way to measure the standards of living in Guyana. In this context, indicators derived from the 2002 census data are compared with similar data in 1991 and 1980. The data shows substantial progress in access to basic needs in the areas of health, education, water and housing, among other indicators.
The 2004 Poverty Programme
Economic Performance and Structural Reforms Guyana continued to pursue prudent macroeconomic policies in 2004. The economy grew at 1.6 percent reversing the negative growth of 2003. Despite the steep rise in oil prices and its impact on the productive sector and services, the consumer price index registered a growth of 5.5 percent, which was slightly higher than the 4.9 percent recorded in 2003. The deficit of the current account of the balance of payments improved from 11.3 percent of GDP in 2003 to 10 percent of GDP in 2004 on account of higher exports, and despite the steep rise in fuel prices. The Government continued to implement structural reforms to improve its macroeconomic framework and lay the basis for sustained growth. To this end, the Financial Institutions Act and the Bank of Guyana Act were amended to strengthen supervision and fiduciary oversight in the financial sector. The Bank of Guyana also continued to make substantial progress in banking supervision and prudential regulations. The Government began to implement the Fiscal Management and Accountability Act (FMAA) with the passage of its regulations in

POVERTY REDUCTION STRATEGY – PROGRESS REPORT 2005
iii
December 2004, and the Integrated Financial Management System (IFMAS) became operational in January 2004. The Government also continued to implement its tax reform plan with the passage of the Fiscal Enactments (Amendment) Act and the Customs Duties (Amendment) Order. The new Internal Affairs Division at the Guyana Revenue Authority was mandated to investigate corrupt practices and complaints against employees, and surveillance equipment was installed at the Cheddi Jagan International Airport and the Customs Transit Sheds. In 2004, the expansion of many new sectors supported economic growth. Significantly, in the Information and Communications Technology Sector, GoInvest and the Office of the Prime Minister facilitated seven investments resulting in the creation of two hundred and sixty-two new direct jobs. The Government continued to improve the institutional and regulatory frameworks with a view to enhancing the business environment for private sector investment and sustained growth. The key reforms that were implemented covered the areas of legislation, public sector reform, land development and allocation. Regulatory and Institutional Reforms The Government implemented an ambitious legislative and regulatory reform agenda to advance its support for economic growth. The Ministry of Tourism, Industry and Commerce began drafting the Competition and Fair Trading Bill to (i) promote, maintain, and encourage competition and enhance economic efficiency in production, trade, and commerce; (ii) prohibit anti-competitive business conduct which prevents, restricts or distorts competition or constitutes the abuse of a dominant position in the market; and (iii) to promote the welfare and interests of consumers. In addition, private sector commercial activity continues to be facilitated through the processing of trade licenses, efforts to address CARICOM Common External Tariff waiver requests and assess local impacts of external trade policies. Other important legal and regulatory laws that were passed in 2004 included:
• the Small Business Act to facilitate the establishment of a small business council, a small business bureau and a small business development fund;
• the Investment Act to stimulate the socio-economic development of Guyana and to attract and facilitate investment; and
• the Technical and Vocational Education and Training Act. Within the mining sector, a complete redrafting of the Mining Regulations took place in 2004. Mine Safety and Health Regulations were also drafted via the Ministry of Labour and Social Security and the International Labour Organization, and await final inter-agency review.

POVERTY REDUCTION STRATEGY – PROGRESS REPORT 2005
iv
Substantial progress was made by the Guyana National Bureau of Standards (GNBS) in developing, implementing and coordinating several reforms to improve product quality for domestic consumption and exportation in 2004. Eight sector committees of the National Committee on Conformity Assessment were established, and a plan of action was developed for the establishment of a National Conformity Assessment System. Two Caricom Standards for the Specification of Rum and the Specification for Labelling of Brewery Products were adopted as national standards. Three laboratories in Guyana developed their laboratory management systems to meet the requirements of the ISO 17025 standard for accreditation. The Guyana Lands and Surveys Commission (GLSC) computerized the application and lease issuance processes, allowing for monitoring, evaluation and the disaggregation of applications and titles issued. The parcel database was computerized using the geographic information systems software ARCVIEW. The Commission’s financial sustainability function was also automated using ACCPAC, allowing for networking between the finance and lease issuance divisions through the rent portfolio, as well as the tracking of revenues against costs. Associated with reforms ongoing at the GLSC, significant progress was made towards strengthening the Deeds Registry through enhancement of its physical structure and IT capabilities, the training of staff, and the identification and revision of laws and procedural aspects of laws necessary to facilitate more efficient functioning of the Registry. Public Accountability and Governance In public accountability and governance, measures were taken to create a unified platform for greater oversight of the Executive. To this end, several parliamentary committees were appointed and/or established. Further, efforts were made to promote capacity building and institutional strengthening within the local government system. A Municipal Services Department of the Local Government and Regional Development, which oversees maintenance and development of infrastructure within the six municipalities, was established. To improve accountability, eight Regional Development Officers were appointed to monitor and evaluate capital works contracts within the various Regional Democratic Councils. Even so, the work of the Ministry continues to be hampered by resource constraints, including inadequate staffing and a lack of equipment such as computers and printers. Some public services were decentralized to provide ease of access. The Ministry of Home Affairs established branches of the General Registrar’s Office in New Amsterdam and Anna Regina for the issuance of birth and death certificates, and the issuance of passports is now the responsibility of the Immigration Units within the Police Divisions of these two counties. In addition, the General Registrar’s Office in collaboration with the Ministry of Amerindian Affairs undertook an outreach exercise to Regions 1, 8 and 10 to register persons and issue birth certificates for hinterland communities. Collaboration with the Guyana Geology and
POVERTY REDUCTION STRATEGY – PROGRESS REPORT 2005
v
Mines Commission (GGMC) has also resulted in the registration and issuance of work permits to foreign miners working in Guyana’s hinterland. Internal Security To confront and suppress violent crime in 2004, the Government of Guyana, through budgetary allocations, provided the Guyana Police Force with resources necessary to improve the organisation’s operational capacity. Several police stations were repaired and/or fortified, and a new station was designed for Sophia. The Guyana Prison Service is implementing its 2001-2011 Strategic Plan, which prioritises the use of Information Technology to improve its administrative and operational efficiency. The health of prisoners and the prison environment was improved with the provision of prophylactics for malaria, filaria, small pox and other infectious diseases. Health education for staff and inmates is ongoing, and an important component of this programme focuses on HIV/AIDS. Investment in Human Capital Guyana continues to make strides in developing its human and social infrastructure. Social sector spending as a share of GDP is perhaps one of the highest in the Western Hemisphere and in E-HIPC countries. In 2004, social sector spending was 19.9 percent of total expenditure. Recurrent expenditures, and in particular, material and supplies and personal emoluments accounted for more than half of spending. In Education, the Curriculum Development Unit of the National Centre for Educational Resource Development (NCERD) developed literacy and numeracy standards for Nursery 1 to Grade 2 Primary. The NCERD trained 201 head teachers and the Cyril Potter College of Education began delivering the teacher training certificate programme by distance education. Progress was also made in increasing the number of students who are in General Secondary School and who have an opportunity to take Secondary School Certificate Examination. In addition, the Basic Competency Certificate Programme (BCCP), an alternative pathway for secondary students with high academic qualifications and an interest in technical subjects was launched in six pilot schools. In Health, several pieces of legislation were drafted to modernize the sector. The Ministry of Health Bill and the Health Promotion and Protection Bill seek to amend or replace existing laws and regulations in order to make them applicable to contemporary and emerging situations; introduce new laws and regulations to provide a comprehensive and more appropriate legal framework for the functioning of the sector; and improve the quality of health care and protection. In the area of human resources development, staff was retrained and health specialists were recruited from abroad. Still, there are severe shortages of nurses and doctors, especially in hinterland regions. The ongoing strengthening of the Medex programme through recruitment and training will provide some relief, especially to Amerindian communities. Further, the
POVERTY REDUCTION STRATEGY – PROGRESS REPORT 2005
vi
procurement of drugs, materials and supplies was improved with the establishment of the Materials Management Unit, and storage facilities were improved with the acquisition of two refrigerators and the construction of the first phase of a refrigerated vaccine storage bond. In the Water sector, rehabilitation projects resulted in the improvement of service to over 40,000 persons. And in Housing, the Central Housing and Planning Agency (CHPA) redefined its policy framework with a view to strengthening shelter and land markets, expediting the divesture of public land for residential settlement, and accelerating squatter area regularization. In social safety nets, three important studies, including a (i) programme targeting study; (ii) risk and vulnerability assessment; and (iii) Guyana Labour Market study were completed. An action plan for the implementation of these studies is under preparation.
Infrastructure to Support Growth
The Government continued to place emphasis on improving its economic infrastructure. In line with this objective, 68 bridges and 26 culverts were rehabilitated, the rehabilitation of the Mahaica-Rosignol Road accelerated, and the four-lane highway from the Demerara Habour Bridge to Ruimveldt is 65 percent complete. Feasibility studies were also completed for the New Amsterdam-Moleson Creek Road and the South Entrance to Georgetown. To sustain the long-term viability of the road network, the Ministry of Public Works and Communications began the execution of its Routine Maintenance Management System. In Sea Defence Management, civil works were carried out along the coastline from Region 2 to 6. In drainage and irrigation, rehabilitation and maintenance work was done on dams, drains and canals. In the air transport sector, the rehabilitation of the Communications, Navigation and Surveillance and Air Traffic Management Systems were completed. A proposal was approved for the development of an Airport Security Programme to strengthen the financial and operational sustainability of the Aviation Security System. The implementation of the special intervention programme also progressed in 2004. The development of infrastructure to support growth in Region 1 continued with the construction of the Port Kaituma and Six Miles to Falls Top Road. Electricity service was extended in Mabaruma and the generator in Port Kaituma was rehabilitated. Access to, and the quality of delivery of, educational and health facilities were improved with the construction of dormitories and staffing quarters for students and health and education professionals. In Region 8, heavy-duty bridges were constructed and a pedestrian bridge installed at Kmana. River defences were maintained and extended in several areas. These activities aimed at improving access to and between communities, and at facilitating the transportation and marketing of agricultural produce. The Mahdia Hospital was equipped with an x-ray machine and primary
POVERTY REDUCTION STRATEGY – PROGRESS REPORT 2005
vii
schools and teachers quarters were constructed. Several miles of roads were rehabilitated to augment productive activities. In Region 9, a rice huller was provided to boost rice production and community farms were fenced to separate them from cattle rearing. There was also improvement in the road network. Access to water was improved with the installation of water tanks, water pumps and windmills for water supply. Access to education was improved with the construction of primary schools. In Region 10, rehabilitation of the road network was kept apace, and the construction of health and educational facilities took place throughout the region. Steady progress was made in the implementation of the Linden Economic Advancement Program (LEAP) and new investments were made in forestry, logging, saw milling and leather craft. In addition, LEAP supported the participation of craft producers at international trade exhibitions and 9 local businesses were assisted in their participation in Guyana Trade Exposition. Public Consultations and Feedback Public consultations on progress towards the achievement of PRS goals and targets reflect the Government’s continuing commitment to involve key stakeholders, in particular the poor, in the formulation and implementation of policies and programmes designed to reduce poverty. The consultation process on the 2005 draft Progress Report aimed to (i) disseminate information on progress made towards reducing poverty as elaborated previously and new programmes that will further augment planned actions; (ii) generate feedback from a cross-section of the population as to whether the poverty programme is having its desired impact; and (iii) provide a forum for civil society to elaborate their priorities and recommend actions. Regional analysis of the issues and recommendations is also presented. It is interesting to note that while regional priorities do not differ significantly from the national level, the order of importance varies somewhat from region to region, and between easily accessible and more remote areas. The hinterland regions showed more variance both in the sector areas requiring attention and in recommended actions. To the extent possible, many of these recommendations have been incorporated into the medium-term poverty programme. For the first time in the poverty reduction process, a special consultation was held for Members of Parliament to elicit their feedback on the draft final progress report. The objective of the consultation was to provide Members of Parliament (i) an overview of the 2005 PRS Progress Report; (ii) present the issues and recommendations arising from the public consultations; (iii) indicate to what extent these recommendations were included in the final draft document; and (v) present the risks inherent in the medium-term poverty reduction program.
POVERTY REDUCTION STRATEGY – PROGRESS REPORT 2005
viii
The Medium-Term Framework
The Challenges Guyana faces serious challenges in the medium term. First, it has to reverse the negative and/or low growth rates of the last 5 years. Second, it has to complete reconstruction of infrastructure damage caused by the January 2005 flooding, adopt mitigating measures to minimize future impacts of such disasters and support the restoration of the productive capacity of the economy. Third, it has to create a more business friendly environment that will attract more direct foreign investment and stem the migration of its entrepreneurs and professionals. It is within this context that Guyana crafted its medium term macroeconomic strategy that addresses key structural reforms in policy, governance, institutional and regulatory areas, and the public investment framework with a view to generating quick supply responses in the productive sector, and to enhancing access to basic social services. These programmes were developed taking cognizance of the serious challenges posed by Guyana meeting its debt sustainability targets in the medium term. Such challenges include (i) external developments such as changes in the discount rates of calculating net present value of key debt indicators; (ii) exchange rate shocks; and (iii) requirements of growth generation and of poverty reduction with particular emphasis on infrastructure development. Investment, Growth and Reforms Despite progress with the legal and regulatory framework, the private sector has not responded in a way that will boost the economy and create jobs that will reduce the prevalence of poverty. Clearly, stimulating private investment will take more than laws and regulations. Additionally, an enabling investment climate will require a stable political environment, efficient bureaucracy, law and order, and expeditious resolution of business conflicts. The Government’s policy orientation in the medium-term takes these issues into account. One of the key challenges facing Guyana is the reform of the European Sugar regime, which will come into effect in mid-2006. The proposals will see a significant reduction in price of sugar under the Sugar Protocol. The speed and depth of this cut will be extremely damaging to a vulnerable industry and is expected to result in an annual loss of income of US$ 90 million for CARICOM sugar producers as a whole. The Government is implementing a modernization and restructuring plan for the sugar industry to mitigate external shocks and ensure the profitability of the industry. To improve efficiency, reduce costs and diversify its operations, a new sugar factory is being constructed at Skeldon to produce over 120,000 tonnes of high quality sugar at competitive prices. A cogeneration plant as part of the factory, will supply about 10 MW of electric power to the

POVERTY REDUCTION STRATEGY – PROGRESS REPORT 2005
ix
national grid while personal emoluments will be contained in line with inflation. The private sector will be encouraged to produce and supply sugarcane to Guysuco, and the management contract has been redesigned to take account of profitability. Fiscal Reforms With regard to fiscal reforms, the Guyana Revenue Authority (GRA) will continue to enhance the system for registering taxpayers, accounting for revenue collections and controlling refunds as part of the planned implementation of the new information technology-based tax administration system. A comprehensive Audit Plan is being developed to improve audit coverage of the tax roll and increase the recovery of unpaid taxes. Initiatives to enhance the anti-corruption programme through increased investigations, enforcement measures, training, and sanctions will also be maintained. The Value Added Tax (VAT) Bill will be tabled in Parliament in 2005 and implementing regulations for the VAT and Excise Tax will also be laid in Parliament. The VAT Legislation will replace the Consumption Tax Act, the Travel Voucher Tax Act, the Hotel Accommodation Tax Act and laws relating to service, premium, purchase, entertainment and telephone taxes. In addition, the Government has begun to publish tax exemptions granted, specifying the amount and recipients by categories. To improve the soundness of the pension system, a prudential framework for investment decisions of the National Insurance Scheme will be in place by September 2005 and a review of the public service pension system will be undertaken by December 2005. The Government will also take measures to implement further monetary and financial reforms in order to further improve the operations of the financial system. To this end, a Financial Sector Assessment Programme (FSAP) will be undertaken shortly to provide a comprehensive review of Guyana’s financial system and vulnerabilities. Consistent with the Amended Bank of Guyana Act 2004, the position of the Governor of the Central Bank was filled in 2005. In addition, discrepancies in fiscal and monetary data will be reconciled in order to reduce the float. Further, the Bank of Guyana will continue to conduct on-site inspections of at least 4 banks including the New Building Society and these inspections will extend to the remaining banks in 2006. The Government will also review and update all (Anti Money Laundering/Combating the Financing of Terrorism) AML/CFT legislation to ensure that they are in line with international best practice. Governance, Transparency and Accountability The Government will take steps to strengthen institutions and agencies that provide fiduciary oversight of public finances. To this end, the Audit Act enacted in 2004 will become operational in 2005. Further, the Wildlife Division will be merged with the Environmental Protection Agency (EPA) and its revenues transferred to the consolidated fund in 2005. Also, all existing external loans will be tabled in Parliament and the audited accounts of the GRA will be placed in Parliament.

POVERTY REDUCTION STRATEGY – PROGRESS REPORT 2005
x
In addition, fiduciary oversight will be strengthened through specific measures implemented to (i) enhance parliamentary oversight; (ii) reduce discretionary powers; and (iii) disclose officials’ assets. Specifically, the Government will adopt and begin implementation of a time-bound reform programme that will strengthen Parliament, constitutional bodies and government institutions in fiduciary oversight responsibilities. High priority will be placed on fighting crime and improving the administration of justice. To this end, the Government will take specific measures to (i) enhance the capacity of the Guyana Police Force to prevent, detect and interdict criminal activities; (ii) mainstream the use of Information Technology within the Ministry of Home Affairs for greater administrative and operational efficiency; (iii) reorient, emphasize and decentralize community policing; and (iv) enhance border and immigration security. In improving the administration of justice, the Government will (i) pass legislation to establish a commercial court in support of conflict resolution for the private sector; (ii) establish a family court to bring quicker resolution to family matters; and (iii) expand the alternative dispute resolution framework to reduce the number of cases in the courts. Infrastructure to Support Growth The events of the recent natural disaster exposed Guyana’s fragile infrastructure and heightened its associated risks to long-term sustainable growth. Its lessons have influenced the medium term investment programme with increased emphasis on drainage systems, conservancy dams, the road network and other infrastructure development critical to complement economic growth and social development. Not surprisingly, public investments in the medium term provide a sharp contrast to previous years. Coming out of the flooding disaster, an Infrastructure Recovery Task Force comprising of experienced and seasoned engineers, was established to oversee the speedy recovery of the drainage and irrigation sector. With donor assistance, the task force is implementing several emergency projects to mitigate the effects of the May/June rains on the drainage system. In the medium term, emphasis will be placed on construction of a road at Flagstaff between the public road and conservancy dam; excavation of cross canals within the East Demerara Conservancy to increase storage and to channel water to the designated outlet structures; repairs to the conservancy dam embankment; the hydraulic and hydrologic modelling of the East Demerara Water conservancy system, rehabilitation of water pumps and discharge canals; and other critical outlet structures (kokers). The Government is currently undertaking a Transport Sector Study (TSS) that covers all modes of transportation: road, maritime, inland waterways, aviation and possibly rail. The TSS will contribute to (i) providing elements for decision-making for a coherent and consistent
POVERTY REDUCTION STRATEGY – PROGRESS REPORT 2005
xi
policy strategy for the development of the transport sector over the next ten years and for responding to the needs of the PRSP; (ii) identifying the requirements in the areas of policy, legislation, regulation, institutional arrangements, service provision and implementation for sustainable growth of the sector; (iii) carrying out comprehensive studies on specific sectors in order to focus on the most relevant problem areas; and (iv) developing a proposal for an indicative investment programme based on the policy and comprehensive studies consistent with the Government’s anticipated financial capacity. Once completed, the investment programme in the transport sector will be modified to reflect the recommendations of the report. Social Sector Programme Medium term expenditure in the social sector will continue to grow although emphasis will be placed on recurrent expenditures rather than on investment programmes. The Ministries of Education and Health will continue to implement their strategic plans with special emphasis on improving the quality of the delivery of education and health. To this end, emphasis will be placed on training, access, equity, and maintenance of physical infrastructure and equipment, and efficiency in the use of resources. In the Water sector, following the flooding, Guyana Water Incorporated (GWI) is taking measures to improve the Georgetown water and sewerage infrastructure, and to reduce the risk of exposure to waterborne disease. GWI will also work to provide continued service to customers, reduce water leakage, and increase access for hinterland communities to treated water. In the Housing sector, emphasis will be placed on regularizing squatter settlements, increasing the number of land titles processed, and facilitating the construction of low-income houses. Through the Government’s Hinterland Development Strategy, training will be provided to improve local governance and the administrative and management capacity of Amerindian leaders across Guyana. The Ministry of Amerindian Affairs will continue to work towards improved standards of living for Amerindian communities through infrastructure development, the provision of equipment and resources, and the titling of thirty-four Amerindian Communities. Monitoring and Evaluation The PRSP recognized the critical role of a monitoring and evaluation (M&E) system to provide a basis for the analysis of the impact of proposed programmes on poverty reduction, to contribute to the development of more appropriate and relevant policy, and to stimulate the continued engagement of civil society in the Poverty Reduction programme. To this end, considerable progress has been made with the development and implementation of an M&E action plan, and the establishment of regional and national structures to provide an organizational framework for widespread stakeholder involvement in monitoring and evaluation for the PRS. The five structures established to spearhead the monitoring and
POVERTY REDUCTION STRATEGY – PROGRESS REPORT 2005
xii
evaluation function--the Monitoring and Evaluation Unit of the PCPMU, a National Steering Committee, Ministerial/Agency Focal Points, Thematic Groups, and PRS Regional Committees—are functional and efforts are underway to continue to build their capacity and refine their roles within the framework of a national M&E system. To strengthen the M&E Unit, a Coordinator with 5 Monitoring and Evaluation Officers were recruited September in 2004 and a National Workshop on Monitoring and Evaluation for the PRSP took place in October 2004. The workshop brought together stakeholders in the PRSP/ M&E cycle to review the system, clarify roles and responsibilities, and develop proposals for a more collaborative and coordinated approach. In 2005 to 2007, a systems based M&E database will be established in all line ministries to track both expenditure data and allocation by regional destination. The implementation of the Social Statistics Project will provide much needed information to assess outputs and outcomes of poverty related expenditures. Meanwhile, in September 2005, the Government will undertake and publish analyses of poverty related expenditures of priority poverty programs and coordinate with regional M&E coordinators in identifying a number of priority projects to track. Like many developing countries, the quality of social statistics is poor in Guyana. In response to these issues, the Government has begun the implementation of the Social Statistics Project with the objectives of improving and sustaining the capacity of the country to generate social data; undertaking evidence-based policy analysis; and monitoring implementation and impact of the Poverty Reduction Strategy. The Government is in the process of recruiting over 20 statisticians for the BOS and social sector line ministries; strengthening the institutional capacity of the BOS and line ministries; establishing a statistical unit in ministries where there is none; training technical staff particularly at the regional level to support data collection, collation and aggregation; standardizing data collection across ministries and regions; and developing local and wide-area networks to link all agencies and ministries to the BOS.

POVERTY REDUCTION STRATEGY – PROGRESS REPORT 2005
1
Chapter
INTRODUCTION
The Context
The Government, over the last several years, has embarked on an ambitious legislative, regulatory, institutional and social sector reforms with a view to creating a business friendly environment, generating growth and improving access to social services. Guyana was rewarded with positive growth in 2004–a reversal from the negative or zero growth rates in previous years--and improvement in social conditions. However, these developments took place in the context of difficult external challenges and unaccommodating domestic conditions. While the Government does not have control over its external environment, it has greater degrees of freedom in ensuring internal balance to provide predictability, confidence and improved social cohesion.
The Domestic Environment
Key issues identified in the 2004 Poverty Reduction Strategy Progress Report included the challenging external environment, low absorptive capacity, difficult sociopolitical conditions, and the weak monitoring and evaluation of the poverty reduction strategy programme. These problems continue to persist. Progress in achieving the PRSP targets and the Millennium Development Goals is, in part, contingent on the successful resolution of these issues. In addition, 2004 and 2005 presented unique problems. Perhaps, the most serious shock that the country has experienced and which has possible long-term implications, is the national disaster that occurred in January 2005. Unprecedented rainfall and accompanying flooding resulted in the displacement of 70,000 households, and caused economic damage in excess of 57 percent of GDP, that is projected to cost US$200-300 million for recovery and reconstruction. The simmering political battles between the major political parties continue to create political instability and act as a disincentive in attracting direct foreign investment and retaining domestic capital. In spite of some improvement in the crime and security situation, Guyana continues to lose its critical entrepreneurial and professional skills to migration.
The External Situation
The external environment has not been kind to Guyana. For an oil dependent country, the oil price hikes in 2004 had a devastating ripple effect on the cost of living, external balances and
1

POVERTY REDUCTION STRATEGY – PROGRESS REPORT 2005
2
the competitiveness of Guyana’s products on the world market. Depressing primary commodity prices have not provided the cushion needed to mitigate the impact of higher import prices. Guyana’s primary export commodities of sugar, rice, bauxite and timber are not expected to see any appreciable increase in price over the medium term. Most significantly, changes in the European Union sugar protocol, which will reduce sugar prices in the EU by 39 percent over four years, will adversely affect Guyana’s main foreign exchange earner. Sugar contributes 17 percent to GDP, over 25 percent of foreign exchange earnings and directly employs over 17,000 people. While modernizing and restructuring the sugar industry will help to mitigate the effects of these changes, unless the European Union provides financial support to ACP sugar exporting countries including Guyana in a timely manner, the welfare implications of the retrenchment of workers employed directly or indirectly by the sugar industry will be devastating.
Major Challenges
These problems present a number of challenges to the Government. First, the crime and security situation will have to be tackled and dealt with definitively if Guyana is to minimize the migration of its highly trained professionals and entrepreneurs whose skills and resources are needed to propel growth. Second, Guyana, being the only English speaking country in South America and a member of the Caribbean Community, Government will have to make concerted efforts to market Guyana’s abundant natural resources and strategic geographic location to the international investment community. Third, the political impasse that continues is counterproductive to making Guyana attractive for investment or in creating the peace and stability critical for development. The continuation of the present political situation increases sovereign risk and raises the cost of capital especially foreign for investment. Fourth, Guyana requires additional resources to meet the investment cost critical to re-building its productive capacity and completing reconstruction in the wake of the recent unprecedented flooding. Given its commitment to maintaining sustainable debt management, the Government may have to pursue more grant resources for its development programmes and reprioritize its investment and other programmes. Finally, the disruption of economic activities and dislocation of people as a result of the recent flooding has brought into sharp focus the challenges of increasing public and private resources for routine and regular maintenance of roads, for drainage and irrigation systems and the conservancy dams, for designing and implementing improved standards in roads, for revising and upgrading building codes, and for establishing and strengthening disaster management systems to mitigate the impact of future disasters. Addressing these challenges is critical to establishing a sustainable framework for meeting the PRSP targets and the MDGs. Benefits include peace and tranquility in the body politic and social life; reduced sovereign risk; the stemming of migration; and renewed confidence and certainty for economic actors and the general population. To achieve the required impact,
POVERTY REDUCTION STRATEGY – PROGRESS REPORT 2005
3
these challenges have to be addressed in tandem. Resolving them on a piecemeal basis will only prolong the delay in meeting the PRSP targets and attainment of the MDGs by 2015. Achieving PRSP Targets and the Millennium Development Goals In attaining PRSP targets and the Millennium Development Goals (MDGs), Guyana continues to make progress, although more effort will be required to achieve all the targets as set out in 2001. The medium-term programme elaborates the Government’s approach to addressing some of these. Of critical importance, however, is the costing of the poverty reduction programmes to determine the need for additional financing to help Guyana to achieve the MDGs by 2015 and/or beyond.
Organization of the Report
The 2005 Progress Report is organized as follows: Chapter 2 provides a summary of poverty indicators in Guyana. In the absence of the Household Income and Expenditure Survey (HIES), the report uses the 2002 population census data to gauge the extent of poverty in Guyana. With the 1980 population census as the baseline, this chapter presents an analysis of the long-term trends in poverty profiles. Data deficient areas such as the number of persons living with disabilities or HIV/AIDS, and the degree of access to social services by residents of rural and isolated communities are also addressed. The review of economic developments in 2004 is undertaken in Chapter 3. In particular, attention is paid to growth, fiscal and monetary developments and structural reforms implemented in 2004. Further, the chapter reviews developments that took place in restructuring and modernizing the traditional sector with emphasis on agriculture, mining, and forestry. Developments in the new growth areas were also reviewed. Governance issues are also discussed in this chapter. Achievements and setbacks experienced in social sector development are highlighted in Chapter 4. Specifically, the chapter deals with advances made in previously identified priority areas in the social sector such as education, health, housing and water. In particular, the chapter focuses on progress made in access, equity and delivery of social services. Chapter 5 focuses on the on-going implementation of works to upgrade and maintain critical infrastructure, in accordance with the infrastructure strategy described in the PRSP. Areas addressed include sea defences, roads, bridges, river and air transport, drainage and irrigation and maritime affairs. Special attention is paid to developments in the hinterland areas and efforts to encourage self-sufficiency, and to promote economic and social development in these regions.
POVERTY REDUCTION STRATEGY – PROGRESS REPORT 2005
4
Public consultation and feedback from the civil society on the poverty reduction strategy is the subject of Chapter 6. The process leading to the consultations is described and matrices representing sector issues and recommendations were prepared for all the ten administrative regions. These matrices are captured in Annex D of the report. However, the national summary of the feedback from the public consultations is included in this chapter. In Chapter 7, a medium-term macroeconomic framework is elaborated. Specifically, the macroeconomic outlook is assessed, taking into account the key challenges facing the country and assumptions of returning the economy to a higher growth trajectory. In this context, a prioritized five-year rolling investment programme is discussed, policies and reforms to promote growth are presented, structural reforms critical to support investment, governance, the rule of law and political stability are also elaborated. Improvement in economic and social infrastructure is the focus of Chapter 8. In economic infrastructure, the emphasis is on disaster mitigation and laying the groundwork for developing a transport network to facilitate growth. Attention is therefore paid to rehabilitation of sea defences, implementation of a transport sector study that will determine the future course of action in that sector, and improvement in drainage and irrigation systems and the conservancy dams. In the social sector area, the focus continues to be the priorities set in the 2001 PRSP for improving access and quality of services in the education, health, water and housing sectors, and designing and implementing programmes that will reduce poverty in regions where extreme or absolute poverty is high or the depth of economic depression requires government intervention. The chapter also addresses the medium-term plans in improving social safety nets. An assessment of monitoring and evaluation of the poverty reduction strategy is provided in Chapter 9. In particular, this section reviews the institutional capacity of the monitoring and evaluation structures with a view to providing recommendations for their strengthening. In addition, the chapter addresses the core issues of M&E, particularly the role of feedback from civil society in policy analysis and programme formulation. The dearth of data is also addressed with recommendations provided for improving social statistics for assessing programme outcomes, and improving budgetary information to describe programme inputs. Chapter 10 inserts a cautionary note by highlighting the risks to the medium term poverty strategy while Chapter 11 provides a Summary and Conclusions of the Report.
POVERTY REDUCTION STRATEGY – PROGRESS REPORT 2005
5
Chapter
LONG TERM POVERTY PROFILE AND TRENDS
Introduction
Guyana has undergone major political and economic changes over the last twenty-five years. On the political front, multi-party democracy accompanied by free and fair elections has, since 1992, replaced the effectively one-party system that was entrenched in 1978. The one-party political system also influenced economic policies. Consistent with its socialist orientation, more than 80 percent of the total value of recorded imports and exports was controlled by the state. State intervention, accompanied by poor economic policies, contributed to persistent negative growth rates. The high correlation between economic growth and poverty reduction meant that a high proportion of population was pushed into absolute and extreme poverty. The poverty surveys and analysis conducted during this period bear testimony to this outcome. Since Guyana began implementing structural market-oriented reforms in 1989, economic growth has accelerated, averaging 3 percent between the period 1994-2004. During this period, US$681.8 million was disbursed to Guyana and over US$336 million was received in grants, in support of improving economic infrastructure, human resource development, governance and institutional reforms. Through implementation of prudent policies and generous debt relief from donors, Guyana’s external debt declined from US$2.1 billion in 1992 to about US$1.2 billion in 2004, freeing much needed resources to improve economic and social infrastructure. The measurement of poverty and its trends will be gauged in the context of these developments.
Measuring Poverty
Poverty is a multidimensional phenomenon and can be defined and measured in a number of different ways. In Guyana, the Income Approach, Household Income and Expenditure Survey (HIES), the Living Condition Survey (LCS) and the Basic Needs Index have been used to measure poverty. While the quantitative measurements of poverty may give different results, the characteristics of poverty in Guyana remain the same: deprivation of the material for meeting basic human needs. People are poor because they lack income, food, clothing and shelter. The last poverty survey, the LCS, was conducted in Guyana in 1999 and the results were captured in the 2001 PRSP. A HIES will be undertaken in September 2005 and preliminary results will be available in July 2006. The HIES which was initially planned for March 2005, was postponed as a result of the national disaster that struck Guyana in late December 2004 and January 2005. The unprecedented rainfall and associated flooding that made it virtually
2
POVERTY REDUCTION STRATEGY – PROGRESS REPORT 2005
6
impossible to conduct the survey. In the absence of the HIES, census data will be used in the 2005 PRSP Progress Report to measure the extent of poverty in Guyana. Emphasis will be placed on both qualitative and quantitative measurements of poverty, particularly with respect to access to basic needs. Specifically, the chapter will review progress or the lack thereof, in the following areas:
• access to shelter • access to safe water and improved sanitation • access to electricity • access to healthcare services • access to education • and labour force participation.
Although there are clearly many other elements of poverty, from a human capabilities perspective, these key and easily measurable elements of poverty provide a good picture of the status of the population. Guyana’s 2002 census report will be published in October 2005. The delay in publication is attributable to agreements with CARICOM to jointly publish all census data together. Meanwhile, the Government will publish about 20 key summary tables of the 2002 census in August 2005.
Poverty Trends
In the context of the menu of economic and social reforms that were introduced in the last three decades, an attempt is made to use census data to measure poverty trends especially as they relate to basic needs, human resource development and economic opportunities. Given the changes in the census questionnaire over the period, emphasis is placed on using the same indicators for easy comparison. The 1980 census data is used as the basis for the analysis, so that the 2002 census data is compared with the 1990 and 1980 census information.
Population
Guyana’s population over the last 20 years has barely changed. At 751,223 in 2002, it was actually 35,894 or 1.2 percent below the 1980 population. However, between 1980 and 1990, the population fell by 4.8 percent. With natural rate of increase of 1 percent per year, this represented about a 15 percent decline in Guyana’s population. In part, this substantial decline in the population resulted from the high levels of migration brought about by the harsh economic, social and political conditions that prevailed during this period.

POVERTY REDUCTION STRATEGY – PROGRESS REPORT 2005
7
The trend of migration eased somewhat during the period 1990 to 2002, with the population showing an increase of about 27,000 people. Also contributing to the modest rise in the population may be remigration of Guyanese in the early 1990s. Nevertheless, with so many Guyanese residing abroad, the pull factor remains strong. Sponsorship of family members by relatives living elsewhere continues to have a considerable influence on migration trends and a dampening effect on population growth. In terms of the distribution, Region 4 is the most populated area in Guyana with about 41 percent of the population. The number of people living in this region has remained fairly constant over the last 20 years. Region 6 is the second highly populated region with about 17 percent of the population. But it is also the region, which experienced the highest level of, perhaps, internal out-migration over the two decades. The population in all the hinterland regions increased over the last 20 years, with Region 8 registering the highest increase as a result of internal migration. Several factors account for the underlying changes in population within the regions. First, increased expansion of economic activities in Region 4, accompanied by the high level of distribution of house lots may have contributed to the steady state of the population. Second, increased mining and forestry activities in the interior regions, with concomitant job creation, may account for the increase in population of these regions. Third, and perhaps, the most interesting aspect of the population trends is the growth in population in Region 10. With the adverse changes in international bauxite prices and new production lines in Brazil and China, the high production costs at Linmine, and the restructuring and privatization of the bauxite entity, the population in Region 10 would be expected to decline. In spite of these factors, however, the population in Region 10 actually grew over the last 20 years. Gold mining, principally Omai operations, forestry and agriculture may have accounted for the population increase.
TABLE 2.1 POPULATION, 1980-2002
1980 1990 2002
National 759,567 723,673 751,223
Region 1 18,329 18,428 24,275
Region 2 42,341 43,455 49,253
Region 3 104,750 95,975 103,061
Region 4 314,475 296,924 310,320
Region 5 53,898 51,280 52,428
Region 6 152,386 142,541 123,695
Region 7 14,390 14,790 17,597
Region 8 4,485 5,615 10,095
Region 9 12,873 15,057 19,387
Region 10 38,641 39,608 41,112
(as percent)
National 100 100 100
Region 1 2.4 2.5 3.2
Region 2 5.6 6 6.6
Region 3 13.8 13.3 13.7
Region 4 41.4 41 41.3
Region 5 7.1 7.1 7
Region 6 20.1 19.7 16.5
Region 7 1.9 2 2.3
Region 8 0.6 0.8 1.3
Region 9 1.7 2.1 2.6
Region 10 5.1 5.5 5.5
(changes in population)
National n.a -4.7 3.8
Region 1 n.a 0.5 31.7
Region 2 n.a 2.6 13.3
Region 3 n.a -8.4 7.4
Region 4 n.a -5.6 4.5
Region 5 n.a -4.9 2.2
Region 6 n.a -6.5 -13.2
Region 7 n.a 2.8 19
Region 8 n.a 25.2 79.8
Region 9 n.a 17 28.5
Region 10 n.a 2.5 3.7
Source: Bureau of Statistics
POVERTY REDUCTION STRATEGY – PROGRESS REPORT 2005
8
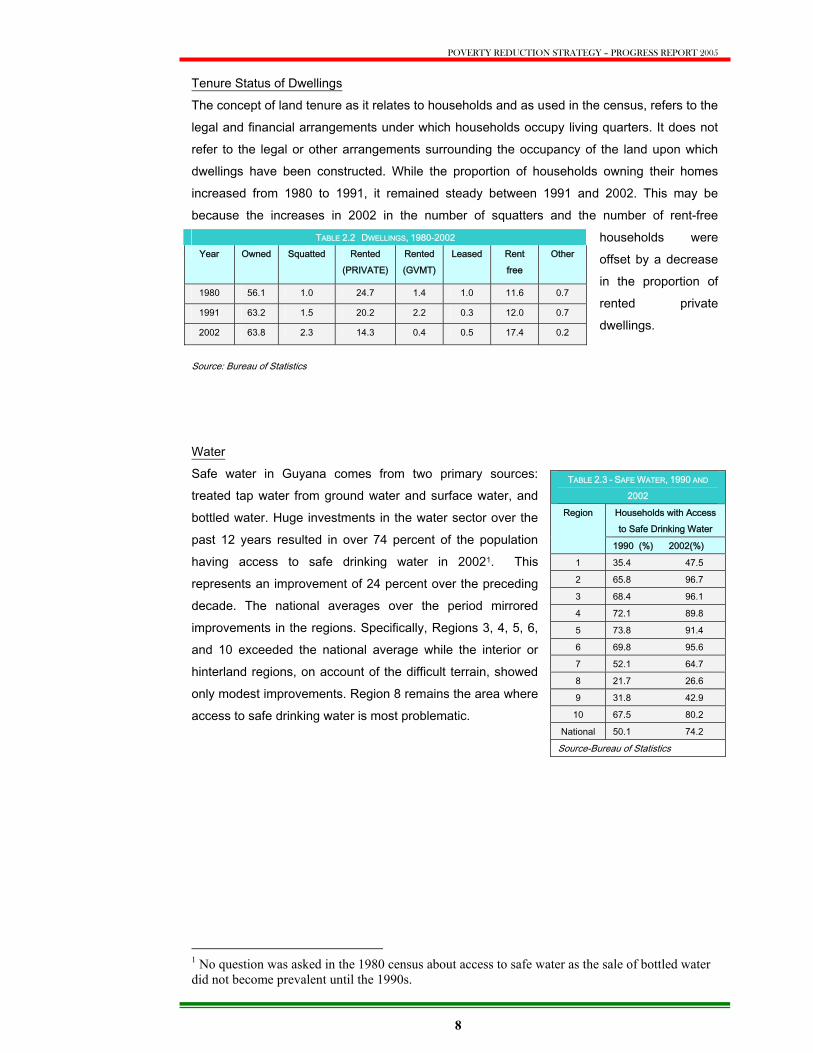
Tenure Status of Dwellings The concept of land tenure as it relates to households and as used in the census, refers to the legal and financial arrangements under which households occupy living quarters. It does not refer to the legal or other arrangements surrounding the occupancy of the land upon which dwellings have been constructed. While the proportion of households owning their homes increased from 1980 to 1991, it remained steady between 1991 and 2002. This may be because the increases in 2002 in the number of squatters and the number of rent-free
households were offset by a decrease in the proportion of rented private dwellings.
Source: Bureau of Statistics
Water Safe water in Guyana comes from two primary sources: treated tap water from ground water and surface water, and bottled water. Huge investments in the water sector over the past 12 years resulted in over 74 percent of the population having access to safe drinking water in 20021. This represents an improvement of 24 percent over the preceding decade. The national averages over the period mirrored improvements in the regions. Specifically, Regions 3, 4, 5, 6, and 10 exceeded the national average while the interior or hinterland regions, on account of the difficult terrain, showed only modest improvements. Region 8 remains the area where access to safe drinking water is most problematic.
1 No question was asked in the 1980 census about access to safe water as the sale of bottled water did not become prevalent until the 1990s.
TABLE 2.2 DWELLINGS, 1980-2002 Year Owned Squatted Rented
(PRIVATE) Rented (GVMT)
Leased Rent free
Other
1980 56.1 1.0 24.7 1.4 1.0 11.6 0.7
1991 63.2 1.5 20.2 2.2 0.3 12.0 0.7
2002 63.8 2.3 14.3 0.4 0.5 17.4 0.2
TABLE 2.3 - SAFE WATER, 1990 AND
2002
Households with Access to Safe Drinking Water
Region
1990 (%) 2002(%)
1 35.4 47.5
2 65.8 96.7
3 68.4 96.1
4 72.1 89.8
5 73.8 91.4
6 69.8 95.6
7 52.1 64.7
8 21.7 26.6
9 31.8 42.9
10 67.5 80.2
National 50.1 74.2
Source-Bureau of Statistics
POVERTY REDUCTION STRATEGY – PROGRESS REPORT 2005
9
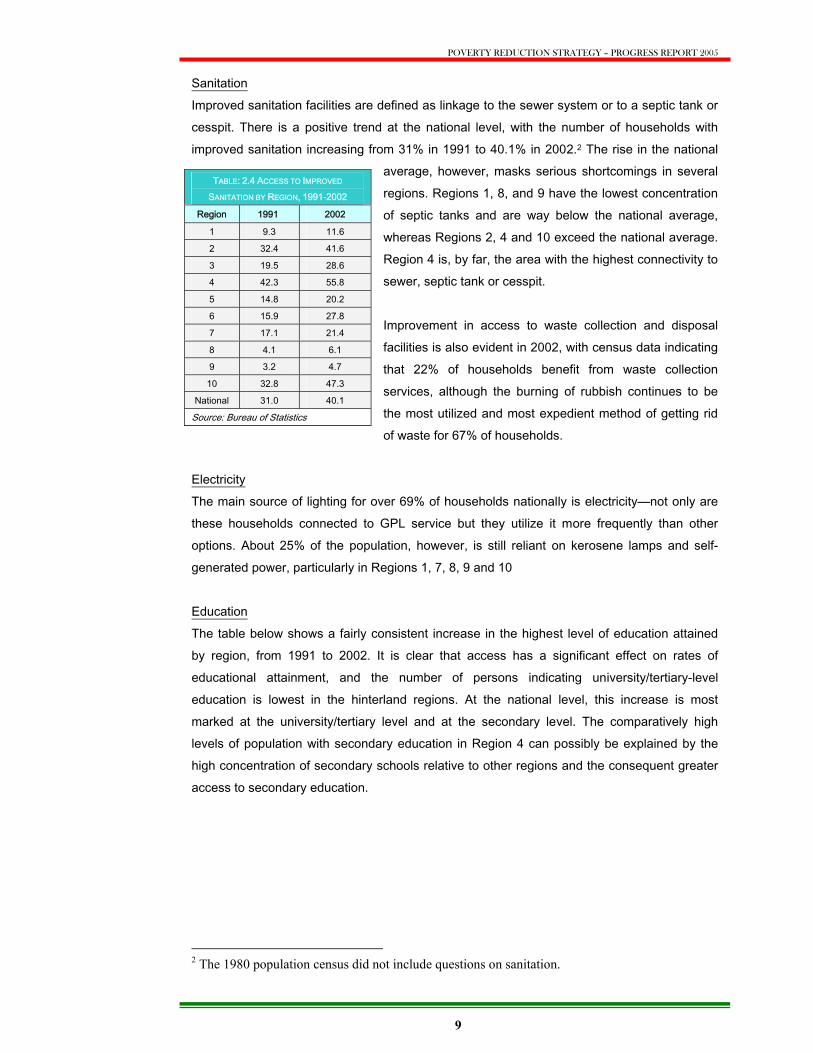
Sanitation Improved sanitation facilities are defined as linkage to the sewer system or to a septic tank or cesspit. There is a positive trend at the national level, with the number of households with improved sanitation increasing from 31% in 1991 to 40.1% in 2002.2 The rise in the national
average, however, masks serious shortcomings in several regions. Regions 1, 8, and 9 have the lowest concentration of septic tanks and are way below the national average, whereas Regions 2, 4 and 10 exceed the national average. Region 4 is, by far, the area with the highest connectivity to sewer, septic tank or cesspit. Improvement in access to waste collection and disposal facilities is also evident in 2002, with census data indicating that 22% of households benefit from waste collection services, although the burning of rubbish continues to be the most utilized and most expedient method of getting rid of waste for 67% of households.
Electricity The main source of lighting for over 69% of households nationally is electricity—not only are these households connected to GPL service but they utilize it more frequently than other options. About 25% of the population, however, is still reliant on kerosene lamps and self-generated power, particularly in Regions 1, 7, 8, 9 and 10 Education The table below shows a fairly consistent increase in the highest level of education attained by region, from 1991 to 2002. It is clear that access has a significant effect on rates of educational attainment, and the number of persons indicating university/tertiary-level education is lowest in the hinterland regions. At the national level, this increase is most marked at the university/tertiary level and at the secondary level. The comparatively high levels of population with secondary education in Region 4 can possibly be explained by the high concentration of secondary schools relative to other regions and the consequent greater access to secondary education.
2 The 1980 population census did not include questions on sanitation.
TABLE: 2.4 ACCESS TO IMPROVED
SANITATION BY REGION, 1991-2002
Region 1991 2002
1 9.3 11.6
2 32.4 41.6
3 19.5 28.6
4 42.3 55.8
5 14.8 20.2
6 15.9 27.8
7 17.1 21.4
8 4.1 6.1
9 3.2 4.7
10 32.8 47.3
National 31.0 40.1
Source: Bureau of Statistics
POVERTY REDUCTION STRATEGY – PROGRESS REPORT 2005
10
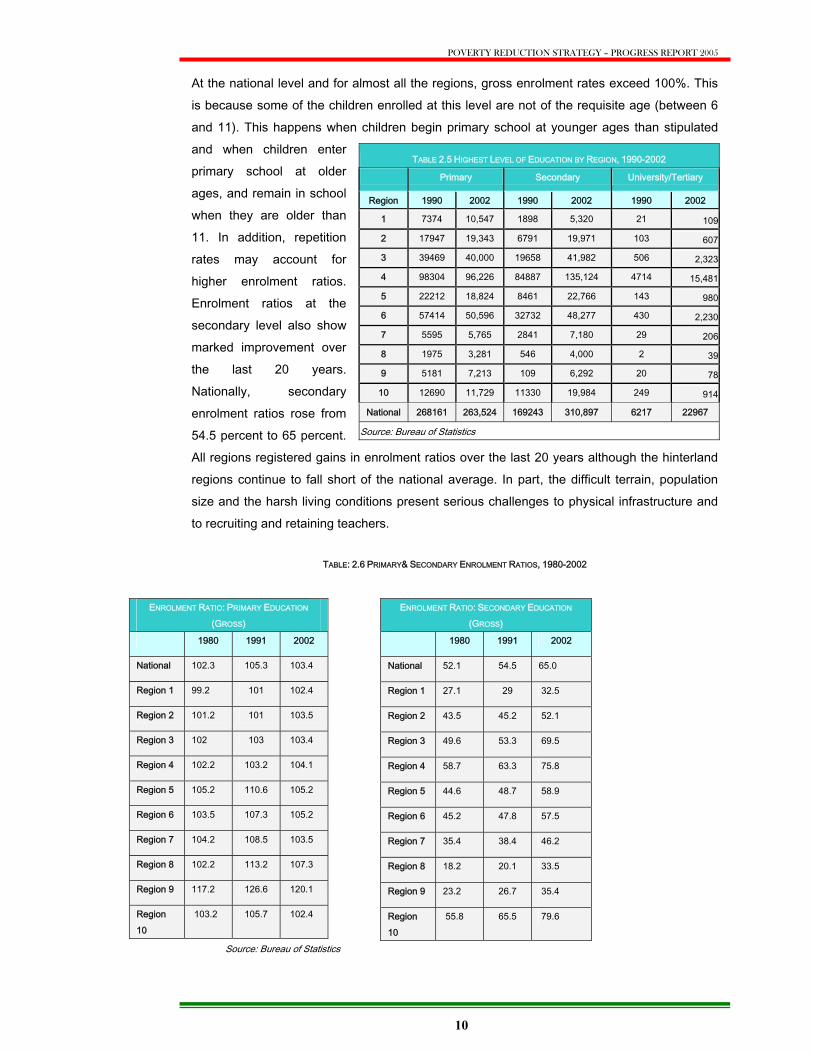
At the national level and for almost all the regions, gross enrolment rates exceed 100%. This is because some of the children enrolled at this level are not of the requisite age (between 6 and 11). This happens when children begin primary school at younger ages than stipulated and when children enter primary school at older ages, and remain in school when they are older than 11. In addition, repetition rates may account for higher enrolment ratios. Enrolment ratios at the secondary level also show marked improvement over the last 20 years. Nationally, secondary enrolment ratios rose from 54.5 percent to 65 percent. All regions registered gains in enrolment ratios over the last 20 years although the hinterland regions continue to fall short of the national average. In part, the difficult terrain, population size and the harsh living conditions present serious challenges to physical infrastructure and to recruiting and retaining teachers.
TABLE: 2.6 PRIMARY& SECONDARY ENROLMENT RATIOS, 1980-2002
Source: Bureau of Statistics
TABLE 2.5 HIGHEST LEVEL OF EDUCATION BY REGION, 1990-2002
Primary Secondary University/Tertiary
Region 1990 2002 1990 2002 1990 2002
1 7374 10,547 1898 5,320 21 109
2 17947 19,343 6791 19,971 103 607
3 39469 40,000 19658 41,982 506 2,323
4 98304 96,226 84887 135,124 4714 15,481
5 22212 18,824 8461 22,766 143 980
6 57414 50,596 32732 48,277 430 2,230
7 5595 5,765 2841 7,180 29 206
8 1975 3,281 546 4,000 2 39
9 5181 7,213 109 6,292 20 78
10 12690 11,729 11330 19,984 249 914
National 268161 263,524 169243 310,897 6217 22967
Source: Bureau of Statistics
ENROLMENT RATIO: PRIMARY EDUCATION
(GROSS)
1980 1991 2002
National 102.3 105.3 103.4
Region 1 99.2 101 102.4
Region 2 101.2 101 103.5
Region 3 102 103 103.4
Region 4 102.2 103.2 104.1
Region 5 105.2 110.6 105.2
Region 6 103.5 107.3 105.2
Region 7 104.2 108.5 103.5
Region 8 102.2 113.2 107.3
Region 9 117.2 126.6 120.1
Region 10
103.2 105.7 102.4
ENROLMENT RATIO: SECONDARY EDUCATION
(GROSS)
1980 1991 2002
National 52.1 54.5 65.0
Region 1 27.1 29 32.5
Region 2 43.5 45.2 52.1
Region 3 49.6 53.3 69.5
Region 4 58.7 63.3 75.8
Region 5 44.6 48.7 58.9
Region 6 45.2 47.8 57.5
Region 7 35.4 38.4 46.2
Region 8 18.2 20.1 33.5
Region 9 23.2 26.7 35.4
Region 10
55.8 65.5 79.6

POVERTY REDUCTION STRATEGY – PROGRESS REPORT 2005
11
Health The crude birth rate represents the total number of live births per 1,000. This indicator is closely linked to the age structure of the population, and will be higher in populations where more of the women are of childbearing age (15-49). It is this linkage that most probably best explains the slight decrease in the crude birth rate from 25.19 in 1991 to 23.29 in 2002. Indeed, concomitant population figures indicate a decline in the proportion of the female population between the ages of 15 and 64 from 31.11% in 1991 to 29.94% in 2002, and an increase in the proportion of women of non-childbearing age (1to14 and older than 65). The increase in the crude death rate may similarly be explained by the aging of the population, with 3.92% over 65 in 1991 and 4.27% over 65 in 2002.
The infant and maternal mortality and the crude birth and death rates are all dependent on registration habits, a factor that may be especially meaningful in rural communities and for low-income and/or adolescent persons. Both infant and maternal mortality rates declined over the period, with a particularly significant drop in infant mortality between 1991 and 2002. This decrease cannot be attributed entirely to a declining birth rate, and must therefore reflect improved quality of care for expectant mothers and babies.
Another interesting trend in the health sector is the steady rise in the doctor/patient ratio over the last 20 years. The establishment of the medical school at the University of Guyana and the influx of specialized doctors from other countries through bilateral arrangements, may account for this outcome. Even so, the rate of 200 patients per doctor is still too high. The fact that over 80 percent of these doctors are located in Region 4 raises serious issues of quality of care and access to doctors, especially in hinterland regions. Another troubling issue is the low nurse to patient ratio, which among many factors may be attributed to the migration of health professionals to the Caribbean, North America and the United Kingdom. Bed to patient ratios, which declined precipitously between 1980 and 1991, are recovering as a result of the establishment of several private hospitals and the expansion of government hospitals over the last ten years.
TABLE 2.7 - KEY HEALTH INDICATORS, 1980-2002
1980 1991 2002
Infant Mortality Rate (per 1,000) 41 43 29
Maternal Mortality Rate (per 1,000) NA 140.1 134.7
Crude Birth Rate (per 1,000) 29.84 25.19 23.29
Crude Death Rate (per 1,000) 7.34 7.16 7.22
Doctor/patient ratio (per 10,000) 1.6 3.3 4.6
Nurse/patient ratio (per 10,000) 14.3 5.9 10.5
Beds/patient ratio (per 10,000) 50 28.8 42.4
Source: Bureau of Statistics and Ministry of Health
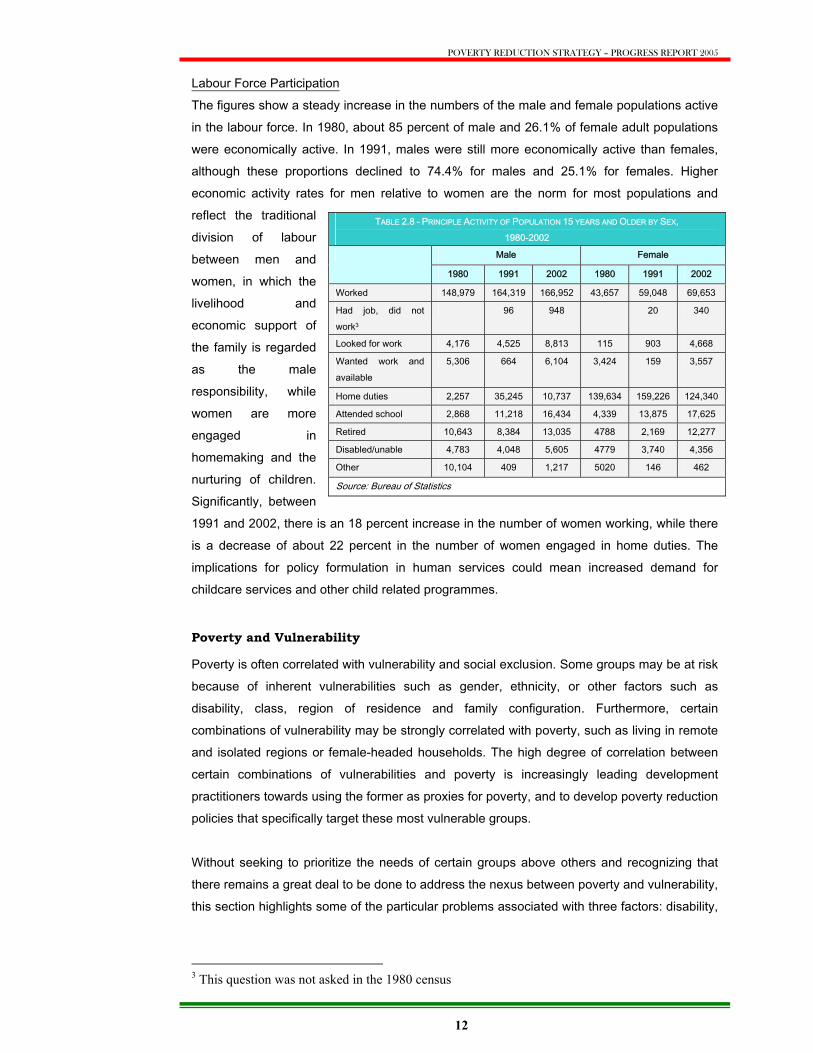
POVERTY REDUCTION STRATEGY – PROGRESS REPORT 2005
12
Labour Force Participation The figures show a steady increase in the numbers of the male and female populations active in the labour force. In 1980, about 85 percent of male and 26.1% of female adult populations were economically active. In 1991, males were still more economically active than females, although these proportions declined to 74.4% for males and 25.1% for females. Higher economic activity rates for men relative to women are the norm for most populations and reflect the traditional division of labour between men and women, in which the livelihood and economic support of the family is regarded as the male responsibility, while women are more engaged in homemaking and the nurturing of children. Significantly, between 1991 and 2002, there is an 18 percent increase in the number of women working, while there is a decrease of about 22 percent in the number of women engaged in home duties. The implications for policy formulation in human services could mean increased demand for childcare services and other child related programmes.
Poverty and Vulnerability
Poverty is often correlated with vulnerability and social exclusion. Some groups may be at risk because of inherent vulnerabilities such as gender, ethnicity, or other factors such as disability, class, region of residence and family configuration. Furthermore, certain combinations of vulnerability may be strongly correlated with poverty, such as living in remote and isolated regions or female-headed households. The high degree of correlation between certain combinations of vulnerabilities and poverty is increasingly leading development practitioners towards using the former as proxies for poverty, and to develop poverty reduction policies that specifically target these most vulnerable groups. Without seeking to prioritize the needs of certain groups above others and recognizing that there remains a great deal to be done to address the nexus between poverty and vulnerability, this section highlights some of the particular problems associated with three factors: disability,
3 This question was not asked in the 1980 census
TABLE 2.8 - PRINCIPLE ACTIVITY OF POPULATION 15 YEARS AND OLDER BY SEX, 1980-2002
Male Female
1980 1991 2002 1980 1991 2002
Worked 148,979 164,319 166,952 43,657 59,048 69,653
Had job, did not work3
96 948 20 340
Looked for work 4,176 4,525 8,813 115 903 4,668
Wanted work and available
5,306 664 6,104 3,424 159 3,557
Home duties 2,257 35,245 10,737 139,634 159,226 124,340
Attended school 2,868 11,218 16,434 4,339 13,875 17,625
Retired 10,643 8,384 13,035 4788 2,169 12,277
Disabled/unable 4,783 4,048 5,605 4779 3,740 4,356
Other 10,104 409 1,217 5020 146 462
Source: Bureau of Statistics

POVERTY REDUCTION STRATEGY – PROGRESS REPORT 2005
13
rural isolation, and HIV/AIDS, and some measures that the Government has taken to address these.
Disability
Data pertaining to persons with disabilities is largely non-existent in Guyana. Estimates from the Pan American Health Organization placed the number of persons with disabilities in Guyana in 1993 at 71,800, and based on the 1991 census, the percentage of the population living with disabilities was then 9 percent. The 2002 census was the first to include specific questions in this area, and provides the most recent estimation of prevalence of disability in Guyana, with 6.7 percent of the population reporting a disability. Persons with disabilities are often the most disadvantaged of all groups in society. Many do not have access to education and employment, which can lead to social and economic exclusion. The situation confronting most people with disabilities in Guyana is one of limited opportunities, limited access to basic social services, lack of programmes, negative social treatment and inability to participate fully in society. Services and facilities are typically inadequate, non-existent or provided on an ad hoc basis. Efforts to mitigate the situation have resulted in the National Policy on Rights of People with Disabilities, which provides for the establishment of a National Commission on Disability (NCD). The NCD was officially launched in December 1997. Its primary functions are to develop and implement programmes to ensure the equalization of opportunities within the framework of the National Policy; advise the government on all issues relating to people with disabilities; and monitor the implementation of the policy. It collaborates with the Ministries of Health, Education, and Labour, Human Services and Social Security, and networks with international disability organizations, the private sector and the Labour Movement. At present, the NCD is undertaking a survey of 1,500 persons with disabilities across four regions in Guyana (4, 6, 7, & 9). The survey is intended to study the characteristics, attitudes, perceptions and needs of persons with disabilities in selected communities. A key activity of the NCD in 2005 is the drafting of legislation to protect the rights of persons in Guyana. The legislation is based upon the National Policy for persons with disabilities, established in 1997. The draft legislation will be presented for Cabinet approval by end 2005.
Geographic Distribution of Access
The provision of social services and the generation of economic opportunity in rural and isolated communities present unique challenges in Guyana. The census figures clearly reveal that the basic needs of communities in hinterland regions are not yet being adequately realized. Rural regions, for instance, have lower percentages than coastal regions of households with access to improved sanitation, and residents in Regions 1, 8, 9 still rely primarily on rainwater collection and wells for drinking water.
POVERTY REDUCTION STRATEGY – PROGRESS REPORT 2005
14
Crucial steps necessary for more equitable geographic development include the development of infrastructure, particularly with regard to communications and access by air, road or boat, and the reform of the local government system. In spite of the prohibitively high cost relative to population numbers, some progress has been made towards improving airstrips, providing boats, increasing the capacity to communicate by radio, and improving the quality of services provided within communities. Line ministries and the BNTF and SIMAP programmes are implementing special intervention strategies with a focus on infrastructure development and access to basic health and education4. The Ministry of Amerindian Affairs has also made significant strides not only in community development but also in supporting and facilitating the empowerment of Amerindian communities.
HIV/AIDS
The rapid spread of HIV/AIDS among the most productive sectors of the Guyanese population has been one of the more daunting challenges facing the nation. In addition to the devastating impact on the lives of infected persons and their families, the deleterious effects of HIV/AIDS on the social and economic fabric of society are by now well understood and documented. Within the past year, the Government has significantly scaled up the scope and intensity of efforts to curtail the spread of HIV/AIDS, and increased capacity to treat and provide care for People Living with HIV/AIDS. These efforts are taking place under the aegis of the Ministry of Health, in partnership with international donors, and international and local NGOs. Some noteworthy results of the enhanced effort include the expansion of Prevention of Mother to Child Transmission (PMTCT) programmes to all ten administrative regions, and the availability of treatment and care programmes in at least one site in all regions. Improved testing capability, a new public health laboratory, and improved home-based care for HIV+ patients are also critical components of the multi-pronged national approach. In addition, considerable resources have been focused on strategies for prevention and behavioral change communication among young people and other particularly vulnerable groups, including incarcerated populations and the disciplined services. These efforts have seen the HIV prevalence rate among blood donors decline from 0.8% in 2003 and 0.6% in 2004.5
4 These issues are dealt with in depth elsewhere in the document. 5 Ministry of Health data.
POVERTY REDUCTION STRATEGY – PROGRESS REPORT 2005
15
Chapter
Review of the Economy, Governance and Institutional
and Regulatory Reforms This chapter reviews Guyana’s progress in meeting its PRSP commitments of generating broad-based economic growth and improving the governance and institutional and regulatory frameworks. It also addresses the following specific areas of intervention: pursuance of prudent macroeconomic policies; policies to support private sector growth and poverty reduction; expansion of the economic base to benefit the poor; restructuring and modernization of the traditional sector; development of new sectors to support growth; good governance; and legislative, institutional and regulatory reforms. For ease of presentation and analysis, the planned actions and implementation outcomes and achievements in 2004 as set out in the last Progress Report, are captured in Annex 1 of the report.
(a) The Macro Economic Framework
Guyana continued to (i) pursue prudent macro economic policies; (ii) manage its external debt situation; and (iii) implement fiscal and monetary reforms. (a) Prudent Economic Policies The economy grew at 1.6 percent reversing the negative growth of 2003. Leading this positive growth rate was the expansion in the sugar sector and services. In sugar, favorable weather conditions led to increases in production of 7.6 percent while growth in the construction, transportation and communications sector, and distribution and financial services accounted for 2.3 percent growth. The mining sector contracted by 6.6 percent on account of a steep decline in gold production principally due to the near completion of operations at OMAI. Bauxite output also fell by 12.4 percent, partly attributable to the continued restructuring of Linmine. The manufacturing sector remained flat. Despite the steep rise in oil prices and its impact on the productive sector and services, the consumer price index registered a growth of 5.5 percent, slightly higher than the 4.9 percent recorded in 2003. On the fiscal front, current revenues rose by 13.8 percent to G$52 billion due largely to increased international tax receipts, the implementation of ongoing tax reforms and growth in direct taxes. On the other hand, current expenditures increased by just under 1 percent. Reduced external interest payments resulting from E-HIPC and the decline in the treasury bill rate contributed to this outcome. Capital expenditure increased by 30 percent to G$22.5 billion, reflecting accelerated implementation of the investment programme. As a result of these developments, the deficit of the non-financial public sector amounted to 4.4 percent of GDP. Complementing the tight fiscal stance was prudent monetary policy, which
3
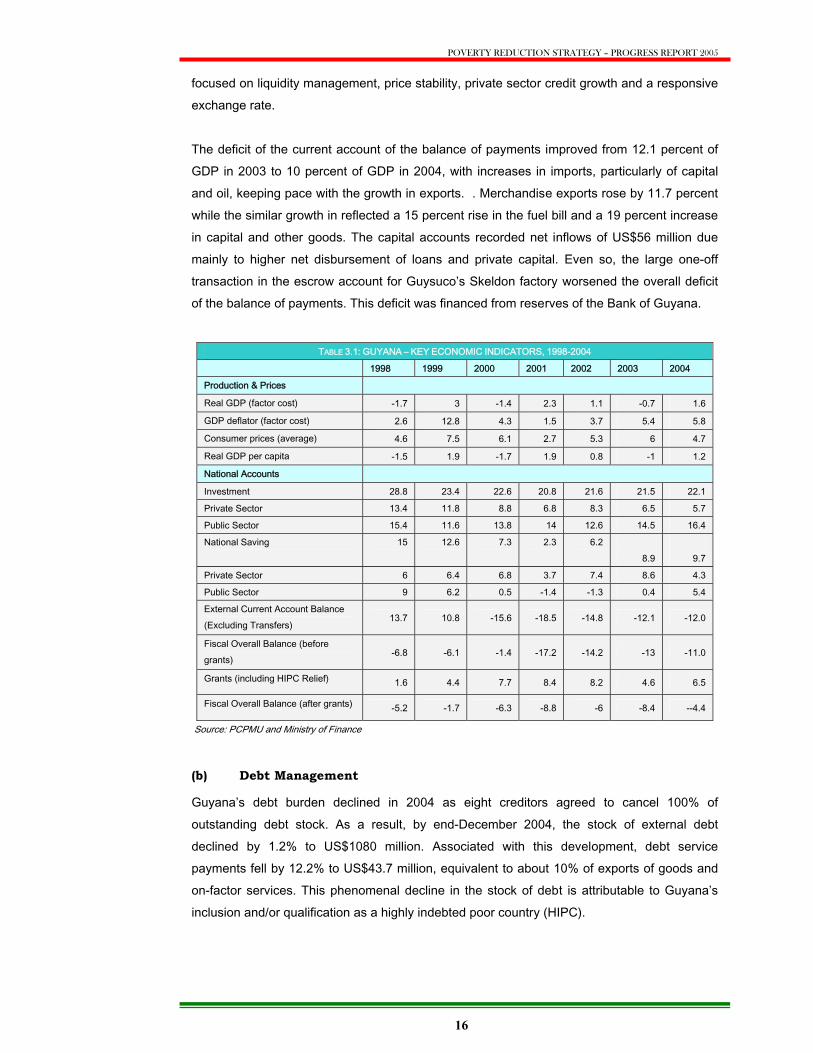
POVERTY REDUCTION STRATEGY – PROGRESS REPORT 2005
16
focused on liquidity management, price stability, private sector credit growth and a responsive exchange rate. The deficit of the current account of the balance of payments improved from 12.1 percent of GDP in 2003 to 10 percent of GDP in 2004, with increases in imports, particularly of capital and oil, keeping pace with the growth in exports. . Merchandise exports rose by 11.7 percent while the similar growth in reflected a 15 percent rise in the fuel bill and a 19 percent increase in capital and other goods. The capital accounts recorded net inflows of US$56 million due mainly to higher net disbursement of loans and private capital. Even so, the large one-off transaction in the escrow account for Guysuco’s Skeldon factory worsened the overall deficit of the balance of payments. This deficit was financed from reserves of the Bank of Guyana.
Source: PCPMU and Ministry of Finance
(b) Debt Management
Guyana’s debt burden declined in 2004 as eight creditors agreed to cancel 100% of outstanding debt stock. As a result, by end-December 2004, the stock of external debt declined by 1.2% to US$1080 million. Associated with this development, debt service payments fell by 12.2% to US$43.7 million, equivalent to about 10% of exports of goods and on-factor services. This phenomenal decline in the stock of debt is attributable to Guyana’s inclusion and/or qualification as a highly indebted poor country (HIPC).
TABLE 3.1: GUYANA – KEY ECONOMIC INDICATORS, 1998-2004
1998 1999 2000 2001 2002 2003 2004
Production & Prices
Real GDP (factor cost) -1.7 3 -1.4 2.3 1.1 -0.7 1.6
GDP deflator (factor cost) 2.6 12.8 4.3 1.5 3.7 5.4 5.8
Consumer prices (average) 4.6 7.5 6.1 2.7 5.3 6 4.7
Real GDP per capita -1.5 1.9 -1.7 1.9 0.8 -1 1.2
National Accounts
Investment 28.8 23.4 22.6 20.8 21.6 21.5 22.1
Private Sector 13.4 11.8 8.8 6.8 8.3 6.5 5.7
Public Sector 15.4 11.6 13.8 14 12.6 14.5 16.4
National Saving 15 12.6 7.3 2.3 6.2 8.9
9.7
Private Sector 6 6.4 6.8 3.7 7.4 8.6 4.3
Public Sector 9 6.2 0.5 -1.4 -1.3 0.4 5.4
External Current Account Balance (Excluding Transfers)
13.7 10.8 -15.6 -18.5 -14.8 -12.1 -12.0
Fiscal Overall Balance (before grants)
-6.8 -6.1 -1.4 -17.2 -14.2 -13 -11.0
Grants (including HIPC Relief) 1.6 4.4 7.7 8.4 8.2 4.6 6.5
Fiscal Overall Balance (after grants) -5.2 -1.7 -6.3 -8.8 -6 -8.4 --4.4
POVERTY REDUCTION STRATEGY – PROGRESS REPORT 2005
17
( c) Fiscal and Monetary Reforms
The Government continued to implement structural reforms to improve its macroeconomic framework and lay the basis for sustained growth. To this end, the Bank of Guyana continued to make substantial progress in banking supervision and prudential regulations. The Financial Institutions Act and the Bank of Guyana Act were amended to strengthen supervision and fiduciary oversight in the financial sector. In addition, the central bank engaged in a number of capacity building exercises, including hosting an anti-money laundering seminar for a wide cross section of stakeholders, bank examiners and inspectors. The Government also began to implement the Fiscal Management and Accountability Act (FMAA) with the passage of its regulations in December 2004. This Act provides for the regulation of the preparation and execution of the annual budget; the receipt, control and disbursement of public moneys; the accounting for public moneys; and other matters connected with or incidental to the transparent and efficient management of the finances of Guyana. The Integrated Financial Management System (IFMAS) also became operational in January 2004. The IFMAS computerized several aspects of the government accounting function, resulting in more efficient processing and recording of transactions and the generation of timely and accurate financial reporting information. The new system also provides accounting officers and their staff with a modern, practical approach to the management of, and accounting for, government expenditure. Reforms were also initiated to strengthen the Project Cycle Management System (PCMS). The design of an institutional model for the PCMS was completed, while work to develop the operating procedures and guidelines for the prioritization of projects in the public sector investment programme, was initiated. In addition, a database of projects, including project profiles and relevant information for monitoring and evaluation is being developed. The completion of this project will improve the design, monitoring and evaluation of the public sector investment programme and will advance ongoing efforts to target resources for poverty reduction. A number of initiatives were also taken to advance tax reforms in 2004. In particular, the Customs Duties (Amendment) Order was issued to minimize discretion in the granting of exemptions. To this end, administrative guidelines and criteria were put in place to aid the granting of exemptions. In addition, in July 2004, the Guyana Revenue Authority (GRA) began the publication of tax exemptions to further improve transparency in the conduct of tax exemptions. In line with this, the Customs (Amendment) Bill was passed. This legislation, which gives effect to the revised Harmonized Commodity Description and Coding System, incorporates amendments made under the Fiscal Enactment Amendment Act, the Customs Duties (Amendment) Order and the decisions of the July Meeting of the Council of Trade and Economic Development (COTED).
POVERTY REDUCTION STRATEGY – PROGRESS REPORT 2005
18
Further, the Guyana Revenue Authority (GRA) updated and enhanced systems for registering taxpayers, accounting for revenue collections and controlling refunds. A committee was established to implement the new Taxpayer Identification Number (TIN) system and the operations of the License Revenue Office were computerized. The operations of the Examination and Investigation, Field Audit, Consumption Tax Audit and Post Assessment Verification Units were consolidated into the Audit and Verification Division. It is expected that this will result in more efficient collection of tax arrears. Under GRA’s anti-corruption programme, a new Internal Affairs Division was mandated to investigate corrupt practices and complaints against employees, and to recommend appropriate disciplinary action. A Monitoring/Surveillance Unit was also established, monitoring officers trained and surveillance equipment installed at the Cheddi Jagan International Airport and Customs Transit Sheds. Policies, procedures, and systems that were implemented for the administration of the following Acts and Customs Orders include:
• Fiscal Enactments (Amendment) Act No. 2 of 2003 • The Customs Duties (Amendment) Order No. 29 of 2003 • The Customs Duties (Amendment) Order No.2 of 2004
Finally, further steps were taken to increase transparency in public tendering and procurement. To this end, legislation was passed to establish a tribunal to hear appeals to decisions of the Public Procurement Commission (PPC). This paves the way for resolution of grievances of the public when the PPC becomes operational. Creating Opportunities for Private Sector Growth
The Government took several steps to create opportunities for Private Sector growth and development. Some of these steps included:
(a) Investment Promotion
In spite of political instability, the Government continued its drive to promote private investment. Two approaches were adopted. First, investors were directly approached about business opportunities in Guyana and second, the investment climate was improved through laws and tax reforms that ensure transparency and security for investors. These measures are beginning to work. In 2004, four large investors began the process of establishing projects in the mining and hospitality industries, with estimated costs of over US$800 million. In the mining sector, the Russian Aluminum Company (RUSAL) invested US$20 million in the Bauxite Company of Guyana Incorporated (BCGI). Cambior also signed a contract to enter into a joint partnership with the Government in Linmine, which will result in the injection of nearly US$40

POVERTY REDUCTION STRATEGY – PROGRESS REPORT 2005
19
million into the privatized company. Two companies were also in negotiations with the Government to establish five star hotels in Guyana. On the domestic front, the Institute of Private Enterprise Development (IPED) continued to play a significant role in the development process and in stimulating entrepreneurship. During the year, IPED funded 1,524 loans valued at G$135 million under the Poor Rural Communities Support Services Project (PRCSSP). IPED also saw an increase in the numbers of their hinterland and Amerindian clients. In addition to the Hinterland Thrust, new developments for IPED in 2004 included an initial outreach to younger clients; the promotion of sustainable aquaculture initiatives in the Takatu area in collaboration with SBARAE, a Brazilian NGO; and the provision of skills training to clients.
The EMPRETEC Programme was launched in 2003 to provide a realistic and focused strategy to promote entrepreneurship in order to contribute to the creation of employment and the eradication of poverty. The program is mandated to provide special support to small and medium enterprises and start up entrepreneurs, and to facilitate access to services such as entrepreneurship training, quality management and control, export support services, networking and assistance in fostering business linkages. Since its establishment, the client base has grown to in excess of 200 whose businesses have shown tremendous expansion. The level of business activity among the EMPRETEC entrepreneurs is also sizeable. The EMPRETEC Centre is currently in the process of assessing the full economic impact of the programme over the last two years. However, preliminary estimates indicate an average increase in employment in these businesses of approximately 60%.
(b) Export Promotion
Many initiatives were undertaken in 2004 in support of export promotion. Efforts were made to streamline the Import and Export License application process, including making application forms available on the web. In addition, the Guyana Office for Investment (GoInvest) hosted three Guyana Trade and Investment Expositions in Trinidad, St. Lucia and Barbados. The expositions are part of a series of road shows hosted by GoInvest throughout the Caribbean, to build awareness of export-ready Guyanese products. GoInvest also aims to expand market share and develop new markets through the overseas Guyanese community; to upgrade skills for trade shows; and to promote trade and investment through meetings and joint ventures. The 2004 expositions showcased about 200 companies from a wide range of sectors, with companies in the fresh and processed foods sector being represented by the Guyana Marketing Corporation, and resulted in export opportunities for many of the participating agencies.
POVERTY REDUCTION STRATEGY – PROGRESS REPORT 2005
20
( c) Expanding the Economic Base to Benefit the Poor
The Government continued to pursue and support the diversification and development of new activities in order to reduce the economy’s dependence on a few primary commodities and to bolster employment, especially in rural, hinterland, and depressed communities. To this end, the Government has been encouraging medium and large scale operators in the gold mining industry to fill the void that will be created by the closure of OMAI Gold Mines. Vanessa Ventures is conducting tests that may lead to the development of an underground mine to exploit gold reserves. Two other companies, Gold Stone Resources and the Guyana Goldfield are conducting similar explorations. In the area of petroleum exploration, the Spanish firm, REPSOL, has joined CGX Energy Inc. in search of oil reserves. CGX invested a further US$7.3 million to drill up to five wells in an area where there is a high probability of gas and oil finds. Ground Star Resources Ltd is also examining the feasibility of exploring oil in the Takutu Basin. Tourism continues to emerge as a promising new growth area, expanding its contribution to national income, foreign exchange earnings and employment generation. In 2004, tourist arrivals broke a ten-year record with numbers of 125,000 and the largest number of cruise ship arrivals.
Restructuring and Modernising the Traditional Sector
Guyana’s traditional sector continues to contribute significantly to growth, job creation and foreign exchange earnings. To sustain these developments in an increasingly competitive global market, the Government is taking several measures to restructure and modernize the sector.
Agriculture
Rural Agriculture
The Government implemented initiatives to support poor rural farmers involved in crop production including rice and sugar. Such support included the rehabilitation of drainage and irrigation schemes, financing through on-lending from IPED, and promotion of microenterprise through financial support for community- based initiatives. In addition, through the Agricultural Support Services Project designed in part to address rural poverty, the Government (i) provided Farmer training in agronomy; (ii) support for the production of pure line seed paddy; (iii) production of improved rice seed to support improved productivity; (iv) established a Pesticides and Toxic Chemicals Laboratory to provide analyses on crop residues to ensure
POVERTY REDUCTION STRATEGY – PROGRESS REPORT 2005
21
safe levels with relevant environmental data; and (v) provided support for the establishment and maintenance of quality standards. A Veterinary Surveillance laboratory to maintain checks on animal health and disease was also established.
The Sugar Sub-sector
The restructuring and modernization of the sugar sector continues apace. In the sugar sector, the Guyana Sugar Company (Guysuco) continued to implement its shareholders agreement with the Government. The company continues to reduce its cost of operations with emphasis on containing its wage bill through voluntary attrition, and by keeping wage increases in tandem with inflation. Sugar cane fields are also being developed in the Skeldon area to allow for increased production to support the new factory. Furthermore, incentives are being given to private cane growers to supply Guysuco. This will help reduce overhead and improve the efficiency of the industry. The company has also partially moved from Annual Productivity Incentives (API) to Profitability Incentives. To this end, the new management contract incorporates key features that tie bonuses and other payments to the company’s profitability, cost reductions and productivity indicators such as factory efficiencies. Guysuco completed all agreements leading to the construction of a new sugar and cogeneration factory at Skeldon. Agreements were signed with the turnkey contractors in July 2004, and the concessional loan facility was extended from the Government of the People’s Republic of China to facilitate the construction of a cogeneration plan. The cogeneration facility will supply 10 megawatts of electric power to the national grid in Berbice. Progress is also being made with the Agricultural Improvement Programme, as evidenced by the increasing trends of sugar production in the Demerara estates. The Rice Sub-sector In spite of challenges resulting from increased cost of inputs, drainage and irrigation problems and delayed payment to farmers by some millers, there were significant improvements in the rice industry in 2004. Although there was a reduction in paddy production during the year, exports increased in 2004 to 243,093 tonnes or US$55,066,534.00, the highest export value since 1999. This figure is an indication that the industry is recovering from the decline in export values of the recent past, which were due mainly to difficulties in both the CARICOM and EU markets. Table 3.2 lists rice statistics for the past six years. Some of the 2004 increase in export volume was due to the increased production in the first quarter of 2004. Some success can also be attributed to the increase in the price during the second crop, with cargo rice
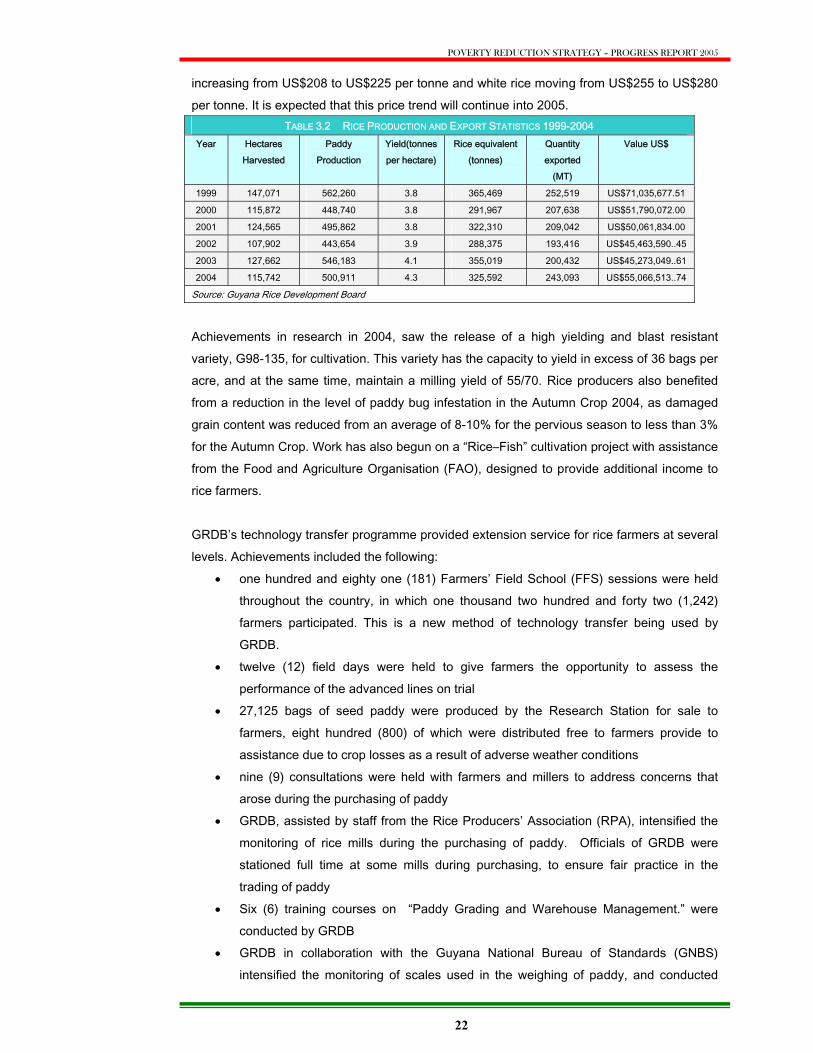
POVERTY REDUCTION STRATEGY – PROGRESS REPORT 2005
22
increasing from US$208 to US$225 per tonne and white rice moving from US$255 to US$280 per tonne. It is expected that this price trend will continue into 2005.
TABLE 3.2 RICE PRODUCTION AND EXPORT STATISTICS 1999-2004 Year Hectares
Harvested Paddy
Production Yield(tonnes per hectare)
Rice equivalent (tonnes)
Quantity exported
(MT)
Value US$
1999 147,071 562,260 3.8 365,469 252,519 US$71,035,677.51
2000 115,872 448,740 3.8 291,967 207,638 US$51,790,072.00
2001 124,565 495,862 3.8 322,310 209,042 US$50,061,834.00
2002 107,902 443,654 3.9 288,375 193,416 US$45,463,590..45
2003 127,662 546,183 4.1 355,019 200,432 US$45,273,049..61
2004 115,742 500,911 4.3 325,592 243,093 US$55,066,513..74
Source: Guyana Rice Development Board
Achievements in research in 2004, saw the release of a high yielding and blast resistant variety, G98-135, for cultivation. This variety has the capacity to yield in excess of 36 bags per acre, and at the same time, maintain a milling yield of 55/70. Rice producers also benefited from a reduction in the level of paddy bug infestation in the Autumn Crop 2004, as damaged grain content was reduced from an average of 8-10% for the pervious season to less than 3% for the Autumn Crop. Work has also begun on a “Rice–Fish” cultivation project with assistance from the Food and Agriculture Organisation (FAO), designed to provide additional income to rice farmers.
GRDB’s technology transfer programme provided extension service for rice farmers at several levels. Achievements included the following:
• one hundred and eighty one (181) Farmers’ Field School (FFS) sessions were held throughout the country, in which one thousand two hundred and forty two (1,242) farmers participated. This is a new method of technology transfer being used by GRDB.
• twelve (12) field days were held to give farmers the opportunity to assess the performance of the advanced lines on trial
• 27,125 bags of seed paddy were produced by the Research Station for sale to farmers, eight hundred (800) of which were distributed free to farmers provide to assistance due to crop losses as a result of adverse weather conditions
• nine (9) consultations were held with farmers and millers to address concerns that arose during the purchasing of paddy
• GRDB, assisted by staff from the Rice Producers’ Association (RPA), intensified the monitoring of rice mills during the purchasing of paddy. Officials of GRDB were stationed full time at some mills during purchasing, to ensure fair practice in the trading of paddy
• Six (6) training courses on “Paddy Grading and Warehouse Management.” were conducted by GRDB
• GRDB in collaboration with the Guyana National Bureau of Standards (GNBS) intensified the monitoring of scales used in the weighing of paddy, and conducted
POVERTY REDUCTION STRATEGY – PROGRESS REPORT 2005
23
three demonstrations to assist farmers in the use of the mechanical and electronic bulk scales.
Guyana’s main rice markets continue to be the European Union (EU) and CARICOM but in 2004, sales of rice to non-traditional markets, including Brazil, Peru, Dominican Republic and Haiti, increased. Support for the non-sugar and non-rice agriculture sector resulted in the fostering of the growth of domestic markets for local produce and the expansion of extension services to support small-scale agriculture. To this end, the Ministry of Agriculture provided extension services to farmers and the New Guyana Marketing Corporation (NGMC) facilitated marketing services to agro-processors and exporters of products within the non-traditional sector. Further, NGMC provided technical advice and training to farmers, agro-processors and exporters and established a pack house to facilitate the processing of fresh produce for the Caribbean market, primarily for produce destined to Barbados, Antigua and St. Lucia. The Fishery and Livestock Sub-sectors Special emphasis was also placed on improving productivity in the fishery and livestock sectors. Significant progress in the areas of aquaculture and marine fisheries resulted in the aquaculture fish stations at Mon Repos and Anna Regina producing a steady supply of fingerlings, some of which were distributed to farmers in the respective regions. An FAO project on Integrated Fish Farming in Region 6 has been progressing well. With respect to marine fisheries, the Fisheries Department has been coordinating with the Caribbean Regional Fisheries Management (CRFM) to carry out assessments on three (3) species of great economic importance: seabob, sea trout and red snapper. As of December 2004, the National Dairy Development Programme (NDDP) had established over 1,044 acres of pasture benefiting more than 70 farmers, and rendered 2,721 inseminations to improve the national herd. In addition, as part of its assistance with technological transfer, the NDDP established feedlots in Regions 4, 5 and 6 with funding from the CDB. These feedlots are to be used as models for individual farmers. The NDDP also improved access to the Caricom market for Guyana beef and in 2004, beef was exported to Grenada. NDDP sought to further strengthen export capabilities by approaching several funding organizations to finance the construction of an abattoir to meet the required standards for the exportation of beef. In spite of these improvements, the NDDP noted a reduction in the cattle population resulting from a number of factors, including increased enforcement of public health regulations, poor market opportunities, migration and cattle rustling. There is also a shortage of land for cattle rearing purposes and improved pasture establishment, due to competition for the resource for crops and housing.
POVERTY REDUCTION STRATEGY – PROGRESS REPORT 2005
24
The Guyana Marketing Corporation highlighted limited capacity as a key challenge to the exportation of non-traditional agricultural produce. In particular, transportation problems, limited air cargo space and a lack of consistency in the quality of some produce, limit the list of admissible products entering the US market. These contribute to a negative perception of Guyanese products in external markets.
Forestry
Investments in the forestry sector led to the establishment of two new projects-- Karlam Timbers Limited and Caribe Products International--and the expansion of the operations of Barama Timber Company, Demerara Timbers Limited, Tradewind Marine Industries and the Guyana Furniture Manufacturing Company, resulting in the recruitment of new workers into the sector.
Mining As with the sugar industry, the mining sector, and particularly the bauxite sub-sector, is undergoing major restructuring. The private sector companies have now taken over the operations of Guyana’s bauxite mining company, with Omai Bauxite Company (formerly Linmine) already re-employing 575 staff. Omai Bauxite Company has so far invested over US$15 million towards restructuring the company. While OBMI’s efforts will be directed initially towards refractory bauxite production, sufficient resources have been made available by the Government to permit the evaluation of, and supply for, an alumina plant project. Discussions in this regard are underway. The privatization of Linmine assets through the creation of OBMI has reduced, virtually to zero, the large sums that were being provided to Linmine to finance its operations. However, residual obligations remain to support a Linmine Secretariat and to fund electricity subsidies in the area, even while government works to disengage from a prior arrangement with Linden Power Company. To this end, Omai Services Company is establishing a 15 MW power station to ensure reliable power generation. Considerable progress was also made towards identifying investors and initiating negotiations for the new alumina plant. In 2004, a Memorandum of Understanding (MOU) was signed with the Russian Aluminum Company (RUSAL) to facilitate a feasibility study of an alumina plant in Linden. In summary, within the mining sector, the following major projects were completed or initiated in 2004:
Canadian International Development Agency (CIDA)-Guyana Environmental Capacity Development Projects for mercury source characterization and miners’
POVERTY REDUCTION STRATEGY – PROGRESS REPORT 2005
25
environmental awareness training. These activities will come to a close in mid 2005, but will be extended through the Mining Management Improvement Project
Re-vegetation trials for bauxite spoil areas Development of a land management system based on active resource
identification, allocation based on merit and tenure holding based on beneficial occupation
Identification and mitigation of key issues for pollution reduction Tertiary training for technologists and professionals in geological engineering
streamed towards mining, environment, and geology.
In spite of this progress, key challenges remain. These include the need to overcome deeply ingrained habits relating to environmental practices; the need for better physical infrastructure and communications; and the reduction of the impact of health risks endemic to the sector. It is also necessary to develop adequate monitoring and inspectorate mechanism, and to improve technical and professional training and commitment.
Developing New Sectors to Support Growth
In 2004, increased operations and the expansion of many new sectors supported economic growth. Significantly, in the Information and Communications Technology Sector, GoInvest and the Office of the Prime Minister facilitated seven investments resulting in the creation of two hundred and sixty-two new direct jobs. These included two expansion projects by the Guyana Telephone and Telegraph Company (GT&T) and the Nand Persaud International Communications Call Center. Three new projects -- Cel*Star, Broadband and the GuyTech International Call Center initiated operations in 2004.
Institutional and Regulatory Reforms
The Government continued to improve the institutional and regulatory frameworks with a view to enhancing the business environment for private sector investment and sustained growth. Key reforms were implemented in the areas of legislation, public sector reform, land development and allocation, public accountability, governance and crime. (i) Reforms to Enhance the Business Environment
The Government implemented an ambitious legislative and regulatory reform agenda to advance its support for economic growth. The Ministry of Tourism, Industry and Commerce recently drafted the Competition and Fair Trading Bill, which will be laid before Parliament in June 2005. The objective of the Competition and Fair Trading Bill are to: (a) promote, maintain, and encourage competition and enhance economic efficiency in production, trade, and commerce; (b) prohibit anti-competitive business conduct which prevents, restricts or distorts competition or constitutes the abuse of a dominant position in the market; and (c) promote the welfare and interests of
POVERTY REDUCTION STRATEGY – PROGRESS REPORT 2005
26
consumers. The Bill establishes a national Competition Commission that shall carry out the functions necessary to give effect to the Bill, granting it the power to investigate potential abuses, prohibit anti-competitive agreements or activities, and levy fines. The Bill also grants powers of investigation and sanction to the CARICOM Regional Community Competition Commission, which shall be authorised to act with regard to cross-border competition issues, as described in Article 174 of the Revised Treaty of Chaguaramas. In addition, private sector commercial activity continues to be facilitated through the processing of trade licenses, efforts to address Caricom Common External Tariff waiver requests and assess local impacts of external trade policies. Other important legal and regulatory laws that were passed in 2004 included:
• the Small Business Act to facilitate the establishment of a small business council, a small business bureau and a small business development fund;
• the Investment Act to stimulate the socio-economic development of Guyana and to attract and facilitate investment;
• the Technical and Vocational Education and Training Act; and • the Bill to Combat Trafficking in Persons.
Within the mining sector, a complete redrafting of the Mining Regulations took place in 2004. Mine Safety and Health Regulations were also drafted via the Ministry of Labour and Social Security and the International Labour Organization, and await final inter-agency review. Substantial progress was made by the Guyana National Bureau of Standards (GNBS) in developing, implementing and coordinating several reforms to improve product quality for domestic consumption and exportation in 2004. To this end, GNBS, in collaboration with the Caribbean Programme for Economic Competitiveness, progressed in its efforts to have eight Guyanese companies certified to the ISO 9001 Quality Management Standard. The companies include Guysuco, the Guyana National Shipping Corporation, the Guyana National Industrial Corporation, and Guyana Stockfeeds Inc. To safeguard consumers’ rights and equity in trade, GNBS carried out widespread accuracy verification of commercial scales, measures, meters and pumps, as well as surveillance at markets and businesses to ensure that all devices used in commerce are tested and stamped. The operations of the jewellery industry were enhanced with six workshops, including training on marketing requirements for gold jewellery, the testing of gold samples, and the certification of two establishments. Ninety-eight importers were registered for the importation and retailing of commodities monitored by the GNBS.
POVERTY REDUCTION STRATEGY – PROGRESS REPORT 2005
27
Eight sector committees of the National Committee on Conformity Assessment were established and a plan of action was developed for the establishment of a National Conformity Assessment System. Twelve Guyana Standards covering a range of subjects, including brewery products, carbonated beverages, and occupational health and safety, have been formulated and published. Two Caricom Standards for the Specification of Rum and the Specification for Labelling of Brewery Products were adopted as national standards. Three laboratories in Guyana developed their laboratory management system to meet the requirements of the ISO 17025 standard for accreditation.
(ii) Land Development and Allocation
The Guyana Lands and Surveys Commission is responsible for the management of public lands in Guyana, including leasing and other forms of titling of public lands and undertaking surveys required for titling. Its mandate also encompasses the development of land policy and land use plans. These are important elements in the PRSP, which sets targets with respect to issuance of land titles, surveys, and the financial sustainability of the operations of the Commission.
With respect to land titling, the Commission has computerized the application and lease issuance processes, allowing for monitoring, evaluation and the disaggregation of applications and titles issued. The parcel database has also been computerized using the geographic information systems software ARCVIEW. This enables the monitoring of leases on the ground on a parcel-by-parcel basis. The Commission’s financial sustainability function was also automated using ACCPAC, allowing for networking between the finance and lease issuance divisions through the rent portfolio, as well as the tracking of revenues against costs. Work to computerize the Land Registry records will be completed by the end of 2005. The Commission tenured leases and titles for 5900 parcels of land in 2004, and titles were registered for more than 200 urban parcels. The Commission is also on target to meet its goal to reduce the time for Land Registry Transfers by private landowners, by the end of 2005. Associated with reforms ongoing at the GLSC, significant progress was made towards strengthening the Deeds Registry through enhancement of its physical structure and IT capabilities, the training of staff, and the identification and revision of laws and procedural aspects of laws necessary to facilitate more efficient functioning of the Registry. The Deeds Registry is
POVERTY REDUCTION STRATEGY – PROGRESS REPORT 2005
28
charged with establishing an improved system to process transports, mortgages, intellectual property rights, business names, companies, trade unions and related matters, in a timely manner.
(iii) Public Accountability and Governance In 2004, the Parliament of Guyana took measures to create a unified platform to increase its oversight of the Executive for better decision-making on national issues. Additional Parliamentary Committees were appointed and established for: Assembly; Standing Orders; Social Services; Foreign Relations; Economic Services; Natural Resources; Appointment of Constitutional Commissions; Constitutional Reform; Privileges; Public Accounts; Selection; and Management. Oversight functions were reposed in the four Sector Committees namely Natural Resources, Economic Services, Foreign Relations and Social Services. Terms of reference of the committees are being developed and so are the rules of engagement. The main objectives of the Sectoral Committees are to: • summon persons to provide evidence and to scrutinize Government
documents and records; • review the programmes and projects undertaken by the Executive, and
agreed and arranged by the committees; • utilize the advisory services of experts in the discharge of their
mandates; and • submit periodic reports to the National Assembly on the status of their
work. On the commitment by Parliament to put measures in place for the strengthening of institutional capacity and the functional operations of the National Assembly, the Commonwealth Parliamentary Association provided a consultant to work directly with and provide advice to the Speaker and Clerk of the National Assembly. Steps were also taken to engage the services of specialists and other sources of advice for the Sector Committees. In addition, UNDP facilitated the construction, furnishing and equipping of an Information Technology Centre in the Public Buildings. Finally, the Ministry of Finance developed internal control of expenditures with the installation and implementation of the Integrated Financial Management Systems (IFMAS).
(iv) Local Government
In 2004, efforts continued to be made to promote capacity building and institutional strengthening within the local government system, with the Ministry of Local Government responsible for overseeing, coordinating and
POVERTY REDUCTION STRATEGY – PROGRESS REPORT 2005
29
ensuring local government organs’ conformity to the laws of Guyana and the policies of the Government. The Ministry’s 2004-2007 work programme included the dissemination of national policies for implementation by the Regional and Local Government Administrations, and the provision of technical advice and guidance to ensure compliance with the laws that govern these entities. Within the 10 Administrative Regions, the Ministry is responsible for the rehabilitation, maintenance and construction of roads, bridges, drainage and irrigation, power generation and other infrastructural works. The Ministry is also charged with monitoring two projects: Phase II of the Urban Development Programme and the Municipal Solid Waste Disposal Programme. Progress in 2004 included the establishment and incorporation of the Municipal Services Department into the Ministry of Local Government and Regional Development. The Department oversees maintenance and development of infrastructure within the six municipalities. The Ministry coordinated and implemented activities under the Guyana Municipal Governance and Management Programme, a five-year project to strengthen local governance and management within the municipalities of Guyana. In an effort to improve accountability, eight Regional Development Officers were appointed to monitor and evaluate capital works contracts within the various Regional Democratic Councils. These Officers, however, require the requisite training to ensure the efficient and effective delivery of goods and services. The Ministry’s capacity for data collection was also enhanced by the acquisition of seven computers in 2004. In spite of such progress, the work of the Ministry continues to be hampered by resource constraints, including inadequate staffing and a lack of equipment such as computers and printers.
(v) Decentralisation of Public Services
In the 2004 PRS Progress Report, the government committed itself to decentralising basic services to the Administrative Regions, particularly with regard to the issuance of birth and death certificates, passports, house lots and land titles, and the processing and facilitation of exports. The Ministry of Home Affairs has since established branches of the General Registrar’s Office in New Amsterdam and Anna Regina for the issuance of birth and death certificates, and the issuance of passports is now the responsibility of the Immigration Units within the Police Division of these two counties. In addition, the General Registrar’s Office in collaboration with the Ministry of Amerindian Affairs also undertook an outreach exercise to Regions 1, 8 and
POVERTY REDUCTION STRATEGY – PROGRESS REPORT 2005
30
10 to register persons and issue birth certificates for hinterland communities. Collaboration with the Geology and Mines Commission (GGMC) has also resulted in the registration and issuance of work permits to foreign miners working illegally in Guyana’s hinterland. The Ministry of Home Affairs has identified Information Technology as a tool to improve administrative and operational efficiency in the six departments under its portfolio. The first phase of computerisation is complete, including a survey funded by the Caribbean Development Bank (CDB) and conducted by International Business Machines, which examined the structure, function, operational systems and the medium and long term IT goals of the departments. The reports emanating from the surveys included recommendations for achieving the technological goals of the departments. The second phase of this project will see the acquisition and installation of IT systems, the training of local personnel and on-going maintenance.
(vi) Justice System and Crime Prevention The Guyana Prison Service is implementing its 2001-2011 Strategic Plan, which prioritises the use of Information Technology to improve its administrative and operational efficiency. Because of its high population density and sometimes unsanitary conditions, the prison environment is one that facilitates the transmission of infectious diseases not only within the institution but also in linked communities. The health of prisoners and the prison environment was therefore given high priority in 2004. In particular, prophylactics for malaria, filaria, small pox and other infectious diseases were administered to inmates on admission to the five prisons. In addition, professional nurses were engaged, staff trained and medical supplies procured to bolster these efforts. Health education for staff and inmates is ongoing, and an important component of this programmes focuses on HIV/AIDS. Included in the Guyana Prison Serv-ice Strategic Development Plan 2001-2011 is the reorganization and expan-sion of priso-ner retraining programmes to develop basic literacy and mathematical skills. A parallel curriculum provides practical training in high-demand sectors. These are remedial programmes meant to reduce the likelihood that ex-inmates will return to crime and to develop their capacity to contribute to their families and comm.-unities.
To confront and suppress violent crime in 2004, the Government of Guyana, through budgetary allocations, provided the Guyana Police Force with the manpower and

POVERTY REDUCTION STRATEGY – PROGRESS REPORT 2005
31
equipment necessary to improve the organisation’s operational capacity. Several police stations were repaired and/or fortified, and a new station is under construction in Sophia. Under the aegis of a new Commissioner, the Police Force is now better equipped to confront the challenges of national security. While gains made over previous
years were consolidated, efforts continued to be made in improving the image of the Force. In spite of this, major challenges remain with regard to financial and human resources.
Other reforms articulated in the Crime Action Plan of the Forces’ Strategic Development Plan 2002-2006 which were implemented in 2004 included:
(a) promoting and facilitating community policing; (b) creating a legal framework for the protection and operation of
persons involved in community policing; (c) enhancing the ability of detectives to conduct criminal investigations; (d) developing an intelligence-led policing style and improving the
quality of patrolling; and (e) providing a more efficient police prosecution system in the courts.
These measures have yielded some progress, with murder and robbery with aggravation declining for the period under review. Table 3.3 above provides a summary of violent crimes over the last four years.
The Disciplined Forces Commission
The Disciplined Forces Commission established in July 2003 for a period of 6 months, was extended for 3 additional months and concluded in March 2004. The purpose of the Commission was to investigate allegations of police brutality during a period when the country experienced an upsurge of armed robbery, murder, drug-related crime and narco-trafficking. The Disciplined Forces Commission was constituted by the National Assembly to examine matters relating to public welfare, safety, order, defense and security, including the structure and composition of the Disciplined Forces, and to make recommendations to promote their greater efficiency in meeting the needs of the public interest.
TABLE 3.3: GUYANA-SUMMARY INDICATORS OF
VIOLENCE/CRIME, 2001-2004
2001 2002 2003 2004
Murder 79 142 206 131
Manslaughter 8 10 18 ….
Robbery 38 18 17 28
Robbery under arms 1,005 1,620 1,004 1,100
Robbery with violence 222 252 172 149
Robbery with aggravation 112 134 113 58
Larceny from the person 449 411 287 317
Rape 117 137 122 170
Burglary 419 428 409 382
Source: Ministry of Home Affairs
POVERTY REDUCTION STRATEGY – PROGRESS REPORT 2005
32
The Commission was charged with taking into account the changing nature of crime resulting from increased trafficking of illicit drugs and firearms, backtracking and money laundering; the relevance and recommendations of the International Commission of Jurists with regard to racial imbalance in the Disciplined Forces; terms and conditions of employment, remuneration, training, accommodation, criteria for promotion, discipline, equipment and logistical needs; and rules and regulations governing the issuance of firearm licenses. The findings of the Disciplined Forces Commission were presented to Government and put before the National Assembly for discussion at a Parliamentary Sub-Committee on Disciplined Forces. Work is ongoing with respect to examination of recommendations made by the Commission. The National Assembly has not been able to establish the Human Rights Commission due primarily to the need for approval of membership. Dialogue continues on appointments to the Commission.
POVERTY REDUCTION STRATEGY – PROGRESS REPORT 2005
33
Chapter
INVESTMENT IN HUMAN AND SOCIAL SERVICES
Investment in Human Capital
Guyana continues to make strides in developing its human and physical infrastructure. Social sector spending as a share of GDP is perhaps, one of the highest in the Western Hemisphere and in E-HIPC countries. Table 4.1 provides a summary of social sector spending over the period 1997-2004. Social sector spending presents the original HIPC expenditures while total social sector spending includes sectors that were not originally provided for in the original programme.
Table: 4.1 Guyana: Social Sector Spending 1997 - 2004 1997 1998 1999 2000 2001 2002 2003 2004
Unless otherwise indicated as percent of GDP
Current 5.4 7.4 9.5 11.3 11.9 12.9 11.5 11.5
Personnel emoluments 4.2 3.8 5.6 5.5 5.7 6.2 6 5.8 Education 2.6 2.8 3.6 3.9 4 4.5 4.4 4.2 Health 1.6 1 2 1.6 1.7 1.7 1.6 1.6Other 1.2 3.6 3.9 5.8 6.2 6.7 5.5 5.7 Education 0.2 1.4 1.5 1.6 2 2.3 2.4 2.7 Health 0.8 1.6 1.8 1.9 1.7 2.2 2.2 2.1 Poverty Alleviation 1/ 0.2 0.6 0.6 2.3 2.5 2.2 0.9 0.9Capital 8.3 6.4 6.1 7.1 7.3 5.6 5.6 5.6 Education 1.2 1.3 1.1 2.3 2.7 2.2 1.3 1.3 Health 0.4 0.1 0.3 0.2 0.1 0.2 0.8 0.6 Poverty Alleviation 1/ 6.8 5.0 4.7 4.6 4.5 3.2 3.5 3.7 Housing and Water 1.5 1.6 1.5 1.9 1.6 1.6 3.2 3.1 Current 0.7 0.4 0.6 0.5 0.4 0.6 0.7 0.7 Personnel emoluments 0 0 0 0 0 0 0 0 Other 0.7 0.4 0.6 0.5 0.4 0.6 0.7 0.7 Capital 0.8 1.2 0.9 1.4 1.2 1 2.5 2.1Public Service Reform 2/ 0 0 0 0.3 0 0.8 1.1 0.1Total Social Spending 15.2 15.4 17.1 20.6 20.8 20.9 21.4 20.0EHIPC CP Social Spending 3/ 13.7 13.8 15.6 18.4 19.2 18.5 17.1 17.1
Total Current Spending 6.1 7.8 10.1 12.1 12.3 14.3 13.3 12.3
Total Capital Spending 9.1 7.6 7 8.5 8.5 6.6 8.1 7.7
Personnel emoluments/SS 27.6 24.7 32.7 26.7 27.4 29.7 28.0 29.0
Education 17.1 18.2 21.1 18.9 19.2 21.5 20.6 21.0
Health 10.5 6.5 11.7 7.8 8.2 8.1 7.5 8.0
Nominal GDP at market prices in billions of Guyana Dollars
106.7 108 120.7 130 133.4 137.8 143.8 154.6
Sources: Guyanese Authorities, IMF Publication (EBS/05/5) 1/ Includes SIMAP, BNTF, IFAD Rural Support Project and other poverty related programs 2/ Includes severance payments for civil service reform as well as safety net programs for Linmine workers in 2003. 3/ This is the definition used in the context of the Enhanced HIPC Completion Point. It excludes housing and water and public sector reform
4
POVERTY REDUCTION STRATEGY – PROGRESS REPORT 2005
34
Recurrent expenditures, and in particular, materials and supplies and personal emoluments account for about 60 percent of social sector spending while investment programmes, such as rehabilitation and/or construction of social facilities account for the remainder. Expenditure in the education sector represents about 40 percent of total social sector spending in 2004, poverty alleviation programmes--principally SIMAP and BNTF--account for 23 percent of spending. Housing, water and health make up the remainder. The impact of these programmes is reflected in the PRSP indicators. This chapter reviews the progress made in investments and human and physical infrastructure in 2004.
Education
The PRSP establishes education as a national priority and one of the major components of poverty reduction. Within this framework, education is not only a tool for development and decreasing poverty but increasing the level of formal and non-formal education of the population is a goal in its own right. In keeping with this perspective, the 2003-2007 Strategic Plan for Education reflects the government’s commitment to reducing illiteracy, repetition and dropout rates, increasing secondary school enrolment and improving the quality and relevance of education for all Guyanese. The Ministry of Education’s medium term strategy is clearly outlined in the Strategic Plan and relates specifically to two pillars of the PRSP:
• investment in human capital with emphasis on basic education and primary health care; and
• stronger institutions and better governance. Education sector activities such as school feeding programmes and subsidies to poor and vulnerable children also contribute to the achievement of the PRS pillar of improved safety nets. Progress in the education sector over the period of review is captured in Table 4.2.
TABLE 4.2: KEY EDUCATION INDICATORS, 2000-2004
Enrolment and Literacy 2001 2002 2003 2004
% of primary school entrants reaching grade 6 83.5 88.3 88.3 89.1
Repetition rate (secondary) 12.9 12.6 11.8 10.6
Drop-out rate (primary)1 8% 8% 8% NA
Drop-out rate (general secondary) 10% 10% 10% NA
Student/trained teacher ratio (primary) 50.1 50.1 51.1 50: 1:
Student/trained teacher ratio (general secondary)2 39.1 38.1 39.1 40.1
Gross nursery school enrolment3 87 88 91 92
Gross primary school enrolment3 107 105 104 101.7
Gross secondary school enrolment3 65 65 65 73
% Trained teachers in primary schools4 53 54 56 58.9
% Trained teachers in secondary schools 58.5 58.5 57.1 54.2
% of CSEC passes5 74.5 77.1 75.8 76.6
Source: Ministry of Education
POVERTY REDUCTION STRATEGY – PROGRESS REPORT 2005
35
(i) Improvement in the Quality of the Delivery of Education An improvement in the quality of the delivery of education, especially in the areas of literacy and numeracy, continued to be the primary objective for the sector, and significant progress was made in achieving indicators set for 2004. The Curriculum Development Unit of the National Centre for Educational Resource Development (NCERD) developed literacy and numeracy standards for Nursery 1 to Grade 2 Primary. These facilitated the development of Indicators/Scope and Sequence charts and curriculum guides, and the development of the Interactive Radio Instruction (IRI) curriculum for mathematics. Curriculum Guides were also developed for Visual Arts (Grades 1 to 11) and Primary Music (Grades 1 to 6). Work is ongoing on the development of similar material for Spanish at the Primary level. A new methodology to improve the teaching of reading was developed, and the first set of Masters trainers and cluster advisors were employed and trained under the Basic Education Access and Management Support (BEAMS) programme. In 2004, twenty lecturers graduated from an innovative programme to provide pedagogical training to instructors of technical and vocational education and training (TVET). The TVET institutions were proactive in improving the quality of their trainees. These institutions now offer remedial classes in English, Mathematics and Reading, and a module on Entrepreneurship. The use of the computer as a teaching/learning tool is also being emphasised by the institutions. The launch of the new literacy and mathematics methodologies were delayed by difficulties in procuring literacy material and radios for the mathematics programme. The programme is, however, being piloted in a number of schools on the coast and in the hinterland. Work on assisting schools with the development of School Improvement Plans (SIP), with improved delivery of the curriculum as a priority, is going slower than anticipated with fewer than fifty percent of schools having completed SIPs and a much smaller proportion (fewer than twenty percent) having been approved. Under this strategic objective, the development and ongoing implementation of a national awareness programme to the new approaches will be ongoing throughout the planned period. A commission to advise the Ministry on curriculum reform was also established in 2004.
(ii) Teacher Training
Improving the quality of staff remains a priority for the education sector. A Council for Teacher Education was tasked with better coordinating programmes of teacher
POVERTY REDUCTION STRATEGY – PROGRESS REPORT 2005
36
training at the Cyril Potter College of Education (CPCE) and the University of Guyana. The NCERD programme to train head teachers and other senior administrators was also successful, with 201 persons graduating in 2004. CPCE is now delivering the Teacher Training Certificate programme by distance education to two hinterland regions, Regions 1 & 9. Ninety-six teachers are currently enrolled in the programme.
Data from the ten administrative regions shows that the proportion of trained teachers at the nursery level grew from 40 percent to 46 percent over a three-year period. However, it should be noted that the number of students at this level in public schools continues to decline and as a consequence, the teaching force has been reduced. While there has been some increase in the number of students in private nursery establishments, this does not fully explain the decline in public schools, which may be attributable to a number of factors. There was also a slight decline of about 1 percent in the proportion of trained teachers at the primary level in spite of an increase in the numbers being trained, suggesting a higher attrition rate and/or migration of teachers than in previous years. It is not surprising that the largest decline in trained teachers (about 6%) has been at the secondary level, as their superior academic qualifications make them more marketable both within and outside of Guyana.
(iii) Improving Equity in the Education Sector
Significant progress has been made over the last two years in increasing the number of students who are in General Secondary Schools and who have an opportunity to take Secondary School Certificate Examination of CXC. The number of Primary Tops was reduced by thirty-five and the number of Community High Schools by three, while the number of General Secondary Schools was increased by six. The construction, extension and repair of other secondary schools under the civil works component of the BEAMS programme, will increase the number of students who will benefit from a general secondary education programme. The Basic Competency Certificate Programme (BCCP), an alternative pathway for secondary students including those with high academic qualifications and an interest in technical subjects, was launched in six pilot schools in January 2004. However, difficulties in accessing funding resulted in a reduction in the number of workshops planned to introduce teachers to the new programme. In the area of Special Needs Education, the Organisation of American States (OAS) is supporting the project “Meeting Special Needs in the Classroom”, and this has already resulted in the equipping of a special resource unit at the Cyril Potter College

POVERTY REDUCTION STRATEGY – PROGRESS REPORT 2005
37
of Education (CPCE). A new module on Special Needs Education is in draft form and all teacher trainees will be sensitised on its delivery.
(iv) Increasing the Level of Commitment of Students, Parents and Communities
The promotion of greater stakeholder participation in the education process has been a major goal of the Ministry for many years, and efforts to intensify such participation are ongoing. The baseline survey conducted under the BEAMS programme revealed that about 80 percent of schools have Parent Teacher Associations (PTAs), which meet at least once per year. Most regions also have Regional Education Committees, which meet regularly and monitor education activities in the regions. The National Advisory Council on Education (NACE) continued to function in 2004, with some members constituting a Task Force working on recommendations for the New Education Act. However, in spite of Cabinet approval for the establishment of this body more than two years ago, no funds have been made available for it to carry out its mandate.
(v) Strengthening Financial and Management Systems
Many of the initiatives to achieve this strategic objective are being carried out under the BEAMS programme. Specialists were placed in key units to assist in recommending reforms for the various departments, and Regional Information Technology Officers were appointed in all regional education departments as well. The Ministry also reviewed policies and set criteria to monitor and assess school effectiveness, order and discipline in education institutions, and contributions to schools by parents/stakeholders. Guidelines to standardise lesson preparation at educational institutions have also been prepared.
(vi) National Assessments
The new teaching methodologies for mathematics and literacy emphasise ongoing school-based assessment and the Ministry is therefore implementing national assessments at key stages in its programme. In 2004, a survey of eight of the eleven education districts collected baseline data on the quality of education, including the professional and academic qualifications of staff, the availability of learning/teaching materials, managerial practices, and relationships with the community. The information from this survey will be the basis of judging progress in future years. This exercise will be continued in 2005.

POVERTY REDUCTION STRATEGY – PROGRESS REPORT 2005
38
Health
Reforms in the health sector began to take shape in 2004 and will be reflected in a significant way in 2005. (i) The Legislative Framework
The MOH’s 2004 legislative agenda was designed to modernize the sector and to accomplish the following:
• Amend or replace existing laws and regulations in order to make them applicable to contemporary and emerging situations
• Introduce new laws and regulations in order to provide a comprehensive and more appropriate legal framework for the sector to effectively function and for reforms to be implemented.
• Improve the quality of health care and provide greater protection to the public.
The Ministry of Health Bill, which seeks to introduce greater accountability and allow the Ministry to regulate various activities within the sector, was finalized after extensive consultation and presented to Parliament in 2004. The Regional Health Authority Bill, intended to assist in the reform of the sector, was also finalized after extensive consultation. This Bill will allow the Ministry to reform regional health services and establish the Regional Health Authorities, as has been done in many countries around the world, in an attempt to modernize the decentralized services and to improve management. A draft Health Promotion and Protection Bill to address public health, environment and sanitation was also completed and will replace the Public Health Ordinance drafted in the 1800s. Public consultation will commence and the Bill will be presented to Parliament by July 2005. The draft Allied (Paramedical) Health Profession Bill was completed. This will permit the regulation of those professions by existing arms-length organizations such as the Medical Council, the Nursing Council, the Dental Council and the Pharmacy Council. This Bill will also help to formalize many professions that deliver health care but do so presently outside the laws in an unregulated manner. The Bill is undergoing consultation and will be presented to Parliament in October 2005. The draft Medical Facilities Licensing Bill was completed in 2004 and is presently undergoing Cabinet sub-committee consideration.
(ii) Human Resource Development
Human resource management is critical for the health sector. Major initiatives undertaken in 2004 to address the human resource constraint focused on four areas:
• Intensifying and increasing training; • Retaining staff by creating a more empowering environment;
POVERTY REDUCTION STRATEGY – PROGRESS REPORT 2005
39
• Recruiting personnel from abroad; and • Joint technical programmes with other countries, including Cuba, China,
India, Israel and Nigeria. Additional technical programmes with Canada, the USA and through UN Volunteers will also be pursued.
In spite of these initiatives, there are still many professionals whose employment status remains unclear, too many positions not filled and a continued shortage of certain skills, especially doctors, nurses and dentists. (a) Doctors
At the end of 2004, there were 190 registered doctors, including 11 interns, 13 Chinese and 20 Cuban doctors, working in the public sector. In addition, there are 125 private sector doctors working in Region 4 (102), Region 6 (15), Region 3 (6) and Region 5 (2). Clearly, Region 4 with about 40 percent of the country’s population enjoys the services of more than 70 percent of total doctors available. Regions 1, 5, 7 and 8 have the lowest doctor to population ratio. The concentration of doctors in Region 4 may be attributed to the availability of better medical facilities, better living conditions and higher income levels. The low concentration of doctors in the hinterland regions raises serious concerns in addressing the quality of healthcare in these regions.
TABLE 4.3: DOCTORS IN THE PUBLIC SECTOR
Type Reg. 1
Reg. 2
Reg. 3
Reg. 4
Reg. 5
Reg. 6
Reg. 7/8
Reg. 9
Reg. 10
Total
Full 6 6 110 2 12 5 141
Institutional 5 5
Cuban 1 1 6 4 3 3 2 20
Chinese 10 3 13
Interns 11 11
Total 1 7 12 140 2 15 3 - 10 190
Source: Ministry of Health
There continues to be unfilled needs for doctors in the health sector as a whole, but particularly with regard to General Medical Officers (GMOs) and consultant level physicians. Significant progress was made in 2004 to address needs in specialist areas but there continues to be slow progress in meeting the need for GMOs, particularly outside of Georgetown. The dependency on Cuban doctors as GMOs in outlying areas is not satisfactory as their terms are limited. While the Cuban Brigade provides an invaluable service, it should not be the primary strategy for meeting Human Resource needs in the health sector. Finally, the placement of doctors in

POVERTY REDUCTION STRATEGY – PROGRESS REPORT 2005
40
Mabaruma, Lethem, Madhia, Moruca, Kwakwani, Lenora, Fort Wellington and Mahaicony and other cottage hospitals remains a challenge.
In spite of constraints, progress was made in 2004 in the following areas: • Several specialists were employed in the sector, with numbers
at the GPHC now totaling 35. These include Cuban and Chinese consultants who are part of the joint GOG/Cuba and the GOG/China technical cooperation Programs. Among the 35 consultant physicians are 6 new staff members recruited from India and several more specialist doctors are expected from India, Russia and Nigeria in 2005.
• New GMOs were placed at the GPHC, the Enmore Polyclinic, Mahaicony Hospital and New Amsterdam Hospital.
• Twenty-five students received scholarships to study medicine in Cuba, bringing the number of students studying medicine in Cuba to 150. The number of students studying medicine at UG is now at 68, and the Government decided in 2004 that the Medical Programme at UG must begin to recruit at least 80% of its students through a Government-sponsored programme in which students will be obligated to serve in various parts of the country for at least five years.
• The MoH is encouraging doctors to pursue post-graduate studies and in this regard, has been facilitating several initiatives. The Government intensified efforts with several collaborating partners to develop local post-graduate programmes. Significant progress was made in 2004 in Surgery, Internal Medicine and Oncology. Arrangements were completed with the Government of Israel to help develop joint study programs to facilitate post-graduate studies by Guyanese doctors. Further advancements were made in 2004 for the commencement of the post-graduate diploma program in surgery, in collaboration with the University of Toronto and the Canadian Association of Surgeons.
• The GPHC intensified its efforts in 2004 with regard to Continuing Medical Education in Guyana, hosting twenty-two lectures for private and public sector doctors in a wide range of areas.
• The Ministry of Health, through the GPHC and with local and international collaborating agencies, continued in 2004 to bring specialists (team and individuals) from various parts of the world to work as mentors in hospitals and clinics. These initiatives are
POVERTY REDUCTION STRATEGY – PROGRESS REPORT 2005
41
meant to build capacity and to enhance the medical skills of the local doctors.
o A special course on cervical cancer screening was conducted at the GPHC in preparation for an intensified effort at cervical cancer screening in 2005.
o 87 doctors and nurses received training in various life support methods organized by the MOH in collaboration with GPHC and with international and local specialists.
(b) Nurses
• The nursing situation in Guyana remains critical with eighty-eight (88) nurses resigning in 2004. Worse still, not enough nurses are being trained to meet the needs of the health sector, in spite of the expansion in 2004 of training programmes for nursing. The number of nurses in training at this time is 337 with 179 in Georgetown, 77 in New Amsterdam, and 81 in Linden. The following are accomplishments in 2004 to note:
• A plan to train 500 additional nurses in 2005 was approved by Cabinet and will be implemented in March 2005. The Georgetown Nursing School intake for 2005 will be 260 students, while New Amsterdam and Linden will each take in 120 new students.
• Changes in the law to address academic and age requirements have been made in order to make the nursing programme more accessible to young men and women across Guyana.
• A new post-graduate programme in anesthetic nursing was negotiated with HVO, and is scheduled to begin in March 2005 at the New Amsterdam Nursing School. The programme will cater for trained nurses from across Guyana and will greatly enhance operating room capacity.
• Continuing Nurse Education courses were conducted in collaboration with Davis Memorial Hospital and the General Nursing Council.
(c) Medexes
Twenty-five new persons were recruited in 2004 and will undergo 18 months of training in basic medical care. In addition, the MOH, through its Regional Health Services Department began the revision of the Medex Training Curriculum in collaboration with PAHO. The intention is to expand the training period so as to include modules for non-health care personnel to enter the medex training program. At the moment, only nurses or occasionally CHW are recruited into the program but exceptional high school graduates will be permitted to enter into the programme in 2005.
Training was also provided for:
• 12 dentexes and 16 new community dental therapists
POVERTY REDUCTION STRATEGY – PROGRESS REPORT 2005
42
• 182 microscopists and 12 senior microscopists received international certification in 2004
• 28 new multipurpose technicians • 10 X-ray technicians • 19 rehabilitation assistants • 10 orthopedic technicians in a new programme conducted by the GPHC • 24 community health workers received training in rural midwifery
(iii) Improving and Expanding Health Infrastructure
• The New Amsterdam Hospital was completed in collaboration with the Japanese Government;
• The design of a new Public Health Laboratory was completed and funding was secured;
• An agreement was reached with the Center for Disease Control in the USA to rehabilitate and expand the chest clinic, and to fund the construction of a new GUM Clinic;
• Operating rooms were commissioned at West Demerara Hospital, and the Lethem Hospital was rehabilitated;
• An Accident and Emergency Clinic and a new X-ray room were completed in 2004 at the Skeldon Hospital
• Health Centers and Health Posts were constructed and opened in Regions 4, 6,9 and 10, including a health center at Sophia (Region 4), and health posts at Siparuta (Region 6) and New England (Region 10)
• The MoH completed 94 contracts in 2004 that enabled various small rehabilitation works to be completed. Among the works completed was the construction of a library facility at the Food and Drug Building.
(iv) Drug Procurement and Distribution
Significant progress was made towards the establishment of a system to procure drugs and medical supplies through a single agency, the Materials Management Unit (MMU). This provides for standardization, more effective implementation of the Essential Drug List, cost effectiveness and better accountability and transparency. A new Commodity Distribution and Planning System was also put in place in 2004, with a computerized system at the MMU. Storage facilities were improved through the acquisition of two new refrigerators and the construction of the first phase of a refrigerated vaccine storage bond.

POVERTY REDUCTION STRATEGY – PROGRESS REPORT 2005
43
(v) Technological Capacity The sector continues to benefit from investment to improve technology, an important part of delivering quality health service. The following were notable additions in 2004:
• The addition of two CD4 FACS machines, and a specialized laboratory unit for testing for TB and STIs at the GPHC central laboratory, has already led to improvement in quality of care being offered to PLWHA
• A new hematology analyzer was acquired for GPHC so that comprehensive differential testing for CBCs (Complete Blood Count) can now be offered. Improved capacity to provide CBC (partial differential blood count) is also now available at New Amsterdam Hospital
• A new laboratory and equipment as well as x-ray machines were installed at the New Amsterdam Hospital and the Skeldon Hospital.
• Computerized information system for TB, HIV and Malaria, Materials Management Unit. This will enable more efficient procurement and distribution of drugs and medical supplies
• An atomic absorption spectrophotometer was installed at the Food and Drug Analyst Department.
• Communication is to be improved via purchasing of two radio sets for the Maternal and Child Health Department
(vi) Health Promotion
A national strategy was developed in 2004 with the goal of empowering communities to take greater responsibility for their health. Major targets for 2004-2008 are workplaces, markets and schools. The formalization of an adolescent and youth health and wellness programme began in 2004.
Water
The key elements of the water programme under the PRSP are to increase access to safe water to over 90 percent of the population, to establish the Guyana Water Inc. (GWI), to streamline activities in the coastal zone with an emphasis on the treatment of raw water, and to implement a comprehensive rehabilitation and maintenance plan. The Guyana Water Incorporated (GWI) identified the major problem areas that should be addressed in long-term strategic plans and a review of the Georgetown Water and Sewerage Master Plan and other studies have been completed. Since the creation of the GWI, a new department was established to maintain the existing water distribution systems in small towns and communities, to promote the Hinterland Strategy to increase water provision, and to
POVERTY REDUCTION STRATEGY – PROGRESS REPORT 2005
44
support community involvement in the management, operation and maintenance of the distribution system. A strategy and programme for the provision of new and improved services in the Hinterland was approved in January 2004. Several rehabilitation projects undertaken in 2004 resulted in the improvement of service to some customers, or in the installation of new service connections to others. Other projects undertaken in various parts of the country (Regions 1, 2, 3, 4, 5, 6, and 10) resulted in improved service for over 40,000 people. This includes Phases 1 and 2 of the Linden Refurbishment Project under which 6,000 people benefited from improved water quality or first-time service provision. Table 4.4 provides a summary of progress against PRS indicators in the water sector.
TABLE 4.4: KEY WATER INDICATORS, 2001-2004
2001 2002 2003 2004
% of population with access to treated water 36.2 44.7 45.1 46.9
Domestic households connected to water system 95180 114266 120072 125763
Distribution network constructed (kilometers) 250 255 265 280
Source: Ministry of Housing and Water
Housing
Consistent with the objectives of the PRSP, the Central Housing & Planning Authority (CHPA) redefined its policy framework with the specific aims of strengthening shelter and land markets, expediting the divestiture of public land for sound residential settlement, accelerating squatter area regularization where appropriate, relocating squatters from land unsuitable for occupation, advancing the institutional strengthening of the CHPA, developing basic infrastructure in new housing areas, and developing long-term planning towards housing development. The Ministry of Housing and Water maintained momentum in its efforts to improve the quality of life for low and moderate-income citizens. Required actions elaborated in the PRSP which are currently being pursued by the Ministry include:
• Verification of the number of residential buildings in new squatter areas through a household data inventory programme to yield a count of the residential buildings and to assist occupants in accessing financial aid once regularisation is complete.
• Revitalisation by the Squatter Regularisation Department of a number of Community Development Councils (CDCs) and establishment of a total of 18 new CDCs in regions 3, 4, 6 and 10. Neighbourhood Democratic Councils (NDCs) were also recruited to be part of the regularisation process.
• A consultancy for the Framework for Government Response to Squatting (FGRS) reviewed the penal code on squatting and examined issues of legal compliance.
POVERTY REDUCTION STRATEGY – PROGRESS REPORT 2005
45
• Completion of design layouts and sub-division plans for the minimum standards required for housing development.
• Computerisation of records in the Land Management Department, allowing for the easy tracking of applications for house lots, minimising the perception of discrimination in house lot allocation and making the system more transparent.
As the CH&PA continues with efforts to establish sustainable human settlements to improve the quality of life for low income earners, some key challenges remain in the following areas:
(i) the expansion of Government’s efforts to facilitate increased access to financing by low income groups
a. increasing the levels of occupancy in the housing schemes and squatter settlements
b. completing the regularization of squatter settlements, including the resolution of disputes
c. completing the provision of basic infrastructure in both housing schemes and squatter settlements
The current status of the Land Distribution and Housing Indicators 2001-2004 is shown in Table 4.5 below. The high increase in agricultural leases in 2004 is a result of the completion of the many of the reforms that are being implemented at the GLSC.
Social Safety Nets
The Government, through the Ministry of Labour, Human Services and Social Security has been assisting Guyanese across the country who are considered to be living in difficult circumstances. Under the numerous programmes introduced and implemented, the Ministry has rendered technical, financial and other assistance to thousands of persons. An allocation of $34 million was approved by Cabinet to provide school uniforms to children in every region of the country. From this initial allocation, the Ministry’ Difficult Circumstances Department distributed uniforms to 12,164 children and assisted 1,396 persons to set up small businesses. In 2004, Cabinet increased the allocation for the School Uniform Programme to $40 million, of which $20 million was allocated to the Ministry of Amerindian Affairs for
TABLE 4.5: LAND DISTRIBUTION AND HOUSING INDICATORS, 2001-2004
2001 2002 2003 2004
House lots distributed 975 4195 4739 4916
Land/house titles distributed 2416 7474 6020 5003
Lots serviced (L.I schemes) 1500 2300 4674 23000
Lots serviced (squatter settlements) 1000 1100 1120 7524
Lots allocated to L.I household 553 3538 3633 688
Number of low income houses built 128 134 215 300
Agricultural leases 103 540 785 3000
Source: Ministry of Housing and Water; GLSC
POVERTY REDUCTION STRATEGY – PROGRESS REPORT 2005
46
children in regions 1, 8, 9 and the riverain communities of region 7. The remaining $20 million was used by the Human Services Ministry to help 13,028 children in all other areas. In 2004, 1,021 persons were also assisted with small grants to develop their entrepreneurial skills. The Ministry of Labour, Human Services and Social Security (MLHSSS) took steps to strengthen its capacity and improve the implementation of its programmes. The Social Security and Senior Citizens’ Department at the MLHSSS is responsible for administering the two major Safety Net programmes of the Government of Guyana: Old Age Pension and Public Assistance, both of which are financed by budgetary allocations from the central Government. Progress in these areas resulted in a revised draft national policy on the elderly, the processing of water relief for Old Age Pensioners, and the design of a Management Information System under the PSTAC project. Risk and Vulnerability and Programme and Targeting studies were conducted for both programmes. Within the Probation and Family Welfare Department, the training of new officers and work on establishing a National Child Protection Monitoring Database, was a significant boost. In collaboration with a number of NGOs, a Children and Violence Project was launched through a series of workshops, and a policy document on Orphans and Vulnerable Children was completed. There was a significant increase in the reporting of child abuse in 2004, although it is not clear whether this represents an actual increase in the number of incidents occurring or increased reporting as a result of the work of the Department and other stakeholders. A Labour Market Study was also completed in 2004, and an action plan is being drafted based on recommendations generated in the survey report. These recommendations will seek to provide support to workers affected by sector restructuring. These achievements were realised in spite of insufficient staff at the Ministry, especially for deployment in remote areas, and a lack of trained staff in Information Technology and social work intervention. The Ministry’s capacity to respond to currently unserved hinterland communities needs to be urgently enhanced.
Social Impact Amelioration Programme (SIMAP)
The current SIMAP III programme aims to improve the living standards and economic opportunities of the poorest and most vulnerable households in Guyana, and to increase the capacity of poor communities to articulate and act upon their priority needs. The programme consists of three components: (a) projects to finance investment in social and economic infrastructure and organizational strengthening in poor communities; (b) community services to finance the provision of selected services to vulnerable groups through NGOs; and (c) institutional strengthening to finance technical assistance and training to SIMAP and other programme participants.
POVERTY REDUCTION STRATEGY – PROGRESS REPORT 2005
47
Project implementation was delayed as a result of the need to complete a Rapid Poverty Assessment and Needs Assessment in previously unserved areas by SIMAP. The Assessments identified 195 projects for execution of which 125 have been approved by the Board of Directors and the IDB. Contracts are in place for 47 of these and 16 have been completed. Following feasibility studies conducted by the IDB, SIMAP signed a Memorandum of Understanding with the Guyana Power and Light Company to undertake seven electrification projects. In addition, with the re-launch of its Community Services component in 2004, training is being provided to prospective applicants in preparing project proposals for submission to the agency. Staffing continues to be an area of grave concern to SIMAP and attempts were made to address a high staff turnover rate by revising the agency’s salary scale. A key area of progress in the operations of SIMAP was the design and implementation of a Monitoring and Evaluation system to produce half yearly reports for long-term strategic planning and for enhancing the day-to-day performance of the agency.
Basic Needs Trust Fund
The focus of the BNTF programme is improving the quality and delivery of social services in poor rural communities. Projects undertaken fall within the following categories:
• Rehabilitation and construction of schools in rural areas • Rehabilitation and construction of hospitals and health centres in rural areas • Road improvement • Skills training; and • the construction of markets.
In 2004, almost 3,000 people benefited from a total of 38 BNTF projects, which were completed in regions 1,2,3,4,5,6, and 10.
The Environment
The National Environmental Action Plan (NEAP) 2001-2004 identified Sustainable Human Development as the cornerstone of the Guyana’s socio-economic programme. The mandate of the EPA is to implement: (i) conservation and sustainable use of biodiversity; (ii) ensure sustainable environmental management; (iii) provide environmental education and awareness; and (iv) provide support systems. Challenges faced by the EPA in 2004 include inadequate funding, difficulties in satisfying donor conditionalities, limited technical expertise, and ineffective coordination among sector agencies. (i) Conservation and Sustainable Use of Biodiversity
A National Bio-safety Framework is being prepared as the Action Plan for ensuring maximum benefit is derived from the potential that biotechnology has to offer. In
POVERTY REDUCTION STRATEGY – PROGRESS REPORT 2005
48
2004, the EPA hosted the First National Workshop on Public Awareness and Education Strategies for Bio-Safety and awarded three consultancies to carry out surveys for the National Bio-safety Framework Project. The EPA also began strengthening a regulatory system to access genetic resources and to share any resulting benefits with all parties involved. A proposal to fully examine and prepare policy on access, benefit sharing and Intellectual Property Rights was approved for support by UNDP. A preliminary draft policy document was prepared and Cabinet approved a revised fee structure for biodiversity research.
A draft proposal for monitoring forest biodiversity was completed along with a strategy for monitoring biodiversity loss in the natural resource sectors. The EPA was also involved in a number of initiatives and activities aimed at coordinating the sustainable use of biodiversity and a wildlife protection programme. These included the finalization of a Memorandum of Understanding (MoU) between the Office of the President and the Southern Rupununi Conservation Society. A critical function of the EPA is the coordination of a programme for the conservation of biodiversity including National Parks, a National Protected Area System, and a Wildlife Protection Management Programme. Activities in 2004 included capacity building workshops on Management of Protected Areas, Categories of Protected Areas, and Community Resource Evaluation; the completion of technical discussions on the Grant Agreement for the Guyana Protected Area System Project to be funded by the World Bank/ GEF; the signing of a Memorandum of Cooperation (MoC) to establish a Community Conservation Area in Southern Guyana; and continued work towards the establishment of a National System of Protected Areas.
(ii) Environmental Management
The EPA reorganized its organizational structure to enhance the work of Quality Control, monitoring and enforcement through the Authorization Unit, to include aspects of Environmental Emergencies and Planning through the Response Unit. Development and research was geared towards the development of guidelines, codes of practice, regulations, standards etc. A mechanism is now in place to direct all facilities requiring licences from the Guyana Forestry Commission and the Guyana Energy Agency to register with the EPA. Successful strategies for enforcement are being implemented resulting in greater environmental compliance by facilities.
POVERTY REDUCTION STRATEGY – PROGRESS REPORT 2005
49
(iii) Education Information and Training A National Youth Forum was hosted in collaboration with the Ministry of Health, WWF, EPA, Iwokrama and Peace Corps, to build awareness and knowledge on issues related to population, conservation and ecology. The EPA also sponsored numerous panel discussions on radio and television and a National Capacity Building Workshop on proposal writing was conducted for 75 youth members of Environmental Clubs.
(iv) Support Systems
The GIS unit of the EPA is responsible for geographic data management and analysis, and prepared maps for proposed pilot study areas, the incidence of environmental complaints along the coastline of Guyana, proposed sites for hydropower stations, and others as requested by internal and external stakeholders. The GIS unit also continued to assist the CDB-funded Coastal Zone Information Management Project, and provided training to the Guyana Sea Defence Board.
POVERTY REDUCTION STRATEGY – PROGRESS REPORT 2005
50
Chapter
INFRASTRUCTURE TO SUPPORT GROWTH
The infrastructure strategy detailed in the PRSP is geared towards improving the maintenance of sea defences, roads, air and river transport, and drainage and irrigation systems in order to support private sector and community-based growth. (i) Sea Defences
The Sea and River Defence Division of the Ministry of Public Works and Communication is responsible for the care, construction, maintenance and rehabilitation of all sea and river defences in Guyana. In 2004, civil works on sea defences were carried out along the coastline from Regions 2 to 6. Special attention was afforded to the Profit/Foulis area where 15000 tons of boulders were delivered for emergency works. The Division also undertook a Sea Defence condition survey, which is sixty percent complete. In addition, a Geographical Information System (GIS) Database to incorporate data gathered from surveys carried out by the Division is almost fully developed. Training of local personnel is also ongoing in key areas such as data management (GIS), and the design and maintenance of sea defence structures. These programs are executed under the Division’s Institutional Capacity Building activities within the framework of Shore Zone Management.
(ii) Roads and Bridges
In 2004, 68 bridges and culverts were rehabilitated and 26 structures constructed between Timehri and Mahaica. These included construction of the Mahaica-Rosignol road to provide the necessary links for farm-to-market roads and allow for easier transportation of goods. This project is about 76 percent complete. In addition, the overall progress on work on the four-lane highway from the Demerara Harbour Bridge to Ruimveldt was rated at 65 percent complete at the end of 2004. Feasibility studies of the New Amsterdam- Moleson Creek Road and the Southern Entrance to Georgetown were also completed. To sustain the long-term viability of roads, the Ministry of Public Works and Communication continued to execute its Routine Maintenance Management System (RMMS). The Ministry also embarked on a Road Safety programme under the RMMS and works on sidewalks and lighting at intersections along the East Bank Demerara roads have begun.
5
POVERTY REDUCTION STRATEGY – PROGRESS REPORT 2005
51
The Demerara Harbour Bridge, a vital link between Regions 3 and 4 that enables transport of agricultural and manufactured goods to and from Georgetown, was also a priority area of focus in 2004. General maintenance of the entire structure was undertaken in accordance with a computerized maintenance and monitoring system developed in 2004. The toll ticket system was also upgraded and construction began on a new building to house the Corporation’s administrative and audit departments.
(iii) River Transport
In spite of the challenges faced by the Transport and Harbours Department in the procurement of spare parts and the curtailment of services due to defects in ferries and stellings, five stellings were rehabilitated and seven vessels repaired in 2004.
(iv) Air Transport
In the air transport sector, rehabilitation works are ongoing at the Cheddi Jagan International Airport. This includes the maintenance of the Communications, Navigation and Surveillance, and Air Traffic Management Systems as well as improvements in the Airport’s computer networking and emergency systems. A proposal was approved for the development of an Airport Security Programme to strengthen the financial and operational sustainability of the Aviation Security system in Guyana. Based on the certification of rural aerodromes, works were completed on the Annai Airstrip while work continues on the Port Kaituma and Orinduik Airstrips. Challenges faced by the sector in 2004 included the hiring and retention of qualified and experienced aviation personnel.
(v) Drainage and Irrigation
In 2004, over $283 million were allocated for maintenance projects and approximately $750 million for capital expenditure in drainage and irrigation. Rehabilitation and maintenance works were completed on dams, drains and canals, and newly constructed structures included a 1900-foot timber revetment and 7 culverts. Two mobile drainage pumps were purchased and installed in order to improve the effectiveness of the D&I system.
(vi) Maritime Affairs
Although the Maritime Administration is purely a regulatory agency and does not directly affect Guyana’s Poverty Reduction Strategy, there are indirect impacts. In 2004, international port facility and ship security certificates were issued to 37 port facilities and 25 ships in accordance with the Maritime Administration’s adoption and implementation of the International Ship and Port Facility Security Code (ISPS). Progress in this area is of great importance to the economy since it allows for
POVERTY REDUCTION STRATEGY – PROGRESS REPORT 2005
52
Guyana’s ships to trade globally and for international ships to be readily received at local port facilities. In keeping with international maritime conventions to which Guyana has acceded, regulations were drafted and approved to give effect to the Caribbean Cargo Ship Safety Code and the Small Commercial Vessel Code. An arrangement was made with the Jamaican Maritime Authority to audit one Maritime Training Institute in Guyana and issue certificates in basic safety courses.
(vii) Unserved Areas Electrification Programme (UAEP)
The UAEP aims at strengthening the legal, regulatory and institutional framework and at accelerating electricity sector development in Guyana over the period 2004 to 2009. Specifically, the programme targets electrification of unserved rural areas and hinterland regions. Materials for the infrastructural works to install new connections by GPL were procured and systems designs for Phase 1 of the project were completed in 2004.
Special Intervention Strategies
The Government is committed to reducing pockets of poverty, especially in the bauxite-producing town of Linden and its environs, and in hinterland areas populated largely by Amerindians. In line with this commitment, the Government proposed and implemented a number of special intervention programmes to reduce poverty in Regions 1, 8, 9 and 10. Hinterland Development The Ministry of Amerindian Affairs (MOAA) works to provide for the integration of the Amerindian Communities into the wider Guyanese society and to encourage self-sufficiency and economic and social development in the hinterland regions. Because the MOAA collaborates closely with the Ministry of Local Government and Regional Development, these agencies synchronize their work programmes to ensure the most efficient utilization of resources within Amerindian Communities. The Strategic Plan being devised by the MOAA also factors in the continued need to link with other government sectors, funding agencies and NGOs. Joint ventures that were undertaken included the training of 20 Mines Officers, community forestry development, pest treatment, a birth certificate programme benefiting 4,000 people, and an HIV awareness programme. Further accomplishments in 2004 included:
• Training in leadership development, including the training of Toshaos as Justices of the Peace and Rural Constables
• The ongoing execution of the Hinterland Scholarship Programme • Draft revision of the Amerindian Act which is now in the final rounds of consultation • Land demarcation and surveying exercises for ten communities in Regions 1, 2, 4, 8,
9 and 10. This will eventually result in legal ownership by communities.

POVERTY REDUCTION STRATEGY – PROGRESS REPORT 2005
53
• Construction of seven Village Council offices • Acquisition of thirty-four radio sets and accessories for Regions 1, 2, 4, 9 and 10, in
an effort to improve communications between communities • Distribution of equipment to assist in forestry and agriculture production • Distribution of boats and outboard engines to enhance river transportation in Regions
1, 2 and 9 • Distribution of school uniforms in Regions 1, 7, 8 and 9.
Region 1: Barima -Waini
The development of infrastructure to support growth in Region 1 continued with the rehabilitation of the Port Kaituma and Six Miles to Falls Top Road. Works are currently in progress on the construction of a number of new roads and the maintenance of existing roads. Electricity services in Mabaruma have been extended and the generator in Port Kaituma rehabilitated. The agricultural support base was improved through the construction of revetment at Barabina and the extension of the plant nursery at Hosororo, and the construction of bridges at San Jose and Wauna. Educational development was boosted through the construction of teachers’ quarters, dormitories, school maintenance, construction and expansion. The Ministry of Amerindian Affairs also provided a boat and engine to the Regional Educational Officer to assist in the transportation of school children. This sector also benefited from 13 SIMAP projects in the region. In the Health sector, the construction of a Health Centre with living quarters at Eclipse Falls and doctors’ quarters at Port Kaituma were completed and the construction of a Health Hut in Coco, Moruca is in progress. To boost vector control in the region, works are in progress on the Malaria Quarters in Port Kaituma and a boat was acquired for the Vector Control Unit. In 2004, efforts continued to finalize the granting of a land title to the Baramita Amerindian District, and legislative and financial activities continued towards including Shell Beach within the Guyana Protected Areas System (GPAS).
Region 8: Potaro –Siparuni
In 2004, heavy-duty bridges were constructed at Micobie, Tumong, and Wailingbaru and a pedestrian bridge installed at Kmana. Bridge maintenance and repair took place at Campbelltown, Madhia, the Denham Bridge, and the Bartica/Potaro Road. Several roads were constructed and maintained in key areas of the region. River defences at Tumatumari, Lower Potaro were maintained and extended. These activities aimed to improve access to and between communities, and to facilitate the transportation and marketing of agricultural produce.
POVERTY REDUCTION STRATEGY – PROGRESS REPORT 2005
54
With regard to social service provision, focus in 2004 was on improving infrastructure in the education and health sectors. To this end, primary schools, dormitories and teachers’ quarters were constructed and rehabilitated throughout the region, and health posts were constructed and maintained. An X-ray room was added to the Mahdia Hospital, along with an x-ray machine, film processor, solar panels and ambulance.
Region 9: Upper Takatu – Upper Essequibo
The Ministry of Amerindian Affairs provided a rice huller for the village of Karaudanaunau to boost village rice production efforts and, as identified in the 2004 Progress Report, community farms at Awarewaunau and Sand Creek were fenced to separate agriculture farming from cattle rearing. Work also commenced on the rehabilitation of the Veterinary Officers Quarter at St. Ignatius and the agriculture building at Annai. Significant road network improvements and bridge construction took place in 2004. Other developmental works included the installation of solar systems for power generation; the purchase of water tanks and hand pumps; and the installation of windmills for water supply. In the Health Sector, the renovation and construction of health huts are in progress. Primary schools were constructed and extended with the addition of teachers’ quarters. The 2004 SIMAP programme in Region 9 comprised 12 activities, including the construction of multipurpose, women’s and community centers, and nursery schools. The process to establish Konashen as a Community Conservation Area was advanced through community consultation and the signing of a Memorandum of Cooperation between the Government of Guyana, Conservation International and the Wai-Wai Community of Konashen.
Region 10: Upper Demerara – Berbice
In 2004, rehabilitation work took place on roads and bridges throughout the region. Drainage and Irrigation activities focused on the desilting of the industrial area drains, Hymara and Cocatara Creek and the clearing of Cocatara Creek crossing. Construction and maintenance work was carried out on schools, and a Health Post at 47 Miles. Solar systems were acquired for the remote communities of Calcuni and St. Lust, Berbice River, to aid power generation to the health facilities and the communities as a whole. In housing, 786 house lots were distributed in Wisroc and the distribution of 1,912 houselots is in progress at Amelia’s Ward based on the established number of vacant lots. SIMAP activity in the region totaled 13 projects and included the construction and rehabilitation of schools, teachers’ quarters and a day care centre. The Basic Needs Trust Fund also awarded a contract for the rehabilitation of the Kwakwani water supply system.
POVERTY REDUCTION STRATEGY – PROGRESS REPORT 2005
55
The Linden Economic Advancement Programme
As part of an effort to realize the significant development potential of Region 10, the Government of Guyana, in partnership with the European Union, established the Linden Economic Advancement Programme (LEAP) to facilitate the economic diversification of the region. An excess of 12 million Euro is expected to be invested in the Region over a 7-year period. LEAP emphasizes investment promotion, the development and expansion of small enterprises. A Business Incubation Centre to support the creation of new micro and small enterprises by providing temporary affordable space, shared office services, management services and marketing assistance advice on access to risk capital, is in development. A micro-credit scheme—the Linden Economic Advancement Fund (LEAF)—will make available 1.9 million Euro for on lending to micro-businesses and small and medium enterprises in Region 10. LEAF is managed by an independent financial institution, the Guyana Fire Life and General Insurance Company Inc., an established Guyanese financial institution known for it proactive business approach. A credit analyst and support staff for the programme were hired, a building and equipment procured, and an MIS system for LEAF installed. The first tranche of G$60 million was made available for on lending in December 2004. LEAP also provided technical, vocational and management training programmes, from which three hundred and forty-four persons benefited in 2004. A Youth Entrepreneur Network was launched in 2004 with a public awareness programme geared towards encouraging entrepreneurship as an employment option for young people. Twenty-five members received training in Entrepreneurial Skills Development and Competitive Advantage as well as ongoing technical assistance and business counselling services. A number of new investments were made during the year in several sectors, including forestry, logging, saw milling, leather craft, and shoe making. An estimated US$1.7 million was invested, creating over 100 jobs. In 2004, an international consultancy carried out a Business Opportunities Survey and a number of Small Business Opportunities Profiles were prepared and will be used to promote new business ideas in the region. New investments in the region are being promoted nationally and internationally through direct contacts and a rolling public relations and communications programme. During the year, LEAP supported the participation of crafts producers at international trade exhibitions and 9 local businesses were assisted in their participation in GuyExpo. By the end of 2009, it is expected that LEAP will have directly contributed to the creation of 1700 new jobs in Region 10. Feasibility studies are being carried out to advance the development of an industrial zone and expansion of wharf facilities.
POVERTY REDUCTION STRATEGY – PROGRESS REPORT 2005
56
Chapter
PUBLIC CONSULTATIONS AND FEEDBACK
The Progress Report Consultation Process Public consultations on progress towards the achievement of PRS goals and targets reflect the Government’s continuing commitment to involve key stakeholders, in particular the poor, in the formulation and implementation of policies and programmes designed to reduce poverty. These meetings to receive feedback on poverty programs and inputs in policy formulation have become increasingly familiar to Guyanese since the development of the Poverty Reduction Strategy in 2001, when over 200 public consultations were held throughout the country. Similar exercises also took place during the countrywide review of the 2004 Progress Report, and within the context of the monitoring and evaluation work of PRS Regional Committees. Repeated successes in generating high levels of participation throughout these processes demonstrate the importance citizens attach to the consultation process and the poverty reduction programme. The consultation process on the 2005 draft Progress Report aimed to (i) disseminate information on progress made towards reducing poverty as elaborated in the previous report and new programmes that will further augment planned actions for poverty reduction; (ii) generate feedback from a cross-section of the population as to whether the poverty programme is having its desired impact; and (iii) provide a forum for civil society to elaborate their priorities and suggest recommended actions. Regional Consultations A total of eight regional consultations were held within a period of two weeks. Consultations were held in Regions 1, 2, 4, 6, 7, 8, 9, and 10, with residents of Region 3 participating in the consultation held in Region 2, and residents from Region 5 participating in the one held in Region 6. The programme for the 2005 public consultations incorporated several improvements over those held previously and generated a wealth of information which, in addition to being incorporated into the 2005 Progress Report, can be utilized in sectoral planning. At each consultation, government ministers and high-level technical officials provided overviews of progress and shortcomings in the implementation of the PRS in 2004. Their presence facilitated the provision of prompt explanations to questions raised by participants. A senior regional official provided an update on achievements and problems in the region during the past year. Members of the Steering Committee and Regional Coordinators also participated in the exercise by presenting an overview of the Progress Report. The primary focus of the consultations was to allow participants the opportunity to comment on the report,
6
POVERTY REDUCTION STRATEGY – PROGRESS REPORT 2005
57
with special emphasis on their community or region. Time was allotted in the programme both for a question and answer period and for participants to record their views and priorities in a feedback form that was submitted to the M&E Unit. Parliamentary Consultations For the first time in the poverty reduction process, a special consultation was held for Members of Parliament to elicit their feedback on the draft final progress report. The objective of the consultation was to provide Members of Parliament (i) an overview of the 2005 PRS Progress Report; (ii) present the issues and recommendations arising from the public consultations; (iii) indicate to what extent these recommendations were included in the final draft document; and (v) present the risks inherent in the medium-term poverty reduction program. Dissemination of the Draft Report and Leaflets Over 500 copies of the draft 2005 PRS Progress Report were widely disseminated to government officials, line ministries, agencies, donor agencies, civil society organizations, the academic community and the private sector. In addition, leaflets covering specific sectors were prepared for dissemination to the wider public via the PRS Regional Committees, the Regional Democratic Councils in all ten Administrative Regions, and at the consultations. The leaflets presented summarized information on progress and plans in key sectors such as education, health, housing, water, governance, and infrastructure. More than 12,000 leaflets were distributed countrywide prior to and during regional consultations. This year, leaflets were distributed in advance so as to allow civil society, including communities, households and other stakeholders, to carefully review the issues and to provide well-considered feedback to the questions. Through collaboration with the DevNet project, the draft report and leaflets were also made available online at the PRSP website. Public Awareness A public awareness campaign promoting the importance of citizen involvement in the consultation process was implemented via the mass media and through the mobilization efforts of the PRS Regional Committees. Press releases were issued to all national and local television and radio stations, as well as newspapers. Daily advertisements also indicated the locations and dates of the consultations. In the week prior to the consultations, government ministers also participated in a live talk show to discuss the Progress Report and plans for the consultations. Through collaboration with the Government Information Agency (GINA), each consultation was recorded and reported on in a number of daily news programmes. Mobilization efforts within the regions centered on the work of committee members who canvassed their regions, beginning two months in advance of consultations. Committees convened small group discussions on the draft Progress Report and consultation process, and distributed reports, leaflets, flyers, and invitations. The participation of Committee
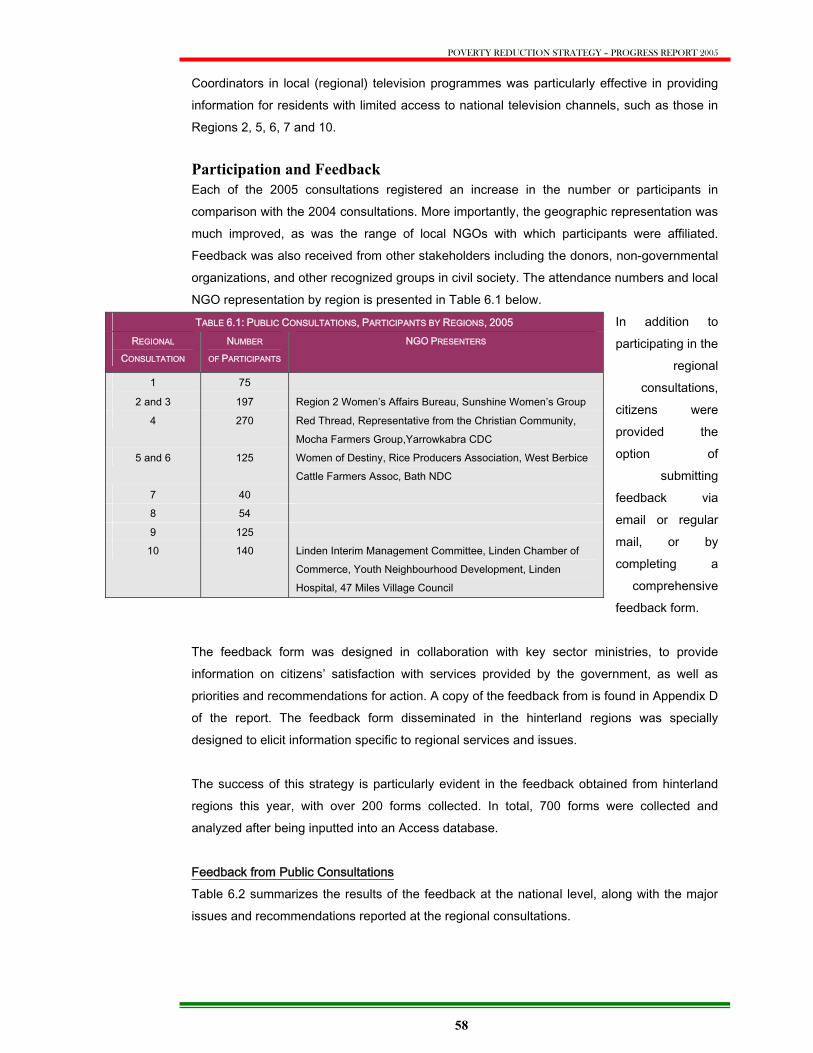
POVERTY REDUCTION STRATEGY – PROGRESS REPORT 2005
58
Coordinators in local (regional) television programmes was particularly effective in providing information for residents with limited access to national television channels, such as those in Regions 2, 5, 6, 7 and 10. Participation and Feedback Each of the 2005 consultations registered an increase in the number or participants in comparison with the 2004 consultations. More importantly, the geographic representation was much improved, as was the range of local NGOs with which participants were affiliated. Feedback was also received from other stakeholders including the donors, non-governmental organizations, and other recognized groups in civil society. The attendance numbers and local NGO representation by region is presented in Table 6.1 below.
In addition to participating in the
regional consultations,
citizens were provided the option of
submitting feedback via email or regular mail, or by completing a
comprehensive feedback form.
The feedback form was designed in collaboration with key sector ministries, to provide information on citizens’ satisfaction with services provided by the government, as well as priorities and recommendations for action. A copy of the feedback from is found in Appendix D of the report. The feedback form disseminated in the hinterland regions was specially designed to elicit information specific to regional services and issues. The success of this strategy is particularly evident in the feedback obtained from hinterland regions this year, with over 200 forms collected. In total, 700 forms were collected and analyzed after being inputted into an Access database. Feedback from Public Consultations Table 6.2 summarizes the results of the feedback at the national level, along with the major issues and recommendations reported at the regional consultations.
TABLE 6.1: PUBLIC CONSULTATIONS, PARTICIPANTS BY REGIONS, 2005 REGIONAL
CONSULTATION NUMBER
OF PARTICIPANTS NGO PRESENTERS
1 75
2 and 3 197 Region 2 Women’s Affairs Bureau, Sunshine Women’s Group
4 270 Red Thread, Representative from the Christian Community, Mocha Farmers Group,Yarrowkabra CDC
5 and 6 125 Women of Destiny, Rice Producers Association, West Berbice Cattle Farmers Assoc, Bath NDC
7 40 8 54
9 125 10 140 Linden Interim Management Committee, Linden Chamber of
Commerce, Youth Neighbourhood Development, Linden Hospital, 47 Miles Village Council
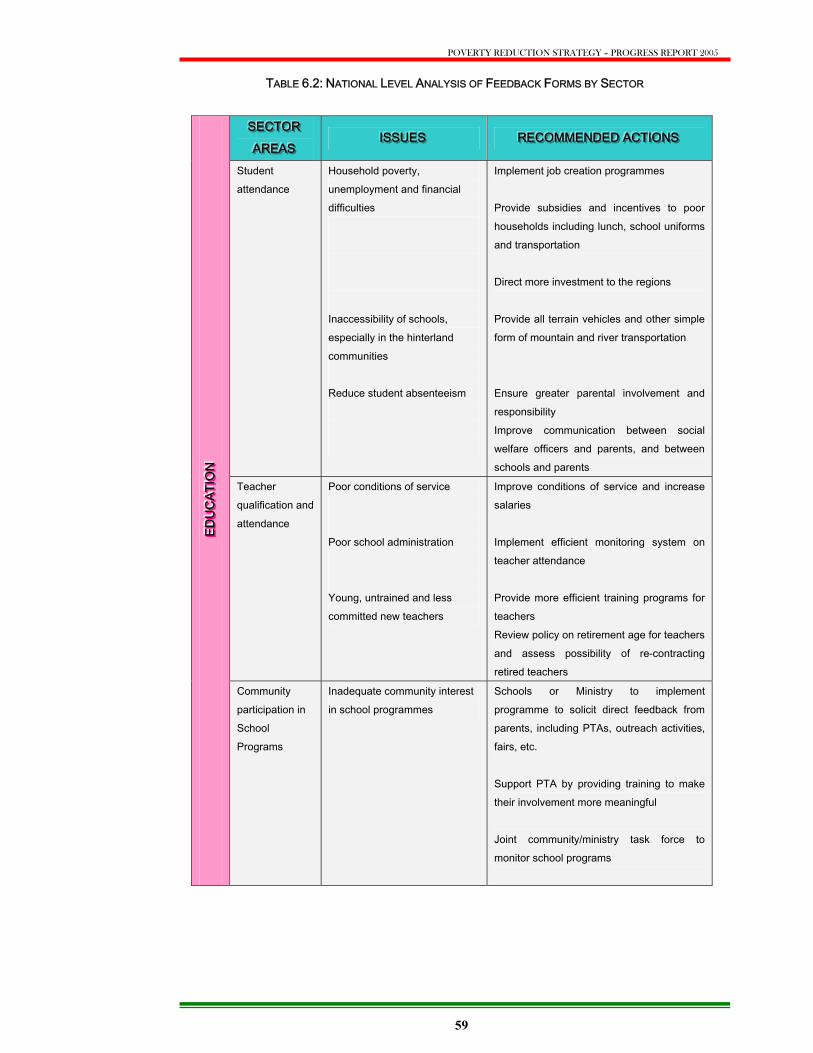
POVERTY REDUCTION STRATEGY – PROGRESS REPORT 2005
59
TABLE 6.2: NATIONAL LEVEL ANALYSIS OF FEEDBACK FORMS BY SECTOR
SSSEEECCCTTTOOORRR
AAARRREEEAAASSS IIISSSSSSUUUEEESSS RRREEECCCOOOMMMMMMEEENNNDDDEEEDDD AAACCCTTTIIIOOONNNSSS
Student attendance
Household poverty, unemployment and financial difficulties Inaccessibility of schools, especially in the hinterland communities Reduce student absenteeism
Implement job creation programmes Provide subsidies and incentives to poor households including lunch, school uniforms and transportation Direct more investment to the regions Provide all terrain vehicles and other simple form of mountain and river transportation Ensure greater parental involvement and responsibility Improve communication between social welfare officers and parents, and between schools and parents
Teacher qualification and attendance
Poor conditions of service Poor school administration Young, untrained and less committed new teachers
Improve conditions of service and increase salaries Implement efficient monitoring system on teacher attendance Provide more efficient training programs for teachers Review policy on retirement age for teachers and assess possibility of re-contracting retired teachers
EE E DD D U
U U CC C A
A A TT T I
I I OO ONN N
Community participation in School Programs
Inadequate community interest in school programmes
Schools or Ministry to implement programme to solicit direct feedback from parents, including PTAs, outreach activities, fairs, etc. Support PTA by providing training to make their involvement more meaningful Joint community/ministry task force to monitor school programs
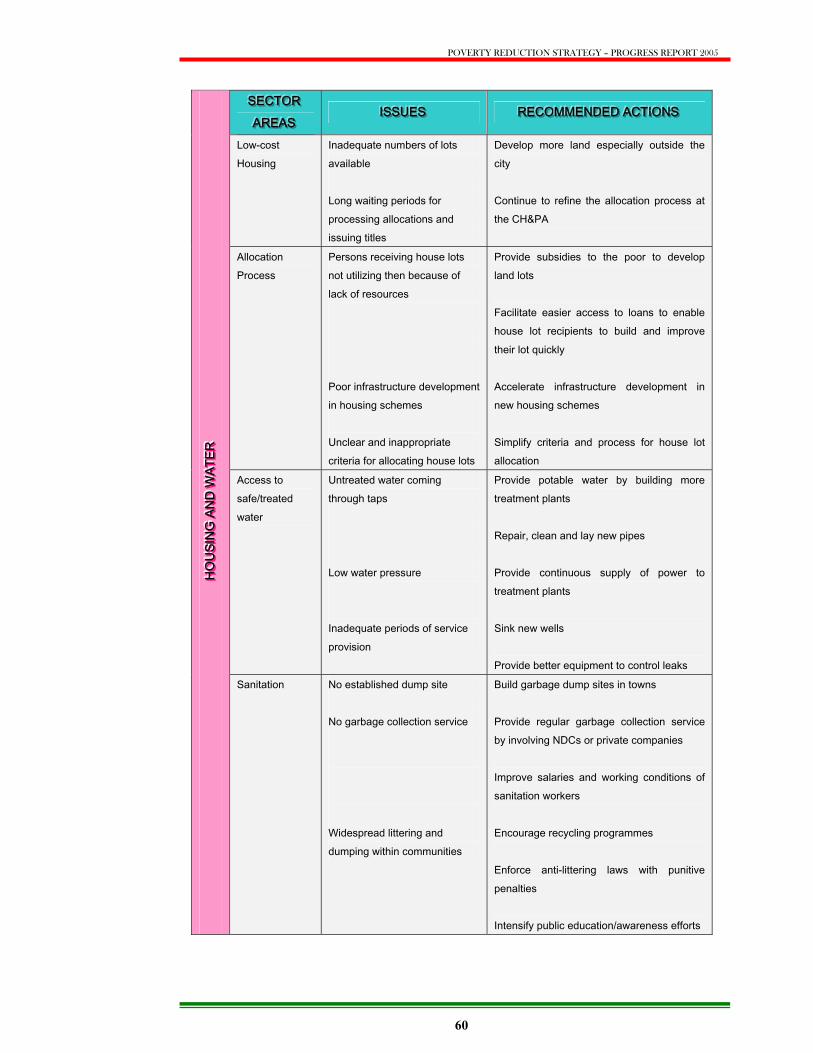
POVERTY REDUCTION STRATEGY – PROGRESS REPORT 2005
60
SSSEEECCCTTTOOORRR
AAARRREEEAAASSS IIISSSSSSUUUEEESSS RRREEECCCOOOMMMMMMEEENNNDDDEEEDDD AAACCCTTTIIIOOONNNSSS
Low-cost Housing
Inadequate numbers of lots available Long waiting periods for processing allocations and issuing titles
Develop more land especially outside the city Continue to refine the allocation process at the CH&PA
Allocation Process
Persons receiving house lots not utilizing then because of lack of resources Poor infrastructure development in housing schemes Unclear and inappropriate criteria for allocating house lots
Provide subsidies to the poor to develop land lots Facilitate easier access to loans to enable house lot recipients to build and improve their lot quickly Accelerate infrastructure development in new housing schemes Simplify criteria and process for house lot allocation
Access to safe/treated water
Untreated water coming through taps Low water pressure Inadequate periods of service provision
Provide potable water by building more treatment plants Repair, clean and lay new pipes Provide continuous supply of power to treatment plants Sink new wells Provide better equipment to control leaks
HH HOO O
UU USS S I
I I NN NGG G
AA ANN N
DD D WW W
AA A TT T E
E E RR R
Sanitation No established dump site No garbage collection service Widespread littering and dumping within communities
Build garbage dump sites in towns Provide regular garbage collection service by involving NDCs or private companies Improve salaries and working conditions of sanitation workers Encourage recycling programmes Enforce anti-littering laws with punitive penalties Intensify public education/awareness efforts
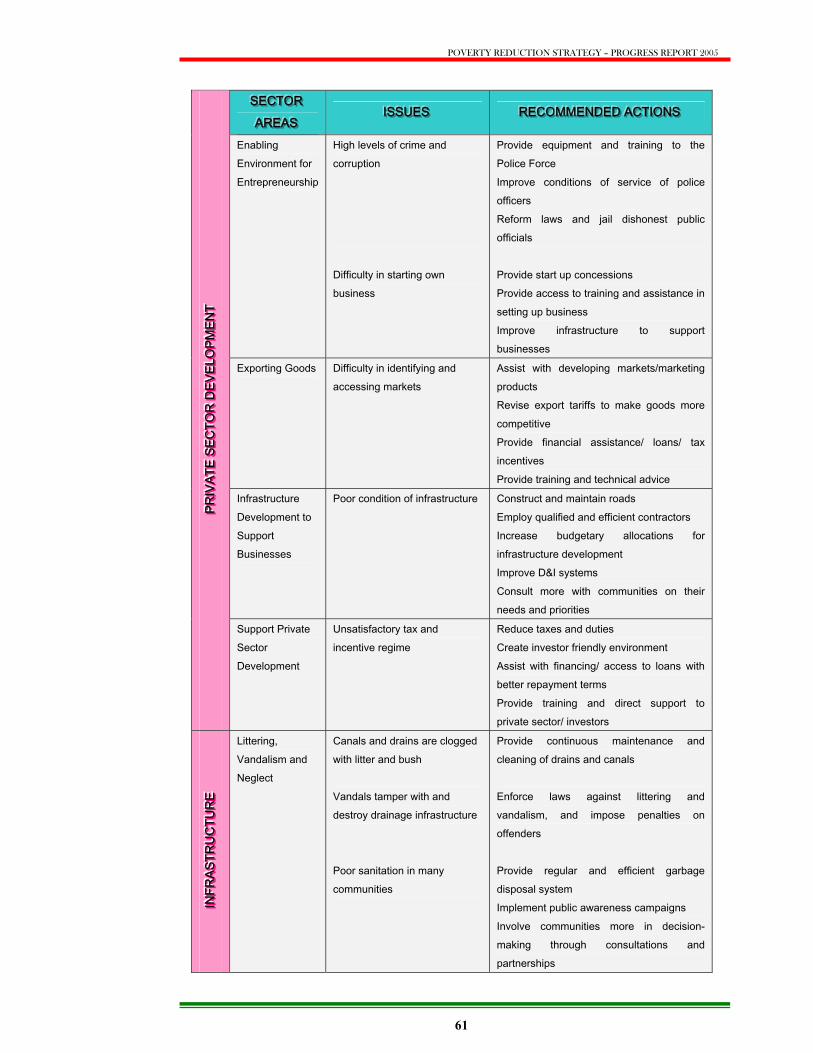
POVERTY REDUCTION STRATEGY – PROGRESS REPORT 2005
61
SSSEEECCCTTTOOORRR
AAARRREEEAAASSS IIISSSSSSUUUEEESSS RRREEECCCOOOMMMMMMEEENNNDDDEEEDDD AAACCCTTTIIIOOONNNSSS
Enabling Environment for Entrepreneurship
High levels of crime and corruption Difficulty in starting own business
Provide equipment and training to the Police Force Improve conditions of service of police officers Reform laws and jail dishonest public officials Provide start up concessions Provide access to training and assistance in setting up business Improve infrastructure to support businesses
Exporting Goods Difficulty in identifying and accessing markets
Assist with developing markets/marketing products Revise export tariffs to make goods more competitive Provide financial assistance/ loans/ tax incentives Provide training and technical advice
Infrastructure Development to Support Businesses
Poor condition of infrastructure
Construct and maintain roads Employ qualified and efficient contractors Increase budgetary allocations for infrastructure development Improve D&I systems Consult more with communities on their needs and priorities
PP P RR R I
I I VV VAA A T
T T EE E
SS SEE E C
C C TT T O
O O RR R
DD DEE E V
V V EE E L
L L OO OPP P M
M MEE E N
N N TT T
Support Private Sector Development
Unsatisfactory tax and incentive regime
Reduce taxes and duties Create investor friendly environment Assist with financing/ access to loans with better repayment terms Provide training and direct support to private sector/ investors
II I NN NFF F R
R R AA A S
S S TT T R
R R UU U C
C C TT T U
U U RR R E
E E
Littering, Vandalism and Neglect
Canals and drains are clogged with litter and bush Vandals tamper with and destroy drainage infrastructure Poor sanitation in many communities
Provide continuous maintenance and cleaning of drains and canals Enforce laws against littering and vandalism, and impose penalties on offenders Provide regular and efficient garbage disposal system Implement public awareness campaigns Involve communities more in decision-making through consultations and partnerships
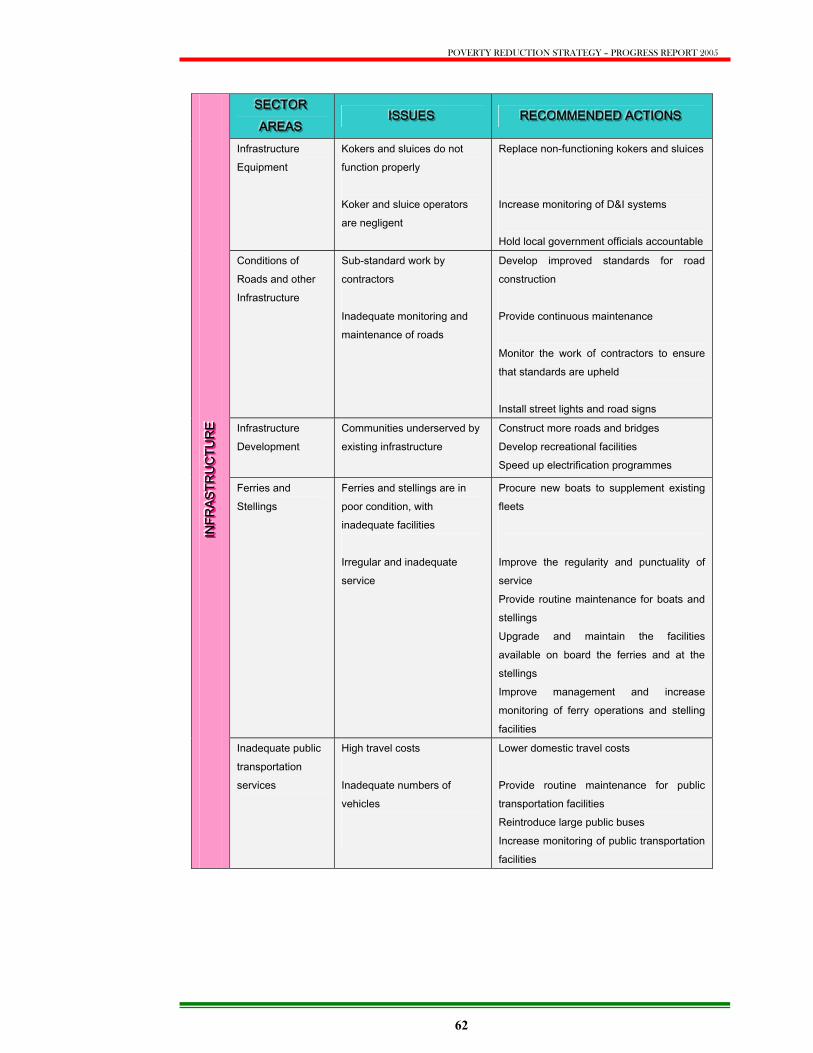
POVERTY REDUCTION STRATEGY – PROGRESS REPORT 2005
62
SSSEEECCCTTTOOORRR
AAARRREEEAAASSS IIISSSSSSUUUEEESSS RRREEECCCOOOMMMMMMEEENNNDDDEEEDDD AAACCCTTTIIIOOONNNSSS
Infrastructure Equipment
Kokers and sluices do not function properly Koker and sluice operators are negligent
Replace non-functioning kokers and sluices Increase monitoring of D&I systems Hold local government officials accountable
Conditions of Roads and other Infrastructure
Sub-standard work by contractors Inadequate monitoring and maintenance of roads
Develop improved standards for road construction Provide continuous maintenance Monitor the work of contractors to ensure that standards are upheld Install street lights and road signs
Infrastructure Development
Communities underserved by existing infrastructure
Construct more roads and bridges Develop recreational facilities Speed up electrification programmes
Ferries and Stellings
Ferries and stellings are in poor condition, with inadequate facilities Irregular and inadequate service
Procure new boats to supplement existing fleets Improve the regularity and punctuality of service Provide routine maintenance for boats and stellings Upgrade and maintain the facilities available on board the ferries and at the stellings Improve management and increase monitoring of ferry operations and stelling facilities
II I NN NFF F R
R R AA A S
S S TT T R
R R UU U C
C C TT T U
U U RR R E
E E
Inadequate public transportation services
High travel costs Inadequate numbers of vehicles
Lower domestic travel costs Provide routine maintenance for public transportation facilities Reintroduce large public buses Increase monitoring of public transportation facilities
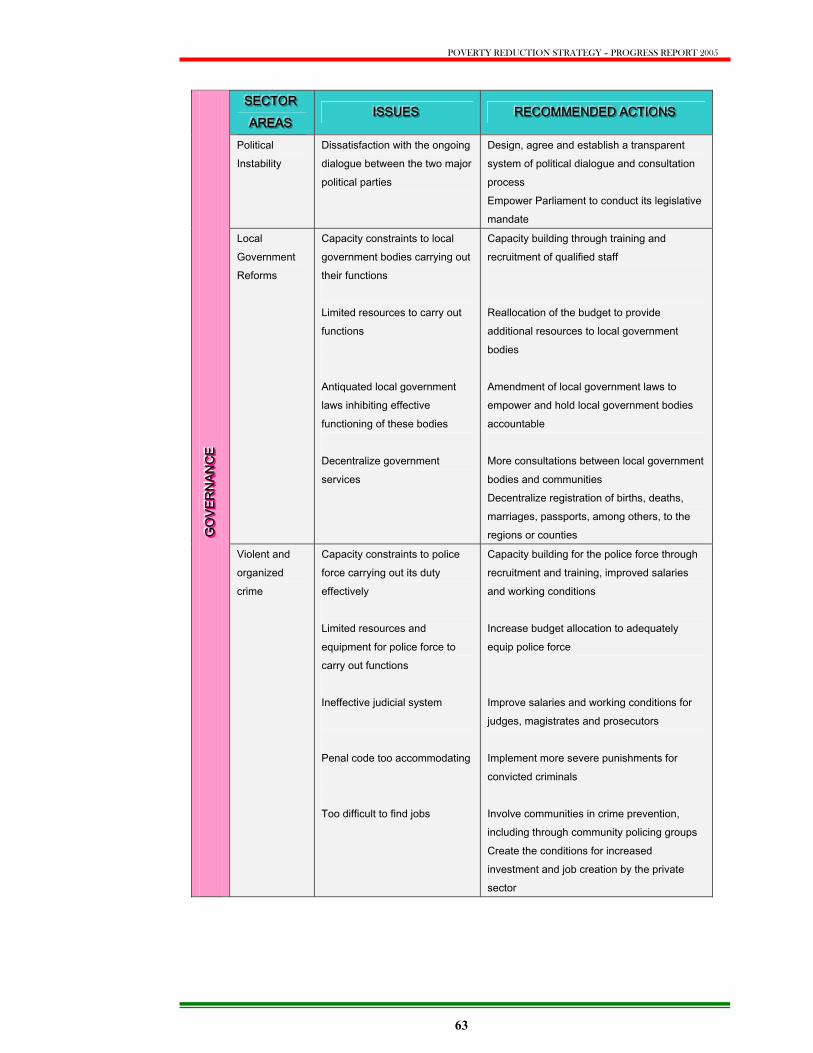
POVERTY REDUCTION STRATEGY – PROGRESS REPORT 2005
63
SSSEEECCCTTTOOORRR
AAARRREEEAAASSS IIISSSSSSUUUEEESSS RRREEECCCOOOMMMMMMEEENNNDDDEEEDDD AAACCCTTTIIIOOONNNSSS
Political Instability
Dissatisfaction with the ongoing dialogue between the two major political parties
Design, agree and establish a transparent system of political dialogue and consultation process Empower Parliament to conduct its legislative mandate
Local Government Reforms
Capacity constraints to local government bodies carrying out their functions Limited resources to carry out functions Antiquated local government laws inhibiting effective functioning of these bodies Decentralize government services
Capacity building through training and recruitment of qualified staff Reallocation of the budget to provide additional resources to local government bodies Amendment of local government laws to empower and hold local government bodies accountable More consultations between local government bodies and communities Decentralize registration of births, deaths, marriages, passports, among others, to the regions or counties GG G
OO OVV V E
E E RR R N
N N AA A N
N N CC C E
E E
Violent and organized crime
Capacity constraints to police force carrying out its duty effectively Limited resources and equipment for police force to carry out functions Ineffective judicial system Penal code too accommodating Too difficult to find jobs
Capacity building for the police force through recruitment and training, improved salaries and working conditions Increase budget allocation to adequately equip police force Improve salaries and working conditions for judges, magistrates and prosecutors Implement more severe punishments for convicted criminals Involve communities in crime prevention, including through community policing groups Create the conditions for increased investment and job creation by the private sector

POVERTY REDUCTION STRATEGY – PROGRESS REPORT 2005
64
SSSEEECCCTTTOOORRR
AAARRREEEAAASSS IIISSSSSSUUUEEESSS RRREEECCCOOOMMMMMMEEENNNDDDEEEDDD AAACCCTTTIIIOOONNNSSS
Care and treatment
Lack of trained staff in healthcare facilities Poor quality of care provided by over-burdened and under-qualified staff Overcrowding and long waiting times to be treated
Recruit and retain more trained staff by providing improved salaries and working conditions Increase monitoring of healthcare personnel Implement regular visits to communities by healthcare workers Increase numbers of visiting specialists from overseas Rehabilitate medical facilities
HH HEE E A
A A LL L TT T
HH H
Facilities Poor condition of health facilities Lack of modern equipment Unavailability of drugs
Construct and fully equip modern facilities Train staff to properly utilize specialized and modern equipment Ensure improved availability of drugs by improving the procurement, storage and distribution system
Regional analysis of the issues and recommendations are presented in Appendix E. It is interesting to note that while regional priorities do not differ significantly from the national level analysis, the order of importance varies somewhat from region to region, and between easily accessible and more remote areas. The hinterland regions showed more variance both in the sector areas requiring attention and in recommended actions. Nevertheless, the public consultations provide a wealth of information and priorities identified by stakeholders as requiring urgent attention. Accordingly, to the extent possible, the medium-term poverty reduction programme takes into consideration many of the identified issues and recommendations. The special consultations with Parliamentarians also provided important feedback. In particular, it helped to (i) expand key areas in the medium term strategy that were not adequately addressed such as tourism and peasant agriculture; (ii) ascertain additional information in terms of the accuracy of the status of the reform agenda and project implementation; and (iii) suggested recommendations for improving future consultations.

POVERTY REDUCTION STRATEGY – PROGRESS REPORT 2005
65
Chapter
THE POVERTY REDUCTION
PROGRAMME MEDIUM-TERM
PROSPECTS6
The Context
In January 2005, torrential rains and subsequent widespread flooding caused tremendous physical damage to the Guyanese coast along Regions 3, 4, and 5, and resulted in great economic and social loss for the country. The impact of the disaster is expected to have lingering effects on the economy that may undermine its performance during the medium term. This section of the report assesses the growth prospects, the medium-term investment programme and its consequences on debt sustainability, and the economic challenges facing Guyana in meeting its PRSP objectives and the MDGs. The assessment begins with (i) an evaluation of the key macroeconomic indicators, (ii) debt sustainability challenges in the medium term; and (iii) the investment required to put the economy on a sustainable growth path. Medium-Term Macroeconomic Outlook Guyana faces serious challenges in the medium term. First, it has to reverse the negative and/or low growth rates of the last 5 years. Second, it has to complete reconstruction of infrastructure damage caused by the January 2005 flooding, adopt mitigating measures to minimize future impacts of such disasters and restore the productive capacity of the economy. Third, it has to create a business-friendly and politically stable environment that will attract direct foreign investment and stem the migration of its entrepreneurs and professionals. Most significantly, overcoming these challenges is integral to its capacity to meet its poverty reduction and MDG commitments. Meeting these challenges will not be easy and will involve serious tradeoffs. This is made more difficult by the internecine political differences between the two major parties and the perceived atmosphere of political instability and uncertainty this creates for both foreign and local investors. In addition, Guyana’s debt sustainability commitments under the E-HIPC impose a binding constraint as to the level and type of debt that can be contracted.
6 The most recent IMF Mission in May 2005 reviewed performance but did not discuss the medium term programme. The Government is herein presenting its proposed framework for the medium term.
7
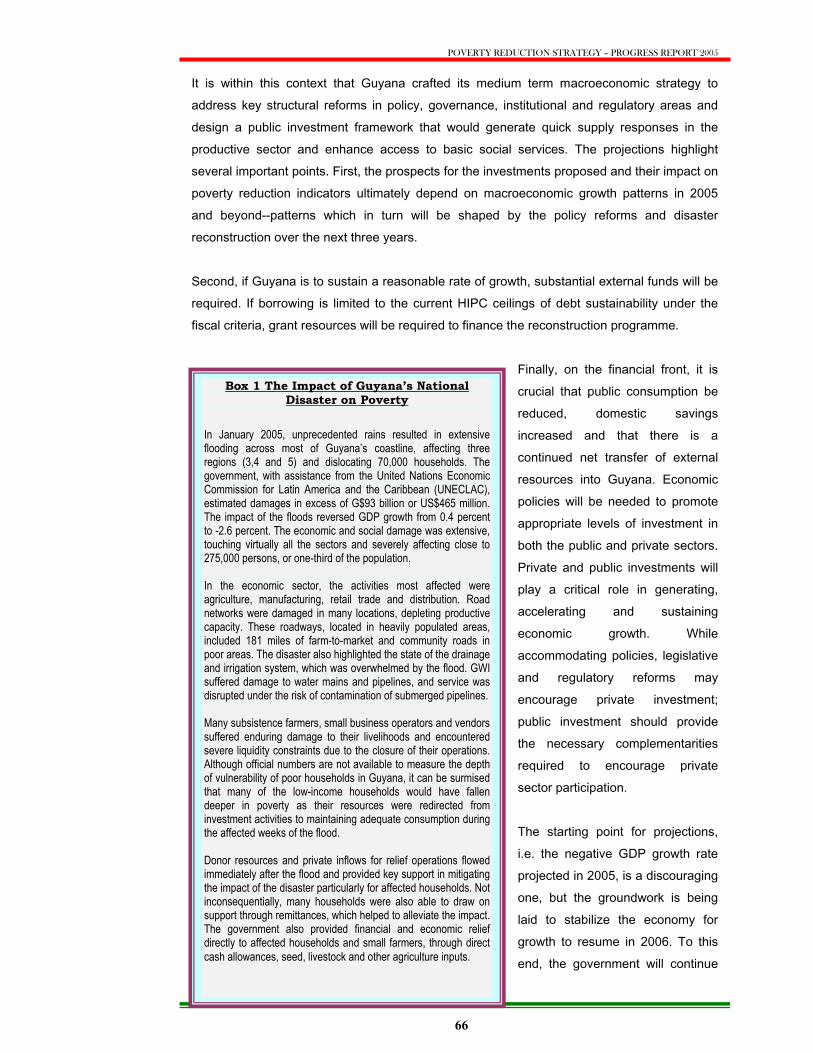
POVERTY REDUCTION STRATEGY – PROGRESS REPORT 2005
66
It is within this context that Guyana crafted its medium term macroeconomic strategy to address key structural reforms in policy, governance, institutional and regulatory areas and design a public investment framework that would generate quick supply responses in the productive sector and enhance access to basic social services. The projections highlight several important points. First, the prospects for the investments proposed and their impact on poverty reduction indicators ultimately depend on macroeconomic growth patterns in 2005 and beyond--patterns which in turn will be shaped by the policy reforms and disaster reconstruction over the next three years. Second, if Guyana is to sustain a reasonable rate of growth, substantial external funds will be required. If borrowing is limited to the current HIPC ceilings of debt sustainability under the fiscal criteria, grant resources will be required to finance the reconstruction programme.
Finally, on the financial front, it is crucial that public consumption be reduced, domestic savings increased and that there is a continued net transfer of external resources into Guyana. Economic policies will be needed to promote appropriate levels of investment in both the public and private sectors. Private and public investments will play a critical role in generating, accelerating and sustaining economic growth. While accommodating policies, legislative and regulatory reforms may encourage private investment; public investment should provide the necessary complementarities required to encourage private sector participation. The starting point for projections, i.e. the negative GDP growth rate projected in 2005, is a discouraging one, but the groundwork is being laid to stabilize the economy for growth to resume in 2006. To this end, the government will continue
Box 1 The Impact of Guyana’s National Disaster on Poverty
In January 2005, unprecedented rains resulted in extensive flooding across most of Guyana’s coastline, affecting three regions (3,4 and 5) and dislocating 70,000 households. The government, with assistance from the United Nations Economic Commission for Latin America and the Caribbean (UNECLAC), estimated damages in excess of G$93 billion or US$465 million. The impact of the floods reversed GDP growth from 0.4 percent to -2.6 percent. The economic and social damage was extensive, touching virtually all the sectors and severely affecting close to 275,000 persons, or one-third of the population. In the economic sector, the activities most affected were agriculture, manufacturing, retail trade and distribution. Road networks were damaged in many locations, depleting productive capacity. These roadways, located in heavily populated areas, included 181 miles of farm-to-market and community roads in poor areas. The disaster also highlighted the state of the drainage and irrigation system, which was overwhelmed by the flood. GWI suffered damage to water mains and pipelines, and service was disrupted under the risk of contamination of submerged pipelines. Many subsistence farmers, small business operators and vendors suffered enduring damage to their livelihoods and encountered severe liquidity constraints due to the closure of their operations. Although official numbers are not available to measure the depth of vulnerability of poor households in Guyana, it can be surmised that many of the low-income households would have fallen deeper in poverty as their resources were redirected from investment activities to maintaining adequate consumption during the affected weeks of the flood. Donor resources and private inflows for relief operations flowed immediately after the flood and provided key support in mitigating the impact of the disaster particularly for affected households. Not inconsequentially, many households were also able to draw on support through remittances, which helped to alleviate the impact. The government also provided financial and economic relief directly to affected households and small farmers, through direct cash allowances, seed, livestock and other agriculture inputs.
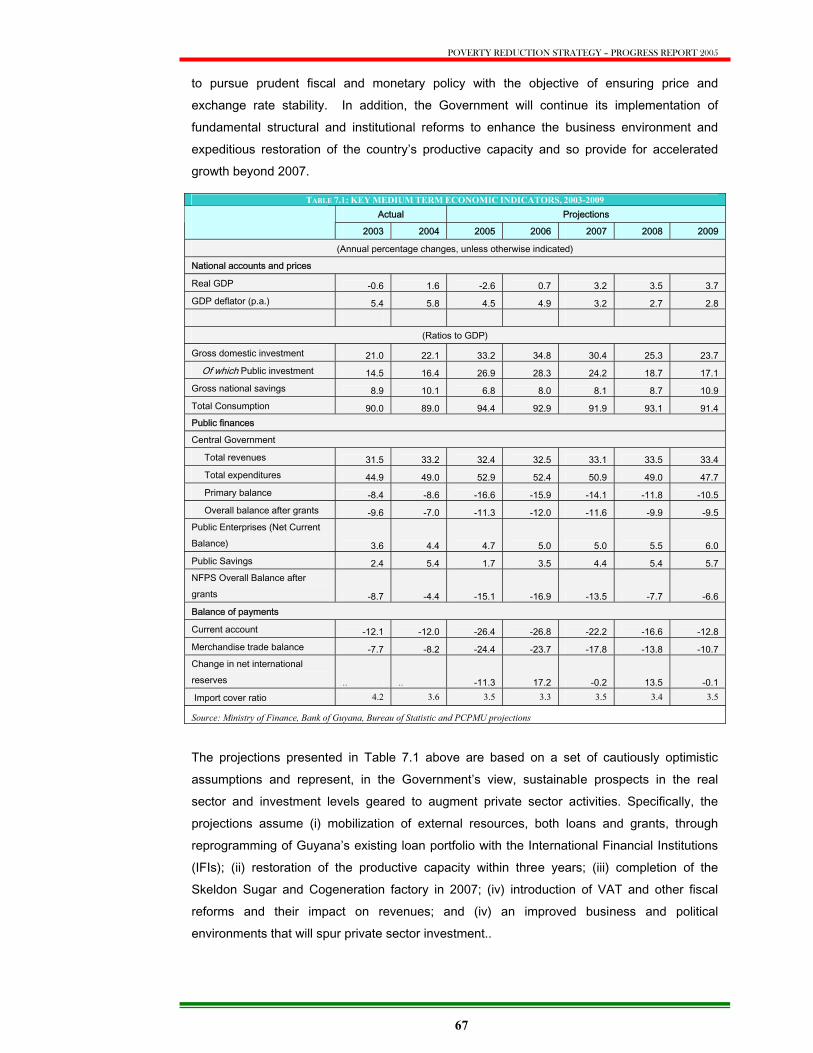
POVERTY REDUCTION STRATEGY – PROGRESS REPORT 2005
67
to pursue prudent fiscal and monetary policy with the objective of ensuring price and exchange rate stability. In addition, the Government will continue its implementation of fundamental structural and institutional reforms to enhance the business environment and expeditious restoration of the country’s productive capacity and so provide for accelerated growth beyond 2007.
The projections presented in Table 7.1 above are based on a set of cautiously optimistic assumptions and represent, in the Government’s view, sustainable prospects in the real sector and investment levels geared to augment private sector activities. Specifically, the projections assume (i) mobilization of external resources, both loans and grants, through reprogramming of Guyana’s existing loan portfolio with the International Financial Institutions (IFIs); (ii) restoration of the productive capacity within three years; (iii) completion of the Skeldon Sugar and Cogeneration factory in 2007; (iv) introduction of VAT and other fiscal reforms and their impact on revenues; and (iv) an improved business and political environments that will spur private sector investment..
TABLE 7.1: KEY MEDIUM TERM ECONOMIC INDICATORS, 2003-2009 Actual Projections
2003 2004 2005 2006 2007 2008 2009
(Annual percentage changes, unless otherwise indicated)
National accounts and prices
Real GDP -0.6 1.6 -2.6 0.7 3.2 3.5 3.7 GDP deflator (p.a.) 5.4 5.8 4.5 4.9 3.2 2.7 2.8
(Ratios to GDP)
Gross domestic investment 21.0 22.1 33.2 34.8 30.4 25.3 23.7 Of which Public investment 14.5 16.4 26.9 28.3 24.2 18.7 17.1 Gross national savings 8.9 10.1 6.8 8.0 8.1 8.7 10.9 Total Consumption 90.0 89.0 94.4 92.9 91.9 93.1 91.4 Public finances
Central Government
Total revenues 31.5 33.2 32.4 32.5 33.1 33.5 33.4 Total expenditures 44.9 49.0 52.9 52.4 50.9 49.0 47.7 Primary balance -8.4 -8.6 -16.6 -15.9 -14.1 -11.8 -10.5 Overall balance after grants -9.6 -7.0 -11.3 -12.0 -11.6 -9.9 -9.5 Public Enterprises (Net Current Balance) 3.6 4.4 4.7 5.0 5.0 5.5 6.0 Public Savings 2.4 5.4 1.7 3.5 4.4 5.4 5.7 NFPS Overall Balance after grants -8.7 -4.4 -15.1 -16.9 -13.5 -7.7 -6.6 Balance of payments
Current account -12.1 -12.0 -26.4 -26.8 -22.2 -16.6 -12.8 Merchandise trade balance -7.7 -8.2 -24.4 -23.7 -17.8 -13.8 -10.7 Change in net international reserves .. .. -11.3 17.2 -0.2 13.5 -0.1 Import cover ratio 4.2 3.6 3.5 3.3 3.5 3.4 3.5
Source: Ministry of Finance, Bank of Guyana, Bureau of Statistic and PCPMU projections
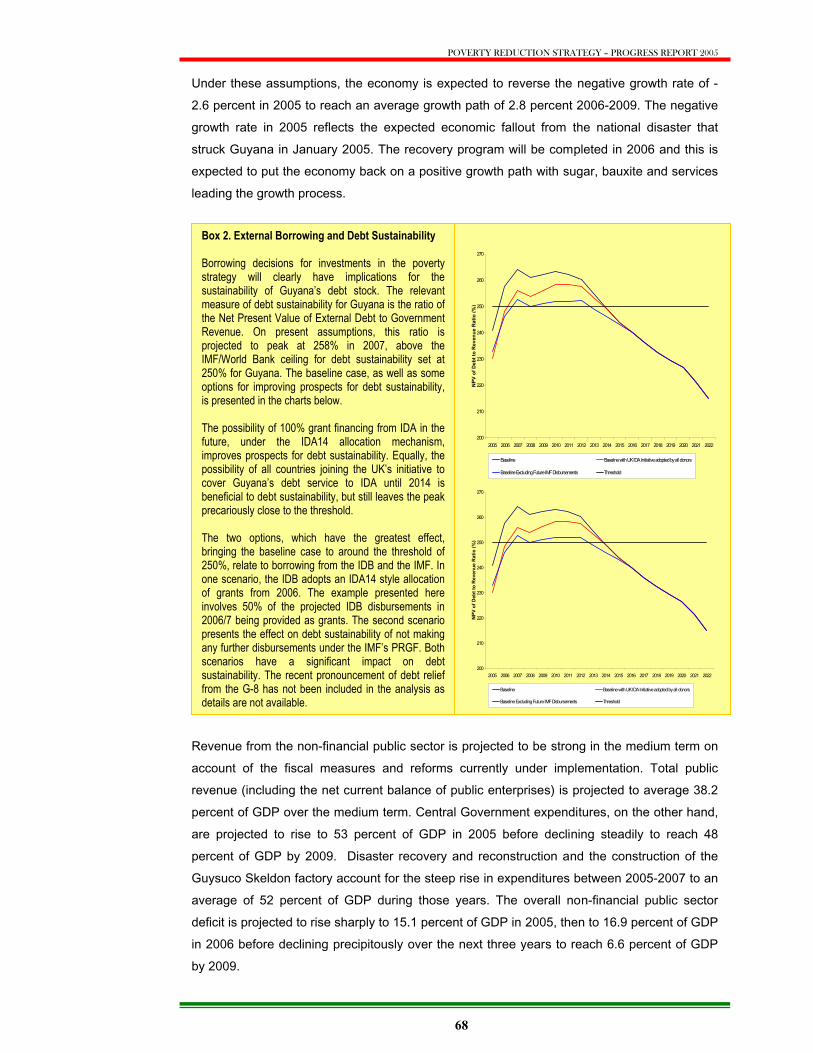
POVERTY REDUCTION STRATEGY – PROGRESS REPORT 2005
68
200
210
220
230
240
250
260
270
2005 2006 2007 2008 2009 2010 2011 2012 2013 2014 2015 2016 2017 2018 2019 2020 2021 2022
NPV
of D
ebt t
o R
even
ue R
atio
(%)
Baseline Baseline with UK IDA Initiative adopted by all donors
Baseline Excluding Future IMF Disbursements Threshold
200
210
220
230
240
250
260
270
2005 2006 2007 2008 2009 2010 2011 2012 2013 2014 2015 2016 2017 2018 2019 2020 2021 2022
NPV
of D
ebt t
o R
even
ue R
atio
(%)
Baseline Baseline with UK IDA Initiative adopted by all donors
Baseline Excluding Future IMF Disbursements Threshold
Under these assumptions, the economy is expected to reverse the negative growth rate of -2.6 percent in 2005 to reach an average growth path of 2.8 percent 2006-2009. The negative growth rate in 2005 reflects the expected economic fallout from the national disaster that struck Guyana in January 2005. The recovery program will be completed in 2006 and this is expected to put the economy back on a positive growth path with sugar, bauxite and services leading the growth process.
Revenue from the non-financial public sector is projected to be strong in the medium term on account of the fiscal measures and reforms currently under implementation. Total public revenue (including the net current balance of public enterprises) is projected to average 38.2 percent of GDP over the medium term. Central Government expenditures, on the other hand, are projected to rise to 53 percent of GDP in 2005 before declining steadily to reach 48 percent of GDP by 2009. Disaster recovery and reconstruction and the construction of the Guysuco Skeldon factory account for the steep rise in expenditures between 2005-2007 to an average of 52 percent of GDP during those years. The overall non-financial public sector deficit is projected to rise sharply to 15.1 percent of GDP in 2005, then to 16.9 percent of GDP in 2006 before declining precipitously over the next three years to reach 6.6 percent of GDP by 2009.
Box 2. External Borrowing and Debt Sustainability Borrowing decisions for investments in the poverty strategy will clearly have implications for the sustainability of Guyana’s debt stock. The relevant measure of debt sustainability for Guyana is the ratio of the Net Present Value of External Debt to Government Revenue. On present assumptions, this ratio is projected to peak at 258% in 2007, above the IMF/World Bank ceiling for debt sustainability set at 250% for Guyana. The baseline case, as well as some options for improving prospects for debt sustainability, is presented in the charts below. The possibility of 100% grant financing from IDA in the future, under the IDA14 allocation mechanism, improves prospects for debt sustainability. Equally, the possibility of all countries joining the UK’s initiative to cover Guyana’s debt service to IDA until 2014 is beneficial to debt sustainability, but still leaves the peak precariously close to the threshold. The two options, which have the greatest effect, bringing the baseline case to around the threshold of 250%, relate to borrowing from the IDB and the IMF. In one scenario, the IDB adopts an IDA14 style allocation of grants from 2006. The example presented here involves 50% of the projected IDB disbursements in 2006/7 being provided as grants. The second scenario presents the effect on debt sustainability of not making any further disbursements under the IMF’s PRGF. Both scenarios have a significant impact on debt sustainability. The recent pronouncement of debt relief from the G-8 has not been included in the analysis as details are not available.

POVERTY REDUCTION STRATEGY – PROGRESS REPORT 2005
69
The external account is projected to register steep declines, particularly in 2005 and 2006. Higher capital imports for the Skeldon Project, increasing fuel prices, and the volume of consumer and durable goods to restock depleted inventories combined with lower volumes of sugar exports, will lead to a significant deterioration of the current account balance. As a result, the current account deficit will rise from 12 percent of GDP in 2004 to about 26.7 percent of GDP in 2005 and 26.8 percent in 2006 before declining to 12.8 percent of GDP in 2009. Gross international reserves will remain at an average of 3.4 percent of import cover.
The Investment Programme
Clearly, transforming the economy, improving economic and social infrastructure and meeting the MDGs will require substantially more resources. Yet, unless Guyana undertakes critical investments in recovery and reconstruction, modernizes and restructures the sugar industry and begins laying the ground work to facilitate private sector investment and growth, poverty indicators will worsen sharply and attainment of the MDGs may become elusive. Consistent with the output growth rates presented above, the public investment requirement for the period through 2009 was derived on the basis of a review of each sector’s past performance and future potential, in addition to the urgency of completing recovery and reconstruction of the productive capacity destroyed by the recent floods. These levels are represented in the public investment breakdown shown in Table 7.2 below. The medium-term investment programme represents a significant increase over the previous years. Figure 7.1 provides trends of the investment programme from 2000 to 2009. From G$25.2 billion in 2004, the programme rises precipitously to G$47.5 billion in 2006 before declining to G$34.4 billion in 2009. Several factors are responsible for this steep rise. First, the restructuring of the sugar industry, included in the PSIP, is estimated to cost close to G$30 billion during 2005-2007. Second, rehabilitation and reconstruction of infrastructure arising out of the natural disaster is estimated to cost about G$14.6 billion over the same period. And, third, the cricket stadium under construction, will contribute another G$4.7 billion. With the completion of these major projects, the investment programme begins to decline in 2008, returning close to 2000 levels in 2009 (as a share of GDP).
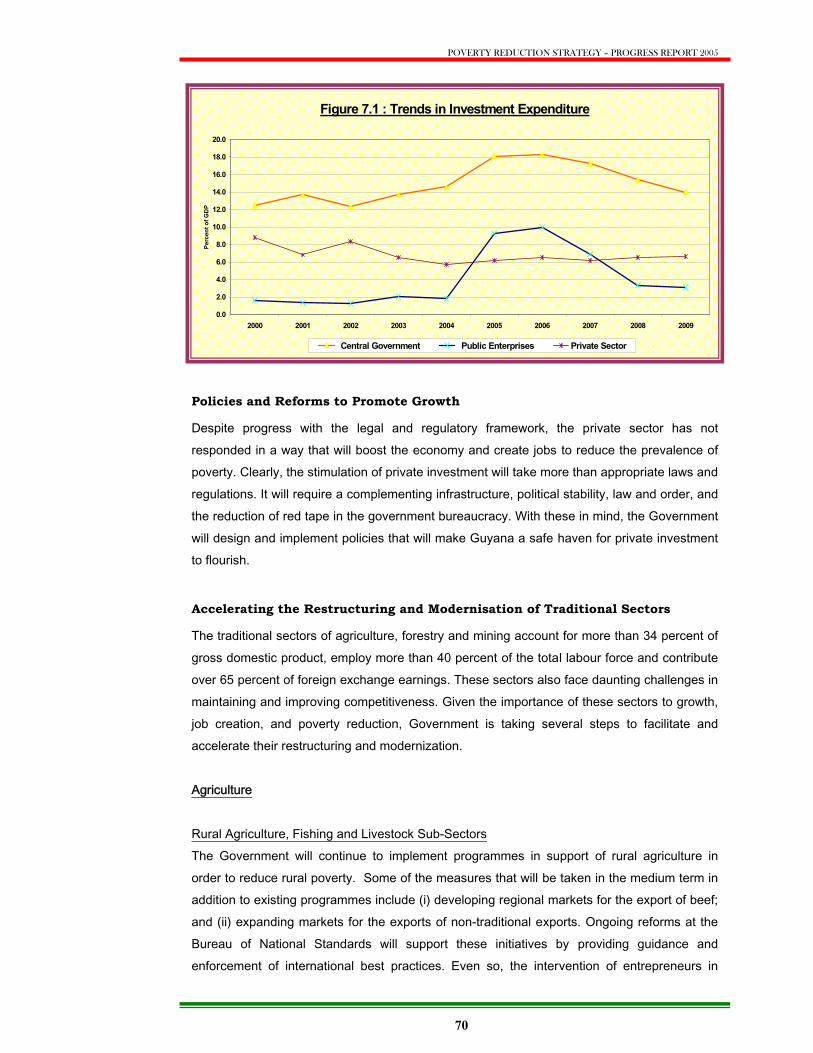
POVERTY REDUCTION STRATEGY – PROGRESS REPORT 2005
70
Policies and Reforms to Promote Growth
Despite progress with the legal and regulatory framework, the private sector has not responded in a way that will boost the economy and create jobs to reduce the prevalence of poverty. Clearly, the stimulation of private investment will take more than appropriate laws and regulations. It will require a complementing infrastructure, political stability, law and order, and the reduction of red tape in the government bureaucracy. With these in mind, the Government will design and implement policies that will make Guyana a safe haven for private investment to flourish.
Accelerating the Restructuring and Modernisation of Traditional Sectors
The traditional sectors of agriculture, forestry and mining account for more than 34 percent of gross domestic product, employ more than 40 percent of the total labour force and contribute over 65 percent of foreign exchange earnings. These sectors also face daunting challenges in maintaining and improving competitiveness. Given the importance of these sectors to growth, job creation, and poverty reduction, Government is taking several steps to facilitate and accelerate their restructuring and modernization. Agriculture Rural Agriculture, Fishing and Livestock Sub-Sectors The Government will continue to implement programmes in support of rural agriculture in order to reduce rural poverty. Some of the measures that will be taken in the medium term in addition to existing programmes include (i) developing regional markets for the export of beef; and (ii) expanding markets for the exports of non-traditional exports. Ongoing reforms at the Bureau of National Standards will support these initiatives by providing guidance and enforcement of international best practices. Even so, the intervention of entrepreneurs in
Figure 7.1 : Trends in Investment Expenditure
0.0
2.0
4.0
6.0
8.0
10.0
12.0
14.0
16.0
18.0
20.0
2000 2001 2002 2003 2004 2005 2006 2007 2008 2009
Perc
ent o
f GD
P
Central Government Public Enterprises Private Sector
POVERTY REDUCTION STRATEGY – PROGRESS REPORT 2005
71
packaging and marketing will be critical in the success of the government’s rural agriculture program. The Investment Law and the Small Business Act provide incentives in geographic location of industries. The Government through Go-Invest will market the sector opportunities with the view of attracting investors in the agriculture sector. In the rice sub-sector, in particular, the Government in the medium term will continue to implement its 2001-2011 strategic plan with emphasis, in the near term, on (i) improving cleaning, drying and storage facilities in each of the rice growing areas by 2006; (ii) obtaining 50 percent whole grain of milled rice of acceptable quality by 2005; (iii) increase the production of parboiled rice as a percent of whole grain to 25 percent; (iv) increase the share packaged rice production to 10 percent of total production; (v) establish bulk loading facilities for by 2006; and (vi) issue freehold land titles for 60 percent of rice farmers by 2006. As part of the Fisheries Management and Development Plan, an Exploratory Committee will be established to assess the possibility of harvesting offshore resources. The Fisheries Department will restart the Observer Programme to better understand the potential of the seabob resource. The department is also expecting three projects to come on stream with funding from Japan, in the areas of aquaculture, a database of Caribbean Fisheries and an offshore survey for Large Pelagics. Another focus for 2005 is the restarting of the Cooperative Societies so that they can honour their debts to the Fisheries Department, which amount to approximately US$25 million. The Guyana Marketing Corporation (GMC) will continue its marketing efforts through export promotion activities in the Caribbean and North America. In collaboration with GoInvest, the trade and investment exposition--Guyana on Show--will take place in St. Lucia, Jamaica, New York and Miami. These activities, in combination with market studies, will identify key growth areas. In order to transfer this information to stakeholders, GMC will continue field visits to farming areas. Specifically, in the dairy sector, a priority goal for the National Dairy Development Programme (NDDP) is the effective use of limited resources to increase beef production in targeted areas on the coast, with particular emphasis on producing beef with increased export possibilities. Support will be provided for the establishment of dairy processing units and the promotion of local dairy products. In order to accomplish the above, the NDDP will continue to unify farmers into strong, viable and sustainable groups to better withstand the impacts of globalisation. Guyana will benefit from 11.7 million of the 24 million Euros within the European Union’s Rice Project to assist Cariforum countries in improving competitiveness in the rice sector. Work on this project has started and will continue in 2005. During 2005, GRDB will continue to work towards increasing production within the sector and monitoring the sale of paddy by farmers to millers.

POVERTY REDUCTION STRATEGY – PROGRESS REPORT 2005
72
The Sugar Sub-sector One of the key challenges facing Guysuco is the reform of the European Sugar regime, which will come into effect in mid-2006. The proposals will see a reduction in price under the Sugar Protocol, amounting to 39 percent over a four -year period. The speed and depth of this cut will be extremely damaging to a vulnerable industry and is expected to result in an annual loss of income of US$90 million for CARICOM sugar producers as a whole. For Guyana, the EU proposal on reform of the sugar regime will result in an annual loss of US$40 million. This will be exacerbated by an enforced change to EU sugar subsidies after a challenge in the WTO. The change will put further downward pressure on international prices, again affecting the viability of the industry. (i) Skeldon Factory
The Guysuco Skeldon Factory project covers the construction of (i) the raw sugar factory; and (ii) the steam and power cogeneration plant. Upon completion, the factory will be capable of producing up to 120,000 tonnes of high quality (VHP) raw sugar per year and supplying 10 MW of power to the national grid. Design work for the factory is ongoing. An advance team of ten engineers is currently in Guyana preparing for mobilisation and will be followed by the arrival of another workforce in August 2005. Civil works will begin in November 2005. Factory equipment will begin arriving in March 2006. Construction work will continue through to mid 2007, and the factory commissioned in October 2007.
(ii) Cogeneration This significant element of the works will comprise the capability to export 10 MW of power throughout the year on a guaranteed basis. The bagasse residue from the sugar cane process will be the primary fuel supplemented by diesel-powered generation when bagasse stocks are exhausted during the inter-crop periods. The early completion of the diesel power plant will allow Guysuco to export power in advance of the main factory completion, thereby increasing its revenue stream and improving the stability of the power supply in Berbice.
(iii) Cane Production
The project has planted approximately 16 percent of the target cane area, with further planting being constrained by the processing capacity of the existing sugar factory. The production of additional sugar cane will be constrained by the availability of resources and will be synchronised with the commissioning of the new factory. In addition, Guysuco will adopt and begin implementation of an Environmental Management Plan for the Skeldon Project and associated canefield expansion including effective wildlife conservation at the Halcrow and Guysuco conservancies.
POVERTY REDUCTION STRATEGY – PROGRESS REPORT 2005
73
Forestry
The Government, in 2005, will submit a revised Forestry Act that improves the legal basis for sustainable and environmentally sound management of Guyana’s forests. The regulations to this Act will be completed in 2006.
Mining
The Mining Amendment Act will be tabled in Parliament in 2006. An Environmental Impact Assessment for the mining sector will be conducted in 2005. Terms of References for the study have already been drafted. Additional strategies, which have been developed and will be initiated include:
Developing multi-stakeholder participation and consensus on mining sector issues
Enhancing indigenous community participation and benefit sharing Improving small and medium scale mining.
Priority areas for the Geology and Mines Commission for 2005 are as follows:
Improving environmental practice, efficiencies and productivity in the sector Improving land management and access for both miners and indigenous
communities with benefit-sharing for the latter Demonstrating and encouraging improved mining and processing techniques Piloting fully for replication re-vegetation projects
RUSAL is currently undertaking pre-feasibility studies, inclusive of confirmatory geological borehole drilling for reserves with a view of establishing an Alumina plant and will take ownership of the Aroaima Bauxite Company by end 2005. Gold Stone Resources has begun to expand prospects for the development of high plateau bauxite in the west of the country, and initial discussions are underway with Trinidad and Tobago’s National Gas Company on how an alumina plant project in Guyana may fit into the Trinidad Aluminum Smelter Project. Tourism Guyana’s tourism sector offers exciting opportunities for economic growth and poverty reduction. Over the last 5 years, substantial progress has been made in developing the tourism sector. Nevertheless, progress is limited by poor infrastructure, degradation of the environment and stable political environment. In the context of the vast potential, the Government has developed a 5-year tourism strategic plan to rejuvenate the sector and create employment opportunities. The Strategic Plan takes into account (i) an assessment of the industry and the global tourism industry; (ii) recent developments in the eco-tourism industry; and (iii) recent study titled “Identification of Tourism Development Initiatives for Guyana”.
POVERTY REDUCTION STRATEGY – PROGRESS REPORT 2005
74
The development of the strategic plan will would require (i) a comprehensive assessment of initiatives towards policy and planning of initiatives towards policy planning for the sector; (ii) examination of the integration of the tourism sector within the wider national development context; (iii) assessment of positioning of tourism as a priority sector for national development; and (iv) engagement in consultation of wide cross-section of stakeholders. The Strategic Plan, among other areas, will concentrate on policy, planning, markets and marketing, legislation, standards, infrastructure and accommodation. Improving Competitiveness Guyana operates an open economy with exports accounting for more than 75 percent of GDP. With small population and limited internal market, growth prospects and poverty reduction are tied to Guyana’s proper management of its adjustment to the new world economic environment. To this end, the Government will implement policies in the medium-term that will improve the country’s competitiveness in the global markets place and that ties in all the facets of its productive sector. In particular, the Government will implement core policies that cut across most sectors of the economy and consists of incentive policies including macroeconomic policy, competition policy, taxation policy and trade policy and supply side policies including policy measures with respect to education and training, technology and standards, finance, investment promotion, red tape and aspects of the legal system; sector strategies to address the particular obstacles and opportunities facing enterprises on a sector specific basis; and (iii) strategic sub-sector or cluster policies that aim to target centers of dynamism which provide opportunities for growth and diversification.
Implementing Tax and Expenditure Reforms
The Guyana Revenue Authority (GRA) will continue to enhance the system for registering taxpayers, accounting for revenue collections and controlling refunds as part of the planned implementation of the new information technology-based tax administration system. Work will continue on the implementation of the Taxpayer Identification Number (TIN) system, along with efforts to computerize the License Revenue Office. A comprehensive Audit Plan is being developed to improve audit coverage of the tax roll and increase the recovery of unpaid taxes. Initiatives to enhance the anti-corruption programme through increased investigations, enforcement measures, training, and sanctions will also be maintained. Systems to track information on tax exemptions will be enhanced, enabling more detailed information to be published when the information technology tax administration systems become operational. In addition, policies, procedures and systems will be put in place for the administration of the Customs Duties (Amendment) Order No. 6 of 2005. The Value Added Tax (VAT) Bill was enacted in July 2005 and implementing regulations for the VAT and Excise Tax will be in place by October 2005. The VAT Legislation would replace the Consumption Tax Act, the Travel Voucher Tax Act, the Hotel Accommodation Tax Act and
POVERTY REDUCTION STRATEGY – PROGRESS REPORT 2005
75
laws relating to service, premium, purchase, entertainment and telephone taxes. Once passed, it will lead to registration of businesses ahead of the full implementation of the system by July 2006. A number of consultation sessions are planned leading up to VAT implementation. A VAT Steering Committee and Implementation Team is in place at the GRA, along with a VAT Unit. In addition, the Government will publish tax exemptions granted, specifying the amount and recipients by categories, by the end of June 2005. Further, a study has been undertaken on the economic costs and benefits of the existing exemptions focussing on how the exemptions affect the critical economic sectors. On improving the soundness of the pension system, a prudential framework for investment decisions of the National Insurance Scheme will be implemented in September 2005 and a review of the public service pension system will be undertaken in December 2005. Monetary and Financial Sector Reforms The Government will also take measures to implement monetary and financial reforms in order to further improve the operations of the financial system. To this end, a Financial Sector Assessment Programme (FSAP) will be undertaken shortly to provide a comprehensive review of Guyana’s financial system and vulnerabilities. Consistent with the Amended Bank of Guyana Act 2004, the Governor of the central bank was appointed in June 2005. In recent years, there have been discrepancies in fiscal and monetary data. Towards resolving this issue, an action plan for reconciliation of fiscal and monetary accounts was completed in May 2005. The Bank of Guyana will continue to conduct onsite inspections of at least 4 banks. The New Building Society inspection is scheduled in 2006. In addition, the banking supervision department of the Bank of Guyana will intensify training on risk-based supervision, develop a risk-based manual, and computerize the financial charts of accounts. Further, the Government will support the reduction of financial intermediation costs by establishing a commercial court in 2005 and issuing title deeds without restriction on transfers. The Government will also review and update all AML/CFT legislation to ensure that they are in line with international best practices.
Export Promotion
Although the Guyana Office of Investment (GoInvest) was created to promote a more conducive investment climate, attract foreign direct investment (FDI), and promote export of traditional and non-traditional commodities, GoInvest has not yet been transformed into a truly one-stop shop. Government, in the medium-term, will restructure and refocus GoInvest in terms of its capacity to assist investors to set up businesses by filing all necessary documents and receiving all permits. This will include the establishment of branch offices/business centers in the key economic centers in the country. The main and branch offices will be staffed by well-trained advisors and equipped with state of the art communications and IT
POVERTY REDUCTION STRATEGY – PROGRESS REPORT 2005
76
equipment. GoInvest will also have the responsibility of facilitating FDI flows and encouraging exports to regional and international markets. Measurable results will include reducing the number of days to set up a business and increases in the levels of FDI and exports. Funds are required for training, hiring expert advisors, and for equipping the various business centers.
Investment Promotion
Towards creating a favourable investment climate and promoting foreign and domestic investment, the Government will continue its fight against violent crime, improve its economic infrastructure, improve governance and continue positive dialogue with the political opposition. Many of these issues have already been dealt with in several sections of the document. In addition to implementing reforms in many of these areas, the Government will establish a Small Business Council to review regulations in the business sector and make recommendations to simplify procedures. Also, the Investment Promotion Council will be established to carry out the functions set out in the Investment Law. Further, the Government will review the Companies Act 1991, the Partnership Act, the Business Names (Registration) Act and the Friendly Societies Act of Guyana. In addition, IPED will continue to promote investment in aquaculture, and to encourage the production and exportation of soya beans. Its Hinterland Thrust will be consolidated in 2005, and a methodology for promoting a business orientation in young people will be developed through collaboration with more than 50 youth groups. IPED also plans to focus more concertedly on working with the unemployed, and is currently negotiating with Laparkan and Western Union on the possibility of remittances being used for investment in business development. In addition, IPED will foster closer links with agencies such as the UG Faculty of Technology, IAST and the EPA to facilitate the transfer of technology to the business sector. It is envisaged that over the next three years, the EMPRETEC programme will continue to implement its Small Business Development Programme, about which initial discussions have already been held with the Ministry of Tourism, Industry & Commerce. By the end of 2008, it is expected that a total of 400 entrepreneurs with high growth potential operating primarily in the key development sectors of general manufacturing, tourism, textiles and clothing, wood and agro processing, will be exposed to the tools necessary for improved competitiveness both locally and internationally. To facilitate the establishment of small business, IPED, EMPTRETEC and Go-Invest will provide training and assistance to set-up or support newly established business and also assist in identifying potential new export markets. To this end, the Bureau of Standards will continue to provide information, support and awareness and enforce internationally agreed standards of product quality.
POVERTY REDUCTION STRATEGY – PROGRESS REPORT 2005
77
Governance and Institutional Regulatory Reforms
(i) Improving Transparency and Accountability The Government will take steps to strengthen institutions and agencies that provide oversight to public finances. To this end, the Audit Act, which was enacted in 2004, will become operational in 2005. Further, steps will be taken to implement several recommendations in the Auditor General’s Report. Specifically, the Wildlife Division will be merged with the Environmental Protection Agency (EPA) and its revenues transferred to the consolidated fund in 2005. Accounts of the Wildlife Division in the medium-term will be audited as part of the accounts of the EPA. Also, all existing external loans will be tabled in Parliament and the audited accounts of the GRA will be placed in Parliament. In addition, fiduciary oversight will be strengthened through (i) enhanced parliamentary oversight; (ii) reduction in discretionary powers; and (iii) disclosure of officials’ assets. Specifically, the Government will adopt and begin implementation of a time-bound reform programme to implement recommendations of the fiduciary oversight studies. Further, the Ministry of Finance will complete reconciliation of the payroll and IFMAS databases for all public servants identify major disparities between IFMAS and payroll, and complete reconciliation of the disparities in 2006.
(ii) Procurement Reforms
With the passage of the Procurement Act and its regulations, the Government has begun undertaking administrative reforms to enhance the operational efficiency of the agencies and institutions involved in implementing the Procurement Act. In line with this, the government has appointed the members of the National Procurement Board (NPAB) and within the next 18 months will complete the following reforms:
• Dissemination of new laws and regulations through workshops and seminars;
• Preparation of new administrative tools to discharge the NPAB’s new responsibilities including internal administrative rules, standing bidding documents, prequalification, evaluation, and contract forms, procurement manuals, guidelines and procedures, and flow charts and time schedules for all procurement methods;
• Design and implementation of a management information system for the NPAB’s operation; and
• Preparation of training and dissemination program on new administrative tools
• Design and preparation of technical specifications for an electronic computer software/hardware package.

POVERTY REDUCTION STRATEGY – PROGRESS REPORT 2005
78
(iii) Land Tenure Security and Land Administration
The Government in the medium term will continue to improve land tenure security and land administration with a view to (i) reducing the time for Land Registry transfers by private landowners from 4 to 2 weeks; (ii) making land and property information available in a central location; and (iii) establishing a one-stop-shop for property transactions at the GLSC. In 2005, GLSC will complete the computerization of its land registry records.
(iv) Local Government
Efforts will continue to promote capacity building and institutional strengthening within the Local Government system, and a strategic plan will be in place by the end of 2005. These reforms, which would include training and recruitment of staff, will assist local government entities in efficiently managing the affairs of local communities. Further reforms in the medium-term will include amendment of Local Government Laws, which will be designed to empower local government bodies and also hold these bodies more accountable. In addition to ongoing programmes currently on stream, the Ministry will be working on:
• continued support for the Local Government Reform Process prior to new Local Government Elections, allowing communities to choose their own leaders;
• the dissemination of national policies for implementation by the Regional and Local Government Administration;
• the identification and preparation of landfill sites in Regions 3 and 4; • the completion of the Urban Development Programme; and • the establishment of four new townships.
(v) Reducing Crime and Improving the Justice Administration
The Government will continue to attach high priority to reducing crime and improving the general security of Guyanese. To this end, specific measures will be taken to improve the institutional capacity of the security agencies to maintain law and order. Measures will include: • Enhancement of the capacity of the Guyana Police Force to prevent, detect
and interdict criminal activities; • Restructuring of the Guyana Prison Service and implementation of structured
programmes for security and rehabilitation of prisoners; • Mainstreaming the use of Information Technology within the Ministry of Home
Affairs for greater administrative and operational efficiency;
POVERTY REDUCTION STRATEGY – PROGRESS REPORT 2005
79
• Establishment of an administrative framework and structure, and the coordination of the activities of the various departments involved in the implementation of the Guyana/Brazil International Road Transport Agreement;
• Development of a National Immigration Policy and a strategic plan for the Secretariat;
• Implementation of the National Drug Strategy Master Plan, 2005-2009; • Reviewing the penal code with a view of making it harsher in dealing with
repeated and violent crimes. Enhancing the capacity of the Guyana Police force to detect and prevent crime and to prosecute criminal offenders is central to crime prevention efforts. In pursuit of these goals the following activities will be undertaken:
• Reorientation and decentralization of community policing in Guyana to allow members of community policing groups to become the catalyst for positive change in their communities, by projecting civic responsibility and alternatives to criminal lifestyles. The Units will not be centralized but there will be strong linkages between communities and the Police Division to facilitate the transfer of intelligence, ensure the security of communities and promote positive police-community relations.
• Enhancement of Border and Immigration Security to better monitor entries and stem trafficking in weapons, illicit drugs and in persons. Elimination of piracy in seaports, along the rivers and the Atlantic Coast will also be vigorously pursued and for that purpose the Marine Police station at Ruimveldt has been rebuilt, and a vibrant River and Shore Patrol Unit will be established. These improvements are critical given the imminent development of airstrips at Bartica and other locations, but resources such as vehicles, boats, communication equipment, computers, etc. are required for them to materialize.
• Reorientation of Ranks and Responsibilities for Law and Order will require that ranks respond to any crime observed or reported, regardless of the nature of that crime or the proximity of the crime scene to the station to which the rank is attached. Members of the force will intervene in any incident of public disorder including domestic violence and indecent language, and the beat system of police foot patrol will be reintroduced.
• Improvement of Public Relations and the Image of the Force will be pursued through training to develop civility and professionalism, and to dispel the aggressive and acrimonious image that may be projected by some ranks and perceived by some members of the public.

POVERTY REDUCTION STRATEGY – PROGRESS REPORT 2005
80
• Development of a Modern and Effective Force that is a technically and technologically sound organization throughout the next decade, and is capable of providing a service to the nation that is compatible with its regional and hemispheric counterparts. To this end, a process had begun to familiarize members of the Force with information systems and communications technology. This includes using the internet for research and for rapid and secure transfer and exchange of information between patrols on the road, investigators in the field and officials at the central database. There will also be a more coherent effort at networking between the Force and other collaborating local government agencies. A diagnostic study for the Information System has been completed but its implementation will require foreign assistance. Critical to the modernization of the Force is the development of language skills relevant for interacting with citizens from all countries in South America. Competency in a second language will become an essential condition for advancement in the Force. The Government will continue to improve the administration of the justice system in support of an enabling business environment and adherence to fundamental human rights and the rule of law. To this end, consultancy work is ongoing with a view of passing commercial legislation and establishing a commercial court. This will help to instil confidence in investors with regard to the legal system. The judiciary also continues to make progress in the reduction of backlog of cases. It is anticipated that by 2007, the current backlog of over 7,000 cases will decline to about 2,500.
In addition, the judiciary plans to establish a family court in 2007. Among other things, this court will help to bring quicker resolution to family matters, especially those involving children. Further, training will be provided to personnel involved in Alternate Dispute Resolution with a view of reducing the number of cases that make their way to the courts. The north-south wing of the High Court will be rehabilitated and the Court of Appeal extended and renovated, in order to meet the requirements of the Caribbean Court of Justice.
(vi) Improving Political Governance
The Government, in consultation with the Parliament and the major political parties, will carry out comprehensive reforms with a view to improving political governance in the medium-term. These reforms that will involve the Parliament, the Parliamentary Committees and the Executive Branch, will be essential for strengthening and deepening the democratic process and providing an umbrella framework for political parties and in particular, the National Assembly, to contribute more meaningfully to the development process. The comprehensive study undertaken in Fiduciary Oversight and the Davies Report will form the basis of this. The 2001 Constitutional

POVERTY REDUCTION STRATEGY – PROGRESS REPORT 2005
81
Amendment, the recommendations of the Fiduciary Oversight Study and recommendations of the Davies Report will form the basis of these medium term reforms. To this end, a time bound action plan will be proposed to address many of the recommendations that will further expand the role and the autonomy of the National Assembly to meaningfully contribute to Guyana’s development.
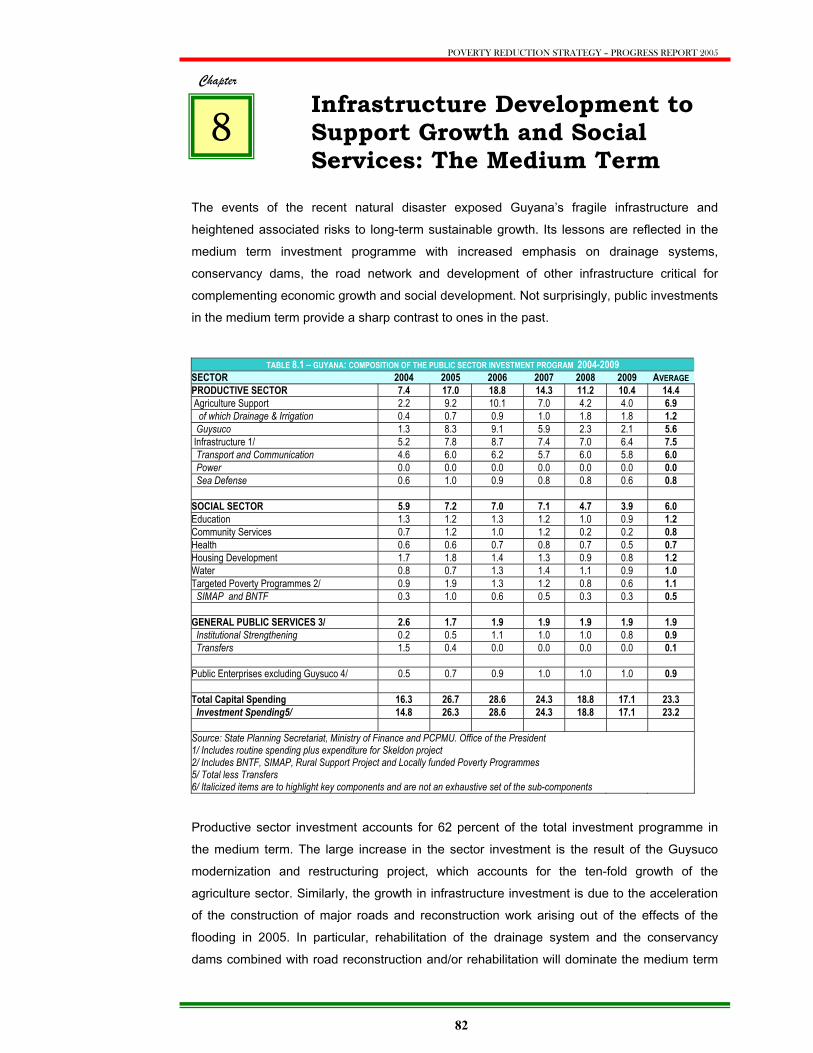
POVERTY REDUCTION STRATEGY – PROGRESS REPORT 2005
82
Chapter
Infrastructure Development to Support Growth and Social Services: The Medium Term
The events of the recent natural disaster exposed Guyana’s fragile infrastructure and heightened associated risks to long-term sustainable growth. Its lessons are reflected in the medium term investment programme with increased emphasis on drainage systems, conservancy dams, the road network and development of other infrastructure critical for complementing economic growth and social development. Not surprisingly, public investments in the medium term provide a sharp contrast to ones in the past.
Productive sector investment accounts for 62 percent of the total investment programme in the medium term. The large increase in the sector investment is the result of the Guysuco modernization and restructuring project, which accounts for the ten-fold growth of the agriculture sector. Similarly, the growth in infrastructure investment is due to the acceleration of the construction of major roads and reconstruction work arising out of the effects of the flooding in 2005. In particular, rehabilitation of the drainage system and the conservancy dams combined with road reconstruction and/or rehabilitation will dominate the medium term
TABLE 8.1 – GUYANA: COMPOSITION OF THE PUBLIC SECTOR INVESTMENT PROGRAM 2004-2009 SECTOR 2004 2005 2006 2007 2008 2009 AVERAGE PRODUCTIVE SECTOR 7.4 17.0 18.8 14.3 11.2 10.4 14.4 Agriculture Support 2.2 9.2 10.1 7.0 4.2 4.0 6.9 of which Drainage & Irrigation 0.4 0.7 0.9 1.0 1.8 1.8 1.2 Guysuco 1.3 8.3 9.1 5.9 2.3 2.1 5.6 Infrastructure 1/ 5.2 7.8 8.7 7.4 7.0 6.4 7.5 Transport and Communication 4.6 6.0 6.2 5.7 6.0 5.8 6.0 Power 0.0 0.0 0.0 0.0 0.0 0.0 0.0 Sea Defense 0.6 1.0 0.9 0.8 0.8 0.6 0.8 SOCIAL SECTOR 5.9 7.2 7.0 7.1 4.7 3.9 6.0 Education 1.3 1.2 1.3 1.2 1.0 0.9 1.2 Community Services 0.7 1.2 1.0 1.2 0.2 0.2 0.8 Health 0.6 0.6 0.7 0.8 0.7 0.5 0.7 Housing Development 1.7 1.8 1.4 1.3 0.9 0.8 1.2 Water 0.8 0.7 1.3 1.4 1.1 0.9 1.0 Targeted Poverty Programmes 2/ 0.9 1.9 1.3 1.2 0.8 0.6 1.1 SIMAP and BNTF 0.3 1.0 0.6 0.5 0.3 0.3 0.5 GENERAL PUBLIC SERVICES 3/ 2.6 1.7 1.9 1.9 1.9 1.9 1.9 Institutional Strengthening 0.2 0.5 1.1 1.0 1.0 0.8 0.9 Transfers 1.5 0.4 0.0 0.0 0.0 0.0 0.1 Public Enterprises excluding Guysuco 4/ 0.5 0.7 0.9 1.0 1.0 1.0 0.9 Total Capital Spending 16.3 26.7 28.6 24.3 18.8 17.1 23.3 Investment Spending5/ 14.8 26.3 28.6 24.3 18.8 17.1 23.2 Source: State Planning Secretariat, Ministry of Finance and PCPMU. Office of the President 1/ Includes routine spending plus expenditure for Skeldon project 2/ Includes BNTF, SIMAP, Rural Support Project and Locally funded Poverty Programmes 5/ Total less Transfers 6/ Italicized items are to highlight key components and are not an exhaustive set of the sub-components
8

POVERTY REDUCTION STRATEGY – PROGRESS REPORT 2005
83
infrastructure development. Other infrastructure development that is not captured in the investment programme but for which the Government will seek private sector interest includes the Berbice Bridge, a deep port harbour and the Guyana-Brazil Road. Consistent with its objectives of providing access to basic services in health, education, water and housing, social sector investment will continue to take a substantial part of public sector resources.
Sea Defences
The first draft of a master plan for sea defence management is scheduled for completion in 2005. In addition, tendering for a socio-economic study and public awareness programme is scheduled to commence in 2005 and be completed by the first quarter of 2006. Some of the issues to be studied include:
• Management, finance and maintenance policies of the Sea Defence sector, public participation and socio-economic characteristics, their interconnections and presumptions for sustainable implementation
• The current status of the management and the level of public participation in the sector.
The Sea and River Defence Division will continue rehabilitation of sea defences and earth works in Regions 2, 3 and 5. The CDB-financed contract for the reconstruction of 1800m of riprap sea defences at Profit/Foulis, West Coast Berbice, is scheduled for completion in November 2005. A construction contract, funded by the European Development Fund, for the rehabilitation of 4 km of sea defences in Regions 2 and 3 will be awarded by the middle of 2005, and 20percent of the works are scheduled for completion in 2005. Funding has also been allocated for a pilot project for the re-establishment of mangroves along the coastline and for institutional strengthening of the Sea Defence Board. The GIS database and Hydraulic Model are scheduled for completion in 2005. Institutional Capacity Building activities in 2005 will emphasize the establishment of a Shore Zone Management system.
The Transport Sector
The Government is currently undertaking a transport sector study (TSS) to provide elements for decision-making in support of a coherent and consistent policy strategy towards the development of the transport sector over the next ten years to respond to the needs of the PRSP. The TSS will contribute to (i) identifying the requirements in the areas of policy, legislation, regulation, institutional arrangements, service provision and implementation for sustainable growth of the sector; (ii) carrying out comprehensive studies on specific sectors in order to focus on the most relevant problem areas; and (iii) developing a proposal for an indicative investment programme, based on the policy and studies, and consistent with the
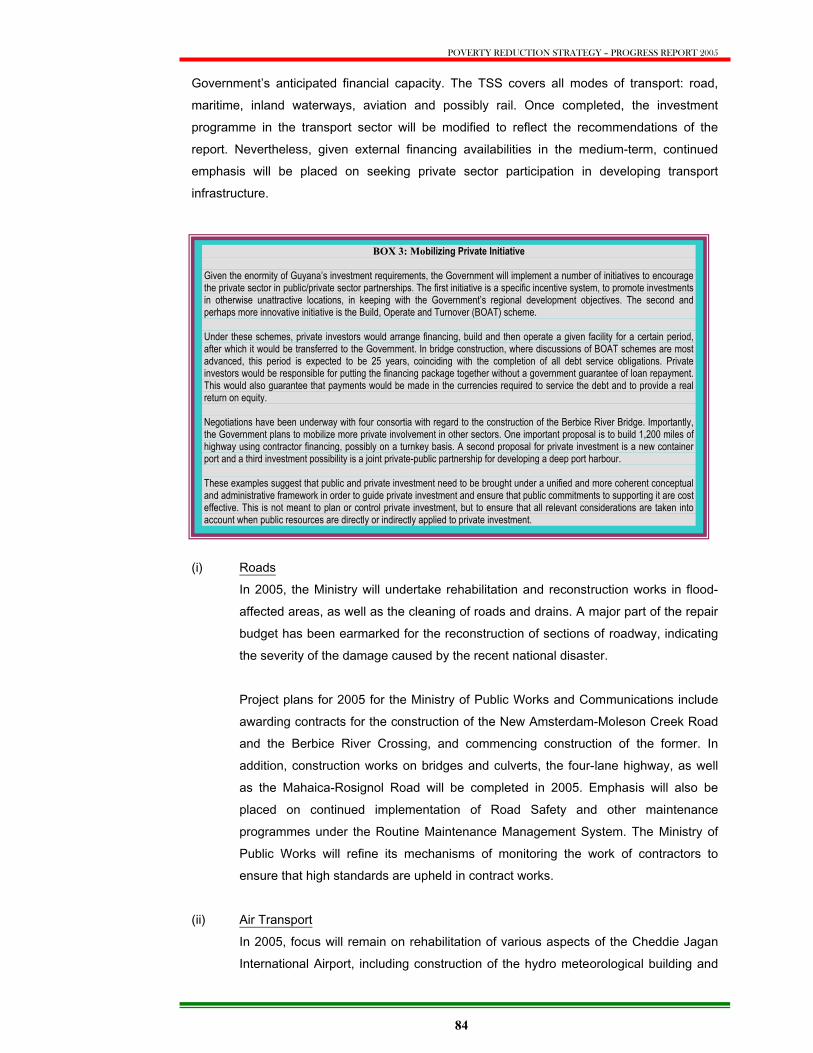
POVERTY REDUCTION STRATEGY – PROGRESS REPORT 2005
84
Government’s anticipated financial capacity. The TSS covers all modes of transport: road, maritime, inland waterways, aviation and possibly rail. Once completed, the investment programme in the transport sector will be modified to reflect the recommendations of the report. Nevertheless, given external financing availabilities in the medium-term, continued emphasis will be placed on seeking private sector participation in developing transport infrastructure. (i) Roads
In 2005, the Ministry will undertake rehabilitation and reconstruction works in flood-affected areas, as well as the cleaning of roads and drains. A major part of the repair budget has been earmarked for the reconstruction of sections of roadway, indicating the severity of the damage caused by the recent national disaster. Project plans for 2005 for the Ministry of Public Works and Communications include awarding contracts for the construction of the New Amsterdam-Moleson Creek Road and the Berbice River Crossing, and commencing construction of the former. In addition, construction works on bridges and culverts, the four-lane highway, as well as the Mahaica-Rosignol Road will be completed in 2005. Emphasis will also be placed on continued implementation of Road Safety and other maintenance programmes under the Routine Maintenance Management System. The Ministry of Public Works will refine its mechanisms of monitoring the work of contractors to ensure that high standards are upheld in contract works.
(ii) Air Transport In 2005, focus will remain on rehabilitation of various aspects of the Cheddie Jagan International Airport, including construction of the hydro meteorological building and
BOX 3: Mobilizing Private Initiative Given the enormity of Guyana’s investment requirements, the Government will implement a number of initiatives to encourage the private sector in public/private sector partnerships. The first initiative is a specific incentive system, to promote investments in otherwise unattractive locations, in keeping with the Government’s regional development objectives. The second and perhaps more innovative initiative is the Build, Operate and Turnover (BOAT) scheme. Under these schemes, private investors would arrange financing, build and then operate a given facility for a certain period, after which it would be transferred to the Government. In bridge construction, where discussions of BOAT schemes are most advanced, this period is expected to be 25 years, coinciding with the completion of all debt service obligations. Private investors would be responsible for putting the financing package together without a government guarantee of loan repayment. This would also guarantee that payments would be made in the currencies required to service the debt and to provide a real return on equity. Negotiations have been underway with four consortia with regard to the construction of the Berbice River Bridge. Importantly, the Government plans to mobilize more private involvement in other sectors. One important proposal is to build 1,200 miles of highway using contractor financing, possibly on a turnkey basis. A second proposal for private investment is a new container port and a third investment possibility is a joint private-public partnership for developing a deep port harbour. These examples suggest that public and private investment need to be brought under a unified and more coherent conceptual and administrative framework in order to guide private investment and ensure that public commitments to supporting it are cost effective. This is not meant to plan or control private investment, but to ensure that all relevant considerations are taken into account when public resources are directly or indirectly applied to private investment.
POVERTY REDUCTION STRATEGY – PROGRESS REPORT 2005
85
the installation of security lighting. In addition, work on the Port Kaituma and Orinduik aerodromes will come to a close in 2005.
(iii) River Transport
In the medium-term, the Government will take measures to improve river transportation. This will include continuous maintenance of existing fleet of boats, improving regularity and punctuality of ferry services, upgrading ferry facilities and improving monitoring of ferry operations and stelling facilities.
Plans over the next year for the Demerara Harbour Bridge Corporation include continued maintenance of the entire structure and completion of the Administrative and Audit building. Taking into consideration the age of vessels and the need to provide an efficient and reliable service, the Transport and Harbours Department will increase its efforts towards acquiring new ferries as well as improving management and the operations of terminals.
Unserved Areas Electrification Programme (UAEP)
In spite of the challenge of inadequate manpower to undertake infrastructural works necessary for the construction of distribution networks, the Guyana Power and Light Company (GPL) plans to install 6000 connections in unserved areas in 2005. GPL will also conduct training to build the skills and capacity of staff. Further, consistent with the goal of reducing losses by 5 percent, GPL will undertake loss reduction investment projects based on the outcome of assessments to be carried out in 2005. Other priorities include two demonstration projects under the Hinterland electrification strategy, a plan to develop strategies for demand management/energy efficiency by GPL consumers, and the implementation of such a plan. An Electrical Inspector with international experience will be engaged as part of the plan to restructure the Electrical Inspector’s Department.
Drainage and Irrigation
Coming out of the flooding disaster, an Infrastructure Recovery Task Force comprising experienced and seasoned engineers was established to oversee the speedy recovery of the drainage and irrigation sector. With donor assistance, the task force is implementing several emergency projects with a view of mitigating the effects of the May/June rains on the drainage system. Short-term civil works include the rehabilitation of canals to the Demerara River and to the Atlantic Ocean, excavation of the Shanks Canal, desilting of canals and the rehabilitation of outlet structures. In the medium term, emphasis will be placed on construction of a road at Flagstaff between the public road and conservancy dam; excavation of cross canals within the East Demerara Conservancy to increase storage and to channel water to the designated outlet structures;

POVERTY REDUCTION STRATEGY – PROGRESS REPORT 2005
86
repairs to the conservancy dam embankment; the hydraulic and hydrologic modelling of the East Demerara Water conservancy system, sluice gates, water pumps and discharge canals; and the repair of critical outlet structures (kokers) in the seawall. In the long term, it is anticipated that related projects will prioritise the implementation of the Mahaica-Mahaicony-Abary water conservancy system and relevant embankments, discharge channels and control structures. In addition to recovery work, construction, repairs and maintenance of D&I structures will continue, so as to provide critical support to the production of rice and other non-traditional agricultural crops such as vegetables and fruits. Works will be done on specific canals, drains, sluices and bridges across the country, five mobile drainage pumps will be purchased and those at Dawa, Cozier and Nabacalis rehabilitated. Specifically, the following projects are planned for 2005:
>Construction of irrigation check at Lima and Sparta >Construction of tail wall at Aurora >Construction of box culvert at Cullen R
EGIO
N
2
>Replacement of drainage pump and related civil works at Cozier
>Construction of culverts at Northern and Western Hogg Island >Construction of an earthen dam at Palmyra Wakenaam >Rehabilitation of a sluice and excavation of outfall at Vetrowen, Leguan R
EGIO
N
3
>Rehabilitation of the sluice at Uniform Leguan
>Rehabilitation of drains in Caledonia/Good Success
>Construction of greenheart revetment at Golden Grove
>Rehabilitation of sluice at Supply, Mahaica
>Rehabilitation works on the East Demerara Water Conservancy >Rehabilitation of Sluices and Channels at Beehive, BV/ Triumph, Hope, Belfield and Buxton >Rehabilitation of Inlet and Outlet Channels at Hope, Belfield, EC.B >The drainage canal at Kofi
REG
ION
4
>Maintenance, monitoring and security of the East Demerara conservancy embankment
>Construction of greenheart revetment at Esau and Jacob
>Construction of embankment between Maniel Canal and Grass Hook
>Rehabilitation of Cottage/Industry and Esau/Jacob canals REG
ION
5
>Rehabilitation of Barh/Industry canal
>Rehabilitation of west drainage canal and grading dams at Whim, Corentyne
REG
ION
6
>Excavation of outfalls at Joppa, Eversham and Adventure
REG
ION
10
>Rehabilitation of drains, canals and structures and purchase of excavator.

POVERTY REDUCTION STRATEGY – PROGRESS REPORT 2005
87
Telecommunications
Although GT&T did not sustain significant or long-lasting damage as a result of the flooding, the company will attempt to reduce vulnerability to future events by developing a more formalized emergency response strategy. In line with this:
• containment walls will be built around Telephone House and some other critical exchanges, allowing for faster and easier flood-proofing;
• sump pumps will be used for de-watering where possible; • sandbagging will also be used to close entrance gate areas; • transformers will be raised above ground level, to give an extra degree of protection
against flooding.
The Environment
In 2005, the EPA will work towards completing the National Bio-safety Framework, and the preparation of a policy on Genetically Modified Organisms and on International Property Rights for Guyana. The EPA will collaborate in the preparation of legislation for wildlife and develop a monitoring system for wildlife populations. Local and international links on Protected Areas Management will be extended and a legal and regulatory framework for Protected Areas defined. EPA will support the creation of a Community Conservation Area in Konashen, South Guyana, and, with IDB assistance, carries out assessments for priority sectors in 2005. Other planned activities include:
Investigating the environmental effects of the flooding, develop guidelines and produce assessment reports;
Conduct public awareness of Environmental Protection Regulations, 2000; Implement public education programme on bio-safety in collaboration with
NRM by 2006; Produce a Sate of the Environment Report for 2004 in 2005.
Medium Term Social Sector Programme
The Government will continue to increase social sector spending in order to expand access to basic services. Table 8.2 provides a summary of social sector projected expenditure for the medium term. Total social sector spending is projected to rise from 20 percent in 2004 to 22.9 percent in 2009. Recurrent spending particularly in maintenance, materials and supplies, drugs and textbooks among others are projected rise modestly while capital spending especially in education and health is anticipated to decline on account of the completeion of key projects. The rehabilitation of hospitals in Linden, Bartica and Mabaruma is projected to increase capital spending slightly in the medium term. Other capital spending includes construction of infrastructural facilities in housing schemes. Increased social sector spending in the medium term will help to improve access to basic services, delivery in the quality of care and reduction in poverty and also improve Guyana’s chances in meeting the MDGs.

POVERTY REDUCTION STRATEGY – PROGRESS REPORT 2005
88
Education
In the medium term, the Ministry of Education will continue to implement its strategic plan with special emphasis on (i) improving the quality of the delivery of education, especially in the areas of literacy and numeracy; (ii) improving equity in the education sector by giving special attention to previously unreached students, those without access to quality secondary education and those in remote hinterland and riverain areas; (iii) increasing the level of commitment of students, parents and communities to the education process and to human rights; (iv) improving the human resources of the system; (v) improving the ministry’s
7 The social spending profile in Tables 8.1 and 8.2 differ slightly since 8.2 include a broader range of poverty programmes.
TABLE 8.2 : GUYANA MEDIUM TERM SOCIAL SECTOR SPENDING7
(Percent of GDP) 2004 2005 2006 2007 2008 2009
unless otherwise indicated
Current 11.5 11.6 12.1 12.4 12.5 12.8
Personnel emoluments 5.8 6.0 6 6.1 6.1 6.1
Education 4.2 4.3 4.3 4.4 4.4 4.4
Health 1.6 1.7 1.7 1.7 1.7 1.7
Other 5.7 5.6 6.1 6.3 6.4 6.7
Education 2.7 2.7 2.8 2.8 2.9 3
Health 2.1 2 2.2 2.3 2.3 2.4
Poverty Alleviation 1/ 0.9 0.9 1.1 1.2 1.2 1.3
Capital 5.6 7.3 7.5 7.9 8.0 7.8
Education 1.3 1.5 1.3 1.2 1.0 0.9
Health 0.6 0.6 0.7 0.8 0.7 0.5
Poverty Alleviation 1/ 3.7 5.3 5.5 5.9 6.3 6.4
Housing and Water 3.1 3.0 3.3 3.2 2.6 2.3
Current 0.7 0.6 0.6 0.6 0.6 0.6
Personnel emoluments 0 0 0 0 0 0
Other 0.7 0.6 0.6 0.6 0.6 0.6
Capital 2.1 2.4 2.7 2.6 2.0 1.7
Public Service Reform 2/ 0.1 0 0 0 0 0
Total Social Spending 20.0 22.0 22.9 23.6 23.1 22.9
EHIPC CP Social Spending 3/ 17.1 18.9 19.6 20.3 20.5 20.6
Total Current Spending 12.3 12.2 12.7 13.0 13.1 13.4
Total Capital Spending 7.7 9.8 10.2 10.6 10.0 9.5
Personnel emoluments/SS 29.0 27.3 26.2 25.9 26.4 26.7
Education 21.0 19.6 18.8 18.7 19.1 19.2
Health 8.0 7.7 7.4 7.2 7.4 7.4
Nominal GDP at market prices in billions of Guyana Dollars
154.6 157.4 166.2 177.1 188.2 200.6
Sources: Guyanese Authorities, IMF Publication (EBS/05/5)
1/ Includes SIMAP, BNTF, IFAD Rural Support Project and other poverty related programs 2/ Includes severance payments for civil service reform as well as safety net programs for Linmine workers in 2003. 3/ This is the definition used in the context of the Enhanced HIPC Completion Point. It excludes housing and water and public sector reform
POVERTY REDUCTION STRATEGY – PROGRESS REPORT 2005
89
managerial capabilities to make it more effective and accountable; and (vi) reducing student and teacher absenteeism.
(i) Improving the Quality and Delivery
(a) Teacher Training Special training programmes were developed to orient teachers in Early Childhood Education (ECE) to changes in curriculum. This training catered for over 90 percent of teachers at this level for the period 2003-2007. By end 2004, about 58 teachers or 61 percent were trained and during the period 2005-2007, the remaining will be trained. With respect to School Improvements Plans (SIPs), 50 percent of schools will meet the defined standards in 2005 and this will increase to 80 percent by 2007. The Ministry will also continue to promote the importance of the ECE especially in economically depressed areas. The Ministry intends to increase media coverage of this programme in all the challenged communities. In addition, training programs for parents and parents-to-be will continue using the parenting manual developed in 2003. The objective is to expand this programme to cover all nursery schools by 2007. In spite of these training exercises that will be undertaken, the focus will continue to be training teachers to fill vacant positions in secondary and primary schools. The high student to teacher ratios at the primary and secondary school levels are unacceptable. While teachers could not be restrained from migrating, the government will reconsider and implement non-pecuniary and other incentives that may attract and retain teachers. In particular, special incentives will be granted to teachers that will take assignments in hinterland regions. At the same time, the Government will consider the review of policy on retirement age for teachers and explore the possibility of re-contracting retired teachers as a short-term measure. Further, school administrations will be strengthened to reduce teacher absenteeism and punctuality.
(b) Improving levels of Literacy and Numeracy The new methodology to teach literacy based on a survey of good practices in Guyana and abroad will be expanded. This will allow increased improvement in the numbers of students meeting the defined standards, from among those entering primary schools from 2003. Trained teachers from the CPCE will deliver the new curriculum by 2007. In addition, the Ministry will continue to monitor improvements in mathematics and the sciences for students in Grades 1 to 3. In addition, 90 cluster advisors will be trained to support teachers through monthly cluster meetings and visits to schools in 2005. Teachers and head teachers will be trained to implement the literacy programmes. To this end, in the next two years, 250 teachers will be trained. Also, teacher training in hinterland and riverain areas by distance education

POVERTY REDUCTION STRATEGY – PROGRESS REPORT 2005
90
will increase and intensify with the proportion of trained teachers reaching 50 percent of the total teacher population in these areas. Towards revising the curricula for nursery, primary and secondary nursing, a permanent commission will be established in 2005 to advise the Minister of Education on evaluation, revision, and updating of the curriculum. The commission’s work will continue until 2007. In 2005, at least three regions will begin to work on aspects of localisation of the curriculum while about 75 percent of schools with SIPs will implement revised curricula in 2007. At the tertiary level, the curricula of the technical and vocational schools will be overhauled in 2005 and 2006 to reflect new subjects, revise subject areas, evaluate reports from employers and graduates and determine the rate at which graduates are employed.
(ii) Improving Equity in the Education Sector
The Government will continue its drive to improve equity in the education sector by giving special attention to previously unreached students, those without access to quality secondary education and those in remote hinterland and riverain areas. To this end, the Government will continue with the construction and rehabilitation of dormitory facilities and teachers’ quarters in hinterland and riverain areas. Specifically, 40 percent of all hinterland schools will be brought up to the national standard, 600 beds will become available and 20 new teacher flats and/or houses will be constructed in 2006. The Escuela Nueva (EN) programme will be expanded in Regions 1 and 9 and extended to Regions 7 and 8 to accommodate 10 schools in 2005 and 20 schools in 2007. Access to secondary education will continue to be improved and the curriculum redefined to pave the way towards Universal Secondary Education (USE). Through the BEAMS and GBET projects, over 5 secondary schools will be rehabilitated in2005 and 3 new schools will be constructed. These projects will also assist in reducing over crowding. Emphasis will also be placed on mainstreaming students with special needs. With the completion of the national study to establish a database of students with disabilities, the focus in 2005 will be to update data on disabilities throughout the 10 administrative regions of Guyana.
(iii) Increasing the Level of Commitment of Students, Parents and Communities
A key medium-term objective for the education sector is increasing the commitment of stakeholders in the education process. To this end, the Ministry of Education will continue to strengthen its existing policy of promoting the participation of stakeholders through training of PTAs and School Improvement Action Committees
POVERTY REDUCTION STRATEGY – PROGRESS REPORT 2005
91
(SIAC). In the same vein, the MOE will take continued steps to increase levels of respect, tolerance and diversity in schools. A special programme derived from the UNICEF Management of Social and Sensitive Issues Programme is being implemented to prepare teachers to be more effective facilitators for tolerance and diversity. Forty percent of teachers will be trained in 2005. This measure is intended to reduce student absenteeism.
(iv) Strengthening The Ministry of Education
The Government in the medium-term will continue its drive to increase the capacity of the Ministry of Education to implement education reforms. To this end, a new Education Bill that will modernize the 50-year old Education Act by establishing modern standards of education, including the regionalization and privatization of schools, will be tabled in Parliament in 2005. The Planning Unit of the Ministry will be strengthened with the recruitment of additional statisticians and IT experts. In addition, equipment for management and administrative purposes will be provided to central and regional departments. Further, regional officers will be trained in order to improve the decentralization of the management system. Over 75 percent of officers will be trained by 2007.
Health
In the health sector, the emphasis in the medium-term will be the provision of basic health services to the population by improving management, logistics and programme effectiveness, and beginning a programme of regional decentralization. In this context, the Ministry will continue to implement its National Health Strategy to attain its poverty reduction indicators and relevant MDGs. The highlight of the medium term program will be the achievement of the following benchmarks:
• Increase in immunization rate for measles from 91 percent in 2002 to 96 percent in 2007;
• Increase in immunization rate for DPT from 93 percent in 2002 to 96 percent in 2007; • Increase in the number of hospitals able to provide emergency obstetric care to 5 in
2007; • Increase in the percentage of HIV+-pregnant women receiving counseling and
preventative treatment from 86.2 percent in 2004 to 90 percent in 2005; • Increase in the number of bed nets for malaria prevention purchased and/or
distributed. The Ministry will distribute copies of the National Health Plan (NHP) 2003-2007 to all stakeholders to ensure familiarity with the NHP. An in-house Oversight Committee and a complete implementation plan for the strategy will also be developed.
POVERTY REDUCTION STRATEGY – PROGRESS REPORT 2005
92
(i) Training
Training programmes in Oncology and Internal Medicine will begin in 2005 with funding from the Governments of Guyana and Israel. Similar programmes will be developed for Radiology and Obstetrics and Gynecology. The Nursing School will recruit 500 persons for nurses’ training in 2005, 50 medexes will be trained and the class size for Community Health Workers increased. Still, nurses to patient and doctor to patient ratios are high and underlies the poor quality of care that may exist especially outside Georgetown and New Amsterdam. To this end, the government will consider other measures of accelerating training of nurses, doctors and other medical officials with the view of improving quality of service. To stem the migration of trained medical professionals, non-pecuniary and other incentives will be considered for key and critical staff.
(ii) Infrastructure and Technological Capacity
Agreements have been reached with IDB, and two firms have been short-listed to bid for the architectural design of a new hospital at Linden and an in-patient building at GPHC. The MOH will proceed to engage a construction firm to start construction by 2005. The Ministry of Local Government has also begun the tendering for a contractor to build the new Lethem Hospital in 2005.A blood bank and TB Clinic will be added to the NA Hospital and works will be completed on the extension of the Georgetown Blood Bank, the Public Health Laboratory and the new GUM clinic. In addition to this, X-ray facilities and laboratories will be installed at all regional hospitals and in some community hospitals. These facilities will provide increased access and reduce overcrowding at health centers and further reduce the influx of several patients to the Georgetown Public Hospital.
(iii) Accelerating Health Sector Reforms
The restructuring of the Ministry of Health will move forward with the addition of an Adolescent and Young Adult Health and Wellness Programme, a Guyana Center for Disease Control (to replace the present Communicable Disease Department), and restructuring of the Regional Health Services Department to provide more effective support to the health sector in the regions. The Health Sector Development Unit will be expanded and Regional Health Authority for Regions 6 and 10, and service agreements with the GPHC will be formalized.
(iv) Legal Framework
In 2005, the Ministry will work towards: • Enacting the new Health Promotion and Protection Act to replace the 1934 Public
Health Ordinance

POVERTY REDUCTION STRATEGY – PROGRESS REPORT 2005
93
• Enacting the new Health Facilities Bill, Paramedical Health Professional Bill, the Ministry of Health Bill and the Regional Health Authority Bill
• Revising the Food and Drug Act • Introducing legislation for HIV/AIDS in accordance with the revised HIV/AIDS
Policy Document.
(v) Regulatory and Quality Assurance System The Quality Assurance system will be formalized with the drafting of regulations for doctors, pharmacists, nurses and paramedical personnel. The Hospital Inspectorate will be enhanced to cover all public health institutions, and to formalize and enforce the minimum standards and licensing requirements for all hospitals. A sector-wide proficiency testing system for public and private laboratories will be implemented and the laboratories in all regional hospitals will be required to be certified by the Bureau of Standards.
(vi) Health Promotion and Primary Health Care
In the medium term, the MOH will introduce a basic package of publicly-guaranteed health care services, and a basic package for laboratory services at all five levels of the health sector. Importantly, primary health care facilities will be rationalized with plans developed for all the administrative regions. A Tobacco Surveillance Survey Study will be completed and will facilitate the development of a National Tobacco Control Plan. Finally, steps will be taken to implement the National Nutrition Plan, and the Medical Termination of Pregnancy Act will be further implemented with the establishment of a new advisory committee.
(vii) Maternal and Child Health
In 2005, a number of measures will be put in place to reduce maternal and neonatal mortality. In addition to the introduction of new programmes at the GPHC and NA Hospitals, a national coordinating committee will be put in place to guide the development of the Integrated Management of Childhood Illnesses (IMCI) Programme. IMCI will be expanded from Regions 2 and 9 to Regions 1,3,5,6 and 8 with sensitization and training being conducted throughout 2005 in these regions. In addition, a community IMCI programme will be introduced in three Regions and a community IMCI course will be conducted in Region 4. With regard to the Prevention of Mother to Child Transmission of HIV/AIDS (PMTCT), training programmes will be conducted in all regions and PMTCT will be available at 62 sites in all ten regions. The rotavirus surveillance programme will also be expanded in preparation for the introduction of the new rotavirus vaccine in 2006. A major cause of maternal and infant mortality especially in hinterland and riverain areas is the difficult access to medical facilities. Mountain motorbikes and speedboats will be procured to provide
POVERTY REDUCTION STRATEGY – PROGRESS REPORT 2005
94
emergency transportation for expecting women and the sick to the nearest health facilities.
(viii) Disease Control
(a) HIV/AIDS Efforts towards curtailing the spread and impact of HIV/AIDS will be enhanced through the following initiatives:
• Expansion of the PMTCT programme to a minimum of 60 sites in all ten regions
• Establishment of treatment and care programmes in at least one site in each region
• Provision of treatment for co-infection with HIV and TB for all co-infected patients
• Availability of CD4 counting to all HIV+ persons • Introduction of DOTS and home-based care for HIV+ persons • Finalization of the Behavioral Communications Change strategy and the
expansion of the ME TO YOU Personal Responsibility campaign • Establishment of a Prison and Disciplinary Services HIV/AIDS Programme • Strengthening the Safe Injection policy through the introduction of new
injection technology
(b) TB and Malaria The MOH will formalize Strategic Plans for dealing with TB and malaria. With regard to TB specifically, the DOTS programme will be expanded, the TB Laboratory strengthened, and treatment manuals disseminated. The fight against malaria will continue with the expansion of ITN in Regions 1,7,8 and 9, the completion of an IT and surveillance system, and the introduction of a new insecticide-spraying programme.
( c) Other Diseases
In 2005, the MOH will: • Appoint a National Diabetes and Hypertension Manager, and complete the
National Diabetes and Hypertension Strategic Plans • Establish a Cardiac Diagnostic Center at the GPHC • Operationalize the Cancer Center with the introduction of radiotherapy and
chemotherapy • Develop a National Mental Health Strategic Plan.
POVERTY REDUCTION STRATEGY – PROGRESS REPORT 2005
95
(ix) Dental and Eye Care Services
Outreach programmes will be initiated to provide optometric and dental care to unserved and underserved areas. Efforts will be made to provide training and increase the number of dentists serving the public sector from 19 to 25, and to improve the dental services provided at health centers. Services to treat cataracts at the NA Hospital and GPHC will be enhanced, and outreach services provided to Regions 2,3,5,7,8,9 and10. The MOH aims to introduce screening programmes in at least 40 schools in Regions 2,3,4,5,6 and 10. Schoolchildren in Regions 1,7,8 and 9 will be covered through existing programmes at hospitals. The Ministry will continue to screen the vision of the elderly in all ten regions and provide free spectacles to a minimum of 3,000 elderly persons.
(x) Health Information System
In 2005, a new health information system will be developed with the computerization of the Ministry of Health and the GPHC Health Information Departments. The Commodity Distribution and Planning System at the MMU will be strengthened and extended to GPHC, New Amsterdam and Linden. The Malaria Information System will be bolstered with computerizing of the Region 1 Malaria Programme Office, and computerization of the GUM and Chest Clinic data offices will also be complete.
Sanitation The extent and impact of the flooding along the coastline in January 2005 underscored the importance of maintaining sound environmental conditions, including the elimination of littering, dumping of garbage in drainage canals and the establishment of dumpsites to dispose of garbage. In the medium term, the government will consider (i) establishing garbage dumps sites in towns; (ii) in collaboration with local government bodies, contracting garbage collection services to the private sector; (iii) creating public awareness and encouraging recycling programmes, and (iv) enforcing anti-littering laws with penalties.
Water
Following the flooding, GWI has sought in the medium term, to bring forward an IDB-funded project to improve the Georgetown water and sewerage infrastructure, and to reduce the risk of exposure to waterborne disease. In addition, a number of modifications will be made to wellhead infrastructure so as to render these less vulnerable to flooding. These works will include raising wellheads and critical electrical equipment, and the construction of bunds around affected wells. In addition to this, the LBI metering project and the Georgetown Programme II are expected to be completed in 2005, and will provide 33,000 customers with improved levels of service and water quality, and 46,992 new connections. By the end of 2005, GWI will have worked

POVERTY REDUCTION STRATEGY – PROGRESS REPORT 2005
96
towards the provision of continued services to customers for at least 16 hours per day, the reduction of water leakage to 39.4%, the provision of water supply to 52.1% of the hinterland communities and initiation of service to over 10,000 new customers. More emphasis will also be placed on system improvements and leakage control. It is the intention that where meters are installed, the service pipe will also be replaced in accordance with the new standard, and this is expected to have a significant impact on leakage. Following the approval of the Hinterland Strategy in 2004, GWI will continue to pursue a five year investment programme for the Hinterland to offset the costs and complicated logistics of working in remote areas over an extended period. GWI will identify suitable partners to develop an integrated and participatory approach to water supply, hygiene and sanitation in the Hinterland. Systems, procedures and practices will be developed and established in collaboration with partners to support an integrated and participatory approach to service provision and maintenance in the Hinterland, including the use of local labour to the extent possible. Some preparatory work has been done with BNTF and final approval is pending for investment in two of the small towns. Potential for BNTF to invest in the smaller settlements has been discussed and will be pursued. An Environmental Management Plan to consolidate the mitigating measures, studies and monitoring of activities to ensure the environmental soundness of the programme, was approved by the GWI Board in February 2005. The main areas of concern will be:
• Sewerage and sewage treatment in Georgetown • Proliferation of and pollution from septic tanks • Pollution and nuisance from pit latrines • Sustainability and quality of the A and B sands • Use of the Conservancy water during the El Nino years • Risk of watercourse pollution from the mining industry
The long-term objectives of GWI’s programme are to ensure that GWI meets the License targets:
• To provide 90% of the coastal population with safe water, whether through a connection to the network, standpipes, licensed boreholes or other means by the end of 2007
• Non-revenue water should be reduced to 25% of total water provided, in relation to those networks serving the coastal population by the end of 2007
• Georgetown and the coastal strip are to be provided with a 24/7 service by the end of 2006
• Sewage pump station downtime in Georgetown should be reduced to below 2% by the end of 2007
POVERTY REDUCTION STRATEGY – PROGRESS REPORT 2005
97
• Revenue meter coverage should be at least 85% by the end of 2007 • Provision of safe water to 80% of settlements in the Hinterland.
Housing
In 2005, the Ministry of Housing and Water will bring under the regularisation process all one hundred and sixty five squatting areas that were prioritised for development, and establish functional Community Development Committees in most by 2006. Other targets for 2005 include processing 8,000–10,000 Titles/Transports, allocating 4,000 house lots, facilitating the construction of 500 low-income houses, and accelerating the construction of houses in the housing schemes. The Ministry will continue its collaboration with the IDB on the Low Income Settlement Programme. In 2005, this project will facilitate infrastructure development for 9,000 house lots in 12 different low-income housing schemes throughout the country. With funding from the EU, the Ministry aims to service an additional 4,500 house lots in 6 schemes over the next 4 years. In addition to these projects, the CHPA is continuously undertaking infrastructure development for house lots, with projects ongoing in housing schemes, including squatter areas, across the country. Social Safety Nets In 2005, the Difficult Circumstances Department of the Ministry of Human Services will continue to carry out the Government’s mandate by providing for the less fortunate. Cabinet has approved another $40 million for the school uniform assistance programme. Of this, $10 million will be allocated to the Ministry of Amerindian Affairs to complete distribution of uniforms in regions, which were not covered in 2004. The Human Services Ministry will provide assistance to some 20,000 children, and will help over 700 persons with wheel chairs, walkers, sewing machines, prosthetic limbs, spectacles and other items. The Ministry will also continue to assists with funeral expenses.
SIMAP
A priority for 2005 is to rapidly implement projects approved and contracted out. These projects will generate about 2000 jobs and will directly benefit 100,000 persons in 2005. The following projects are scheduled for 2005:
• In Region 2, the replacement of the Liberty Primary School, rehabilitation and extension of the Lilydale Primary School, execution of the Riverstown Sands Water Supply Project, and rehabilitation of farm to market roads at Sommerset Cross Canal/ Plantation Evergreen/New Road.
• In Region 3, 21 projects comprising 4 drainage projects, construction of one school, rehabilitation of 13 roads and construction of three multipurpose centers
POVERTY REDUCTION STRATEGY – PROGRESS REPORT 2005
98
• In Region 4, 22 projects including 2 schools, 2 water supply projects, 13 road projects, 2 multipurpose centers and the reconstruction of the male dormitory at President’s College
• In Region 5,13 projects including 6 road projects, 4 water projects, 1 school and 2 multipurpose centers
• In Region 6, 17 projects primarily focusing on road rehabilitation. • In Region 7, 8 projects including the construction of a multipurpose center at
Itabali, community centers at Kartabo and Tassarene, a nursery school at Kamarang, a nursery and primary school at Quebanang, Falls Top and Wax Creek/ Chinoweing.
In addition to the above, SIMAP will undertake several projects in Regions 1, 8, 9 and 10, the details of which can be found under special interventions programs. Hinterland Development Recognizing the roles and responsibilities of communities, training will be provided to improve local governance, administrative and management capacity of Amerindian leaders across Guyana. The target number is 90 communities involving a total of 392 village leaders and animators. The areas of training are Governance, Public Administration and Finance, Environmental Management, Project Management, Community Development and Decision Making. This will have positive implications for approaches in regional government and systems, community planning, community organizational and social structures and dynamics, CBOs, CDOs and NGOs and semi-autonomous agencies. The training will allow for greater competence and confidence among village animators and leaders, and service delivery will be enhanced.
The MoAA will take into consideration the need for refresher courses, seminars, workshops and training geared toward the further development of leadership skills, knowledge and attitudes. Updating of relevant training materials and newly developed materials will also be included in the MoAA’s outreach to villages.
From 2005, a Management Information System has been in place with appropriate database and data analysis for extracting and updating information that will be actively utilized by the MoAA.
Special Intervention Programmes
In 2005, the Ministry of Amerindian Affairs will continue to work towards the creation of improved standards of living in Amerindian communities. This will be reflected in the provision of a monthly subvention to the Bina Hill Institute, Region 9; the provision of school uniforms in Regions 2,3,4,5,6 and 10; and the construction of a dormitory in Georgetown to accommodate 200 hinterland scholarship awardees.
POVERTY REDUCTION STRATEGY – PROGRESS REPORT 2005
99
In addition, the Ministry plans to acquire boats and other equipment for Regions 1,2,6, 7 and 9, a tractor and trailer for Region 7; construct ten village offices in Regions 2,7,8, and 9; and pursue the titling of thirty-four Amerindian Communities in Regions 1,2,4,8,9 and 10. The process for the titling of some of these communities has already commenced and will continue through 2007.
Region 1: Barima -Waini
Economic and social development will be fostered through the construction of road networks from Matthews Ridge to Baramita, Citrus Grove to Port Kaituma and the Port Kaituma School Road. Additionally, rehabilitation works will be undertaken on the road from Tobago Hill to Wauna, Manicurie Junction to Arakaka and Falls to Manicurie Junction. A bridge will be constructed at Kumaka Junction. These infrastructure projects will assist in transporting agriculture produce and promote regional development. The Health sector will be boosted by the completion of the dental hut and laboratory at Matthews Ridge and the construction of health huts at St. Anselm, Canal Bank and Lower Kariabo. Capacity at the dental clinic at Kumaka will be boosted with the acquisition of a dental chair unit and an x-ray machine while the Matthew Ridge center will receive a partial portable set. In addition, an assessment will be made to determine the quantum of regional medical supplies and measures will be taken to ensure regular supplies of drugs in health facilities. Consideration will also be given to providing emergency all terrain transportation/equipment for communities that have difficulty accessing to health clinics due to the difficult terrain. Government will recruit and retain health personnel in the region, given the severe shortages of medical personnel nationwide In education, special provisions will be made to extend the dormitories at North West and Santa Rosa Secondary and construct teachers’ quarters at Kamawatta, Four Miles and Hotoquai. Further, the government will continue its programme of providing school uniforms, lunch vouchers, and transportation to needy children in an effort to increase school attendance. Incentives will also be provided to attract and retain teachers in primary and secondary schools. The Region will continue to benefit from national programmes such as SIMAP, BNTF and the Hinterland Water Strategy which aims to ensure the improved water and sanitation facilities are accessible to 80% of all settlements in the hinterland by 2007. These projects will, among other things, (i) develop new wells; (ii) provide potable water; and (iii) rehabilitate existing water systems.
POVERTY REDUCTION STRATEGY – PROGRESS REPORT 2005
100
Region 8: Potaro -Siparuni
The Government with the establishment of the Small Business and Investment Councils will promote the benefits of the Small Business Act and Investment Law that was passed in 2004. These pieces of legislation provide incentives to investors locating in hinterland regions such as Region 8 and augment economic development with potential of creating employment. In education, the government will continue to provide subsidies in the form of school uniforms and lunch vouchers and also explore the possibility of providing transportation to students is special circumstances. Incentives packages will also be implemented to enable the recruitment and retention of teachers for primary and secondary schools. Educational support will continue with the extension of the primary schools at Paramakatoi and Kopinang and the construction of teachers’ quarters at Kopinang and Tuseneng. SIMAP has earmarked Kaibarupai and Monkey Mountain for the construction of multipurpose centers and will rehabilitate the nursery/ primary school at Waipa. Health services will be enhanced with the extension of the health posts at Paramakatoi, Kopinang and Tumatumari. Additionally, the dental unit at the Madhia Hospital will receive a dental chair and unit and an x-ray machine, while the centers at Paramakatoi and Kato will receive partial sets. A fogging machine will be procured for use in the Mahdia Area to reduce incidents of malaria and other vector borne diseases. The incentives system for medical professionals will receive urgent attention with a view of improving the quality of care in the region and also reducing deaths by preventable diseases.
Region 9: Upper Takatu – Upper Essequibo
The medium term priorities in Region 9 include (i) accelerating the issuance of land titles; (ii) improving economic infrastructure to stimulate economic growth; (iii) improving access and quality of education, health services; and water. In accelerating the issuance of land titles, efforts will continue to have the Konashen Amerindian District given an absolute grant of land title. SIMAP will construct multipurpose centers at Yurong Peru and Cracrana. Infrastructure developments to increase economic activities include the construction of bridges, roads and the installation of culverts. As in Regions 1 and 8, the Government will implement an incentive package to attract and retain teachers, nurses and doctors that are so critical in improving the quality and delivery of these services. In education, special provisions will be made to upgrade teacher support services with the construction of living quarters in Aishalton, Sand Creek, Fair View, Shea, Tiger Pond and Nappi. Residents will benefit from the construction of a primary school at Yurong Peru and nursery schools at Parishara, Tiger Pond, and Surama. An auditorium will be constructed at St. Ignatius and the primary schools at Kwatamang and Hiowa will be extended. Further, needy children in the region will benefit from the school uniform, lunch and
POVERTY REDUCTION STRATEGY – PROGRESS REPORT 2005
101
transportation programs that will be implemented over the medium-term. Attention will also be given to the rehabilitation of the airstrip at Lethem in support of facilitating tourism and inter country travel. Health infrastructure for the region will include the construction of a Health Post at Surama. Lethem hospital will have a dental chair unit and an x-ray machine. The Karasabai and Aishalton health centers will each have a partial set. Further, drug and medical supplies storage will be reviewed with the objective of ensuring regular medical supplies in the region. In an effort to support the growth of the beef industry in the region, Foot and Mouth control buildings will be established at Mickie Crossing and Baitoon Crossing. New plant nurseries will be established at Karasabai and Annai. Electricity services will be extended to Tabatinga and St. Ignatius. The water supply network will also be enhanced with the installation of windmills, water tanks and trestles.
Region 10: Upper Demerara - Berbice
Agricultural production in new areas will be further facilitated by the rehabilitation of roads and drains at Amelia’s Ward, Ituni/ Kwakwani, Rainbow City and Wisroc. Efforts will continue in 2005 to improve the quality of health care in the region through the procurement of operating theatre lights, the extension of the health centre at One Mile Linden, and the upgrading of the health post to a health centre at Wisroc. Dental care will be enhanced with the installation of a dental unit at the Mackenzie Hospital and a chair at the Wismar Hospital and the One Mile and Kwakwani Health Centers. The quality of health care in Region 10 will be improved through the rehabilitation of the Linden Hospital and the upgrading of the hospital at Kwakwani. A malaria centre will be constructed. As part of the ongoing programme to meet the educational needs of the region, nursery schools will be constructed at Christiansburg, Wismar, Republic Avenue and Amelia’s Ward, and teachers’ quarters’ at Kwakwani and Ituni will be rehabilitated. SIMAP expects to construct multipurpose centers at Bamia, Block 22, Central Amelia’s Ward and Wiruni and extend the Center at Maria Elisabeth/Three Friends. As part of the ongoing programme to enable Amerindian communities to lead their own development, the legal status of seven Amerindian communities will be settled in accordance with the wishes of those communities. In recognition of the special needs of schools in the hinterland regions, there will be an increase in the remote area incentive for teachers in Region 10 and school-feeding programmes will be implemented in all hinterland schools.

POVERTY REDUCTION STRATEGY – PROGRESS REPORT 2005
102
Through the Low-Income Settlement programme, 1,534 house lots for squatter settlements will be distributed over the medium term. The rehabilitation of Linden Water Supply, as part of the overall water sector investment plan, will also be completed.
Linden Economic Advancement Programme (LEAP)
In 2005, LEAP’s priority activities will continue with on-lending to micro, small and medium enterprises to facilitate the start-up and expansion of businesses, and training for entrepreneurs in business planning, marketing and small business management. The Business Incubation Centre will be launched and the first group of tenants will benefit from its services. LEAP also aims to support the creation of large companies, medium-sized companies, and small and micro enterprises in the medium-term, to provide training programmes for retrenched workers and entrepreneurs, and to support youth entrepreneurship. LEAP will also provide support to regional institutions to improve their capacity to plan activities, devise strategies, implement them, and set objectives to ensure the economic development of Region 10. Systematic investment promotion activities to attract new investment to Region 10 will continue, and the LEAP Infrastructure Investment Incentives will be implemented to support these efforts. In order to maximise the impact of these activities, additional infrastructure rehabilitation works and feasibility studies, particularly with regard to wharf facilities, will be undertaken. The Business Development Unit will also continue to provide business advice services, planning and marketing assistance, training to micro, small and medium enterprises, and support for youth entrepreneurship will be expanded through the Youth Entrepreneur Network. Sports Facilities: The Cricket Stadium The contract was signed to build the stadium for the 2007 Cricket World Cup in 2005. Work will begin in 2005 and is scheduled to be completed by October 2006.

POVERTY REDUCTION STRATEGY – PROGRESS REPORT 2005
103
Chapter
MONITORING AND EVALUATION
Guyana continues to make progress in achieving its PRSP targets and reaching the millennium development goals although it also faces serious challenges in meeting some of its MDGs. Of a total 25 poverty reduction indicators identified in 2001 and of which projections were made, Guyana successfully met or exceeded 14 or 56 percent of its targets. In particular, Guyana far exceeded its targets of pro-poor spending registering sustained improvement between 2000 and 2004 although since 2002, the spending has declined marginally from the actual in 2001. Nevertheless, spending in 2004 represented an increase of 22 percent over the target set in 2000. Table 9.1 provides a comparison of the projected and actual indicators for the period 2000-2004.
TABLE 9.1: GUYANA -- PRSP INDICATORS, 2000-2004 2000 2001 2002 2003 2004
Population below the national poverty line 35.1 34.9 34 33.1 32.2
Actual
Total pro-poor spending (%GDP)/1 8 11.7 13.8 14.4 14.5 14.7
Actual 18.4 19.2 18.5 17.1 17.1
% primary school entrants reaching Grade 6 83.5 84 84.6 85.7 86.9
Actual 83.4 83.5 88.3 88.3 88.7
Repetition rate (secondary) 12.9 12.6 12.3 11.2 10.1
Actual 12.9 12.9 12.6 11.8 10.6
Student/trained teacher ratio (primary) 54:1 53:1 53:1 52:1 50:1
Actual 54:1 50:1 50:1 51.1 50:1
Student/trained teacher ratio (secondary) 37:1 36:1 35:1 34:1 33:1
Actual 37:1 38:1 38:1 39.1 40:1
Gross nursery school enrolment 87 87 88 90 91
Actual 87 87 88 91 92
Gross primary school enrolment 110 107 105 102 100
Actual 110 107 105 104 102
Gross secondary school enrolment 62 65 68 70 72
Actual 62 65 65 65 73
% trained teachers in secondary schools 55 56 57 60 62
Actual 57.5 58.5 58.5 57.1 54.2
% trained teachers in primary schools 49 49 52 55 58
Actual 50 53 54 56 59.4
Number of CXC passes 46.7 51.4 52.5 55.5 58
Actual 73.3 74.5 77.1 75.8 76.3
Infant mortality rate (per 10,000) 57 56 50 47 45
Actual 57 56 54 54 53
Maternal mortality rate (per 10,000) 188 187 170 150 145
Actual 188 187 126 124 122
1 year olds immunized against measles 88.9 90.2 93.3 95.5 97.1
Actual 88.9 90.4 93.5 95.8 97.5
1 year olds immunized against DPT 85.6 88.2 90.2 90.8 91.3
9
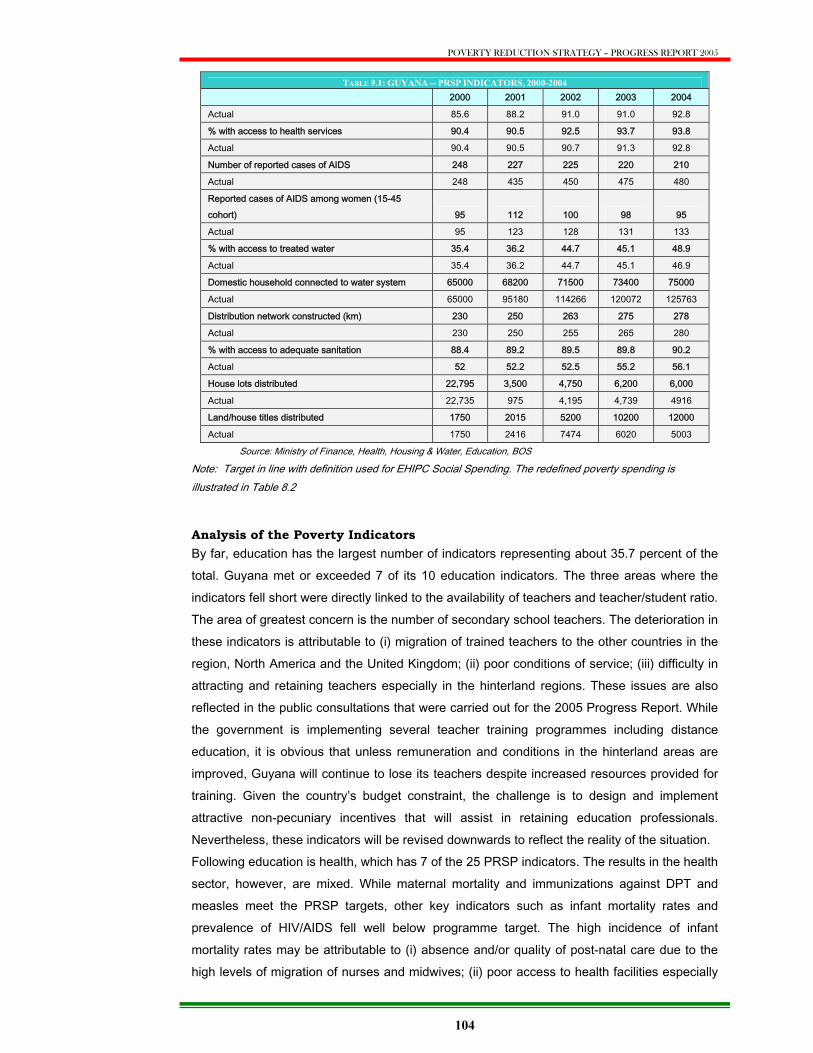
POVERTY REDUCTION STRATEGY – PROGRESS REPORT 2005
104
TABLE 9.1: GUYANA -- PRSP INDICATORS, 2000-2004 2000 2001 2002 2003 2004
Actual 85.6 88.2 91.0 91.0 92.8
% with access to health services 90.4 90.5 92.5 93.7 93.8
Actual 90.4 90.5 90.7 91.3 92.8
Number of reported cases of AIDS 248 227 225 220 210
Actual 248 435 450 475 480
Reported cases of AIDS among women (15-45 cohort) 95 112 100 98 95
Actual 95 123 128 131 133
% with access to treated water 35.4 36.2 44.7 45.1 48.9
Actual 35.4 36.2 44.7 45.1 46.9
Domestic household connected to water system 65000 68200 71500 73400 75000
Actual 65000 95180 114266 120072 125763
Distribution network constructed (km) 230 250 263 275 278
Actual 230 250 255 265 280
% with access to adequate sanitation 88.4 89.2 89.5 89.8 90.2
Actual 52 52.2 52.5 55.2 56.1
House lots distributed 22,795 3,500 4,750 6,200 6,000
Actual 22,735 975 4,195 4,739 4916
Land/house titles distributed 1750 2015 5200 10200 12000
Actual 1750 2416 7474 6020 5003
Source: Ministry of Finance, Health, Housing & Water, Education, BOS Note: Target in line with definition used for EHIPC Social Spending. The redefined poverty spending is illustrated in Table 8.2
Analysis of the Poverty Indicators By far, education has the largest number of indicators representing about 35.7 percent of the total. Guyana met or exceeded 7 of its 10 education indicators. The three areas where the indicators fell short were directly linked to the availability of teachers and teacher/student ratio. The area of greatest concern is the number of secondary school teachers. The deterioration in these indicators is attributable to (i) migration of trained teachers to the other countries in the region, North America and the United Kingdom; (ii) poor conditions of service; (iii) difficulty in attracting and retaining teachers especially in the hinterland regions. These issues are also reflected in the public consultations that were carried out for the 2005 Progress Report. While the government is implementing several teacher training programmes including distance education, it is obvious that unless remuneration and conditions in the hinterland areas are improved, Guyana will continue to lose its teachers despite increased resources provided for training. Given the country’s budget constraint, the challenge is to design and implement attractive non-pecuniary incentives that will assist in retaining education professionals. Nevertheless, these indicators will be revised downwards to reflect the reality of the situation. Following education is health, which has 7 of the 25 PRSP indicators. The results in the health sector, however, are mixed. While maternal mortality and immunizations against DPT and measles meet the PRSP targets, other key indicators such as infant mortality rates and prevalence of HIV/AIDS fell well below programme target. The high incidence of infant mortality rates may be attributable to (i) absence and/or quality of post-natal care due to the high levels of migration of nurses and midwives; (ii) poor access to health facilities especially
POVERTY REDUCTION STRATEGY – PROGRESS REPORT 2005
105
in hinterland communities; and (iii) difficulties in the delivery and storage of drugs and medical supplies in difficult to reach areas. On the issue of HIV/AIDS, the high levels consistently registered may be the result of poor quality baseline data in setting the programme targets for both the general number of reported AIDS cases and the reported cases among women in the 15-45 age cohort. Even so, measures are being taken to deal with the lapses in achieving the PRSP targets. In the case of reducing infant mortality rates and improving access to health care, the completion of the regional hospital in Berbice may help to provide improved access and quality of care to residents in Regions 5 and 6. This may also help to reduce infant mortality rates in these regions. With increased participation of several donor agencies and the NGOs in combating HIV, it is anticipated that the prevalence and incidence rates of HIV/AIDS will begin to decline. Yet, it is obvious that in the absence of good baseline data, the government underestimated the extent of the prevalence rate in 2000. Hence, in consultation with the Ministry of Health, the targets for the medium-term have been revised. Other key areas of concern are access to treated water and sanitation. The issue again remains that the baseline data that was used in 2000. In the case of water, as part of the private management agreement between the Government and the Guyana Water Inc, the PRSP targets were revised in 2003 and these targets have now become part of the performance review of the management company. Taking this into account, GWI is making steady progress towards reaching the revised PRSP targets on water. The medium-term programme will assist in reaching these targets. Similarly, the sanitation targets set in 2000 for the medium-term are unrealistic, as they have been matched by concomitant investments. This was also a key issue raised during the public consultations. Revision of the targets will be necessary. The proposed medium-term programme, successfully implemented, may help in improving access. In housing, the difficulty in securing financing and developing distributed lots and in developing accompanying infrastructure stymied the acceleration of distribution of land titles. However, the provision of loans to low-income housing is beyond the scope of the Government. In the context of the foregoing, Table 9.2 presents revised poverty reduction targets for the period 2005-2009. Achievement of these targets will be facilitated by the programme implementation elaborated in the medium-term. Implementation of the social statistics project and the revised work programme of the Monitoring and Evaluation Unit will assist in monitoring the programme.
POVERTY REDUCTION STRATEGY – PROGRESS REPORT 2005
106
TABLE 9.2: GUYANA -- REVISED QUANTITATIVE GOALS OF THE POVERTY REDUCTION STRATEGY, 2004-2009
2004 2005 2006 2007 2008 2009
Enrollment and literacy
% of primary school entrants reaching Grade 6 89.1 89.3 89.4 89.6 89.6 90.1
Repetition rate (secondary) 10.6 10.6 10.5 10.5 10.3 10.1
Student/trained teacher ratio (primary) 48 47 47 46 46 45
Student/trained teacher ratio (secondary) 39 39 38 38 37 37
Gross nursery school enrolment 92 92 93 93 93 94
Gross primary school enrolment 97 98 98 75 75 77
Gross secondary school enrolment 73 73 74 74 74 75
% Trained teachers in secondary schools 54.5 54.5 54.7 54.8 54.8 55.1
% Trained teachers in primary schools 52 53 55 55 58 60
Percentage CSEC passes Grades 1-4 77.6 76.5 76.9 77.2 77.4 77.6
Health and Nutrition
Infant mortality rate (per 10,000) 53 53 52 51 50 48
Maternal mortality rate (per 10,000) 145 144 144 142 141 140
1 year olds immunized against measles 97.5 97.7 97.8 98.1 98.4 98.5
1 year olds immunized against DPT 91.3 91.5 91.6 92.8 92.8 93.0
% of population with access to health services 92.8 92.9 92.8 93.1 93.2 93.5
% of population with access to adequate sanitation 56.1 56.3 56.5 56.8 57.1 57.4
Number of reported cases of AIDS 480 475 466 455 438 416
Reported cases of AIDS among women (15-45 cohort) 133 132 130 127 124 117
Water
% of population with access to safe water 95.1 95.4 95.6 95.6 95.8 96.2
% of population with access to treated water 36.5 39.6 44.7 64.3 74.2 85
Domestic households connected to water system 125,763 126,800 127,687 129,602 130,898 132,207
Distribution network constructed (kilometers) 280 283 285 288 291 294
Housing
House lots distributed 4,916 5,000 4,000 4,000 4,000 4,000
Land/house titles distributed 5,003 8,000 4,000 4,000 4,000 4,000
Land distribution
Agricultural leases 3,000 3,060 2,121 2,183 2,263 2,344
Business leases 140 143 146 148 152 155
Source: Ministry of Education; Ministry of Health; Ministry of Water and Housing; Guyana Land and Surveys Commission
Data and Programme Monitoring
The availability of data to monitor and measure progress of the poverty programme continues to be a major concern. Unless the culture of social statistics improves, it will be difficult to undertake in-depth analysis of progress made in reducing poverty. Indeed, the PRS consultations revealed the disparities that may exist between the national and regional indicators. Further disaggregation of national data to regional data will substantially help in determining the progress of the poverty programme and assist in reallocating resources to meet specific regional problems. The Government is already taking measures to improve its social statistics in order to improve the quality of the monitoring of its PRS. Box 5 provides a summary of recent development in dealing with this issue.
The PRSP recognized the critical role of a monitoring and evaluation (M&E) system to provide a basis for the analysis of the impact of proposed programmes on poverty reduction, to

POVERTY REDUCTION STRATEGY – PROGRESS REPORT 2005
107
Box 4: Can Guyana Achieve the Millennium Development Goals?
The Millennium Development Goals (MDGs) adopted by United Nations member states sets an ambitious agenda for reducing poverty by 50% by 2015. Since 2001, Guyana has moved to mainstream the MDGs into its PRS. As is the case in many other countries, however, the inadequacy of data and data collection systems present serious challenges to measuring progress towards the attainment the MDGs. In addition, the achievement of the MDGs requires the cooperation of the international community as articulated in Goal 8: A Global Partnership for Development. Particularly critical are the availability of finance and the development of human capacity to manage the process. While the required financing for attainment of the MDGs has not been computed for Guyana, estimates from similar countries suggest that current expenditure trends are woefully inadequate to address the infrastructure and other requirements necessary to meet the MDG targets by 2015. Attainment of the MDG and poverty reduction goals will necessitate new injections of investments to increase productive capacity. As a HIPC country, Guyana has constraints on external borrowing. Not only must new borrowings be highly concessional but also for the purpose of debt sustainability, the debt to revenue ratio in net present value terms must not exceed 250 percent. Recent commitments on debt relief by the G-8 may help countries like Guyana to spend additional resources in meeting its MDGs. Even so, Guyana will seek to secure more grant financing to implement its programmes. In summary, the financing outlook for the MDGs is challenging. Debt financing is restricted, aid transfers are increasingly volatile and procyclical, and the upper ceiling on domestic revenues is constrained by the pace of growth of GDP. The donor community, including the multilateral institutions, must continue to assist highly indebted countries to secure more concessional financing in implementing their poverty reduction programmes
contribute to the development of more appropriate and relevant policy, and to stimulate the continued engagement of civil society in the Poverty Reduction programme. To this end, considerable progress has been made with the development and implementation of an M&E action plan and the establishment of regional and national structures to provide the organizational framework for widespread stakeholder involvement in monitoring and evaluation for the PRS. The five structures established to spearhead the monitoring and evaluation function--the Monitoring and Evaluation Unit of the PCPMU, a National Steering Committee, Ministerial/Agency Focal Points, Thematic Groups, and PRS Regional Committees—are functional and efforts are ongoing to continue building their capacity
and refine their roles within the framework of a national M&E system. PRS M&E Unit In 2003, the Monitoring and Evaluation Unit (M&E Unit) was established within the Policy Coordination and Program Management Unit (PCPMU) at the Office of the President. The Unit’s mandate is to manage a comprehensive and inclusive programme to monitor and evaluate programme and policy performance against the goals and objectives set out in the PRSP. To this end, the Unit supports the work of other M&E structures to facilitate a programme of outreach and information dissemination to civil society, to build awareness and ownership of the PRS at the regional level, and to act as a conduit for feedback to policy makers. The Unit is also responsible for producing the PRS Progress Report, and for coordinating regional and national consultations for civil society input into the PRS Progress Report.
POVERTY REDUCTION STRATEGY – PROGRESS REPORT 2005
108
Box 5: Monitoring Outcomes of the Poverty Reduction Programme
Guyana suffers substantially from institutional weakness and low capacity in gathering, collecting and aggregating social sector data. As a result, the Monitoring and Evaluation Unit encounters serious challenges in measuring outcomes of the poverty reduction strategy program and the millennium development goals (MDGs). In addition, the lack of in-depth analysis hinders the ability of policy makers in specifically targeting resources to areas where they are needed most. In recognition of these challenges, the Government of Guyana with support from the Inter-American Development Bank (IDB), UNDP and possibly DFID is implementing a Social Statistics and Policy Analysis project with the objective of (i) improving and sustaining the capacity of line ministries and agencies to generate social statistics; (ii) undertaking evidence-based policy analysis; and (iii) monitoring output and outcomes and the poverty reduction program. To achieve the project objectives, the Government is strengthening the Bureau of Statistics by improving its capacity to conduct and analyze surveys, demographic information, national accounts and establishing state-of-the-art information management systems. To this end, the Government is recruiting Heads of Departments for Survey, Demography, and National Accounts to begin to build much needed capacity in these sectors. In addition, 20 statisticians are being recruited to fill existing vacancies at BOS and social sector line ministries. The Government is also establishing and/or strengthening statistical units and management information systems in the various line ministries and agencies to assist these units to generate their own social data to support decision-making and also help monitor the PRS. The Bureau of Statistics will coordinate the outputs of the line ministries. Some progress has been made in the implementation of this project. A technical diagnostic assessment (needs assessment) and an ICT survey have been completed for the line ministries. The Government is also in the process of recruiting a consulting firm to assist in institutional strengthening and capacity building of the Bureau of Statistics. Successfully implemented, this project will fill significant gaps in assisting to effectively monitor PRS output/outcomes and creating a culture of an institutionalized social statistics framework. Notwithstanding, it will take time to fully implement this project and to generate the outcomes that are so critical in monitoring the PRS.
In an effort to strengthen the M&E Unit, a Coordinator and five Monitoring and Evaluation Officers were recruited. To further integrate the work of the M&E structures, the first National Workshop on Monitoring and Evaluation for the PRSP took place in October 2004. This workshop brought together stakeholders in the PRSP M&E cycle to review the system, clarify roles and responsibilities, and developed proposals for a more collaborative and coordinated approach. In spite of the strengthening and capacity building efforts undertaken within the M&E system, serious limitations remain. First, there is no M&E systems-based database to track poverty allocation and expenditures. Second, M&E Regional Coordinators and Committees do not have data on programmes with which to undertake public consultations in communities. Third, there is no analysis of allocations and expenditures for pro-poor spending at the regional or national level. And fourthly, in the absence of the social statistics institutional framework, there is great difficulty in measuring outputs and outcomes of poverty programmes. To address these issues, the M&E Unit has developed a comprehensive work programme to improve monitoring evaluation in a sustainable way, over the next 15 months.
Community engagement in monitoring and evaluation cannot progress as necessary without access to timely and relevant information about budgetary allocations for PRS programmes and projects. Further, this information must be disaggregated to sub-regional levels so that stakeholders can better understand resource allocations for sector programmes within

POVERTY REDUCTION STRATEGY – PROGRESS REPORT 2005
109
communities, in order to determine whether these allocations are in line with community needs and priorities. Pending automation of budget and expenditure systems designed for the tracking and monitoring of PRS progress, the M&E Unit is working towards facilitating the expansion of the budget system to allow monitoring and evaluation at the regional level. Specifically, the Unit completed a prioritised rolling investment and maintenance programme attached in Annex C of the report. The M&E Unit is collaborating with the Ministry of Finance, the Lands and Survey Commission and the Ministry of Local Government and Regional Development to determine the most appropriate system for identifying sub regions within the existing 10 administrative regions. This is a critical first step in disaggregating the capital programme allocation to the regional and sub-regional levels in order to provide Regional Committees with information on PRSP programmes and projects slated for their communities. Regional Coordinators will use this information as the basis of consultation and feedback for policy decision making and programming. The Ministry of Finance’s IFMAS system will be used to disaggregate expenditure data on the poverty reduction programme by sector and region for poverty reduction ex-post analysis. The Unit will also engage technical assistance to initiate the automation of budgetary allocations by sectors, programmes, regions, and eventually sub-regions.
POVERTY REDUCTION STRATEGY – PROGRESS REPORT 2005
110
TABLE 9.3 - GUYANA: POVERTY REDUCTION STRATEGY MONITORING AND EVALUATION PLAN, 2005-2006
AGENCY WORK PLAN PROGRESS TO DATE PLANNED ACTIVITIES TARGET
DATE
M & E Unit
Prepare PRS Progress Report for the Government and donors, including the World Bank and IMF
M&E Unit produced the PRSP report in 2001 and two progress reports in 2004 and 2005
Produce the draft PRS Progress Report; report will include inputs from Regional Coordinators that provide regional perspectives of poverty reduction and from line ministries that provide sector perspectives; Conduct nationwide consultations on the progress report; Finalize PRS Progress Report
May 2006 June 2006 July 2006
M & E Unit
Establish institutional framework for monitoring and evaluation of the poverty reduction strategy
Network of focal points within each ministry and agencies totaling 15 was established in October 2004 to monitor sector PRS programs; liaise with M&E unit at the PCPMU to provide feedback on sector programs; and link PRS objectives to the formulation of sector strategies and plans Established a Steering Committee consisting of civil society and public servants to provide policy direction to the M & E unit.
Establish a Steering/Coordinating Committee comprising of focal points, M&E Unit, Regional Coordinators to review progress of PRS on a quarterly basis;
September 2005
M & E Unit
Develop information/data-based capacity to support poverty reduction program at the regional and community levels
Disaggregating capital program allocation into regional components which will be used by regional coordinators as the basis of consultation and feedback in policy decision making and programming Developing skills register at the regional level to provide entrepreneurs and contractors identifying personal for employment Established information centers in Regions 3, 4, 5, 6
Complete task on data disaggregation Complete skills register at Regions 3, 4, 5, 6 and 10 and keep updating information Expand information centers to cover hinterland regions
October 2005 November 2005 to December 2006 March 2006
POVERTY REDUCTION STRATEGY – PROGRESS REPORT 2005
111
AGENCY WORK PLAN PROGRESS TO DATE PLANNED ACTIVITIES TARGET
DATE
and 10 to allow the general public to easily access information on PRSP
M & E Unit
Develop information/data-based capacity to support poverty reduction program at the regional and community levels
Developing data base of social sector (PRSP targets, MDGs) input, intermediate and output indicators disaggregated at the regional level for analysis in the PRS Progress Report
Design and implement an M&E computerized system-based for tracking budget allocation, expenditures and outcomes at the national and regional levels Continue expanding social sector data bank to cover all relevant PRSP targets and MDGs at the regional level in collaboration with the Social Statistics Project, Bureau of Statistics and social sector ministries and agencies Begin to conduct and publish on a bi-annual basis expenditure data on poverty programmes broken down by sector and priorities Collaborate with Regional M&E Committees to identify number of priority poverty reduction projects to track Disaggregate expenditure data on poverty reduction program by sectors using IFMAS into regional component for poverty reduction ex-post analysis Complete a technical paper of budget allocations and expenditures and outcomes of poverty reduction strategy as an input into the 2006
July 2006 December 2006 September 2005 September 2005 October 2005 June 2006
M & E Unit
Provide technical support and management capacity in building M & E capabilities in key ministries
M&E unit has developed in collaboration with sector ministries key indicators and data required for PRS analysis M&E unit has identified key sector constraints in PRSP monitoring and with support of the IDB working to improve social sector data with the Social Statistics Project
M&E Unit to continue its collaboration with the line ministries in developing regional data for key PRS indicators MDGs M&E unit in collaboration with Social Statistics Project and the line ministries to refine and standardize data for PRS monitoring (intermediate and outcome indicators)
December 2006 December 2006
POVERTY REDUCTION STRATEGY – PROGRESS REPORT 2005
112
AGENCY WORK PLAN PROGRESS TO DATE PLANNED ACTIVITIES TARGET
DATE
M&E Unit
Provide technical support and management capacity in building M & E capabilities in key ministries
Worked with focal points in refining data requirements for PRSP monitoring Began the process of recruiting an M&E specialist to assist in capacity building and institutional strengthening Completed workshops with focal points to define role in the overall M&E work program
Recruit M&E specialist to provide training to deepen the monitoring and evaluation skills of M&E staff, regional community coordinators, and M&E staff of sector ministries Assist M&E unit to develop a national M&E strategy that includes all of the major stakeholders, a budget reform strategy that links the generation of M&E results to budget elaboration in a carefully sequenced cycle based on government priorities and performance benchmarks, and a needs assessment for training in M&E for major stakeholders.
December 2005 October 2005
M&E Unit
Pilot an innovative community-based M&E program on local PRSP impacts and activities
Six regional committees were established and are functioning. Each committee has ten members with 2 regional coordinators Training and workshops have been provided to the regional committees to support its work Committees continue to function as the liaison between the communities and the M&E unit Committees provide workshops and consultations to inform communities of the poverty reduction strategy
Establish two regional coordinating committees at Region 9 and Region 7; Establish two regional coordinating committees at Region 1 and Region 8 Complete training and capacity building to regional committees to fully undertake its M&E responsibilities
November 2005 March 2006 December 2006
In addition, the Monitoring and Evaluation Unit will undertake the following activities in 2005:
• Training An M&E Specialist will be engaged to implement a comprehensive training programme to deepen the monitoring and evaluation skills of M&E staff, regional community coordinators, and M&E staff of sector ministries. The M&E Specialist will also assist in developing a national M&E strategy that includes all of the major stakeholders, a budget reform strategy that links the generation of M&E results to budget elaboration in a carefully sequenced cycle based on government priorities and
POVERTY REDUCTION STRATEGY – PROGRESS REPORT 2005
113
performance benchmarks, and a needs assessment for training in M&E for major stakeholders.
• Applied Budget Analysis
It has become increasingly evident that fiscal transparency is of considerable importance in achieving good governance and meaningful participation by citizens. Public sector transparency enhances accountability and, when coupled with increased opportunities for public debate, may contribute to better policy and trust in government. In keeping with this, the M&E Unit will develop and launch a programme to train community representatives in budget literacy and analysis. Analysis may take the form of tracking to assess how funds allocated for a particular purpose are spent.
• Skills Register The Regional Committees will continue to work towards generating a comprehensive skills register for their regions, and to disseminate information via regional information centres, on employment opportunities available for local workers through PRS projects and programmes.
• Citizen Report Cards The M&E Unit and Regional Committees will introduce the use of citizen report cards as a means of generating regular feedback on the implementation, performance and impact of PRSP projects and programmes. Report cards would shed light on constraints that citizens face in accessing public services, their views about the quality and adequacy of services, and the responsiveness of government officials. They would provide valuable insight on the priorities and problems faced by citizens, and how services may be better tailored to the needs of citizens in general, and the poor in particular.
• Expansion of Regional Committees
In 2005, work will also continue towards expanding opportunities for participation to hinterland areas, and in particular, to Regions 2 and 9. Logistical complexities and high communication and transportation costs have hindered efforts to maintain sustained engagement of these communities. The M&E Unit will collaborate with regional officials and community representatives to establish a system suited to the particularities of these areas.
• Strengthening the Feedback Mechanism
The M&E Unit has also identified the need to strengthen the mechanism by which civil society input is communicated to line ministries and agencies, and ultimately contributes to better-informed policy decisions at the national level. To this end, the role of the Thematic Groups in providing a link between the government, donors and

POVERTY REDUCTION STRATEGY – PROGRESS REPORT 2005
114
the monitoring and evaluation process (via the M&E Unit) will be strengthened. The Unit is also in the process of strengthening its collaboration with the Ministry of Local Government and Regional Development. The Ministry is able to provide information on regional programmes for dissemination to the PRS regional committees, and it is envisioned that the work of the Regional Committees will contribute to the Ministry’s work towards a process of more decentralized planning at the regional level. The Ministry is supporting a system to improve coordination with the Ministry of Amerindian Affairs and other sector ministries to disseminate information on hinterland projects and programmes, and has also appointed nine regional officers who have undergone training to improve their ability to execute monitoring and evaluation functions. The Ministry also supports the establishment of a Thematic Group on regional PRS projects and programmes.
Steering Committee A Steering Committee consisting of 10 members representing NGOs, other civil society organizations and the Government, was strengthened early in 2004 when national civil society organizations were invited to nominate representatives. Efforts continue to refine the role of the Steering Committee in order to more effectively utilize members’ expertise and reach within their constituencies to promote more effective and sustained civic engagement with the PRS process. A more concerted effort will also be made to have a more diverse Steering Committee that includes the perspectives of women, youth, Amerindian and other groups. Focal Points in Ministries and Agencies At the National Workshop on Monitoring and Evaluation for the PRSP, ministries and agencies identified Focal Points to liaise with the M&E Unit. Since then, the Focal Points have been actively engaged in providing information on sectoral and agency policies and programmes for the 2005 Progress Report, in addition to providing data for the national social indicator tables. Ministry and Agency Focal Points are also engaged in capacity building activities that fall under the aegis of the IDB-funded Social Statistics project and are expected to further benefit from initiatives supported both by that project and by the M&E Unit. The Unit will continue its collaboration with the line ministries in generating regional data for key PRS indicators, MDGs, and in refining and standardizing data monitoring PRS intermediate and outcome indicators. Thematic Groups Thematic Groups have been constituted for water, health, education and governance sectors, and have functioned to a greater or lesser degree throughout 2004. The Thematic Groups continue to be coordinated by the relevant line Ministry, with the participation of other key agencies, including donors and the M&E Unit. However, the role of the Thematic Groups needs to be further concretized in order to bring their work closer in line with the overall goals and objectives of the PRS M&E system.
POVERTY REDUCTION STRATEGY – PROGRESS REPORT 2005
115
PRS Regional Committees The PRS Regional Committees were developed as critical components of a system to test the methodology employed during the first phase of implementation of the M&E strategy for the PRSP. A total of six committees have been established in Regions 3, 4 (East), 4 (West), 5, 6 and 10. With more than 40 percent of the population residing in Region 4 two Regional Committees were established. The mandate of the Committees is to foster the engagement of communities, civil society and local government representatives in monitoring progress towards the goals and objectives of the Poverty Reduction Programme Strategy. The Committees also serve as a link between their communities, local government institutions and the PRS M&E Unit. Committees conduct outreach activities as part of the national review process for the annual PRS Progress Report, and implement mobilization campaigns to encourage participation in public consultations to illicit feedback on the document. Training has been provided for Committee members in areas such as team building, basic M&E tools such as ranking and scoring, diagrams, mapping, interviewing, impact vs. process monitoring, developing objectives, developing a programme of work, and exercises in planning an M&E activity.
The Bureau of Statistics
The Bureau of Statistics (BOS), custodian of national aggregate data, continues to suffer from institutional and capacity constraints. Key line ministries do not have statistical departments and where statistical departments exist, statisticians and other skilled personnel are not available, in part due to poor remuneration in the public sector that makes it difficult to recruit and retain professionals. These problems are further exacerbated by supply constraints of computer hardware and software and the absence of national standards in data compilation from community and regional levels to the national. The 2004 Progress Report outlined processes to be put in place to strengthen the Bureau of Statistics to enable it to fulfill its assigned role in the overall national Poverty Reduction Strategy. These included staff training in data collection, surveys, analysis and data management, the development of the curriculum at University of Guyana, and the recruitment of graduates to address the current shortage of statisticians. Other priorities identified include upgrading IT equipment, establishing a website and mounting a new Household Income and Expenditure Survey (HIES) to update the Poverty Profile, as well as support from the IDB through the Social Sector and Policy Analysis Programme. Since then, the Bureau has received upgraded computer and stand-by generating equipment, to enhance its Management Information Systems capability. A Junior Data Processing Specialist was recruited in January 2004, and the World Bank has provided funding for both human resource skills and equipment under the PSTAC loan agreement. This will facilitate the completion of the detailed 2001 census tables and analysis of the results in 2005.
POVERTY REDUCTION STRATEGY – PROGRESS REPORT 2005
116
Completion of detailed Census data was a prerequisite for the launching of a new Household Income and Expenditure Survey, which will be based on a sample of approximately 7,500 households. The Bureau was engaged with the M&E Unit of the Office of the President, and World Bank and IDB Staff, in the further amplification of the Questionnaire for the HIES to include modules for enquiry into the status of Poverty and Living Conditions. This data, combined with correlative data from the Census, is required to inform the M&E Unit’s monitoring of policy impacts on Government’s Poverty Reduction Strategies as well as the achievement of benchmarks for the Millennium Development Goals. Additional preparatory activities for the commencement of the HIES, including training of enumerators, were interrupted by onset of the flood disaster and have delayed the start of the HIES. Obviously, these constraints continue to impact on the quality, frequency and consistency of key poverty reduction indicators and targets and also the MDGs.
POVERTY REDUCTION STRATEGY – PROGRESS REPORT 2005
117
Chapter
RISKS TO THE STRATEGY
This Poverty Reduction Strategy Progress Report assumes unimpeded progress of reforms on the regulatory, legislative, macroeconomic and social programmes. It also assumes that the economy will grow at a steady pace and will provide employment creation leading to the amelioration of the conditions under which the poor live. However, a number of factors pose serious threats to the strategy. These were raised in the PRSP of 2001 and continue to be relevant in the medium term. This chapter provides a summary of the risks associated with the medium term programme.
National Consensus
Civil Society
The PRSP process in Guyana has contributed to the development and promotion of civil society participation in the design and monitoring of economic and social policies. Although progress has been limited in the past three years, the mechanisms for deeper participation and collaboration, through the PRSP steering committee and the national M&E framework, are being developed. Nonetheless, civil society development in Guyana remains vulnerable to the maintenance of a satisfactory degree of social and political cohesion. There is also a need to improve policy literacy, particularly through the budget process. Satisfying this need is not only the responsibility of government, in opening the space for policy education and dialogue, but communities must also feel encouraged to make demands on this space through their representatives.
Policies and the Economy
The relationship between economic development and socio-political stability is not unidirectional. Economic progress requires a minimum level of stability to reduce the risks of doing business and encourage the expansion of the economy. However, economic development places a premium on stability as economic agents seek to preserve and advance their gains. Lack of progress on the economic front in reducing poverty can therefore place a strain on cohesion as inequalities increase bringing about increased criminality and divisions in society. In particular, as Guyanese go to the polls in 2006, there is need for confidence building measures to stymie civil unrest and instability, and to cultivate a new culture of peace in political relations in the society.
Implementation Capacity
Guyana’s seven-pillared poverty reduction strategy aims to move forward the development programme simultaneously on all fronts. While this approach recognizes the urgent needs to
10
POVERTY REDUCTION STRATEGY – PROGRESS REPORT 2005
118
be addressed and the interdependent nature of each of the seven pillars, it also carries the risk that bottlenecks in one area will delay implementation in others and constrain progress. One of the main symptoms of the disparity in progress made in various areas has been the mass exodus of skilled personnel in business, healthcare and education. If the migration is not slowed, there will be an increased reliance on a smaller volume of human resource base, including foreign personnel, thus increasing the cost of labour for the strategy and with broader deleterious effects on the economy and society. The human capital base is also threatened by HIV/AIDS and other diseases, as well as declines in the quality of education and healthcare delivered, as education and health care professionals leave Guyana for jobs elsewhere. The assumptions of the strategy’s impact on poverty have not been quantified because of the dearth of data to conduct a poverty diagnosis and impact evaluation of policies. Success in monitoring the outcome of the PRSP in the medium term depends on the expeditious implementation of the Social Statistics Project and the successful establishment of a vibrant national monitoring and evaluation system.
Availability of External Resources
Guyana has very limited fiscal space for expanding poverty reducing programmes. In addition to financial resources, the scale and technology of potential strategies may also require technical and managerial capacity outside of the current capabilities of the country. External assistance and partnerships are therefore essential to the achievement of Guyana’s poverty reduction efforts, including the attainment of the MDGs. Given the changing modalities of debt relief, Guyana’s post HIPC status and trends in development assistance globally, there is a possibility that external support may fall below what is required. This has been realized in the past three years, as assistance has fallen below what was envisioned in the strategy in 2001. Alternative financing initiatives and new financing strategies are currently being explored by the government and have already met with success in terms of debt relief. The effort must be proactively built on as a safeguard against the unpredictability of international sentiment on development aid.
Developments in the World Economy
Although developing countries have been enjoying higher growth rates than in the last decade, the global economy, and particularly those economies that receive much of the developing world’s output, is expected to expand at a much slower rate over the medium term compared to 2004.9 The declines in global demand may negatively impact the growth in exports for Guyana, particularly in the new growth areas of tourism and non-traditional
9 Global Development Finance 2005, World Bank
POVERTY REDUCTION STRATEGY – PROGRESS REPORT 2005
119
exports. Non-oil commodity prices are also expected to level off, which, if combined with increases in oil prices, can depress the terms of trade for oil importing countries like Guyana. Developments in the European Union’s preferential arrangements and negotiations with the Caribbean and others in the ACP block will directly impact the success of reforms to modernize the rice and sugar sectors. Guyana must build new economic partnerships with growth economies such as China and India, while also acting to advance the Caricom Single Market Economy as vehicles for promoting the economic progress for Guyana.
Natural Disasters
The reality of the risk that a natural disaster can pose to economic progress became painfully clear in the wake of the flood in January 2005. While still contemplating the extent of the damages, it is clear that the disaster has forced a reprioritization of expenditure and that future disaster mitigation will lead to a higher expenditure profile than in the past. The recent flood has imposed additional demands on the budget, highlighting the perils of neglecting the adequate maintenance of drainage infrastructure. The disaster therefore provides warning signals and actions must be taken now to ensure that Guyana is better prepared to withstand such threats to its economic infrastructure in the future.
POVERTY REDUCTION STRATEGY – PROGRESS REPORT 2005
120
Chapter
SUMMARY AND CONCLUSIONS Despite serious challenges, Guyana continues to make strides in the achievement of its poverty reduction targets. In 2004, the Government accomplished more than 80 percent of its planned actions that was proposed in the PRS progress report. The 2005 progress report sets an ambitious agenda for the medium-term in improving the poverty indicators. Yet, reaching these will not be easy. High and sustained growth would have to be maintained over the medium term, regulatory reforms and good governance will matter, political stability will be critical and the government will have to expand the infrastructure network to complement private sector growth. Violence and crime will have to be contained and social cohesion will be essential. The private sector also has a critical role to play. It would have to take advantage of the many opportunities that Government continues to create to allow for increased investment. Thus, efforts will have to be made to stem the flow of Guyanese especially skilled professionals and entrepreneurs. It is therefore important that the causes of migration are adequately addressed. Law and order, the functioning of the justice system, reforms in key organizations such as Go-Invest, the Deeds Registry and the Guyana Land and Survey Commission are critical to investment both local and foreign. Several measures will be implemented to ensure expeditious and far-reaching reforms in these and other agencies. Interest in the poverty reduction program is high. The many persons who attend public consultations and the meaningful feedback that is reflected in the progress report is evidence of the participatory approach of the PRS. In order to sustain this high level of interest, Government will continue to involve the communities in the prioritization and monitoring of projects that are important to them. To this end, the Monitoring and Evaluation Unit will begin to implement a comprehensive work program with a view of developing and maintaining systems of monitoring that span across ministries, regions and agencies involved in generating economic and social statistics. The Social Statistics Project will provide the much-needed mechanism in measuring outputs of the poverty program. Disaggregating data to the regional level will help, where necessary, to refocus resources to meet regional development priorities. The medium-term macroeconomic framework presents its own special challenges. Continuing high oil prices combined with ongoing sugar reforms in the European Union may adversely
11

POVERTY REDUCTION STRATEGY – PROGRESS REPORT 2005
121
affect external balances and impact on Government’s progress on poverty reduction. This is especially so when taken in the context that the sugar sector provides more than 25 percent of Guyana’s foreign exchange earnings. Speedy efforts on the part of the European Union will be necessary to provide financial cushioning especially to the workers that are directly involved in sugar production. The poverty reduction program is not without its risks. Increased concessional financing, especially grant assistance will be needed if Guyana is to meet its poverty reduction targets and the millennium development goals. Importantly, the absorptive capacity of the country will have to improve for Guyana to convert any additional financing into effective programs and outputs that will definitively support poverty reduction. In addition, national consensus and cohesion will be pivotal especially in 2006 when Guyana holds general elections. It is anticipated that Guyana’s development will transcend partisan politics, which will allow for the continued implementation of the medium-term poverty program. In the final analysis, future prospects are good for Guyana. Investors continue to show keen interest in developing the country’s vast natural resources. The challenge will be to marshal these interests in a way that helps to advance the cause of poverty reduction through the creation of good paying jobs and opportunities that will stem the tide of migration of young Guyanese
AN
NE
X A
: G
UYA
NA
: PO
LIC
Y M
ATR
IX F
OR
PO
VE
RTY
RE
DU
CTI
ON
ST
RA
TEG
Y –
IMPL
EM
EN
TAT
ION
YE
AR
200
4
Page
147
of 2
32
P
OL
ICY
A
RE
A
STR
AT
EG
IES
AN
D M
EA
SUR
ES
PL
AN
NE
D A
CT
ION
S: 2
004
AC
HIE
VE
ME
NT
S/O
UT
CO
ME
S 20
04
Mac
roec
onom
ic
fram
ewor
k M
aint
ain
pric
e an
d ex
chan
ge s
tabi
lity
Stre
ngth
en th
e fin
anci
al s
yste
m
Esta
blis
h st
ock
mar
ket
Impl
emen
t tax
refo
rms
Con
tinue
to
purs
ue p
rude
nt m
acro
econ
omic
pol
icie
s co
nsis
tent
with
th
e PR
GF
Impl
emen
t arra
ngem
ents
for s
uper
visi
on o
f the
New
Bui
ldin
g So
ciet
y Ac
t bas
ed o
n th
e FI
A C
ondu
ct o
n-si
te in
spec
tions
and
app
ly c
onso
lidat
ed s
uper
visi
on o
f all
finan
cial
inst
itutio
ns
Impl
emen
t com
preh
ensi
ve h
uman
reso
urce
stra
tegy
for t
he B
SD
Enac
t leg
isla
tion
on d
epos
it in
sura
nce
Con
tinue
to im
plem
ent l
oan
risk
ratin
g sy
stem
and
follo
w p
roce
dure
s fo
r pro
mpt
cor
rect
ive
actio
n En
act m
odifi
catio
ns to
the
FIA
and
the
Bank
of G
uyan
a Ac
t C
ontin
ue to
attr
act m
ore
com
pani
es to
trad
e in
the
stoc
k m
arke
t In
stal
l sy
stem
s in
th
e In
com
e Ta
x D
epar
tmen
t to
im
prov
e ta
x co
llect
ion
Gov
ernm
ent c
ompl
eted
its
2nd
Rev
iew
of t
he P
RG
F in
Jul
y 20
04
and
3rd
revi
ew i
n Ja
nuar
y 20
05.
Both
sta
ff re
ports
not
ed t
he
mai
nten
ance
of f
inan
cial
sta
bilit
y.
The
Bank
ing
Supe
rvis
ion
Dep
artm
ent o
f the
Cen
tral B
ank
is s
ched
uled
to s
uper
vise
NBS
in 2
006.
O
n-si
te i
nspe
ctio
ns o
f 4
four
com
mer
cial
ban
ks w
as c
ompl
eted
an
d co
nsol
idat
ed s
uper
visi
on o
f all
finan
cial
inst
itutio
ns is
pla
ce.
Trai
ning
on
inte
grat
ed a
nd c
onso
lidat
ed s
uper
visi
on c
ondu
cted
for
staf
f. Th
e Ba
nk is
aw
aitin
g po
licy
dire
ctio
n, b
oth
for t
he H
R s
trate
gy a
nd
for t
he le
gisl
atio
n on
dep
osit
insu
ranc
e
Loan
risk
ratin
g sy
stem
is in
pla
ce a
nd o
pera
tiona
l.
The
FIA
and
the
Bank
of G
uyan
a Ac
t wer
e am
ende
d to
stre
ngth
en
supe
rvis
ion
and
fiduc
iary
ove
rsig
ht i
n th
e fin
anci
al s
ecto
r. Th
e N
BS A
ct w
as a
lso
appr
oved
. Th
e vo
lum
e of
trad
e on
the
Guy
ana
Stoc
k Ex
chan
ge in
crea
sed
by
400
perc
ent
durin
g 20
04.
Num
ber
of f
irms
tradi
ng i
n th
e st
ock
mar
ket a
lso
incr
ease
d fro
m 8
to 1
0.
GR
A up
date
d an
d en
hanc
ed s
yste
ms
for
regi
ster
ing
taxp
ayer
s an
d a
com
mitt
ee w
as e
stab
lishe
d to
impl
emen
t the
new
Tax
paye
r Id
entif
icat
ion
Num
ber (
TIN
) sys
tem

AN
NE
X A
: G
UYA
NA
: PO
LIC
Y M
ATR
IX F
OR
PO
VE
RTY
RE
DU
CTI
ON
ST
RA
TEG
Y –
IMPL
EM
EN
TAT
ION
YE
AR
200
4
Page
148
of 2
32
PO
LIC
Y
AR
EA
ST
RA
TE
GIE
S A
ND
ME
ASU
RE
S P
LA
NN
ED
AC
TIO
NS:
200
4 A
CH
IEV
EM
EN
TS/
OU
TC
OM
ES
2004
Ref
orm
exp
endi
ture
con
trol
Stre
ngth
en th
e fie
ld a
nd a
udit
unit
to c
olle
ct ta
x ar
rear
s D
esig
n an
d im
plem
ent a
n an
ti-co
rrupt
ion
prog
ram
me,
with
em
phas
is
on a
cod
e of
con
duct
, ne
w r
egul
atio
ns a
llow
ing
for
dism
issa
l of
of
ficia
ls a
nd a
ppro
pria
te s
yste
ms
& tra
inin
g
Publ
ish
tax
exem
ptio
ns a
nnua
lly
Adop
t ad
min
istra
tive
guid
elin
es
and
crite
ria
to
impl
emen
t th
e am
endm
ents
to th
e C
usto
ms
Ord
er (A
men
dmen
t) Ac
t En
act l
egis
latio
n to
impl
emen
t VAT
In
stal
l har
dwar
e an
d so
ftwar
e fo
r in
tegr
atin
g th
e M
OF’
s pa
yrol
l and
th
e Pu
blic
Ser
vice
Min
istry
’s h
uman
reso
urce
dat
abas
es
Trai
ning
of c
ore
staf
f and
sta
ff of
oth
er a
genc
ies
in th
e op
erat
ion
of
the
syst
ems.
The
oper
atio
ns o
f the
Exa
min
atio
n an
d In
vest
igat
ion,
Fie
ld A
udit,
C
onsu
mpt
ion
Tax
Audi
t an
d Po
st A
sses
smen
t Ve
rific
atio
n U
nits
w
ere
cons
olid
ated
into
the
Audi
t and
Ver
ifica
tion
Div
isio
n A
new
Int
erna
l Af
fairs
Div
isio
n w
as m
anda
ted
to i
nves
tigat
e co
rrupt
pr
actic
es
and
com
plai
nts
agai
nst
empl
oyee
s an
d to
re
com
men
d ap
prop
riate
di
scip
linar
y ac
tion.
A
Mon
itorin
g/Su
rvei
llanc
e U
nit w
as a
lso
esta
blis
hed
inst
alle
d at
key
cu
stom
s po
ints
of e
ntry
. Ta
x ex
empt
ions
are
now
bei
ng p
ublis
hed
The
Cus
tom
s D
utie
s (A
men
dmen
t) w
as
issu
ed
to
min
imiz
e di
scre
tion
in th
e gr
antin
g of
exe
mpt
ions
. Th
e VA
T le
gisl
atio
n w
as ta
bled
in P
arlia
men
t in
Janu
ary
2005
and
pa
ssed
in J
uly
2005
. VAT
Ste
erin
g C
omm
ittee
and
Uni
t in
plac
e at
G
RA.
H
ardw
are
and
softw
are
for
inte
grat
ing
the
publ
ic s
ecto
r pa
yrol
l in
stal
led
and
oper
atio
nal.
The
Inte
grat
ed F
inan
cial
Man
agem
ent
Syst
em (I
FMAS
) als
o be
cam
e op
erat
iona
l in
Janu
ary
2004
. Tr
aini
ng
and
wor
ksho
ps
com
plet
ed
for
agen
cies
to
op
erat
e da
taba
se s
yste
ms.
Inst
itutio
nal
and
regu
lato
ry
fram
ewor
k
Mod
erni
se
and
rest
ruct
ure
the
publ
ic
sect
or
Stre
ngth
en th
e ca
paci
ty o
f the
PSM
to re
gula
te a
nd m
anag
e th
e ci
vil
serv
ice
syst
em
Trai
n hi
gh le
vel s
taff
in m
anag
emen
t and
lead
ersh
ip te
chni
ques
D
esig
n an
d im
plem
ent
perfo
rman
ce a
ppra
isal
sys
tem
for
hig
h le
vel
staf
f
The
Publ
ic S
ecto
r Mod
erni
zatio
n Pr
ojec
t (PS
MP)
to s
treng
then
the
PSM
is u
nder
impl
emen
tatio
n Be
ing
impl
emen
ted
thro
ugh
PSM
P Be
ing
impl
emen
ted
thro
ugh
PSM
P
AN
NE
X A
: G
UYA
NA
: PO
LIC
Y M
ATR
IX F
OR
PO
VE
RTY
RE
DU
CTI
ON
ST
RA
TEG
Y –
IMPL
EM
EN
TAT
ION
YE
AR
200
4
Page
149
of 2
32
PO
LIC
Y
AR
EA
ST
RA
TE
GIE
S A
ND
ME
ASU
RE
S P
LA
NN
ED
AC
TIO
NS:
200
4 A
CH
IEV
EM
EN
TS/
OU
TC
OM
ES
2004
Impr
ove
fram
ewor
k fo
r la
nd
deve
lopm
ent
Ref
orm
tend
er a
nd p
rocu
rem
ent s
yste
m
Stre
ngth
en t
he P
CU
in
the
Stat
e Pl
anni
ng S
ecre
taria
t to
des
ign,
pr
ogra
mm
e, m
onito
r and
eva
luat
e pr
ojec
ts
Rec
eive
and
exa
min
e re
port
of c
omm
ittee
set
up
to r
evie
w e
xist
ing
size
an
d co
vera
ge
of
stat
utor
y bo
dies
an
d se
mi-a
uton
omou
s ag
enci
es
Reg
ular
ise
land
out
side
of l
and
deve
lopm
ent s
chem
es
Proc
ess
addi
tiona
l elig
ible
cla
ims
to le
ases
and
title
s Im
plem
ent
LTR
in
the
river
ain
area
s of
Ber
bice
, D
emer
ara
and
Esse
quib
o an
d in
Mab
arum
a, M
ahdi
a an
d Le
them
C
ompl
ete
syst
em d
evel
opm
ent i
n la
nd a
dmin
istra
tion
Impr
ove
capa
city
of r
even
ue m
anag
emen
t with
in G
LSC
C
ompl
ete
and
adop
t reg
ulat
ions
of t
he 2
003
Tend
er a
nd P
rocu
rem
ent
Act
Impl
emen
t adm
inis
trativ
e sy
stem
s an
d pr
oced
ures
to s
uppo
rt Te
nder
an
d Pr
ocur
emen
t Act
200
3
Com
plet
ed
Des
ign
of
inst
itutio
nal
mod
el
for
Proj
ect
Cyc
le
Man
agem
ent
Syst
em.
Staf
f be
ing
train
ed t
o un
derta
ke f
easi
bilit
y st
udie
s,
proj
ect
appr
aisa
l, po
st
eval
uatio
n an
alys
is
and
prep
arat
ion
of ro
lling
inve
stm
ent p
rogr
am.
Rep
ort w
as c
ompl
eted
and
rec
omm
enda
tions
bei
ng im
plem
ente
d th
roug
h (i)
the
Org
anic
bud
get
law
; an
d/or
(ii)
adm
inis
trativ
e di
rect
ives
Ad
ditio
nal c
laim
s be
ing
proc
esse
d; m
ost o
f coa
stal
are
a co
mpl
ete.
G
LSC
tenu
red
leas
es fo
r 5,
900
parc
els
of la
nd a
nd ti
tles
for
200
urba
n pa
rcel
s re
gist
ered
. M
abar
uma,
Mah
dia,
Kai
tum
a an
d Bo
nasi
ka i
n pr
ogre
ss;
60%
co
mpl
ete.
G
LSC
ha
s co
mpu
teriz
ed
the
appl
icat
ion
and
leas
e is
suan
ce
proc
ess.
Par
cel d
atab
ase
has
also
bee
n co
mpu
teriz
ed u
sing
the
geog
raph
ic i
nfor
mat
ion
syst
ems
softw
are
ARC
VIEW
. C
adas
tral
Plan
inde
x 90
% c
ompl
ete.
R
even
ue s
ectio
n es
tabl
ishe
d an
d st
affe
d.
Proa
ctiv
e co
llect
ions
cam
paig
n st
arte
d on
larg
er le
ssee
s.
Proc
urem
ent L
aw a
nd re
gula
tions
bec
ame
oper
atio
nal i
n 20
04
A fir
m
has
been
en
gage
d to
w
ork
on
the
stre
ngth
enin
g of
pr
ocur
emen
t adm
inis
tratio
n, in
clud
ing
the
prep
arat
ion
of s
tand
ard
bid
docu
men
ts a
nd a
rev
iew
of t
he a
dmin
istra
tive
func
tion
of th
e bo
ard
and
the
tend
er p
roce
ss. D
ocum
ents
hav
e be
en d
rafte
d an
d pr
ocur
emen
t per
sonn
el a
re b
eing
trai
ned.
AN
NE
X A
: G
UYA
NA
: PO
LIC
Y M
ATR
IX F
OR
PO
VE
RTY
RE
DU
CTI
ON
ST
RA
TEG
Y –
IMPL
EM
EN
TAT
ION
YE
AR
200
4
Page
150
of 2
32
PO
LIC
Y
AR
EA
ST
RA
TE
GIE
S A
ND
ME
ASU
RE
S P
LA
NN
ED
AC
TIO
NS:
200
4 A
CH
IEV
EM
EN
TS/
OU
TC
OM
ES
2004
Appo
int B
oard
of t
he N
TPB
Stre
ngth
en th
e Se
cret
aria
t of t
he N
TPB
Boar
d
Mem
bers
of t
he N
TPB
appo
inte
d in
200
4 S
treng
then
ing
of
the
Secr
etar
iat
is
unde
rway
. O
ffice
sp
ace,
eq
uipm
ent a
nd s
ome
staf
f hav
e be
en s
ecur
ed.
Pass
ed
legi
slat
ion
to
esta
blis
h tri
buna
l to
he
ar
appe
als
to
deci
sion
s of
the
Publ
ic P
rocu
rem
ent C
omm
issi
on (P
PC)
Priv
ate
sect
or
deve
lopm
ent
Stre
ngth
en
inst
itutio
nal
supp
ort
for
inve
stm
ent a
nd e
xpor
t pro
mot
ion
Impl
emen
t sp
ecifi
c po
licie
s to
int
egra
te
smal
l bus
ines
ses
and
cotta
ge in
dust
ries
into
the
form
al e
cono
my
Org
anis
e an
In
vest
men
t C
onfe
renc
e dr
awin
g on
lo
cal
and
inte
rnat
iona
l in
vest
ors
and
mon
ey
man
ager
s w
ith
assi
stan
ce
of
UN
DP
and
Wor
ld B
ank
Enac
t Sm
all B
usin
ess
Law
and
beg
in to
impl
emen
t its
pro
visi
ons
Und
erta
ke
a co
mpr
ehen
sive
re
view
of
th
e in
stitu
tiona
l an
d or
gani
satio
nal
envi
ronm
ent
unde
rpin
ning
m
icro
en
terp
rise
deve
lopm
ent a
nd s
mal
l bus
ines
ses
Incr
ease
the
cap
ital
base
of
IPED
and
rev
iew
the
ter
m
stru
ctur
e of
its
inte
rest
rate
s to
allo
w it
to c
ontin
ue to
pro
vide
su
ppor
t to
smal
l bus
ines
ses
Esta
blis
h a
Nat
iona
l Eco
nom
ic A
dvis
ory
Cou
ncil
Inve
stm
ent
Con
fere
nce
did
not
take
pla
ce in
200
4. H
owev
er,
in
2005
, with
UN
DP
assi
stan
ce, r
egio
nal b
usin
essm
en a
nd in
vest
ors
held
one
-day
inv
esto
rs’
conf
eren
ce i
n G
uyan
a. G
uyan
a al
so
parti
cipa
ted
in tr
ade
and
inve
stm
ent e
xpos
ition
s in
the
Car
ibbe
an.
Com
plet
ed th
e dr
aft C
ompe
titio
n an
d Fa
ir Tr
adin
g (C
FT) B
ill.
Smal
l Bus
ines
s La
w,
Inve
stm
ent
Law
, Te
chni
cal a
nd V
ocat
iona
l Ed
ucat
ion
and
Trai
ning
Act
ena
cted
. Th
e re
view
was
not
und
erta
ken
in 2
004.
To
be im
plem
ente
d un
der
the
2005
- 20
07 p
olic
y fra
mew
ork
Not
don
e.
Not
don
e.
Econ
omic
ba
se
to
bene
fit
the
poor
Res
pond
to
the
priv
ate
sect
or r
eque
st
for s
uppo
rt
Asse
ss th
e fe
asib
ility
of d
evel
opin
g ga
rmen
t and
info
rmat
ics
park
s C
ontin
ue to
revi
ew th
e fis
cal i
ncen
tives
fram
ewor
k to
sup
port
priv
ate
sect
or d
evel
opm
ent
Not
don
e.
Fisc
al E
nact
men
ts L
aw w
as p
asse
d, th
e In
vest
men
t Law
and
the
Smal
l Bus
ines
s La
w w
as e
nact
ed w
ith th
e vi
ew o
f enh
anci
ng th
e fis
cal i
ncen
tive
fram
ewor
k fo
r priv
ate
sect
or d
evel
opm
ent.
AN
NE
X A
: G
UYA
NA
: PO
LIC
Y M
ATR
IX F
OR
PO
VE
RTY
RE
DU
CTI
ON
ST
RA
TEG
Y –
IMPL
EM
EN
TAT
ION
YE
AR
200
4
Page
151
of 2
32
PO
LIC
Y
AR
EA
ST
RA
TE
GIE
S A
ND
ME
ASU
RE
S P
LA
NN
ED
AC
TIO
NS:
200
4 A
CH
IEV
EM
EN
TS/
OU
TC
OM
ES
2004
Pack
age
and
mar
ket
Guy
ana’
s va
st
min
eral
and
foss
il re
sour
ces
abro
ad
Dev
elop
IT b
usin
ess
Dev
elop
co
mpr
ehen
sive
st
rate
gy
for
eco-
tour
ism
dev
elop
men
t in
resp
onse
to
priv
ate
sect
or d
eman
ds
Enac
t ne
w
Min
ing
and
Fore
stry
La
ws
that
pr
ovid
e ad
equa
te
ince
ntiv
es to
inve
stor
s as
wel
l as
suffi
cien
t env
ironm
enta
l pro
tect
ion
Rea
ch s
ettle
men
t with
the
mai
n co
mm
unic
atio
n ca
rrier
on
mon
opol
y rig
hts
Con
tinue
agg
ress
ive
mar
ketin
g of
Guy
ana
as to
uris
t des
tinat
ion
Dev
elop
an
inte
grat
ed to
uris
m s
trate
gy
Con
tinue
reha
bilit
atio
n of
tour
ist i
nfra
stru
ctur
e C
ontin
ue u
pgra
ding
of h
inte
rland
airs
trips
The
Fore
stry
Law
s w
as s
ubst
antia
lly c
ompl
eted
. Th
e Am
ende
d Fo
rest
ry L
aw w
ill be
tabl
ed in
Par
liam
ent i
n 20
05. P
rogr
ess
was
m
ade
in
draf
ting
the
min
ing
law
. En
actm
ent
awai
ts
an
envi
ronm
enta
l im
pact
ass
essm
ent
to b
e in
clud
ed a
s pa
rt of
the
La
w.
Four
lar
ge i
nves
tors
beg
an p
roce
ss o
f es
tabl
ishi
ng p
roje
cts
in
min
ing
and
hosp
italit
y in
dust
ries.
A S
pani
sh f
irm jo
ined
CG
X to
ex
plor
e hy
drpc
arbo
ns.
Two
new
com
pani
es w
ere
esta
blis
hed
in
min
ing
sect
or a
nd B
aram
a ex
pand
ed o
pera
tions
. Th
ree
new
com
pani
es e
stab
lishe
d in
the
tel
ecom
mun
icat
ions
se
ctor
and
GT&
T ne
twor
k ex
pand
ed.
IT c
all-c
ente
rs s
uppo
rted
and
esta
blis
hed.
In
tern
atio
nal
adve
rtisi
ng o
f G
uyan
a’s
Eco-
Tour
ism
res
ourc
es i
s on
goin
g.
The
stra
tegy
has
bee
n de
velo
ped
Reh
abilit
atio
n of
cab
ins
and
othe
r lo
dgin
g fa
cilit
ies
in th
e in
terio
r ar
e on
goin
g.
Ong
oing
with
the
reha
bilit
atio
n of
3 h
inte
rland
airs
trips
Trad
ition
al
sect
or
Incr
ease
effi
cien
cy o
f the
sug
ar in
dust
ry
to
deal
w
ith
eros
ion
of
pref
eren
tial
mar
ket a
cces
s
Con
tinue
im
plem
entin
g po
licy
of w
age
rest
rain
t an
d em
ploy
men
t do
wns
izin
g.
Cap
G
UYS
UC
O
wag
e bi
ll,
incl
udin
g th
e An
nual
Pr
oduc
tivity
Ince
ntiv
e.
Con
clud
ed n
ew m
anag
emen
t con
tract
for G
UYS
UC
O
Sign
con
tract
for c
onst
ruct
ion
of th
e Sk
eldo
n Fa
ctor
y
Empl
oym
ent f
ell b
y 3.
3 pe
rcen
t dur
ing
2004
due
to la
bour
sh
eddi
ng. W
ages
and
the
API r
ose
in ta
ndem
with
infla
tion
N
ew m
anag
emen
t co
ntra
ct w
ith p
rofit
abilit
y ta
rget
s an
d in
cent
ives
was
con
clud
ed w
ith t
he p
rivat
e m
anag
emen
t fir
m.
AN
NE
X A
: G
UYA
NA
: PO
LIC
Y M
ATR
IX F
OR
PO
VE
RTY
RE
DU
CTI
ON
ST
RA
TEG
Y –
IMPL
EM
EN
TAT
ION
YE
AR
200
4
Page
152
of 2
32
PO
LIC
Y
AR
EA
ST
RA
TE
GIE
S A
ND
ME
ASU
RE
S P
LA
NN
ED
AC
TIO
NS:
200
4 A
CH
IEV
EM
EN
TS/
OU
TC
OM
ES
2004
Incr
ease
ef
ficie
ncy
of
agric
ultu
re
prod
uctio
n w
ith e
mph
asis
on
expo
rts
Incr
ease
the
effi
cien
cy o
f th
e m
inin
g se
ctor
Begi
n fie
ld c
ompo
nent
of f
acto
ry
Con
tinue
to
prov
ide
exte
nsio
n se
rvic
es,
espe
cial
ly t
o sm
all
land
ho
lder
s
Com
plet
e pr
ivat
izat
ion
of L
INM
INE
Elim
inat
e op
erat
iona
l sub
sidi
es to
LIN
MIN
E Be
gin
nego
tiatio
ns w
ith in
vest
ors
to d
evel
op a
n al
umin
a pl
ant
Red
raft
the
min
ing
law
C
ondu
ct a
n En
viro
nmen
tal I
mpa
ct A
sses
smen
t of t
he m
inin
g se
ctor
Con
tract
was
sig
ned
with
CN
TIC
, a C
hine
se c
onso
rtuim
to
cons
truct
the
Skel
don
suga
r and
cog
ener
atio
n fa
ctor
y.
The
field
com
pone
nt o
f th
e Sk
eldo
n su
gar
expa
nsio
n pr
ogra
m b
egan
in 2
004
with
ass
ista
nce
of C
DB
This
is o
ngoi
ng w
ith g
reat
er e
mph
asis
is b
eing
pla
ced
in
hint
erla
nd re
gion
s Li
nmin
e so
ld to
Cam
bior
in S
epte
mbe
r 200
4. N
ew o
wne
rs
inve
sted
ab
out
US$
25
milli
on
to
reha
bilit
ate
and
rest
ruct
ure
it an
d re
crui
ted
abou
t 800
wor
kers
. O
pera
tiona
l sub
sidi
es to
Lin
min
e el
imin
ated
in 2
004
Neg
otia
tions
with
RU
SAL
to d
evel
op a
n al
umin
a pl
ant h
ave
resu
lted
in t
he c
ompa
ny u
nder
taki
ng f
easi
bilit
y st
udie
s to
de
term
ine
the
viab
ility
of th
e op
erat
ions
M
inin
g La
w r
edra
fted
and
final
dra
ft be
ing
prep
ared
for
ga
zetti
ng in
200
5. M
ine
safe
ty a
nd h
ealth
regu
latio
ns w
ere
draf
ted
and
awai
t int
erag
ency
revi
ew.
Def
erre
d to
200
5 G
ood
gove
rnan
ce
Esta
blis
h th
e Pa
rliam
enta
ry C
omm
ittee
s on
N
atur
al
Res
ourc
es,
Econ
omic
Se
rvic
es,
Fore
ign
Rel
atio
ns a
nd S
ocia
l Se
rvic
es
Appo
int a
ll Pa
rliam
enta
ry C
omm
issi
ons
and
Sect
or C
omm
ittee
s Es
tabl
ish,
st
aff
and
equi
p se
cret
aria
ts
of
Com
mis
sion
s an
d C
omm
ittee
s
All
sect
or
com
mitt
ees
wer
e es
tabl
ishe
d.
12
Pa
rliam
enta
ry
Com
mis
sion
s ap
poin
ted
and
esta
blis
hed.
Fu
ndin
g ha
s be
en s
ecur
ed t
o st
aff
the
secr
etar
iats
and
the
co
mm
issi
ons.
AN
NE
X A
: G
UYA
NA
: PO
LIC
Y M
ATR
IX F
OR
PO
VE
RTY
RE
DU
CTI
ON
ST
RA
TEG
Y –
IMPL
EM
EN
TAT
ION
YE
AR
200
4
Page
153
of 2
32
PO
LIC
Y
AR
EA
ST
RA
TE
GIE
S A
ND
ME
ASU
RE
S P
LA
NN
ED
AC
TIO
NS:
200
4 A
CH
IEV
EM
EN
TS/
OU
TC
OM
ES
2004
Con
tinue
pol
itica
l dia
logu
e be
twee
n th
e tw
o m
ajor
pol
itica
l par
ties
Intro
duce
fa
r-rea
chin
g re
form
s in
th
e ju
dici
ary
and
law
enf
orce
men
t age
ncie
s G
rant
di
rect
re
pres
enta
tion
to
com
mun
ities
to
ch
oose
th
eir
own
lead
ers
Com
plet
e se
vera
l stu
dies
on
fiduc
iary
ove
rsig
ht a
nd im
plem
ent
the
prov
isio
ns/re
com
men
datio
ns
Con
tinue
to
crea
te c
limat
e fo
r po
litic
al d
ialo
gue
and
cons
ensu
s bu
ildin
g Im
plem
ent a
ll ag
reem
ents
reac
hed
thro
ugh
the
dial
ogue
pro
cess
Se
ek e
xter
nal a
ssis
tanc
e to
redu
ce b
ackl
og o
f cou
rt ca
ses
Con
tinue
to
revi
ew s
alar
y sc
ales
of
judg
es c
onsi
sten
t w
ith t
he
mac
roec
onom
ic fr
amew
ork
Take
st
eps
to
impl
emen
t th
e co
nstit
utio
nal
prov
isio
n of
lo
cal
gove
rnm
ent
elec
tora
l re
form
s to
stre
ngth
en t
he l
ocal
gov
ernm
ent
syst
em
Hol
d lo
cal g
over
nmen
t ele
ctio
ns in
200
4
Dra
ft re
port
of th
e Fi
duci
ary
Ove
rsig
ht S
tudi
es w
as c
ompl
eted
in
June
200
5. R
evie
w o
f the
doc
umen
t with
the
view
of d
evel
opin
g a
time-
boun
d ac
tion
plan
for i
mpl
emen
tatio
n w
ill be
com
plet
ed in
the
third
qua
rter o
f 200
5.
Two
draf
t re
ports
on
Parli
amen
tary
Ref
orm
s w
ere
com
plet
ed in
20
04. A
dopt
ion
of th
e re
ports
and
impl
emen
tatio
n of
som
e of
the
reco
mm
enda
tions
will
crea
te t
he f
ram
ewor
k fo
r an
im
prov
ed
clim
ate
for p
oliti
cal d
ialo
gue
and
cons
ensu
s bu
ildin
g
Agre
emen
ts re
ache
d in
pas
t are
bei
ng im
plem
ente
d 40
00 a
band
oned
bac
klog
ged
case
s el
imin
ated
from
the
regi
ster
Th
e sa
lary
sca
les
of ju
dges
con
tinue
to b
e un
der r
evie
w
Join
t Tas
k Fo
rce
on L
ocal
Gov
ernm
ent r
efor
m c
ontin
ued
to m
eet
to a
ddre
ss lo
cal g
over
nmen
t ele
ctio
n sy
stem
, fis
cal t
rans
fers
and
th
e dr
aftin
g of
loca
l gov
ernm
ent l
aw.
Def
erre
d
Educ
atio
n
Red
uce
repe
titio
n ra
tes
in
prim
ary
scho
ols
and
incr
ease
en
rolm
ent
in
seco
ndar
y sc
hool
s
Con
tinue
with
pol
icie
s to
redu
ce re
petit
ion
and
drop
out
rate
s C
ontin
ue w
ith p
olic
ies
to in
crea
se s
econ
dary
sch
ool e
nrol
men
t rat
ios
Seco
ndar
y re
petit
ion
rate
12.
4 in
200
4 co
mpa
red
to 1
2.5
in 2
003.
R
epet
ition
rate
s in
hin
terla
nd c
omm
uniti
es c
ontin
ue to
be
high
with
m
ales
ave
ragi
ng 1
0 pe
rcen
t and
fem
ales
8 p
erce
nt. D
rop-
out r
ates
at
prim
ary
show
ed a
mod
est d
eclin
e of
1 p
erce
nt.
Polic
ies
impl
emen
ted
to i
ncre
ase
seco
ndar
y en
rollm
ent
ratio
s in
clud
ed (
i) re
duct
ion
in th
e nu
mbe
r of
Com
mun
ity H
igh
Scho
ols
by 1
2; (i
i) re
duct
ion
in th
e nu
mbe
r of p
rimar
y to
ps b
y 56
; and
(iii)
in
crea
se i
n th
e nu
mbe
r of
Gen
eral
Sec
onda
ry S
choo
ls b
y 15
.

AN
NE
X A
: G
UYA
NA
: PO
LIC
Y M
ATR
IX F
OR
PO
VE
RTY
RE
DU
CTI
ON
ST
RA
TEG
Y –
IMPL
EM
EN
TAT
ION
YE
AR
200
4
Page
154
of 2
32
PO
LIC
Y
AR
EA
ST
RA
TE
GIE
S A
ND
ME
ASU
RE
S P
LA
NN
ED
AC
TIO
NS:
200
4 A
CH
IEV
EM
EN
TS/
OU
TC
OM
ES
2004
Red
uce
over
crow
ding
in s
choo
ls
Trai
n, re
crui
t and
reta
in tr
aine
d te
ache
rs
and
soci
al w
orke
rs
Reh
abilit
ate
55 p
rimar
y an
d se
cond
ary
scho
ols
to i
mpr
ove
acce
ss
espe
cial
ly to
the
poor
, and
ove
rcro
wdi
ng
Com
plet
e an
d im
plem
ent G
IS/S
ME
Con
tinue
to tr
ain
teac
hers
thro
ugh
pre-
serv
ice
and
in-s
ervi
ce tr
aini
ng,
with
sp
ecia
l em
phas
is
on
Engl
ish,
M
athe
mat
ics,
Sc
ienc
e an
d R
eadi
ng
Con
tinue
pro
gram
me
to e
xpan
d pl
acem
ent o
f tea
cher
s in
hin
terla
nd
com
mun
ities
Ta
ke m
easu
res
to re
tain
trai
ned
teac
hers
C
omm
ence
trai
ning
of t
each
ers
in H
FLE
Con
tinue
impl
emen
ting
revi
sed
curri
culu
m fo
r Tea
cher
Tra
inin
g Es
tabl
ish
Lear
ning
Cen
tres
to f
acilit
ate
train
ing
of t
each
ers
usin
g di
stan
ce e
duca
tion
met
hods
Be
gin
syst
em o
f ong
oing
sch
ool-b
ased
ass
essm
ent i
n lit
erac
y
Thes
e po
licie
s re
sulte
d in
sec
onda
ry e
nrol
lmen
t rat
io o
f 73
perc
ent
com
pare
d w
ith 6
4 pe
rcen
t in
2003
O
ver
115
prim
ary
and
seco
ndar
y sc
hool
s w
ere
reha
bilit
ated
in
2004
at c
ost o
f mor
e th
an U
S$3.
25 m
. Ph
ase
1 of
the
GIS
/SM
E, t
hat
is,
colle
ctio
n of
ent
ry d
ata
and
train
ing
of c
entra
l Min
istry
sta
ff w
as c
ompl
eted
In
200
4, 4
78 te
ache
rs g
radu
ated
from
pre
-ser
vice
and
in-s
ervi
ce
train
ing.
The
sm
all
num
ber
of g
radu
ates
is
attri
buta
ble
to t
he
chan
ge in
pro
gram
com
plet
ion
from
2 y
ears
to 3
yea
rs.
Rem
ote
Area
In
cent
ive
(RAI
) ha
s be
en
paid
in
20
05,
with
re
troac
tive
paym
ents
from
Oct
ober
200
4.
This
refe
rs p
rimar
ily to
the
RAI
. Oth
er in
cent
ives
hav
e in
clud
ed th
e pa
ymen
t of C
XC fe
es fo
r tea
cher
s’ c
hild
ren.
Tr
aini
ng o
f tea
cher
s in
HFL
E w
as p
artia
lly im
plem
ente
d be
caus
e of
the
rele
ase
of fu
nds
alth
ough
trai
ning
beg
an fo
r tea
cher
s at
the
prim
ary
leve
ls (G
rade
s 1&
2)
NC
ERD
dev
elop
ed li
tera
cy a
nd n
umer
acy
stan
dard
s fo
r Nur
sery
1
to G
rade
2 p
rimar
y. C
urric
ulum
gui
des
wer
e al
so d
evel
oped
for
Vi
sual
Gui
des
Arts
(Gra
des
1 to
11)
and
Prim
ary
Mus
ic (G
rade
s 1
to 6
) Le
arni
ng R
esou
rce
Cen
ters
wer
e es
tabl
ishe
d in
Reg
ions
1 a
nd 9
w
ith G
BET
assi
stan
ce. 9
6 te
ache
rs e
nrol
led
and
bein
g tra
ined
. In
200
4, a
sur
vey
of 8
of t
he 1
1 sc
hool
dis
trict
s co
llect
ed b
asel
ine
data
on
th
e qu
ality
of
ed
ucat
ion,
in
clud
ing
prof
essi
onal
an
d ac
adem
ic q
ualif
icat
ions
of
staf
f, av
aila
bilit
y of
lea
rnin
g/te
achi
ng
mat
eria
ls,
man
ager
ial
prac
tices
an
d re
latio
nshi
ps
with
th
e co
mm
unity
AN
NE
X A
: G
UYA
NA
: PO
LIC
Y M
ATR
IX F
OR
PO
VE
RTY
RE
DU
CTI
ON
ST
RA
TEG
Y –
IMPL
EM
EN
TAT
ION
YE
AR
200
4
Page
155
of 2
32
PO
LIC
Y
AR
EA
ST
RA
TE
GIE
S A
ND
ME
ASU
RE
S P
LA
NN
ED
AC
TIO
NS:
200
4 A
CH
IEV
EM
EN
TS/
OU
TC
OM
ES
2004
Impr
ove
aptit
ude
in M
athe
mat
ics
and
Engl
ish
Lang
uage
Pr
ovid
e re
quire
d te
xtbo
oks
to s
tude
nts
and
impl
emen
t cos
t rec
over
y Es
tabl
ish
a sc
hool
feed
ing
prog
ram
me
Esta
blis
h sc
hool
tran
spor
tatio
n sy
stem
Pr
omot
e st
akeh
olde
r par
ticip
atio
n at
the
scho
ol le
vel
Re-
orie
nt a
nd tr
ain
teac
hers
to u
se n
ew c
urric
ula
met
hodo
logi
es
Impl
emen
t na
tiona
l prim
ary
scho
ol t
imet
able
, w
ith s
peci
al e
mph
asis
on
Mat
hem
atic
s an
d R
eadi
ng
Begi
n lit
erac
y pr
ogra
mm
e w
ith a
focu
s on
HIV
/AID
S fo
r out
-of-s
choo
l yo
uth
Re-
com
men
ce p
rocu
rem
ent o
f tex
tboo
ks
Impl
emen
t re
com
men
datio
ns o
f th
e di
agno
stic
stu
dy o
f th
e sc
hool
fe
edin
g pr
ogra
mm
e D
efer
red
due
to th
e la
ck o
f res
ourc
es
Stre
ngth
en
Scho
ol
Boar
ds
to e
ncou
rage
gr
eate
r in
volv
emen
t of
pa
rent
s an
d Pr
ovid
e tra
inin
g fo
r PTA
s In
crea
se p
artic
ipat
ion
of c
omm
unity
mem
bers
in
scho
ol d
ecis
ion
mak
ing
Impl
emen
tatio
n of
the
Scho
ol Im
prov
emen
t Pro
gram
s (S
IPs)
with
im
prov
ed d
eliv
ery
of c
urric
ulum
is
slow
er t
han
antic
ipat
ed w
ith
SIPs
pre
pare
d fo
r onl
y 50
% o
f sch
ools
. A
met
hodo
logy
to im
prov
e th
e te
achi
ng o
f rea
ding
was
dev
elop
ed
and
the
first
set
of
Mas
ters
tra
iner
s an
d cl
uste
r ad
viso
rs w
ere
empl
oyed
and
trai
ned
unde
r the
BEA
MS
proj
ect
The
Lite
racy
and
HIV
/AID
S pr
ojec
t ha
s be
gun
in a
t le
ast
one
regi
on
Proc
urem
ent
of t
extb
ooks
beg
an in
200
4 w
ith a
ssis
tanc
e of
the
W
orld
Ban
k EF
A-FT
I C
ompl
eted
stu
dy o
n sc
hool
feed
ing
prog
ram
me
but f
unds
for
the
hot
mea
l pro
gram
me
unde
r EF
A-FT
I ar
e no
t av
aila
ble
until
yea
r tw
o. T
he M
inis
try is
par
ticip
atin
g in
an
inno
vativ
e pr
ogra
mm
e in
so
me
hint
erla
nd c
omm
uniti
es t
o pr
ovid
e ch
ildre
n w
ith a
loc
ally
pr
oduc
ed s
nack
. D
efer
red
due
to th
e la
ck o
f res
ourc
es
Abou
t 80
perc
ent o
f sch
ools
hav
e PT
As, w
hich
mee
t at l
east
onc
e a
year
. Th
is is
und
erw
ay w
ith n
early
200
sch
ools
ben
efiti
ng fr
om tr
aini
ng
to p
rodu
ce s
choo
l im
prov
emen
t pla
ns.
Mos
t re
gion
s ha
ve R
egio
nal E
duca
tion
Com
mitt
ees,
whi
ch m
eet
regu
larly
and
mon
itor e
duca
tion
activ
ities
in th
e re
gion
O
AS i
s su
ppor
ting
the
proj
ect
“ M
eetin
g Sp
ecia
l N
eeds
in
the
AN
NE
X A
: G
UYA
NA
: PO
LIC
Y M
ATR
IX F
OR
PO
VE
RTY
RE
DU
CTI
ON
ST
RA
TEG
Y –
IMPL
EM
EN
TAT
ION
YE
AR
200
4
Page
156
of 2
32
PO
LIC
Y
AR
EA
ST
RA
TE
GIE
S A
ND
ME
ASU
RE
S P
LA
NN
ED
AC
TIO
NS:
200
4 A
CH
IEV
EM
EN
TS/
OU
TC
OM
ES
2004
Mai
nstre
am c
hild
ren
with
spe
cial
nee
ds
Stre
ngth
en
man
ager
ial
and
orga
niza
tiona
l ca
paci
ty
of
educ
atio
n se
ctor
Dev
elop
spe
cial
edu
catio
n m
odul
e fo
r tea
cher
trai
nees
Be
gin
scre
enin
g ex
erci
se f
or c
hild
ren
with
spe
cial
nee
ds i
n tw
o re
gion
s D
evel
op p
ropo
sals
to s
treng
then
the
Pers
onne
l, Fi
nanc
e an
d M
anag
emen
t Inf
orm
atio
n U
nits
of t
he M
oE
Begi
n tra
inin
g pr
ogra
mm
es d
urin
g th
e la
st q
uarte
r of 2
004
Pilo
t te
st
prel
imin
ary
vers
ions
of
ac
coun
ting,
re
sour
ce
trans
fer,
finan
cial
rep
ortin
g an
d au
ditin
g pr
oced
ures
in
six
scho
ols
in t
wo
Reg
ions
Cla
ssro
om” a
nd h
as e
quip
ped
a sp
ecia
l res
ourc
e un
it at
the
Cyr
il Po
tter C
olle
ge o
f Edu
catio
n to
trai
n te
ache
rs in
ass
istin
g ph
ysic
ally
ch
alle
nged
chi
ldre
n Th
is h
as n
ot b
een
impl
emen
ted
Spec
ialis
ts u
nder
the
BEA
MS
proj
ects
hav
e be
en p
lace
d in
key
un
its o
f the
MO
E to
reco
mm
end
refo
rms
in v
ario
us d
epar
tmen
ts to
st
reng
then
per
sonn
el, f
inan
ce a
nd M
IS
This
has
not
bee
n im
plem
ente
d bu
t pla
ns fo
r th
e pr
ogra
mm
e ar
e w
ell a
dvan
ced.
Th
is h
as n
ot b
een
impl
emen
ted
Hea
lth
Expa
nd p
reve
ntat
ive
care
and
red
uce
the
inci
denc
e of
th
e ot
her
occu
rring
di
seas
es
Dev
elop
an
up-to
-dat
e ST
I, H
IV/A
IDS
data
base
Con
tinue
with
im
mun
isat
ion
prog
ram
mes
esp
ecia
lly i
n hi
nter
land
co
mm
uniti
es
Impl
emen
t mea
sure
s to
redu
ce in
fant
and
mat
erna
l mor
talit
y ra
tes
Intro
duce
a n
utrit
ion
prog
ram
me
bene
fitin
g w
omen
and
chi
ldre
n in
po
or c
omm
uniti
es,
in p
artic
ular
stre
ngth
en t
he A
dole
scen
t H
ealth
Pr
ogra
mm
e Im
plem
ent
reco
mm
enda
tions
ar
isin
g ou
t of
de
liber
atio
ns
of
Pres
iden
tial C
omm
issi
on o
n H
IV/A
IDS
Imm
unis
atio
n pr
ogra
mm
es f
or c
hild
ren
espe
cial
ly i
n hi
nter
land
co
mm
uniti
es a
re o
ngoi
ng
Rec
ruit
and
train
mor
e nu
rses
and
mid
wiv
es a
nd i
mpr
ove
pre-
nata
l and
pos
t-nat
al c
are.
Th
e N
utrit
ion
prog
ram
me
fund
ed b
y th
e ID
B is
ong
oing
with
the
pr
ovis
ion
of a
ssis
tanc
e an
d fo
od s
uppl
emen
ts to
pre
gnan
t wom
en
and
youn
g ch
ildre
n Th
e Pr
esid
entia
l Com
mis
sion
on
HIV
/AID
S ha
s be
en m
eetin
g as
a
coor
dina
ting
body
fo
r th
e w
ork
of
line
min
istri
es
and
dono
r ag
enci
es.
Wor
k pr
ogra
mm
es h
ave
been
dev
elop
ed f
or e
ach

AN
NE
X A
: G
UYA
NA
: PO
LIC
Y M
ATR
IX F
OR
PO
VE
RTY
RE
DU
CTI
ON
ST
RA
TEG
Y –
IMPL
EM
EN
TAT
ION
YE
AR
200
4
Page
157
of 2
32
PO
LIC
Y
AR
EA
ST
RA
TE
GIE
S A
ND
ME
ASU
RE
S P
LA
NN
ED
AC
TIO
NS:
200
4 A
CH
IEV
EM
EN
TS/
OU
TC
OM
ES
2004
Prov
ide
med
ical
ca
re
to
HIV
/AID
S pa
tient
s D
evel
op a
nd im
plem
ent s
usta
ined
pub
lic
awar
enes
s pr
ogra
mm
es
on
STI,
HIV
/AID
S Im
prov
ing
med
ical
fa
cilit
ies
and
cond
ition
s of
se
rvic
e to
m
edic
al
Expa
nd p
ilot s
ites
to te
st m
othe
r to
child
HIV
/AID
S pr
even
tion
in 1
0 ad
ditio
nal c
ente
rs
Expa
nd u
se o
f ant
iretro
vira
l the
rapy
to h
ealth
cen
ters
In
trodu
ce ro
utin
e us
e of
Rap
id K
its fo
r HIV
/AID
S te
stin
g at
all
heal
th c
entre
s in
200
4 Be
gin
cons
truct
ion
of H
IV/A
IDS
labo
rato
ry w
hich
will
also
ca
ter f
or o
ther
dis
ease
s D
evel
op in
stitu
tiona
l arra
ngem
ents
for p
rogr
amm
e m
onito
ring
and
eval
uatio
n of
the
impa
ct o
f HIV
/AID
S pr
ogra
mm
es
Stre
ngth
en
capa
city
of
N
GO
s an
d C
BOs
to
resp
ond
to
HIV
/AID
S C
ontin
ue to
exp
and
and
deep
en th
e pu
blic
aw
aren
ess
prog
ram
me
on
HIV
/AID
S pr
even
tion
parti
cipa
ting
line
min
istry
and
app
rove
d by
the
Com
mis
sion
. The
C
omm
issi
on i
s ex
pect
ed t
o m
eet
agai
n by
the
thi
rd q
uarte
r of
20
05.
Pilo
t si
tes
expa
nded
to
10 a
dditi
onal
cen
ters
thr
ough
out
the
10
adm
inis
trativ
e re
gion
s
Cov
erag
e of
the
pro
visi
on o
f an
ti-re
trovi
ral
drug
s es
peci
ally
to
preg
nant
wom
en b
eing
exp
ande
d to
incl
ude
mor
e pe
ople
R
apid
kits
for
HIV
/AID
s te
stin
g w
ere
intro
duce
d at
all
heal
th
cent
ers.
D
efer
red
to 2
005
Wor
k ha
s be
gun
and
the
aim
is
to h
ave
a ha
rmon
ized
lis
t of
m
easu
rabl
e in
dica
tors
. The
Min
istry
is in
the
proc
ess
of e
ngag
ing
a lo
ng t
erm
con
sulta
nt t
o de
velo
p m
onito
ring
and
eval
uatio
n ca
paci
ty fo
r HIV
/AID
S an
d ot
her h
ealth
pro
gram
mes
Th
e M
inis
try o
f Hea
lth h
as h
ired
a ci
vil s
ocie
ty c
oord
inat
or a
nd 1
1 C
BOS
have
bee
n id
entif
ied
for
fund
ing
unde
r th
e W
orld
Ban
k pr
ogra
mm
e Pu
blic
aw
aren
ess
prog
ram
me
thro
ugh
prin
t and
ele
ctro
nic
med
ia
cont
inue
Im
plem
enta
tion
of t
he p
rogr
amm
e is
ong
oing
. C
ompl
eted
dra
ft m
edic
al fa
cilit
ies
licen
sing
Bill.
C
ompl
eted
the
draf
t Allie
d H
ealth
Pr
ofes
sion
s Bi
ll to
impr
ove
regu
latio
n.
2 C
D4
FAC
S m
achi
ne
and
spec
ializ
ed
TB
and
STI
test
ing

AN
NE
X A
: G
UYA
NA
: PO
LIC
Y M
ATR
IX F
OR
PO
VE
RTY
RE
DU
CTI
ON
ST
RA
TEG
Y –
IMPL
EM
EN
TAT
ION
YE
AR
200
4
Page
158
of 2
32
PO
LIC
Y
AR
EA
ST
RA
TE
GIE
S A
ND
ME
ASU
RE
S P
LA
NN
ED
AC
TIO
NS:
200
4 A
CH
IEV
EM
EN
TS/
OU
TC
OM
ES
2004
pers
onne
l In
trodu
ce
mar
ket
prin
cipl
es
in
the
proc
urem
ent
of
drug
s an
d m
edic
al
supp
lies
Rec
ruit
and
train
w
orke
rs
to
prov
ide
coun
selin
g in
com
mun
ities
Ex
pand
Pr
ofes
sion
al
Dev
elop
men
t O
ppor
tuni
ties
for m
edic
al p
erso
nnel
Com
plet
e H
ealth
Fac
ilitie
s R
atio
nalis
atio
n Pr
ogra
mm
e an
d be
gin
its
impl
emen
tatio
n
Com
plet
e re
cons
truct
ion
of th
e N
ew A
mst
erda
m H
ospi
tal
Take
mea
sure
s to
reta
in m
edic
al p
erso
nnel
Im
prov
emen
t of
reg
iona
l he
alth
ser
vice
s th
roug
h th
e fo
rmat
ion
of
Reg
iona
l Hea
lth A
utho
ritie
s Ar
ticul
ate
a m
enta
l he
alth
po
licy
and
deve
lopm
ent
of
a w
ork
prog
ram
me
Esta
blis
h M
ater
ials
Man
agem
ent
Uni
t to
proc
ure
drug
s an
d m
edic
al
supp
lies
Rec
ruit
and
train
30
wor
kers
to p
rovi
de c
ouns
elin
g in
com
mun
ities
C
ontin
ue tr
aini
ng o
f hea
lth p
erso
nnel
labo
rato
ry u
nit a
dded
at G
PHC
cen
tral l
abor
ator
y.
Acqu
ired
new
hem
atol
ogy
anal
yzer
for t
estin
g of
CBC
S.
New
labo
rato
ry a
nd e
quip
men
t an
d x
ray
mac
hine
s in
stal
led
at
New
Am
ster
dam
and
Ske
ldon
hos
pita
ls.
New
Am
ster
dam
Hos
pita
l w
as c
ompl
eted
and
com
mis
sion
ed i
n 20
04
Mea
sure
s to
ret
ain
med
ical
per
sonn
el a
re o
ngoi
ng a
nd in
cent
ive
stru
ctur
es h
ave
been
dev
elop
ed f
or n
ursi
ng t
rain
ing
and
for
deal
ing
with
iden
tifie
d he
alth
bur
dens
R
egio
nal H
ealth
Aut
horit
ies
Bill
to e
stab
lish
Auth
oriti
es p
asse
d in
20
04. T
he M
inis
try o
f Hea
lth B
ill w
as a
lso
final
ized
in 2
005.
Th
e m
enta
l he
alth
po
licy
has
been
dr
afte
d an
d th
e w
ork
prog
ram
me
is b
eing
dev
elop
ed
Mat
eria
ls M
anag
emen
t Uni
t was
est
ablis
hed
with
a c
ompu
teriz
ed
syst
em
to
proc
ure
med
ical
su
pplie
s.
Stor
age
faci
litie
s w
ere
impr
oved
thro
ugh
the
acqu
isiti
on o
f tw
o ne
w re
frige
rato
rs a
nd th
e co
nstru
ctio
n of
the
firs
t ph
ase
of a
ref
riger
ated
vac
cine
sto
rage
bo
nd
30
pers
ons
recr
uite
d an
d tra
ined
to
pr
ovid
e co
unse
ling
in
com
mun
ities
. 25
stu
dent
s se
nt o
n m
edic
al s
chol
arsh
ips
to C
uba;
Neg
otia
tions
ad
vanc
ed fo
r joi
nt p
ostg
radu
ate
prog
ram
in S
urge
ry w
ith C
anad
ian
coun
terp
arts
; C
ompl
eted
neg
otia
tions
for
new
pos
t gr
adua
te
prog
ram
me
for n
urse
s to
com
men
ce 2
005
in N
ew A
mst
erda
m.
The
Min
istry
of H
ealth
(i)
inte
nsifi
ed tr
aini
ng o
f hea
lth p
erso
nnel
;

AN
NE
X A
: G
UYA
NA
: PO
LIC
Y M
ATR
IX F
OR
PO
VE
RTY
RE
DU
CTI
ON
ST
RA
TEG
Y –
IMPL
EM
EN
TAT
ION
YE
AR
200
4
Page
159
of 2
32
PO
LIC
Y
AR
EA
ST
RA
TE
GIE
S A
ND
ME
ASU
RE
S P
LA
NN
ED
AC
TIO
NS:
200
4 A
CH
IEV
EM
EN
TS/
OU
TC
OM
ES
2004
(ii)
reta
ined
sta
ff by
cre
atin
g m
ore
empo
wer
ing
envi
ronm
ent;
(iii)
recr
uite
d pe
rson
nel
from
ab
road
; an
d (iv
) en
tere
d in
to
join
t te
chni
cal p
rogr
amm
es w
ith o
ther
pro
gram
mes
Wat
er
Cre
ate
Guy
ana
Wat
er I
nc t
o re
plac
e G
uyw
a an
d G
SWC
Ex
pand
wat
er s
ervi
ces
to r
ural
are
as,
espe
cial
ly in
terio
r loc
atio
ns
Mai
ntai
n pr
icin
g an
d su
bsid
y ag
reem
ents
to a
chie
ve fu
ll co
st re
cove
ry
Reh
abilit
ate
treat
men
t sys
tem
s an
d in
stal
l wat
er m
eter
s R
ehab
ilitat
e w
ater
fa
cilit
ies,
in
clud
ing
expa
nsio
n of
di
strib
utio
n pi
pelin
es
Com
plet
e re
cons
truct
ion
of L
inde
n W
ater
Tre
atm
ent P
lant
New
com
pany
cre
ated
. Pric
ing
and
subs
idy
agre
emen
ts a
re b
eing
ob
serv
ed. C
ompl
eted
revi
ew o
f Geo
rget
own
Wat
er a
nd S
ewer
age
Mas
ter P
lan.
C
omm
ence
d th
e LB
I m
eter
ing
and
Geo
rget
own
Prog
ram
me
11
proj
ects
W
ater
fa
cilit
ies
incl
udin
g ex
pans
ion
of
dist
ribut
ion
lines
w
as
unde
rtake
n in
Reg
ions
1,
2, 3
, 4,
5,
6 an
d 10
ben
efiti
ng 4
0,00
0 pe
rson
s H
inte
rland
Stra
tegy
app
rove
d.
Dep
artm
ent
esta
blis
hed
to m
aint
ain
exis
ting
wat
er d
istri
butio
n sy
stem
s in
sm
all t
owns
and
com
mun
ities
, pro
mot
e th
e H
inte
rland
st
rate
gy, a
nd s
uppo
rt co
mm
unity
invo
lvem
ent i
n th
e m
anag
emen
t, op
erat
ion
and
mai
nten
ance
of t
he d
istri
butio
n sy
stem
Ph
ase
1 an
d 2
of T
he L
inde
n R
efur
bish
men
t Pr
ojec
t co
mpl
eted
be
nefit
ing
6,00
0 pe
rson
s
Hou
sing
St
reng
then
sh
elte
r an
d la
nd
mar
kets
an
d fa
cilit
ate
pote
ntia
l hom
eow
ners
Ac
cele
rate
squ
atte
r and
regu
laris
atio
n
Com
plet
e in
frast
ruct
ure
for 1
4,50
0 lo
ts in
hou
sing
sch
emes
; Al
loca
te 4
,000
low
inco
me
lots
; Pr
oces
s 16
,000
title
s C
ompl
ete
infra
stru
ctur
e fo
r 6,5
00 lo
ts in
squ
atte
r set
tlem
ents
23,0
00 lo
w in
com
e lo
ts s
ervi
ced;
491
6 ho
usel
ots
wer
e di
strib
uted
5,
003
land
/hou
se ti
tles
wer
e di
strib
uted
7,
524
lots
ser
vice
d in
squ
atte
r set
tlem
ents
Pe
nal
code
s on
squ
attin
g an
d le
gal
com
plia
nce
revi
ewed
by
cons
ulta
ncy
unde
r th
e Fr
amew
ork
for
Gov
ernm
ent
resp
onse
to
Squa
tting
(FG
RS)
Es
tabl
ishe
d 18
new
CD
Cs
and
revi
taliz
ed o
ther
s to
ass
ist i
n th
e

AN
NE
X A
: G
UYA
NA
: PO
LIC
Y M
ATR
IX F
OR
PO
VE
RTY
RE
DU
CTI
ON
ST
RA
TEG
Y –
IMPL
EM
EN
TAT
ION
YE
AR
200
4
Page
160
of 2
32
PO
LIC
Y
AR
EA
ST
RA
TE
GIE
S A
ND
ME
ASU
RE
S P
LA
NN
ED
AC
TIO
NS:
200
4 A
CH
IEV
EM
EN
TS/
OU
TC
OM
ES
2004
Rat
iona
lise
the
dive
stitu
re o
f pub
lic la
nd
for s
ound
resi
dent
ial s
ettle
men
t
Com
plet
e da
taba
se a
nd m
oder
nise
man
agem
ent
stru
ctur
e to
bet
ter
serv
e th
e pu
blic
, esp
ecia
lly th
e po
or
Con
tinue
util
isat
ion
of L
and
Reg
istry
Sys
tem
regu
lariz
atio
n pr
oces
s.
Com
pute
rizat
ion
of re
cord
s in
the
Land
Man
agem
ent D
epar
tmen
t co
mpl
eted
to im
prov
e tra
ckin
g an
d tra
nspa
renc
y D
esig
n of
layo
uts
and
subd
ivis
ion
plan
s fo
r min
imum
sta
ndar
ds fo
r ho
usin
g de
velo
pmen
t was
com
plet
ed
Com
men
ced
verif
icat
ion
exer
cise
to
up
date
ho
useh
old
data
in
vent
ory
prog
ram
m
Dire
ctly
targ
etin
g th
e po
or
Des
ign
a so
cial
saf
ety
net p
rogr
amm
e Se
cure
add
ition
al f
inan
cing
for
SIM
AP
and
BNTF
R
evie
w
actu
aria
l st
udie
s of
th
e IL
O
Det
erm
ine
optio
ns o
f in
crea
sing
soc
ial
secu
rity
bene
fits
and
prov
ide
reco
mm
enda
tions
for r
efor
min
g th
e N
IS
Stre
ngth
en
sect
or
min
istri
es
and
agen
cies
to
ca
rry
out
PRSP
im
plem
enta
tion
Stre
ngth
en th
e ca
paci
ty o
f the
MLH
SSS
thro
ugh
impr
oved
sys
tem
s,
proc
esse
s an
d tra
inin
g Im
plem
ent S
IMAP
and
BN
TF p
rogr
amm
es
Incr
ease
con
tribu
tion
rate
s to
mai
ntai
n th
e vi
abilit
y of
the
NIS
C
ontin
ue
to
stre
ngth
en
the
capa
city
of
m
inis
tries
/age
ncie
s to
im
plem
ent a
nd m
onito
r PR
SP
MIS
sys
tem
was
inst
alle
d at
the
Min
istry
, tra
inin
g w
as p
rovi
ded
to
staf
f; th
ree
stud
ies
wer
e in
itiat
ed to
furth
er im
prov
e an
d en
hanc
e th
e M
inis
try s
ervi
ce d
eliv
ery
to th
e pu
blic
.
SIM
AP I
II an
d BN
TF p
roje
cts
are
unde
r im
plem
enta
tion.
125
SI
MAP
pro
ject
s w
ere
appr
oved
and
47
cont
ract
ed.
38 B
NTF
pr
ojec
ts
com
plet
ed
bene
fitin
g 30
00
pers
ons
in
Reg
ions
1,
2,3,
4,5,
6, a
nd 1
0.
Com
plet
ed R
apid
Pov
erty
and
Nee
ds A
sses
smen
t (R
PNA)
in
prev
ious
ly u
nser
ved
area
s.
SIM
AP s
igne
d M
OU
with
GPL
for 7
pro
ject
s.
NIS
con
tribu
tion
was
rais
ed b
y 5
perc
ent
Five
sta
ff an
d a
coor
dina
tor
wer
e re
crui
ted
for
the
M&E
uni
t and
th
ree
staf
f re
crui
ted
to f
orm
the
nuc
leus
of
the
soci
al s
tatis
tics
proj
ect
that
is
desi
gned
to
stre
ngth
en t
he c
apac
ity o
f th
e lin
e m
inis
tries
to m
onito
r PR
SP o
utco
mes
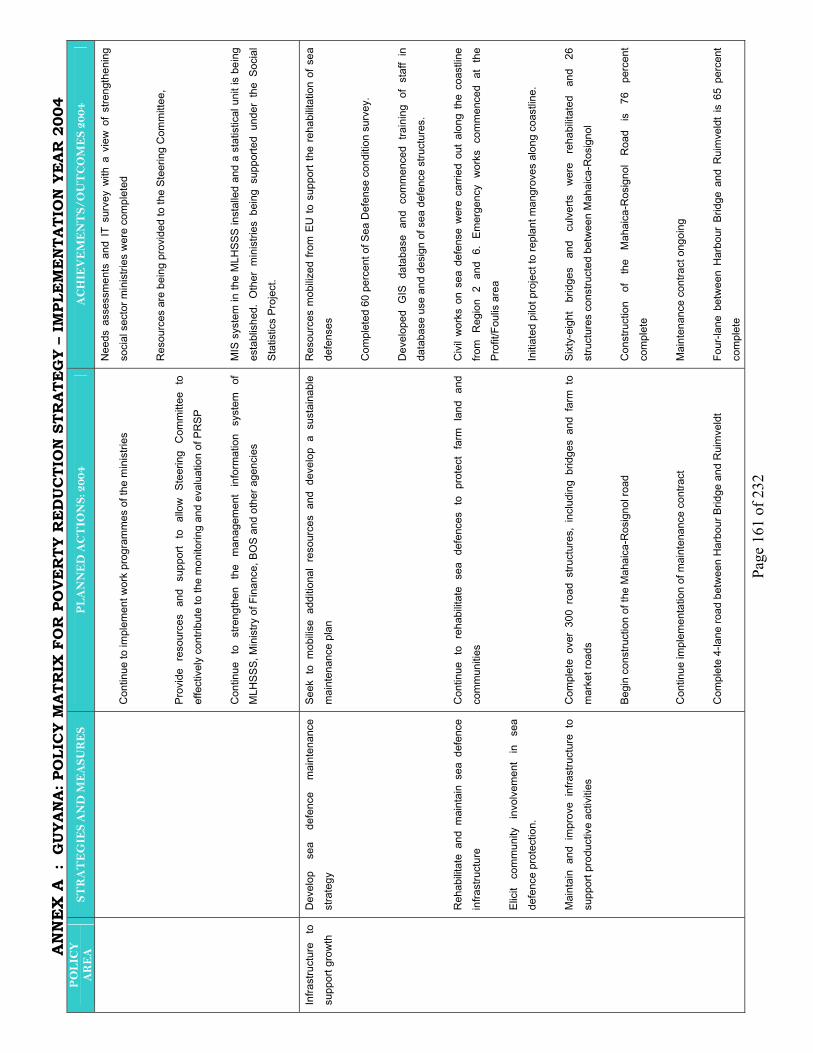
AN
NE
X A
: G
UYA
NA
: PO
LIC
Y M
ATR
IX F
OR
PO
VE
RTY
RE
DU
CTI
ON
ST
RA
TEG
Y –
IMPL
EM
EN
TAT
ION
YE
AR
200
4
Page
161
of 2
32
PO
LIC
Y
AR
EA
ST
RA
TE
GIE
S A
ND
ME
ASU
RE
S P
LA
NN
ED
AC
TIO
NS:
200
4 A
CH
IEV
EM
EN
TS/
OU
TC
OM
ES
2004
Con
tinue
to im
plem
ent w
ork
prog
ram
mes
of t
he m
inis
tries
Pr
ovid
e re
sour
ces
and
supp
ort
to
allo
w
Stee
ring
Com
mitt
ee
to
effe
ctiv
ely
cont
ribut
e to
the
mon
itorin
g an
d ev
alua
tion
of P
RSP
C
ontin
ue
to
stre
ngth
en
the
man
agem
ent
info
rmat
ion
syst
em
of
MLH
SSS,
Min
istry
of F
inan
ce, B
OS
and
othe
r age
ncie
s
Nee
ds a
sses
smen
ts a
nd I
T su
rvey
with
a v
iew
of
stre
ngth
enin
g so
cial
sec
tor m
inis
tries
wer
e co
mpl
eted
R
esou
rces
are
bei
ng p
rovi
ded
to th
e St
eerin
g C
omm
ittee
, M
IS s
yste
m in
the
MLH
SSS
inst
alle
d an
d a
stat
istic
al u
nit i
s be
ing
esta
blis
hed.
Oth
er m
inis
tries
bei
ng s
uppo
rted
unde
r th
e So
cial
St
atis
tics
Proj
ect.
Infra
stru
ctur
e to
su
ppor
t gro
wth
D
evel
op
sea
defe
nce
mai
nten
ance
st
rate
gy
Reh
abilit
ate
and
mai
ntai
n se
a de
fenc
e in
frast
ruct
ure
Elic
it co
mm
unity
in
volv
emen
t in
se
a de
fenc
e pr
otec
tion.
M
aint
ain
and
impr
ove
infra
stru
ctur
e to
su
ppor
t pro
duct
ive
activ
ities
Seek
to
mob
ilise
addi
tiona
l re
sour
ces
and
deve
lop
a su
stai
nabl
e m
aint
enan
ce p
lan
Con
tinue
to
reha
bilit
ate
sea
defe
nces
to
prot
ect
farm
lan
d an
d co
mm
uniti
es
Com
plet
e ov
er 3
00 r
oad
stru
ctur
es,
incl
udin
g br
idge
s an
d fa
rm t
o m
arke
t roa
ds
Begi
n co
nstru
ctio
n of
the
Mah
aica
-Ros
igno
l roa
d C
ontin
ue im
plem
enta
tion
of m
aint
enan
ce c
ontra
ct
Com
plet
e 4-
lane
road
bet
wee
n H
arbo
ur B
ridge
and
Rui
mve
ldt
Res
ourc
es m
obiliz
ed fr
om E
U to
sup
port
the
reha
bilit
atio
n of
sea
de
fens
es
Com
plet
ed 6
0 pe
rcen
t of S
ea D
efen
se c
ondi
tion
surv
ey.
Dev
elop
ed G
IS d
atab
ase
and
com
men
ced
train
ing
of s
taff
in
data
base
use
and
des
ign
of s
ea d
efen
ce s
truct
ures
. C
ivil
wor
ks o
n se
a de
fens
e w
ere
carri
ed o
ut a
long
the
coa
stlin
e fro
m R
egio
n 2
and
6. E
mer
genc
y w
orks
com
men
ced
at t
he
Prof
it/Fo
ulis
are
a In
itiat
ed p
ilot p
roje
ct to
repl
ant m
angr
oves
alo
ng c
oast
line.
Si
xty-
eigh
t br
idge
s an
d cu
lver
ts
wer
e re
habi
litat
ed
and
26
stru
ctur
es c
onst
ruct
ed b
etw
een
Mah
aica
-Ros
igno
l C
onst
ruct
ion
of
the
Mah
aica
-Ros
igno
l R
oad
is
76
perc
ent
com
plet
e M
aint
enan
ce c
ontra
ct o
ngoi
ng
Four
-lane
bet
wee
n H
arbo
ur B
ridge
and
Rui
mve
ldt
is 6
5 pe
rcen
t co
mpl
ete
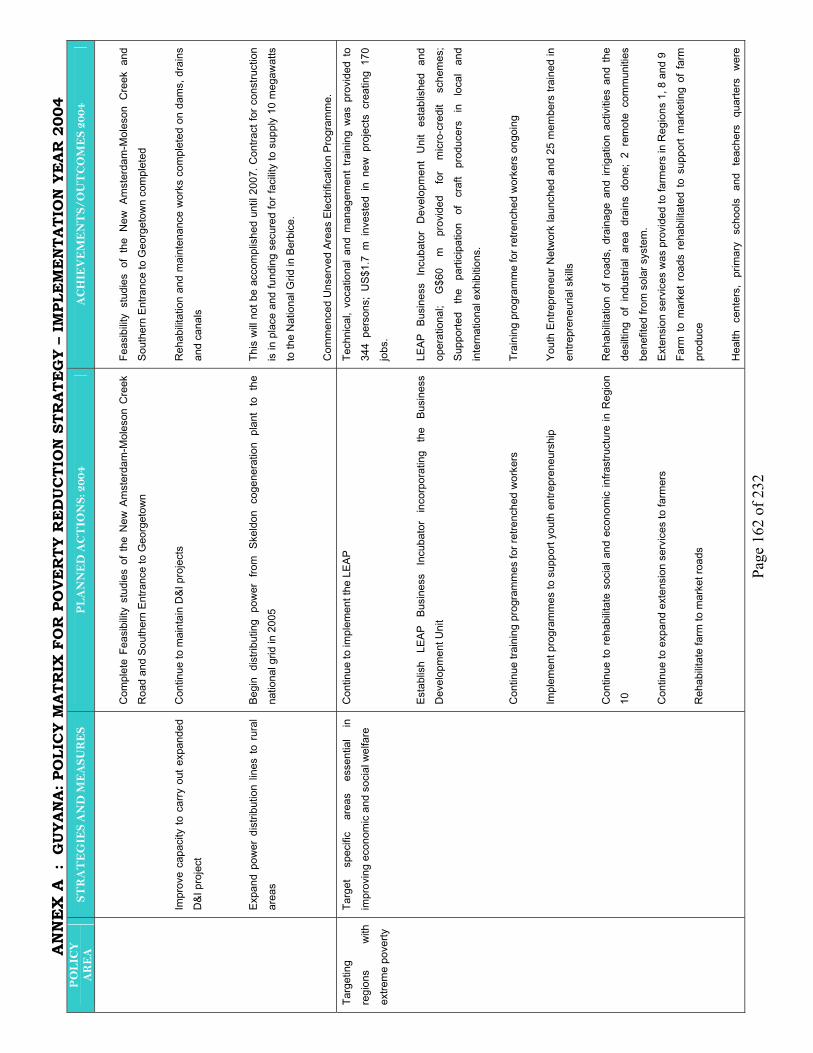
AN
NE
X A
: G
UYA
NA
: PO
LIC
Y M
ATR
IX F
OR
PO
VE
RTY
RE
DU
CTI
ON
ST
RA
TEG
Y –
IMPL
EM
EN
TAT
ION
YE
AR
200
4
Page
162
of 2
32
PO
LIC
Y
AR
EA
ST
RA
TE
GIE
S A
ND
ME
ASU
RE
S P
LA
NN
ED
AC
TIO
NS:
200
4 A
CH
IEV
EM
EN
TS/
OU
TC
OM
ES
2004
Impr
ove
capa
city
to c
arry
out
exp
ande
d D
&I p
roje
ct
Expa
nd p
ower
dis
tribu
tion
lines
to r
ural
ar
eas
Com
plet
e Fe
asib
ility
stud
ies
of th
e N
ew A
mst
erda
m-M
oles
on C
reek
R
oad
and
Sout
hern
Ent
ranc
e to
Geo
rget
own
Con
tinue
to m
aint
ain
D&I
pro
ject
s Be
gin
dist
ribut
ing
pow
er f
rom
Ske
ldon
cog
ener
atio
n pl
ant
to t
he
natio
nal g
rid in
200
5
Feas
ibilit
y st
udie
s of
the
New
Am
ster
dam
-Mol
eson
Cre
ek a
nd
Sout
hern
Ent
ranc
e to
Geo
rget
own
com
plet
ed
Reh
abilit
atio
n an
d m
aint
enan
ce w
orks
com
plet
ed o
n da
ms,
dra
ins
and
cana
ls
This
will
not b
e ac
com
plis
hed
until
200
7. C
ontra
ct fo
r con
stru
ctio
n is
in p
lace
and
fund
ing
secu
red
for f
acilit
y to
sup
ply
10 m
egaw
atts
to
the
Nat
iona
l Grid
in B
erbi
ce.
Com
men
ced
Uns
erve
d Ar
eas
Elec
trific
atio
n Pr
ogra
mm
e.
Targ
etin
g re
gion
s w
ith
extre
me
pove
rty
Targ
et
spec
ific
area
s es
sent
ial
in
impr
ovin
g ec
onom
ic a
nd s
ocia
l wel
fare
Con
tinue
to im
plem
ent t
he L
EAP
Esta
blis
h LE
AP
Busi
ness
In
cuba
tor
inco
rpor
atin
g th
e Bu
sine
ss
Dev
elop
men
t Uni
t C
ontin
ue tr
aini
ng p
rogr
amm
es fo
r ret
renc
hed
wor
kers
Im
plem
ent p
rogr
amm
es to
sup
port
yout
h en
trepr
eneu
rshi
p C
ontin
ue to
reha
bilit
ate
soci
al a
nd e
cono
mic
infra
stru
ctur
e in
Reg
ion
10
Con
tinue
to e
xpan
d ex
tens
ion
serv
ices
to fa
rmer
s
Reh
abilit
ate
farm
to m
arke
t roa
ds
Tech
nica
l, vo
catio
nal a
nd m
anag
emen
t tra
inin
g w
as p
rovi
ded
to
344
pers
ons;
US$
1.7
m i
nves
ted
in n
ew p
roje
cts
crea
ting
170
jobs
. LE
AP
Busi
ness
In
cuba
tor
Dev
elop
men
t U
nit
esta
blis
hed
and
oper
atio
nal;
G$6
0 m
pr
ovid
ed
for
mic
ro-c
redi
t sc
hem
es;
Supp
orte
d th
e pa
rtici
patio
n of
cr
aft
prod
ucer
s in
lo
cal
and
inte
rnat
iona
l exh
ibiti
ons.
Tr
aini
ng p
rogr
amm
e fo
r ret
renc
hed
wor
kers
ong
oing
Yo
uth
Entre
pren
eur N
etw
ork
laun
ched
and
25
mem
bers
trai
ned
in
entre
pren
euria
l ski
lls
Reh
abilit
atio
n of
roa
ds,
drai
nage
and
irrig
atio
n ac
tiviti
es a
nd t
he
desi
lting
of
indu
stria
l ar
ea d
rain
s do
ne;
2 re
mot
e co
mm
uniti
es
bene
fited
from
sol
ar s
yste
m.
Exte
nsio
n se
rvic
es w
as p
rovi
ded
to fa
rmer
s in
Reg
ions
1, 8
and
9
Farm
to
mar
ket
road
s re
habi
litat
ed t
o su
ppor
t m
arke
ting
of f
arm
pr
oduc
e
Hea
lth
cent
ers,
pr
imar
y sc
hool
s an
d te
ache
rs
quar
ters
w
ere
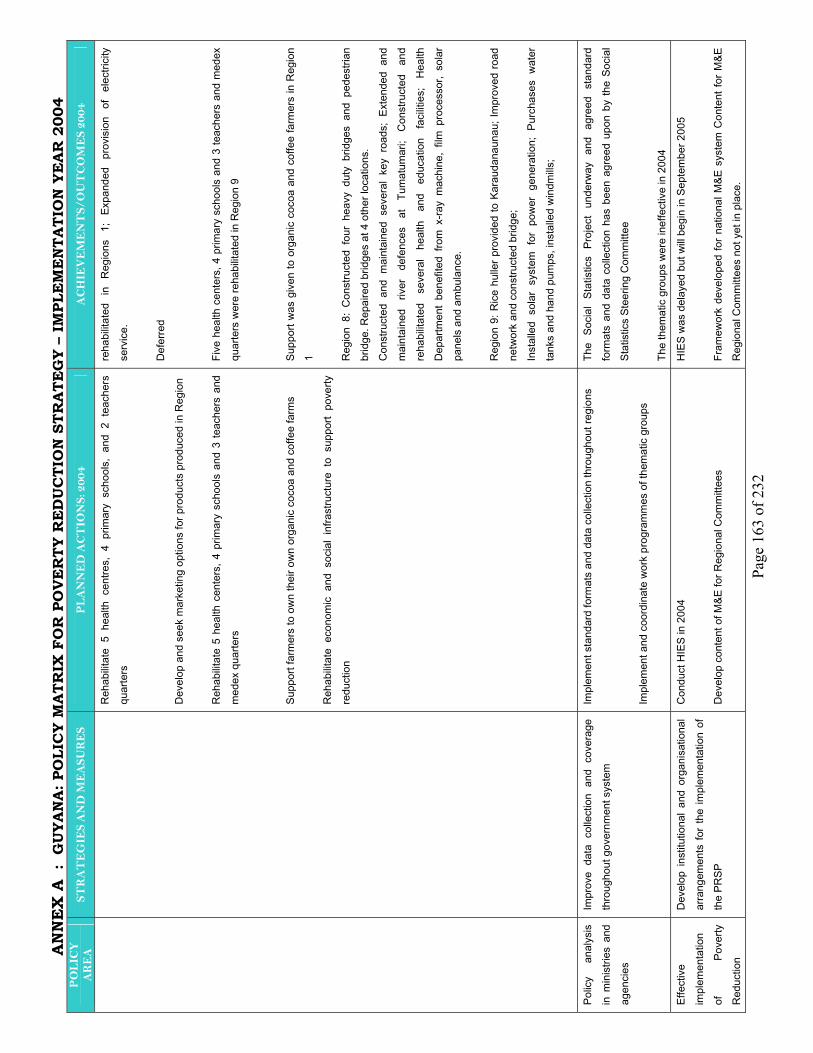
AN
NE
X A
: G
UYA
NA
: PO
LIC
Y M
ATR
IX F
OR
PO
VE
RTY
RE
DU
CTI
ON
ST
RA
TEG
Y –
IMPL
EM
EN
TAT
ION
YE
AR
200
4
Page
163
of 2
32
PO
LIC
Y
AR
EA
ST
RA
TE
GIE
S A
ND
ME
ASU
RE
S P
LA
NN
ED
AC
TIO
NS:
200
4 A
CH
IEV
EM
EN
TS/
OU
TC
OM
ES
2004
Reh
abilit
ate
5 he
alth
cen
tres,
4 p
rimar
y sc
hool
s, a
nd 2
tea
cher
s qu
arte
rs
Dev
elop
and
see
k m
arke
ting
optio
ns fo
r pro
duct
s pr
oduc
ed in
Reg
ion
Reh
abilit
ate
5 he
alth
cen
ters
, 4 p
rimar
y sc
hool
s an
d 3
teac
hers
and
m
edex
qua
rters
Su
ppor
t far
mer
s to
ow
n th
eir o
wn
orga
nic
coco
a an
d co
ffee
farm
s R
ehab
ilitat
e ec
onom
ic a
nd s
ocia
l in
frast
ruct
ure
to s
uppo
rt po
verty
re
duct
ion
reha
bilit
ated
in
R
egio
ns
1;
Expa
nded
pr
ovis
ion
of
elec
trici
ty
serv
ice.
D
efer
red
Five
hea
lth c
ente
rs, 4
prim
ary
scho
ols
and
3 te
ache
rs a
nd m
edex
qu
arte
rs w
ere
reha
bilit
ated
in R
egio
n 9
Supp
ort w
as g
iven
to o
rgan
ic c
ocoa
and
cof
fee
farm
ers
in R
egio
n 1 R
egio
n 8:
Con
stru
cted
fou
r he
avy
duty
brid
ges
and
pede
stria
n br
idge
. Rep
aire
d br
idge
s at
4 o
ther
loca
tions
. C
onst
ruct
ed a
nd m
aint
aine
d se
vera
l ke
y ro
ads;
Ext
ende
d an
d m
aint
aine
d riv
er
defe
nces
at
Tu
mat
umar
i; C
onst
ruct
ed
and
reha
bilit
ated
se
vera
l he
alth
an
d ed
ucat
ion
faci
litie
s;
Hea
lth
Dep
artm
ent
bene
fited
fro
m x
-ray
mac
hine
, fil
m p
roce
ssor
, so
lar
pane
ls a
nd a
mbu
lanc
e.
Reg
ion
9: R
ice
hulle
r pro
vide
d to
Kar
auda
naun
au; I
mpr
oved
road
ne
twor
k an
d co
nstru
cted
brid
ge;
Inst
alle
d so
lar
syst
em f
or p
ower
gen
erat
ion;
Pur
chas
es w
ater
ta
nks
and
hand
pum
ps, i
nsta
lled
win
dmills
;
Polic
y an
alys
is
in m
inis
tries
and
ag
enci
es
Impr
ove
data
col
lect
ion
and
cove
rage
th
roug
hout
gov
ernm
ent s
yste
m
Impl
emen
t sta
ndar
d fo
rmat
s an
d da
ta c
olle
ctio
n th
roug
hout
regi
ons
Impl
emen
t and
coo
rdin
ate
wor
k pr
ogra
mm
es o
f the
mat
ic g
roup
s
The
Soci
al S
tatis
tics
Proj
ect
unde
rway
and
agr
eed
stan
dard
fo
rmat
s an
d da
ta c
olle
ctio
n ha
s be
en a
gree
d up
on b
y th
e So
cial
St
atis
tics
Stee
ring
Com
mitt
ee
The
them
atic
gro
ups
wer
e in
effe
ctiv
e in
200
4
Effe
ctiv
e im
plem
enta
tion
of
Pove
rty
Red
uctio
n
Dev
elop
inst
itutio
nal a
nd o
rgan
isat
iona
l ar
rang
emen
ts fo
r th
e im
plem
enta
tion
of
the
PRSP
Con
duct
HIE
S in
200
4 D
evel
op c
onte
nt o
f M&E
for R
egio
nal C
omm
ittee
s
HIE
S w
as d
elay
ed b
ut w
ill be
gin
in S
epte
mbe
r 200
5 Fr
amew
ork
deve
lope
d fo
r na
tiona
l M&E
sys
tem
Con
tent
for
M&E
R
egio
nal C
omm
ittee
s no
t yet
in p
lace
.
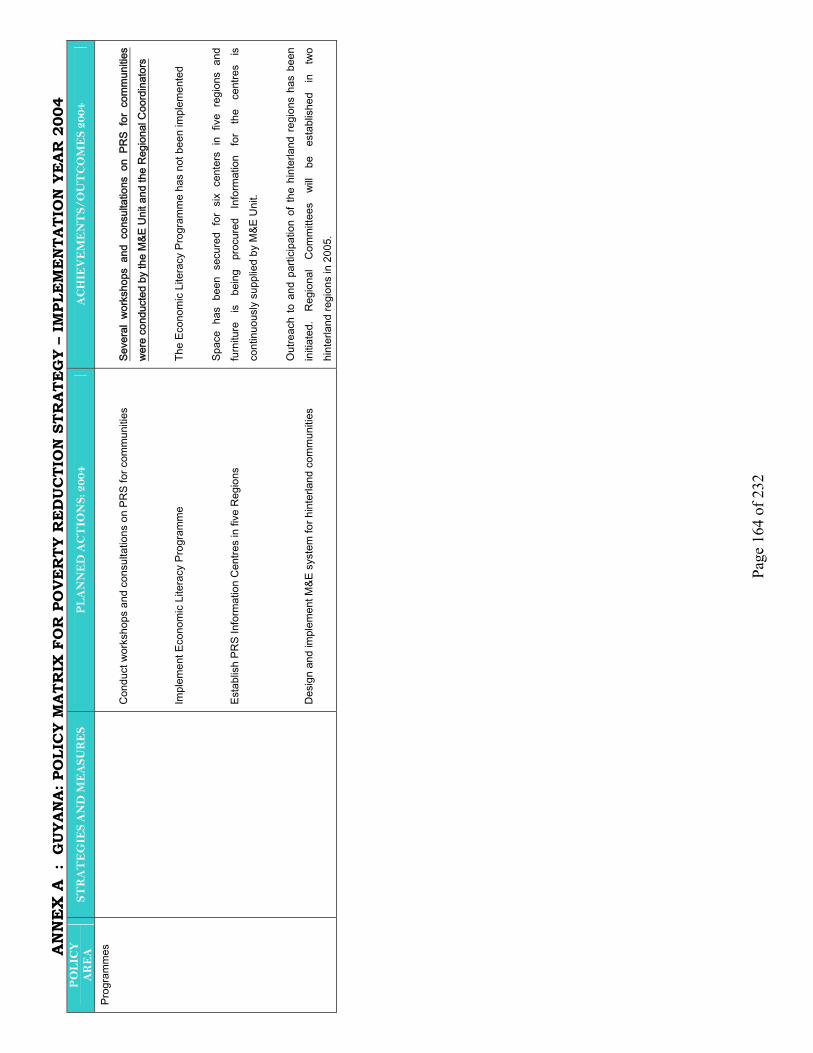
AN
NE
X A
: G
UYA
NA
: PO
LIC
Y M
ATR
IX F
OR
PO
VE
RTY
RE
DU
CTI
ON
ST
RA
TEG
Y –
IMPL
EM
EN
TAT
ION
YE
AR
200
4
Page
164
of 2
32
PO
LIC
Y
AR
EA
ST
RA
TE
GIE
S A
ND
ME
ASU
RE
S P
LA
NN
ED
AC
TIO
NS:
200
4 A
CH
IEV
EM
EN
TS/
OU
TC
OM
ES
2004
Prog
ram
mes
C
ondu
ct w
orks
hops
and
con
sulta
tions
on
PRS
for c
omm
uniti
es
Impl
emen
t Eco
nom
ic L
itera
cy P
rogr
amm
e Es
tabl
ish
PRS
Info
rmat
ion
Cen
tres
in fi
ve R
egio
ns
Des
ign
and
impl
emen
t M&E
sys
tem
for h
inte
rland
com
mun
ities
Seve
ral
wor
ksho
ps a
nd c
onsu
ltatio
ns o
n PR
S fo
r co
mm
uniti
es
wer
e co
nduc
ted
by th
e M
&E U
nit a
nd th
e R
egio
nal C
oord
inat
ors
The
Econ
omic
Lite
racy
Pro
gram
me
has
not b
een
impl
emen
ted
Spac
e ha
s be
en s
ecur
ed f
or s
ix c
ente
rs i
n fiv
e re
gion
s an
d fu
rnitu
re
is
bein
g pr
ocur
ed
Info
rmat
ion
for
the
cent
res
is
cont
inuo
usly
sup
plie
d by
M&E
Uni
t.
Out
reac
h to
and
par
ticip
atio
n of
the
hint
erla
nd r
egio
ns h
as b
een
initi
ated
. R
egio
nal
Com
mitt
ees
will
be
esta
blis
hed
in
two
hint
erla
nd re
gion
s in
200
5.
AN
NE
X B
- G
UY
AN
A: P
OL
ICY
MA
TR
IX F
OR
PO
VE
RT
Y R
ED
UC
TIO
N S
TR
AT
EG
Y –
200
5-20
07
Page
165
of 2
32
PO
LIC
Y AR
EA
O
BJEC
TIVE
S AN
D
TAR
GET
S
ST
RAT
EGIE
S AN
D
MEA
SUR
ES
REQ
UIR
ED A
CTI
ON
S 20
05-2
007
MO
NIT
OR
ING
IND
ICAT
OR
S/
EXPE
CTE
D R
ESU
LTS
TA
RG
ET
DAT
E
Mac
roec
onom
ic
fram
ewor
k
Mai
ntai
n pr
uden
t fis
cal
polic
y Im
prov
e re
venu
e co
llect
ion
and
adm
inis
tratio
n
Impr
ove
expe
nditu
re
man
agem
ent
Ref
orm
tend
er a
nd
Esta
blis
h po
licie
s, p
roce
dure
s an
d sy
stem
s fo
r the
ad
min
istra
tion
of th
e C
usto
ms
Dut
ies
(Am
endm
ent)
Ord
er N
o.6
of 2
005.
En
hanc
e sy
stem
s to
trac
k in
form
atio
n on
tax
exem
ptio
ns to
ena
ble
mor
e de
taile
d in
form
atio
n to
be
publ
ishe
d
Pass
VAT
Bill
Pa
ss im
plem
entin
g re
gula
tions
for V
AT a
nd E
xcis
e ta
x D
evel
op c
ompr
ehen
sive
Aud
it Pl
an to
impr
ove
cove
rage
of t
he ta
x ro
ll an
d re
cove
ry u
npai
d ta
xes.
C
ompl
ete
IT n
etw
orki
ng o
f dep
artm
ents
and
div
isio
ns
with
in G
RA
Rev
iew
pub
lic p
ensi
on s
yste
m to
dev
elop
re
com
men
datio
ns to
ens
ure
its s
ound
ness
C
ompl
ete
oper
atin
g pr
oced
ures
and
gui
delin
es fo
r the
pr
iorit
satio
n of
pro
ject
s in
the
PSIP
C
ompl
ete
a 5-
year
prio
ritiz
ed ro
lling
inve
stm
ent
prog
ram
D
evis
e pr
uden
tial f
ram
ewor
k fo
r the
inve
stm
ent
deci
sion
s of
the
NIS
Publ
ish
proc
edur
es
Publ
ish
tax
exem
ptio
ns
Enac
t VAT
Law
Is
sue
VAT
Reg
ulat
ions
an
d be
gin
its im
plem
enta
tion
Appr
ove
audi
t Pla
n
Dep
artm
ents
net
wor
ked.
D
evel
op a
tim
e-bo
und
actio
n pl
an
and
begi
n im
plem
enta
tion
Publ
ish
oper
atin
g pr
oced
ures
and
gu
idel
ines
Pu
blis
h 5-
year
PSI
P
Agre
e on
fram
ewor
k an
d be
gin
its
impl
emen
tatio
n Be
gin
usin
g ne
w to
ols
at th
e N
TPB
secr
etar
iat
2005
20
05
2005
20
05-2
006
2005
20
05
2005
-200
7 20
05
2005
20
05
2005
AN
NE
X B
- G
UY
AN
A: P
OL
ICY
MA
TR
IX F
OR
PO
VE
RT
Y R
ED
UC
TIO
N S
TR
AT
EG
Y –
200
5-20
07
Page
166
of 2
32
PO
LIC
Y AR
EA
O
BJEC
TIVE
S AN
D
TAR
GET
S
ST
RAT
EGIE
S AN
D
MEA
SUR
ES
REQ
UIR
ED A
CTI
ON
S 20
05-2
007
MO
NIT
OR
ING
IND
ICAT
OR
S/
EXPE
CTE
D R
ESU
LTS
TA
RG
ET
DAT
E
proc
urem
ent s
yste
m
Prep
are
new
adm
inis
trativ
e to
ols
to d
isch
arge
the
NPT
B’s
new
resp
onsi
bilit
ies;
D
isse
min
ate
new
law
s an
d re
gula
tions
and
trai
n pu
blic
on
new
adm
inis
tratio
n to
ols
D
esig
n an
d im
plem
ent a
man
agem
ent i
nfor
mat
ion
syst
em fo
r the
NPT
B’s
oper
atio
n
Begi
n im
plem
enta
tion
of la
w a
nd
regu
latio
ns
Ope
ratio
naliz
e M
IS
2005
-200
7 20
06
Mai
ntai
n pr
uden
t mon
etar
y po
licy
and
inte
grity
of t
he
finan
cial
sys
tem
Mai
ntai
n pr
ice
and
exch
ange
rate
sta
bilit
y St
reng
then
sup
ervi
sion
an
d fid
ucia
ry o
vers
ight
of
the
finan
cial
sys
tem
Con
tinuo
usly
revi
ew m
onet
ary
polic
y to
ens
ure
its
cons
iste
ncy
with
pric
e st
abilit
y Im
plem
ent i
nitia
tives
for r
isk-
base
d ap
proa
ch to
su
perv
isin
g IF
Is
Con
duct
a H
uman
Res
ourc
e St
rate
gy B
SD in
the
cont
ext o
f its
man
date
and
con
duct
a c
ompr
ehen
sive
re
view
of t
he F
IA.
Appo
int G
over
nor a
nd D
eput
y G
over
nor o
f the
Ban
k of
G
uyan
a R
econ
cile
dis
crep
anci
es in
fisc
al a
nd m
onet
ary
data
an
d re
view
reco
rdin
g pr
oced
ures
C
ondu
ct o
n-si
te in
spec
tions
of a
ll co
mm
erci
al b
anks
an
d N
BS
Rev
iew
and
upd
ate
all A
ML/
CFT
legi
slat
ion
to e
nsur
e its
con
sist
ency
with
inte
rnat
iona
l bes
t pra
ctic
es
Con
tain
infla
tion
and
gro
wth
in
base
mon
ey
Dev
elop
risk
ass
essm
ent c
riter
ia
Com
plet
e H
R S
trate
gy a
nd b
egin
its
impl
emen
tatio
n Fi
ll va
cant
pos
ition
Es
tabl
ish
inte
r-age
ncy
task
forc
e to
reco
ncile
dis
crep
anci
es
Com
plet
e in
spec
tions
of 4
ban
ks
and
NBS
Le
gisl
atio
n fin
aliz
ed.
Con
tinuo
us
2005
-200
6 20
05-2
006
2005
C
ontin
uous
20
05-2
006
2005

AN
NE
X B
- G
UY
AN
A: P
OL
ICY
MA
TR
IX F
OR
PO
VE
RT
Y R
ED
UC
TIO
N S
TR
AT
EG
Y –
200
5-20
07
Page
167
of 2
32
PO
LIC
Y AR
EA
O
BJEC
TIVE
S AN
D
TAR
GET
S
ST
RAT
EGIE
S AN
D
MEA
SUR
ES
REQ
UIR
ED A
CTI
ON
S 20
05-2
007
MO
NIT
OR
ING
IND
ICAT
OR
S/
EXPE
CTE
D R
ESU
LTS
TA
RG
ET
DAT
E
Esta
blis
h st
ock
mar
ket
Com
plet
e Fi
nanc
ial S
ecto
r Ass
essm
ent P
rogr
amm
e (F
SAP)
Fu
lfil t
rain
ing
prog
ram
initi
ated
in 2
004
Rev
iew
reco
mm
enda
tions
and
de
velo
p ac
tion
plan
C
ompl
ete
train
ing
2005
-200
6 20
05
Priv
ate
sect
or
deve
lopm
ent
Cre
ate
and/
or e
xpan
d se
ctor
s th
at w
ill ge
nera
te
broa
d ba
sed
empl
oym
ent
and
grow
th
Dev
elop
Guy
ana’
s na
tura
l res
ourc
e po
tent
ial
Stre
ngth
en fr
amew
ork
for e
xpor
t pro
mot
ion
Enha
nce
the
busi
ness
en
viro
nmen
t
Pass
new
fore
stry
law
to im
prov
e se
ctor
ope
ratio
ns in
an
env
ironm
enta
lly s
usta
inab
le m
anne
r Pa
ss M
inin
g Am
endm
ent A
ct a
nd p
ass
impl
emen
ting
regu
latio
ns
Con
clud
e R
USA
L m
anag
emen
t con
tract
and
als
o di
scus
sion
s w
ith T
rinid
ad a
nd T
obag
o’s
Nat
iona
l Gas
C
ompa
ny o
n Al
umin
um S
mel
ter P
roje
ct
Com
plet
e re
stru
ctur
ing
of G
o-In
vest
to m
ake
it a
truly
on
e-st
op in
vest
men
t age
ncy
Pres
ent C
FT b
ill to
Par
liam
ent
Esta
blis
h Sm
all B
usin
ess
Cou
ncil
(SBC
) to
revi
ew
regu
latio
ns to
sim
plify
bus
ines
s pr
oced
ures
R
educ
e th
e nu
mbe
r of d
ays
of e
stab
lishi
ng b
usin
esse
s Es
tabl
ish
Inve
stm
ent P
rom
otio
n C
ounc
il (IP
C) t
o ca
rry
out t
he fu
nctio
ns s
et in
the
Inve
stm
ent L
aw
Con
tinue
to c
reat
e co
nditi
ons
of s
tabi
lity
thro
ugh
impr
oved
dia
logu
e w
ith a
ll po
litic
al p
artie
s
Enac
t Am
ende
d Fo
rest
ry L
aw
Enac
t Am
ende
d M
inin
g Ac
t and
be
gin
to im
plem
ent t
he la
w
Sign
con
tract
with
RU
SAL
and
Agre
emen
t w
ith T
&T
Go-
Inve
st to
bec
ome
one
stop
fa
cilit
y En
act C
FT B
ill Ap
poin
t mem
bers
of t
he
com
mitt
ee
Lim
it nu
mbe
r of d
ays
to 2
1 Ap
poin
t mem
bers
of t
he IP
C
2005
20
06-2
007
2005
-200
6 20
05-2
006
2006
20
05
2005
-200
7 20
05
2005
-200
7

AN
NE
X B
- G
UY
AN
A: P
OL
ICY
MA
TR
IX F
OR
PO
VE
RT
Y R
ED
UC
TIO
N S
TR
AT
EG
Y –
200
5-20
07
Page
168
of 2
32
PO
LIC
Y AR
EA
O
BJEC
TIVE
S AN
D
TAR
GET
S
ST
RAT
EGIE
S AN
D
MEA
SUR
ES
REQ
UIR
ED A
CTI
ON
S 20
05-2
007
MO
NIT
OR
ING
IND
ICAT
OR
S/
EXPE
CTE
D R
ESU
LTS
TA
RG
ET
DAT
E
Stre
ngth
en in
stitu
tions
in
volv
ed in
land
de
velo
pmen
t St
imul
ate
entre
pren
eurs
hip
and
prom
ote
deve
lopm
ent
of n
on-tr
aditi
onal
pr
oduc
ts in
clud
ing
for
expo
rt En
hanc
e ef
ficie
ncy
of
agric
ultu
re p
rodu
ctio
n an
d im
prov
e ex
port
com
petit
iven
ess
Esta
blis
h a
com
mer
cial
cou
rt to
exp
edite
litig
atio
n an
d se
ttlem
ent o
f dis
pute
s Es
tabl
ish
One
-sto
p-sh
op fo
r pro
perty
tran
sact
ions
at
GLS
C b
uild
ing
Prom
ote
deve
lopm
ent o
f aqu
acul
ture
and
soy
abea
ns
culti
vatio
n; c
onso
lidat
e H
inte
rland
Thr
ust a
nd;
esta
blis
h lin
kage
s w
ith U
G, I
AST
and
EPA
to fa
cilit
ate
trans
fer o
f tec
hnol
ogy
betw
een
busi
ness
R
evis
e th
e Fi
sher
ies
Man
agem
ent a
nd D
evel
opm
ent
Plan
Es
tabl
ish
an E
xplo
rato
ry C
omm
ittee
to a
sses
s th
e po
ssib
ility
of h
arve
stin
g of
fsho
re re
sour
ces.
R
esta
rt th
e O
bser
ver P
rogr
amm
e to
ass
ess
the
pote
ntia
l of t
he s
eabo
b re
sour
ce.
Dev
elop
a d
atab
ase
of C
arib
bean
Fis
herie
s an
d co
nstru
ct a
n of
fsho
re s
urve
y fo
r Lar
ge P
elag
ic.
Und
erta
ke tr
ade
and
inve
stm
ent e
xpos
ition
s C
ondu
ct m
arke
t stu
dies
to id
entif
y ke
y gr
owth
are
as
Begi
n im
plem
enta
tion
of th
e Fi
duci
ary
Ove
rsig
ht a
ctio
n pl
an
Com
mer
cial
cou
rt op
erat
iona
l G
LSC
to b
ecom
e a
one
shop
ce
nter
C
ompl
ete
and
publ
ish
sect
or
prof
iles
Pl
an a
ppro
ved
Appo
int m
embe
rs o
f the
co
mm
ittee
C
ompl
ete
repo
rt on
Sea
bob
Res
ourc
es
Com
plet
e da
taba
se
Incr
ease
the
num
bers
of t
rade
2006
20
06
2006
20
05
2005
20
06
2007
20
05
2006
AN
NE
X B
- G
UY
AN
A: P
OL
ICY
MA
TR
IX F
OR
PO
VE
RT
Y R
ED
UC
TIO
N S
TR
AT
EG
Y –
200
5-20
07
Page
169
of 2
32
PO
LIC
Y AR
EA
O
BJEC
TIVE
S AN
D
TAR
GET
S
ST
RAT
EGIE
S AN
D
MEA
SUR
ES
REQ
UIR
ED A
CTI
ON
S 20
05-2
007
MO
NIT
OR
ING
IND
ICAT
OR
S/
EXPE
CTE
D R
ESU
LTS
TA
RG
ET
DAT
E
expo
sitio
ns
Com
plet
e st
udie
s an
d co
nduc
t co
nsul
tatio
ns
Reg
ulat
ory
and
inst
itutio
nal
fram
ewor
k an
d ru
le o
f law
Impr
ove
effic
ienc
y in
the
deliv
ery
of p
ublic
ser
vice
s Im
prov
e ju
stic
e ad
min
istra
tion
R
educ
e cr
ime
and
enha
nce
inte
rnal
sec
urity
Stre
ngth
en p
ublic
ac
coun
tabi
lity
and
impr
ove
gove
rnan
ce
Ref
orm
Jud
icia
ry
Stre
ngth
en in
stitu
tiona
l ca
paci
ty o
f sec
urity
ag
enci
es
Com
preh
ensi
ve re
form
s at
the
Parli
amen
t, Pa
rliam
enta
ry C
omm
ittee
and
Exe
cutiv
e Br
anch
inte
r al
ia in
clud
e:
Begi
n to
impl
emen
t tim
e-bo
und
actio
n pl
an o
n fid
ucia
ry
over
sigh
t rec
omm
enda
tions
. R
evie
w re
com
men
datio
ns o
f Sir
Dav
ies
Rep
ort a
nd
deve
lop
a tim
e bo
und
actio
n pl
an a
nd b
egin
its
impl
emen
tatio
n R
educ
e th
e ba
cklo
g of
cas
es in
the
judi
ciar
y fro
m 7
000
to 2
500
Esta
blis
h a
fam
ily c
ourt
Trai
n pe
rson
nel i
n Al
tern
ate
Dis
pute
Res
olut
ion
to
alle
viat
e th
e co
urts
R
ehab
ilitat
e th
e H
igh
Cou
rt an
d th
e C
ourt
of A
ppea
l to
mee
t req
uire
men
ts o
f Car
ibbe
an C
ourt
of J
ustic
e R
estru
ctur
e th
e G
uyan
a Pr
ison
Ser
vice
and
impl
emen
t pr
ogra
mm
es fo
r the
sec
urity
and
reha
bilit
atio
n of
pr
ison
ers
Impl
emen
tatio
n of
act
ion
plan
in
itiat
ed
Impl
emen
tatio
n of
act
ion
plan
in
itiat
ed
Back
log
redu
ced
by 2
000
Mak
e co
urt o
pera
tiona
l AD
R e
xper
ts b
egin
adj
udic
atin
g ca
ses
Res
ourc
es a
lloca
ted
Begi
n to
impl
emen
t ref
orm
s D
evel
op a
ctio
n pl
an fo
r im
plem
enta
tion
2005
-200
7 20
05-2
007
2005
20
07
2006
20
06
2006
-200
7 20
06-2
007
AN
NE
X B
- G
UY
AN
A: P
OL
ICY
MA
TR
IX F
OR
PO
VE
RT
Y R
ED
UC
TIO
N S
TR
AT
EG
Y –
200
5-20
07
Page
170
of 2
32
PO
LIC
Y AR
EA
O
BJEC
TIVE
S AN
D
TAR
GET
S
ST
RAT
EGIE
S AN
D
MEA
SUR
ES
REQ
UIR
ED A
CTI
ON
S 20
05-2
007
MO
NIT
OR
ING
IND
ICAT
OR
S/
EXPE
CTE
D R
ESU
LTS
TA
RG
ET
DAT
E D
evel
op a
Nat
iona
l Im
mig
ratio
n Po
licy;
Enh
ance
Bo
rder
and
Imm
igra
tion
Secu
rity;
Tar
get t
hrou
gh th
e re
build
ing
of th
e M
arin
e Po
lice
stat
ion
at R
uim
veld
t an
d th
e es
tabl
ishm
ent o
f a R
iver
and
Sho
re P
atro
l U
nit.
Dec
entra
lize
com
mun
ity p
olic
ing
with
stro
ng li
nkag
es
betw
een
com
mun
ities
and
the
Polic
e D
ivis
ion
R
eint
rodu
ce th
e be
at s
yste
m o
f pol
ice
foot
pat
rol
Appo
int m
embe
rs to
the
Hum
an R
ight
s C
omm
issi
on
Com
mun
ity g
roup
s eq
uipp
ed a
nd
coor
dina
tion
mec
hani
sms
esta
blis
hed
with
GPF
Ap
poin
t mem
bers
of t
he
com
mitt
ee
2007
20
06-2
007
2006
G
rant
dire
ct re
pres
enta
tion
to c
omm
uniti
es to
cho
ose
thei
r ow
n le
ader
s
Ref
orm
loca
l go
vern
men
t R
evie
w s
tatu
s of
Loc
al G
over
nmen
t Law
s an
d m
ake
amen
dmen
ts to
giv
e di
rect
repr
esen
tatio
n to
co
mm
uniti
es.
Con
tinue
to p
rom
ote
capa
city
bui
ldin
g an
d in
stitu
tiona
l st
reng
then
ing
with
in th
e Lo
cal G
over
nmen
t sys
tem
, Pr
oduc
e st
rate
gic
plan
.
Hol
d lo
cal g
over
nmen
t ele
ctio
ns
Dra
ft lo
cal g
over
nmen
t law
s R
ecru
it an
d tra
in s
taff
for l
ocal
go
vern
men
t bod
ies
Stra
tegi
c pl
an c
ompl
eted
Se
t a d
ate
for t
he lo
cal c
ounc
il el
ectio
ns
2006
20
05
2006
20
06
Inve
stm
ents
in
Phys
ical
In
frast
ruct
ure
Stre
ngth
en a
nd m
aint
ain
sea
defe
nces
to re
duce
br
each
es a
nd in
curs
ions
Dev
elop
sus
tain
able
se
a de
fenc
e m
aint
enan
ce p
lan
and
inst
itutio
ns
Com
plet
e dr
aft
mas
ter
plan
fo
r se
a de
fenc
e m
anag
emen
t. Te
nder
for
con
sulta
ncy
to a
sses
s in
terc
onne
ctio
ns
Publ
ish
the
mas
ter p
lan
and
seek
re
sour
ces
for i
ts im
plem
enta
tion
Eval
uate
tend
ers
and
cont
ract
a
firm
2005
20
05-2
006
AN
NE
X B
- G
UY
AN
A: P
OL
ICY
MA
TR
IX F
OR
PO
VE
RT
Y R
ED
UC
TIO
N S
TR
AT
EG
Y –
200
5-20
07
Page
171
of 2
32
PO
LIC
Y AR
EA
O
BJEC
TIVE
S AN
D
TAR
GET
S
ST
RAT
EGIE
S AN
D
MEA
SUR
ES
REQ
UIR
ED A
CTI
ON
S 20
05-2
007
MO
NIT
OR
ING
IND
ICAT
OR
S/
EXPE
CTE
D R
ESU
LTS
TA
RG
ET
DAT
E
Expa
nd a
ir, ro
ad a
nd ri
ver
trans
porta
tion
netw
ork
Reh
abilit
ate
and
mai
ntai
n se
a de
fenc
e in
frast
ruct
ure
Con
stru
ct a
nd
reha
bilit
ate
trans
port
infra
stru
ctur
e Es
tabl
ish
stra
tegy
to
guid
e tra
nspo
rt se
ctor
de
velo
pmen
t
betw
een
sea
defe
nces
and
com
mun
ities
to
deriv
e a
stra
tegy
fo
r su
stai
nabl
e im
plem
enta
tion
of
sect
or
polic
ies
Laun
ch
publ
ic
awar
enes
s pr
ogra
mm
e to
im
prov
e pu
blic
par
ticip
atio
n in
sec
tor.
Com
plet
e G
IS d
atab
ase
and
hydr
aulic
mod
el
Com
plet
e re
cons
truct
ion
of 1
800m
of r
ipra
p de
fenc
es
at P
rofit
/Fou
lis
Con
tinue
reh
abilit
atio
n an
d em
erge
ncy
wor
ks o
n se
a de
fenc
es
Reh
abilit
ate
4km
of s
ea d
efen
ces
in R
egio
ns 2
and
3
Impl
emen
t pilo
t pro
ject
to re
-pla
nt m
angr
oves
Im
prov
e de
sign
sta
ndar
ds fo
r roa
ds
Reh
abilit
ate
and
reco
nstru
ct fl
ood-
dam
aged
road
s.
Addr
ess
reco
mm
enda
tion
of th
e tra
nspo
rt se
ctor
stu
dy
Esta
blis
h In
frast
ruct
ure
Rec
over
y Ta
skfo
rce
to
impl
emen
t em
erge
ncy
wor
ks.
Begi
n Pu
blic
aw
aren
ess
cam
paig
n th
roug
h th
e m
edia
Be
gin
to u
tiliz
e m
odel
for
mon
itorin
g Pr
ojec
t wor
ks c
ompl
eted
R
educ
e th
e nu
mbe
r of b
reac
hes
Red
uce
the
num
ber o
f bre
ache
s.
Pilo
ts o
pera
tiona
l Be
gin
to im
plem
ent s
tand
ards
C
ompl
ete
of fl
ood
dam
aged
road
s D
evel
op a
ctio
n pl
an a
nd s
ecur
e fin
anci
ng fo
r its
impl
emen
tatio
n Ta
sk fo
rce
mem
bers
app
oint
ed
and
wor
k pr
ogra
m e
stab
lishe
d
2006
-200
7 20
06
2005
20
05-2
007
2005
-200
7 20
05-2
006
2005
20
05-2
007
2005
-200
6 20
05

AN
NE
X B
- G
UY
AN
A: P
OL
ICY
MA
TR
IX F
OR
PO
VE
RT
Y R
ED
UC
TIO
N S
TR
AT
EG
Y –
200
5-20
07
Page
172
of 2
32
PO
LIC
Y AR
EA
O
BJEC
TIVE
S AN
D
TAR
GET
S
ST
RAT
EGIE
S AN
D
MEA
SUR
ES
REQ
UIR
ED A
CTI
ON
S 20
05-2
007
MO
NIT
OR
ING
IND
ICAT
OR
S/
EXPE
CTE
D R
ESU
LTS
TA
RG
ET
DAT
E
Expa
nd, i
mpr
ove
and
mai
ntai
n dr
aina
ge a
nd
irrig
atio
n sy
stem
s an
d ou
tlets
Ex
pand
and
impr
ove
relia
bilit
y of
pow
er
dist
ribut
ion
Impr
ove
capa
city
to
carry
out
exp
ande
d D
&I
proj
ect
Upg
rade
D&I
sys
tem
an
d ou
tlets
Pr
ovid
e el
ectri
city
to
unde
rser
ved
rura
l and
in
terio
r are
as
Impr
ove
ener
gy
effic
ienc
y
Reh
abilit
ate
cana
ls t
o D
emer
ara
Riv
er a
nd A
tlant
ic
Oce
an;
Exca
vate
Sha
nks
Can
al;
Des
ilt d
rain
s an
d re
habi
litat
e ou
tlet s
truct
ures
Ex
cava
te c
ross
can
als
with
in E
ast D
emer
ara
Con
serv
ancy
and
repa
ir da
m e
mba
nkm
ent
Purc
hase
5 m
obile
pum
ps a
nd; r
ehab
ilitat
e pu
mps
at
Daw
a, C
ozie
r and
Nab
acal
is.
Com
plet
e hy
drau
lic a
nd h
ydro
logi
c m
odel
ing
of th
e Ea
st D
emer
ara
wat
er c
onse
rvan
cy s
yste
m a
nd o
utle
t st
ruct
ures
G
PL to
inst
all 6
000
conn
ectio
ns to
und
er-s
erve
d ar
eas
Two
dem
onst
ratio
n pr
ojec
ts to
be
unde
rtake
n by
GPL
un
der t
he H
inte
rland
ele
ctrif
icat
ion
stra
tegy
D
iese
l pow
er p
lant
at t
he G
uysu
co S
keld
on F
acto
ry to
im
prov
e th
e st
abilit
y of
the
pow
er s
uppl
y in
Ber
bice
Com
plet
e at
leas
t 60
perc
ent o
f w
ork
prog
ram
C
ompl
ete
at le
ast 6
0 pe
rcen
t of
wor
k pr
ogra
m
Com
plet
e at
leas
t 60
perc
ent o
f w
ork
prog
ram
Be
gin
to im
plem
ent m
odel
in
mon
itorin
g w
ater
leve
ls a
nd
stru
ctur
es o
f the
con
serv
ancy
C
ompl
ete
inst
alla
tions
Be
gin
impl
emen
tatio
n of
pilo
t pr
ojec
ts
Com
plet
e co
gene
ratio
n pl
ant
2005
-200
6 20
05-2
006
2005
-200
6 20
05
2005
-200
7 20
05-2
006
2007
Educ
atio
n Im
prov
e co
vera
ge,
enro
lmen
t and
R
educ
e re
petit
ion
rate
s in
prim
ary
Acce
lera
te th
e Ed
ucat
ion
For A
ll-Fa
st T
rack
Initi
ativ
e (E
FA-F
TI) a
nd th
e Ba
sic
Educ
atio
n Ac
cess
and
Im
plem
enta
tion
is k
ept a
pace
.
2005
-200
7
AN
NE
X B
- G
UY
AN
A: P
OL
ICY
MA
TR
IX F
OR
PO
VE
RT
Y R
ED
UC
TIO
N S
TR
AT
EG
Y –
200
5-20
07
Page
173
of 2
32
PO
LIC
Y AR
EA
O
BJEC
TIVE
S AN
D
TAR
GET
S
ST
RAT
EGIE
S AN
D
MEA
SUR
ES
REQ
UIR
ED A
CTI
ON
S 20
05-2
007
MO
NIT
OR
ING
IND
ICAT
OR
S/
EXPE
CTE
D R
ESU
LTS
TA
RG
ET
DAT
E pe
rform
ance
of
stud
ents
in fi
rst a
nd
seco
nd c
ycle
s St
reng
then
Fin
anci
al
and
Man
agem
ent
Syst
ems
scho
ols
and
incr
ease
en
rolm
ent i
n se
cond
ary
scho
ols
Impr
ovin
g Eq
uity
in
the
educ
atio
n se
ctor
R
educ
e ov
ercr
owdi
ng in
sc
hool
s
Trai
n, re
crui
t and
reta
in
train
ed te
ache
rs a
nd
soci
al w
orke
rs.
Im
prov
e qu
ality
of t
he
deliv
ery
of e
duca
tion.
Prov
ide
requ
ired
text
book
s to
stu
dent
s an
d im
plem
ent c
ost
reco
very
. Es
tabl
ish
scho
ol-
feed
ing
prog
ram
me.
Build
stro
nger
in
stitu
tions
and
impr
ove
Man
agem
ent S
uppo
rt (B
EAM
S) p
rogr
amm
es
Con
tinue
the
conv
ersi
on o
f CH
S’s
and
the
amal
gam
atio
n of
prim
ary
tops
. In
crea
se th
e nu
mbe
r of
avai
labl
e pl
aces
in p
ublic
sec
onda
ry s
choo
ls
Impr
ove
acce
ss th
roug
h th
e co
nstru
ctio
n an
d re
habi
litat
ion
of 1
2 se
cond
ary
scho
ols
unde
r the
BE
AMS
prog
ram
me.
Se
nsiti
ze te
ache
rs o
n de
liver
y of
the
new
mod
ule
for
Spec
ial N
eeds
Edu
catio
n Tr
ain
mor
e te
ache
rs.
R
ecru
it an
d re
tain
teac
hers
in h
inte
rland
com
mun
ities
Ac
cele
rate
the
deve
lopm
ent o
f the
Sch
ool
Impr
ovem
ent P
lans
Pr
ovid
e te
xtbo
oks
for s
tude
nts
Amen
d hi
nter
land
hot
mea
l pro
gram
me
(und
er E
FA-
FTI)
in a
ccor
danc
e w
ith s
urve
y re
com
men
datio
ns to
ex
tend
sch
ool f
eedi
ng p
rogr
amm
e to
hin
terla
nd
scho
ols
Com
plet
e co
nver
sion
of C
HSs
C
ompl
ete
reha
bilit
atio
n of
12
seco
ndar
y sc
hool
s Tr
aine
d te
ache
rs-s
tude
nts
ratio
in
crea
sed
580
teac
hers
to g
radu
ate
Enha
nce
ince
ntiv
es s
chem
es fo
r te
ache
rs
Expa
nd im
plem
enta
tion
of S
IPs
Four
cor
e te
xt b
ooks
to b
e pr
ovid
ed to
prim
ary
scho
ol
child
ren
Begi
n pr
ovid
ing
lunc
hes
to a
ll hi
nter
land
regi
ons
Inst
all c
ompu
ters
and
mak
e th
em
2005
20
05-2
006
2005
-200
7 20
06
2005
-200
7 20
05-2
007
2005
-200
7 20
06-2
007
2006
AN
NE
X B
- G
UY
AN
A: P
OL
ICY
MA
TR
IX F
OR
PO
VE
RT
Y R
ED
UC
TIO
N S
TR
AT
EG
Y –
200
5-20
07
Page
174
of 2
32
PO
LIC
Y AR
EA
O
BJEC
TIVE
S AN
D
TAR
GET
S
ST
RAT
EGIE
S AN
D
MEA
SUR
ES
REQ
UIR
ED A
CTI
ON
S 20
05-2
007
MO
NIT
OR
ING
IND
ICAT
OR
S/
EXPE
CTE
D R
ESU
LTS
TA
RG
ET
DAT
E go
vern
ance
Pr
ocur
e co
mpu
ters
for r
egio
nal o
ffice
s an
d pr
ovid
e fu
rther
trai
ning
in G
IS s
oftw
are
oper
atio
nal
Hea
lth
Mod
erni
se th
e Se
ctor
Im
prov
e ac
cess
, co
vera
ge a
nd q
ualit
y of
hea
lth c
are,
es
peci
ally
to th
e po
or
Red
esig
n th
e le
gisl
ativ
e an
d in
stitu
tiona
l fra
mew
ork
for
heal
thca
re
prov
isio
n at
the
regi
onal
and
ce
ntra
l lev
els
Expa
nd
prev
enta
tive
care
Con
tinue
to re
stru
ctur
e th
e M
inis
try –
Add
Ado
lesc
ent
and
Youn
g Ad
ult H
ealth
and
Wel
lnes
s Pr
ogra
mm
e.
Res
truct
ure
the
Reg
iona
l Hea
lth S
ervi
ces
Dep
artm
ent
to p
rovi
de m
ore
effe
ctiv
e su
ppor
t to
the
heal
th s
ecto
r in
the
regi
ons.
Pr
esen
t Allie
d H
ealth
Pro
fess
ion
Bill
to p
arlia
men
t afte
r co
nsul
tatio
n R
atio
naliz
e pr
imar
y he
alth
car
e fa
cilit
ies
with
regi
onal
pl
ans
for a
ll re
gion
s.
Esta
blis
h a
Guy
ana
Cen
ter f
or D
isea
se C
ontro
l.
Com
plet
e a
Toba
cco
Surv
eilla
nce
Surv
ey S
tudy
and
de
velo
p a
Nat
iona
l Tob
acco
Con
trol P
lan.
Im
plem
ent t
he N
atio
nal N
utrit
ion
Plan
. Fu
lly im
plem
ent t
he M
edic
al T
erm
inat
ion
of P
regn
ancy
Ac
t with
a n
ew a
dvis
ory
com
mitt
ee.
Inte
grat
e m
alar
ia d
iagn
osis
and
trea
tmen
t int
o pr
imar
y he
alth
car
e, a
nd in
trodu
ce M
alar
ia S
trate
gic
Plan
. Ex
pand
DEC
sal
t dis
tribu
tion
for p
reve
ntio
n of
Fi
laria
sis
Com
plet
e re
stru
ctur
ing
prog
ram
Ag
reed
on
refo
rms
and
begi
n its
im
plem
enta
tion
Pass
legi
slat
ion
Dev
elop
act
ion
plan
and
beg
in it
s im
plem
enta
tion
Appo
int m
embe
rs
Publ
ish
stud
y an
d pl
an o
f act
ion
Expa
nd c
over
age
of b
enef
icia
ries
Red
uced
num
ber o
f ille
gal
preg
nanc
ies
Begi
n im
plem
entin
g th
e in
tegr
ated
pro
gram
Ex
pand
pro
gram
cov
erag
e ar
ea
2005
-200
7 20
05-2
007
2006
20
05-2
006
2006
20
05-2
006
2005
-200
7 20
06-2
007
2005
-200
6 20
05-2
006
AN
NE
X B
- G
UY
AN
A: P
OL
ICY
MA
TR
IX F
OR
PO
VE
RT
Y R
ED
UC
TIO
N S
TR
AT
EG
Y –
200
5-20
07
Page
175
of 2
32
PO
LIC
Y AR
EA
O
BJEC
TIVE
S AN
D
TAR
GET
S
ST
RAT
EGIE
S AN
D
MEA
SUR
ES
REQ
UIR
ED A
CTI
ON
S 20
05-2
007
MO
NIT
OR
ING
IND
ICAT
OR
S/
EXPE
CTE
D R
ESU
LTS
TA
RG
ET
DAT
E At
tract
, ret
ain
and
train
med
ical
pe
rson
nel t
o ad
dres
s
R
educ
e th
e in
cide
nce
of fr
eque
ntly
occ
urrin
g di
seas
es
Prov
ide
med
ical
car
e to
H
IV/ A
IDS
patie
nts.
Com
plet
e N
atio
nal D
iabe
tes
and
Hyp
erte
nsio
n St
rate
gic
Plan
s D
evel
op a
Nat
iona
l Men
tal H
ealth
Stra
tegi
c Pl
an a
nd
initi
ate
the
psyc
hiat
ric n
urse
pra
ctiti
oner
pro
gram
me.
Es
tabl
ish
a C
ardi
ac D
iagn
ostic
Cen
ter a
t the
GPH
C.
Ope
ratio
naliz
e th
e ca
ncer
cen
ter w
ith th
e in
trodu
ctio
n of
radi
othe
rapy
and
che
mot
hera
py.
Impl
emen
t HIV
/AID
S tre
atm
ent a
nd c
are
prog
ram
mes
in
at l
east
one
site
in a
ll te
n re
gion
s.
Mak
e tre
atm
ent f
or c
o-in
fect
ion
with
HIV
and
TB
avai
labl
e to
all
co-in
fect
ed p
atie
nts.
M
ake
CD
4 av
aila
ble
to a
ll H
IV+
pers
ons
and
new
co
nstru
ct p
ublic
hea
lth la
bora
tory
. In
trodu
ce D
OTS
and
hom
e-ba
sed
care
for H
IV.
Fina
lize
Beha
viou
ral C
hang
e C
omm
unic
atio
ns
stra
tegy
and
exp
and
ME
TO Y
OU
Per
sona
l R
espo
nsib
ility
BCC
pro
gram
me.
Es
tabl
ish
Pris
on a
nd D
isci
plin
ary
Serv
ices
HIV
/AID
S pr
ogra
mm
e.
Publ
ish
stra
tegi
c pl
an
Impl
emen
t pla
n an
d ps
ychi
atric
nu
rsin
g pr
ogra
mm
e M
ake
the
cent
er o
pera
tiona
l Pr
ocur
e an
d in
stal
l equ
ipm
ent
Sele
ct re
gion
and
beg
in
impl
emen
tatio
n of
trea
tmen
t pr
ogra
m
Expa
nded
cov
erag
e of
dru
gs to
pa
tient
s Ex
pand
ed c
over
age
of d
rugs
to
patie
nts
Begi
n to
impl
emen
t pro
gram
s Ad
opt r
ecom
men
datio
ns a
nd
begi
n to
impl
emen
t an
actio
n pl
an.
Begi
n to
impl
emen
t pro
gram
2005
-200
6 20
05-2
007
2006
-200
7 20
06-2
007
2005
-200
6 20
05-2
007
2005
-200
7 20
06-2
007
2006
-200
7 20
05-2
007
2006
-200
7
AN
NE
X B
- G
UY
AN
A: P
OL
ICY
MA
TR
IX F
OR
PO
VE
RT
Y R
ED
UC
TIO
N S
TR
AT
EG
Y –
200
5-20
07
Page
176
of 2
32
PO
LIC
Y AR
EA
O
BJEC
TIVE
S AN
D
TAR
GET
S
ST
RAT
EGIE
S AN
D
MEA
SUR
ES
REQ
UIR
ED A
CTI
ON
S 20
05-2
007
MO
NIT
OR
ING
IND
ICAT
OR
S/
EXPE
CTE
D R
ESU
LTS
TA
RG
ET
DAT
E sk
ills s
horta
ge
Impr
ove
and
Expa
nd
heal
th in
frast
ruct
ure
and
tech
nolo
gica
l ca
paci
ty
Reg
ular
ly c
ontra
ct
inte
rnat
iona
l ex
perts
to p
erfo
rm
spec
ializ
ed
serv
ices
Ex
pand
pro
fess
iona
l de
velo
pmen
t op
portu
nitie
s an
d co
nditi
ons
of s
ervi
ce to
m
edic
al p
erso
nnel
Es
tabl
ish
Syst
em
to p
rocu
re d
rugs
an
d m
edic
al
supp
lies
Impr
ove
med
ical
fa
cilit
ies
Stre
ngth
en S
afe
Inje
ctio
n Po
licy
thro
ugh
intro
duct
ion
of n
ew in
ject
ion
tech
nolo
gy.
Purs
ue te
chni
cal p
rogr
amm
es w
ith C
anad
a, th
e U
SA
and
UN
Vol
unte
er s
yste
m.
Dev
elop
pro
toco
ls fo
r gre
ater
man
agem
ent
supe
rvis
ion
and
effe
ctiv
e m
onito
ring
of s
taff.
Es
tabl
ish
rule
s fo
r priv
ate
prac
tice
by p
ublic
hea
lth
pers
onne
l. C
olla
bora
te w
ith m
edic
al s
choo
l at U
G to
recr
uit
stud
ents
for g
over
nmen
t ser
vice
. R
ecru
it 50
0 pe
rson
s fo
r nur
se tr
aini
ng.
Dev
elop
a b
iom
edic
al d
epar
tmen
t at G
PHC
to tr
ain
biom
edic
al te
chni
cian
s fo
r all
hosp
itals
Fo
rmal
ize
the
Mat
eria
ls M
anag
emen
t Uni
t (M
MU
), an
d im
prov
e its
sta
ffing
and
func
tioni
ng.
Com
plet
e ne
w IT
sys
tem
, with
the
proc
urem
ent a
nd
dist
ribut
ion
syst
em c
ompu
teriz
ed
Und
erta
ke re
gula
r aud
its to
ens
ure
that
dru
gs a
re
Begi
n to
impl
emen
t pro
gram
N
umbe
r med
ical
exp
erts
to
spec
ial p
rogr
amm
es
Doc
tors
-pat
ient
ratio
Im
plem
ent a
nd e
nfor
ce ru
les
Rec
ruit
mor
e st
uden
ts in
to
med
ical
sch
ool
Red
uce
patie
nt to
nur
ses
ratio
O
pera
tiona
lize
the
wor
k of
the
depa
rtmen
ts
Proc
ure
and
dist
ribut
e m
edic
ine
M
ake
syst
em o
pera
tiona
l
2005
-200
7 20
05
2005
-200
7 20
06-2
007
2005
-200
7 20
05-2
007
2005
-220
7 20
05-2
006
2005
20
05-2
007

AN
NE
X B
- G
UY
AN
A: P
OL
ICY
MA
TR
IX F
OR
PO
VE
RT
Y R
ED
UC
TIO
N S
TR
AT
EG
Y –
200
5-20
07
Page
177
of 2
32
PO
LIC
Y AR
EA
O
BJEC
TIVE
S AN
D
TAR
GET
S
ST
RAT
EGIE
S AN
D
MEA
SUR
ES
REQ
UIR
ED A
CTI
ON
S 20
05-2
007
MO
NIT
OR
ING
IND
ICAT
OR
S/
EXPE
CTE
D R
ESU
LTS
TA
RG
ET
DAT
E
acco
unte
d fo
r and
util
ized
in a
tim
ely
way
. Ex
pand
the
Hos
pita
l Ins
pect
orat
e to
cov
er a
ll pu
blic
he
alth
inst
itutio
ns.
Form
aliz
e m
inim
um s
tand
ards
requ
irem
ent f
or a
ll ho
spita
ls a
nd e
nfor
ce li
cens
ing
requ
irem
ents
. C
ompl
ete
a m
aint
enan
ce p
lan
for a
ll pu
blic
hea
lth
labo
rato
ries.
La
bora
torie
s in
all
regi
onal
hos
pita
ls to
be
certi
fied
by
the
Stan
dard
s Bu
reau
. Fi
naliz
e th
e es
sent
ial l
abor
ator
y se
rvic
es p
lan
for t
he
publ
ic h
ealth
sec
tor.
Add
a ne
w b
lood
ban
k, T
B cl
inic
and
wai
ting
area
to
the
New
Am
ster
dam
Hos
pita
l. Be
gin
cons
truct
ion
on th
e Li
nden
and
Let
hem
H
ospi
tals
, GPH
C In
-Pat
ient
Bui
ldin
gs, a
nd h
ealth
ce
nter
s at
E. L
a Pe
nite
nce
and
Yaka
sari.
C
onst
ruct
Mab
arum
a H
ospi
tal a
nd p
olyc
linic
s at
Eas
t Ba
nk D
emer
ara,
Kitt
y an
d Pa
rika.
C
ompl
ete
cons
truct
ion
of n
ew G
UM
clin
ic.
Com
plet
e au
dit f
or 2
004
Insp
ect a
t lea
st 1
0 he
alth
faci
litie
s pe
r yea
r En
forc
e st
anda
rds
thro
ugh
rand
om in
spec
tions
and
impo
sing
pe
nalti
es fo
r non
-com
plia
nce
Impl
emen
t mai
nten
ance
pla
n C
ondu
ct ra
ndom
insp
ectio
ns
Impl
emen
t pla
n C
ompl
ete
stru
ctur
es a
nd p
rocu
re
equi
pmen
t Be
gin
cons
truct
ion
of h
ospi
tals
Be
gin
cons
truct
ion
of fa
cilit
ies
Begi
n co
nstru
ctio
n of
GU
M C
linic
2005
-200
7 20
05-2
007
2005
-200
7 20
06-2
007
2006
-200
7 20
05-2
006
2005
/200
6 20
05/2
006
2005
/200
6

AN
NE
X B
- G
UY
AN
A: P
OL
ICY
MA
TR
IX F
OR
PO
VE
RT
Y R
ED
UC
TIO
N S
TR
AT
EG
Y –
200
5-20
07
Page
178
of 2
32
PO
LIC
Y AR
EA
O
BJEC
TIVE
S AN
D
TAR
GET
S
ST
RAT
EGIE
S AN
D
MEA
SUR
ES
REQ
UIR
ED A
CTI
ON
S 20
05-2
007
MO
NIT
OR
ING
IND
ICAT
OR
S/
EXPE
CTE
D R
ESU
LTS
TA
RG
ET
DAT
E
Hou
sing
Pr
ovid
e af
ford
able
hou
sing
an
d m
ake
avai
labl
e af
ford
able
fina
ncin
g fo
r low
in
com
e ea
rner
s
Stre
ngth
en s
helte
r and
la
nd m
arke
ts
Acce
lera
te s
quat
ter
regu
lariz
atio
n St
reng
then
CH
PA
Dev
elop
new
hou
sing
ar
eas
Dev
elop
long
term
ho
usin
g pl
anni
ng
Cre
ate
mar
kets
for l
and
Reg
ular
ize
squa
tter s
ettle
men
ts
Allo
cate
hou
se lo
ts a
nd fa
cilit
ate
its d
evel
opm
ent
Serv
ice
hous
e lo
ts in
sch
emes
C
onst
ruct
low
-inco
me
hous
es in
new
ly d
evel
oped
ho
usin
g sc
hem
es.
Fina
l Pap
er o
n FG
RS
to b
e pr
esen
ted
to P
arlia
men
t R
egul
ariz
e 16
5 sq
uatti
ng a
reas
an
d es
tabl
ish
func
tiona
l CD
Cs
in
each
are
a Al
loca
te a
t lea
st 4
,500
hou
se lo
ts
area
s 4
500
Pr
ovid
e ba
sic
infra
stru
ctur
e in
6
hous
ing
sche
mes
C
onst
ruct
at l
east
500
hou
ses
2005
20
05
2005
20
05
2005
-200
7 20
05-2
007
Envi
ronm
enta
l Pr
otec
tion
Prom
ote
sust
aina
ble
deve
lopm
ent i
n th
e us
e of
re
sour
ces.
1/En
sure
con
serv
atio
n an
d su
stai
nabl
e us
e of
bi
odiv
ersi
ty
2/Pr
omot
e so
und
envi
ronm
enta
l m
anag
emen
t 3/
Prom
ote
envi
ronm
enta
l ed
ucat
ion
and
awar
enes
s 4/
Prov
ide
supp
ort
serv
ices
Com
plet
e N
atio
nal B
io-S
afet
y Fr
amew
ork,
and
the
prep
arat
ion
of a
pol
icy
on G
enet
ical
ly M
odifi
ed
Org
anis
ms
and
IPR
s fo
r Guy
ana
Dev
elop
mon
itorin
g sy
stem
and
pre
pare
legi
slat
ion
for
wild
life
Exte
nd lo
cal a
nd in
tern
atio
nal l
inks
on
Prot
ecte
d Ar
eas
Man
agem
ent a
nd d
efin
e a
lega
l and
regu
lato
ry
fram
ewor
k fo
r it.
Asse
ss a
nd re
port
on e
nviro
nmen
tal i
mpa
ct o
f flo
ods
Con
duct
pub
lic e
duca
tion
prog
ram
mes
Publ
ish
stud
y D
raft
legi
slat
ion
C
onsu
lt on
lega
l and
regu
lato
ry
fram
ewor
k C
ompl
ete
repo
rt on
impa
ct o
f flo
odin
g Be
gin
sens
itiza
tion
prog
ram
mes
2005
-200
6 20
06
2005
-200
6 20
05
2005
-200
6

AN
NE
X B
- G
UY
AN
A: P
OL
ICY
MA
TR
IX F
OR
PO
VE
RT
Y R
ED
UC
TIO
N S
TR
AT
EG
Y –
200
5-20
07
Page
179
of 2
32
PO
LIC
Y AR
EA
O
BJEC
TIVE
S AN
D
TAR
GET
S
ST
RAT
EGIE
S AN
D
MEA
SUR
ES
REQ
UIR
ED A
CTI
ON
S 20
05-2
007
MO
NIT
OR
ING
IND
ICAT
OR
S/
EXPE
CTE
D R
ESU
LTS
TA
RG
ET
DAT
E
Prod
uce
Stra
tegi
c En
viro
nmen
tal A
sses
smen
t (SE
A)
for t
he m
inin
g se
ctor
. Im
plem
ent E
nviro
nmen
tal M
anag
emen
t Pla
n fo
r the
Sk
eldo
n su
gar f
acto
ry.
to p
rote
ct th
e en
viro
nmen
t C
ompl
ete
TOR
for t
he s
tudy
O
bser
ve a
ll pr
otoc
ols
and
agre
emen
ts in
the
wor
k pl
an
2005
20
06
Wat
er a
nd
Sani
tatio
n En
sure
goo
d an
d ef
fect
ive
regu
latio
n of
the
sect
or
Expa
nd a
cces
s an
d qu
ality
of
wat
er to
90
perc
ent o
f po
pula
tion
Cre
ate
Guy
ana
Wat
er
Inc.
to re
plac
e G
UYW
A an
d G
SWC
Ex
pand
wat
er s
ervi
ces
to ru
ral a
nd e
spec
ially
hi
nter
land
loca
tions
.
Agre
e on
reco
mm
enda
tions
of R
evie
w
Com
plet
e th
e LB
I met
erin
g pr
ojec
t and
the
Geo
rget
own
Prog
ram
me
II to
pro
vide
33,
000
cust
omer
s w
ith im
prov
ed s
ervi
ce a
nd p
rovi
de 4
,992
ne
w c
onne
ctio
ns
Prov
ide
cont
inue
d w
ater
s se
rvic
e
Prov
ide
wat
er s
uppl
y to
52.
1% o
f hin
terla
nd
com
mun
ities
Dev
elop
and
impl
emen
t an
actio
n pl
an
Prov
ide
33,0
00 c
usto
mer
s w
ith
impr
oved
ser
vice
and
4,9
92 n
ew
conn
ectio
ns
Ensu
re a
t lea
st 1
6 ho
urs
of
serv
ice
per d
ay
Con
nect
hin
terla
nd c
omm
uniti
es
2005
-200
7 20
05-2
007
2005
-200
7 20
05-2
007
Soci
al S
afet
y N
ets
Impr
ove
the
livin
g co
nditi
ons
of th
e po
ores
t ho
useh
olds
and
incr
ease
ca
paci
ty o
f poo
r co
mm
uniti
es to
arti
cula
te
thei
r prio
ritie
s Im
prov
e th
e qu
ality
and
1/So
cial
Impa
ct
Amel
iora
tion
Proj
ect
(SIM
AP):
a) fi
nanc
e in
vest
men
ts
in s
ocia
l and
eco
nom
ic
infra
stru
ctur
e an
d st
reng
then
org
aniz
atio
n of
poo
r com
mun
ities
SIM
AP to
acc
eler
ate
proj
ects
Ac
cele
rate
pro
ject
impl
emen
tatio
n
Awar
d 26
0 co
ntra
cts
Incr
ease
num
ber o
f ben
efic
iarie
s Aw
ard
cont
ract
s to
cov
er th
e un
disb
urse
d am
ount
s
2005
-200
7 20
05-2
007
2005
-200
7

AN
NE
X B
- G
UY
AN
A: P
OL
ICY
MA
TR
IX F
OR
PO
VE
RT
Y R
ED
UC
TIO
N S
TR
AT
EG
Y –
200
5-20
07
Page
180
of 2
32
PO
LIC
Y AR
EA
O
BJEC
TIVE
S AN
D
TAR
GET
S
ST
RAT
EGIE
S AN
D
MEA
SUR
ES
REQ
UIR
ED A
CTI
ON
S 20
05-2
007
MO
NIT
OR
ING
IND
ICAT
OR
S/
EXPE
CTE
D R
ESU
LTS
TA
RG
ET
DAT
E
deliv
ery
of s
ocia
l ser
vice
s to
poo
r rur
al c
omm
uniti
es
2/Ba
sic
Nee
ds T
rust
Fu
nd (B
NTF
) 3/
Min
istry
of H
uman
Se
rvic
es. L
abou
r and
So
cial
Sec
urity
Rev
iew
reco
mm
enda
tions
of s
tudi
es c
ompl
eted
for
MH
SLSS
C
omm
ence
impl
emen
tatio
n of
tim
e-bo
und
actio
n pl
ans
for P
rogr
am a
nd T
arge
ting,
Lab
our M
arke
t and
Ris
k an
d vu
lner
abilit
y pr
ojec
ts.
Impl
emen
tatio
n of
pla
ns
com
men
ced.
2005
-200
6
Spec
ial
Inte
rven
tion
Prog
ram
mes
Red
uce
pock
ets
of p
over
ty
Hin
terla
nd
Dev
elop
men
t – to
pr
ovid
e fo
r dee
per
inte
grat
ion
and
self
– su
ffici
ency
in
Amer
indi
an
Com
mun
ities
R
egio
nal I
nter
vent
ions
: R
egio
n 1
Reg
ion
8
Impr
ove
gove
rnan
ce, a
dmin
istra
tive
and
man
ager
ial
capa
city
of h
inte
rland
com
mun
ities
. Es
tabl
ish
MIS
for u
se b
y M
inis
try o
f Am
erin
dian
Affa
irs
Impl
emen
t nat
iona
l pro
gram
mes
suc
h as
SIM
AP,
BNTF
and
Hin
terla
nd W
ater
Stra
tegy
. C
onst
ruct
and
reha
bilit
ate
road
net
wor
ks, b
ridge
and
re
vetm
ent t
o fo
ster
dev
elop
men
t; C
ompl
ete
4 de
ntal
la
bs a
nd la
bora
tory
and
acq
uire
den
tal e
quip
men
t and
x-
ray
mac
hine
for l
ab; E
xten
d do
rmito
ries
and
cons
truct
teac
hers
’ qua
rters
C
ontin
ue to
impl
emen
t roa
d an
d br
idge
s co
nstru
ctio
n an
d m
aint
enan
ce; E
xten
d pr
imar
y sc
hool
s an
d te
ache
rs’ q
uarte
rs; E
xten
d an
d eq
uip
3 he
alth
pos
ts;
proc
ure
fogg
ing
mac
hine
for d
isea
se c
ontro
l.
392
villa
ge le
ader
s an
d an
imat
ors
to b
e tra
ined
Ap
poin
t sta
ff to
man
age
and
impl
emen
t MIS
In
crea
se n
umbe
r of b
enef
icia
ries
Com
plet
e pr
ojec
ts a
s pr
opos
ed in
th
e In
vest
men
t Pro
gram
C
ompl
ete
proj
ects
as
prop
osed
in
the
Inve
stm
ent P
rogr
am
2005
-200
6 20
05-2
006
2005
-200
6 20
05-2
006
2005
-200
7

AN
NE
X B
- G
UY
AN
A: P
OL
ICY
MA
TR
IX F
OR
PO
VE
RT
Y R
ED
UC
TIO
N S
TR
AT
EG
Y –
200
5-20
07
Page
181
of 2
32
PO
LIC
Y AR
EA
O
BJEC
TIVE
S AN
D
TAR
GET
S
ST
RAT
EGIE
S AN
D
MEA
SUR
ES
REQ
UIR
ED A
CTI
ON
S 20
05-2
007
MO
NIT
OR
ING
IND
ICAT
OR
S/
EXPE
CTE
D R
ESU
LTS
TA
RG
ET
DAT
E
Reg
ion
9 R
egio
n 10
LE
AP
Gra
nt la
nd ti
tle to
Kon
ashe
n Am
erin
dian
Dis
trict
; U
pgra
de te
ache
r sup
port
serv
ices
; con
stru
ct a
nd
mai
ntai
n sc
hool
s; c
onst
ruct
and
equ
ip h
ealth
pos
ts a
nd
cent
ers;
Est
ablis
h Fo
ot a
nd M
outh
Con
trol C
ente
rs
and
new
pla
nt n
urse
ries.
R
ehab
ilitat
e ro
ads
and
drai
ns; E
quip
and
upg
rade
he
alth
care
faci
litie
s; C
onst
ruct
4 n
urse
ry s
choo
ls a
nd 2
te
ache
rs q
uarte
rs; s
ettle
lega
l sta
tus
of 7
Am
erin
dian
co
mm
uniti
es; i
ncre
ase
rem
ote
area
s in
cent
ive
paym
ent f
or re
gion
’s te
ache
rs; a
lloca
te 2
950
hous
e lo
ts.
Con
stru
ct fa
rm–t
o-m
arke
t roa
d C
ompl
ete
feas
ibilit
y st
udie
s fo
r ind
ustri
al z
one
and
expa
nsio
n of
wha
rf fa
cilit
ies
Con
tinue
to p
rovi
de b
usin
ess
advi
ce, p
lann
ing
and
mar
ketin
g as
sist
ance
thro
ugh
the
Busi
ness
D
evel
opm
ent U
nit
Com
plet
e pr
ojec
ts a
s pr
opos
ed in
th
e In
vest
men
t Pro
gram
C
ompl
ete
proj
ects
as
prop
osed
in
the
Inve
stm
ent P
rogr
am
Com
plet
e ro
ads
St
udie
s co
mpl
eted
In
crea
se n
umbe
r of b
enef
icia
ries
2005
-200
7 20
05-2
007
2005
-200
7 20
06
2006
Res
earc
h an
d Po
licy
Anal
ysis
Im
prov
e ev
iden
ce b
ased
po
licy
anal
ysis
and
fo
rmul
atio
ns a
cros
s th
e go
vern
men
t
Stre
ngth
en th
e Po
verty
R
educ
tion
Stra
tegy
Se
cret
aria
t to
mon
itor
and
eval
uate
PR
SP
impl
emen
tatio
n to
en
sure
effe
ctiv
e im
plem
enta
tion
Prog
ram
mes
Prov
ide
com
preh
ensi
ve tr
aini
ng in
M&E
for a
ll st
akeh
olde
rs
Dev
elop
a s
yste
m b
ased
mon
itorin
g an
d ev
alua
tion
fram
ewor
k
Rec
ruit
M&E
con
sulta
nt to
beg
in
train
ing
exer
cise
R
ecru
it an
MIS
con
sulta
nt to
de
sign
a s
impl
e co
mpu
teriz
ed
rule
bas
ed s
yste
m to
mon
itor
pove
rty re
duct
ion
prog
ram
s
2005
-200
6 20
05

AN
NE
X B
- G
UY
AN
A: P
OL
ICY
MA
TR
IX F
OR
PO
VE
RT
Y R
ED
UC
TIO
N S
TR
AT
EG
Y –
200
5-20
07
Page
182
of 2
32
PO
LIC
Y AR
EA
O
BJEC
TIVE
S AN
D
TAR
GET
S
ST
RAT
EGIE
S AN
D
MEA
SUR
ES
REQ
UIR
ED A
CTI
ON
S 20
05-2
007
MO
NIT
OR
ING
IND
ICAT
OR
S/
EXPE
CTE
D R
ESU
LTS
TA
RG
ET
DAT
E
Stre
ngth
en d
ata
colle
ctio
n an
d co
vera
ge
thro
ugho
ut g
over
nmen
t sy
stem
Stre
ngth
en in
stitu
tiona
l cap
acity
to im
prov
e st
atis
tical
in
form
atio
n on
pov
erty
ana
lysi
s an
d ta
rget
ing
Begi
n im
plem
enta
tion
of th
e So
cial
Sta
tistic
s Pr
ojec
t
Publ
ish
on a
bia
nnua
l bas
is
exec
uted
cur
rent
exp
endi
ture
s br
oken
dow
n by
sec
tors
and
pr
iorit
y re
late
d pr
ogra
ms
Publ
ish
on a
bia
nnua
l bas
is
exec
uted
exp
endi
ture
s fo
r prio
rity
proj
ects
in th
e ca
pita
l pro
gram
Tr
ain
M&E
regi
onal
coo
rdin
ator
s on
wha
t and
how
to m
onito
r ex
pend
iture
dat
a on
pro
ject
s C
ompl
ete
tech
nica
l pap
er o
f bu
dget
allo
catio
n an
d ex
pend
iture
s an
d ou
tcom
es o
f po
verty
redu
ctio
n R
ecru
it st
atis
ticia
ns a
nd s
tatis
tical
of
ficer
s fo
r the
Bur
eau
of
Stat
istic
s an
d th
e so
cial
sec
tor
line
min
istri
es
Esta
blis
h an
d st
aff s
tatis
tical
uni
ts
in li
ne m
inis
tries
Pr
ocur
e eq
uipm
ent,
com
pute
r ha
rdw
are
and
softw
are
for
stat
istic
al u
nits
2005
20
05
2005
-200
7 20
06
2005
20
05
2005
20
05
AN
NE
X B
- G
UY
AN
A: P
OL
ICY
MA
TR
IX F
OR
PO
VE
RT
Y R
ED
UC
TIO
N S
TR
AT
EG
Y –
200
5-20
07
Page
183
of 2
32
PO
LIC
Y AR
EA
O
BJEC
TIVE
S AN
D
TAR
GET
S
ST
RAT
EGIE
S AN
D
MEA
SUR
ES
REQ
UIR
ED A
CTI
ON
S 20
05-2
007
MO
NIT
OR
ING
IND
ICAT
OR
S/
EXPE
CTE
D R
ESU
LTS
TA
RG
ET
DAT
E
Rec
ruit
head
of d
epar
tmen
ts fo
r va
cant
pos
ition
s at
the
BOS
Begi
n in
tens
ive
train
ing
prog
ram
me
for s
tatis
ticia
ns
Rec
ruit
a fir
m to
ass
ist i
n ca
paci
ty
build
ing
and
inst
itutio
nal
stre
ngth
enin
g fo
r BO
S
2005
-200
6 20
05
GU
YAN
A –
PO
VER
TY R
EDU
CTI
ON
STR
ATE
GY
REG
ION
AL
CO
NSU
LTA
TIO
N
FEED
BA
CK
FR
OM
HIN
TER
LAN
D R
EGIO
NS
Page
184
of 2
32
SE
CT
OR
AR
EA
IS
SUE
S R
EC
OM
ME
ND
ED
AC
TIO
NS
ECONOMIC DEVELOPMENT E
cono
mic
Dev
elop
men
t D
iffic
ulty
in s
tarti
ng o
wn
busi
ness
In
adeq
uate
infra
stru
ctur
e de
velo
pmen
t to
supp
ort b
usin
esse
s D
iffic
ulty
in fi
ndin
g an
d ac
cess
ing
mar
kets
H
igh
unem
ploy
men
t rat
es
Pro
vide
sta
rt up
con
cess
ions
P
rovi
de a
cces
s to
trai
ning
and
con
tinui
ng e
duca
tion
Faci
litat
e ac
cess
to c
omm
erci
al b
anki
ng s
ervi
ces
Impr
ove
the
prov
isio
n of
wat
er, e
lect
ricity
and
hea
lth s
ervi
ces
Con
stru
ct a
nd u
pgra
de r
oads
to
faci
litat
e tra
nspo
rtatio
n of
goo
ds a
nd
prod
uce
Ass
ist w
ith d
evel
opin
g m
arke
ts/ m
arke
ting
good
s pr
oduc
ed in
the
regi
on
Pro
mot
e th
e de
velo
pmen
t of j
ob-c
reat
ing
indu
strie
s
Sch
ool A
ttend
ance
H
ouse
hold
po
verty
, un
empl
oym
ent
and
finan
cial
di
fficu
lties
In
acce
ssib
ility
of s
choo
ls a
nd la
ck o
f tra
nspo
rtatio
n R
educ
e st
uden
t abs
ente
eism
Impl
emen
t job
cre
atio
n pr
ogra
mm
es
Pro
vide
sub
sidi
es a
nd i
ncen
tives
to
poor
hou
seho
lds
incl
udin
g lu
nch,
sc
hool
uni
form
s an
d tra
nspo
rtatio
n E
nsur
e gr
eate
r par
enta
l inv
olve
men
t and
resp
onsi
bilit
y Im
prov
e co
mm
unic
atio
n be
twee
n so
cial
wel
fare
offi
cers
and
par
ents
, an
d be
twee
n sc
hool
s an
d pa
rent
s
EDUCATION
Teac
her q
ualif
icat
ion
and
atte
ndan
ce
Poor
con
ditio
ns o
f ser
vice
Yo
ung,
unt
rain
ed a
nd le
ss c
omm
itted
new
teac
hers
Prov
ide
ince
ntiv
es fo
r te
ache
rs to
wor
k in
hin
terl
and
com
mun
ities
Im
prov
e co
nditi
ons o
f ser
vice
and
incr
ease
sala
ries
P
rovi
de b
ette
r tra
inin
g pr
ogra
mm
es fo
r tea
cher
s R
evie
w p
olic
y on
ret
irem
ent a
ge fo
r te
ache
rs a
nd a
sses
s po
ssib
ility
of
re-c
ontra
ctin
g re
tired
teac
hers
Car
e an
d tre
atm
ent
Lack
of t
rain
ed s
taff
in h
ealth
care
faci
litie
s
Rec
ruit
and
reta
in m
ore
train
ed s
taff
by p
rovi
ding
impr
oved
sal
arie
s an
d w
orki
ng c
ondi
tions
Im
plem
ent r
egul
ar v
isits
to c
omm
uniti
es b
y he
alth
care
wor
kers
HEALTH
Hea
lth fa
cilit
ies
Poo
r con
ditio
n of
hea
lth fa
cilit
ies
Una
vaila
bilit
y of
dru
gs
Con
stru
ct a
nd fu
lly e
quip
mod
ern
faci
litie
s E
nsur
e im
prov
ed a
vaila
bilit
y of
dru
gs b
y im
prov
ing
the
proc
urem
ent,
stor
age
and
dist
ribut
ion
syst
em
REGION 1
WATER
Acc
ess
to s
afe/
treat
ed w
ater
U
ntre
ated
wat
er c
omin
g th
roug
h ta
ps
Inad
equa
te p
erio
ds o
f ser
vice
pro
visi
on
Pro
vide
pot
able
wat
er b
y bu
ildin
g tre
atm
ent p
lant
s R
epai
r, cl
ean
and
lay
new
pip
es
Sin
k ne
w w
ells
P
rovi
de b
ette
r equ
ipm
ent t
o fa
cilit
ate
stor
age
and
cont
rol w
asta
ge
GU
YAN
A –
PO
VER
TY R
EDU
CTI
ON
STR
ATE
GY
REG
ION
AL
CO
NSU
LTA
TIO
N
FEED
BA
CK
FR
OM
HIN
TER
LAN
D R
EGIO
NS
Page
185
of 2
32
SEC
TO
R A
RE
A
ISSU
ES
RE
CO
MM
EN
DE
D A
CT
ION
S
REGION 1
INFRASTRUCTURE Tr
ansp
orta
tion
Ferr
ies
and
stel
lings
are
in
poor
con
ditio
n, w
ith i
nade
quat
e fa
cilit
ies
Irreg
ular
and
inad
equa
te s
ervi
ce
Hig
h tra
vel c
osts
In
adeq
uate
num
bers
of v
ehic
les
Poo
r con
ditio
n of
infra
stru
ctur
e
Pro
cure
new
boa
ts to
sup
plem
ent e
xist
ing
fleet
s U
pgra
de th
e fa
cilit
ies
avai
labl
e on
boa
rd th
e fe
rrie
s an
d at
the
stel
lings
P
rovi
de ro
utin
e m
aint
enan
ce fo
r boa
ts a
nd s
telli
ngs
Impr
ove
the
regu
larit
y an
d pu
nctu
ality
of s
ervi
ce
Low
er d
omes
tic tr
avel
cos
ts
Pro
cure
ve
hicl
es
to
prov
ide
addi
tiona
l fo
rms
of
trans
porta
tion
for
resi
dent
s P
rovi
de ro
utin
e m
aint
enan
ce fo
r pub
lic tr
ansp
orta
tion
faci
litie
s, in
clud
ing
road
s
ECONOMIC DEVELOPMENT
Eco
nom
ic D
evel
opm
ent
Diff
icul
ty in
sta
rting
ow
n bu
sine
ss
Inad
equa
te in
frast
ruct
ure
deve
lopm
ent t
o su
ppor
t bus
ines
ses
Lo
w s
alar
ies
and
pens
ions
Pro
vide
sta
rt up
con
cess
ions
P
rovi
de a
cces
s to
trai
ning
and
con
tinui
ng e
duca
tion
Faci
litat
e ac
cess
to c
omm
erci
al b
anki
ng s
ervi
ces
Impr
ove
the
prov
isio
n of
wat
er, e
lect
ricity
and
hea
lth s
ervi
ces
Con
stru
ct a
nd u
pgra
de r
oads
to
faci
litat
e tra
nspo
rtatio
n of
goo
ds a
nd
prod
uce
Pro
mot
e th
e de
velo
pmen
t of j
ob-c
reat
ing
indu
strie
s P
rovi
de a
ssis
tanc
e to
low
-inco
me
earn
ers
EDUCATION
Sch
ool A
ttend
ance
H
ouse
hold
po
verty
, un
empl
oym
ent
and
finan
cial
di
fficu
lties
In
acce
ssib
ility
of s
choo
ls a
nd la
ck o
f tra
nspo
rtatio
n R
educ
e st
uden
t abs
ente
eism
Impl
emen
t job
cre
atio
n pr
ogra
mm
es
Pro
vide
sub
sidi
es a
nd i
ncen
tives
to
poor
hou
seho
lds
incl
udin
g lu
nch,
sc
hool
uni
form
s an
d tra
nspo
rtatio
n P
rovi
de m
oped
s an
d ot
her s
impl
e fo
rms
of tr
ansp
orta
tion
Rev
ise
the
scho
ol c
urric
ulum
with
mor
e em
phas
is o
n te
chni
cal
and
voca
tiona
l ski
lls tr
aini
ng
Teac
her t
rain
ing
and
atte
ndan
ce
Sho
rtage
of t
rain
ed te
ache
rs
Impr
ove
cond
ition
s of
ser
vice
and
incr
ease
sal
arie
s fo
r tea
cher
s
REGION 7
HEALTH
Hea
lth
Lack
of t
rain
ed s
taff
resi
dent
in th
e re
gion
P
oor c
ondi
tion
and
inad
equa
te n
umbe
rs o
f hea
lth fa
cilit
ies
Una
vaila
bilit
y of
dru
gs
Rec
ruit
and
reta
in m
ore
train
ed s
taff
by p
rovi
ding
ince
ntiv
es, i
mpr
oved
sa
larie
s an
d w
orki
ng c
ondi
tions
Im
plem
ent r
egul
ar v
isits
to c
omm
uniti
es b
y he
alth
care
wor
kers
C
onst
ruct
and
fully
equ
ip m
oder
n fa
cilit
ies
Ens
ure
impr
oved
ava
ilabi
lity
of d
rugs
by
impr
ovin
g th
e pr
ocur
emen
t, st
orag
e an
d di
strib
utio
n sy
stem
GU
YAN
A –
PO
VER
TY R
EDU
CTI
ON
STR
ATE
GY
REG
ION
AL
CO
NSU
LTA
TIO
N
FEED
BA
CK
FR
OM
HIN
TER
LAN
D R
EGIO
NS
Page
186
of 2
32
SEC
TO
R A
RE
A
ISSU
ES
RE
CO
MM
EN
DE
D A
CT
ION
S WATER
Acc
ess
to s
afe/
treat
ed w
ater
In
adeq
uate
ser
vice
pro
visi
on
Pro
vide
pot
able
wat
er b
y bu
ildin
g tre
atm
ent p
lant
s R
epai
r, cl
ean
and
lay
new
pip
es
Sin
k ne
w w
ells
REGION 7
INFRASTRUCTURE
Tran
spor
tatio
n Irr
egul
ar a
nd in
adeq
uate
ser
vice
Fe
rrie
s an
d st
ellin
gs a
re i
n po
or c
ondi
tion,
with
ina
dequ
ate
faci
litie
s
Hig
h tra
vel c
osts
P
oor c
ondi
tion
of in
frast
ruct
ure
Impr
ove
the
regu
larit
y an
d pu
nctu
ality
of s
ervi
ce
Pro
cure
new
boa
ts to
sup
plem
ent e
xist
ing
fleet
s U
pgra
de th
e fa
cilit
ies
avai
labl
e on
boa
rd th
e fe
rrie
s an
d at
the
stel
lings
Lo
wer
dom
estic
trav
el c
osts
P
rovi
de ro
utin
e m
aint
enan
ce fo
r pub
lic tr
ansp
orta
tion
faci
litie
s, in
clud
ing
road
s an
d ai
rstri
ps
ECONOMIC DEVELOPMENT
Eco
nom
ic D
evel
opm
ent
Diff
icul
ty in
sta
rting
ow
n bu
sine
ss
Inad
equa
te in
frast
ruct
ure
deve
lopm
ent t
o su
ppor
t bus
ines
ses
Hig
h un
empl
oym
ent r
ates
Lo
w s
alar
ies
and
pens
ions
Pro
vide
ince
ntiv
es to
enc
oura
ge in
vest
men
t P
rovi
de tr
aini
ng a
nd c
ontin
uing
edu
catio
n Fa
cilit
ate
acce
ss to
com
mer
cial
ban
king
ser
vice
s Im
prov
e th
e pr
ovis
ion
of w
ater
, ele
ctric
ity a
nd h
ealth
ser
vice
s P
rom
ote
the
deve
lopm
ent o
f job
-cre
atin
g in
dust
ries
Pro
vide
ass
ista
nce
to lo
w-in
com
e ea
rner
s
EDUCATION
Sch
ool a
ttend
ance
H
ouse
hold
po
verty
, un
empl
oym
ent
and
finan
cial
di
fficu
lties
R
educ
e st
uden
t abs
ente
eism
S
horta
ge o
f tra
ined
teac
hers
Impl
emen
t job
cre
atio
n pr
ogra
mm
es
Pro
vide
sub
sidi
es a
nd i
ncen
tives
to
poor
hou
seho
lds
incl
udin
g lu
nch,
sc
hool
uni
form
s an
d tra
nspo
rtatio
n R
evis
e th
e sc
hool
cur
ricul
um w
ith m
ore
emph
asis
on
tech
nica
l an
d vo
catio
nal s
kills
trai
ning
In
crea
se th
e pr
esen
ce a
nd n
umbe
rs o
f sch
ool w
elfa
re o
ffice
rs
Impr
ove
cond
ition
s of s
ervi
ce a
nd in
crea
se sa
lari
es fo
r te
ache
rs
REGION 8
HEALTH
Car
e an
d tre
atm
ent
Lack
of t
rain
ed s
taff
resi
dent
in th
e re
gion
P
oor c
ondi
tion
and
inad
equa
te n
umbe
r of h
ealth
faci
litie
s
Rec
ruit
and
reta
in m
ore
train
ed s
taff
by p
rovi
ding
ince
ntiv
es, i
mpr
oved
sa
larie
s an
d w
orki
ng c
ondi
tions
C
onst
ruct
and
fully
equ
ip m
oder
n fa
cilit
ies
GU
YAN
A –
PO
VER
TY R
EDU
CTI
ON
STR
ATE
GY
REG
ION
AL
CO
NSU
LTA
TIO
N
FEED
BA
CK
FR
OM
HIN
TER
LAN
D R
EGIO
NS
Page
187
of 2
32
SE
CT
OR
AR
EA
IS
SUE
S R
EC
OM
ME
ND
ED
AC
TIO
NS
WATER A
cces
s to
saf
e/tre
ated
wat
er
Trea
ted
wat
er n
ot a
vaila
ble
Low
wat
er p
ress
ure
Inad
equa
te p
erio
ds o
f ser
vice
pro
visi
on
Pro
vide
pot
able
wat
er b
y bu
ildin
g tre
atm
ent p
lant
s R
epai
r, cl
ean
and
lay
new
pip
es
Sin
k ne
w w
ells
REGION 8
TREANSPORTATION
Tran
spor
tatio
n Irr
egul
ar a
nd in
adeq
uate
ser
vice
In
adeq
uate
faci
litie
s on
ferr
ies
and
stel
lings
H
igh
trave
l cos
ts
Poo
r con
ditio
n of
infra
stru
ctur
e
Impr
ove
the
regu
larit
y an
d pu
nctu
ality
of s
ervi
ce
Pro
cure
new
boa
ts to
sup
plem
ent e
xist
ing
fleet
s U
pgra
de th
e fa
cilit
ies
avai
labl
e on
boa
rd th
e fe
rrie
s an
d at
the
stel
lings
Lo
wer
dom
estic
trav
el c
osts
P
rovi
de ro
utin
e m
aint
enan
ce fo
r pub
lic tr
ansp
orta
tion
faci
litie
s, in
clud
ing
road
s an
d ai
rstri
ps
ECONOMIC DEVELOPMENT
Eco
nom
ic D
evel
opm
ent
Inad
equa
te in
frast
ruct
ure
deve
lopm
ent t
o su
ppor
t bus
ines
ses
Hig
h un
empl
oym
ent r
ates
Impr
ove
the
prov
isio
n of
wat
er, e
lect
ricity
and
hea
lth s
ervi
ces
Con
stru
ct a
nd u
pgra
de r
oads
to
faci
litat
e tra
nspo
rtatio
n of
goo
ds a
nd
prod
uce
Pro
mot
e th
e de
velo
pmen
t of j
ob-c
reat
ing
indu
strie
s
EDUCATION
Sch
ool a
ttend
ance
H
ouse
hold
po
verty
, un
empl
oym
ent
and
finan
cial
di
fficu
lties
R
educ
e st
uden
t abs
ente
eism
S
horta
ge o
f tra
ined
teac
hers
Impl
emen
t job
cre
atio
n pr
ogra
mm
es
Pro
vide
sub
sidi
es a
nd i
ncen
tives
to
poor
hou
seho
lds
incl
udin
g lu
nch,
sc
hool
uni
form
s an
d tra
nspo
rtatio
n R
evis
e th
e sc
hool
cur
ricul
um w
ith m
ore
emph
asis
on
tech
nica
l an
d vo
catio
nal s
kills
trai
ning
P
rovi
de m
ore
effic
ient
trai
ning
pro
gram
mes
for t
each
ers
Impr
ove
cond
ition
s of s
ervi
ce a
nd in
crea
se sa
lari
es fo
r te
ache
rs
REGION 9
HEALTH
Car
e an
d Tr
eatm
ent
Lack
of t
rain
ed s
taff
resi
dent
in th
e re
gion
P
oor c
ondi
tion
and
inad
equa
te n
umbe
rs o
f hea
lth fa
cilit
ies
Una
vaila
bilit
y of
dru
gs
Rec
ruit
and
reta
in m
ore
train
ed s
taff
by p
rovi
ding
ince
ntiv
es, i
mpr
oved
sa
larie
s an
d w
orki
ng c
ondi
tions
C
onst
ruct
and
fully
equ
ip m
oder
n fa
cilit
ies
Ens
ure
impr
oved
ava
ilabi
lity
of d
rugs
by
impr
ovin
g th
e pr
ocur
emen
t, st
orag
e an
d di
strib
utio
n sy
stem
GU
YAN
A –
PO
VER
TY R
EDU
CTI
ON
STR
ATE
GY
REG
ION
AL
CO
NSU
LTA
TIO
N
FEED
BA
CK
FR
OM
HIN
TER
LAN
D R
EGIO
NS
Page
188
of 2
32
SE
CT
OR
AR
EA
IS
SUE
S R
EC
OM
ME
ND
ED
AC
TIO
NS
WATER
Acc
ess
to s
afe/
treat
ed w
ater
U
ntre
ated
wat
er c
omin
g th
roug
h ta
ps
Inad
equa
te p
erio
ds o
f ser
vice
pro
visi
on
Rep
air,
clea
n an
d la
y ne
w p
ipes
S
ink
new
wel
ls
Pro
vide
bet
ter e
quip
men
t to
faci
litat
e st
orag
e an
d co
ntro
l was
tage
TREANSPORTATION
Tran
spor
tatio
n H
igh
trave
l cos
ts
Poo
r con
ditio
n of
road
s an
d ai
rstri
ps
Low
er d
omes
tic tr
avel
cos
ts
Pro
vide
rout
ine
mai
nten
ance
for p
ublic
tran
spor
tatio
n fa
cilit
ies,
incl
udin
g ro
ads
and
airs
trips
AN
NEX
C- G
UYA
NA
– P
OVE
RTY
RED
UC
TIO
N S
TRA
TEG
Y R
EGIO
NA
L C
ON
SULT
ATI
ON
R
EGIO
N 2
FEE
DB
AC
K
Page
189
of 2
32
Sect
or A
rea
Issu
esR
ecom
men
ded
Act
ions
Stu
dent
atte
ndan
ce
Hou
seho
ld p
over
ty
Irres
pons
ible
par
ents
In
acce
ssib
ility
to
scho
ol
Enf
orce
trua
ncy
legi
slat
ion
In
crea
se s
ocia
l ass
ista
nce
in t
he f
orm
of
trans
port,
uni
form
, te
xtbo
oks
etc
Impr
ove
com
mun
icat
ion
betw
een
scho
ol &
par
ents
& S
WO
s Im
prov
e th
e nu
mbe
r & q
ualit
y of
SW
Os
Enc
oura
ge s
uppo
rt &
stre
ngth
en P
TAs
Pro
vide
sub
sidi
es/ i
ncen
tives
to p
oor h
ouse
hold
s Te
ache
r qua
lific
atio
n &
atte
ndan
ce
Unq
ualif
ied
teac
hers
Mor
e ef
ficie
nt tr
aini
ng p
rogr
amm
es fo
r tea
cher
Im
prov
e sa
lary
& w
orki
ng c
ondi
tion
EDUCATION
Com
mun
ity
parti
cipa
tion
in
scho
ol
prog
ram
s
Enc
oura
ge s
uppo
rt &
stre
ngth
en P
TAs
MoE
to s
olic
it di
rect
feed
back
from
par
ents
in c
omm
unity
M
oE to
incr
ease
mon
itorin
g/ s
uper
visi
on o
f sch
ools
Lo
w c
ost h
ousi
ng
Inad
equa
te n
umbe
r of l
ow c
ost l
ots
avai
labl
e P
oor c
usto
mer
ser
vice
by
hous
ing
& w
ater
em
ploy
ees
Insu
ffici
ent l
ow in
tere
st h
ousi
ng lo
ans
Aw
ard
lots
/ titl
es to
the
poor
er c
lass
& s
enio
r citi
zens
P
rovi
de tr
aini
ng to
wor
kers
to im
prov
e ef
ficie
ncy
Wor
k w
ith th
e ba
nkin
g se
ctor
to m
ake
hous
ing
loan
s ea
sily
acc
essi
ble
and
at lo
w in
tere
st ra
tes
Acc
ess
to s
afe
& tre
ated
wat
er
Unt
reat
ed w
ater
bei
ng d
istri
bute
d In
adeq
uate
per
iod
of s
ervi
ce p
rovi
sion
Pro
vide
pot
able
trea
ted
wat
er
Incr
ease
hou
rs o
f ser
vice
S
ink
new
wel
l
HOUSING AND WATER
San
itatio
n P
oor/
no g
arba
ge c
olle
ctio
n sy
stem
N
o re
cycl
ing
prog
ram
mes
Pro
vide
mor
e &
regu
lar g
arba
ge c
olle
ctio
n se
rvic
e E
stab
lish
recy
clin
g pr
ogra
mm
e E
stab
lish
dum
p si
te
Invo
lve
com
mun
ities
in s
anita
tion
M
ore
publ
ic a
war
enes
s/ e
duca
tion
prog
ram
mes
E
nabl
ing
envi
ronm
ent f
or
entre
pren
eurs
hip
U
nattr
activ
e Ta
x an
d in
cent
ive
regi
me
B
ette
r inf
rast
ruct
ure
In
tere
st &
exc
hang
e ra
tes
too
high
Mor
e ac
cess
to lo
ans,
gra
nts
and
tax
conc
essi
ons
Nee
d fo
r effi
cien
t & q
ualif
ied
cont
ract
ors
and
incr
ease
mon
itor o
f in
frast
ruct
ure
wor
ks
Sta
rt up
con
cess
ion
(dut
y fre
e, la
nd le
ases
) to
be e
asily
acc
essi
ble.
N
eed
for a
com
mer
cial
cou
rt G
over
nmen
t Age
ncie
s to
wor
k cl
oser
with
regi
onal
bod
ies
to a
ttrac
t fo
reig
n in
vest
men
t.
PRIVATE SECTOR DEVELOPMENT
Enh
anci
ng e
xpor
t D
iffic
ulty
in id
entif
ying
and
acc
essi
ng m
arke
ts
Hig
h fu
el c
ost
Ass
ist w
ith a
cces
sing
ove
rsea
s m
arke
ts fo
r loc
ally
pro
duce
d go
ods
Affo
rdab
le fu
el
REGION 2
INFRASTRUCTURE
Mai
nten
ance
M
aint
enan
ce o
f inf
rast
ruct
ure
(D&
I, R
oads
etc
) neg
lect
ed b
y re
leva
nt a
utho
ritie
s La
ck o
f com
mun
icat
ion
betw
een
loca
l gov
ernm
ent b
odie
s &
co
mm
uniti
es
Pro
vide
con
tinuo
us m
aint
enan
ce to
infra
stru
ctur
e
Am
end
regu
latio
ns to
hol
d re
leva
nt lo
cal g
over
nmen
t bod
ies
acco
unta
ble
for n
egle
ct o
f dut
ies
Law
s to
hol
d re
side
nts
acco
unta
ble
for d
istra
ctio
n/ ta
mpe
ring
with
in
frast
ruct
ure
Mor
e co
mm
unity
invo
lvem
ent i
n su
ppor
t of m
aint
enan
ce o
f in
frast
ruct
ure
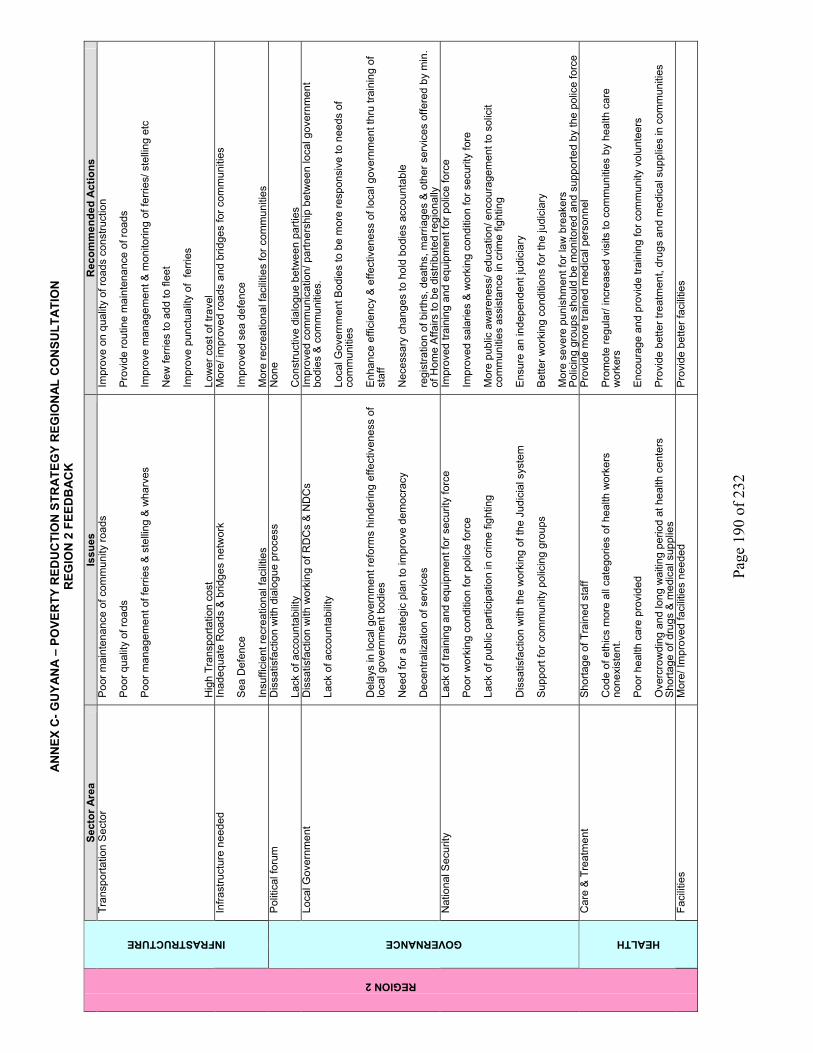
AN
NEX
C- G
UYA
NA
– P
OVE
RTY
RED
UC
TIO
N S
TRA
TEG
Y R
EGIO
NA
L C
ON
SULT
ATI
ON
R
EGIO
N 2
FEE
DB
AC
K
Page
190
of 2
32
Sect
or A
rea
Issu
es
Rec
omm
ende
d A
ctio
ns
Tran
spor
tatio
n S
ecto
r P
oor m
aint
enan
ce o
f com
mun
ity ro
ads
Poo
r qua
lity
of ro
ads
Poo
r man
agem
ent o
f fer
ries
& s
telli
ng &
wha
rves
H
igh
Tran
spor
tatio
n co
st
Impr
ove
on q
ualit
y of
road
s co
nstru
ctio
n P
rovi
de ro
utin
e m
aint
enan
ce o
f roa
ds
Impr
ove
man
agem
ent &
mon
itorin
g of
ferr
ies/
ste
lling
etc
N
ew fe
rrie
s to
add
to fl
eet
Impr
ove
punc
tual
ity o
f fe
rrie
s Lo
wer
cos
t of t
rave
l
INFRASTRUCTURE
Infra
stru
ctur
e ne
eded
In
adeq
uate
Roa
ds &
brid
ges
netw
ork
S
ea D
efen
ce
Insu
ffici
ent r
ecre
atio
nal f
acili
ties
Mor
e/ im
prov
ed ro
ads
and
brid
ges
for c
omm
uniti
es
Impr
oved
sea
def
ence
M
ore
recr
eatio
nal f
acili
ties
for c
omm
uniti
es
Pol
itica
l for
um
Dis
satis
fact
ion
with
dia
logu
e pr
oces
s La
ck o
f acc
ount
abili
ty
Non
e C
onst
ruct
ive
dial
ogue
bet
wee
n pa
rties
Lo
cal G
over
nmen
t D
issa
tisfa
ctio
n w
ith w
orki
ng o
f RD
Cs
& N
DC
s La
ck o
f acc
ount
abili
ty
Del
ays
in lo
cal g
over
nmen
t ref
orm
s hi
nder
ing
effe
ctiv
enes
s of
lo
cal g
over
nmen
t bod
ies
Nee
d fo
r a S
trate
gic
plan
to im
prov
e de
moc
racy
D
ecen
traliz
atio
n of
ser
vice
s
Impr
oved
com
mun
icat
ion/
par
tner
ship
bet
wee
n lo
cal g
over
nmen
t bo
dies
& c
omm
uniti
es.
Loca
l Gov
ernm
ent B
odie
s to
be
mor
e re
spon
sive
to n
eeds
of
com
mun
ities
E
nhan
ce e
ffici
ency
& e
ffect
iven
ess
of lo
cal g
over
nmen
t thr
u tra
inin
g of
st
aff
Nec
essa
ry c
hang
es to
hol
d bo
dies
acc
ount
able
re
gist
ratio
n of
birt
hs, d
eath
s, m
arria
ges
& o
ther
ser
vice
s of
fere
d by
min
. of
Hom
e A
ffairs
to b
e di
strib
uted
regi
onal
ly
GOVERNANCE
Nat
iona
l Sec
urity
La
ck o
f tra
inin
g an
d eq
uipm
ent f
or s
ecur
ity fo
rce
Poo
r wor
king
con
ditio
n fo
r pol
ice
forc
e La
ck o
f pub
lic p
artic
ipat
ion
in c
rime
fight
ing
Dis
satis
fact
ion
with
the
wor
king
of t
he J
udic
ial s
yste
m
Sup
port
for c
omm
unity
pol
icin
g gr
oups
Impr
oved
trai
ning
and
equ
ipm
ent f
or p
olic
e fo
rce
Impr
oved
sal
arie
s &
wor
king
con
ditio
n fo
r sec
urity
fore
M
ore
publ
ic a
war
enes
s/ e
duca
tion/
enc
oura
gem
ent t
o so
licit
com
mun
ities
ass
ista
nce
in c
rime
fight
ing
Ens
ure
an in
depe
nden
t jud
icia
ry
Bet
ter w
orki
ng c
ondi
tions
for t
he ju
dici
ary
Mor
e se
vere
pun
ishm
ent f
or la
w b
reak
ers
Pol
icin
g gr
oups
sho
uld
be m
onito
red
and
supp
orte
d by
the
polic
e fo
rce
Car
e &
Tre
atm
ent
Sho
rtage
of T
rain
ed s
taff
Cod
e of
eth
ics
mor
e al
l cat
egor
ies
of h
ealth
wor
kers
no
nexi
sten
t.
Poo
r hea
lth c
are
prov
ided
O
verc
row
ding
and
long
wai
ting
perio
d at
hea
lth c
ente
rs
Sho
rtage
of d
rugs
& m
edic
al s
uppl
ies
Pro
vide
mor
e tra
ined
med
ical
per
sonn
el
Pro
mot
e re
gula
r/ in
crea
sed
visi
ts to
com
mun
ities
by
heal
th c
are
wor
kers
E
ncou
rage
and
pro
vide
trai
ning
for c
omm
unity
vol
unte
ers
Pro
vide
bet
ter t
reat
men
t, dr
ugs
and
med
ical
sup
plie
s in
com
mun
ities
REGION 2
HEALTH
Faci
litie
s M
ore/
Impr
oved
faci
litie
s ne
eded
P
rovi
de b
ette
r fac
ilitie
s
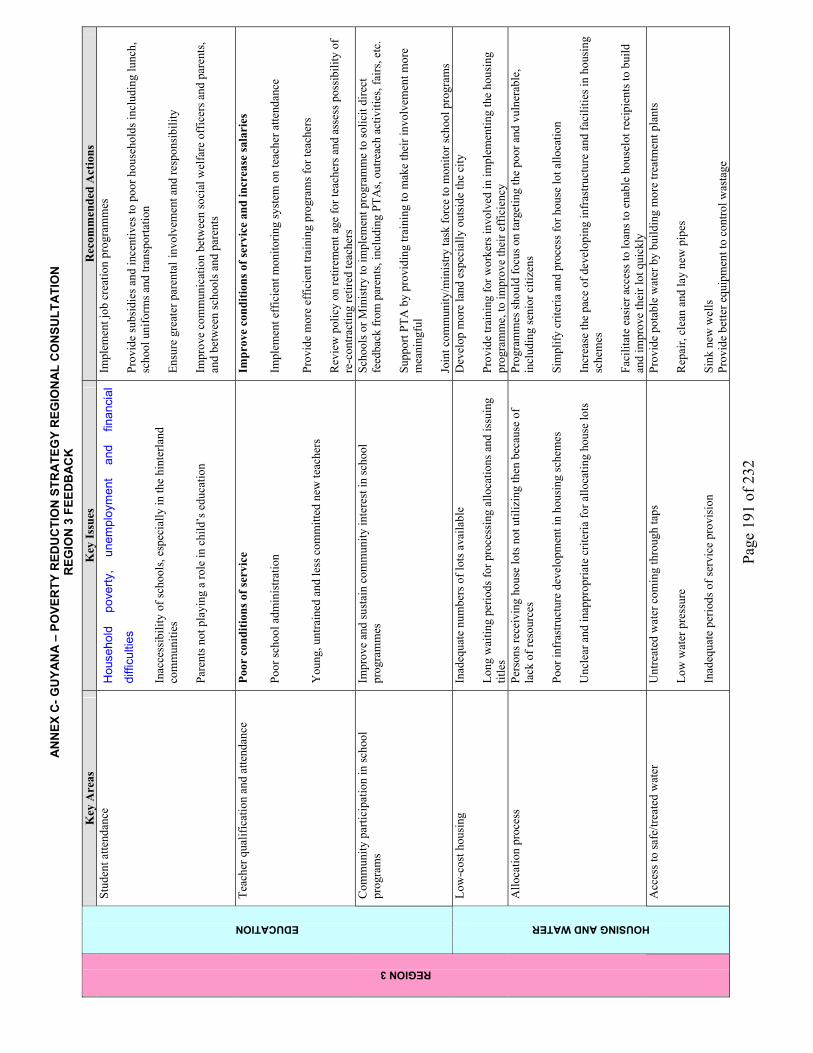
AN
NEX
C- G
UYA
NA
– P
OVE
RTY
RED
UC
TIO
N S
TRA
TEG
Y R
EGIO
NA
L C
ON
SULT
ATI
ON
R
EGIO
N 3
FEE
DB
AC
K
Page
191
of 2
32
Key
Are
as
Key
Issu
es
Rec
omm
ende
d A
ctio
ns
Stud
ent a
ttend
ance
H
ouse
hold
po
verty
, un
empl
oym
ent
and
finan
cial
di
fficu
lties
In
acce
ssib
ility
of s
choo
ls, e
spec
ially
in th
e hi
nter
land
co
mm
uniti
es
Pare
nts n
ot p
layi
ng a
role
in c
hild
’s e
duca
tion
Impl
emen
t job
cre
atio
n pr
ogra
mm
es
Prov
ide
subs
idie
s and
ince
ntiv
es to
poo
r hou
seho
lds i
nclu
ding
lunc
h,
scho
ol u
nifo
rms a
nd tr
ansp
orta
tion
Ensu
re g
reat
er p
aren
tal i
nvol
vem
ent a
nd re
spon
sibi
lity
Impr
ove
com
mun
icat
ion
betw
een
soci
al w
elfa
re o
ffic
ers a
nd p
aren
ts,
and
betw
een
scho
ols a
nd p
aren
ts
Teac
her q
ualif
icat
ion
and
atte
ndan
ce
Poor
con
ditio
ns o
f ser
vice
Po
or sc
hool
adm
inis
tratio
n Y
oung
, unt
rain
ed a
nd le
ss c
omm
itted
new
teac
hers
Impr
ove
cond
ition
s of s
ervi
ce a
nd in
crea
se sa
lari
es
Impl
emen
t eff
icie
nt m
onito
ring
syst
em o
n te
ache
r atte
ndan
ce
Prov
ide
mor
e ef
ficie
nt tr
aini
ng p
rogr
ams f
or te
ache
rs
Rev
iew
pol
icy
on re
tirem
ent a
ge fo
r tea
cher
s and
ass
ess p
ossi
bilit
y of
re
-con
tract
ing
retir
ed te
ache
rs
EDUCATION
Com
mun
ity p
artic
ipat
ion
in sc
hool
pr
ogra
ms
Impr
ove
and
sust
ain
com
mun
ity in
tere
st in
scho
ol
prog
ram
mes
Sc
hool
s or M
inis
try to
impl
emen
t pro
gram
me
to so
licit
dire
ct
feed
back
from
par
ents
, inc
ludi
ng P
TAs,
outre
ach
activ
ities
, fai
rs, e
tc.
Supp
ort P
TA b
y pr
ovid
ing
train
ing
to m
ake
thei
r inv
olve
men
t mor
e m
eani
ngfu
l Jo
int c
omm
unity
/min
istry
task
forc
e to
mon
itor s
choo
l pro
gram
s Lo
w-c
ost h
ousi
ng
Inad
equa
te n
umbe
rs o
f lot
s ava
ilabl
e Lo
ng w
aitin
g pe
riods
for p
roce
ssin
g al
loca
tions
and
issu
ing
title
s
Dev
elop
mor
e la
nd e
spec
ially
out
side
the
city
Pr
ovid
e tra
inin
g fo
r wor
kers
invo
lved
in im
plem
entin
g th
e ho
usin
g pr
ogra
mm
e, to
impr
ove
thei
r eff
icie
ncy
Allo
catio
n pr
oces
s Pe
rson
s rec
eivi
ng h
ouse
lots
not
util
izin
g th
en b
ecau
se o
f la
ck o
f res
ourc
es
Poor
infr
astru
ctur
e de
velo
pmen
t in
hous
ing
sche
mes
U
ncle
ar a
nd in
appr
opria
te c
riter
ia fo
r allo
catin
g ho
use
lots
Prog
ram
mes
shou
ld fo
cus o
n ta
rget
ing
the
poor
and
vul
nera
ble,
in
clud
ing
seni
or c
itize
ns
Sim
plify
crit
eria
and
pro
cess
for h
ouse
lot a
lloca
tion
Incr
ease
the
pace
of d
evel
opin
g in
fras
truct
ure
and
faci
litie
s in
hous
ing
sche
mes
Fa
cilit
ate
easi
er a
cces
s to
loan
s to
enab
le h
ouse
lot r
ecip
ient
s to
build
an
d im
prov
e th
eir l
ot q
uick
ly
REGION 3
HOUSING AND WATER
Acc
ess t
o sa
fe/tr
eate
d w
ater
U
ntre
ated
wat
er c
omin
g th
roug
h ta
ps
Low
wat
er p
ress
ure
Inad
equa
te p
erio
ds o
f ser
vice
pro
visi
on
Prov
ide
pota
ble
wat
er b
y bu
ildin
g m
ore
treat
men
t pla
nts
Rep
air,
clea
n an
d la
y ne
w p
ipes
Si
nk n
ew w
ells
Pr
ovid
e be
tter e
quip
men
t to
cont
rol w
asta
ge
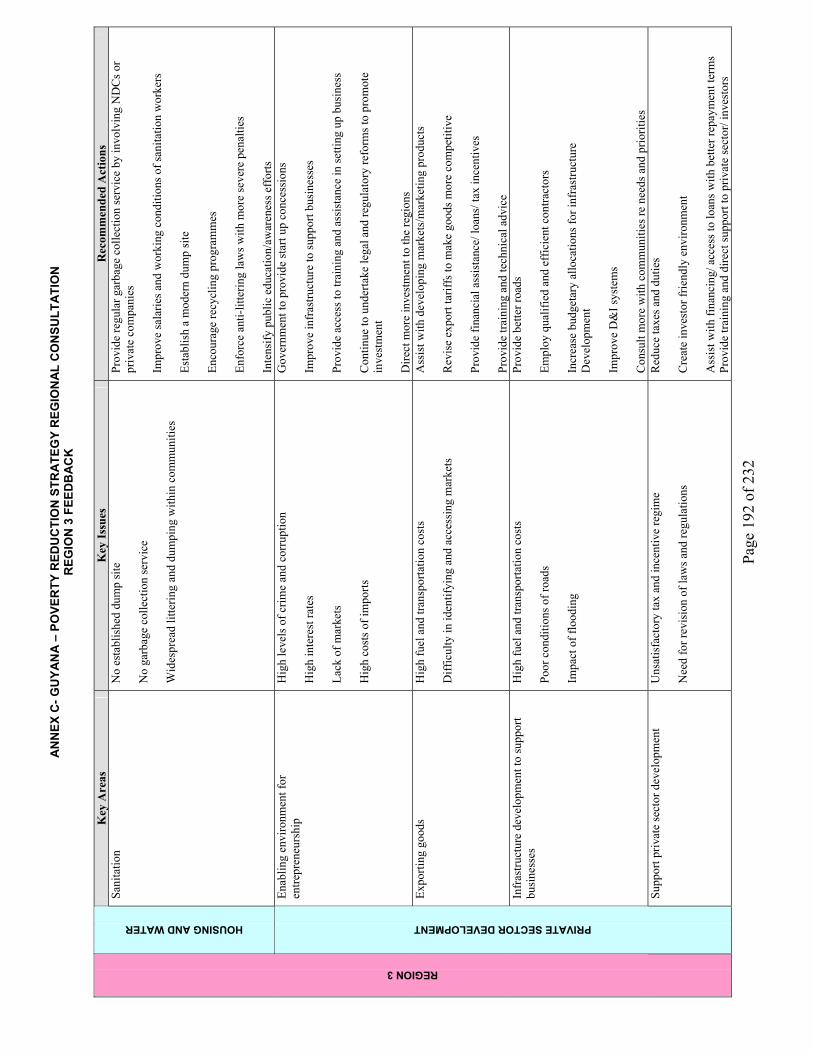
AN
NEX
C- G
UYA
NA
– P
OVE
RTY
RED
UC
TIO
N S
TRA
TEG
Y R
EGIO
NA
L C
ON
SULT
ATI
ON
R
EGIO
N 3
FEE
DB
AC
K
Page
192
of 2
32
Key
Are
as
Key
Issu
es
Rec
omm
ende
d A
ctio
ns
HOUSING AND WATER Sa
nita
tion
N
o es
tabl
ishe
d du
mp
site
N
o ga
rbag
e co
llect
ion
serv
ice
Wid
espr
ead
litte
ring
and
dum
ping
with
in c
omm
uniti
es
Prov
ide
regu
lar g
arba
ge c
olle
ctio
n se
rvic
e by
invo
lvin
g N
DC
s or
priv
ate
com
pani
es
Impr
ove
sala
ries a
nd w
orki
ng c
ondi
tions
of s
anita
tion
wor
kers
Es
tabl
ish
a m
oder
n du
mp
site
En
cour
age
recy
clin
g pr
ogra
mm
es
Enfo
rce
anti-
litte
ring
law
s with
mor
e se
vere
pen
altie
s In
tens
ify p
ublic
edu
catio
n/aw
aren
ess e
ffor
ts
Enab
ling
envi
ronm
ent f
or
entre
pren
eurs
hip
Hig
h le
vels
of c
rime
and
corr
uptio
n H
igh
inte
rest
rate
s La
ck o
f mar
kets
H
igh
cost
s of i
mpo
rts
Gov
ernm
ent t
o pr
ovid
e st
art u
p co
nces
sion
s Im
prov
e in
fras
truct
ure
to su
ppor
t bus
ines
ses
Prov
ide
acce
ss to
trai
ning
and
ass
ista
nce
in se
tting
up
busi
ness
C
ontin
ue to
und
erta
ke le
gal a
nd re
gula
tory
refo
rms t
o pr
omot
e in
vest
men
t D
irect
mor
e in
vest
men
t to
the
regi
ons
Expo
rting
goo
ds
Hig
h fu
el a
nd tr
ansp
orta
tion
cost
s D
iffic
ulty
in id
entif
ying
and
acc
essi
ng m
arke
ts
Ass
ist w
ith d
evel
opin
g m
arke
ts/m
arke
ting
prod
ucts
R
evis
e ex
port
tarif
fs to
mak
e go
ods m
ore
com
petit
ive
Prov
ide
finan
cial
ass
ista
nce/
loan
s/ ta
x in
cent
ives
Pr
ovid
e tra
inin
g an
d te
chni
cal a
dvic
e In
fras
truct
ure
deve
lopm
ent t
o su
ppor
t bu
sine
sses
H
igh
fuel
and
tran
spor
tatio
n co
sts
Poor
con
ditio
ns o
f roa
ds
Impa
ct o
f flo
odin
g
Prov
ide
bette
r roa
ds
Empl
oy q
ualif
ied
and
effic
ient
con
tract
ors
Incr
ease
bud
geta
ry a
lloca
tions
for i
nfra
stru
ctur
e
Dev
elop
men
t Im
prov
e D
&I s
yste
ms
Con
sult
mor
e w
ith c
omm
uniti
es re
nee
ds a
nd p
riorit
ies
REGION 3
PRIVATE SECTOR DEVELOPMENT
Supp
ort p
rivat
e se
ctor
dev
elop
men
t U
nsat
isfa
ctor
y ta
x an
d in
cent
ive
regi
me
Nee
d fo
r rev
isio
n of
law
s and
regu
latio
ns
Red
uce
taxe
s and
dut
ies
Cre
ate
inve
stor
frie
ndly
env
ironm
ent
Ass
ist w
ith fi
nanc
ing/
acc
ess t
o lo
ans w
ith b
ette
r rep
aym
ent t
erm
s Pr
ovid
e tra
inin
g an
d di
rect
supp
ort t
o pr
ivat
e se
ctor
/ inv
esto
rs
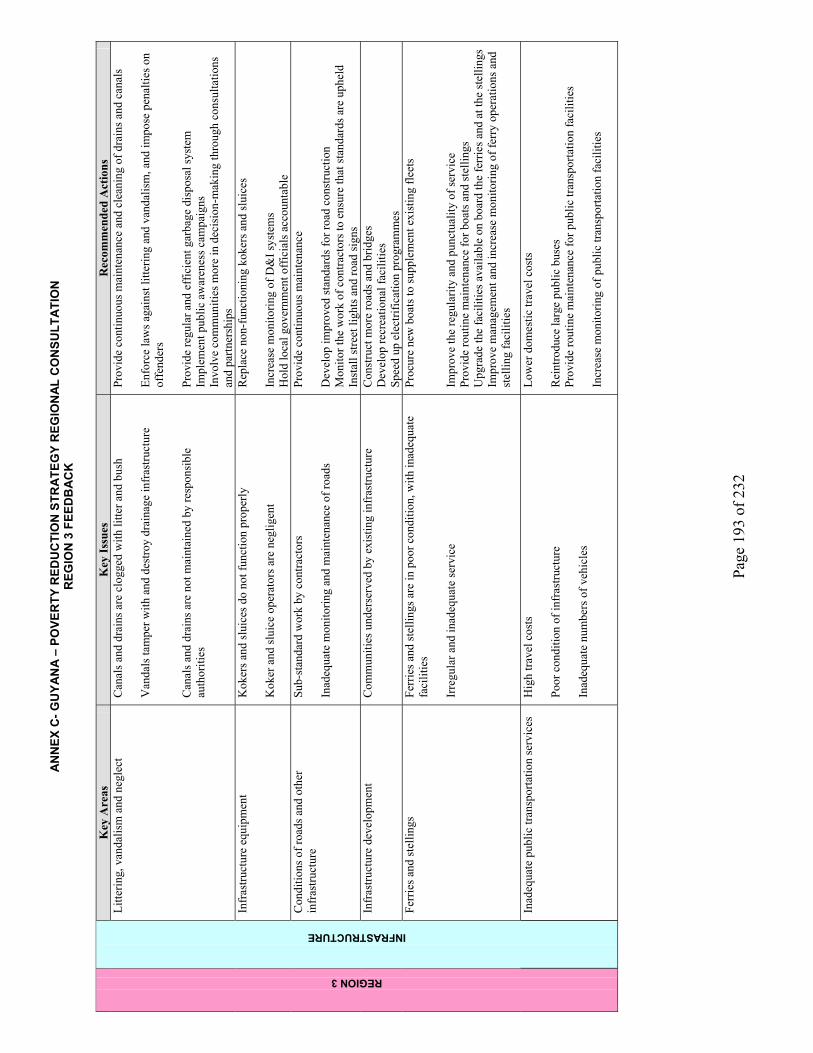
AN
NEX
C- G
UYA
NA
– P
OVE
RTY
RED
UC
TIO
N S
TRA
TEG
Y R
EGIO
NA
L C
ON
SULT
ATI
ON
R
EGIO
N 3
FEE
DB
AC
K
Page
193
of 2
32
Key
Are
as
Key
Issu
es
Rec
omm
ende
d A
ctio
ns
Litte
ring,
van
dalis
m a
nd n
egle
ct
Can
als a
nd d
rain
s are
clo
gged
with
litte
r and
bus
h V
anda
ls ta
mpe
r with
and
des
troy
drai
nage
infr
astru
ctur
e C
anal
s and
dra
ins a
re n
ot m
aint
aine
d by
resp
onsi
ble
auth
oriti
es
Prov
ide
cont
inuo
us m
aint
enan
ce a
nd c
lean
ing
of d
rain
s and
can
als
Enfo
rce
law
s aga
inst
litte
ring
and
vand
alis
m, a
nd im
pose
pen
altie
s on
offe
nder
s Pr
ovid
e re
gula
r and
eff
icie
nt g
arba
ge d
ispo
sal s
yste
m
Impl
emen
t pub
lic a
war
enes
s cam
paig
ns
Invo
lve
com
mun
ities
mor
e in
dec
isio
n-m
akin
g th
roug
h co
nsul
tatio
ns
and
partn
ersh
ips
Infr
astru
ctur
e eq
uipm
ent
Kok
ers a
nd sl
uice
s do
not f
unct
ion
prop
erly
K
oker
and
slui
ce o
pera
tors
are
neg
ligen
t
Rep
lace
non
-fun
ctio
ning
kok
ers a
nd sl
uice
s In
crea
se m
onito
ring
of D
&I s
yste
ms
Hol
d lo
cal g
over
nmen
t off
icia
ls a
ccou
ntab
le
Con
ditio
ns o
f roa
ds a
nd o
ther
in
fras
truct
ure
Sub-
stan
dard
wor
k by
con
tract
ors
Inad
equa
te m
onito
ring
and
mai
nten
ance
of r
oads
Prov
ide
cont
inuo
us m
aint
enan
ce
Dev
elop
impr
oved
stan
dard
s for
road
con
stru
ctio
n
Mon
itor t
he w
ork
of c
ontra
ctor
s to
ensu
re th
at st
anda
rds a
re u
phel
d In
stal
l stre
et li
ghts
and
road
sign
s In
fras
truct
ure
deve
lopm
ent
Com
mun
ities
und
erse
rved
by
exis
ting
infr
astru
ctur
e C
onst
ruct
mor
e ro
ads a
nd b
ridge
s D
evel
op re
crea
tiona
l fac
ilitie
s Sp
eed
up e
lect
rific
atio
n pr
ogra
mm
es
Ferr
ies a
nd st
ellin
gs
Ferr
ies a
nd st
ellin
gs a
re in
poo
r con
ditio
n, w
ith in
adeq
uate
fa
cilit
ies
Irre
gula
r and
inad
equa
te se
rvic
e
Proc
ure
new
boa
ts to
supp
lem
ent e
xist
ing
fleet
s Im
prov
e th
e re
gula
rity
and
punc
tual
ity o
f ser
vice
Pr
ovid
e ro
utin
e m
aint
enan
ce fo
r boa
ts a
nd st
ellin
gs
Upg
rade
the
faci
litie
s ava
ilabl
e on
boa
rd th
e fe
rrie
s and
at t
he st
ellin
gs
Impr
ove
man
agem
ent a
nd in
crea
se m
onito
ring
of fe
rry
oper
atio
ns a
nd
stel
ling
faci
litie
s
REGION 3
INFRASTRUCTURE
Inad
equa
te p
ublic
tran
spor
tatio
n se
rvic
es
Hig
h tra
vel c
osts
Po
or c
ondi
tion
of in
fras
truct
ure
In
adeq
uate
num
bers
of v
ehic
les
Low
er d
omes
tic tr
avel
cos
ts
Rei
ntro
duce
larg
e pu
blic
bus
es
Prov
ide
rout
ine
mai
nten
ance
for p
ublic
tran
spor
tatio
n fa
cilit
ies
Incr
ease
mon
itorin
g of
pub
lic tr
ansp
orta
tion
faci
litie
s
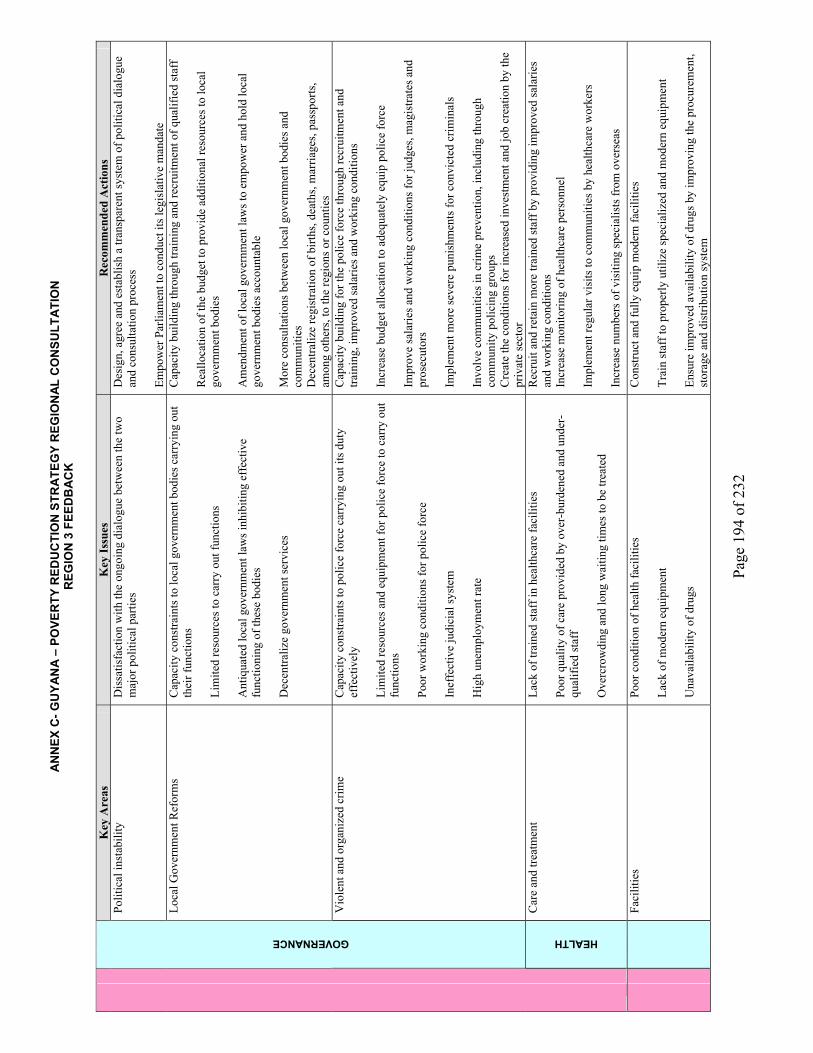
AN
NEX
C- G
UYA
NA
– P
OVE
RTY
RED
UC
TIO
N S
TRA
TEG
Y R
EGIO
NA
L C
ON
SULT
ATI
ON
R
EGIO
N 3
FEE
DB
AC
K
Page
194
of 2
32
Key
Are
as
Key
Issu
es
Rec
omm
ende
d A
ctio
ns
Polit
ical
inst
abili
ty
Dis
satis
fact
ion
with
the
ongo
ing
dial
ogue
bet
wee
n th
e tw
o m
ajor
pol
itica
l par
ties
Des
ign,
agr
ee a
nd e
stab
lish
a tra
nspa
rent
syst
em o
f pol
itica
l dia
logu
e an
d co
nsul
tatio
n pr
oces
s Em
pow
er P
arlia
men
t to
cond
uct i
ts le
gisl
ativ
e m
anda
te
Loca
l Gov
ernm
ent R
efor
ms
Cap
acity
con
stra
ints
to lo
cal g
over
nmen
t bod
ies c
arry
ing
out
thei
r fun
ctio
ns
Lim
ited
reso
urce
s to
carr
y ou
t fun
ctio
ns
Ant
iqua
ted
loca
l gov
ernm
ent l
aws i
nhib
iting
eff
ectiv
e fu
nctio
ning
of t
hese
bod
ies
Dec
entra
lize
gove
rnm
ent s
ervi
ces
Cap
acity
bui
ldin
g th
roug
h tra
inin
g an
d re
crui
tmen
t of q
ualif
ied
staf
f R
eallo
catio
n of
the
budg
et to
pro
vide
add
ition
al re
sour
ces t
o lo
cal
gove
rnm
ent b
odie
s A
men
dmen
t of l
ocal
gov
ernm
ent l
aws t
o em
pow
er a
nd h
old
loca
l go
vern
men
t bod
ies a
ccou
ntab
le
Mor
e co
nsul
tatio
ns b
etw
een
loca
l gov
ernm
ent b
odie
s and
co
mm
uniti
es
Dec
entra
lize
regi
stra
tion
of b
irths
, dea
ths,
mar
riage
s, pa
sspo
rts,
amon
g ot
hers
, to
the
regi
ons o
r cou
ntie
s
GOVERNANCE
Vio
lent
and
org
aniz
ed c
rime
Cap
acity
con
stra
ints
to p
olic
e fo
rce
carr
ying
out
its d
uty
effe
ctiv
ely
Lim
ited
reso
urce
s and
equ
ipm
ent f
or p
olic
e fo
rce
to c
arry
out
fu
nctio
ns
Poor
wor
king
con
ditio
ns fo
r pol
ice
forc
e In
effe
ctiv
e ju
dici
al sy
stem
H
igh
unem
ploy
men
t rat
e
Cap
acity
bui
ldin
g fo
r the
pol
ice
forc
e th
roug
h re
crui
tmen
t and
tra
inin
g, im
prov
ed sa
larie
s and
wor
king
con
ditio
ns
Incr
ease
bud
get a
lloca
tion
to a
dequ
atel
y eq
uip
polic
e fo
rce
Impr
ove
sala
ries a
nd w
orki
ng c
ondi
tions
for j
udge
s, m
agis
trate
s and
pr
osec
utor
s Im
plem
ent m
ore
seve
re p
unis
hmen
ts fo
r con
vict
ed c
rimin
als
Invo
lve
com
mun
ities
in c
rime
prev
entio
n, in
clud
ing
thro
ugh
com
mun
ity p
olic
ing
grou
ps
Cre
ate
the
cond
ition
s for
incr
ease
d in
vest
men
t and
job
crea
tion
by th
e pr
ivat
e se
ctor
HEALTH
Car
e an
d tre
atm
ent
Lack
of t
rain
ed st
aff i
n he
alth
care
faci
litie
s Po
or q
ualit
y of
car
e pr
ovid
ed b
y ov
er-b
urde
ned
and
unde
r-qu
alifi
ed st
aff
Ove
rcro
wdi
ng a
nd lo
ng w
aitin
g tim
es to
be
treat
ed
Rec
ruit
and
reta
in m
ore
train
ed st
aff b
y pr
ovid
ing
impr
oved
sala
ries
and
wor
king
con
ditio
ns
Incr
ease
mon
itorin
g of
hea
lthca
re p
erso
nnel
Im
plem
ent r
egul
ar v
isits
to c
omm
uniti
es b
y he
alth
care
wor
kers
In
crea
se n
umbe
rs o
f vis
iting
spec
ialis
ts fr
om o
vers
eas
Faci
litie
s Po
or c
ondi
tion
of h
ealth
faci
litie
s La
ck o
f mod
ern
equi
pmen
t U
nava
ilabi
lity
of d
rugs
Con
stru
ct a
nd fu
lly e
quip
mod
ern
faci
litie
s Tr
ain
staf
f to
prop
erly
util
ize
spec
ializ
ed a
nd m
oder
n eq
uipm
ent
Ensu
re im
prov
ed a
vaila
bilit
y of
dru
gs b
y im
prov
ing
the
proc
urem
ent,
stor
age
and
dist
ribut
ion
syst
em
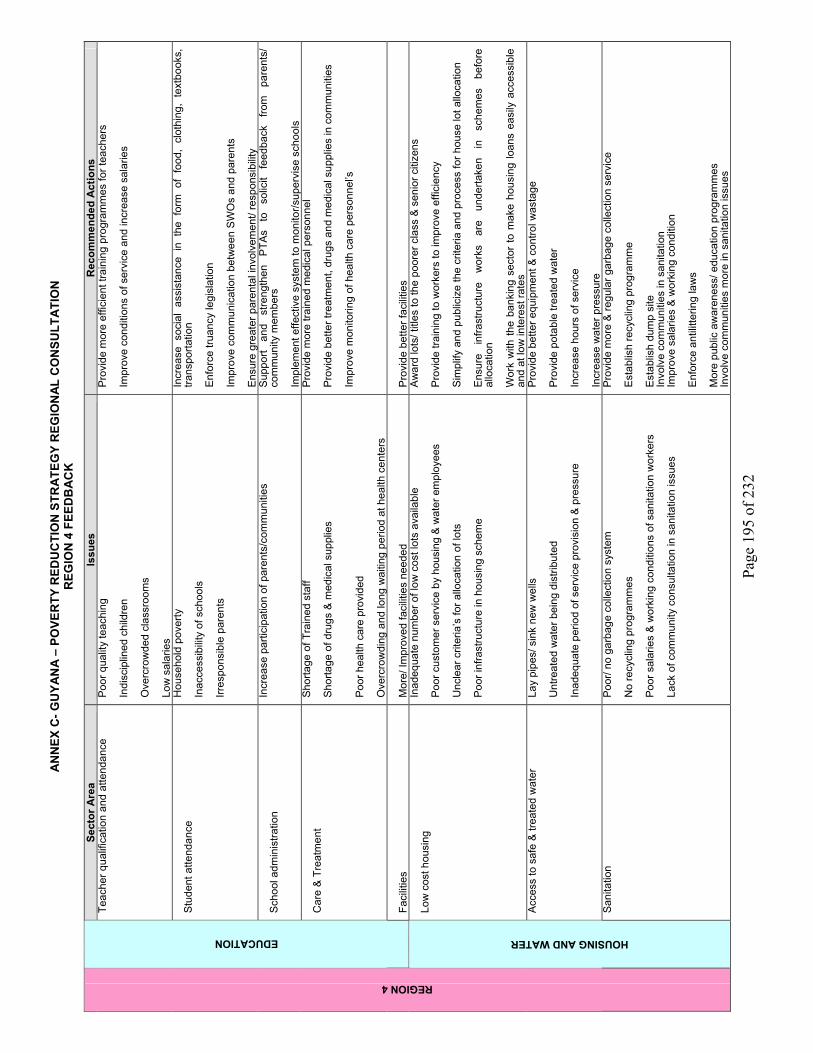
AN
NEX
C- G
UYA
NA
– P
OVE
RTY
RED
UC
TIO
N S
TRA
TEG
Y R
EGIO
NA
L C
ON
SULT
ATI
ON
R
EGIO
N 4
FEE
DB
AC
K
Page
195
of 2
32
Sect
or A
rea
Issu
es
Rec
omm
ende
d A
ctio
ns
Teac
her q
ualif
icat
ion
and
atte
ndan
ce
Poo
r qua
lity
teac
hing
In
disc
iplin
ed c
hild
ren
Ove
rcro
wde
d cl
assr
oom
s Lo
w s
alar
ies
Pro
vide
mor
e ef
ficie
nt tr
aini
ng p
rogr
amm
es fo
r tea
cher
s Im
prov
e co
nditi
ons
of s
ervi
ce a
nd in
crea
se s
alar
ies
Stu
dent
atte
ndan
ce
Hou
seho
ld p
over
ty
Inac
cess
ibili
ty o
f sch
ools
Irr
espo
nsib
le p
aren
ts
Incr
ease
soc
ial
assi
stan
ce i
n th
e fo
rm o
f fo
od,
clot
hing
, te
xtbo
oks,
tra
nspo
rtatio
n E
nfor
ce tr
uanc
y le
gisl
atio
n Im
prov
e co
mm
unic
atio
n be
twee
n S
WO
s an
d pa
rent
s E
nsur
e gr
eate
r par
enta
l inv
olve
men
t/ re
spon
sibi
lity
Sch
ool a
dmin
istra
tion
Incr
ease
par
ticip
atio
n of
par
ents
/com
mun
ities
S
uppo
rt an
d st
reng
then
P
TAs
to
solic
it fe
edba
ck
from
pa
rent
s/
com
mun
ity m
embe
rs
Impl
emen
t effe
ctiv
e sy
stem
to m
onito
r/sup
ervi
se s
choo
ls
Car
e &
Tre
atm
ent
Sho
rtage
of T
rain
ed s
taff
Sho
rtage
of d
rugs
& m
edic
al s
uppl
ies
P
oor h
ealth
car
e pr
ovid
ed
Ove
rcro
wdi
ng a
nd lo
ng w
aitin
g pe
riod
at h
ealth
cen
ters
Pro
vide
mor
e tra
ined
med
ical
per
sonn
el
Pro
vide
bet
ter t
reat
men
t, dr
ugs
and
med
ical
sup
plie
s in
com
mun
ities
Im
prov
e m
onito
ring
of h
ealth
car
e pe
rson
nel’s
EDUCATION
Faci
litie
s M
ore/
Impr
oved
faci
litie
s ne
eded
P
rovi
de b
ette
r fac
ilitie
s Lo
w c
ost h
ousi
ng
Inad
equa
te n
umbe
r of l
ow c
ost l
ots
avai
labl
e P
oor c
usto
mer
ser
vice
by
hous
ing
& w
ater
em
ploy
ees
Unc
lear
crit
eria
’s fo
r allo
catio
n of
lots
P
oor i
nfra
stru
ctur
e in
hou
sing
sch
eme
Aw
ard
lots
/ titl
es to
the
poor
er c
lass
& s
enio
r citi
zens
P
rovi
de tr
aini
ng to
wor
kers
to im
prov
e ef
ficie
ncy
Sim
plify
and
pub
liciz
e th
e cr
iteria
and
pro
cess
for h
ouse
lot a
lloca
tion
Ens
ure
infra
stru
ctur
e w
orks
ar
e un
derta
ken
in
sche
mes
be
fore
al
loca
tion
Wor
k w
ith th
e ba
nkin
g se
ctor
to m
ake
hous
ing
loan
s ea
sily
acc
essi
ble
and
at lo
w in
tere
st ra
tes
Acc
ess
to s
afe
& tre
ated
wat
er
Lay
pipe
s/ s
ink
new
wel
ls
Unt
reat
ed w
ater
bei
ng d
istri
bute
d In
adeq
uate
per
iod
of s
ervi
ce p
rovi
sion
& p
ress
ure
Pro
vide
bet
ter e
quip
men
t & c
ontro
l was
tage
P
rovi
de p
otab
le tr
eate
d w
ater
In
crea
se h
ours
of s
ervi
ce
Incr
ease
wat
er p
ress
ure
REGION 4
HOUSING AND WATER
San
itatio
n P
oor/
no g
arba
ge c
olle
ctio
n sy
stem
N
o re
cycl
ing
prog
ram
mes
P
oor s
alar
ies
& w
orki
ng c
ondi
tions
of s
anita
tion
wor
kers
La
ck o
f com
mun
ity c
onsu
ltatio
n in
san
itatio
n is
sues
Pro
vide
mor
e &
regu
lar g
arba
ge c
olle
ctio
n se
rvic
e E
stab
lish
recy
clin
g pr
ogra
mm
e E
stab
lish
dum
p si
te
Invo
lve
com
mun
ities
in s
anita
tion
Im
prov
e sa
larie
s &
wor
king
con
ditio
n E
nfor
ce a
ntili
tterin
g la
ws
Mor
e pu
blic
aw
aren
ess/
edu
catio
n pr
ogra
mm
es
Invo
lve
com
mun
ities
mor
e in
san
itatio
n is
sues
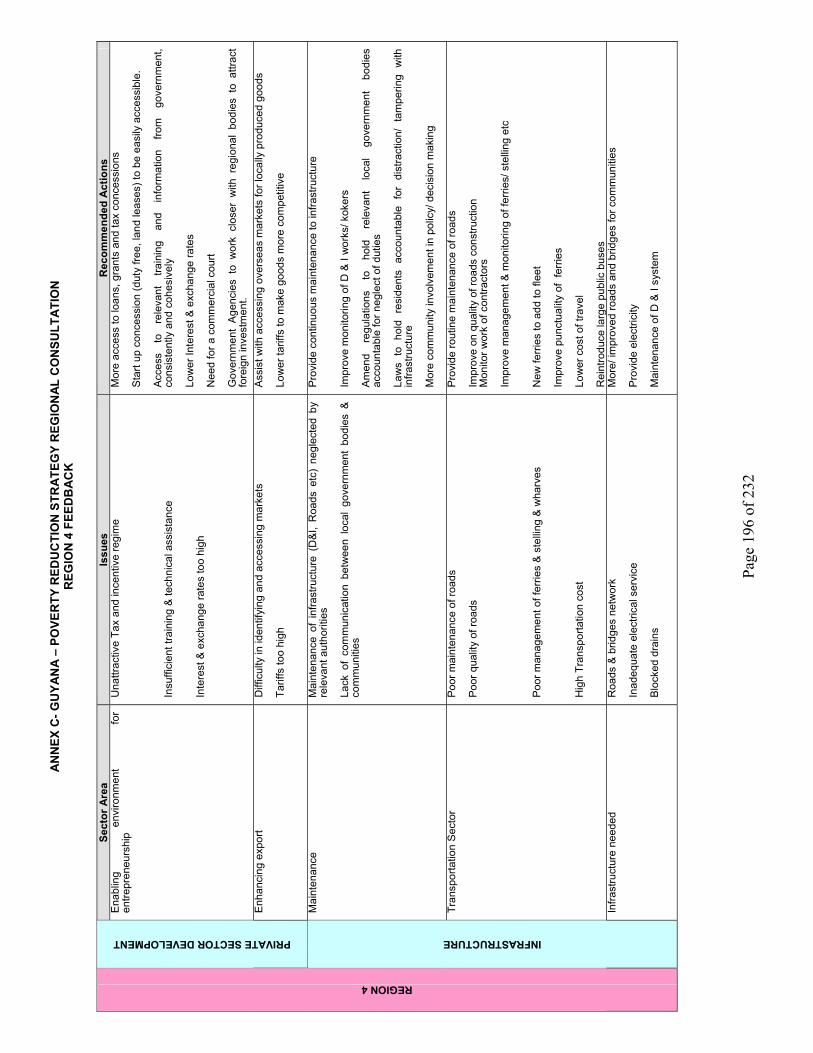
AN
NEX
C- G
UYA
NA
– P
OVE
RTY
RED
UC
TIO
N S
TRA
TEG
Y R
EGIO
NA
L C
ON
SULT
ATI
ON
R
EGIO
N 4
FEE
DB
AC
K
Page
196
of 2
32
Sect
or A
rea
Issu
es
Rec
omm
ende
d A
ctio
ns
Ena
blin
g en
viro
nmen
t fo
r en
trepr
eneu
rshi
p
Una
ttrac
tive
Tax
and
ince
ntiv
e re
gim
e
Insu
ffici
ent t
rain
ing
& te
chni
cal a
ssis
tanc
e In
tere
st &
exc
hang
e ra
tes
too
high
Mor
e ac
cess
to lo
ans,
gra
nts
and
tax
conc
essi
ons
Sta
rt up
con
cess
ion
(dut
y fre
e, la
nd le
ases
) to
be e
asily
acc
essi
ble.
A
cces
s to
re
leva
nt
train
ing
and
info
rmat
ion
from
go
vern
men
t,
cons
iste
ntly
and
coh
esiv
ely
Lo
wer
Inte
rest
& e
xcha
nge
rate
s N
eed
for a
com
mer
cial
cou
rt G
over
nmen
t A
genc
ies
to w
ork
clos
er w
ith r
egio
nal
bodi
es t
o at
tract
fo
reig
n in
vest
men
t.
PRIVATE SECTOR DEVELOPMENT
Enh
anci
ng e
xpor
t D
iffic
ulty
in id
entif
ying
and
acc
essi
ng m
arke
ts
Tarif
fs to
o hi
gh
Ass
ist w
ith a
cces
sing
ove
rsea
s m
arke
ts fo
r loc
ally
pro
duce
d go
ods
Low
er ta
riffs
to m
ake
good
s m
ore
com
petit
ive
M
aint
enan
ce
Mai
nten
ance
of
infra
stru
ctur
e (D
&I,
Roa
ds e
tc)
negl
ecte
d by
re
leva
nt a
utho
ritie
s La
ck o
f co
mm
unic
atio
n be
twee
n lo
cal
gove
rnm
ent
bodi
es &
co
mm
uniti
es
Pro
vide
con
tinuo
us m
aint
enan
ce to
infra
stru
ctur
e
Impr
ove
mon
itorin
g of
D &
I w
orks
/ kok
ers
Am
end
regu
latio
ns
to
hold
re
leva
nt
loca
l go
vern
men
t bo
dies
ac
coun
tabl
e fo
r neg
lect
of d
utie
s La
ws
to h
old
resi
dent
s ac
coun
tabl
e fo
r di
stra
ctio
n/ t
ampe
ring
with
in
frast
ruct
ure
Mor
e co
mm
unity
invo
lvem
ent i
n po
licy/
dec
isio
n m
akin
g
Tran
spor
tatio
n S
ecto
r P
oor m
aint
enan
ce o
f roa
ds
Poo
r qua
lity
of ro
ads
Poo
r man
agem
ent o
f fer
ries
& s
telli
ng &
wha
rves
H
igh
Tran
spor
tatio
n co
st
Pro
vide
rout
ine
mai
nten
ance
of r
oads
Im
prov
e on
qua
lity
of ro
ads
cons
truct
ion
Mon
itor w
ork
of c
ontra
ctor
s Im
prov
e m
anag
emen
t & m
onito
ring
of fe
rrie
s/ s
telli
ng e
tc
New
ferr
ies
to a
dd to
flee
t Im
prov
e pu
nctu
ality
of
ferr
ies
Low
er c
ost o
f tra
vel
Rei
ntro
duce
larg
e pu
blic
bus
es
REGION 4
INFRASTRUCTURE
Infra
stru
ctur
e ne
eded
R
oads
& b
ridge
s ne
twor
k
Inad
equa
te e
lect
rical
ser
vice
B
lock
ed d
rain
s
Mor
e/ im
prov
ed ro
ads
and
brid
ges
for c
omm
uniti
es
Pro
vide
ele
ctric
ity
Mai
nten
ance
of D
& I
syst
em

AN
NEX
C- G
UYA
NA
– P
OVE
RTY
RED
UC
TIO
N S
TRA
TEG
Y R
EGIO
NA
L C
ON
SULT
ATI
ON
R
EGIO
N 4
FEE
DB
AC
K
Page
197
of 2
32
Sect
or A
rea
Issu
es
Rec
omm
ende
d A
ctio
ns
Pol
itica
l ins
tabi
lity
Dis
satis
fact
ion
with
ong
oing
dia
logu
e be
twee
n th
e tw
o m
ajor
po
litic
al p
artie
s
Des
ign
syst
em th
at e
nsur
es c
onst
ruct
ive
dial
ogue
bet
wee
n G
over
nmen
t and
all
oppo
sitio
n pa
rties
Lo
cal G
over
nmen
t ref
orm
s P
oor c
omm
unic
atio
n be
twee
n lo
cal g
over
nmen
t bod
ies
and
com
mun
ities
N
eed
for t
rans
pare
ncy
in lo
cal g
over
nmen
t bod
ies
Lim
ited
reso
urce
s to
car
ry o
ut fu
nctio
ns
Mor
e co
nsul
tatio
ns b
etw
een
loca
l gov
ernm
ent b
odie
s an
d co
mm
uniti
es
Impr
ove
train
ing
and
mon
itorin
g of
loca
l gov
ernm
ent b
odie
s Im
prov
e ta
x co
llect
ion
syst
em
GOVERNANCE
Vio
lent
and
org
aniz
ed c
rime
Cap
acity
con
stra
ints
to p
olic
e fo
rce
carr
ying
out
its
duty
ef
fect
ivel
y H
igh
unem
ploy
men
t rat
e N
eces
sity
of c
omm
unity
pol
icin
g gr
oups
Impr
ove
sala
ries,
wor
king
con
ditio
ns to
pol
ice
forc
e an
d pr
ovid
e m
ore
and
bette
r equ
ipm
ent
Cre
ate
the
envi
ronm
ent f
or in
crea
sed
inve
stm
ent a
nd jo
b cr
eatio
n by
th
e pr
ivat
e se
ctor
Im
plem
ent m
ore
seve
re p
unis
hmen
ts fo
r con
vict
ed c
rimin
als
Impr
ove
sala
ries,
trai
ning
, wor
king
con
ditio
ns o
f jud
ges,
mag
istra
tes
and
pros
ecut
ors
Pro
vide
sup
port
to c
omm
unity
pol
icin
g gr
oups
thro
ugh
the
polic
e fo
rce
Car
e &
Tre
atm
ent
Sho
rtage
of T
rain
ed s
taff
Sho
rtage
of d
rugs
& m
edic
al s
uppl
ies
P
oor h
ealth
car
e pr
ovid
ed
Ove
rcro
wdi
ng a
nd lo
ng w
aitin
g pe
riod
at h
ealth
cen
ters
Pro
vide
mor
e tra
ined
med
ical
per
sonn
el
Pro
vide
bet
ter t
reat
men
t, dr
ugs
and
med
ical
sup
plie
s in
com
mun
ities
Im
prov
e m
onito
ring
of h
ealth
car
e pe
rson
nel’s
REGION 4
HEALTH
Faci
litie
s M
ore/
Impr
oved
faci
litie
s ne
eded
P
rovi
de b
ette
r fac
ilitie
s

AN
NEX
C- G
UYA
NA
– P
OVE
RTY
RED
UC
TIO
N S
TRA
TEG
Y R
EGIO
NA
L C
ON
SULT
ATI
ON
R
EGIO
N 5
FEE
DB
AC
K
Page
198
of 2
32
Sect
or A
rea
Issu
es
Rec
omm
ende
d A
ctio
ns
Teac
her q
ualif
icat
ion
and
atte
ndan
ce
Poo
r qua
lity
teac
hing
O
verc
row
ded
clas
sroo
ms
Low
sal
arie
s
Pro
vide
mor
e ef
ficie
nt tr
aini
ng p
rogr
amm
es fo
r tea
cher
s Im
prov
e co
nditi
ons
of s
ervi
ce a
nd in
crea
se s
alar
ies
Sch
ool a
dmin
istra
tion
Incr
ease
par
ticip
atio
n of
par
ents
/com
mun
ities
S
uppo
rt an
d st
reng
then
PTA
s Im
plem
ent e
ffect
ive
syst
em to
mon
itor/s
uper
vise
sch
ools
EDUCATION
Stu
dent
atte
ndan
ce
Hou
seho
ld p
over
ty
Irres
pons
ible
par
ents
Incr
ease
soc
ial a
ssis
tanc
e in
the
form
of f
ood,
clo
thin
g, te
xtbo
oks,
tra
nspo
rtatio
n E
nfor
ce tr
uanc
y le
gisl
atio
n Im
prov
e co
mm
unic
atio
n be
twee
n S
WO
s an
d pa
rent
s Lo
w-c
ost h
ousi
ng
Inad
equa
te n
umbe
r of l
ots
avai
labl
e P
rovi
de m
ore
low
-cos
t lot
s A
lloca
tion
proc
ess
Poo
r inf
rast
ruct
ure
deve
lopm
ent i
n ho
usin
g sc
hem
es
Unc
lear
and
inap
prop
riate
crit
eria
for a
lloca
ting
hous
e lo
ts
Impr
ove
infra
stru
ctur
e in
sch
emes
to a
ttrac
t res
iden
ts
Crit
eria
for g
ivin
g lo
ts s
houl
d be
mor
e pr
o-po
or
Pro
vide
trai
ning
for w
orke
rs in
volv
ed in
the
Min
istry
’s h
ousi
ng
prog
ram
me
to im
prov
e th
eir e
ffici
ency
A
cces
s to
saf
e/tre
ated
wat
er
Unt
reat
ed w
ater
In
adeq
uate
per
iods
of s
ervi
ce
Low
wat
er p
ress
ure
Pro
vide
trea
ted
wat
er
Rep
air,
clea
n, la
y ne
w p
ipes
S
ink
new
wel
ls
Pro
vide
bet
ter e
quip
men
t (pu
mps
, met
ers)
to c
ontro
l was
tage
In
crea
se h
ours
of s
ervi
ce
HOUSING AND WATER
San
itatio
n N
o ga
rbag
e co
llect
ion
syst
em in
pla
ce
No
esta
blis
hed
dum
p si
te
Litte
ring
and
dum
ping
with
in c
omm
uniti
es
Pro
vide
regu
lar g
arba
ge c
olle
ctio
n se
rvic
e by
invo
lvin
g N
DC
E
stab
lish
a du
mps
ite a
nd re
cycl
ing
prog
ram
mes
E
nfor
ce a
nti-l
itter
ing
law
s w
ith m
ore
seve
re p
enal
ties
Impr
ove
sala
ries
and
wor
king
con
ditio
ns o
f san
itatio
n w
orke
rs
Inte
nsify
pub
lic a
war
enes
s ef
forts
E
nabl
ing
envi
ronm
ent f
or
entre
pren
eurs
hip
Hig
h le
vels
of c
rime
Hig
h in
tere
st ra
tes
Lack
of m
arke
ts
Gov
ernm
ent t
o pr
ovid
e st
artu
p co
nces
sion
s
Pro
vide
tech
nica
l adv
ice,
trai
ning
to e
ntre
pren
eurs
Im
prov
e in
frast
ruct
ure
Ass
ist w
ith m
arke
ting
Infra
stru
ctur
e de
velo
pmen
t to
supp
ort
busi
ness
P
oor c
ondi
tion
of ro
ads
Inef
fect
ive
D&
I sys
tem
s
Em
ploy
qua
lifie
d an
d ef
ficie
nt c
ontra
ctor
s Im
prov
e D
&I s
yste
ms
Con
sult
mor
e w
ith c
omm
uniti
es re
nee
ds a
nd p
riorit
ies
REGION 5
PRIVATE SECTOR DEVELOPMENT
Sup
port
to p
rivat
e se
ctor
dev
elop
men
t U
nsat
isfa
ctor
y ta
x an
d in
cent
ive
regi
me
Nee
d fo
r rev
isio
n of
bus
ines
s la
ws
Red
uce
taxe
s an
d du
ties
Ass
ist w
ith a
cces
s to
loan
s w
ith b
ette
r rep
aym
ent t
erm
s
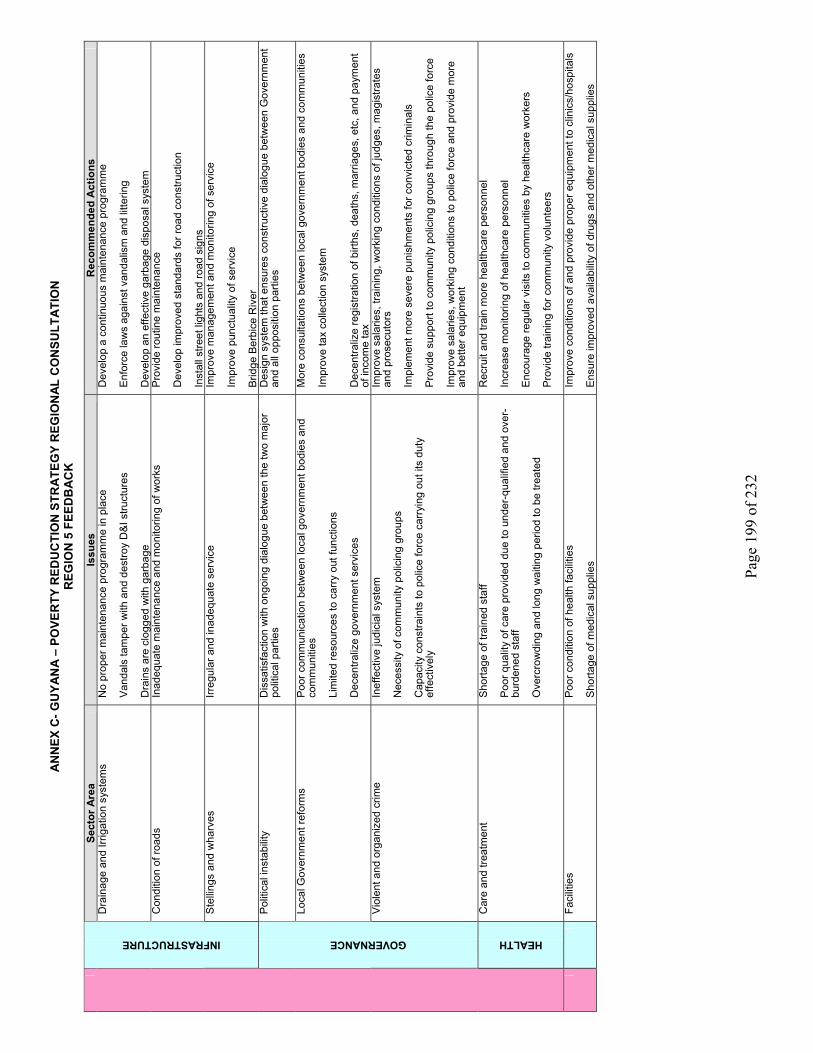
AN
NEX
C- G
UYA
NA
– P
OVE
RTY
RED
UC
TIO
N S
TRA
TEG
Y R
EGIO
NA
L C
ON
SULT
ATI
ON
R
EGIO
N 5
FEE
DB
AC
K
Page
199
of 2
32
Sect
or A
rea
Issu
es
Rec
omm
ende
d A
ctio
ns
Dra
inag
e an
d Irr
igat
ion
syst
ems
No
prop
er m
aint
enan
ce p
rogr
amm
e in
pla
ce
Van
dals
tam
per w
ith a
nd d
estro
y D
&I s
truct
ures
D
rain
s ar
e cl
ogge
d w
ith g
arba
ge
Dev
elop
a c
ontin
uous
mai
nten
ance
pro
gram
me
Enf
orce
law
s ag
ains
t van
dalis
m a
nd li
tterin
g D
evel
op a
n ef
fect
ive
garb
age
disp
osal
sys
tem
C
ondi
tion
of ro
ads
Inad
equa
te m
aint
enan
ce a
nd m
onito
ring
of w
orks
P
rovi
de ro
utin
e m
aint
enan
ce
Dev
elop
impr
oved
sta
ndar
ds fo
r roa
d co
nstru
ctio
n In
stal
l stre
et li
ghts
and
road
sig
ns
INFRASTRUCTURE
Ste
lling
s an
d w
harv
es
Irreg
ular
and
inad
equa
te s
ervi
ce
Impr
ove
man
agem
ent a
nd m
onito
ring
of s
ervi
ce
Impr
ove
punc
tual
ity o
f ser
vice
B
ridge
Ber
bice
Riv
er
Pol
itica
l ins
tabi
lity
Dis
satis
fact
ion
with
ong
oing
dia
logu
e be
twee
n th
e tw
o m
ajor
po
litic
al p
artie
s D
esig
n sy
stem
that
ens
ures
con
stru
ctiv
e di
alog
ue b
etw
een
Gov
ernm
ent
and
all o
ppos
ition
par
ties
Loca
l Gov
ernm
ent r
efor
ms
Poo
r com
mun
icat
ion
betw
een
loca
l gov
ernm
ent b
odie
s an
d co
mm
uniti
es
Lim
ited
reso
urce
s to
car
ry o
ut fu
nctio
ns
Dec
entra
lize
gove
rnm
ent s
ervi
ces
Mor
e co
nsul
tatio
ns b
etw
een
loca
l gov
ernm
ent b
odie
s an
d co
mm
uniti
es
Impr
ove
tax
colle
ctio
n sy
stem
D
ecen
traliz
e re
gist
ratio
n of
birt
hs, d
eath
s, m
arria
ges,
etc
, and
pay
men
t of
inco
me
tax
GOVERNANCE
Vio
lent
and
org
aniz
ed c
rime
Inef
fect
ive
judi
cial
sys
tem
N
eces
sity
of c
omm
unity
pol
icin
g gr
oups
C
apac
ity c
onst
rain
ts to
pol
ice
forc
e ca
rryi
ng o
ut it
s du
ty
effe
ctiv
ely
Impr
ove
sala
ries,
trai
ning
, wor
king
con
ditio
ns o
f jud
ges,
mag
istra
tes
and
pros
ecut
ors
Impl
emen
t mor
e se
vere
pun
ishm
ents
for c
onvi
cted
crim
inal
s P
rovi
de s
uppo
rt to
com
mun
ity p
olic
ing
grou
ps th
roug
h th
e po
lice
forc
e Im
prov
e sa
larie
s, w
orki
ng c
ondi
tions
to p
olic
e fo
rce
and
prov
ide
mor
e an
d be
tter e
quip
men
t
HEALTH
Car
e an
d tre
atm
ent
Sho
rtage
of t
rain
ed s
taff
Poo
r qua
lity
of c
are
prov
ided
due
to u
nder
-qua
lifie
d an
d ov
er-
burd
ened
sta
ff O
verc
row
ding
and
long
wai
ting
perio
d to
be
treat
ed
Rec
ruit
and
train
mor
e he
alth
care
per
sonn
el
Incr
ease
mon
itorin
g of
hea
lthca
re p
erso
nnel
E
ncou
rage
regu
lar v
isits
to c
omm
uniti
es b
y he
alth
care
wor
kers
P
rovi
de tr
aini
ng fo
r com
mun
ity v
olun
teer
s
Fa
cilit
ies
P
oor c
ondi
tion
of h
ealth
faci
litie
s S
horta
ge o
f med
ical
sup
plie
s
Impr
ove
cond
ition
s of
and
pro
vide
pro
per e
quip
men
t to
clin
ics/
hosp
itals
E
nsur
e im
prov
ed a
vaila
bilit
y of
dru
gs a
nd o
ther
med
ical
sup
plie
s
AN
NEX
C- G
UYA
NA
– P
OVE
RTY
RED
UC
TIO
N S
TRA
TEG
Y R
EGIO
NA
L C
ON
SULT
ATI
ON
R
EGIO
N 6
FEE
DB
AC
K
Page
200
of 2
32
Are
a Is
sues
R
ecom
men
ded
Act
ions
S
tude
nt a
ttend
ance
H
ouse
hold
pov
erty
In
acce
ssib
ility
to
scho
ol
Irres
pons
ible
par
ents
P
oor s
choo
l adm
inis
tratio
n
Incr
ease
soc
ial a
ssis
tanc
e in
the
for
m o
f tra
nspo
rt, u
nifo
rm,
text
book
s et
c P
rovi
de s
ubsi
dies
/ inc
entiv
es to
poo
r hou
seho
lds
Fost
er im
prov
ed c
omm
unic
atio
n be
twee
n sc
hool
& p
aren
ts
Rea
ch o
ut to
chi
ldre
n w
ith p
oor a
ttend
ance
reco
rds
Impr
ove
curr
icul
um to
inte
rest
chi
ldre
n E
ncou
rage
sup
port
& s
treng
then
PTA
s Te
ache
r qua
lific
atio
n &
atte
ndan
ce
Unq
ualif
ied
teac
hers
Impr
ove
sala
ry &
wor
king
con
ditio
n M
ore
effic
ient
trai
ning
pro
gram
mes
for t
each
er
Incr
ease
/ im
prov
e th
e nu
mbe
r & q
ualit
y of
SW
Os
EDUCATION
Com
mun
ity p
artic
ipat
ion
in s
choo
l pr
ogra
ms
M
oE to
sol
icit
dire
ct fe
edba
ck fr
om p
aren
ts in
com
mun
ity
MoE
to in
crea
se m
onito
ring/
sup
ervi
sion
of s
choo
ls
Low
cos
t hou
sing
P
oor i
nfra
stru
ctur
e de
velo
pmen
t in
hous
ing
area
s P
oor c
usto
mer
ser
vice
by
h&w
wor
kers
In
adeq
uate
num
ber o
f low
cos
t lot
s av
aila
ble
Impr
ove
infra
stru
ctur
e &
faci
litie
s in
hou
sing
sch
emes
P
rovi
de tr
aini
ng to
wor
kers
to im
prov
e ef
ficie
ncy
Dev
elop
land
out
side
of c
omm
erci
al a
rea
Acc
ess
to s
afe
& tre
ated
wat
er
Unt
reat
ed w
ater
In
adeq
uate
per
iod
of s
ervi
ce p
rovi
sion
P
oor w
ater
pre
ssur
e
Pro
vide
pot
able
trea
ted
wat
er
Incr
ease
hou
rs o
f ser
vice
In
crea
se w
ater
pre
ssur
e R
epai
r/ la
y/ c
lean
pip
es
HOUSING AND WATER
San
itatio
n P
oor/
no g
arba
ge c
olle
ctio
n sy
stem
N
o re
cycl
ing
prog
ram
mes
Pro
vide
mor
e &
regu
lar g
arba
ge c
olle
ctio
n se
rvic
e E
nfor
ce a
nti-l
itter
ing
law
with
pro
secu
tion/
fini
ng fo
r offe
nder
s
Est
ablis
h re
cycl
ing
prog
ram
me
Invo
lve
com
mun
ities
in s
anita
tion
M
ore
publ
ic a
war
enes
s/ e
duca
tion
prog
ram
mes
REGION 6
PRIVATE SECTOR
DEVELOPMENT
Ena
blin
g en
viro
nmen
t for
en
trepr
eneu
rshi
p
Uni
tizin
g Ta
x an
d in
cent
ive
regi
me
In
suffi
cien
t tra
inin
g, l
egal
adv
ice/
inf
orm
atio
n av
aila
ble
form
re
leva
nt g
over
nmen
t age
ncie
s
Mor
e ac
cess
to lo
ans,
gra
nts
and
tax
conc
essi
ons
Sta
rt up
con
cess
ion
(dut
y fre
e, la
nd le
ases
) to
be e
asily
acc
essi
ble.
A
cces
s to
rele
vant
trai
ning
and
info
rmat
ion
cons
iste
ntly
and
coh
esiv
ely
M
ore
Gov
ernm
ent i
nter
actio
n w
ith p
rivat
e se
ctor
and
inve
stor
s
Enh
anci
ng e
xpor
t D
iffic
ulty
in id
entif
ying
and
acc
essi
ng m
arke
ts
Hig
h fu
el c
ost
Hig
h du
ties
on im
porte
d ra
w m
ater
ials
Ass
ist w
ith a
cces
sing
ove
rsea
s m
arke
ts fo
r loc
ally
pro
duce
d go
ods
Affo
rdab
le fu
el
Rev
ise
expo
rt ta
riff t
o m
ake
good
s m
ore
com
petit
ive
AN
NEX
C- G
UYA
NA
– P
OVE
RTY
RED
UC
TIO
N S
TRA
TEG
Y R
EGIO
NA
L C
ON
SULT
ATI
ON
R
EGIO
N 6
FEE
DB
AC
K
Page
201
of 2
32
Are
a Is
sues
R
ecom
men
ded
Act
ions
M
aint
enan
ce
Mai
nten
ance
of i
nfra
stru
ctur
e ne
glec
ted
by re
leva
nt a
utho
ritie
s La
ck o
f co
mm
unic
atio
n be
twee
n lo
cal
gove
rnm
ent
bodi
es &
co
mm
uniti
es
Pro
vide
con
tinuo
us m
aint
enan
ce to
infra
stru
ctur
e
Am
end
regu
latio
ns
to
hold
re
leva
nt
loca
l go
vern
men
t bo
dies
ac
coun
tabl
e fo
r neg
lect
of d
utie
s La
ws
to h
old
resi
dent
s ac
coun
tabl
e fo
r di
stra
ctio
n/ t
ampe
ring
with
in
frast
ruct
ure
Mor
e co
mm
unity
in
volv
emen
t in
su
ppor
t of
m
aint
enan
ce
of
infra
stru
ctur
e
Tran
spor
tatio
n S
ecto
r P
oor m
aint
enan
ce o
f roa
ds
Poo
r qua
lity
of ro
ads
Uns
uper
vise
d co
ntra
ctor
s P
oor m
anag
emen
t of f
errie
s H
igh
Tran
spor
tatio
n co
st
Pro
vide
rout
ine
mai
nten
ance
of r
oads
Im
prov
e on
qua
lity
of ro
ads
cons
truct
ion
Mor
e su
perv
isio
n of
road
con
tract
ors
Impr
ove
man
agem
ent &
mon
itorin
g of
ferr
ies/
ste
lling
etc
Im
prov
e pu
nctu
ality
of
ferr
ies
New
ferr
ies
to tr
aver
se re
gion
Lo
wer
cos
t of t
rave
l
INFRASTRUCTURE
Infra
stru
ctur
e ne
eded
In
suffi
cien
t rec
reat
iona
l fac
ilitie
s In
adeq
uate
Roa
ds &
brid
ges
netw
ork
Mor
e re
crea
tiona
l fac
ilitie
s fo
r com
mun
ities
M
ore/
impr
oved
road
s an
d br
idge
s fo
r com
mun
ities
P
oliti
cal f
orum
D
issa
tisfa
ctio
n w
ith d
ialo
gue
proc
ess
Lack
of a
ccou
ntab
ility
C
ontin
uatio
n of
di
alog
ue
proc
ess
with
ai
m
of
putti
ng
Guy
ana
& G
uyan
ese
first
rath
er th
an p
oliti
cs.
Loca
l Gov
ernm
ent
Lack
of c
itize
n in
volv
emen
t in
deci
sion
mak
ing
Dec
entra
lizat
ion
of s
ervi
ces
Impr
oved
co
mm
unic
atio
n/
partn
ersh
ip
betw
een
loca
l go
vern
men
t bo
dies
& c
omm
uniti
es.
Loca
l G
over
nmen
t B
odie
s to
be
m
ore
resp
onsi
ve
to
need
s of
co
mm
uniti
es
Enh
ance
effi
cien
cy &
effe
ctiv
enes
s of
loca
l gov
ernm
ent t
hru
train
ing
of
staf
f N
eces
sary
cha
nges
to h
old
bodi
es a
ccou
ntab
le
Pas
spor
ts &
ID
, r
egis
tratio
n of
birt
hs,
deat
hs,
mar
riage
s &
oth
er
serv
ices
offe
red
by m
in. o
f Hom
e A
ffairs
to b
e di
strib
uted
regi
onal
ly
REGION 6
GOVERNANCE
Nat
iona
l Sec
urity
P
oor w
orki
ng c
ondi
tion
for p
olic
e fo
rce
Lack
of t
rain
ing
and
equi
pmen
t for
sec
urity
forc
e In
effe
ctiv
e po
licin
g gr
oups
In
effe
ctiv
e Ju
dici
ary
Impr
oved
sal
arie
s &
wor
king
con
ditio
n fo
r sec
urity
fore
Im
prov
ed tr
aini
ng a
nd e
quip
men
t for
pol
ice
forc
e P
olic
ing
grou
ps s
houl
d be
mon
itore
d an
d su
ppor
ted
by th
e po
lice
forc
e B
ette
r wor
king
con
ditio
ns fo
r the
judi
ciar
y E
nsur
e an
inde
pend
ent j
udic
iary
AN
NEX
C- G
UYA
NA
– P
OVE
RTY
RED
UC
TIO
N S
TRA
TEG
Y R
EGIO
NA
L C
ON
SULT
ATI
ON
R
EGIO
N 1
0 FE
EDB
AC
K
Page
202
of 2
32
Are
a Is
sues
R
ecom
men
ded
Act
ions
C
are
& T
reat
men
t S
horta
ge o
f Tra
ined
sta
ff P
oor h
ealth
car
e pr
ovid
ed
Ove
rcro
wdi
ng a
nd lo
ng w
aitin
g pe
riod
at h
ealth
cen
ters
S
horta
ge o
f dru
gs &
med
ical
sup
plie
s
Pro
vide
mor
e tra
ined
med
ical
per
sonn
el
Pro
mot
e re
gula
r/ in
crea
sed
visi
ts
to
com
mun
ities
by
he
alth
ca
re
wor
kers
P
rovi
de b
ette
r tre
atm
ent a
nd d
rugs
REGION 6
HEALTH
Faci
litie
s M
ore/
Impr
oved
faci
litie
s ne
eded
Pro
vide
bet
ter f
acili
ties
AN
NEX
C- G
UYA
NA
– P
OVE
RTY
RED
UC
TIO
N S
TRA
TEG
Y R
EGIO
NA
L C
ON
SULT
ATI
ON
R
EGIO
N 1
0 FE
EDB
AC
K
Page
203
of 2
32
Sect
or A
rea
Issu
esR
ecom
men
ded
Act
ions
Teac
her q
ualif
icat
ion
and
atte
ndan
ce
Poo
r qua
lity
teac
hing
P
oor e
xam
resu
lts
Low
sal
arie
s
Pro
vide
mor
e ef
ficie
nt tr
aini
ng p
rogr
amm
es fo
r tea
cher
s Im
prov
e co
nditi
ons
of s
ervi
ce a
nd in
crea
se s
alar
ies
Stu
dent
atte
ndan
ce
Hou
seho
ld p
over
ty
Inac
cess
ibili
ty o
f sch
ools
Irr
espo
nsib
le p
aren
ts
Incr
ease
so
cial
as
sist
ance
in
th
e fo
rm
of
food
, cl
othi
ng,
text
book
s,
trans
porta
tion
Enf
orce
trua
ncy
legi
slat
ion
Impr
ove
com
mun
icat
ion
betw
een
SW
Os
and
pare
nts
Ens
ure
grea
ter p
aren
tal i
nvol
vem
ent/
resp
onsi
bilit
y
EDUCATION
Sch
ool a
dmin
istra
tion
Incr
ease
par
ticip
atio
n of
par
ents
/com
mun
ities
S
uppo
rt an
d st
reng
then
PTA
s to
sol
icit
feed
back
from
par
ents
/ com
mun
ity
mem
bers
Im
plem
ent e
ffect
ive
syst
em to
mon
itor/s
uper
vise
sch
ools
Lo
w-c
ost h
ousi
ng
Inad
equa
te n
umbe
r of l
ots
avai
labl
e P
rovi
de m
ore
low
-cos
t lot
s
Allo
catio
n pr
oces
s U
ncle
ar a
nd in
appr
opria
te c
riter
ia fo
r allo
catin
g ho
use
lots
P
oor i
nfra
stru
ctur
e de
velo
pmen
t in
hous
ing
sche
mes
Crit
eria
for g
ivin
g lo
ts s
houl
d be
mor
e pr
o-po
or
Pro
vide
trai
ning
for w
orke
rs in
volv
ed in
the
Min
istry
’s h
ousi
ng p
rogr
amm
e to
impr
ove
thei
r effi
cien
cy
Impr
ove
infra
stru
ctur
e in
sch
emes
to a
ttrac
t res
iden
ts
A
cces
s to
saf
e/tre
ated
wat
er
Unt
reat
ed w
ater
In
adeq
uate
per
iods
of s
ervi
ce
Pro
vide
trea
ted
wat
er
Rep
air,
clea
n, la
y ne
w p
ipes
S
ink
new
wel
ls
Incr
ease
hou
rs o
f ser
vice
HOUSING AND WATER
San
itatio
n N
o ga
rbag
e co
llect
ion
syst
em in
pla
ce
No
esta
blis
hed
dum
p si
te
Litte
ring
and
dum
ping
with
in c
omm
uniti
es
Pro
vide
regu
lar g
arba
ge c
olle
ctio
n se
rvic
e by
invo
lvin
g N
DC
In
tens
ify p
ublic
aw
aren
ess
effo
rts
Enf
orce
ant
i-litt
erin
g la
ws
with
mor
e se
vere
pen
altie
s C
onsu
lt m
ore
with
com
mun
ities
re n
eeds
and
prio
ritie
s E
nabl
ing
envi
ronm
ent f
or e
ntre
pren
eurs
hip
Hig
h in
tere
st ra
tes
Lack
of m
arke
ts
Gov
ernm
ent t
o pr
ovid
e st
artu
p co
nces
sion
s
Impr
ove
infra
stru
ctur
e to
sup
port
busi
ness
es
Impr
ove
awar
enes
s/ou
treac
h pr
ogra
mm
es o
f GO
INV
ES
T
Exp
ortin
g go
ods
Diff
icul
ty in
acc
essi
ng m
arke
ts
Ass
ist w
ith m
arke
ting
Pro
vide
trai
ning
and
tech
nica
l adv
ice
Rev
ise
expo
rt ta
riffs
to m
ake
good
s m
ore
com
petit
ive
REGION 10
PRIVATE SECTOR DEVELOPMENT
Infra
stru
ctur
e de
velo
pmen
t to
su
ppor
t bu
sine
ss
Poo
r con
ditio
n of
road
s In
effe
ctiv
e D
&I s
yste
ms
Em
ploy
qua
lifie
d an
d ef
ficie
nt c
ontra
ctor
s Im
prov
e D
&I s
yste
ms
Incr
ease
bud
geta
ry a
lloca
tion
to in
frast
ruct
ure
deve
lopm
ent
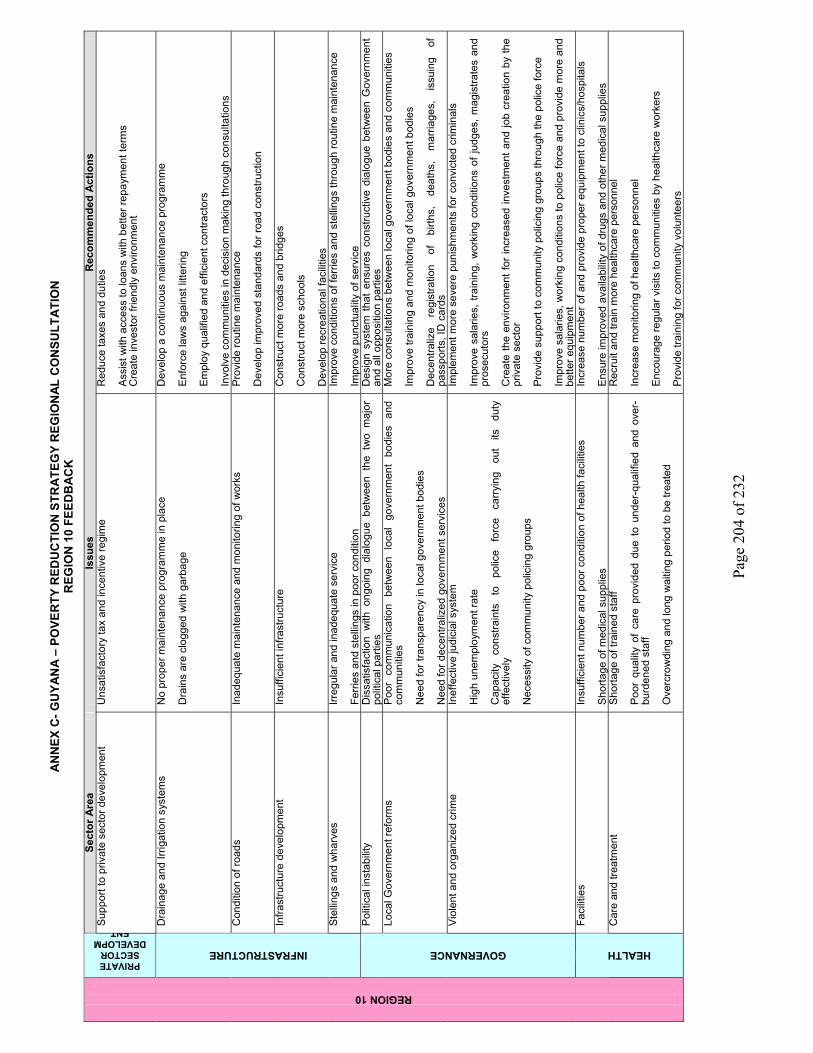
AN
NEX
C- G
UYA
NA
– P
OVE
RTY
RED
UC
TIO
N S
TRA
TEG
Y R
EGIO
NA
L C
ON
SULT
ATI
ON
R
EGIO
N 1
0 FE
EDB
AC
K
Page
204
of 2
32
Sect
or A
rea
Issu
esR
ecom
men
ded
Act
ions
PRIVATE SECTOR
DEVELOPMENTS
uppo
rt to
priv
ate
sect
or d
evel
opm
ent
Uns
atis
fact
ory
tax
and
ince
ntiv
e re
gim
e
Red
uce
taxe
s an
d du
ties
Ass
ist w
ith a
cces
s to
loan
s w
ith b
ette
r rep
aym
ent t
erm
s C
reat
e in
vest
or fr
iend
ly e
nviro
nmen
t
Dra
inag
e an
d Irr
igat
ion
syst
ems
No
prop
er m
aint
enan
ce p
rogr
amm
e in
pla
ce
Dra
ins
are
clog
ged
with
gar
bage
Dev
elop
a c
ontin
uous
mai
nten
ance
pro
gram
me
Enf
orce
law
s ag
ains
t litt
erin
g E
mpl
oy q
ualif
ied
and
effic
ient
con
tract
ors
Invo
lve
com
mun
ities
in d
ecis
ion
mak
ing
thro
ugh
cons
ulta
tions
C
ondi
tion
of ro
ads
Inad
equa
te m
aint
enan
ce a
nd m
onito
ring
of w
orks
P
rovi
de ro
utin
e m
aint
enan
ce
Dev
elop
impr
oved
sta
ndar
ds fo
r roa
d co
nstru
ctio
n
Infra
stru
ctur
e de
velo
pmen
t In
suffi
cien
t inf
rast
ruct
ure
Con
stru
ct m
ore
road
s an
d br
idge
s C
onst
ruct
mor
e sc
hool
s D
evel
op re
crea
tiona
l fac
ilitie
s
INFRASTRUCTURE
Ste
lling
s an
d w
harv
es
Irreg
ular
and
inad
equa
te s
ervi
ce
Ferr
ies
and
stel
lings
in p
oor c
ondi
tion
Impr
ove
cond
ition
s of
ferr
ies
and
stel
lings
thro
ugh
rout
ine
mai
nten
ance
Im
prov
e pu
nctu
ality
of s
ervi
ce
Pol
itica
l ins
tabi
lity
Dis
satis
fact
ion
with
ong
oing
dia
logu
e be
twee
n th
e tw
o m
ajor
po
litic
al p
artie
s D
esig
n sy
stem
tha
t en
sure
s co
nstru
ctiv
e di
alog
ue b
etw
een
Gov
ernm
ent
and
all o
ppos
ition
par
ties
Loca
l Gov
ernm
ent r
efor
ms
Poo
r co
mm
unic
atio
n be
twee
n lo
cal
gove
rnm
ent
bodi
es
and
com
mun
ities
N
eed
for t
rans
pare
ncy
in lo
cal g
over
nmen
t bod
ies
Nee
d fo
r dec
entra
lized
gov
ernm
ent s
ervi
ces
Mor
e co
nsul
tatio
ns b
etw
een
loca
l gov
ernm
ent b
odie
s an
d co
mm
uniti
es
Impr
ove
train
ing
and
mon
itorin
g of
loca
l gov
ernm
ent b
odie
s D
ecen
traliz
e re
gist
ratio
n of
bi
rths,
de
aths
, m
arria
ges,
is
suin
g of
pa
sspo
rts, I
D c
ards
GOVERNANCE
Vio
lent
and
org
aniz
ed c
rime
Inef
fect
ive
judi
cial
sys
tem
H
igh
unem
ploy
men
t rat
e C
apac
ity
cons
train
ts
to
polic
e fo
rce
carr
ying
ou
t its
du
ty
effe
ctiv
ely
Nec
essi
ty o
f com
mun
ity p
olic
ing
grou
ps
Impl
emen
t mor
e se
vere
pun
ishm
ents
for c
onvi
cted
crim
inal
s Im
prov
e sa
larie
s, tr
aini
ng, w
orki
ng c
ondi
tions
of j
udge
s, m
agis
trate
s an
d pr
osec
utor
s C
reat
e th
e en
viro
nmen
t for
incr
ease
d in
vest
men
t and
job
crea
tion
by th
e pr
ivat
e se
ctor
P
rovi
de s
uppo
rt to
com
mun
ity p
olic
ing
grou
ps th
roug
h th
e po
lice
forc
e Im
prov
e sa
larie
s, w
orki
ng c
ondi
tions
to p
olic
e fo
rce
and
prov
ide
mor
e an
d be
tter e
quip
men
t Fa
cilit
ies
In
suffi
cien
t num
ber a
nd p
oor c
ondi
tion
of h
ealth
faci
litie
s S
horta
ge o
f med
ical
sup
plie
s
Incr
ease
num
ber o
f and
pro
vide
pro
per e
quip
men
t to
clin
ics/
hosp
itals
E
nsur
e im
prov
ed a
vaila
bilit
y of
dru
gs a
nd o
ther
med
ical
sup
plie
s
REGION 10
HEALTH
Car
e an
d tre
atm
ent
Sho
rtage
of t
rain
ed s
taff
Poo
r qu
ality
of
care
pro
vide
d du
e to
und
er-q
ualif
ied
and
over
-bu
rden
ed s
taff
Ove
rcro
wdi
ng a
nd lo
ng w
aitin
g pe
riod
to b
e tre
ated
Rec
ruit
and
train
mor
e he
alth
care
per
sonn
el
Incr
ease
mon
itorin
g of
hea
lthca
re p
erso
nnel
E
ncou
rage
regu
lar v
isits
to c
omm
uniti
es b
y he
alth
care
wor
kers
P
rovi
de tr
aini
ng fo
r com
mun
ity v
olun
teer
s

ANNEX D - POVERTY REDUCTION STRATEGY : FEEDBACK FORM
Page 205 of 232
What region and community do you live in? ………………………………………………………………………………………………………………………………………………… Education What issues need to be addressed to make education more relevant to your needs? ………………………………………………………………………………………………………………………………………………… Are your children able to attend school regularly? Yes □ No □ What are some reasons for children not going to school in your community? ………………………………………………………………………………………………………………………………………………… What can parents do to help the School Welfare Officers to reduce students’ absenteeism? ………………………………………………………………………………………………………………………………………………… What can the school and the community do to improve children’s attendance at school? ………………………………………………………………………………………………………………………………………………… What more can the Government do to ensure that children attend school? ………………………………………………………………………………………………………………………………………………… The Government has spent a lot of money to buy textbooks which will be distributed in schools. Is there any subject area for which textbooks are still needed? ………………………………………………………………………………………………………………………………………………… How has the shortage of teachers affected the functioning of your school? ………………………………………………………………………………………………………………………………………………… What suggestions do you have for the MOE to improve the number of skilled/trained teachers in your schools? ………………………………………………………………………………………………………………………………………………… Are the teachers in your schools attending school regularly and punctually? Yes □ No □ Monitoring of the schools by the community is being encouraged by the MOE through PTAs and other parent groups. Do parents participate in the management of your school? Yes □ No □ Are you willing to visit the school to share your experience, skills and knowledge? ………………………………………………………………………………………………………………………………………………… How can the MOE work with your community to provide better service for your children? ………………………………………………………………………………………………………………………………………………… Health What issues need to be addressed to make health services more responsive to your needs? ………………………………………………………………………………………………………………………………………………… Do you attend a hospital, clinic or health center in your community? Yes □ No □ Are you satisfied with the service provided by your hospital/clinic/health center? …………………………………………………………………………………………………………………………………………………

ANNEX D - POVERTY REDUCTION STRATEGY : FEEDBACK FORM
Page 206 of 232
How has the shortage of nurses affected the functioning of your hospital/clinic/health center? ………………………………………………………………………………………………………………………………………………… Are the drugs you need available at your hospital, clinic or health center? Yes □ No □ What more can the Government do to improve the quality of care provided in your community? ………………………………………………………………………………………………………………………………………………… Are you satisfied with improvements in healthcare for pregnant women and children? Yes □ No □ Are you satisfied with improvements in treatment and care for HIV+ persons? Yes □ No □ How can the MOH work with your community to provide better service for you? …………………………………………………………………………………………………………………………………………………
Housing and Water What issues need to be addressed to make housing and water services more responsive to your needs? ………………………………………………………………………………………………………………………………………………… Are you satisfied with the number of house lots allocated by the Government? Yes □ No □ Should government continue with its housing scheme programmes? Yes □ No □ What suggestions do you have for the Government to improve the housing situation? ………………………………………………………………………………………………………………………………………………… Are you satisfied with the access to safe/treated water in your community? Yes □ No □ What more can the Government do to improve water service in your community? ………………………………………………………………………………………………………………………………………………… Are you satisfied with sanitation and garbage collection facilities in your community? Yes □ No □ What can community members do to improve sanitation? ………………………………………………………………………………………………………………………………………………… What more can the government do to improve sanitation and garbage collection in your community? ………………………………………………………………………………………………………………………………………………… How can the MOH&W work with your community to provide better service for you? ………………………………………………………………………………………………………………………………………………… Governance What issues need to be addressed to improve governance in Guyana? ………………………………………………………………………………………………………………………………………………… Are you satisfied with the ongoing dialogue between the PPP/C and PNCR? Yes □ No □

ANNEX D - POVERTY REDUCTION STRATEGY : FEEDBACK FORM
Page 207 of 232
What suggestions do you have to improve this process? ………………………………………………………………………………………………………………………………………………… Do you want your RDC and NDC to have more control in managing your region and your community in the future than they currently have? Yes □ No □ Are you satisfied with the performance of your RDC? Yes □ No □ Are you satisfied with the performance of your NDC? Yes □ No □ What more can the RDC do to better serve your community? ………………………………………………………………………………………………………………………………………………… What more can the NDC do to better serve your community? ………………………………………………………………………………………………………………………………………………… What public services would you like to see decentralized so you don’t have to travel to G/T all the time? ………………………………………………………………………………………………………………………………………………… What advice would you give the government in fighting crime? ………………………………………………………………………………………………………………………………………………… What do you think of community policing groups? ………………………………………………………………………………………………………………………………………………… Are you satisfied with the way the courts are working? Yes □ No □ If no, what kind of changes or reforms would you suggest? …………………………………………………………………………………………………………………………………………………
Private Sector Development Are you satisfied with the performance of the economy? Yes □ No □ Would you like to have your own business? Yes □ No □ Why/why not …………………………………………………………………. What kind of business do you find attractive in your region or community? ………………………………………………………………………………………………………………………………………………… What would you expect from Government in going into your own business? ………………………………………………………………………………………………………………………………………………… If you ’re already in business, what do you consider to be the major bottlenecks? ………………………………………………………………………………………………………………………………………………… What do you think about the performance of the commercial banks ? …………………………………………………………………………………………………………………………………………………
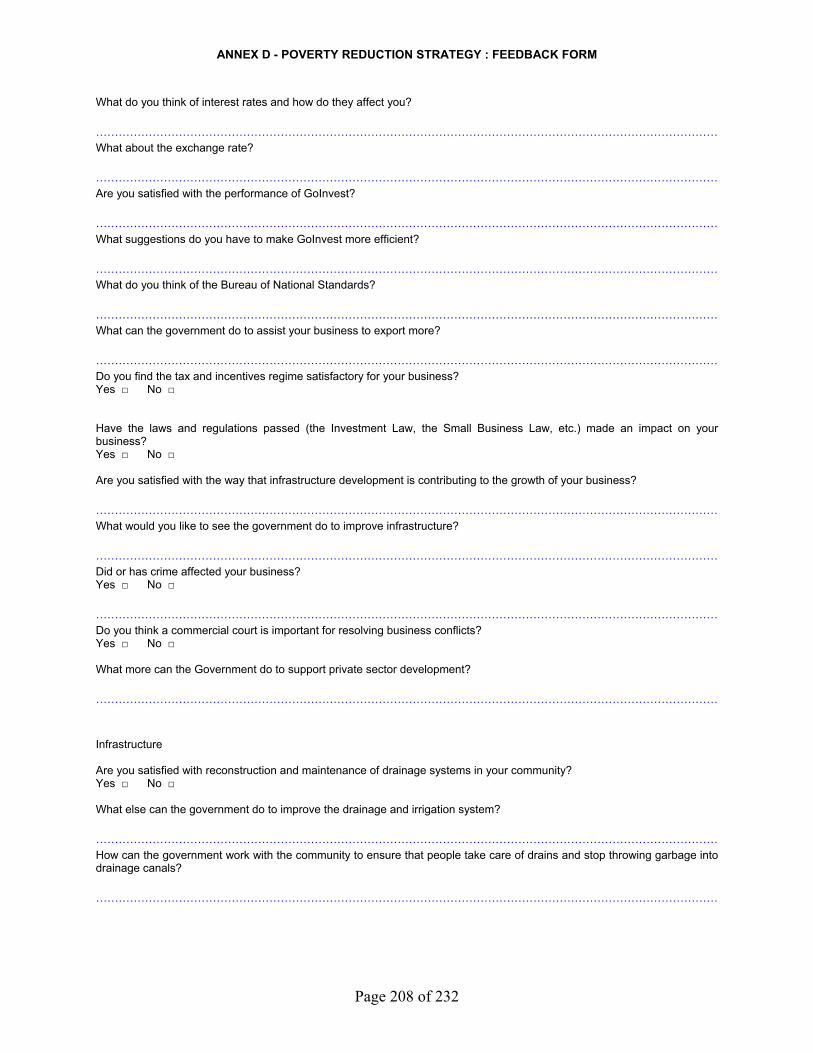
ANNEX D - POVERTY REDUCTION STRATEGY : FEEDBACK FORM
Page 208 of 232
What do you think of interest rates and how do they affect you? ………………………………………………………………………………………………………………………………………………… What about the exchange rate? ………………………………………………………………………………………………………………………………………………… Are you satisfied with the performance of GoInvest? ………………………………………………………………………………………………………………………………………………… What suggestions do you have to make GoInvest more efficient? ………………………………………………………………………………………………………………………………………………… What do you think of the Bureau of National Standards? ………………………………………………………………………………………………………………………………………………… What can the government do to assist your business to export more? ………………………………………………………………………………………………………………………………………………… Do you find the tax and incentives regime satisfactory for your business? Yes □ No □ Have the laws and regulations passed (the Investment Law, the Small Business Law, etc.) made an impact on your business? Yes □ No □ Are you satisfied with the way that infrastructure development is contributing to the growth of your business? ………………………………………………………………………………………………………………………………………………… What would you like to see the government do to improve infrastructure? ………………………………………………………………………………………………………………………………………………… Did or has crime affected your business? Yes □ No □ ………………………………………………………………………………………………………………………………………………… Do you think a commercial court is important for resolving business conflicts? Yes □ No □ What more can the Government do to support private sector development? ………………………………………………………………………………………………………………………………………………… Infrastructure Are you satisfied with reconstruction and maintenance of drainage systems in your community? Yes □ No □ What else can the government do to improve the drainage and irrigation system? ………………………………………………………………………………………………………………………………………………… How can the government work with the community to ensure that people take care of drains and stop throwing garbage into drainage canals? …………………………………………………………………………………………………………………………………………………

ANNEX D - POVERTY REDUCTION STRATEGY : FEEDBACK FORM
Page 209 of 232
Are you satisfied with the state of road construction in the country? ………………………………………………………………………………………………………………………………………………… Are you satisfied with the maintenance of your community roads? Yes □ No □ Are the roads serving your needs? Yes □ No □ What more can the government do to improve road networks? ………………………………………………………………………………………………………………………………………………… What other infrastructure development is needed in your community? ………………………………………………………………………………………………………………………………………………… Are you satisfied with the service at the stellings and the wharves? Yes □ No □ What suggestions do you have for improving the operations of ferries? ………………………………………………………………………………………………………………………………………………… If you travel to the interior by air, are you satisfied with the condition of airstrips? Yes □ No □ What more can the Government do to improve and develop the transport sector? ………………………………………………………………………………………………………………………………………………… Any other comments? ………………………………………………………………………………………………………………………………………………… …………………………………………………………………………………………………………………………………………………
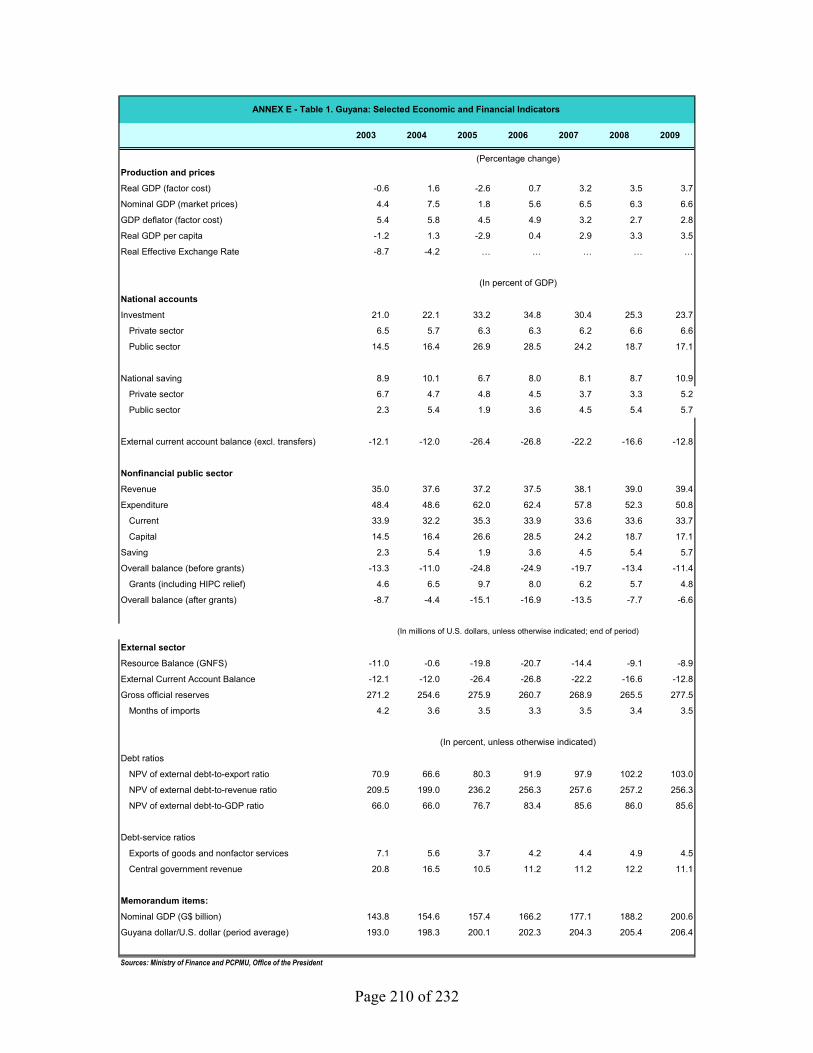
Page 210 of 232
Production and prices
Real GDP (factor cost) -0.6 1.6 -2.6 0.7 3.2 3.5 3.7
Nominal GDP (market prices) 4.4 7.5 1.8 5.6 6.5 6.3 6.6
GDP deflator (factor cost) 5.4 5.8 4.5 4.9 3.2 2.7 2.8
Real GDP per capita -1.2 1.3 -2.9 0.4 2.9 3.3 3.5
Real Effective Exchange Rate -8.7 -4.2 … … … … …
National accounts
Investment 21.0 22.1 33.2 34.8 30.4 25.3 23.7
Private sector 6.5 5.7 6.3 6.3 6.2 6.6 6.6
Public sector 14.5 16.4 26.9 28.5 24.2 18.7 17.1
National saving 8.9 10.1 6.7 8.0 8.1 8.7 10.9
Private sector 6.7 4.7 4.8 4.5 3.7 3.3 5.2
Public sector 2.3 5.4 1.9 3.6 4.5 5.4 5.7
External current account balance (excl. transfers) -12.1 -12.0 -26.4 -26.8 -22.2 -16.6 -12.8
Nonfinancial public sector
Revenue 35.0 37.6 37.2 37.5 38.1 39.0 39.4
Expenditure 48.4 48.6 62.0 62.4 57.8 52.3 50.8
Current 33.9 32.2 35.3 33.9 33.6 33.6 33.7
Capital 14.5 16.4 26.6 28.5 24.2 18.7 17.1
Saving 2.3 5.4 1.9 3.6 4.5 5.4 5.7
Overall balance (before grants) -13.3 -11.0 -24.8 -24.9 -19.7 -13.4 -11.4
Grants (including HIPC relief) 4.6 6.5 9.7 8.0 6.2 5.7 4.8
Overall balance (after grants) -8.7 -4.4 -15.1 -16.9 -13.5 -7.7 -6.6
External sector
Resource Balance (GNFS) -11.0 -0.6 -19.8 -20.7 -14.4 -9.1 -8.9
External Current Account Balance -12.1 -12.0 -26.4 -26.8 -22.2 -16.6 -12.8
Gross official reserves 271.2 254.6 275.9 260.7 268.9 265.5 277.5
Months of imports 4.2 3.6 3.5 3.3 3.5 3.4 3.5
Debt ratios
NPV of external debt-to-export ratio 70.9 66.6 80.3 91.9 97.9 102.2 103.0
NPV of external debt-to-revenue ratio 209.5 199.0 236.2 256.3 257.6 257.2 256.3
NPV of external debt-to-GDP ratio 66.0 66.0 76.7 83.4 85.6 86.0 85.6
Debt-service ratios
Exports of goods and nonfactor services 7.1 5.6 3.7 4.2 4.4 4.9 4.5
Central government revenue 20.8 16.5 10.5 11.2 11.2 12.2 11.1
Memorandum items:
Nominal GDP (G$ billion) 143.8 154.6 157.4 166.2 177.1 188.2 200.6
Guyana dollar/U.S. dollar (period average) 193.0 198.3 200.1 202.3 204.3 205.4 206.4
Sources: Ministry of Finance and PCPMU, Office of the President
ANNEX E - Table 1. Guyana: Selected Economic and Financial Indicators
2003 2004 2005 2006 2007 2008 2009
(In millions of U.S. dollars, unless otherwise indicated; end of period)
(In percent, unless otherwise indicated)
(Percentage change)
(In percent of GDP)
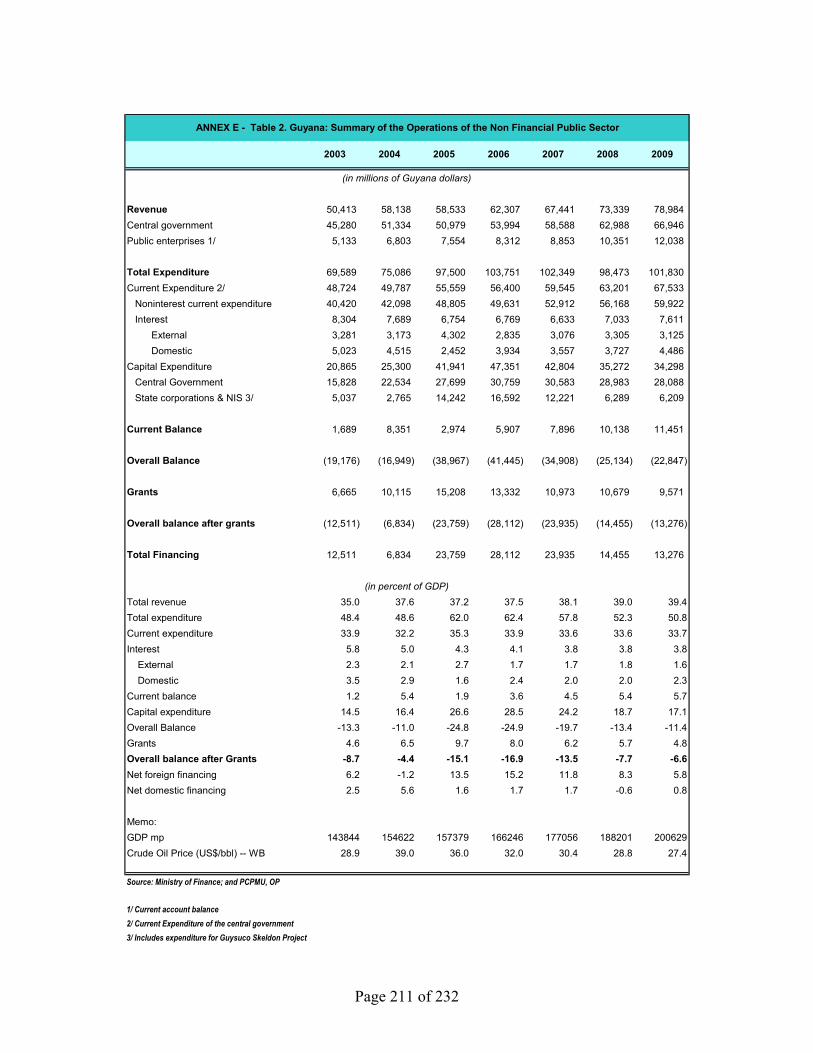
Page 211 of 232
Revenue 50,413 58,138 58,533 62,307 67,441 73,339 78,984 Central government 45,280 51,334 50,979 53,994 58,588 62,988 66,946 Public enterprises 1/ 5,133 6,803 7,554 8,312 8,853 10,351 12,038
Total Expenditure 69,589 75,086 97,500 103,751 102,349 98,473 101,830 Current Expenditure 2/ 48,724 49,787 55,559 56,400 59,545 63,201 67,533 Noninterest current expenditure 40,420 42,098 48,805 49,631 52,912 56,168 59,922 Interest 8,304 7,689 6,754 6,769 6,633 7,033 7,611 External 3,281 3,173 4,302 2,835 3,076 3,305 3,125 Domestic 5,023 4,515 2,452 3,934 3,557 3,727 4,486 Capital Expenditure 20,865 25,300 41,941 47,351 42,804 35,272 34,298 Central Government 15,828 22,534 27,699 30,759 30,583 28,983 28,088 State corporations & NIS 3/ 5,037 2,765 14,242 16,592 12,221 6,289 6,209
Current Balance 1,689 8,351 2,974 5,907 7,896 10,138 11,451
Overall Balance (19,176) (16,949) (38,967) (41,445) (34,908) (25,134) (22,847)
Grants 6,665 10,115 15,208 13,332 10,973 10,679 9,571
Overall balance after grants (12,511) (6,834) (23,759) (28,112) (23,935) (14,455) (13,276)
Total Financing 12,511 6,834 23,759 28,112 23,935 14,455 13,276
Total revenue 35.0 37.6 37.2 37.5 38.1 39.0 39.4Total expenditure 48.4 48.6 62.0 62.4 57.8 52.3 50.8Current expenditure 33.9 32.2 35.3 33.9 33.6 33.6 33.7Interest 5.8 5.0 4.3 4.1 3.8 3.8 3.8 External 2.3 2.1 2.7 1.7 1.7 1.8 1.6 Domestic 3.5 2.9 1.6 2.4 2.0 2.0 2.3Current balance 1.2 5.4 1.9 3.6 4.5 5.4 5.7Capital expenditure 14.5 16.4 26.6 28.5 24.2 18.7 17.1Overall Balance -13.3 -11.0 -24.8 -24.9 -19.7 -13.4 -11.4Grants 4.6 6.5 9.7 8.0 6.2 5.7 4.8Overall balance after Grants -8.7 -4.4 -15.1 -16.9 -13.5 -7.7 -6.6Net foreign financing 6.2 -1.2 13.5 15.2 11.8 8.3 5.8Net domestic financing 2.5 5.6 1.6 1.7 1.7 -0.6 0.8
Memo:GDP mp 143844 154622 157379 166246 177056 188201 200629Crude Oil Price (US$/bbl) -- WB 28.9 39.0 36.0 32.0 30.4 28.8 27.4
Source: Ministry of Finance; and PCPMU, OP
1/ Current account balance2/ Current Expenditure of the central government3/ Includes expenditure for Guysuco Skeldon Project
ANNEX E - Table 2. Guyana: Summary of the Operations of the Non Financial Public Sector
2003 2004 2005 2006 2007 2008 2009
(in millions of Guyana dollars)
(in percent of GDP)
Page 212 of 232
Total revenue 45,280 51,334 50,979 53,994 58,588 62,988 66,946
Tax revenue 41,555 47,908 48,112 50,337 54,693 58,848 62,532
Nontax revenue 1/ 3,725 3,426 2,867 3,657 3,895 4,140 4,414
Total expenditure & net lending 64,552 72,321 83,258 87,159 90,128 92,184 95,621
Current expenditures 48,724 49,787 55,559 56,400 59,545 63,201 67,533
Personal emoluments 18,268 16,317 18,866 16,451 17,436 18,501 19,742
Other goods & services 11,220 13,774 16,809 19,880 21,311 22,612 24,129
Transfer payments 10,932 12,007 13,130 13,300 14,164 15,056 16,050
Interest 8,304 7,689 6,754 6,769 6,633 7,033 7,611
Domestic 5,023 4,515 2,452 3,934 3,557 3,727 4,486
External 3,281 3,173 4,302 2,835 3,076 3,305 3,125
Current surplus or deficit (-) (3,444) 1,548 (4,581) (2,406) (956) (213) (587)
Capital expenditure & net lending 15,828 22,534 27,699 30,759 30,583 28,983 28,088
Overall surplus or deficit (-) before grants (19,272) (20,986) (32,279) (33,165) (31,540) (29,196) (28,675)
Grants 6,665 10,115 15,208 13,332 10,973 10,679 9,571
Overall surplus or deficit (-) after grants (12,607) (10,872) (17,071) (19,832) (20,567) (18,517) (19,104)
Total Revenue 31.5 33.2 32.4 32.5 33.1 33.5 33.4
Tax Revenue 28.9 31.0 30.6 30.3 30.9 31.3 31.2
Nontax Revenue 2.6 2.2 1.8 2.2 2.2 2.2 2.2
Current expenditure 33.9 32.2 35.3 33.9 33.6 33.6 33.7
Non interest current expenditure 28.1 27.2 31.0 29.9 29.9 29.8 29.9
Interest 5.8 5.0 4.3 4.1 3.7 3.7 3.8
Current surplus or deficit (-) (2.4) 1.0 (2.9) (1.4) (0.5) (0.1) (0.3)
Capital expenditure and net lending 11.0 14.6 17.6 18.5 17.3 15.4 14.0
Overall surplus or deficit (-) before grants (13.4) (13.6) (20.5) (19.9) (17.8) (15.5) (14.3)
Grants 4.6 6.5 9.7 8.0 6.2 5.7 4.8
Overall surplus or deficit (-) after grants (8.8) (7.0) (10.8) (11.9) (11.6) (9.8) (9.5)
Memo:
GDP mp 143844 154622 157379 166246 177056 188201 200629
Source: Ministry of Finance; and PCPMU, Office of the President
1/ Includes taxes paid by public enterprises.
ANNEX E - Table 3. Guyana: Operations of the Central Government
2003 2004 2005 2006 2007 2008 2009
(in millions of Guyana dollars)
(In percent of GDP)
Page 213 of 232
2003 2004 2005 2006 2007 2008 2009
GDP at current factor cost 123,263 130,701 133,914 139,773 147,554 156,469 166,802
Net indirect taxes 20,581 23,921 23,465 26,473 29,502 31,732 33,827
GDP at market prices 143,844 154,622 157,379 166,246 177,056 188,201 200,629
Consumption expenditure 129,424 137,606 148,745 154,493 162,720 175,168 183,376
Private Sector 99,936 107,515 113,070 118,162 123,973 134,056 139,505
Public Sector 29,488 30,091 35,675 36,331 38,747 41,112 43,871
Gross domestic investment 30,207 34,171 52,194 57,819 53,767 47,615 47,575
Private sector 9,342 8,872 9,904 10,468 10,963 12,343 13,278
Public sector 20,865 25,300 42,291 47,351 42,804 35,272 34,298
Net exports of goods and nonfactor services (15,787) (17,155) (43,561) (46,066) (39,432) (34,582) (30,322)
Exports of goods and nonfactor services 133,807 151,169 145,754 145,730 148,975 157,830 166,056
Imports of goods and nonfactor services 149,594 168,324 189,315 191,796 188,406 192,412 196,378
GDP at current factor cost 85.7 84.5 85.1 84.1 83.3 83.1 83.1
Net indirect taxes 1/ 14.3 15.5 14.9 15.9 16.7 16.9 16.9
GDP at market prices 100.0 100.0 100.0 100.0 100.0 100.0 100.0
Consumption expenditure 90.0 89.0 94.5 92.9 91.9 93.1 91.4
Private sector 69.5 69.5 71.8 71.1 70.0 71.2 69.5
Public sector 20.5 19.5 22.7 21.9 21.9 21.8 21.9
Gross domestic Investment 21.0 22.1 33.2 34.8 30.4 25.3 23.7
Private sector 6.5 5.7 6.3 6.3 6.2 6.6 6.6
Public sector 14.5 16.4 26.9 28.5 24.2 18.7 17.1
Net exports of goods and nonfactor services -11.0 -11.1 -27.7 -27.7 -22.3 -18.4 -15.1
Exports of goods and nonfactor services 93.0 97.8 92.6 87.7 84.1 83.9 82.8
Imports of goods and nonfactor services 104.0 108.9 120.3 115.4 106.4 102.2 97.9
Source: Ministry of Finance; and PCPMU, Office of the President
(In millions of Guyana dollars)
(as a percentage of GDP at market prices)
ANNEX E - Table 4. Guyana: GDP by Expenditure at Current Prices
Page 214 of 232
2003 2004 2005 2006 2007 2008 2009
Savings 30,207 34,171 52,194 57,819 53,767 47,615 47,575
National savings 12,837 15,620 10,579 13,344 14,378 16,380 21,845
Private savings 9,566 7,269 7,605 7,437 6,481 6,242 10,394
Public savings 3,271 8,351 2,974 5,907 7,896 10,138 11,451
Foreign savings 17,370 18,552 41,615 44,475 39,390 31,235 25,730
Investment 30,207 34,171 52,194 57,819 53,767 47,615 47,575
Private investment 9,342 8,872 9,904 10,468 10,963 12,343 13,278
Public investment 20,865 25,300 42,291 47,351 42,804 35,272 34,298
Savings 21.0 22.1 33.2 34.8 30.4 25.3 23.7
National savings 8.9 10.1 6.7 8.0 8.1 8.7 10.9
Private savings 6.7 4.7 4.8 4.5 3.7 3.3 5.2
Public savings 2.3 5.4 1.9 3.6 4.5 5.4 5.7
Foreign savings 12.1 12.0 26.4 26.8 22.2 16.6 12.8
Investment 21.0 22.1 33.2 34.8 30.4 25.3 23.7
Private investment 6.5 5.7 6.3 6.3 6.2 6.6 6.6
Public investment 14.5 16.4 26.9 28.5 24.2 18.7 17.1
Source: Ministry of Finance; and PCPMU, Office of the President
(In millions of Guyana dollars
(In percent of GDP at market prices)
ANNEX E - Table 5. Guyana: Savings and Investment
Page 215 of 232
(US$ million)
2004 2005 2006 2007 2008 2009
TOTAL 147.4 218.8 170.9 148.1 131.6 112.1 LOANS 90.1 143.2 107.5 89.0 79.7 69.3 GRANTS 57.3 75.6 63.4 59.1 51.9 42.9 Project 13.0 24.0 23.3 23.8 18.5 14.5 Program 44.2 51.6 40.2 35.3 33.4 28.4
LOANS 90.1 143.2 107.5 89.0 79.7 69.3
Program Loans 33.0 48.9 19.0 20.0 25.0 20.0 IMF 28.0 27.0 14.0 20.0 20.0 20.0 PRGF 28.0 27.0 14.0 20.0 20.0 20.0 IDB 5.0 12.9 5.0 0.0 5.0 0.0 Air Transport Sector Prog. 0.0 12.9 0.0 0.0 0.0 0.0 Public Sector Financial Mngt. Prog. 5.0 0.0 5.0 0.0 5.0 0.0
Project Loans 57.1 94.3 88.5 69.0 54.7 49.3
Multilateral Loans 57.1 78.4 62.7 60.7 51.2 49.3
CDB 15.7 23.4 12.3 5.5 4.0 3.0Road Rehabilitation and Construction 0.3 1.3 3.8 4.1 4.0 3.0Towns Development 0.2 0.5 0.0 0.0 0.0 0.0West Demerara Four Lane Road 4.8 4.0 0.0 0.0 0.0 0.0West Coast Berbice (Sea Defense) 1.6 2.5 0.0 0.0 0.0 0.0Technical Vocation 0.0 0.0 0.0 0.0 0.0 0.0Caribbean Court of Justice 8.9 0.0 0.0 0.0 0.0 0.0Skeldon 0.0 15.1 8.5 1.4 0.0 0.0
IDB 35.2 50.3 47.7 52.2 45.1 46.3Agri. Sector Loan 1.8 0.0 0.0 0.0 0.0 0.0Agric. Support Services Project 0.0 1.5 1.8 2.2 1.5 1.5Airport Transport Reform 2.2 2.1 1.0 0.7 0.0 0.0Electrification Programme 0.5 3.5 4.2 4.2 3.7 3.1Reprog. Of Loans for Disaster Recon 0.0 8.1 0.0 0.0 0.0 0.0Bridge and Roads 9.6 2.7 5.2 4.5 4.5 4.0Mahaica - Rosignol Road Rehab./ Studies 8.8 8.1 3.8 3.8 5.9 6.5Moleson Creek--New Amsterdam Road 0.0 0.2 6.0 6.5 7.0 7.5Rural Transport 0.0 0.0 0.0 1.0 3.3 4.8Georgetown Remedial & Sewerage Proj. 0.0 2.0 3.1 3.5 3.0 3.0GR&SP Reprogramming for Disaster Areas 0.0 0.3 0.0 0.0 0.0 0.0Institutional Strengthening -- Legal Affairs - Deeds Registry 0.0 0.04 0.0 0.0 0.0 0.0Public Sector Financial Management 0.1 0.0 3.0 3.0 2.2 1.5Social Statistics Project 0.0 0.7 1.2 0.7 0.6 0.0Public Sector Modernisation Program 0.0 0.1 0.5 0.8 1.3 1.8Fiscal and Financial Management Programme 0.1 1.5 3.7 4.0 4.4 4.8Competitiveness Program 0.0 0.0 0.0 1.0 2.0 3.0Basic Education Access & Mng. Support 1.8 1.8 3.4 4.4 3.1 3.1Education Rehabilitation (BEAMS Reprog.) 0.0 2.0 0.0 0.0 0.0 0.0Technical Assistance 0.4 0.0 0.0 0.0 0.0 0.0Health Sector Programme 0.0 0.8 0.0 0.0 0.0 0.0Basic Nutrition 0.2 0.8 1.5 1.7 1.2 0.0Simap - Phase III 1.3 1.2 2.5 2.0 1.4 1.7Simap - Rehab of Disaster Communities 0.0 2.7 0.0 0.0 0.0 0.0Low Income Settlement 6.6 5.3 2.6 2.0 0.0 0.0Urban Development Programme 1.4 1.9 2.1 3.1 0.0 0.0UDB for Disaster Reconstruction 0.0 2.7 2.1 3.1 0.0 0.0
Annex E: TABLE 6: GUYANA--- EXTERNAL FINANCING, 2004-2009
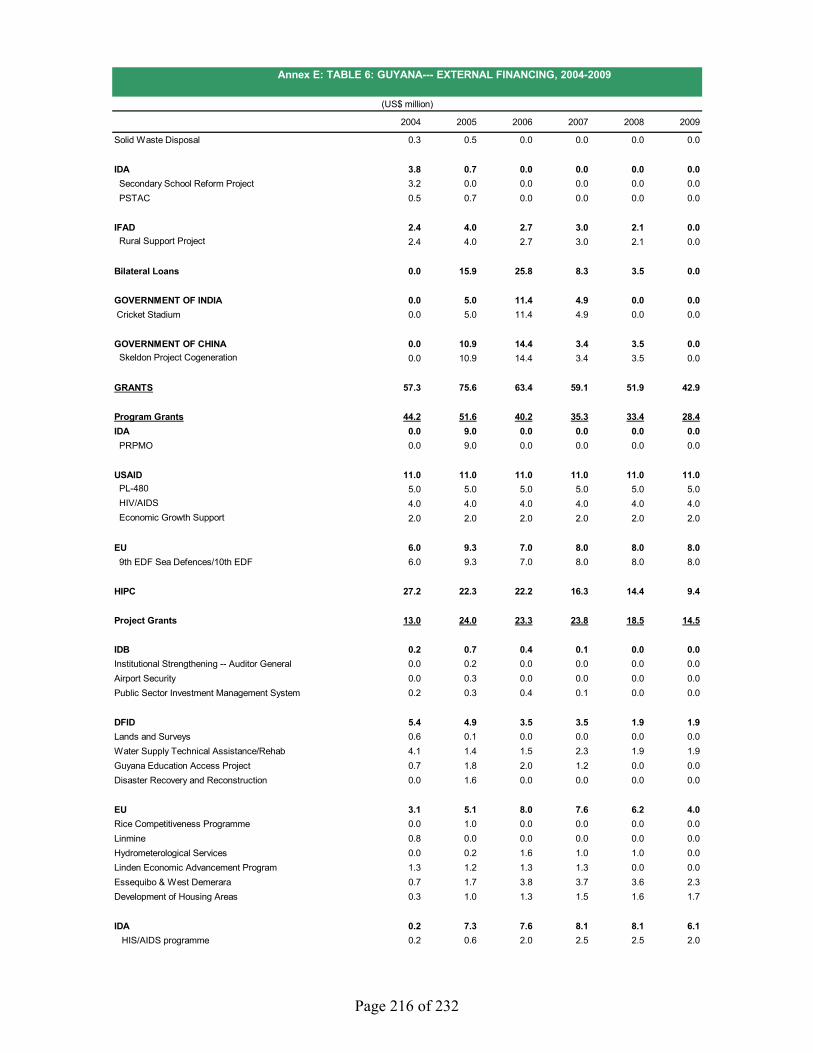
Page 216 of 232
(US$ million)
2004 2005 2006 2007 2008 2009
Solid Waste Disposal 0.3 0.5 0.0 0.0 0.0 0.0
IDA 3.8 0.7 0.0 0.0 0.0 0.0 Secondary School Reform Project 3.2 0.0 0.0 0.0 0.0 0.0 PSTAC 0.5 0.7 0.0 0.0 0.0 0.0
IFAD 2.4 4.0 2.7 3.0 2.1 0.0 Rural Support Project 2.4 4.0 2.7 3.0 2.1 0.0
Bilateral Loans 0.0 15.9 25.8 8.3 3.5 0.0
GOVERNMENT OF INDIA 0.0 5.0 11.4 4.9 0.0 0.0 Cricket Stadium 0.0 5.0 11.4 4.9 0.0 0.0
GOVERNMENT OF CHINA 0.0 10.9 14.4 3.4 3.5 0.0 Skeldon Project Cogeneration 0.0 10.9 14.4 3.4 3.5 0.0
GRANTS 57.3 75.6 63.4 59.1 51.9 42.9
Program Grants 44.2 51.6 40.2 35.3 33.4 28.4IDA 0.0 9.0 0.0 0.0 0.0 0.0 PRPMO 0.0 9.0 0.0 0.0 0.0 0.0
USAID 11.0 11.0 11.0 11.0 11.0 11.0 PL-480 5.0 5.0 5.0 5.0 5.0 5.0 HIV/AIDS 4.0 4.0 4.0 4.0 4.0 4.0 Economic Growth Support 2.0 2.0 2.0 2.0 2.0 2.0
EU 6.0 9.3 7.0 8.0 8.0 8.0 9th EDF Sea Defences/10th EDF 6.0 9.3 7.0 8.0 8.0 8.0
HIPC 27.2 22.3 22.2 16.3 14.4 9.4
Project Grants 13.0 24.0 23.3 23.8 18.5 14.5
IDB 0.2 0.7 0.4 0.1 0.0 0.0Institutional Strengthening -- Auditor General 0.0 0.2 0.0 0.0 0.0 0.0Airport Security 0.0 0.3 0.0 0.0 0.0 0.0Public Sector Investment Management System 0.2 0.3 0.4 0.1 0.0 0.0
DFID 5.4 4.9 3.5 3.5 1.9 1.9Lands and Surveys 0.6 0.1 0.0 0.0 0.0 0.0Water Supply Technical Assistance/Rehab 4.1 1.4 1.5 2.3 1.9 1.9Guyana Education Access Project 0.7 1.8 2.0 1.2 0.0 0.0Disaster Recovery and Reconstruction 0.0 1.6 0.0 0.0 0.0 0.0
EU 3.1 5.1 8.0 7.6 6.2 4.0Rice Competitiveness Programme 0.0 1.0 0.0 0.0 0.0 0.0Linmine 0.8 0.0 0.0 0.0 0.0 0.0Hydrometerological Services 0.0 0.2 1.6 1.0 1.0 0.0Linden Economic Advancement Program 1.3 1.2 1.3 1.3 0.0 0.0Essequibo & West Demerara 0.7 1.7 3.8 3.7 3.6 2.3Development of Housing Areas 0.3 1.0 1.3 1.5 1.6 1.7
IDA 0.2 7.3 7.6 8.1 8.1 6.1 HIS/AIDS programme 0.2 0.6 2.0 2.5 2.5 2.0
Annex E: TABLE 6: GUYANA--- EXTERNAL FINANCING, 2004-2009
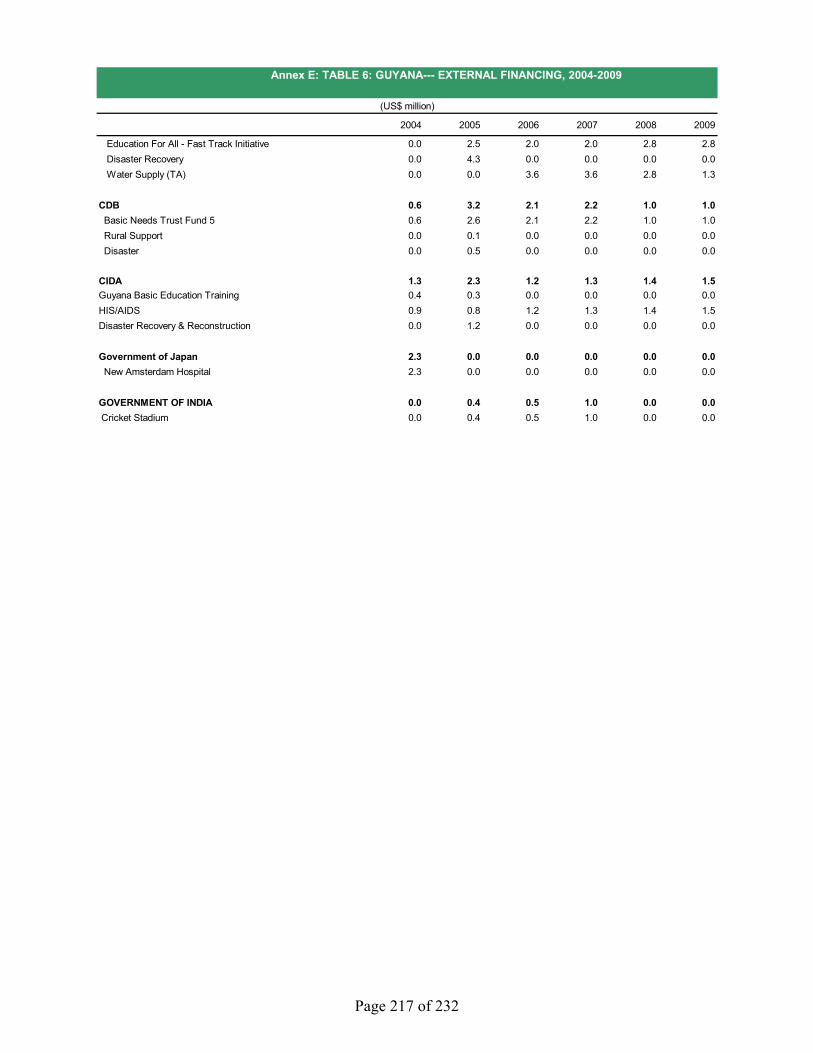
Page 217 of 232
(US$ million)
2004 2005 2006 2007 2008 2009
Education For All - Fast Track Initiative 0.0 2.5 2.0 2.0 2.8 2.8 Disaster Recovery 0.0 4.3 0.0 0.0 0.0 0.0 Water Supply (TA) 0.0 0.0 3.6 3.6 2.8 1.3
CDB 0.6 3.2 2.1 2.2 1.0 1.0 Basic Needs Trust Fund 5 0.6 2.6 2.1 2.2 1.0 1.0 Rural Support 0.0 0.1 0.0 0.0 0.0 0.0 Disaster 0.0 0.5 0.0 0.0 0.0 0.0
CIDA 1.3 2.3 1.2 1.3 1.4 1.5Guyana Basic Education Training 0.4 0.3 0.0 0.0 0.0 0.0HIS/AIDS 0.9 0.8 1.2 1.3 1.4 1.5Disaster Recovery & Reconstruction 0.0 1.2 0.0 0.0 0.0 0.0
Government of Japan 2.3 0.0 0.0 0.0 0.0 0.0 New Amsterdam Hospital 2.3 0.0 0.0 0.0 0.0 0.0
GOVERNMENT OF INDIA 0.0 0.4 0.5 1.0 0.0 0.0 Cricket Stadium 0.0 0.4 0.5 1.0 0.0 0.0
Annex E: TABLE 6: GUYANA--- EXTERNAL FINANCING, 2004-2009
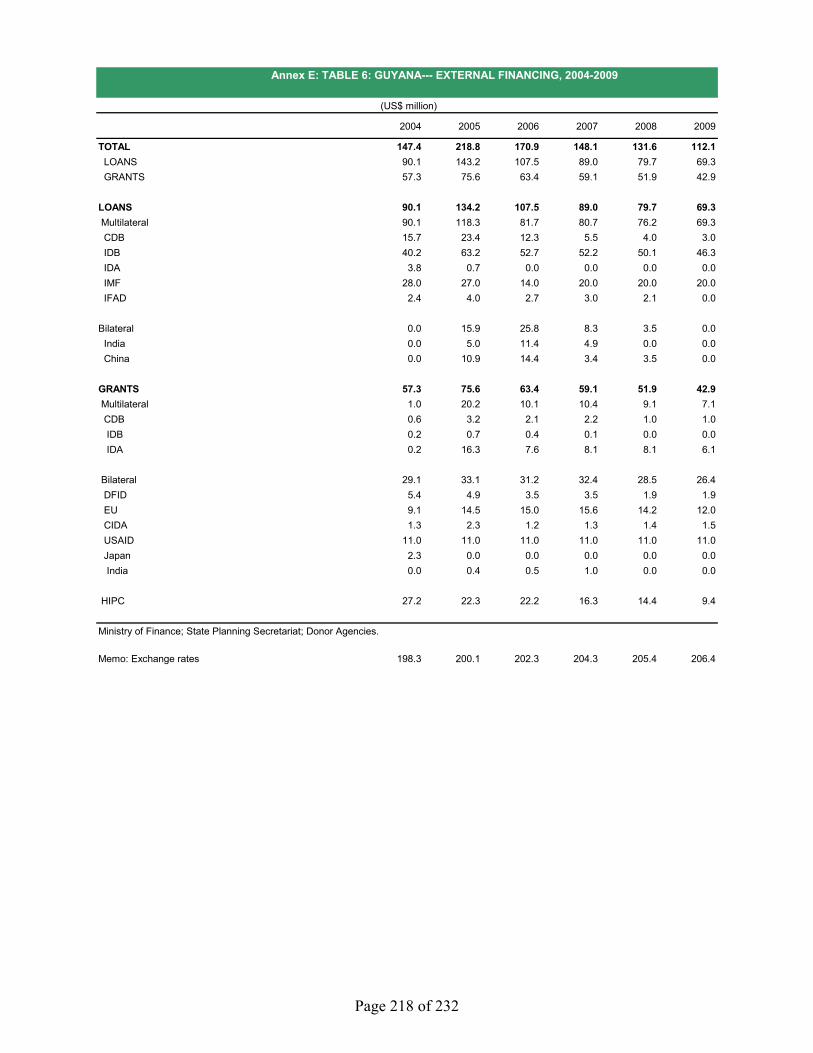
Page 218 of 232
(US$ million)
2004 2005 2006 2007 2008 2009
TOTAL 147.4 218.8 170.9 148.1 131.6 112.1 LOANS 90.1 143.2 107.5 89.0 79.7 69.3 GRANTS 57.3 75.6 63.4 59.1 51.9 42.9
LOANS 90.1 134.2 107.5 89.0 79.7 69.3 Multilateral 90.1 118.3 81.7 80.7 76.2 69.3 CDB 15.7 23.4 12.3 5.5 4.0 3.0 IDB 40.2 63.2 52.7 52.2 50.1 46.3 IDA 3.8 0.7 0.0 0.0 0.0 0.0 IMF 28.0 27.0 14.0 20.0 20.0 20.0 IFAD 2.4 4.0 2.7 3.0 2.1 0.0
Bilateral 0.0 15.9 25.8 8.3 3.5 0.0 India 0.0 5.0 11.4 4.9 0.0 0.0 China 0.0 10.9 14.4 3.4 3.5 0.0
GRANTS 57.3 75.6 63.4 59.1 51.9 42.9 Multilateral 1.0 20.2 10.1 10.4 9.1 7.1 CDB 0.6 3.2 2.1 2.2 1.0 1.0 IDB 0.2 0.7 0.4 0.1 0.0 0.0 IDA 0.2 16.3 7.6 8.1 8.1 6.1
Bilateral 29.1 33.1 31.2 32.4 28.5 26.4 DFID 5.4 4.9 3.5 3.5 1.9 1.9 EU 9.1 14.5 15.0 15.6 14.2 12.0 CIDA 1.3 2.3 1.2 1.3 1.4 1.5 USAID 11.0 11.0 11.0 11.0 11.0 11.0 Japan 2.3 0.0 0.0 0.0 0.0 0.0 India 0.0 0.4 0.5 1.0 0.0 0.0
HIPC 27.2 22.3 22.2 16.3 14.4 9.4
Ministry of Finance; State Planning Secretariat; Donor Agencies.
Memo: Exchange rates 198.3 200.1 202.3 204.3 205.4 206.4
Annex E: TABLE 6: GUYANA--- EXTERNAL FINANCING, 2004-2009
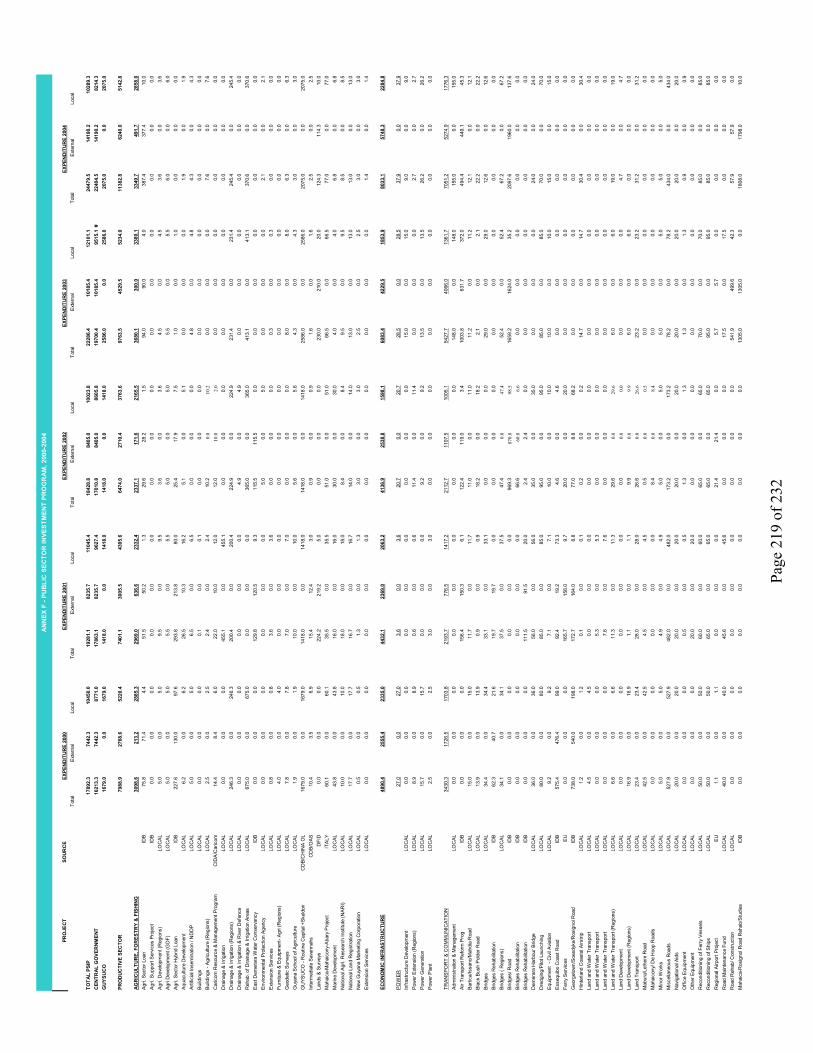
Page
219
of 2
32
PRO
JEC
TSO
UR
CE
Tota
lEx
tern
alLo
cal
Tota
lEx
tern
alLo
cal
Tota
lEx
tern
alLo
cal
Tota
lEx
tern
alLo
cal
Tota
lEx
tern
alLo
cal
TOTA
L PS
IP17
892.
374
42.3
1045
0.0
1928
1.1
8235
.711
045.
418
428.
884
05.0
1002
3.8
2228
6.4
1018
5.4
1210
1.1
2447
9.5
1419
0.2
1028
9.3
CEN
TRA
L G
OVE
RN
MEN
T16
213.
374
42.3
8771
.017
863.
182
35.7
9627
.417
010.
884
05.0
8605
.819
700.
410
185.
495
15.1
#22
404.
514
190.
282
14.3
GU
YSU
CO
1679
.00.
016
79.0
1418
.00.
014
18.0
1418
.00.
014
18.0
2586
.00.
025
86.0
2075
.00.
020
75.0
PRO
DU
CTI
VE S
ECTO
R79
88.9
2768
.652
20.4
7401
.130
05.5
4395
.664
74.0
2710
.437
63.6
9763
.545
29.5
5234
.011
382.
862
40.0
5142
.8
AG
RIC
ULT
UR
E, F
OR
ESTR
Y &
FIS
HIN
G30
98.6
213.
228
85.3
2969
.063
6.6
2332
.423
37.1
171.
621
65.5
3680
.130
0.0
3380
.133
49.7
491.
728
58.0
Agri.
Sec
tor L
oan
IDB
75.8
71.4
4.4
51.5
50.2
1.3
29.6
28.2
1.5
94.0
90.0
4.0
387.
437
7.4
10.0
Agri.
Sup
port
Serv
ices
Pro
ject
IDB
0.0
0.0
0.0
0.0
0.0
0.0
0.0
0.0
0.0
0.0
0.0
0.0
0.0
0.0
0.0
Agri.
Dev
elop
men
t (R
egio
ns)
LOC
AL5.
00.
05.
09.
50.
09.
53.
60.
03.
64.
50.
04.
53.
60.
03.
6Ag
ri D
evel
opm
ent (
GD
F)LO
CAL
5.0
0.0
5.0
5.5
0.0
5.5
5.0
0.0
5.0
5.5
0.0
5.5
6.0
0.0
6.0
Agri.
Sec
tor H
ybrid
Loa
nID
B22
7.6
130.
097
.629
3.8
213.
880
.025
.417
.97.
51.
00.
01.
00.
00.
00.
0Aq
uacu
lture
Dev
elop
men
tLO
CAL
6.2
0.0
6.2
26.5
10.3
16.2
5.1
0.0
5.1
0.0
0.0
0.0
1.9
0.0
1.9
Artif
icia
l Ins
emin
atio
n / N
DD
PLO
CAL
5.0
0.0
5.0
6.5
0.0
6.5
0.0
0.0
0.0
4.8
0.0
4.8
4.3
0.0
4.3
Build
ings
LOC
AL0.
00.
00.
00.
10.
00.
10.
00.
00.
00.
00.
00.
00.
00.
00.
0Bu
ildin
gs -
Agric
ultu
re (R
egio
ns)
LOC
AL2.
50.
02.
52.
40.
02.
410
.20.
010
.20.
00.
00.
07.
60.
07.
6C
aric
om R
esou
rce
& M
anag
emen
t Pro
gram
CID
A/C
aric
om14
.48.
46.
022
.010
.012
.012
.010
.02.
00.
00.
00.
00.
00.
00.
0D
rain
age
& Irr
igat
ion
LOC
AL0.
00.
00.
045
5.1
0.0
455.
10.
00.
00.
00.
00.
00.
00.
00.
00.
0D
rain
age
& Irr
igat
ion
(Reg
ions
)LO
CAL
246.
30.
024
6.3
200.
40.
020
0.4
224.
90.
022
4.9
231.
40.
023
1.4
245.
40.
024
5.4
Dra
inag
e &
Irrig
atio
n &
Rive
r Def
ence
LOC
AL0.
00.
00.
00.
00.
00.
04.
90.
04.
90.
00.
00.
00.
00.
00.
0R
ehab
. of D
rain
age
& Irr
igat
ion
Area
s LO
CAL
675.
00.
067
5.0
0.0
0.0
0.0
365.
00.
036
5.0
413.
10.
041
3.1
370.
60.
037
0.6
East
Dem
erar
a W
ater
Con
serv
ancy
IDB
0.0
0.0
0.0
129.
812
0.5
9.3
115.
511
5.5
0.0
0.0
0.0
0.0
0.0
0.0
0.0
Envir
onm
enta
l Pro
tect
ion
Agen
cyLO
CAL
0.0
0.0
0.0
0.0
0.0
0.0
5.0
0.0
5.0
0.0
0.0
0.0
2.1
0.0
2.1
Exte
nsio
n Se
rvic
esLO
CAL
0.8
0.0
0.8
3.6
0.0
3.6
0.0
0.0
0.0
0.3
0.0
0.3
0.0
0.0
0.0
Furn
iture
& E
quip
men
t- Ag
ri (R
egio
ns)
LOC
AL4.
00.
04.
00.
00.
00.
00.
00.
00.
00.
00.
00.
00.
00.
00.
0G
eode
tic S
urve
ysLO
CAL
7.8
0.0
7.8
7.0
0.0
7.0
0.0
0.0
0.0
8.0
0.0
8.0
6.3
0.0
6.3
Guy
ana
Sch
ool o
f Agr
icul
ture
LOC
AL1.
90.
01.
910
.00.
010
.05.
60.
05.
64.
30.
04.
33.
00.
03.
0G
UYS
UC
O -
Rou
tine
Cap
ital +
Skel
don
CD
B/C
HIN
A O
L16
79.0
0.0
1679
.014
18.0
0.0
1418
.014
18.0
0.0
1418
.025
86.0
0.0
2586
.020
75.0
0.0
2075
.0In
term
edia
te S
avan
nahs
CD
B/O
AS10
.43.
56.
915
.412
.43.
00.
90.
00.
91.
60.
01.
62.
50.
02.
5La
nds
& Su
rvey
sD
FID
0.0
0.0
0.0
224.
221
9.2
5.0
0.0
0.0
0.0
230.
021
0.0
20.0
124.
311
4.3
10.0
Mah
aica
-Mah
aico
ny-A
bary
Pro
ject
ITA
LY60
.10.
060
.135
.50.
035
.551
.00.
051
.066
.50.
066
.577
.00.
077
.0M
arin
e D
evel
opm
ent
LOC
AL43
.80.
043
.816
.00.
016
.030
.00.
030
.04.
00.
04.
06.
80.
06.
8N
atio
nal A
gri.
Res
earc
h In
stitu
te (N
AR
I)LO
CAL
10.0
0.0
10.0
18.0
0.0
18.0
8.4
0.0
8.4
9.5
0.0
9.5
8.5
0.0
8.5
Nat
iona
l Lan
d R
egis
tratio
nLO
CAL
17.7
0.0
17.7
16.7
0.0
16.7
14.0
0.0
14.0
13.0
0.0
13.0
13.0
0.0
13.0
New
Guy
ana
Mar
ketin
g C
orpo
ratio
nLO
CAL
0.5
0.0
0.5
1.3
0.0
1.3
3.0
0.0
3.0
2.5
0.0
2.5
3.0
0.0
3.0
Exte
nsio
n Se
rvic
esLO
CAL
0.0
0.0
0.0
0.0
0.0
0.0
0.0
0.0
0.0
0.0
0.0
0.0
1.4
0.0
1.4
ECO
NO
MIC
INFR
AST
RU
CTU
RE
4890
.425
55.4
2335
.044
32.1
2369
.020
63.2
4136
.925
38.8
1598
.160
83.4
4229
.518
53.9
8033
.157
48.3
2284
.8
POW
ER
27.0
0.0
27.0
3.6
0.0
3.6
20.7
0.0
20.7
28.5
0.0
28.5
37.9
0.0
37.9
Infra
stru
ctur
e D
evel
opm
ent
LOC
AL0.
00.
00.
00.
00.
00.
00.
00.
00.
015
.00.
015
.09.
00.
09.
0Po
wer
Ext
ensi
on (R
egio
ns)
LOC
AL8.
90.
08.
90.
60.
00.
611
.40.
011
.40.
00.
00.
02.
70.
02.
7Po
wer
Gen
erat
ion
LOC
AL15
.70.
015
.70.
00.
00.
09.
20.
09.
213
.50.
013
.526
.20.
026
.2Po
wer
Pla
ntLO
CAL
2.5
0.0
2.5
3.0
0.0
3.0
0.0
0.0
0.0
0.0
0.0
0.0
0.0
0.0
0.0
TRAN
SPO
RT
& C
OM
MU
NIC
ATIO
N34
30.3
1726
.517
03.8
2193
.777
6.5
1417
.221
12.7
1107
.510
05.1
5427
.740
66.0
1361
.770
51.2
5274
.917
76.3
Adm
inis
tratio
n &
Man
agem
ent
LOC
AL0.
00.
00.
00.
00.
00.
00.
00.
00.
014
8.0
0.0
148.
015
5.0
0.0
155.
0Ai
r Tra
nspo
rt R
efor
m P
rog
IDB
0.0
0.0
0.0
156.
415
0.3
6.1
122.
411
9.0
3.4
1003
.863
1.7
372.
049
4.4
449.
145
.3Ba
rtica
/Issa
no/M
ahdi
a R
oad
LOC
AL15
.00.
015
.011
.70.
011
.711
.00.
011
.011
.20.
011
.212
.10.
012
.1Bl
ack
Bush
Pol
der R
oad
LOC
AL13
.90.
013
.90.
90.
00.
918
.20.
018
.22.
10.
02.
122
.20.
022
.2Br
idge
sLO
CAL
34.4
0.0
34.4
33.1
0.0
33.1
0.0
0.0
0.0
29.0
0.0
29.0
12.6
0.0
12.6
Brid
ges
Reh
abilit
atio
nID
B62
.340
.721
.619
.719
.70.
00.
00.
00.
00.
00.
00.
00.
00.
00.
0Br
idge
s ( R
egio
ns)
LOC
AL34
.10.
034
.137
.50.
037
.547
.40.
047
.452
.40.
052
.467
.20.
067
.2Br
idge
s/ R
oad
IDB
0.0
0.0
0.0
0.0
0.0
0.0
969.
387
0.8
98.5
1659
.216
24.0
35.2
2097
.619
60.0
137.
6Br
idge
s R
ehab
ilitat
ion
IDB
0.0
0.0
0.0
0.0
0.0
0.0
66.6
60.0
6.6
0.0
0.0
0.0
0.0
0.0
0.0
Brid
ges
Reh
abilit
atio
nID
B0.
00.
00.
011
1.5
91.5
20.0
2.4
2.4
0.0
0.0
0.0
0.0
0.0
0.0
0.0
Dem
erar
a H
arbo
ur B
ridge
LOC
AL36
.00.
036
.056
.00.
056
.035
.00.
035
.00.
00.
00.
024
.00.
024
.0D
redg
ing/
Pilo
t Lau
nchi
ngLO
CAL
80.0
0.0
80.0
85.0
0.0
85.0
95.0
0.0
95.0
85.0
0.0
85.0
70.0
0.0
70.0
Equi
pmen
t - C
ivil
Avia
tion
LOC
AL9.
20.
09.
27.
10.
07.
110
.00.
010
.010
.00.
010
.015
.00.
015
.0Es
sequ
ibo
Coa
st R
oad
IDB
575.
447
6.4
99.0
92.4
19.2
73.3
4.6
0.0
4.6
0.0
0.0
0.0
0.0
0.0
0.0
Ferry
Ser
vices
EU0.
00.
00.
016
5.7
156.
09.
720
.00.
020
.00.
00.
00.
00.
00.
00.
0G
eorg
etow
n/So
esdy
ke/R
osig
nol R
oad
IDB
738.
054
0.0
198.
017
2.7
164.
08.
877
.08.
868
.20.
00.
00.
00.
00.
00.
0H
inte
rland
Coa
stal
Airs
trip
LOC
AL1.
20.
01.
20.
10.
00.
10.
20.
00.
214
.70.
014
.730
.40.
030
.4La
nd a
nd W
ater
Tra
nspo
rtLO
CAL
4.5
0.0
4.5
0.0
0.0
0.0
0.0
0.0
0.0
0.0
0.0
0.0
0.0
0.0
0.0
Land
and
Wat
er T
rans
port
LOC
AL0.
00.
00.
05.
30.
05.
30.
00.
00.
00.
00.
00.
00.
00.
00.
0La
nd a
nd W
ater
Tra
nspo
rtLO
CAL
0.0
0.0
0.0
7.6
0.0
7.6
0.0
0.0
0.0
0.0
0.0
0.0
0.0
0.0
0.0
Land
and
Wat
er T
rans
port
(Reg
ions
)LO
CAL
6.6
0.0
6.6
11.3
0.0
11.3
29.6
0.0
29.6
6.0
0.0
6.0
19.0
0.0
19.0
Land
Dev
elop
men
t LO
CAL
0.0
0.0
0.0
0.0
0.0
0.0
0.0
0.0
0.0
0.0
0.0
0.0
4.7
0.0
4.7
Land
Dev
elop
men
t (R
egio
ns)
LOC
AL16
.90.
016
.91.
10.
01.
19.
90.
09.
96.
00.
06.
00.
00.
00.
0La
nd T
rans
port
LOC
AL23
.40.
023
.428
.00.
028
.026
.60.
026
.623
.20.
023
.231
.20.
031
.2M
abur
a/Le
them
Roa
dLO
CAL
42.5
0.0
42.5
4.5
0.0
4.5
0.5
0.0
0.5
0.0
0.0
0.0
0.0
0.0
0.0
Mah
aico
ny/ D
e H
oop
Roa
dsLO
CAL
0.0
0.0
0.0
0.0
0.0
0.0
8.4
0.0
8.4
0.0
0.0
0.0
0.0
0.0
0.0
Min
or W
orks
LOC
AL5.
00.
05.
04.
90.
04.
95.
00.
05.
05.
00.
05.
05.
00.
05.
0M
isce
llane
ous
Roa
dsLO
CAL
527.
90.
052
7.9
482.
00.
048
2.0
173.
20.
017
3.2
78.2
0.0
78.2
434.
00.
043
4.0
Nav
igat
iona
l Aid
sLO
CAL
20.0
0.0
20.0
20.0
0.0
20.0
20.0
0.0
20.0
20.0
0.0
20.0
20.0
0.0
20.0
Offi
ce E
quip
men
tLO
CAL
0.0
0.0
0.0
0.5
0.0
0.5
1.3
0.0
1.3
1.3
0.0
1.3
0.9
0.0
0.9
Oth
er E
quip
men
tLO
CAL
0.0
0.0
0.0
20.0
0.0
20.0
0.0
0.0
0.0
0.0
0.0
0.0
0.0
0.0
0.0
Rec
ondi
tioni
ng o
f Fer
ry V
esse
lsLO
CAL
50.0
0.0
50.0
60.0
0.0
60.0
65.0
0.0
65.0
70.0
0.0
70.0
85.0
0.0
85.0
Rec
ondi
tioni
ng o
f Shi
psLO
CAL
50.0
0.0
50.0
65.0
0.0
65.0
65.0
0.0
65.0
95.0
0.0
95.0
85.0
0.0
85.0
Reg
iona
l Airp
ort P
roje
ctEU
1.1
0.0
1.1
0.0
0.0
0.0
21.4
21.4
0.0
5.7
5.7
0.0
0.0
0.0
0.0
Roa
d M
aint
enan
ce F
und
LOC
AL40
.00.
040
.045
.60.
045
.60.
00.
00.
017
.50.
017
.50.
00.
00.
0R
oad
Reh
ab/ C
onst
ruct
ion
LOC
AL0.
00.
00.
00.
00.
00.
00.
00.
00.
054
1.9
499.
642
.357
.957
.90.
0M
ahai
ca-R
osig
nol R
oad
Reh
ab/S
tudi
esID
B0.
00.
00.
00.
00.
00.
00.
00.
00.
013
05.0
1305
.00.
018
08.0
1798
.010
.0
EXPE
ND
ITU
RE
2000
EXPE
ND
ITU
RE
2001
EXPE
ND
ITU
RE
2002
ANN
EX F
- PU
BLI
C S
ECTO
R IN
VEST
MEN
T PR
OG
RAM
, 200
0-20
04
EXPE
ND
ITU
RE
2003
EXPE
ND
ITU
RE
2004
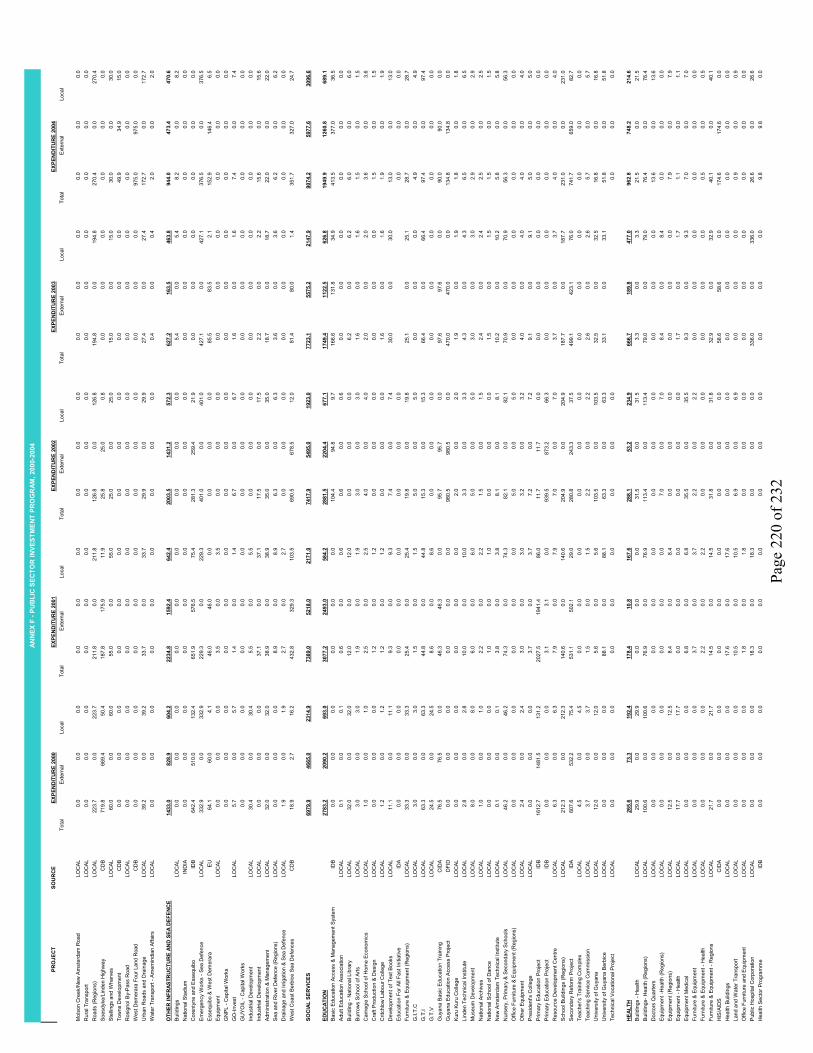
Page
220
of 2
32
PRO
JEC
TSO
UR
CE
Tota
lEx
tern
alLo
cal
Tota
lE
xter
nal
Loca
lTo
tal
Ext
erna
lLo
cal
Tota
lE
xter
nal
Loca
lTo
tal
Ext
erna
lLo
cal
Mol
son
Cre
ek/N
ew A
mst
erda
m R
oad
LOC
AL
0.0
0.0
0.0
0.0
0.0
0.0
0.0
0.0
0.0
0.0
0.0
0.0
0.0
0.0
0.0
Rur
al T
rans
port
LOC
AL
0.0
0.0
0.0
0.0
0.0
0.0
0.0
0.0
0.0
0.0
0.0
0.0
0.0
0.0
0.0
Roa
ds (R
egio
ns)
LOC
AL
223.
70.
022
3.7
211.
80.
021
1.8
126.
80.
012
6.8
194.
80.
019
4.8
270.
40.
027
0.4
Soe
sdyk
e/Li
nden
Hig
hway
CD
B71
9.8
669.
450
.418
7.8
175.
911
.925
.825
.00.
80.
00.
00.
00.
00.
00.
0S
tellin
gs a
nd W
harv
esLO
CA
L60
.00.
060
.055
.00.
055
.025
.00.
025
.015
.00.
015
.030
.00.
030
.0To
wns
Dev
elop
men
tC
DB
0.0
0.0
0.0
0.0
0.0
0.0
0.0
0.0
0.0
0.0
0.0
0.0
49.9
34.9
15.0
Ros
igno
l By-
Pas
s R
oad
LOC
AL
0.0
0.0
0.0
0.0
0.0
0.0
0.0
0.0
0.0
0.0
0.0
0.0
0.0
0.0
0.0
Wes
t Dem
erar
a Fo
ur L
and
Roa
dC
DB
0.0
0.0
0.0
0.0
0.0
0.0
0.0
0.0
0.0
0.0
0.0
0.0
975.
097
5.0
0.0
Urb
an R
oads
and
Dra
inag
eLO
CA
L39
.20.
039
.233
.70.
033
.729
.90.
029
.927
.40.
027
.417
2.7
0.0
172.
7W
ater
Tra
nspo
rt - A
mer
nind
ian
Affa
irsLO
CA
L0.
00.
00.
00.
00.
00.
00.
00.
00.
00.
40.
00.
42.
00.
02.
0
OTH
ER IN
FRAS
TRU
CTU
RE
AND
SEA
DEF
ENC
E14
33.0
828.
960
4.2
2234
.815
92.4
642.
420
03.5
1431
.257
2.3
627.
216
3.5
463.
894
4.0
473.
447
0.6
Bui
ldin
gsLO
CA
L0.
00.
00.
00.
00.
00.
00.
00.
00.
05.
40.
05.
48.
20.
08.
2N
atio
nal S
tadi
umIN
DIA
0.0
0.0
0.0
0.0
0.0
0.0
0.0
0.0
0.0
0.0
0.0
0.0
0.0
0.0
0.0
Cor
enty
ne a
nd E
sseq
uibo
IDB
642.
451
0.0
132.
465
1.9
576.
575
.428
1.3
259.
421
.90.
00.
00.
00.
00.
00.
0E
mer
genc
y W
orks
- S
ea D
efen
ceLO
CA
L33
2.9
0.0
332.
922
9.3
0.0
229.
340
1.0
0.0
401.
042
7.1
0.0
427.
137
6.5
0.0
376.
5E
sseq
uibo
& W
est D
emer
ara
EU
64.1
60.0
4.1
46.0
46.0
0.0
0.0
0.0
0.0
85.5
83.5
2.1
152.
914
6.4
6.5
Equ
ipm
ent
LOC
AL
0.0
0.0
0.0
3.5
0.0
3.5
0.0
0.0
0.0
0.0
0.0
0.0
0.0
0.0
0.0
GN
PL
- Cap
ital W
orks
0.0
0.0
0.0
0.0
0.0
0.0
0.0
0.0
0.0
0.0
0.0
0.0
0.0
0.0
0.0
GO
-Inve
stLO
CA
L5.
70.
05.
71.
40.
01.
46.
70.
06.
71.
60.
01.
67.
40.
07.
4G
UY
OIL
- C
apita
l Wor
ks0.
00.
00.
00.
00.
00.
00.
00.
00.
00.
00.
00.
00.
00.
00.
0In
dust
rial D
evel
opm
ent
LOC
AL
30.4
0.0
30.4
5.5
0.0
5.5
0.0
0.0
0.0
0.0
0.0
0.0
0.0
0.0
0.0
Indu
stria
l Dev
elop
men
tLO
CA
L0.
00.
00.
037
.10.
037
.117
.50.
017
.52.
20.
02.
215
.60.
015
.6A
dmin
istra
tion
& M
anag
emen
tLO
CA
L32
.00.
032
.038
.90.
038
.935
.00.
035
.018
.70.
018
.722
.00.
022
.0S
ea a
nd R
iver
Def
ence
(Reg
ions
)LO
CA
L0.
00.
00.
08.
90.
08.
96.
30.
06.
33.
60.
03.
66.
20.
06.
2D
rain
age
and
Irrig
atio
n &
Sea
Def
ence
LOC
AL
1.9
0.0
1.9
2.7
0.0
2.7
0.0
0.0
0.0
0.0
0.0
0.0
0.0
0.0
0.0
Wes
t Coa
st B
erbi
ce S
ea D
efen
ces
CD
B18
.92.
716
.243
2.8
329.
310
3.5
690.
567
8.5
12.0
81.4
80.0
1.4
351.
732
7.0
24.7
SOC
IAL
SER
VIC
ES69
79.9
4665
.023
14.9
7389
.052
18.0
2171
.074
17.9
5495
.019
23.0
7723
.155
75.2
2147
.990
74.2
5977
.630
96.6
EDU
CAT
ION
2783
.220
90.2
693.
030
77.2
2493
.058
4.2
2881
.522
04.4
677.
117
49.4
1122
.562
6.8
1949
.912
60.8
689.
1B
asic
Edu
catio
n Ac
cess
& M
anag
emen
t Sys
tem
IDB
0.0
0.0
0.0
0.0
0.0
0.0
104.
494
.89.
716
6.6
131.
834
.941
3.5
377.
036
.5A
dult
Edu
catio
n As
soci
atio
nLO
CA
L0.
10.
00.
10.
60.
00.
60.
60.
00.
60.
00.
00.
00.
00.
00.
0B
uild
ing
- Nat
iona
l Lib
rary
LOC
AL
32.0
0.0
32.0
12.0
0.0
12.0
0.0
0.0
0.0
6.2
0.0
6.2
6.0
0.0
6.0
Bur
row
s S
choo
l of A
rtsLO
CA
L3.
00.
03.
01.
90.
01.
93.
00.
03.
01.
60.
01.
61.
50.
01.
5C
arne
gie
Sch
ool o
f Hom
e E
cono
mic
sLO
CA
L1.
00.
01.
02.
50.
02.
54.
00.
04.
02.
00.
02.
03.
60.
03.
6C
raft
Prod
uctio
n &
Des
ign
LOC
AL
0.0
0.0
0.0
1.2
0.0
1.2
0.0
0.0
0.0
0.0
0.0
0.0
1.5
0.0
1.5
Crit
chlo
w L
abou
r Col
lege
LOC
AL
1.2
0.0
1.2
1.2
0.0
1.2
0.0
0.0
0.0
1.6
0.0
1.6
1.9
0.0
1.9
Dev
elop
men
t of T
ext B
ooks
LOC
AL
11.1
0.0
11.1
9.3
0.0
9.3
7.4
0.0
7.4
30.0
0.0
30.0
13.0
0.0
13.0
Edu
catio
n Fo
r All
Fast
Initi
ativ
eID
A0.
00.
00.
00.
00.
00.
00.
00.
00.
00.
00.
00.
0Fu
rnitu
re &
Equ
ipm
ent (
Reg
ions
)LO
CA
L33
.30.
033
.325
.40.
025
.419
.80.
019
.825
.10.
025
.128
.70.
028
.7G
.I.T.
CLO
CA
L3.
00.
03.
01.
50.
01.
55.
00.
05.
00.
00.
00.
04.
90.
04.
9G
.T.I
LOC
AL
63.3
0.0
63.3
44.8
0.0
44.8
15.3
0.0
15.3
66.4
0.0
66.4
97.4
0.0
97.4
G.T
.VLO
CA
L24
.50.
024
.58.
60.
08.
60.
00.
00.
00.
00.
00.
00.
00.
00.
0G
uyan
a B
asic
Edu
catio
n Tr
aini
ngC
IDA
76.5
76.5
0.0
46.3
46.3
0.0
95.7
95.7
0.0
97.6
97.6
0.0
90.0
90.0
0.0
Guy
ana
Edu
catio
n A
cces
s P
roje
ctD
FID
0.0
0.0
0.0
0.0
0.0
0.0
980.
598
0.5
0.0
470.
047
0.0
0.0
134.
813
4.8
0.0
Kur
u Ku
ru C
olle
geLO
CA
L0.
00.
00.
00.
00.
00.
02.
00.
02.
01.
90.
01.
91.
80.
01.
8Li
nden
Tec
hnic
al In
stitu
teLO
CA
L2.
80.
02.
810
.00.
010
.03.
30.
03.
34.
30.
04.
36.
50.
06.
5M
useu
m D
evel
opm
ent
LOC
AL
8.0
0.0
8.0
6.0
0.0
6.0
5.0
0.0
5.0
3.0
0.0
3.0
2.9
0.0
2.9
Nat
iona
l Arc
hive
sLO
CA
L1.
00.
01.
02.
20.
02.
21.
50.
01.
52.
40.
02.
42.
50.
02.
5N
atio
nal S
choo
l of D
ance
LOC
AL
0.0
0.0
0.0
1.0
0.0
1.0
0.0
0.0
0.0
1.5
0.0
1.5
1.5
0.0
1.5
New
Am
ster
dam
Tec
hnic
al In
stitu
teLO
CA
L0.
10.
00.
13.
80.
03.
88.
10.
08.
110
.20.
010
.25.
80.
05.
8N
urse
ry, P
rimar
y &
Sec
onda
ry S
choo
lsLO
CA
L46
.20.
046
.274
.30.
074
.382
.10.
082
.170
.90.
070
.956
.30.
056
.3O
ffice
Fur
nitu
re &
Equ
ipm
ent (
Reg
ions
)LO
CA
L0.
00.
00.
00.
00.
00.
05.
00.
05.
00.
00.
00.
00.
00.
00.
0O
ther
Equ
ipm
ent
LOC
AL
2.4
0.0
2.4
3.0
0.0
3.0
3.2
0.0
3.2
4.0
0.0
4.0
4.0
0.0
4.0
Pre
side
nt's
Col
lege
LOC
AL
0.0
0.0
0.0
3.7
0.0
3.7
7.2
0.0
7.2
9.1
0.0
9.1
5.0
0.0
5.0
Prim
ary
Edu
catio
n P
roje
ctID
B16
12.7
1481
.513
1.2
2027
.519
41.4
86.0
11.7
11.7
0.0
0.0
0.0
0.0
0.0
0.0
0.0
Prim
ary
Edu
catio
n P
roje
ctID
B0.
00.
00.
03.
13.
10.
093
9.5
873.
266
.30.
00.
00.
00.
00.
00.
0R
esou
rce
Dev
elop
men
t Cen
treLO
CA
L6.
30.
06.
37.
90.
07.
97.
00.
07.
03.
70.
03.
74.
00.
04.
0S
choo
l Bui
ldin
gs (R
egio
ns)
LOC
AL
212.
30.
021
2.3
140.
60.
014
0.6
204.
90.
020
4.9
187.
70.
018
7.7
231.
00.
023
1.0
Sec
onda
ry R
efor
m P
roje
ctID
A60
7.6
532.
275
.453
1.1
502.
129
.028
0.8
243.
337
.549
9.1
423.
176
.074
1.7
659.
082
.7Te
ache
r's T
rain
ing
Com
plex
LOC
AL
4.5
0.0
4.5
0.0
0.0
0.0
0.0
0.0
0.0
0.0
0.0
0.0
0.0
0.0
0.0
Teac
hing
Ser
vice
Com
mis
sion
LOC
AL
3.7
0.0
3.7
1.5
0.0
1.5
2.2
0.0
2.2
2.6
0.0
2.6
5.7
0.0
5.7
Uni
vers
ity o
f Guy
ana
LOC
AL
12.0
0.0
12.0
5.6
0.0
5.6
103.
50.
010
3.5
32.5
0.0
32.5
16.8
0.0
16.8
Uni
vers
ity o
f Guy
ana
Ber
bice
LOC
AL
0.0
0.0
0.0
88.1
0.0
88.1
63.3
0.0
63.3
33.1
0.0
33.1
51.8
0.0
51.8
Tech
nica
l Voc
atio
nal P
roje
ctLO
CA
L0.
00.
00.
00.
00.
00.
00.
00.
00.
00.
00.
00.
0
HEA
LTH
265.
673
.319
2.4
178.
410
.816
7.6
288.
153
.223
4.9
666.
718
9.8
477.
096
2.8
748.
221
4.6
Bui
ldin
gs -
Hea
lthLO
CA
L29
.90.
029
.90.
00.
00.
031
.50.
031
.53.
30.
03.
321
.50.
021
.5B
uild
ings
- Hea
lth (R
egio
ns)
LOC
AL
100.
60.
010
0.6
76.9
0.0
76.9
113.
40.
011
3.4
79.0
0.0
79.0
76.4
0.0
76.4
Doc
tors
Qua
rters
LOC
AL
0.0
0.0
0.0
0.0
0.0
0.0
0.0
0.0
0.0
0.0
0.0
0.0
13.6
0.0
13.6
Equ
ipm
ent -
Hea
lth (R
egio
ns)
LOC
AL
0.0
0.0
0.0
0.0
0.0
0.0
7.0
0.0
7.0
8.4
0.0
8.4
0.0
0.0
0.0
Equ
ipm
ent (
Reg
ions
)LO
CA
L12
.50.
012
.58.
40.
08.
40.
00.
00.
00.
00.
00.
07.
90.
07.
9E
quip
men
t - H
ealth
LOC
AL
17.7
0.0
17.7
0.0
0.0
0.0
0.0
0.0
0.0
1.7
0.0
1.7
1.1
0.0
1.1
Equ
ipm
ent M
edic
alLO
CA
L0.
00.
00.
06.
80.
06.
835
.50.
035
.59.
30.
09.
37.
00.
07.
0Fu
rnitu
re &
Equ
ipm
ent
LOC
AL
0.0
0.0
0.0
3.7
0.0
3.7
2.2
0.0
2.2
0.0
0.0
0.0
0.0
0.0
0.0
Furn
iture
& E
quip
men
t - H
ealth
LOC
AL
0.0
0.0
0.0
2.2
0.0
2.2
0.0
0.0
0.0
0.0
0.0
0.0
0.5
0.0
0.5
Furn
iture
& E
quip
men
t - R
egio
nsLO
CA
L21
.70.
021
.714
.50.
014
.531
.80.
031
.832
.90.
032
.940
.10.
040
.1H
IS/A
IDS
CID
A0.
00.
00.
00.
00.
00.
00.
00.
00.
058
.658
.60.
017
4.6
174.
60.
0H
ealth
Bui
ldin
gsLO
CA
L0.
00.
00.
017
.60.
017
.60.
00.
00.
00.
00.
00.
00.
00.
00.
0La
nd a
nd W
ater
Tra
nspo
rtLO
CA
L0.
00.
00.
010
.50.
010
.56.
90.
06.
90.
00.
00.
00.
90.
00.
9O
ffice
Fur
nitu
re a
nd E
quip
men
tLO
CA
L0.
00.
00.
01.
80.
01.
80.
00.
00.
00.
00.
00.
00.
00.
00.
0P
ublic
Hos
pita
l Cor
pora
tion
LOC
AL
0.0
0.0
0.0
18.3
0.0
18.3
0.0
0.0
0.0
336.
00.
033
6.0
26.6
0.0
26.6
Hea
lth S
ecto
r Pro
gram
me
IDB
0.0
0.0
0.0
0.0
0.0
0.0
0.0
0.0
0.0
0.0
0.0
0.0
9.8
9.8
0.0
ANN
EX F
- PU
BLI
C S
ECTO
R IN
VEST
MEN
T PR
OG
RAM
, 200
0-20
04
EXPE
ND
ITU
RE
2000
EXPE
ND
ITU
RE
2001
EXPE
ND
ITU
RE
2002
EXPE
ND
ITU
RE
2003
EXPE
ND
ITU
RE
2004

Page
221
of 2
32
PRO
JEC
TSO
UR
CE
Tota
lEx
tern
alLo
cal
Tota
lE
xter
nal
Loca
lTo
tal
Exte
rnal
Loca
lTo
tal
Ext
erna
lLo
cal
Tota
lE
xter
nal
Loca
l
Bas
ic N
utrit
ion
IDB
0.0
0.0
0.0
0.0
0.0
0.0
0.0
0.0
0.0
48.0
48.0
0.0
36.2
32.3
3.9
Tech
nica
l Ass
ista
nce
IDB
83.4
73.3
10.1
17.6
10.8
6.8
59.9
53.2
6.7
89.4
83.2
6.2
88.9
84.2
4.7
New
Am
ster
dam
Hos
pita
lJA
PAN
0.0
0.0
0.0
0.0
0.0
0.0
0.0
0.0
0.0
459.
445
5.9
3.5
457.
744
7.3
10.4
POVE
RTY
-TAR
GET
ED IN
TER
VEN
TIO
NS
1594
.812
33.8
361.
014
88.8
1217
.127
1.7
770.
660
1.3
169.
364
0.4
478.
016
2.5
1366
.488
1.4
485.
0B
asic
Nee
ds T
rust
Fun
d 5
CD
B24
7.4
230.
017
.419
5.4
149.
446
.046
.922
.424
.546
.88.
838
.020
3.1
118.
185
.0S
imap
- P
hase
IID
B0.
00.
00.
00.
00.
00.
00.
00.
00.
00.
00.
00.
00.
00.
00.
0S
imap
- P
hase
IIID
B10
82.2
967.
211
4.9
534.
747
3.1
61.5
467.
841
3.0
54.8
0.0
0.0
0.0
0.0
0.0
0.0
Sim
ap -
Pha
se II
IDB
0.0
0.0
0.0
432.
038
0.8
51.2
0.0
0.0
0.0
0.0
0.0
0.0
0.0
0.0
0.0
Sim
ap -
Pha
se II
IID
B0.
00.
00.
00.
00.
00.
00.
00.
00.
029
1.7
247.
244
.532
0.0
270.
749
.3P
over
ty P
rogr
amm
eLO
CA
L22
8.7
0.0
228.
711
3.0
0.0
113.
089
.60.
089
.678
.80.
078
.834
2.0
0.0
342.
0R
ural
Sup
port
Pro
ject
IF
AD
/CD
B0.
00.
00.
058
.358
.30.
00.
00.
00.
00.
00.
00.
00.
00.
00.
0R
ural
Sup
port
Pro
ject
IFA
D/C
DB
36.6
36.6
0.0
155.
515
5.5
0.0
166.
316
5.9
0.4
223.
022
1.9
1.1
501.
349
2.6
8.7
HO
USI
NG
DEV
ELO
PMEN
T46
2.2
0.0
462.
252
8.7
35.8
492.
982
0.2
503.
531
6.7
1239
.910
01.1
238.
825
61.3
1470
.010
91.3
Dev
elop
men
t of H
ousi
ng A
reas
EU
0.0
0.0
0.0
0.0
0.0
0.0
0.0
0.0
0.0
0.0
0.0
0.0
65.5
65.5
0.0
Infra
stru
ctur
e D
evel
opm
ent &
Bui
ldin
gLO
CA
L40
1.7
0.0
401.
741
3.0
0.0
413.
023
4.4
0.0
234.
419
6.6
0.0
196.
660
3.5
0.0
603.
5In
frast
ruct
ure
Dev
elop
men
tLO
CA
L10
.10.
010
.125
.00.
025
.033
.50.
033
.50.
00.
00.
013
.60.
013
.6In
frast
ruct
ure
Dev
elop
men
t (R
egio
ns)
LOC
AL
5.4
0.0
5.4
5.5
0.0
5.5
6.0
0.0
6.0
0.0
0.0
0.0
0.0
0.0
0.0
Land
Dev
elop
men
t (R
egio
ns)
LOC
AL
45.0
0.0
45.0
27.7
0.0
27.7
28.2
0.0
28.2
32.2
0.0
32.2
27.9
0.0
27.9
Ele
ctrif
icat
ion
Prog
ram
me
IDB
0.0
0.0
0.0
0.0
0.0
0.0
0.0
0.0
0.0
7.9
7.9
0.0
495.
795
.740
0.0
Low
Inco
me
Settl
emen
t Pro
gram
me
IDB
0.0
0.0
0.0
57.5
35.8
21.7
518.
150
3.5
14.6
1003
.299
3.2
10.0
1355
.113
08.8
46.3
CO
MM
UN
ITY
SER
VIC
ES46
8.2
102.
336
5.9
1005
.667
2.9
332.
812
74.6
935.
733
9.0
970.
548
9.5
481.
010
52.4
607.
744
4.7
Am
erin
dian
Dev
elop
men
t Fun
dLO
CA
L61
.40.
061
.440
.10.
040
.117
.50.
017
.524
.90.
024
.956
.80.
056
.8E
ntre
pren
eura
l Ski
lls T
rain
ing
LOC
AL
0.0
0.0
0.0
20.0
0.0
20.0
10.5
0.0
10.5
14.0
0.0
14.0
15.9
0.0
15.9
Nat
iona
l Spo
rts C
omm
issi
onLO
CA
L10
.00.
010
.05.
70.
05.
710
.00.
010
.08.
90.
08.
99.
00.
09.
0N
atio
nal T
rust
LOC
AL
1.8
0.0
1.8
5.5
0.0
5.5
6.0
0.0
6.0
3.4
0.0
3.4
5.6
0.0
5.6
Pro
ject
Dev
elop
men
t & A
ssis
tanc
eLO
CA
L25
7.0
0.0
257.
023
4.0
0.0
234.
00.
00.
00.
026
5.0
0.0
265.
026
8.7
0.0
268.
7S
olid
Was
te D
ispo
sal
IDB
0.0
0.0
0.0
0.0
0.0
0.0
0.5
0.0
0.5
10.1
10.1
0.0
73.4
60.0
13.4
Tour
ism
Dev
elop
men
tLO
CA
L18
.60.
018
.611
.00.
011
.011
.20.
011
.211
.20.
011
.24.
90.
04.
9U
man
a Ya
naLO
CA
L0.
00.
00.
00.
00.
00.
00.
00.
00.
04.
00.
04.
01.
00.
01.
0U
rban
Dev
elop
men
t Pro
gram
me
IDB
116.
010
2.3
13.7
268.
526
1.6
7.0
824.
675
3.1
71.4
370.
327
9.4
90.9
330.
428
2.3
48.1
Urb
an D
evel
opm
ent P
rogr
amm
eID
B0.
00.
00.
041
8.8
411.
37.
60.
00.
00.
00.
00.
00.
00.
00.
00.
0LE
AP
EU
0.0
0.0
0.0
0.0
0.0
0.0
182.
518
2.5
0.0
200.
020
0.0
0.0
265.
426
5.4
0.0
You
th In
itiat
ive
Pro
gram
me
LOC
AL
0.0
0.0
0.0
0.0
0.0
0.0
208.
80.
020
8.8
53.2
0.0
53.2
19.1
0.0
19.1
You
th a
nd S
ports
LOC
AL
3.4
0.0
3.4
2.0
0.0
2.0
3.0
0.0
3.0
5.5
0.0
5.5
2.2
0.0
2.2
WAT
ER14
05.8
1165
.324
0.5
1110
.378
8.5
321.
913
82.9
1196
.918
6.0
2456
.222
94.4
161.
911
81.4
1009
.517
1.9
Coa
stal
Wat
er S
uppl
yLO
CA
L0.
00.
00.
010
0.0
0.0
100.
012
0.0
0.0
120.
015
2.2
0.0
152.
212
0.5
0.0
120.
5E
quip
men
tLO
CA
L0.
00.
00.
00.
00.
00.
00.
50.
00.
51.
00.
01.
00.
00.
00.
0G
eorg
etow
n R
emed
ial &
Sew
erag
e P
roj.
IDB
351.
834
4.0
7.8
171.
715
5.5
16.1
65.7
65.7
0.0
0.0
0.0
0.0
0.0
0.0
0.0
Geo
rget
own
Rem
edia
l & S
ewer
age
Pro
j. II
IDB
0.0
0.0
0.0
0.0
0.0
0.0
20.0
20.0
0.0
20.9
20.9
0.0
0.0
0.0
0.0
LIN
MIN
E (L
inde
n W
ater
Sup
ply
Syst
em)
EU
0.0
0.0
0.0
0.0
0.0
0.0
43.3
0.0
43.3
21.6
21.6
0.0
163.
716
3.7
0.0
Land
Tra
nspo
rt (R
egio
ns)
LOC
AL
0.5
0.0
0.5
3.9
0.0
3.9
0.0
0.0
0.0
0.0
0.0
0.0
0.0
0.0
0.0
Pur
e W
ater
Sup
ply
(New
Am
ster
dam
)E
U12
7.0
109.
018
.048
.030
.018
.00.
00.
00.
00.
00.
00.
00.
00.
00.
0P
ure
Wat
er S
uppl
y - G
DF
LOC
AL
5.0
0.0
5.0
8.0
0.0
8.0
8.0
0.0
8.0
7.0
0.0
7.0
8.0
0.0
8.0
Rur
al W
ater
(Hin
terla
nd)
DFI
D18
.10.
018
.115
.00.
015
.00.
00.
00.
00.
00.
00.
010
.40.
010
.4W
ater
Sup
ply
- Reg
ions
LOC
AL
53.0
0.0
53.0
51.1
0.0
51.1
3.0
0.0
3.0
1.7
0.0
1.7
4.8
0.0
4.8
Wat
er S
uppl
y Te
chni
cal A
ssis
tanc
e/R
ehab
850.
471
2.3
138.
171
2.6
602.
910
9.7
1122
.411
11.2
11.2
2251
.922
51.9
0.0
874.
084
5.8
28.2
GEN
ERAL
PU
BLI
C S
ERVI
CES
2923
.58.
829
14.7
4491
.012
.244
78.8
4536
.919
9.6
4337
.247
99.8
80.7
4719
.140
22.5
1972
.620
49.9
ADM
INIS
TRAT
ION
& P
LAN
NIN
G48
7.9
8.8
479.
131
2.6
12.2
300.
473
7.5
199.
653
7.9
448.
080
.736
7.3
1070
.321
2.6
857.
7A
dmin
istra
tion
& S
uper
visi
onLO
CA
L4.
00.
04.
02.
80.
02.
89.
00.
09.
00.
00.
00.
00.
00.
00.
0B
uild
ing
LOC
AL
0.0
0.0
0.0
4.5
0.0
4.5
9.5
0.0
9.5
0.0
0.0
0.0
0.0
0.0
0.0
Bui
ldin
g --
Cul
tura
l Cen
ter
LOC
AL
7.5
0.0
7.5
6.5
0.0
6.5
25.4
0.0
25.4
4.7
0.0
4.7
3.5
0.0
3.5
Bur
eau
of S
tand
ards
LOC
AL
15.0
0.0
15.0
0.0
0.0
0.0
0.0
0.0
0.0
20.0
0.0
20.0
5.0
0.0
5.0
Equ
ipm
ent
LOC
AL
0.0
0.0
0.0
1.7
0.0
1.7
32.0
0.0
32.0
0.0
0.0
0.0
4.4
0.0
4.4
Equ
ipm
ent A
dmin
LOC
AL
0.0
0.0
0.0
0.5
0.0
0.5
0.0
0.0
0.0
0.0
0.0
0.0
0.0
0.0
0.0
Furn
iture
& E
quip
men
tLO
CA
L22
.80.
022
.829
.80.
029
.81.
50.
01.
534
.90.
034
.940
.90.
040
.9Fu
rnitu
re &
Equ
ipm
ent (
Reg
ions
)LO
CA
L1.
90.
01.
91.
50.
01.
53.
10.
03.
10.
00.
00.
06.
40.
06.
4Fu
rnitu
re a
nd E
quip
men
t - A
dmin
.(Reg
ions
)LO
CA
L0.
50.
00.
51.
50.
01.
50.
20.
00.
24.
30.
04.
30.
00.
00.
0Fu
rnitu
re a
nd E
quip
men
t - E
duca
tion(
Reg
ions
)LO
CA
L0.
00.
00.
00.
00.
00.
00.
50.
00.
50.
40.
00.
40.
50.
00.
5Fu
rnitu
re a
nd E
quip
men
t - A
dmin
.LO
CA
L0.
00.
00.
03.
40.
03.
40.
00.
00.
00.
00.
00.
00.
00.
00.
0Fu
rnitu
re a
nd E
quip
men
t - A
dmin
.(Reg
ions
)LO
CA
L0.
00.
00.
00.
00.
00.
00.
00.
00.
00.
00.
00.
00.
00.
00.
0Fu
rnitu
re a
nd E
quip
men
t - S
taff
Qua
rters
LOC
AL
0.0
0.0
0.0
0.0
0.0
0.0
0.0
0.0
0.0
0.0
0.0
0.0
0.0
0.0
0.0
Furn
iture
- S
taff
Qua
rters
LOC
AL
0.0
0.0
0.0
0.0
0.0
0.0
0.0
0.0
0.0
0.0
0.0
0.0
0.0
0.0
0.0
Furn
iture
and
Equ
ipm
ent -
Sta
ff Q
uarte
rs
LOC
AL
0.0
0.0
0.0
0.8
0.0
0.8
72.6
0.0
72.6
0.6
0.0
0.6
0.4
0.0
0.4
Furn
iture
and
Equ
ipm
ent -
Adm
in.
LOC
AL
0.0
0.0
0.0
0.0
0.0
0.0
0.0
0.0
0.0
0.0
0.0
0.0
0.0
0.0
0.0
Gov
ernm
ent B
uild
ings
LOC
AL
95.1
0.0
95.1
94.6
0.0
94.6
12.7
0.0
12.7
47.5
0.0
47.5
450.
60.
045
0.6
Guy
ana
Ele
ctio
ns C
omm
issi
onLO
CA
L0.
00.
00.
00.
00.
00.
00.
00.
00.
04.
40.
04.
420
.10.
020
.1G
uyan
a R
even
ue A
utho
rity
LOC
AL
0.0
0.0
0.0
48.5
0.0
48.5
52.0
0.0
52.0
42.3
0.0
42.3
53.0
0.0
53.0
Guy
ana
Ene
rgy
Agen
cyLO
CA
L0.
00.
00.
00.
00.
00.
05.
00.
05.
00.
00.
00.
00.
50.
00.
5G
uyan
a TV
/ Bro
adca
stin
g C
o. L
td./N
CN
LOC
AL
0.0
0.0
0.0
0.0
0.0
0.0
15.0
0.0
15.0
15.0
0.0
15.0
19.4
0.0
19.4
Guy
ana
Nat
iona
l Ser
vice
LOC
AL
10.0
0.0
10.0
0.0
0.0
0.0
0.0
0.0
0.0
0.0
0.0
0.0
0.0
0.0
0.0
Inte
rnal
Aud
itC
DB
8.8
8.8
0.0
9.8
9.8
0.0
5.1
5.1
0.0
0.0
0.0
0.0
0.0
0.0
0.0
Land
and
Wat
er T
rans
port
LOC
AL
0.0
0.0
0.0
0.0
0.0
0.0
2.0
0.0
2.0
0.0
0.0
0.0
9.5
0.0
9.5
Land
Tra
nspo
rtLO
CA
L0.
00.
00.
06.
50.
06.
516
.30.
016
.310
.70.
010
.70.
00.
00.
0La
nd T
rans
port
(Reg
ions
)LO
CA
L0.
00.
00.
00.
00.
00.
04.
50.
04.
54.
30.
04.
38.
50.
08.
5La
nd T
rans
port
- Hom
e A
ffairs
LOC
AL
0.0
0.0
0.0
0.0
0.0
0.0
0.0
0.0
0.0
4.0
0.0
4.0
0.0
0.0
0.0
Just
ice
Impr
ovem
ent P
rogr
amm
eLO
CA
L9.
60.
09.
60.
00.
00.
00.
00.
00.
00.
00.
00.
00.
00.
00.
0M
inor
Wor
ksLO
CA
L28
.00.
028
.027
.20.
027
.238
.50.
038
.535
.00.
035
.049
.90.
049
.9
CD
B/E
U/ID
A/
DFI
D/J
APA
N
ANN
EX F
- PU
BLI
C S
ECTO
R IN
VEST
MEN
T PR
OG
RAM
, 200
0-20
04
EXPE
ND
ITU
RE
2000
EXPE
ND
ITU
RE
2001
EXPE
ND
ITU
RE
2002
EXPE
ND
ITU
RE
2003
EXPE
ND
ITU
RE
2004
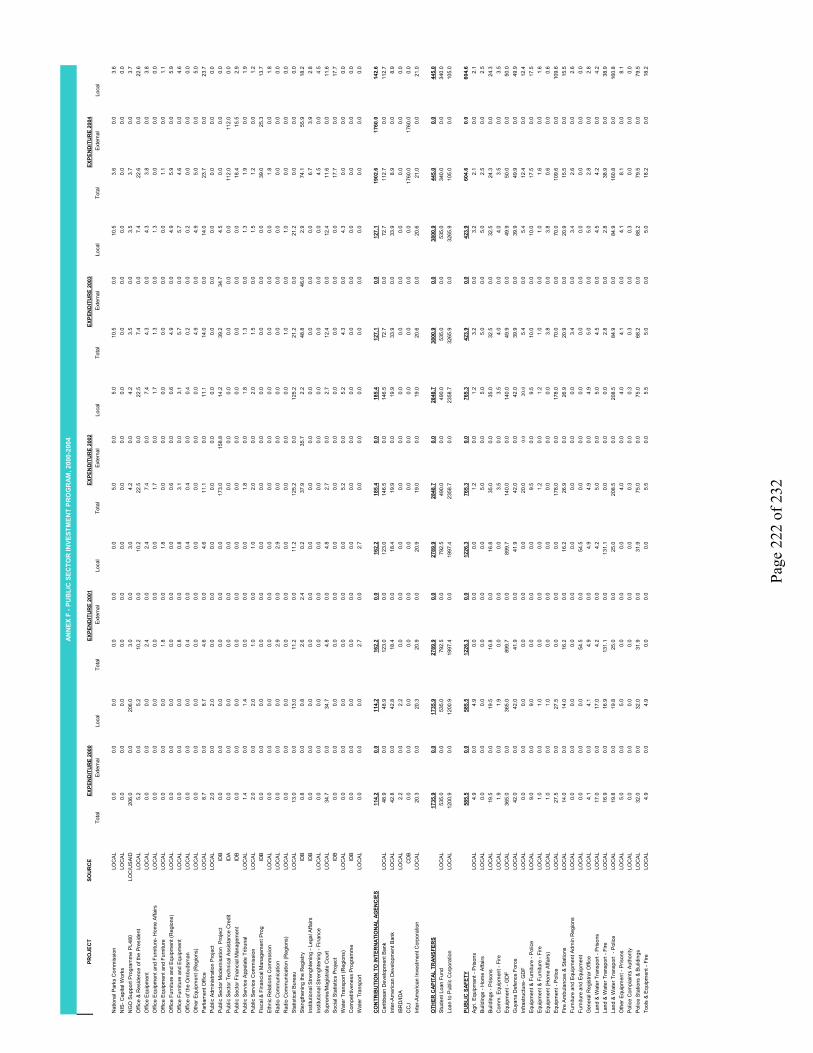
Page
222
of 2
32
PRO
JEC
TSO
UR
CE
Tota
lEx
tern
alLo
cal
Tota
lE
xter
nal
Loca
lTo
tal
Exte
rnal
Loca
lTo
tal
Ext
erna
lLo
cal
Tota
lE
xter
nal
Loca
l
Nat
iona
l Par
ks C
omm
issi
onLO
CAL
0.0
0.0
0.0
0.0
0.0
0.0
5.0
0.0
5.0
10.5
0.0
10.5
3.6
0.0
3.6
NIS
- Cap
ital W
orks
LOC
AL0.
00.
00.
00.
00.
00.
00.
00.
00.
00.
00.
00.
00.
00.
00.
0N
GO
Sup
port
Pro
gram
me
PL4
80LO
C/U
SAI
D20
6.0
0.0
206.
03.
00.
03.
04.
20.
04.
23.
50.
03.
53.
70.
03.
7O
ffice
& R
esid
ence
of t
he P
resi
dent
LOC
AL5.
20.
05.
210
.20.
010
.222
.50.
022
.57.
40.
07.
422
.60.
022
.6O
ffice
Equ
ipm
ent
LOC
AL0.
00.
00.
02.
40.
02.
47.
40.
07.
44.
30.
04.
33.
80.
03.
8O
ffice
Equ
ipm
ent a
nd F
urni
ture
- Hom
e A
ffairs
LOC
AL0.
00.
00.
00.
00.
00.
01.
70.
01.
71.
30.
01.
30.
00.
00.
0O
ffice
Equ
ipm
ent a
nd F
urni
ture
LOC
AL0.
00.
00.
01.
80.
01.
80.
00.
00.
00.
00.
00.
01.
10.
01.
1O
ffice
Fur
nitu
re a
nd E
quip
men
t (R
egio
ns)
LOC
AL0.
00.
00.
00.
00.
00.
00.
60.
00.
64.
90.
04.
95.
90.
05.
9O
ffice
Fur
nitu
re a
nd E
quip
men
tLO
CAL
0.0
0.0
0.0
0.8
0.0
0.8
3.1
0.0
3.1
5.7
0.0
5.7
4.6
0.0
4.6
Offi
ce o
f the
Om
buds
man
LOC
AL0.
00.
00.
00.
40.
00.
40.
40.
00.
40.
20.
00.
20.
00.
00.
0O
ther
Equ
ipm
ent (
Reg
ions
)LO
CAL
0.0
0.0
0.0
0.0
0.0
0.0
0.0
0.0
0.0
4.9
0.0
4.9
5.0
0.0
5.0
Par
liam
ent O
ffice
LOC
AL8.
70.
08.
74.
60.
04.
611
.10.
011
.114
.00.
014
.023
.70.
023
.7P
ublic
Adm
inis
tratio
n P
roje
ctLO
CAL
2.0
0.0
2.0
0.0
0.0
0.0
0.0
0.0
0.0
0.0
0.0
0.0
0.0
0.0
0.0
Pub
lic S
ecto
r Mod
erni
satio
n P
roje
ctID
B0.
00.
00.
00.
00.
00.
017
3.0
158.
814
.239
.234
.74.
50.
00.
00.
0P
ublic
Sec
tor T
echn
ical
Ass
ista
nce
Cre
dit
IDA
0.0
0.0
0.0
0.0
0.0
0.0
0.0
0.0
0.0
0.0
0.0
0.0
112.
011
2.0
0.0
Pub
lic S
ecto
r Fin
anci
al M
anag
emen
tID
B0.
00.
00.
00.
00.
00.
00.
00.
00.
00.
00.
00.
018
.415
.52.
9P
ublic
Ser
vice
App
elat
e Tr
ibun
alLO
CAL
1.4
0.0
1.4
0.0
0.0
0.0
1.8
0.0
1.8
1.3
0.0
1.3
1.9
0.0
1.9
Pub
lic S
ervi
ce C
omm
issi
onLO
CAL
2.0
0.0
2.0
1.0
0.0
1.0
2.0
0.0
2.0
1.5
0.0
1.5
1.2
0.0
1.2
Fisc
al &
Fin
anci
al M
anag
emen
t Pro
gID
B0.
00.
00.
00.
00.
00.
00.
00.
00.
00.
00.
00.
039
.025
.313
.7E
thni
c R
elat
ions
Com
mss
ion
LOC
AL0.
00.
00.
00.
00.
00.
00.
00.
00.
00.
00.
00.
01.
80.
01.
8R
adio
Com
mun
icat
ion
LOC
AL0.
00.
00.
02.
90.
02.
90.
00.
00.
00.
00.
00.
00.
00.
00.
0R
adio
Com
mun
icat
ion
(Reg
ions
)LO
CAL
0.0
0.0
0.0
0.0
0.0
0.0
0.0
0.0
0.0
1.0
0.0
1.0
0.0
0.0
0.0
Sta
tistic
al B
urea
uLO
CAL
13.0
0.0
13.0
11.2
0.0
11.2
125.
20.
012
5.2
21.2
0.0
21.2
0.0
0.0
0.0
Ste
ngth
enin
g th
e R
egis
tryID
B0.
80.
00.
82.
62.
40.
237
.935
.72.
248
.846
.02.
974
.155
.918
.2In
stitu
tiona
l Stre
nght
enin
g - L
egal
Affa
irsID
B0.
00.
00.
00.
00.
00.
00.
00.
00.
00.
00.
00.
06.
73.
92.
8In
stitu
tiona
l Stre
nght
enin
g - F
inan
ceLO
CAL
0.0
0.0
0.0
0.0
0.0
0.0
0.0
0.0
0.0
0.0
0.0
0.0
4.5
0.0
4.5
Sup
rem
e/M
agis
trate
Cou
rtLO
CAL
34.7
0.0
34.7
4.8
0.0
4.8
2.7
0.0
2.7
12.4
0.0
12.4
11.6
0.0
11.6
Soc
ial S
tatis
tics
Proj
ect
IDB
0.0
0.0
0.0
0.0
0.0
0.0
0.0
0.0
0.0
0.0
0.0
0.0
17.7
0.0
17.7
Wat
er T
rans
port
(Reg
ions
)LO
CAL
0.0
0.0
0.0
0.0
0.0
0.0
5.2
0.0
5.2
4.3
0.0
4.3
0.0
0.0
0.0
Com
petit
iven
ess
Pro
gram
me
IDB
0.0
0.0
0.0
0.0
0.0
0.0
0.0
0.0
0.0
0.0
0.0
0.0
0.0
0.0
0.0
Wat
er T
rans
port
LOC
AL0.
00.
00.
02.
70.
02.
70.
00.
00.
00.
00.
00.
00.
00.
00.
0
CO
NTR
IBU
TIO
N T
O IN
TER
NAT
ION
AL A
GEN
CIE
S11
4.2
0.0
114.
216
2.2
0.0
162.
218
5.4
0.0
185.
412
7.1
0.0
127.
119
02.6
1760
.014
2.6
Car
ibbe
an D
evel
opm
ent B
ank
LOC
AL48
.90.
048
.912
3.0
0.0
123.
014
6.5
0.0
146.
572
.70.
072
.711
2.7
0.0
112.
7In
ter-A
mer
ican
Dev
elop
men
t Ban
kLO
CAL
42.8
0.0
42.8
18.4
0.0
18.4
19.9
0.0
19.9
33.9
0.0
33.9
8.9
0.0
8.9
IBR
D/ID
ALO
CAL
2.2
0.0
2.2
0.0
0.0
0.0
0.0
0.0
0.0
0.0
0.0
0.0
0.0
0.0
0.0
CC
JC
DB
0.0
0.0
0.0
0.0
0.0
0.0
0.0
0.0
0.0
0.0
0.0
0.0
1760
.017
60.0
0.0
Inte
r-Am
eric
an In
vest
men
t Cor
pora
tion
LOC
AL20
.30.
020
.320
.90.
020
.919
.00.
019
.020
.60.
020
.621
.00.
021
.0
OTH
ER C
APIT
AL T
RAN
SFER
S17
35.9
0.0
1735
.927
89.9
0.0
2789
.928
48.7
0.0
2848
.738
00.9
0.0
3800
.944
5.0
0.0
445.
0S
tude
nt L
oan
Fund
LOC
AL53
5.0
0.0
535.
079
2.5
0.0
792.
549
0.0
0.0
490.
053
5.0
0.0
535.
034
0.0
0.0
340.
0Lo
an to
Pub
lic C
orpo
ratio
nLO
CAL
1200
.90.
012
00.9
1997
.40.
019
97.4
2358
.70.
023
58.7
3265
.90.
032
65.9
105.
00.
010
5.0
PUB
LIC
SAF
ETY
585.
50.
058
5.5
1226
.30.
012
26.3
765.
30.
076
5.3
423.
90.
042
3.9
604.
60.
060
4.6
Agr
i. E
quip
men
t - P
rison
sLO
CAL
4.9
0.0
4.9
0.0
0.0
0.0
1.2
0.0
1.2
3.2
0.0
3.2
2.1
0.0
2.1
Bui
ldin
gs -
Hom
e A
ffairs
LOC
AL0.
00.
00.
00.
00.
00.
05.
00.
05.
05.
00.
05.
02.
50.
02.
5B
uild
ings
- Pr
ison
sLO
CAL
19.5
0.0
19.5
16.8
0.0
16.8
35.0
0.0
35.0
32.5
0.0
32.5
24.3
0.0
24.3
Com
m. E
quip
men
t - F
ireLO
CAL
1.9
0.0
1.9
0.0
0.0
0.0
3.5
0.0
3.5
4.0
0.0
4.0
3.5
0.0
3.5
Equ
ipm
ent -
GD
FLO
CAL
365.
00.
036
5.0
899.
70.
089
9.7
140.
00.
014
0.0
49.9
0.0
49.9
50.0
0.0
50.0
Guy
ana
Def
ence
For
ceLO
CAL
42.0
0.0
42.0
41.9
0.0
41.9
42.0
0.0
42.0
39.9
0.0
39.9
49.9
0.0
49.9
Infra
stru
ctur
e- G
DF
LOC
AL0.
00.
00.
00.
00.
00.
020
.00.
020
.05.
40.
05.
412
.40.
012
.4E
quip
men
t & F
urni
ture
- P
olic
eLO
CAL
9.0
0.0
9.0
0.0
0.0
0.0
9.5
0.0
9.5
10.0
0.0
10.0
17.5
0.0
17.5
Equ
ipm
ent &
Fur
nitu
re -
Fire
LO
CAL
1.0
0.0
1.0
0.0
0.0
0.0
1.2
0.0
1.2
1.0
0.0
1.0
1.6
0.0
1.6
Equ
ipm
ent (
Hom
e A
ffairs
)LO
CAL
1.0
0.0
1.0
0.0
0.0
0.0
0.0
0.0
0.0
3.8
0.0
3.8
0.6
0.0
0.6
Equ
ipm
ent -
Pol
ice
LOC
AL27
.50.
027
.50.
00.
00.
017
8.0
0.0
178.
070
.00.
070
.010
9.6
0.0
109.
6Fi
re A
mbu
lanc
es &
Sta
tions
LOC
AL14
.00.
014
.016
.20.
016
.226
.90.
026
.920
.90.
020
.915
.50.
015
.5Fu
rnitu
re a
nd E
quip
men
t Adm
in R
egio
nsLO
CAL
0.0
0.0
0.0
0.0
0.0
0.0
0.0
0.0
0.0
3.4
0.0
3.4
2.6
0.0
2.6
Furn
iture
and
Equ
ipm
ent
LOC
AL0.
00.
00.
054
.50.
054
.50.
00.
00.
00.
00.
00.
00.
00.
00.
0G
ener
al R
egis
trar O
ffice
LOC
AL4.
10.
04.
14.
90.
04.
94.
90.
04.
95.
00.
05.
02.
80.
02.
8La
nd &
Wat
er T
rans
port
- Pris
ons
LOC
AL17
.00.
017
.04.
20.
04.
25.
00.
05.
04.
50.
04.
54.
20.
04.
2La
nd &
Wat
er T
rans
port
- Fire
LOC
AL16
.90.
016
.913
1.1
0.0
131.
10.
00.
00.
02.
80.
02.
838
.90.
038
.9La
nd &
Wat
er T
rans
port
- P
olic
eLO
CAL
19.8
0.0
19.8
25.0
0.0
25.0
208.
50.
020
8.5
84.9
0.0
84.9
160.
80.
016
0.8
Oth
er E
quip
men
t - P
rison
sLO
CAL
5.0
0.0
5.0
0.0
0.0
0.0
4.0
0.0
4.0
4.1
0.0
4.1
8.1
0.0
8.1
Pol
ice
Com
plai
nts
Aut
horit
yLO
CAL
0.0
0.0
0.0
0.0
0.0
0.0
0.3
0.0
0.3
0.3
0.0
0.3
0.0
0.0
0.0
Pol
ice
Stat
ions
& B
uild
ings
LOC
AL32
.00.
032
.031
.90.
031
.975
.00.
075
.068
.20.
068
.279
.50.
079
.5To
ols
& E
quip
men
t - F
ireLO
CAL
4.9
0.0
4.9
0.0
0.0
0.0
5.5
0.0
5.5
5.0
0.0
5.0
18.2
0.0
18.2
ANN
EX F
- PU
BLI
C S
ECTO
R IN
VEST
MEN
T PR
OG
RAM
, 200
0-20
04
EXPE
ND
ITU
RE
2000
EXPE
ND
ITU
RE
2001
EXPE
ND
ITU
RE
2002
EXPE
ND
ITU
RE
2003
EXPE
ND
ITU
RE
2004

Page
223
of 2
32
PRO
JEC
TSO
UR
CE
BU
DG
ET 2
006
Tota
lE
xter
nal
Loca
lTo
tal
Ext
erna
lLo
cal
Tota
lE
xter
nal
Loca
lTo
tal
Ext
erna
lLo
cal
Tota
lE
xter
nal
Loca
lTo
tal
Ext
erna
lLo
cal
TOTA
L PS
IP24
479.
314
190.
410
288.
940
808.
318
080.
422
727.
945
985.
918
019.
827
966.
141
320.
917
906.
423
414.
533
438.
814
243.
919
194.
932
391.
013
033.
819
357.
2
CEN
TRAL
GO
VER
NM
ENT
22
404.
314
190.
482
13.9
27
729.
318
080.
496
48.9
3088
9.9
1801
9.8
1287
0.1
30
870.
917
906.
412
964.
529
031.
814
243.
914
787.
9
2818
8.0
1303
3.8
1515
4.2
G
UYS
UC
O20
75.0
0.0
2075
.013
079.
00.
013
079.
015
096.
00.
015
096.
010
450.
00.
010
450.
044
07.0
0.0
4407
.042
03.0
0.0
4203
.0
PRO
DU
CTI
VE S
ECTO
R11
382.
862
40.1
5142
.726
767.
095
04.7
1726
2.3
3124
2.9
7913
.423
329.
525
386.
267
95.2
1859
1.0
2098
4.5
6283
.214
701.
320
827.
560
40.4
1478
7.1
AGR
ICU
LTU
RE,
FO
RES
TRY
& F
ISH
ING
3349
.849
1.7
2858
.114
484.
751
9.9
1396
4.8
1671
8.0
367.
216
350.
812
361.
444
8.8
1191
2.6
7860
.730
6.0
7554
.779
26.0
308.
076
18.0
Agr
i. S
ecto
r Loa
nID
B38
7.4
377.
410
.00.
00.
00.
00.
00.
00.
00.
00.
00.
00.
00.
00.
00.
00.
00.
0Ag
ri. S
uppo
rt Se
rvic
es P
roje
ctID
B0.
00.
00.
033
0.0
300.
030
.040
3.9
367.
236
.749
3.7
448.
844
.933
6.6
306.
030
.633
8.8
308.
030
.8Ag
ri. D
evel
opm
ent (
Reg
ions
)LO
CAL
3.6
0.0
3.6
4.5
0.0
4.5
4.6
0.0
4.6
4.7
0.0
4.7
4.8
0.0
4.8
5.0
0.0
5.0
Agri.
Dev
elop
men
t (G
DF)
LOC
AL6.
00.
06.
06.
20.
06.
26.
40.
06.
46.
50.
06.
56.
70.
06.
76.
80.
06.
8A
quac
ultu
re D
evel
opm
ent
LOC
AL
1.9
0.0
1.9
1.0
0.0
1.0
1.0
0.0
1.0
1.1
0.0
1.1
1.1
0.0
1.1
1.1
0.0
1.1
Arti
ficia
l Ins
emin
atio
n / N
DD
PLO
CA
L4.
30.
04.
33.
30.
03.
33.
40.
03.
43.
40.
03.
43.
50.
03.
53.
60.
03.
6D
rain
age
& Irr
igat
ion
(Reg
ions
)LO
CAL
245.
40.
024
5.4
245.
00.
024
5.0
320.
00.
032
0.0
400.
00.
040
0.0
440.
00.
044
0.0
484.
00.
048
4.0
Reh
ab. o
f Dra
inag
e &
Irrig
atio
n Ar
eas
LOC
AL37
0.6
0.0
370.
637
9.0
0.0
379.
077
7.2
0.0
777.
289
3.8
0.0
893.
825
50.0
0.0
2550
.027
70.0
0.0
2770
.0M
ahai
ca-M
ahai
cony
-Aba
ry P
roje
ctLO
CA
L77
.00.
077
.010
2.0
0.0
102.
00.
00.
00.
00.
00.
00.
00.
00.
00.
00.
00.
00.
0G
eode
tic S
urve
ysLO
CAL
6.3
0.0
6.3
6.5
0.0
6.5
6.7
0.0
6.7
6.8
0.0
6.8
7.0
0.0
7.0
7.2
0.0
7.2
GR
DB
- C
apita
l Wor
ksLO
CAL
0.0
0.0
0.0
0.0
0.0
0.0
0.0
0.0
0.0
0.0
0.0
0.0
0.0
0.0
0.0
0.0
0.0
0.0
Guy
ana
Sch
ool o
f Agr
icul
ture
LOC
AL
3.0
0.0
3.0
5.0
0.0
5.0
5.1
0.0
5.1
5.3
0.0
5.3
5.4
0.0
5.4
5.5
0.0
5.5
GU
YS
UC
O -
Cap
ital W
orks
CD
B/C
HIN
A20
75.0
0.0
2075
.013
079.
00.
013
079.
015
096.
00.
015
096.
010
450.
00.
010
450.
044
07.0
0.0
4407
.042
03.0
0.0
4203
.0In
term
edia
te S
avan
nahs
OA
S2.
50.
02.
51.
90.
01.
90.
00.
00.
00.
00.
00.
00.
00.
00.
00.
00.
00.
0M
arin
e D
evel
opm
ent
LOC
AL6.
80.
06.
825
.00.
025
.025
.60.
025
.626
.30.
026
.326
.90.
026
.927
.60.
027
.6R
ice
Com
petit
iven
ess
Pro
gram
me
EU
0.0
0.0
0.0
200.
020
0.0
0.0
0.0
0.0
0.0
0.0
0.0
0.0
0.0
0.0
0.0
0.0
0.0
0.0
Nat
iona
l Agr
i. R
esea
rch
Inst
itute
(NAR
I)LO
CAL
8.5
0.0
8.5
19.0
0.0
19.0
19.5
0.0
19.5
20.0
0.0
20.0
20.5
0.0
20.5
21.0
0.0
21.0
Nat
iona
l Lan
d R
egis
tratio
nLO
CAL
13.0
0.0
13.0
30.0
0.0
30.0
30.8
0.0
30.8
31.5
0.0
31.5
32.3
0.0
32.3
33.1
0.0
33.1
Land
s an
d S
urve
ysD
FID
124.
311
4.3
10.0
29.9
19.9
10.0
0.0
0.0
0.0
0.0
0.0
0.0
0.0
0.0
0.0
0.0
0.0
0.0
New
Guy
ana
Mar
ketin
g C
orpo
ratio
nLO
CAL
3.0
0.0
3.0
4.0
0.0
4.0
4.1
0.0
4.1
4.2
0.0
4.2
4.3
0.0
4.3
4.4
0.0
4.4
Ext
ensi
on S
ervi
ces
LOC
AL
1.4
0.0
1.4
2.5
0.0
2.5
2.6
0.0
2.6
2.6
0.0
2.6
2.7
0.0
2.7
2.8
0.0
2.8
Bui
ldin
gs -
Agr
icul
ture
(Reg
ions
)LO
CA
L7.
60.
07.
67.
00.
07.
07.
20.
07.
27.
40.
07.
47.
50.
07.
57.
70.
07.
7E
nviro
nmen
tal P
rote
ctio
n A
genc
yLO
CA
L2.
10.
02.
14.
00.
04.
04.
10.
04.
14.
20.
04.
24.
30.
04.
34.
40.
04.
4
ECO
NO
MIC
INFR
ASTR
UC
TUR
E80
33.0
5748
.422
84.6
1228
2.3
8984
.832
97.5
1452
4.8
7546
.269
78.6
1302
4.8
6346
.466
78.4
1312
3.9
5977
.271
46.7
1290
1.5
5732
.471
69.1
PO
WE
R37
.90.
037
.924
.50.
024
.525
.10.
025
.125
.70.
025
.726
.40.
026
.427
.00.
027
.0P
ower
Ext
ensi
on (R
egio
ns)
LOC
AL
2.7
0.0
2.7
9.5
0.0
9.5
9.7
0.0
9.7
10.0
0.0
10.0
10.2
0.0
10.2
10.5
0.0
10.5
Pow
er G
ener
atio
nLO
CA
L26
.20.
026
.26.
00.
06.
06.
20.
06.
26.
30.
06.
36.
50.
06.
56.
60.
06.
6In
frast
ruct
ure
Dev
elop
men
tLO
CA
L9.
00.
09.
09.
00.
09.
09.
20.
09.
29.
50.
09.
59.
70.
09.
79.
90.
09.
9
TRA
NS
PO
RT
& C
OM
MU
NIC
ATI
ON
7051
.252
75.0
1776
.295
10.4
6991
.825
18.6
1023
6.1
4038
.261
97.9
1008
2.1
4202
.058
80.1
1136
9.2
5038
.863
30.4
1160
9.8
5263
.263
46.6
Adm
inis
tratio
n &
Man
agem
ent
LOC
AL15
5.0
0.0
155.
016
5.0
0.0
165.
016
9.1
0.0
169.
117
3.4
0.0
173.
417
7.7
0.0
177.
718
2.1
0.0
182.
1A
irpor
t Tra
nspo
rt R
efor
mID
B49
4.4
449.
145
.348
2.8
422.
860
.024
4.8
204.
040
.817
1.4
142.
828
.60.
00.
00.
00.
00.
00.
0A
irpor
t Sec
urity
IDB
0.0
0.0
0.0
54.0
54.0
0.0
0.0
0.0
0.0
0.0
0.0
0.0
0.0
0.0
0.0
0.0
0.0
0.0
Rep
rog.
Of
Loan
s fo
r Dis
aste
r Rec
onID
B0.
00.
00.
018
20.0
1620
.020
0.0
0.0
0.0
0.0
0.0
0.0
0.0
0.0
0.0
0.0
0.0
0.0
0.0
Bla
ck B
ush
Pol
der R
oad
LOC
AL
22.2
0.0
22.2
45.0
0.0
45.0
46.1
0.0
46.1
47.3
0.0
47.3
48.5
0.0
48.5
49.7
0.0
49.7
Barti
ca/Is
sano
/Mah
dia
Roa
dLO
CAL
12.1
0.0
12.1
15.0
0.0
15.0
15.4
0.0
15.4
15.8
0.0
15.8
16.2
0.0
16.2
16.6
0.0
16.6
Brid
ge a
nd R
oads
IDB
2097
.619
60.0
137.
689
1.0
535.
035
6.0
1272
.010
60.0
212.
011
01.6
918.
018
3.6
1101
.691
8.0
183.
697
9.2
816.
016
3.2
Brid
ges
( Reg
ions
)LO
CAL
67.2
0.0
67.2
86.5
0.0
86.5
88.7
0.0
88.7
90.9
0.0
90.9
93.2
0.0
93.2
95.5
0.0
95.5
Brid
ges
LOC
AL12
.60.
012
.60.
00.
00.
013
.20.
013
.213
.90.
013
.914
.60.
014
.615
.30.
015
.3D
emer
ara
Har
bour
Brid
geLO
CA
L24
.00.
024
.045
.00.
045
.046
.10.
046
.147
.30.
047
.348
.50.
048
.549
.70.
049
.7D
redg
ing/
Pilo
t Lau
nchi
ngLO
CAL
70.0
0.0
70.0
80.0
0.0
80.0
82.0
0.0
82.0
84.1
0.0
84.1
86.2
0.0
86.2
88.3
0.0
88.3
Hin
terla
nd C
oast
al A
irstri
pLO
CAL
30.4
0.0
30.4
30.0
0.0
30.0
30.8
0.0
30.8
31.5
0.0
31.5
32.3
0.0
32.3
33.1
0.0
33.1
Land
and
Wat
er T
rans
port(
Reg
)LO
CAL
19.0
0.0
19.0
20.4
0.0
20.4
20.9
0.0
20.9
21.4
0.0
21.4
22.0
0.0
22.0
22.5
0.0
22.5
Land
Dev
elop
men
tLO
CAL
4.7
0.0
4.7
12.0
0.0
12.0
12.3
0.0
12.3
12.6
0.0
12.6
12.9
0.0
12.9
13.2
0.0
13.2
Land
Tra
nspo
rtLO
CA
L31
.20.
031
.248
.50.
048
.549
.70.
049
.751
.00.
051
.052
.20.
052
.253
.50.
053
.5
EXPE
ND
ITU
RE
2004
ANN
EX F
- PU
BLI
C S
ECTO
R IN
VEST
MEN
T PR
OG
RAM
, 200
4-20
09
(G
$ m
illio
n)
BU
DG
ET 2
009
BU
DG
ET 2
007
BU
DG
ET 2
008
REV
ISED
BU
DG
ET 2
005
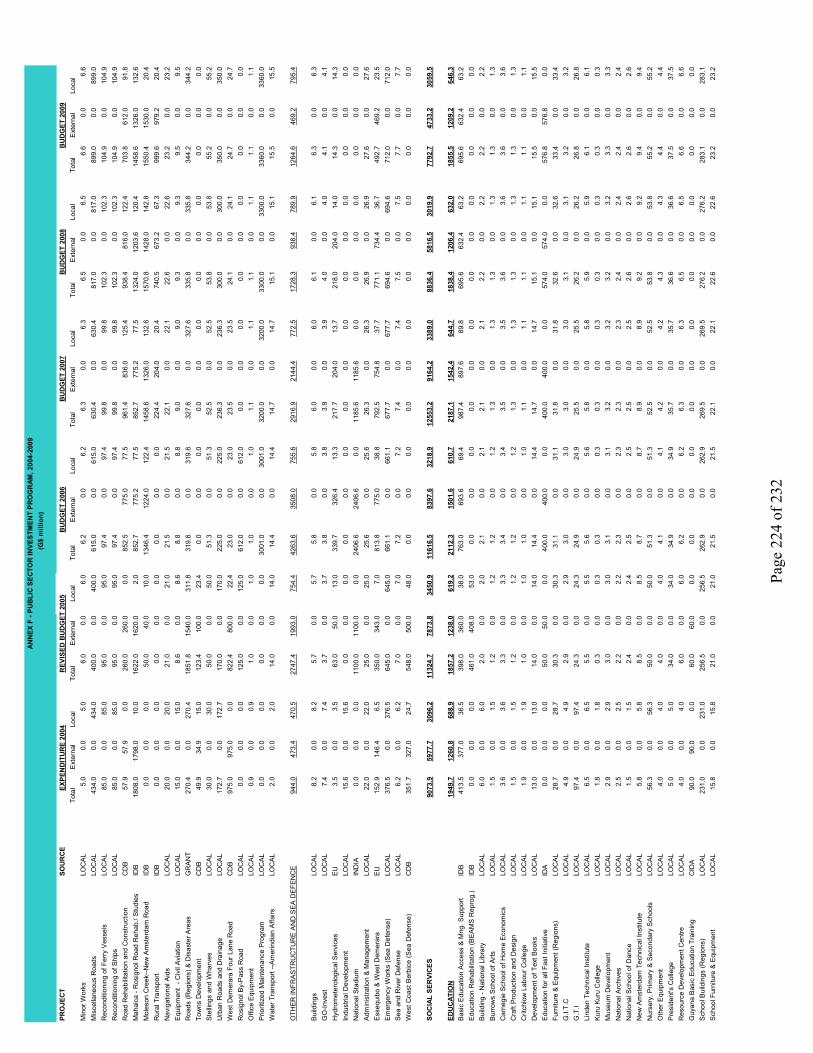
Page
224
of 2
32
PRO
JEC
TSO
UR
CE
BU
DG
ET 2
006
Tota
lE
xter
nal
Loca
lTo
tal
Ext
erna
lLo
cal
Tota
lE
xter
nal
Loca
lTo
tal
Ext
erna
lLo
cal
Tota
lE
xter
nal
Loca
lTo
tal
Ext
erna
lLo
cal
Min
or W
orks
LOC
AL
5.0
0.0
5.0
6.0
0.0
6.0
6.2
0.0
6.2
6.3
0.0
6.3
6.5
0.0
6.5
6.6
0.0
6.6
Mis
cella
neou
s R
oads
LOC
AL
434.
00.
043
4.0
400.
00.
040
0.0
615.
00.
061
5.0
630.
40.
063
0.4
817.
00.
081
7.0
899.
00.
089
9.0
Rec
ondi
tioni
ng o
f Fer
ry V
esse
lsLO
CA
L85
.00.
085
.095
.00.
095
.097
.40.
097
.499
.80.
099
.810
2.3
0.0
102.
310
4.9
0.0
104.
9R
econ
ditio
ning
of S
hips
LOC
AL
85.0
0.0
85.0
95.0
0.0
95.0
97.4
0.0
97.4
99.8
0.0
99.8
102.
30.
010
2.3
104.
90.
010
4.9
Roa
d R
ehab
ilita
tion
and
Con
stru
ctio
nC
DB
57.9
57.9
0.0
260.
026
0.0
0.0
852.
577
5.0
77.5
961.
483
6.0
125.
493
8.4
816.
012
2.4
703.
861
2.0
91.8
Mah
aica
- R
osig
nol R
oad
Reh
ab./
Stu
dies
IDB
1808
.017
98.0
10.0
1622
.016
20.0
2.0
852.
777
5.2
77.5
852.
777
5.2
77.5
1324
.012
03.6
120.
414
58.6
1326
.013
2.6
Mol
eson
Cre
ek--N
ew A
mst
erda
m R
oad
IDB
0.0
0.0
0.0
50.0
40.0
10.0
1346
.412
24.0
122.
414
58.6
1326
.013
2.6
1570
.814
28.0
142.
815
50.4
1530
.020
.4R
ural
Tra
nspo
rtID
B0.
00.
00.
00.
00.
00.
00.
00.
00.
022
4.4
204.
020
.474
0.5
673.
267
.399
9.6
979.
220
.4N
avig
atio
nal A
ids
LOC
AL
20.0
0.0
20.0
21.0
0.0
21.0
21.5
0.0
21.5
22.1
0.0
22.1
22.6
0.0
22.6
23.2
0.0
23.2
Equ
ipm
ent
- Civ
il A
viat
ion
LOC
AL
15.0
0.0
15.0
8.6
0.0
8.6
8.8
0.0
8.8
9.0
0.0
9.0
9.3
0.0
9.3
9.5
0.0
9.5
Roa
ds (R
egio
ns) &
Dis
aste
r Are
asG
RA
NT
270.
40.
027
0.4
1851
.815
40.0
311.
831
9.6
0.0
319.
632
7.6
0.0
327.
633
5.8
0.0
335.
834
4.2
0.0
344.
2To
wns
Dev
elop
men
tC
DB
49.9
34.9
15.0
123.
410
0.0
23.4
0.0
0.0
0.0
0.0
0.0
0.0
0.0
0.0
0.0
0.0
0.0
0.0
Ste
lling
s an
d W
harv
esLO
CA
L30
.00.
030
.050
.00.
050
.051
.30.
051
.352
.50.
052
.553
.80.
053
.855
.20.
055
.2U
rban
Roa
ds a
nd D
rain
age
LOC
AL
172.
70.
017
2.7
170.
00.
017
0.0
225.
00.
022
5.0
236.
30.
023
6.3
300.
00.
030
0.0
350.
00.
035
0.0
Wes
t Dem
erar
a Fo
ur L
ane
Roa
dC
DB
975.
097
5.0
0.0
822.
480
0.0
22.4
23.0
0.0
23.0
23.5
0.0
23.5
24.1
0.0
24.1
24.7
0.0
24.7
Ros
igno
l By-
Pas
s R
oad
LOC
AL
0.0
0.0
0.0
125.
00.
012
5.0
612.
00.
061
2.0
0.0
0.0
0.0
0.0
0.0
0.0
0.0
0.0
0.0
Offi
ce E
quip
men
tLO
CA
L0.
90.
00.
91.
00.
01.
01.
00.
01.
01.
10.
01.
11.
10.
01.
11.
10.
01.
1P
riorit
ized
Mai
nten
ance
Pro
gram
LOC
AL
0.0
0.0
0.0
0.0
0.0
0.0
3001
.00.
030
01.0
3200
.00.
032
00.0
3300
.00.
033
00.0
3360
.00.
033
60.0
Wat
er T
rans
port
--Am
erin
dian
Affa
irsLO
CA
L2.
00.
02.
014
.00.
014
.014
.40.
014
.414
.70.
014
.715
.10.
015
.115
.50.
015
.5
OTH
ER
INFR
AS
TRU
CTU
RE
AN
D S
EA
DE
FEN
CE
944.
047
3.4
470.
527
47.4
1993
.075
4.4
4263
.635
08.0
755.
629
16.9
2144
.477
2.5
1728
.393
8.4
789.
912
64.6
469.
279
5.4
Bui
ldin
gsLO
CA
L8.
20.
08.
25.
70.
05.
75.
80.
05.
86.
00.
06.
06.
10.
06.
16.
30.
06.
3G
O-In
vest
LOC
AL
7.4
0.0
7.4
3.7
0.0
3.7
3.8
0.0
3.8
3.9
0.0
3.9
4.0
0.0
4.0
4.1
0.0
4.1
Hyd
rom
eter
olog
ical
Ser
vice
sE
U3.
50.
03.
563
.050
.013
.033
9.7
326.
413
.321
7.7
204.
013
.721
8.0
204.
014
.014
.30.
014
.3In
dust
rial D
evel
opm
ent
LOC
AL
15.6
0.0
15.6
0.0
0.0
0.0
0.0
0.0
0.0
0.0
0.0
0.0
0.0
0.0
0.0
0.0
0.0
0.0
Nat
iona
l Sta
dium
IND
IA0.
00.
00.
011
00.0
1100
.00.
024
06.6
2406
.60.
011
85.6
1185
.60.
00.
00.
00.
00.
00.
00.
0A
dmin
istra
tion
& M
anag
emen
t LO
CA
L22
.00.
022
.025
.00.
025
.025
.60.
025
.626
.30.
026
.326
.90.
026
.927
.60.
027
.6E
sseq
uibo
& W
est D
emer
ara
EU
152.
914
6.4
6.5
350.
034
3.0
7.0
813.
877
5.0
38.8
792.
575
4.8
37.7
771.
173
4.4
36.7
492.
746
9.2
23.5
Em
erge
ncy
Wor
ks (S
ea D
efen
se)
LOC
AL
376.
50.
037
6.5
645.
00.
064
5.0
661.
10.
066
1.1
677.
70.
067
7.7
694.
60.
069
4.6
712.
00.
071
2.0
Sea
and
Riv
er D
efen
seLO
CA
L6.
20.
06.
27.
00.
07.
07.
20.
07.
27.
40.
07.
47.
50.
07.
57.
70.
07.
7W
est C
oast
Ber
bice
(Sea
Def
ense
)C
DB
351.
732
7.0
24.7
548.
050
0.0
48.0
0.0
0.0
0.0
0.0
0.0
0.0
0.0
0.0
0.0
0.0
0.0
0.0
SOC
IAL
SER
VIC
ES90
73.9
5977
.730
96.2
1132
4.7
7873
.834
50.9
1161
6.5
8397
.632
18.9
1255
3.2
9164
.233
89.0
8836
.458
16.5
3019
.977
92.7
4733
.230
59.5
EDU
CAT
ION
1949
.712
60.8
688.
918
57.2
1238
.061
9.2
2112
.315
01.6
610.
721
87.1
1542
.464
4.7
1838
.412
06.4
632.
018
55.5
1209
.264
6.3
Bas
ic E
duca
tion
Acc
ess
& M
ng. S
uppo
rtID
B41
3.5
377.
036
.539
8.0
360.
038
.076
3.0
693.
669
.498
7.4
897.
689
.869
5.6
632.
463
.269
5.6
632.
463
.2E
duca
tion
Reh
abili
tatio
n (B
EA
MS
Rep
rog.
)ID
B0.
00.
00.
046
1.0
408.
053
.00.
00.
00.
00.
00.
00.
00.
00.
00.
00.
00.
00.
0B
uild
ing
- Nat
iona
l Lib
rary
LOC
AL
6.0
0.0
6.0
2.0
0.0
2.0
2.1
0.0
2.1
2.1
0.0
2.1
2.2
0.0
2.2
2.2
0.0
2.2
Bur
row
s S
choo
l of A
rtsLO
CA
L1.
50.
01.
51.
20.
01.
21.
20.
01.
21.
30.
01.
31.
30.
01.
31.
30.
01.
3C
arne
gie
Sch
ool o
f Hom
e E
cono
mic
sLO
CA
L3.
60.
03.
63.
30.
03.
33.
40.
03.
43.
50.
03.
53.
60.
03.
63.
60.
03.
6C
raft
Pro
duct
ion
and
Des
ign
LOC
AL
1.5
0.0
1.5
1.2
0.0
1.2
1.2
0.0
1.2
1.3
0.0
1.3
1.3
0.0
1.3
1.3
0.0
1.3
Crit
chlo
w L
abou
r Col
lege
LOC
AL
1.9
0.0
1.9
1.0
0.0
1.0
1.0
0.0
1.0
1.1
0.0
1.1
1.1
0.0
1.1
1.1
0.0
1.1
Dev
elop
men
t of T
ext B
ooks
LOC
AL
13.0
0.0
13.0
14.0
0.0
14.0
14.4
0.0
14.4
14.7
0.0
14.7
15.1
0.0
15.1
15.5
0.0
15.5
Edu
catio
n fo
r all
Fast
Initi
ativ
eID
A
0.0
0.0
0.0
50.0
50.0
0.0
400.
040
0.0
0.0
400.
040
0.0
0.0
574.
057
4.0
0.0
576.
857
6.8
0.0
Furn
iture
& E
quip
men
t (R
egio
ns)
LOC
AL
28.7
0.0
28.7
30.3
0.0
30.3
31.1
0.0
31.1
31.8
0.0
31.8
32.6
0.0
32.6
33.4
0.0
33.4
G.I.
T.C
LOC
AL
4.9
0.0
4.9
2.9
0.0
2.9
3.0
0.0
3.0
3.0
0.0
3.0
3.1
0.0
3.1
3.2
0.0
3.2
G.T
.ILO
CA
L97
.40.
097
.424
.30.
024
.324
.90.
024
.925
.50.
025
.526
.20.
026
.226
.80.
026
.8Li
nden
Tec
hnic
al In
stitu
teLO
CA
L6.
50.
06.
55.
50.
05.
55.
60.
05.
65.
80.
05.
85.
90.
05.
96.
10.
06.
1K
uru
Kur
u C
olle
geLO
CA
L1.
80.
01.
80.
30.
00.
30.
30.
00.
30.
30.
00.
30.
30.
00.
30.
30.
00.
3M
useu
m D
evel
opm
ent
LOC
AL
2.9
0.0
2.9
3.0
0.0
3.0
3.1
0.0
3.1
3.2
0.0
3.2
3.2
0.0
3.2
3.3
0.0
3.3
Nat
iona
l Arc
hive
sLO
CA
L2.
50.
02.
52.
20.
02.
22.
30.
02.
32.
30.
02.
32.
40.
02.
42.
40.
02.
4N
atio
nal S
choo
l of D
ance
LOC
AL
1.5
0.0
1.5
2.4
0.0
2.4
2.5
0.0
2.5
2.5
0.0
2.5
2.6
0.0
2.6
2.6
0.0
2.6
New
Am
ster
dam
Tec
hnic
al In
stitu
teLO
CA
L5.
80.
05.
88.
50.
08.
58.
70.
08.
78.
90.
08.
99.
20.
09.
29.
40.
09.
4N
urse
ry, P
rimar
y &
Sec
onda
ry S
choo
lsLO
CA
L56
.30.
056
.350
.00.
050
.051
.30.
051
.352
.50.
052
.553
.80.
053
.855
.20.
055
.2O
ther
Equ
ipm
ent
LOC
AL
4.0
0.0
4.0
4.0
0.0
4.0
4.1
0.0
4.1
4.2
0.0
4.2
4.3
0.0
4.3
4.4
0.0
4.4
Pre
side
nt's
Col
lege
LOC
AL
5.0
0.0
5.0
34.0
0.0
34.0
34.9
0.0
34.9
35.7
0.0
35.7
36.6
0.0
36.6
37.5
0.0
37.5
Res
ourc
e D
evel
opm
ent C
entre
LOC
AL
4.0
0.0
4.0
6.0
0.0
6.0
6.2
0.0
6.2
6.3
0.0
6.3
6.5
0.0
6.5
6.6
0.0
6.6
Guy
ana
Bas
ic E
duca
tion
Trai
ning
CID
A90
.090
.00.
060
.060
.00.
00.
00.
00.
00.
00.
00.
00.
00.
00.
00.
00.
00.
0S
choo
l Bui
ldin
gs (R
egio
ns)
LOC
AL
231.
00.
023
1.0
256.
50.
025
6.5
262.
90.
026
2.9
269.
50.
026
9.5
276.
20.
027
6.2
283.
10.
028
3.1
Sch
ool F
urni
ture
& E
quip
men
tLO
CA
L15
.80.
015
.821
.00.
021
.021
.50.
021
.522
.10.
022
.122
.60.
022
.623
.20.
023
.2
ANN
EX F
- PU
BLI
C S
ECTO
R IN
VEST
MEN
T PR
OG
RAM
, 200
4-20
09
(G
$ m
illio
n)
EXPE
ND
ITU
RE
2004
REV
ISED
BU
DG
ET 2
005
BU
DG
ET 2
007
BU
DG
ET 2
008
BU
DG
ET 2
009
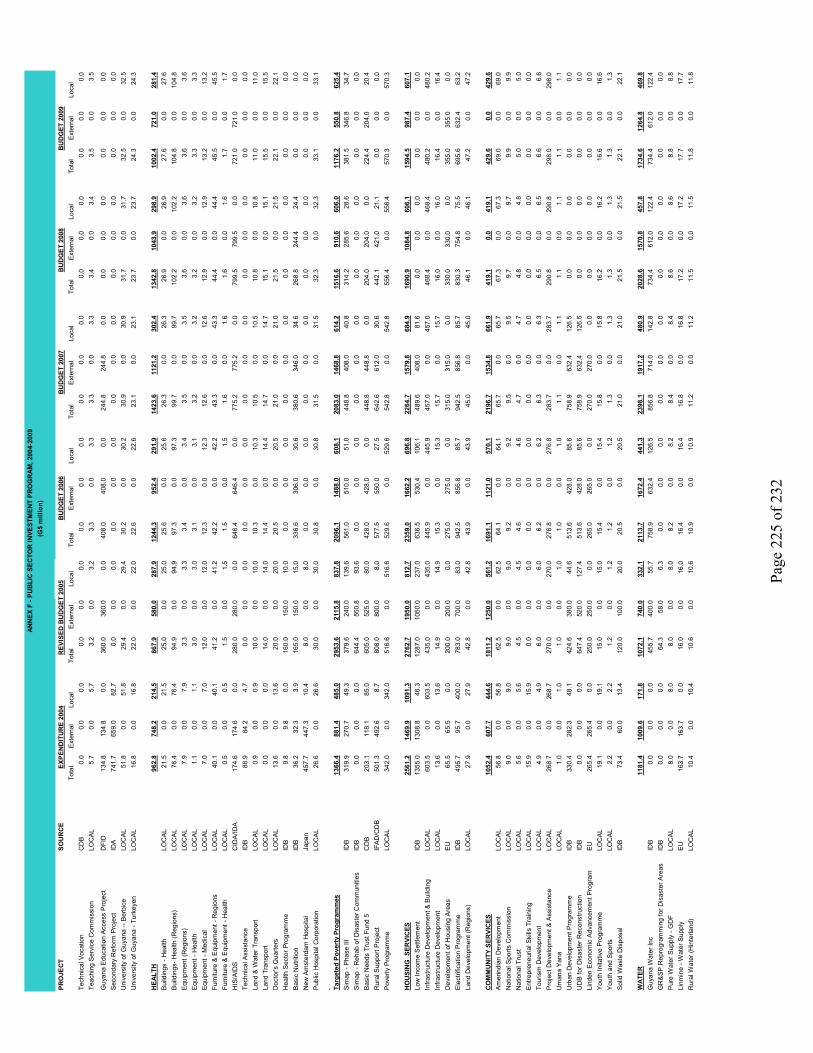
Page
225
of 2
32
PRO
JEC
TSO
UR
CE
BU
DG
ET 2
006
Tota
lE
xter
nal
Loca
lTo
tal
Ext
erna
lLo
cal
Tota
lE
xter
nal
Loca
lTo
tal
Ext
erna
lLo
cal
Tota
lE
xter
nal
Loca
lTo
tal
Ext
erna
lLo
cal
Tech
nica
l Voc
atio
nC
DB
0.0
0.0
0.0
0.0
0.0
0.0
0.0
0.0
0.0
0.0
0.0
0.0
0.0
0.0
0.0
0.0
0.0
0.0
Teac
hing
Ser
vice
Com
mis
sion
LOC
AL
5.7
0.0
5.7
3.2
0.0
3.2
3.3
0.0
3.3
3.3
0.0
3.3
3.4
0.0
3.4
3.5
0.0
3.5
Guy
ana
Edu
catio
n A
cces
s P
roje
ctD
FID
134.
813
4.8
0.0
360.
036
0.0
0.0
408.
040
8.0
0.0
244.
824
4.8
0.0
0.0
0.0
0.0
0.0
0.0
0.0
Sec
onda
ry R
efor
m P
roje
ctID
A
741.
765
9.0
82.7
0.0
0.0
0.0
0.0
0.0
0.0
0.0
0.0
0.0
0.0
0.0
0.0
0.0
0.0
0.0
Uni
vers
ity o
f Guy
ana
-- B
erbi
ceLO
CA
L51
.80.
051
.829
.40.
029
.430
.20.
030
.230
.90.
030
.931
.70.
031
.732
.50.
032
.5U
nive
rsity
of G
uyan
a - T
urke
yen
LOC
AL
16.8
0.0
16.8
22.0
0.0
22.0
22.6
0.0
22.6
23.1
0.0
23.1
23.7
0.0
23.7
24.3
0.0
24.3
HEA
LTH
962.
874
8.2
214.
586
7.9
580.
028
7.9
1244
.395
2.4
291.
914
23.6
1121
.230
2.4
1342
.810
43.9
298.
910
02.4
721.
028
1.4
Bui
ldin
gs -
Hea
lthLO
CA
L21
.50.
021
.525
.00.
025
.025
.60.
025
.626
.30.
026
.326
.90.
026
.927
.60.
027
.6B
uild
ings
- Hea
lth (R
egio
ns)
LOC
AL
76.4
0.0
76.4
94.9
0.0
94.9
97.3
0.0
97.3
99.7
0.0
99.7
102.
20.
010
2.2
104.
80.
010
4.8
Equ
ipm
ent (
Reg
ions
)LO
CA
L7.
90.
07.
93.
30.
03.
33.
40.
03.
43.
50.
03.
53.
60.
03.
63.
60.
03.
6E
quip
men
t - H
ealth
LOC
AL
1.1
0.0
1.1
3.0
0.0
3.0
3.1
0.0
3.1
3.2
0.0
3.2
3.2
0.0
3.2
3.3
0.0
3.3
Equ
ipm
ent -
Med
ical
LOC
AL
7.0
0.0
7.0
12.0
0.0
12.0
12.3
0.0
12.3
12.6
0.0
12.6
12.9
0.0
12.9
13.2
0.0
13.2
Furn
iture
& E
quip
men
t - R
egio
nsLO
CA
L40
.10.
040
.141
.20.
041
.242
.20.
042
.243
.30.
043
.344
.40.
044
.445
.50.
045
.5Fu
rnitu
re &
Equ
ipm
ent -
Hea
lthLO
CA
L0.
50.
00.
51.
50.
01.
51.
50.
01.
51.
60.
01.
61.
60.
01.
61.
70.
01.
7H
IS/A
IDS
CID
A/ID
A17
4.6
174.
60.
028
0.0
280.
00.
064
6.4
646.
40.
077
5.2
775.
20.
079
9.5
799.
50.
072
1.0
721.
00.
0Te
chni
cal A
ssis
tanc
eID
B88
.984
.24.
70.
00.
00.
00.
00.
00.
00.
00.
00.
00.
00.
00.
00.
00.
00.
0La
nd &
Wat
er T
rans
port
LOC
AL
0.9
0.0
0.9
10.0
0.0
10.0
10.3
0.0
10.3
10.5
0.0
10.5
10.8
0.0
10.8
11.0
0.0
11.0
Land
Tra
nspo
rtLO
CA
L0.
00.
00.
014
.00.
014
.014
.40.
014
.414
.70.
014
.715
.10.
015
.115
.50.
015
.5D
octo
r's Q
uarte
rsLO
CA
L13
.60.
013
.620
.00.
020
.020
.50.
020
.521
.00.
021
.021
.50.
021
.522
.10.
022
.1H
ealth
Sec
tor P
rogr
amm
eID
B9.
89.
80.
016
0.0
150.
010
.00.
00.
00.
00.
00.
00.
00.
00.
00.
00.
00.
00.
0B
asic
Nut
ritio
nID
B36
.232
.33.
916
5.0
150.
015
.033
6.6
306.
030
.638
0.6
346.
034
.626
8.8
244.
424
.40.
00.
00.
0N
ew A
mst
erda
m H
ospi
tal
Japa
n45
7.7
447.
310
.48.
00.
08.
00.
00.
00.
00.
00.
00.
00.
00.
00.
00.
00.
00.
0P
ublic
Hos
pita
l Cor
pora
tion
LOC
AL
26.6
0.0
26.6
30.0
0.0
30.0
30.8
0.0
30.8
31.5
0.0
31.5
32.3
0.0
32.3
33.1
0.0
33.1
Targ
eted
Pov
erty
Pro
gram
mes
1366
.488
1.4
485.
029
53.6
2115
.883
7.8
2096
.114
88.0
608.
120
83.0
1468
.861
4.2
1516
.691
0.6
606.
011
76.2
550.
862
5.4
Sim
ap -
Pha
se II
IID
B31
9.9
270.
749
.337
9.6
240.
013
9.6
561.
051
0.0
51.0
448.
840
8.0
40.8
314.
228
5.6
28.6
381.
534
6.8
34.7
Sim
ap -
Reh
ab o
f Dis
aste
r Com
mun
ities
IDB
0.0
0.0
0.0
644.
455
0.8
93.6
0.0
0.0
0.0
0.0
0.0
0.0
0.0
0.0
0.0
0.0
0.0
0.0
Bas
ic N
eeds
Tru
st F
und
5C
DB
203.
111
8.1
85.0
605.
052
5.0
80.0
428.
042
8.0
0.0
448.
844
8.8
0.0
204.
020
4.0
0.0
224.
420
4.0
20.4
Rur
al S
uppo
rt P
roje
ctIF
AD
/CD
B50
1.3
492.
68.
780
8.0
800.
08.
057
7.5
550.
027
.564
2.6
612.
030
.644
2.1
421.
021
.10.
00.
00.
0P
over
ty P
rogr
amm
eLO
CA
L34
2.0
0.0
342.
051
6.6
0.0
516.
652
9.6
0.0
529.
654
2.8
0.0
542.
855
6.4
0.0
556.
457
0.3
0.0
570.
3
HO
USI
NG
SER
VIC
ES25
61.2
1469
.910
91.3
2762
.719
50.0
812.
723
59.0
1662
.269
6.8
2264
.715
79.8
684.
916
90.9
1084
.860
6.1
1594
.598
7.4
607.
1Lo
w In
com
e S
ettle
men
tID
B13
55.0
1308
.846
.312
87.0
1050
.023
7.0
636.
553
0.4
106.
148
9.6
408.
081
.60.
00.
00.
00.
00.
00.
0In
frast
ruct
ure
Dev
elop
men
t & B
uild
ing
LOC
AL
603.
50.
060
3.5
435.
00.
043
5.0
445.
90.
044
5.9
457.
00.
045
7.0
468.
40.
046
8.4
480.
20.
048
0.2
Infra
stru
ctur
e D
evel
opm
ent
LOC
AL
13.6
0.0
13.6
14.9
0.0
14.9
15.3
0.0
15.3
15.7
0.0
15.7
16.0
0.0
16.0
16.4
0.0
16.4
Dev
elop
men
t of H
ousi
ng A
reas
EU
65.5
65.5
0.0
200.
020
0.0
0.0
275.
027
5.0
0.0
315.
031
5.0
0.0
330.
033
0.0
0.0
355.
035
5.0
0.0
Ele
ctrif
icat
ion
Pro
gram
me
IDB
495.
795
.740
0.0
783.
070
0.0
83.0
942.
585
6.8
85.7
942.
585
6.8
85.7
830.
375
4.8
75.5
695.
663
2.4
63.2
Land
Dev
elop
men
t (R
egio
ns)
LOC
AL
27.9
0.0
27.9
42.8
0.0
42.8
43.9
0.0
43.9
45.0
0.0
45.0
46.1
0.0
46.1
47.2
0.0
47.2
CO
MM
UN
ITY
SER
VIC
ES10
52.4
607.
744
4.6
1811
.212
50.0
561.
216
91.1
1121
.057
0.1
2196
.715
34.8
661.
941
9.1
0.0
419.
142
9.6
0.0
429.
6A
mer
indi
an D
evel
opm
ent
LOC
AL
56.8
0.0
56.8
62.5
0.0
62.5
64.1
0.0
64.1
65.7
0.0
65.7
67.3
0.0
67.3
69.0
0.0
69.0
Nat
iona
l Spo
rts C
omm
issi
onLO
CA
L9.
00.
09.
09.
00.
09.
09.
20.
09.
29.
50.
09.
59.
70.
09.
79.
90.
09.
9N
atio
nal T
rust
LOC
AL
5.6
0.0
5.6
4.5
0.0
4.5
4.6
0.0
4.6
4.7
0.0
4.7
4.8
0.0
4.8
5.0
0.0
5.0
Ent
repr
eneu
rial S
kills
Tra
inin
gLO
CA
L15
.90.
015
.90.
00.
00.
00.
00.
00.
00.
00.
00.
00.
00.
00.
00.
00.
00.
0To
uris
m D
evel
opm
ent
LOC
AL
4.9
0.0
4.9
6.0
0.0
6.0
6.2
0.0
6.2
6.3
0.0
6.3
6.5
0.0
6.5
6.6
0.0
6.6
Pro
ject
Dev
elop
men
t & A
ssis
tanc
eLO
CA
L26
8.7
0.0
268.
727
0.0
0.0
270.
027
6.8
0.0
276.
828
3.7
0.0
283.
729
0.8
0.0
290.
829
8.0
0.0
298.
0U
man
a Y
ana
LOC
AL
1.0
0.0
1.0
1.0
0.0
1.0
1.0
0.0
1.0
1.1
0.0
1.1
1.1
0.0
1.1
1.1
0.0
1.1
Urb
an D
evel
opm
ent P
rogr
amm
eID
B33
0.4
282.
348
.142
4.6
380.
044
.651
3.6
428.
085
.675
8.9
632.
412
6.5
0.0
0.0
0.0
0.0
0.0
0.0
UD
B fo
r Dis
aste
r Rec
onst
ruct
ion
IDB
0.0
0.0
0.0
647.
452
0.0
127.
451
3.6
428.
085
.675
8.9
632.
412
6.5
0.0
0.0
0.0
0.0
0.0
0.0
Lind
en E
cono
mic
Adv
ance
men
t Pro
gram
EU
265.
426
5.4
0.0
250.
025
0.0
0.0
265.
026
5.0
0.0
270.
027
0.0
0.0
0.0
0.0
0.0
0.0
0.0
0.0
You
th In
itativ
e P
rogr
amm
eLO
CA
L19
.10.
019
.115
.00.
015
.015
.40.
015
.415
.80.
015
.816
.20.
016
.216
.60.
016
.6Y
outh
and
Spo
rtsLO
CA
L2.
20.
02.
21.
20.
01.
21.
20.
01.
21.
30.
01.
31.
30.
01.
31.
30.
01.
3S
olid
Was
te D
ispo
sal
IDB
73.4
60.0
13.4
120.
010
0.0
20.0
20.5
0.0
20.5
21.0
0.0
21.0
21.5
0.0
21.5
22.1
0.0
22.1
WAT
ER11
81.4
1009
.617
1.8
1072
.174
0.0
332.
121
13.7
1672
.444
1.3
2398
.119
17.2
480.
920
28.6
1570
.845
7.8
1734
.612
64.8
469.
8G
uyan
a W
ater
Inc
IDB
0.0
0.0
0.0
455.
740
0.0
55.7
758.
963
2.4
126.
585
6.8
714.
014
2.8
734.
461
2.0
122.
473
4.4
612.
012
2.4
GR
&S
P R
epro
gram
min
g fo
r Dis
aste
r Are
asID
B0.
00.
00.
064
.358
.06.
30.
00.
00.
00.
00.
00.
00.
00.
00.
00.
00.
00.
0P
ure
Wat
er S
uppl
y - G
DF
LOC
AL
8.0
0.0
8.0
8.0
0.0
8.0
8.2
0.0
8.2
8.4
0.0
8.4
8.6
0.0
8.6
8.8
0.0
8.8
Linm
ine
- Wat
er S
uppl
yE
U16
3.7
163.
70.
016
.00.
016
.016
.40.
016
.416
.80.
016
.817
.20.
017
.217
.70.
017
.7R
ural
Wat
er (H
inte
rland
)LO
CA
L10
.40.
010
.410
.60.
010
.610
.90.
010
.911
.20.
011
.211
.50.
011
.511
.80.
011
.8
ANN
EX F
- PU
BLI
C S
ECTO
R IN
VEST
MEN
T PR
OG
RAM
, 200
4-20
09
(G
$ m
illio
n)
EXPE
ND
ITU
RE
2004
REV
ISED
BU
DG
ET 2
005
BU
DG
ET 2
007
BU
DG
ET 2
008
BU
DG
ET 2
009

Page
226
of 2
32
PRO
JEC
TSO
UR
CE
BU
DG
ET 2
006
Tota
lEx
tern
alLo
cal
Tota
lE
xter
nal
Loca
lTo
tal
Ext
erna
lLo
cal
Tota
lEx
tern
alLo
cal
Tota
lE
xter
nal
Loca
lTo
tal
Exte
rnal
Loca
lW
ater
Sup
ply
Tech
nica
l Ass
ista
nce/
Reh
abD
FID
874.
084
5.8
28.2
282.
028
2.0
0.0
336.
630
6.0
30.6
516.
146
9.2
46.9
426.
438
7.6
38.8
434.
138
7.6
46.5
Wat
er S
uppl
y R
ehab
ilita
tion
IDA
0.0
0.0
0.0
0.0
0.0
0.0
741.
373
4.0
7.3
741.
373
4.0
7.3
576.
957
1.2
5.7
267.
926
5.2
2.7
Wat
er S
uppl
y - R
egio
nsLO
CA
L4.
80.
04.
85.
50.
05.
55.
60.
05.
65.
80.
05.
85.
90.
05.
96.
10.
06.
1C
oast
al W
ater
Sup
ply
LOC
AL
120.
50.
012
0.5
230.
00.
023
0.0
235.
80.
023
5.8
241.
60.
024
1.6
247.
70.
024
7.7
253.
90.
025
3.9
GEN
ERAL
PU
BLI
C S
ERVI
CES
4022
.619
72.6
2050
.027
16.6
701.
920
14.7
3126
.517
08.8
1417
.733
81.5
1947
.014
34.5
3617
.821
44.2
1473
.637
70.8
2260
.215
10.6
ADM
INIS
TRAT
ION
& P
LAN
NIN
G10
70.3
212.
685
7.7
1520
.170
1.9
818.
325
38.9
1708
.883
0.1
2779
.219
47.0
832.
230
00.5
2144
.285
6.3
3138
.022
60.2
877.
8B
uild
ing
-- C
ultu
ral C
ente
rLO
CA
L3.
50.
03.
510
.00.
010
.010
.30.
010
.310
.50.
010
.510
.80.
010
.811
.00.
011
.0B
uild
ings
LOC
AL
14.6
0.0
14.6
12.9
0.0
12.9
13.2
0.0
13.2
13.6
0.0
13.6
13.9
0.0
13.9
14.2
0.0
14.2
Bui
ldin
gs -
Adm
inis
tratio
n (R
egio
ns)
LOC
AL
16.8
0.0
16.8
5.9
0.0
5.9
6.0
0.0
6.0
6.2
0.0
6.2
6.3
0.0
6.3
6.5
0.0
6.5
Bur
eau
of S
tand
ards
LOC
AL
5.0
0.0
5.0
12.0
0.0
12.0
12.3
0.0
12.3
12.6
0.0
12.6
12.9
0.0
12.9
13.2
0.0
13.2
Dire
ctor
of P
ublic
Pro
secu
tion
LOC
AL
1.9
0.0
1.9
2.5
0.0
2.5
2.6
0.0
2.6
2.6
0.0
2.6
2.7
0.0
2.7
2.8
0.0
2.8
Equ
ipm
ent
LOC
AL
4.4
0.0
4.4
3.5
0.0
3.5
3.6
0.0
3.6
3.7
0.0
3.7
3.8
0.0
3.8
3.9
0.0
3.9
Furn
iture
& E
quip
men
tLO
CA
L40
.90.
040
.935
.60.
035
.636
.50.
036
.537
.40.
037
.438
.30.
038
.339
.30.
039
.3Fu
rnitu
re &
Equ
ipm
ent (
Reg
ions
)LO
CA
L6.
40.
06.
45.
90.
05.
96.
00.
06.
06.
20.
06.
26.
40.
06.
46.
50.
06.
5Fu
rnitu
re a
nd E
quip
men
t - (E
duca
tion
Re)
LOC
AL
0.5
0.0
0.5
0.5
0.0
0.5
0.5
0.0
0.5
0.5
0.0
0.5
0.5
0.0
0.5
0.6
0.0
0.6
Furn
iture
-- S
taff
Qua
rters
LOC
AL
0.4
0.0
0.4
0.4
0.0
0.4
0.4
0.0
0.4
0.4
0.0
0.4
0.4
0.0
0.4
0.4
0.0
0.4
Gov
ernm
ent B
uild
ings
LOC
AL
450.
60.
045
0.6
215.
30.
021
5.3
220.
60.
022
0.6
226.
20.
022
6.2
231.
80.
023
1.8
237.
60.
023
7.6
Gov
ernm
ent I
nfor
mat
ion
Age
ncy
LOC
AL
1.5
0.0
1.5
5.0
0.0
5.0
5.1
0.0
5.1
5.3
0.0
5.3
5.4
0.0
5.4
5.5
0.0
5.5
Guy
ana
Ene
rgy
Agen
cyLO
CA
L0.
50.
00.
52.
90.
02.
93.
00.
03.
03.
00.
03.
03.
10.
03.
13.
20.
03.
2G
uyan
a R
even
ue A
utho
rity
LOC
AL
53.0
0.0
53.0
75.0
0.0
75.0
76.9
0.0
76.9
78.8
0.0
78.8
80.8
0.0
80.8
82.8
0.0
82.8
Land
and
Wat
er T
rans
port
LOC
AL
9.5
0.0
9.5
13.7
0.0
13.7
14.0
0.0
14.0
14.4
0.0
14.4
14.8
0.0
14.8
15.1
0.0
15.1
Land
Tra
nspo
rt (R
egio
ns)
LOC
AL
8.5
0.0
8.5
9.2
0.0
9.2
9.5
0.0
9.5
9.7
0.0
9.7
10.0
0.0
10.0
10.2
0.0
10.2
Min
or W
orks
LOC
AL
49.9
0.0
49.9
50.0
0.0
50.0
51.3
0.0
51.3
52.5
0.0
52.5
53.8
0.0
53.8
55.2
0.0
55.2
Offi
ce &
Res
iden
ce o
f the
Pre
side
ntLO
CA
L22
.60.
022
.624
.00.
024
.024
.60.
024
.625
.20.
025
.225
.80.
025
.826
.50.
026
.5O
ffice
Equ
ipm
ent
LOC
AL
3.8
0.0
3.8
4.1
0.0
4.1
4.2
0.0
4.2
4.3
0.0
4.3
4.4
0.0
4.4
4.5
0.0
4.5
Offi
ce E
quip
men
t and
Fur
nitu
reLO
CA
L1.
10.
01.
14.
10.
04.
14.
20.
04.
24.
30.
04.
34.
40.
04.
44.
50.
04.
5O
ffice
Fur
nitu
re a
nd E
quip
men
t LO
CA
L4.
60.
04.
60.
00.
00.
00.
00.
00.
00.
00.
00.
00.
00.
00.
00.
0O
ffice
Fur
nitu
re a
nd E
quip
men
t (R
egio
ns)
LOC
AL
5.9
0.0
5.9
6.4
0.0
6.4
6.6
0.0
6.6
6.7
0.0
6.7
6.9
0.0
6.9
7.1
0.0
7.1
Oth
er E
quip
men
t (R
egio
ns)
LOC
AL
5.0
0.0
5.0
20.0
0.0
20.0
20.5
0.0
20.5
21.0
0.0
21.0
21.5
0.0
21.5
22.1
0.0
22.1
Par
liam
ent O
ffice
LOC
AL
23.7
0.0
23.7
45.0
0.0
45.0
46.1
0.0
46.1
47.3
0.0
47.3
48.5
0.0
48.5
49.7
0.0
49.7
Pub
lic S
ervi
ce A
ppel
ate
Trib
unal
LOC
AL
1.9
0.0
1.9
2.0
0.0
2.0
2.1
0.0
2.1
2.1
0.0
2.1
2.2
0.0
2.2
2.2
0.0
2.2
Pub
lic S
ervi
ce C
omm
issi
onLO
CA
L1.
20.
01.
21.
00.
01.
01.
00.
01.
01.
10.
01.
11.
10.
01.
11.
10.
01.
1E
thni
c R
elat
ions
Com
mis
sion
LOC
AL
1.8
0.0
1.8
3.4
0.0
3.4
3.5
0.0
3.5
3.6
0.0
3.6
3.7
0.0
3.7
3.8
0.0
3.8
Guy
ana
Ele
ctio
ns C
omm
issi
onLO
CA
L20
.10.
020
.150
.00.
050
.051
.30.
051
.352
.50.
052
.553
.80.
053
.855
.20.
055
.2N
atio
nal P
arks
Com
mis
sion
LOC
AL
3.6
0.0
3.6
4.0
0.0
4.0
4.1
0.0
4.1
4.2
0.0
4.2
4.3
0.0
4.3
4.4
0.0
4.4
Sup
rem
e/M
agis
trate
Cou
rtLO
CA
L11
.60.
011
.640
.00.
040
.041
.00.
041
.042
.00.
042
.043
.10.
043
.144
.20.
044
.2S
teng
then
ing
the
Reg
istry
IDB
74.1
55.9
18.2
18.9
8.9
10.0
10.3
0.0
10.3
10.5
0.0
10.5
10.8
0.0
10.8
11.0
0.0
11.0
Nat
iona
l Com
mun
icat
ion
Net
wor
kLO
CA
L19
.40.
019
.425
.00.
025
.025
.60.
025
.626
.30.
026
.326
.90.
026
.927
.60.
027
.6N
GO
Sup
port
Prog
ram
me
PL4
80U
SA
ID3.
70.
03.
74.
50.
04.
54.
60.
04.
64.
70.
04.
74.
80.
04.
85.
00.
05.
0P
ublic
Sec
tor T
echn
ical
Ass
ist.
Cre
dit
IDA
112.
011
2.0
0.0
161.
014
0.0
21.0
0.0
0.0
0.0
0.0
0.0
0.0
0.0
0.0
0.0
0.0
0.0
0.0
Inst
itutio
nal S
treng
then
ing
-- Le
gal A
ffairs
IDB
6.7
3.9
2.8
11.5
8.0
3.5
0.0
0.0
0.0
0.0
0.0
0.0
0.0
0.0
0.0
0.0
0.0
0.0
Inst
itutio
nal S
treng
then
ing
-- A
udito
r Gen
eral
IDB
0.0
0.0
0.0
40.0
40.0
0.0
0.0
0.0
0.0
0.0
0.0
0.0
0.0
0.0
0.0
0.0
0.0
0.0
Inst
itutio
nal S
treng
then
ing
-- Fi
nanc
eID
B4.
50.
04.
550
.050
.00.
00.
00.
00.
00.
00.
00.
00.
00.
00.
00.
00.
00.
0P
ublic
Sec
tor F
inan
cial
Man
agem
ent
IDB
18.4
15.5
2.9
5.0
0.0
5.0
673.
261
2.0
61.2
673.
261
2.0
61.2
493.
744
8.8
44.9
336.
630
6.0
30.6
Soc
ial S
tatis
tics
Pro
ject
IDB
17.7
0.0
17.7
185.
014
0.0
45.0
289.
824
4.8
45.0
149.
914
2.8
7.1
128.
512
2.4
6.1
0.0
0.0
0.0
Pub
lic S
ecto
r Mod
erni
satio
n P
rogr
amID
B0.
00.
00.
015
.015
.00.
010
4.6
102.
02.
616
7.3
163.
24.
127
1.6
265.
06.
637
6.4
367.
29.
2Fi
scal
and
Fin
anci
al M
anag
emen
t Pro
gram
me
IDB
39.0
25.3
13.7
340.
030
0.0
40.0
750.
075
0.0
0.0
825.
082
5.0
0.0
900.
090
0.0
0.0
975.
097
5.0
0.0
Com
petit
iven
ess
Prog
ram
IDB
0.0
0.0
0.0
0.0
0.0
0.0
0.0
0.0
0.0
224.
420
4.0
20.4
448.
840
8.0
40.8
673.
261
2.0
61.2
CO
NTR
IBU
TIO
N T
O IN
TER
NAT
ION
AL A
GEN
CIE
S19
02.6
1760
.014
2.6
173.
20.
017
3.2
0.0
0.0
0.0
0.0
0.0
0.0
0.0
0.0
0.0
0.0
0.0
0.0
Car
ibbe
an D
evel
opm
ent B
ank
LOC
AL
112.
70.
011
2.7
126.
00.
012
6.0
0.0
0.0
0.0
0.0
0.0
0.0
0.0
0.0
0.0
0.0
0.0
0.0
Inte
r-Am
eric
an In
vest
men
t Cor
pora
tion
LOC
AL
21.0
0.0
21.0
22.0
0.0
22.0
0.0
0.0
0.0
0.0
0.0
0.0
0.0
0.0
0.0
0.0
0.0
0.0
Car
ibbe
an C
ourt
of ju
stic
eC
DB
1760
.017
60.0
0.0
0.0
0.0
0.0
0.0
0.0
0.0
0.0
0.0
0.0
0.0
0.0
0.0
0.0
0.0
0.0
Inte
r-Am
eric
an D
evel
opm
ent B
ank
LOC
AL
8.9
0.0
8.9
25.2
0.0
25.2
0.0
0.0
0.0
0.0
0.0
0.0
0.0
0.0
0.0
0.0
0.0
0.0
OTH
ER C
APIT
AL T
RAN
SFER
S44
5.0
0.0
445.
045
0.0
0.0
450.
00.
00.
00.
00.
00.
00.
00.
00.
00.
00.
00.
00.
0S
tude
nt L
oan
Fund
LOC
AL
340.
00.
034
0.0
450.
00.
045
0.0
0.0
0.0
0.0
0.0
0.0
0.0
0.0
0.0
0.0
0.0
0.0
0.0
Loan
to P
ublic
Cor
pora
tion
LOC
AL
105.
00.
010
5.0
0.0
0.0
0.0
0.0
0.0
0.0
0.0
0.0
0.0
0.0
0.0
0.0
0.0
0.0
0.0
ANN
EX F
- PU
BLI
C S
ECTO
R IN
VEST
MEN
T PR
OG
RAM
, 200
4-20
09
(G
$ m
illio
n)
EXPE
ND
ITU
RE
2004
REV
ISED
BU
DG
ET 2
005
BU
DG
ET 2
007
BU
DG
ET 2
008
BU
DG
ET 2
009

Page
227
of 2
32
PRO
JEC
TSO
UR
CE
BU
DG
ET 2
006
Tota
lE
xter
nal
Loca
lTo
tal
Ext
erna
lLo
cal
Tota
lE
xter
nal
Loca
lTo
tal
Ext
erna
lLo
cal
Tota
lE
xter
nal
Loca
lTo
tal
Ext
erna
lLo
cal
PUB
LIC
SAF
ETY
604.
70.
060
4.7
573.
30.
057
3.3
587.
60.
058
7.6
602.
30.
060
2.3
617.
30.
061
7.3
632.
80.
063
2.8
Agr
i. E
quip
men
t - P
rison
sLO
CA
L2.
10.
02.
12.
00.
02.
02.
10.
02.
12.
10.
02.
12.
20.
02.
22.
20.
02.
2B
uild
ings
- H
ome
Affa
irsLO
CA
L2.
50.
02.
52.
60.
02.
62.
70.
02.
72.
70.
02.
72.
80.
02.
82.
90.
02.
9
Bui
ldin
gs -
Pris
ons
LOC
AL
24.3
0.0
24.3
25.0
0.0
25.0
25.6
0.0
25.6
26.3
0.0
26.3
26.9
0.0
26.9
27.6
0.0
27.6
Com
m. E
quip
men
t - F
ireLO
CA
L3.
50.
03.
52.
80.
02.
82.
90.
02.
92.
90.
02.
93.
00.
03.
03.
10.
03.
1E
quip
men
t & F
urni
ture
- P
olic
eLO
CA
L17
.50.
017
.516
.00.
016
.016
.40.
016
.416
.80.
016
.817
.20.
017
.217
.70.
017
.7E
quip
men
t & F
urni
ture
- Fi
re
LOC
AL
1.6
0.0
1.6
1.0
0.0
1.0
1.0
0.0
1.0
1.1
0.0
1.1
1.1
0.0
1.1
1.1
0.0
1.1
Equ
ipm
ent (
Hom
e A
ffairs
)LO
CA
L0.
60.
00.
61.
00.
01.
01.
00.
01.
01.
10.
01.
11.
10.
01.
11.
10.
01.
1E
quip
men
t - P
olic
eLO
CA
L10
9.6
0.0
109.
610
5.0
0.0
105.
010
7.6
0.0
107.
611
0.3
0.0
110.
311
3.1
0.0
113.
111
5.9
0.0
115.
9E
quip
men
t - G
DF
LOC
AL
50.0
0.0
50.0
51.0
0.0
51.0
52.3
0.0
52.3
53.6
0.0
53.6
54.9
0.0
54.9
56.3
0.0
56.3
Guy
ana
Def
ence
For
ceLO
CA
L49
.90.
049
.950
.00.
050
.051
.30.
051
.352
.50.
052
.553
.80.
053
.855
.20.
055
.2In
frast
ruct
ure
-- G
DF
LOC
AL
12.4
0.0
12.4
15.0
0.0
15.0
15.4
0.0
15.4
15.8
0.0
15.8
16.2
0.0
16.2
16.6
0.0
16.6
Fire
Am
bula
nces
& S
tatio
nsLO
CA
L15
.50.
015
.525
.00.
025
.025
.60.
025
.626
.30.
026
.326
.90.
026
.927
.60.
027
.6Fu
rnitu
re &
Equ
ipm
ent -
Adm
in (R
egio
ns)
LOC
AL
2.6
0.0
2.6
2.4
0.0
2.4
2.4
0.0
2.4
2.5
0.0
2.5
2.5
0.0
2.5
2.6
0.0
2.6
Gen
eral
Reg
istra
r Offi
ceLO
CA
L2.
80.
02.
83.
50.
03.
53.
60.
03.
63.
70.
03.
73.
80.
03.
83.
90.
03.
9La
nd &
Wat
er T
rans
port
- Fire
LOC
AL
38.9
0.0
38.9
19.0
0.0
19.0
19.5
0.0
19.5
20.0
0.0
20.0
20.5
0.0
20.5
21.0
0.0
21.0
Land
& W
ater
Tra
nspo
rt - P
rison
sLO
CA
L4.
20.
04.
23.
00.
03.
03.
10.
03.
13.
20.
03.
23.
20.
03.
23.
30.
03.
3La
nd &
Wat
er T
rans
port
- Po
lice
LOC
AL
160.
80.
016
0.8
90.0
0.0
90.0
92.3
0.0
92.3
94.6
0.0
94.6
96.9
0.0
96.9
99.3
0.0
99.3
Oth
er E
quip
men
t - P
rison
sLO
CA
L8.
10.
08.
13.
00.
03.
03.
10.
03.
13.
20.
03.
23.
20.
03.
23.
30.
03.
3P
olic
e C
ompl
aint
s A
iuth
ority
LOC
AL
0.3
0.0
0.3
0.0
0.0
0.0
0.0
0.0
0.0
0.0
0.0
0.0
0.0
0.0
0.0
0.0
0.0
0.0
Pol
ice
Stat
ions
& B
uild
ings
LOC
AL
79.5
0.0
79.5
141.
00.
014
1.0
144.
50.
014
4.5
148.
10.
014
8.1
151.
80.
015
1.8
155.
60.
015
5.6
Tool
s &
Equ
ipm
ent -
Fire
LOC
AL
18.2
0.0
18.2
15.0
0.0
15.0
15.4
0.0
15.4
15.8
0.0
15.8
16.2
0.0
16.2
16.6
0.0
16.6
ANN
EX F
- PU
BLI
C S
ECTO
R IN
VEST
MEN
T PR
OG
RAM
, 200
4-20
09
(G
$ m
illio
n)
EXPE
ND
ITU
RE
2004
REV
ISED
BU
DG
ET 2
005
BU
DG
ET 2
007
BU
DG
ET 2
008
BU
DG
ET 2
009
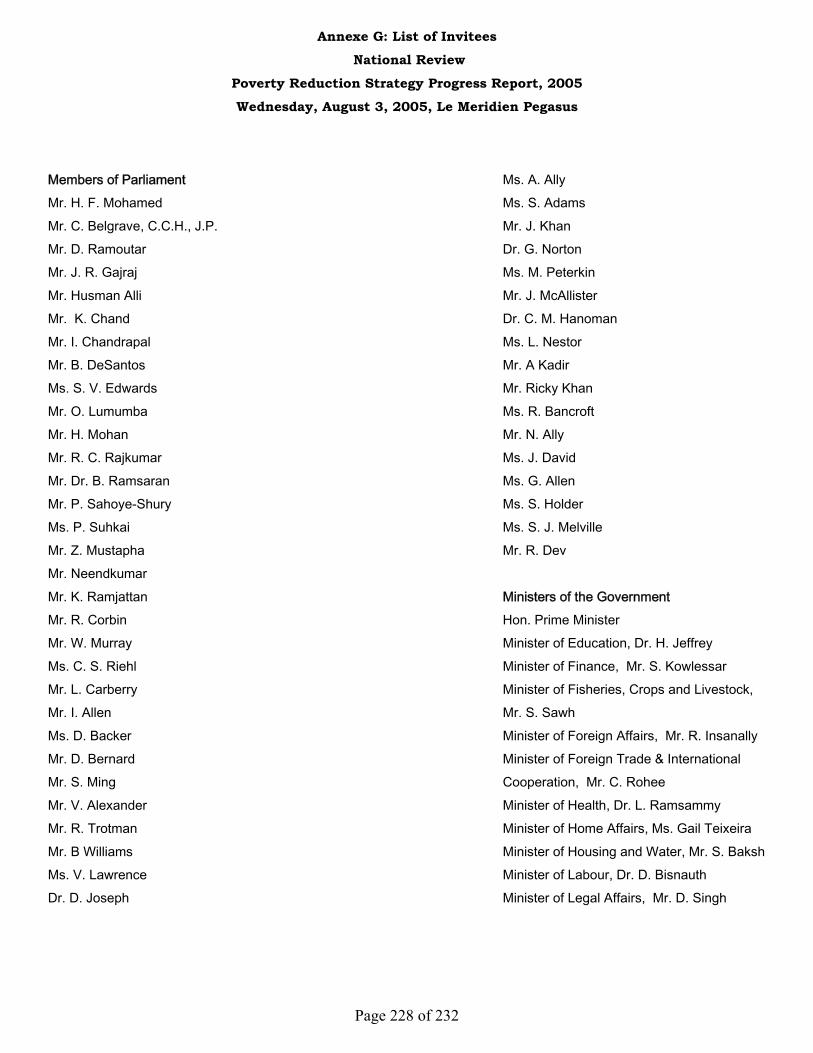
Annexe G: List of Invitees National Review
Poverty Reduction Strategy Progress Report, 2005 Wednesday, August 3, 2005, Le Meridien Pegasus
Page 228 of 232
Members of Parliament Mr. H. F. Mohamed Mr. C. Belgrave, C.C.H., J.P. Mr. D. Ramoutar Mr. J. R. Gajraj Mr. Husman Alli Mr. K. Chand Mr. I. Chandrapal Mr. B. DeSantos Ms. S. V. Edwards Mr. O. Lumumba Mr. H. Mohan Mr. R. C. Rajkumar Mr. Dr. B. Ramsaran Mr. P. Sahoye-Shury Ms. P. Suhkai Mr. Z. Mustapha Mr. Neendkumar Mr. K. Ramjattan Mr. R. Corbin Mr. W. Murray Ms. C. S. Riehl Mr. L. Carberry Mr. I. Allen Ms. D. Backer Mr. D. Bernard Mr. S. Ming Mr. V. Alexander Mr. R. Trotman Mr. B Williams Ms. V. Lawrence Dr. D. Joseph
Ms. A. Ally Ms. S. Adams Mr. J. Khan Dr. G. Norton Ms. M. Peterkin Mr. J. McAllister Dr. C. M. Hanoman Ms. L. Nestor Mr. A Kadir Mr. Ricky Khan Ms. R. Bancroft Mr. N. Ally Ms. J. David Ms. G. Allen Ms. S. Holder Ms. S. J. Melville Mr. R. Dev Ministers of the Government Hon. Prime Minister Minister of Education, Dr. H. Jeffrey Minister of Finance, Mr. S. Kowlessar Minister of Fisheries, Crops and Livestock, Mr. S. Sawh Minister of Foreign Affairs, Mr. R. Insanally Minister of Foreign Trade & International Cooperation, Mr. C. Rohee Minister of Health, Dr. L. Ramsammy Minister of Home Affairs, Ms. Gail Teixeira Minister of Housing and Water, Mr. S. Baksh Minister of Labour, Dr. D. Bisnauth Minister of Legal Affairs, Mr. D. Singh
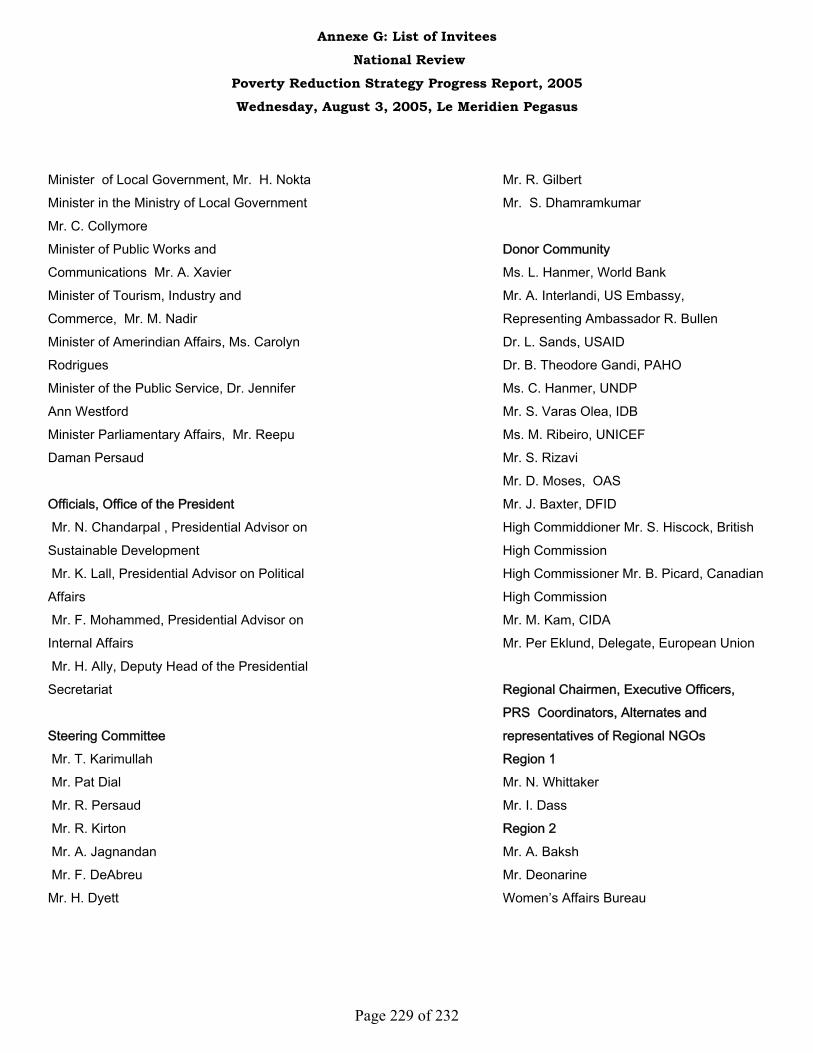
Annexe G: List of Invitees National Review
Poverty Reduction Strategy Progress Report, 2005 Wednesday, August 3, 2005, Le Meridien Pegasus
Page 229 of 232
Minister of Local Government, Mr. H. Nokta Minister in the Ministry of Local Government Mr. C. Collymore Minister of Public Works and Communications Mr. A. Xavier Minister of Tourism, Industry and Commerce, Mr. M. Nadir Minister of Amerindian Affairs, Ms. Carolyn Rodrigues Minister of the Public Service, Dr. Jennifer Ann Westford Minister Parliamentary Affairs, Mr. Reepu Daman Persaud Officials, Office of the President Mr. N. Chandarpal , Presidential Advisor on Sustainable Development Mr. K. Lall, Presidential Advisor on Political Affairs Mr. F. Mohammed, Presidential Advisor on Internal Affairs Mr. H. Ally, Deputy Head of the Presidential Secretariat Steering Committee Mr. T. Karimullah Mr. Pat Dial Mr. R. Persaud Mr. R. Kirton Mr. A. Jagnandan Mr. F. DeAbreu Mr. H. Dyett
Mr. R. Gilbert Mr. S. Dhamramkumar Donor Community Ms. L. Hanmer, World Bank Mr. A. Interlandi, US Embassy, Representing Ambassador R. Bullen Dr. L. Sands, USAID Dr. B. Theodore Gandi, PAHO Ms. C. Hanmer, UNDP Mr. S. Varas Olea, IDB Ms. M. Ribeiro, UNICEF Mr. S. Rizavi Mr. D. Moses, OAS Mr. J. Baxter, DFID High Commiddioner Mr. S. Hiscock, British High Commission High Commissioner Mr. B. Picard, Canadian High Commission Mr. M. Kam, CIDA Mr. Per Eklund, Delegate, European Union Regional Chairmen, Executive Officers, PRS Coordinators, Alternates and representatives of Regional NGOs Region 1 Mr. N. Whittaker Mr. I. Dass Region 2 Mr. A. Baksh Mr. Deonarine Women’s Affairs Bureau
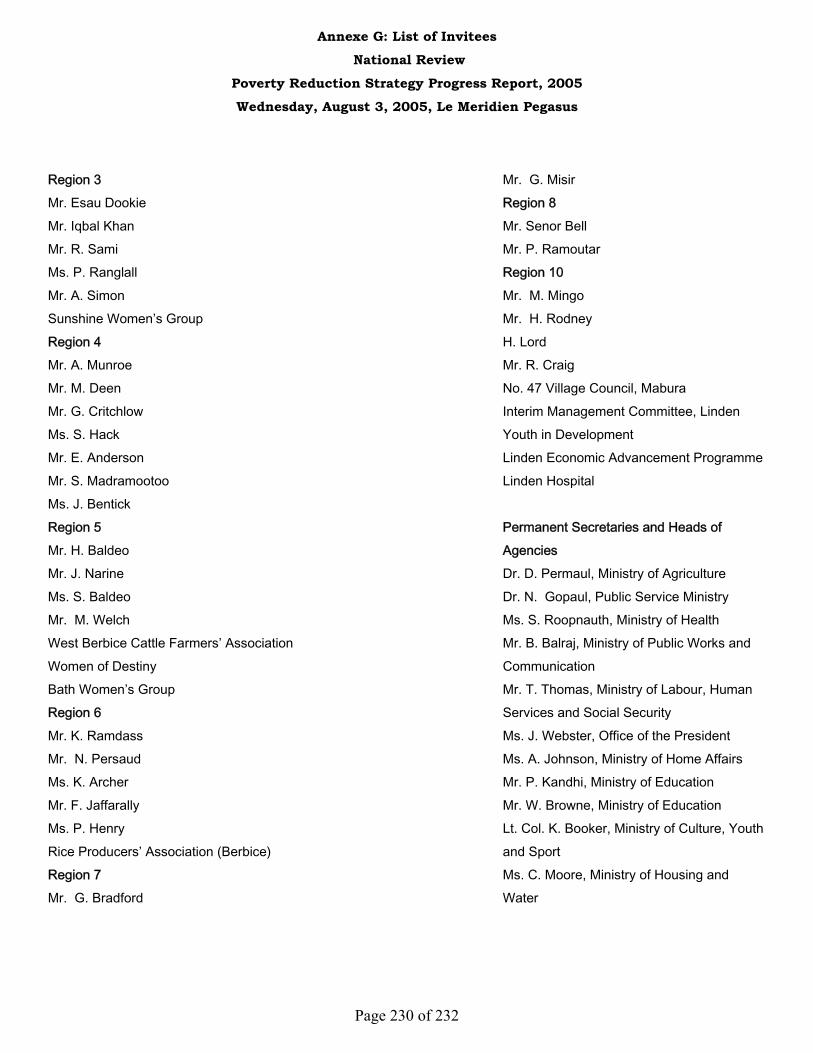
Annexe G: List of Invitees National Review
Poverty Reduction Strategy Progress Report, 2005 Wednesday, August 3, 2005, Le Meridien Pegasus
Page 230 of 232
Region 3 Mr. Esau Dookie Mr. Iqbal Khan Mr. R. Sami Ms. P. Ranglall Mr. A. Simon Sunshine Women’s Group Region 4 Mr. A. Munroe Mr. M. Deen Mr. G. Critchlow Ms. S. Hack Mr. E. Anderson Mr. S. Madramootoo Ms. J. Bentick Region 5 Mr. H. Baldeo Mr. J. Narine Ms. S. Baldeo Mr. M. Welch West Berbice Cattle Farmers’ Association Women of Destiny Bath Women’s Group Region 6 Mr. K. Ramdass Mr. N. Persaud Ms. K. Archer Mr. F. Jaffarally Ms. P. Henry Rice Producers’ Association (Berbice) Region 7 Mr. G. Bradford
Mr. G. Misir Region 8 Mr. Senor Bell Mr. P. Ramoutar Region 10 Mr. M. Mingo Mr. H. Rodney H. Lord Mr. R. Craig No. 47 Village Council, Mabura Interim Management Committee, Linden Youth in Development Linden Economic Advancement Programme Linden Hospital Permanent Secretaries and Heads of Agencies Dr. D. Permaul, Ministry of Agriculture Dr. N. Gopaul, Public Service Ministry Ms. S. Roopnauth, Ministry of Health Mr. B. Balraj, Ministry of Public Works and Communication Mr. T. Thomas, Ministry of Labour, Human Services and Social Security Ms. J. Webster, Office of the President Ms. A. Johnson, Ministry of Home Affairs Mr. P. Kandhi, Ministry of Education Mr. W. Browne, Ministry of Education Lt. Col. K. Booker, Ministry of Culture, Youth and Sport Ms. C. Moore, Ministry of Housing and Water
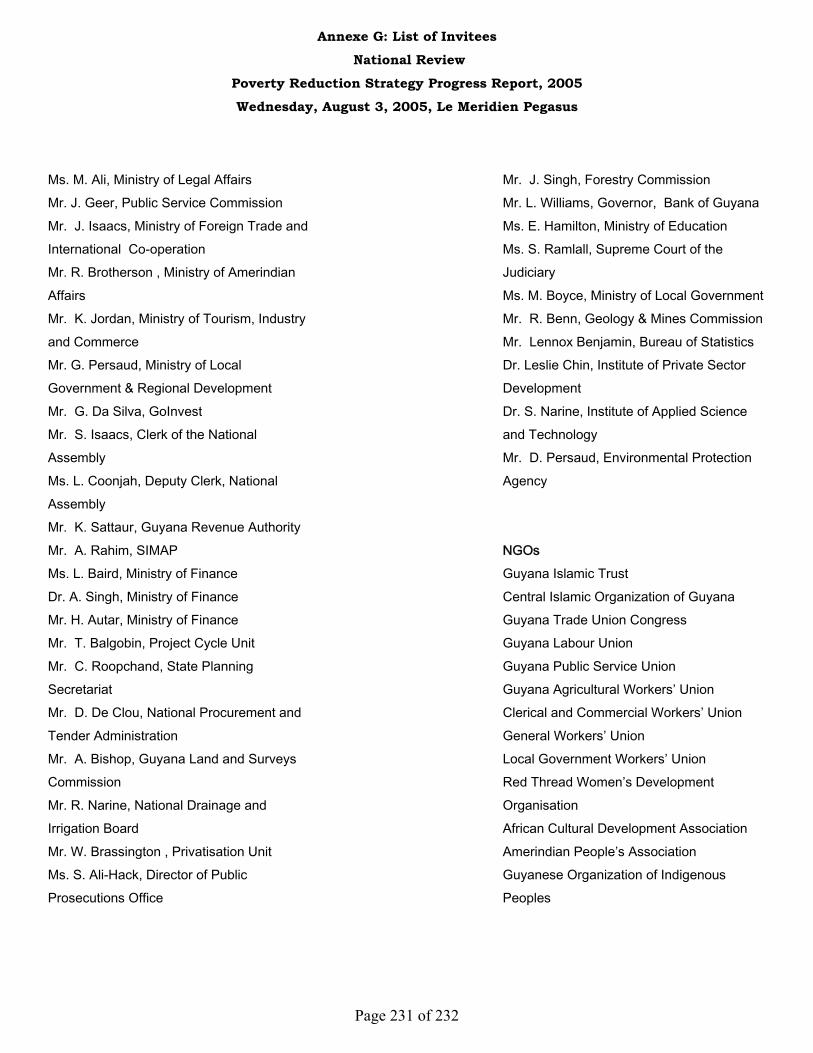
Annexe G: List of Invitees National Review
Poverty Reduction Strategy Progress Report, 2005 Wednesday, August 3, 2005, Le Meridien Pegasus
Page 231 of 232
Ms. M. Ali, Ministry of Legal Affairs Mr. J. Geer, Public Service Commission Mr. J. Isaacs, Ministry of Foreign Trade and International Co-operation Mr. R. Brotherson , Ministry of Amerindian Affairs Mr. K. Jordan, Ministry of Tourism, Industry and Commerce Mr. G. Persaud, Ministry of Local Government & Regional Development Mr. G. Da Silva, GoInvest Mr. S. Isaacs, Clerk of the National Assembly Ms. L. Coonjah, Deputy Clerk, National Assembly Mr. K. Sattaur, Guyana Revenue Authority Mr. A. Rahim, SIMAP Ms. L. Baird, Ministry of Finance Dr. A. Singh, Ministry of Finance Mr. H. Autar, Ministry of Finance Mr. T. Balgobin, Project Cycle Unit Mr. C. Roopchand, State Planning Secretariat Mr. D. De Clou, National Procurement and Tender Administration Mr. A. Bishop, Guyana Land and Surveys Commission Mr. R. Narine, National Drainage and Irrigation Board Mr. W. Brassington , Privatisation Unit Ms. S. Ali-Hack, Director of Public Prosecutions Office
Mr. J. Singh, Forestry Commission Mr. L. Williams, Governor, Bank of Guyana Ms. E. Hamilton, Ministry of Education Ms. S. Ramlall, Supreme Court of the Judiciary Ms. M. Boyce, Ministry of Local Government Mr. R. Benn, Geology & Mines Commission Mr. Lennox Benjamin, Bureau of Statistics Dr. Leslie Chin, Institute of Private Sector Development Dr. S. Narine, Institute of Applied Science and Technology Mr. D. Persaud, Environmental Protection Agency NGOs Guyana Islamic Trust Central Islamic Organization of Guyana Guyana Trade Union Congress Guyana Labour Union Guyana Public Service Union Guyana Agricultural Workers’ Union Clerical and Commercial Workers’ Union General Workers’ Union Local Government Workers’ Union Red Thread Women’s Development Organisation African Cultural Development Association Amerindian People’s Association Guyanese Organization of Indigenous Peoples

Annexe G: List of Invitees National Review
Poverty Reduction Strategy Progress Report, 2005 Wednesday, August 3, 2005, Le Meridien Pegasus
Page 232 of 232
Guyana Human Rights Association Rural Women’s Network Guyana Consumers’ Association Habitat for Humanity National Commission on Disabilities Hindu Dharmic Sabha Private Sector Private Sector Commission Georgetown Chamber of Commerce Consultative Association of Guyanese Industry Guyana Manufacturers’ Association IPED Others Dr. Juan Edghill, Ethnic Relations Commission Mr. Vidya Kissoon, UNDP (DevNet)