guideline fencing and edging treatments for cycling
TRANSCRIPT

Guideline
Fencing and edging treatments for cycling infrastructure February 2019

Guideline, Transport and Main Roads, February 2019
Copyright
© The State of Queensland (Department of Transport and Main Roads) 2019.
Licence
This work is licensed by the State of Queensland (Department of Transport and Main Roads) under
a Creative Commons Attribution (CC BY) 4.0 International licence.
CC BY licence summary statement
You are free to copy, communicate and adapt this work, if you attribute the work to the State of
Queensland (Department of Transport and Main Roads). To view a copy of this licence, visit:
https://creativecommons.org/licenses/by/4.0/
Translating and interpreting assistance
The Queensland Government is committed to providing accessible services to
Queenslanders from all cultural and linguistic backgrounds. If you have difficulty
understanding this publication and need a translator, please call the Translating and
Interpreting Service (TIS National) on 13 14 50 and ask them to telephone the
Queensland Department of Transport and Main Roads on 13 74 68.
Disclaimer
While every care has been taken in preparing this publication, the State of Queensland accepts no
responsibility for decisions or actions taken because of any data, information, statement or advice,
expressed or implied, contained within. To the best of our knowledge, the content was correct at
the time of publishing.
Feedback
Please send your feedback regarding this document to: [email protected]

Fencing and edging treatments for cycling infrastructure
Guideline, Transport and Main Roads, February 2019 i
Contents
1 Introduction ....................................................................................................................................1
1.1 Scope .............................................................................................................................................. 1
1.2 Related documents ......................................................................................................................... 1
1.3 Purpose ........................................................................................................................................... 2
2 Risk assessment ............................................................................................................................2
2.1 Identify the hazards ........................................................................................................................ 5
2.2 Eliminate the hazards ..................................................................................................................... 5
2.3 Likelihood, consequence and risk estimation tables ...................................................................... 6
3 Fences and barriers options for cycleways and shared paths .................................................9
3.1 Delineation .................................................................................................................................... 11
3.2 Rideable clear zone ...................................................................................................................... 12
3.3 Planting and landscaping .............................................................................................................. 13
3.4 Inclined edge treatments and edge treatments ............................................................................ 14
3.5 Low walls ...................................................................................................................................... 15
3.6 Partial barrier fence ...................................................................................................................... 16
3.7 Full barrier fence ........................................................................................................................... 18
3.8 Full barrier fence with screening ................................................................................................... 21
3.9 Road safety barriers – Smooth profile continuous ........................................................................ 23
3.10 Road safety barriers – Steel beam guardrail ................................................................................ 25
4 Design and placement of fences to reduce risk ...................................................................... 26
4.1 Risks associated with fences ........................................................................................................ 26
4.2 Examples of good fence placement ............................................................................................. 28
5 Further information..................................................................................................................... 29
Appendix A: Commentary .................................................................................................................. 30
Commentary 1: Examples of factors that affect likelihood of encounters with hazards ........................ 30
Commentary 2: Examples of factors that influence consequences of crashes ..................................... 33
Commentary 3: Comparison of cyclist fence height requirements in America ...................................... 35
Commentary 4: Barriers adjacent to cycle lanes ................................................................................... 36
Commentary 5: Kerbs as separation devices on bridges ...................................................................... 36
Commentary 6: Cyclist rails ................................................................................................................... 37
Commentary 7: Risks associated with fences ....................................................................................... 38
Commentary 8: Usable path width ........................................................................................................ 39
Appendix B: Risks assessment worksheet examples ..................................................................... 42

Fencing and edging treatments for cycling infrastructure
Guideline, Transport and Main Roads, February 2019 ii
Tables
Table 1.2 – Summary of related documents ........................................................................................... 1
Table 2.1 – Common types of hazards and criteria for evaluating risk ................................................... 5
Table 2.3(A) – Consequence estimates for path user encounters with specific hazards ....................... 7
Table 2.3(B) – Factors that contribute to likelihood of user encounters with hazards ............................ 8
Table 2.3(C) – Resulting level of risk ...................................................................................................... 9
Table 4.1 – Factors that increase risk of being harmed by fence ......................................................... 26
Table A1 – Risk categories and adjustment factor for effective height of falls ...................................... 34
Figure A7 – Simulation of a low-speed and high-speed cyclist falling after losing control .................... 34
Table A2 – Risks associated with fences constructed near or adjacent to paths ................................. 38
Figures
Figure 2 – Flow chart of risk assessment process .................................................................................. 4
Figure 4.2(A) – Preferred fencing arrangement showing fence terminations splayed away from path at
either side of creek crossing .................................................................................................................. 28
Figure 4.2(B) – Example of good fence placement where the fence borders the hazard and is set back
from the path ......................................................................................................................................... 28
Figure 4.2(C) – Example of good fence choice and placement, featuring a chainmesh fence set back
0.5 m from the path edge ...................................................................................................................... 29
Figure 4.2(D) – A good example of splayed, fence termination points (Caloundra) ............................. 29
Figure A1 – The fence on the path may pose a greater risk to users than other hazards .................... 30
Figure A2 –1.0 m raised buffer separates users from potentially high severity crashes. ..................... 31
Figure A3 –Small separator between cycle path and traffic lane .......................................................... 31
Figure A4– A low risk facility, in a predictable environment with a rideable shoulder zone .................. 31
Figure A5 – Batter slopes adjacent to paths may propel users towards hazards ................................. 32
Figure A6– Culverts and headwalls are a common hazard. Where possible, hazards should be
obvious to path users and offset from the path. .................................................................................... 33
Figure A8 – Simulation of young bicycle rider colliding with barrier and falling over handlebars ......... 35
Figure A9 – Maydmo simulation of crash where a rider lost control after striking a concrete kerb and
collided with a guardrail ......................................................................................................................... 36
Figure A10 – Photo showing path used by cyclists with a kerb separation to traffic lane ..................... 37
Figure A11 – Photo showing separate hand rails for pedestrians and cyclists ..................................... 37
Figure A12 – Examples of fencing that puts users at risk ..................................................................... 39

Fencing and edging treatments for cycling infrastructure
Guideline, Transport and Main Roads, February 2019 iii
Figure A13 – Photo from AGRD-6B not consistent with current guidance which recommends offsets
between paths and fences..................................................................................................................... 40
Figure A14 –Cyclist travelling downhill has positioned himself on the centre of the path away from the
fence, which remains a snag hazard for children .................................................................................. 40
Figure A15 – Diagram showing cyclist envelope and far left ride line with and without a fence ........... 41
Figure A16 – Shared path and bicycle path operation before and after installation of fences AGRD,
Adopted from AGRD, Figure A2 ............................................................................................................ 41

Fencing and edging treatments for cycling infrastructure
Guideline, Transport and Main Roads, February 2019 1
1 Introduction
1.1 Scope
This Guideline deals specifically with fencing and barrier treatments for cyclist safety. This includes
cyclists travelling on shared paths, dedicated cycle paths and bicycle lanes where traffic barriers are in
place. It provides guidance as to the circumstances in which fences should be installed and describes
a variety of treatment options. The Guideline recommends a risk assessment approach to identifying
fencing treatments. Ten treatment options are identified, eight of which are designed to control the
movements of cyclists and pedestrians. Two options relate to vehicle barrier treatments.
The Guideline is designed to supplement Austroads guidance, which focuses on managing risks on
batter slopes. The Guideline considers the risks associated with installing a fencing treatment or
barrier option, versus the risks associated with not installing a treatment. Options identified provide
flexibility for designers and operators to identify a treatment that is suitable to the context of the cycling
facility.
1.2 Related documents
This Guideline should be read in conjunction with the documents listed in Table 1.2, which provide
further detail on design considerations.
Table 1.2 – Summary of related documents
Reference Title
AGRD-6 Austroads Guide to Road Design Pt 6: Roadside design, safety and barriers (2010)
AGRD-6A Austroads Guide to Road Design Pt 6A: Paths for walking and cycling (2017)
AGRD-6B Austroads Guide to Road Design Pt 6B: Roadside environment (2015)
AS 1428 Design for access and mobility (Set)
AS 2156: 2001 Walking tracks (Set)
AS/NZS 3845.1 Road safety barriers and devices – Road safety barrier systems
AS/NZS 5100.1: 2017 Bridge design – Scope and general principles
NCC National Construction Code Series 2015, Building Code of Australia Volume 1 Class 2 to Class 9 Buildings (2015)
Transport and Main Roads Bridge design and assessment criteria
Transport and Main Roads Bridge Design and Assessment Criteria Vol 1: Design criteria for bridges and other structures (2018)
Transport and Main Roads Policy (overpass structures)
Transport and Main Roads Policy – Reduction of risk from objects thrown from overpass structures onto roads
Transport and Main Roads Guidelines (overhead structures)
Transport and Main Roads Technical guidelines for treatment of overhead structures – objects thrown or dropped
Transport and Main Roads Road Safety Barrier Systems
Transport and Main Roads Approved products and suppliers Road safety barrier systems, end treatments and other related road safety devices (2018)
Transport and Main Roads TN128
Transport and Main Roads technical note TN128 Selection and design of cycle tracks (2015)

Fencing and edging treatments for cycling infrastructure
Guideline, Transport and Main Roads, February 2019 2
Reference Title
RPDM-6A Transport and Main Roads supplement to Austroads Guide to Road Design: Road Planning and Design Manual 2nd ed Vol 3 Pt 6A: Pedestrian and cyclist paths (2015)
RPDM-6B Transport and Main Roads supplement to Austroads Guide to Road Design: Road Planning and Design Manual 2nd ed Vol 3 Pt 6B: Roadside environment (2015)
TRUM-V1 P5 Transport and Main Roads supplement to Austroads Guide to Traffic Management: Traffic and Road Use Management manual Vol 1 Pt 5: Road Management (2014)
The documents listed following have been referenced in this Guideline.
• [AASHTO] American Association of State Highway and Transportation Officials. (2012). Guide to
the Development of Bicycle Facilities. Washington D.C.
• [AASHTO] American Association of State Highway and Transportation Officials. (2017). AASHTO
LRFD bridge design specifications. Washington D.C.
• [AASHTO] American Association of State Highway and Transportation Officials, A. (2012). Guide
for the development of bicycle facilities: Fourth Edition. America.
• CDM Research. (2016). Evaluation of night-time delineation treatments.
• Department of Infrastructure and Regional Development. (2016). Information sheet 76: Developing
national road safety indicators for injury. Canberra: Bureau of infrastructure, transport and regional
economics.
• McNally, D.S. (2013), MADYMO simulation of children in cycle accidents: A novel approach in risk
assessment. Accident; analysis and prevention. 59C. 469-478. 10.1016/j.aap.2013.07.022.
• National Cooperative Highway Research Program. (2004). Determination of appropriate railing
heights for bicyclists – final. Albany, New York.
• Pang, T., Sakeran, H., Short, A., McIntosh, A., Rechnitzer, G., & Thai, K. (2008). Numerical analysis
of real-world cyclist crashes: impact speed, collision mechanism and movement trajectories.
1.3 Purpose
Fences and barrier treatments are used to protect cyclists and pedestrians from hazards after
preventative measures such as eliminating, relocating or reducing the risks from hazards have been
considered; however, fences adjacent to paths can also be hazardous to cyclists. Fencing treatments
must reduce the nett risk to path users and pose less risk than the hazard being treated.
The purpose of this Guideline is to detail when fencing and barrier treatments are required on cycling
facilities, and the types of treatments that may be considered.
2 Risk assessment
The risk assessment process in Figure 2 supports the selection of appropriate treatments to protect
cyclists from hazards. It refers to treatments 3.1–3.10 in this Guideline.
An EvaluationTool is published separately to this Guideline and is available on the Transport and Main
Roads website. The user can input site and hazard characteristics and the EvaluationTool will

Fencing and edging treatments for cycling infrastructure
Guideline, Transport and Main Roads, February 2019 3
recommend specific fencing and edging treatments. Print-outs of outputs from worked examples are
also provided in Appendix B of this Guideline for reference.
Engineering judgement is required in undertaking each assessment. Consideration should be given to
the following factors when selecting appropriate treatment options:
• environmental and social factors, including the ability for people to see through fences, lean
on fences and enjoy a view without interference from fences – in some situations, fences that
minimise negative effects on the environment and experience of users will be desired
• maintenance: how barriers will be safely and economically maintained for whole-of-life, and
• Safety in Design to reduce risk to users and maintenance staff throughout the life of the asset.

Fencing and edging treatments for cycling infrastructure
Guideline, Transport and Main Roads, February 2019 4
Figure 2 – Flow chart of risk assessment process
Fencing and edging treatments for cycling infrastructure
Guideline, Transport and Main Roads, February 2019 5
2.1 Identify the hazards
The first step in the risk assessment process is to identify hazards. Table 2.1 identifies common types
of hazards in cycling environments that barriers and fencing may have a role in mitigating.
Table 2.1 – Common types of hazards and criteria for evaluating risk
Categories of hazard Examples
Vertical drops • Culverts, headwalls, pipes
• Cliffs and embankments
• Retaining walls
Batters • Banks of rivers, creeks and drains
• Sloping verges
• Approaches to overpasses
Waterways • Creeks, rivers, streams, lakes, ocean
• Drains
Objects and fences • Trees and shrubs
• Street furniture
• Large rocks
• Fences
• Broken fences
• Ends of fences
Roads • Traffic lanes on streets, roads and intersections
• Parking lanes (door hazards)
Other path users • Cyclists travelling in opposite direction
• Passing cyclists
• Intersecting cyclists
• Pedestrians and children
• Dogs
2.2 Eliminate the hazards
Once hazards have been identified, consideration should be given to eliminating hazards and/or
mitigating the risk they pose to users. Examples of this include:
• shifting objects, bins, seating and signs further away from the facility
• creating more forgiving fall environments
• extending culverts 1.5 m past the edge of pathway
• removing fencing where it is redundant
• separating uphill and downhill facilities to avoid tight bends on downhill sections, and
• providing a shoulder, landscaped area or more forgiving batter slope.
Fencing and edging treatments for cycling infrastructure
Guideline, Transport and Main Roads, February 2019 6
2.3 Likelihood, consequence and risk estimation tables
Tables 2.3(A), 2.3(B) and 2.3(C) are provided as a guide to quantifying the risk associated with a
specific hazard and recommending an appropriate treatment option. Copies of these tables are
provided in the EvaluationTool which calculates the results of the risk assessment process and directs
users towards Treatment Options 3.1–3.8 in this Guideline. Where the facility is adjacent to a road or
existing barrier, Treatment Options 3.9–3.10 may be more appropriate.
The risk assessment tool works as follows:
Step 1 Identify and describe the path, path type, hazard and hazard location
Step 2 Identify elimination options
Step 3 Assess the consequences from Table 2.3(B) associated with an interaction with the
hazard
Step 4 Asses the likelihood of an interaction with the hazard from Table 2.3(B)
Step 5 Identify the risk associated with the hazard from Table 2.3(C) and identify appropriate
treatment options.
Further information relating to the factors identified in Tables 2.3(A) and 2.3(B) are described in
Commentary 1 and 2 of Appendix A in this Guideline.
Engineering judgement is required in the assessment and treatment recommendation process. The
scores are indicative only and should be adjusted as necessary to reflect specific risks associated with
the hazard and the user groups expected to use the facility. The highest injury score for the user
groups likely to use the facility should be identified and documented.

Fencing and edging treatments for cycling infrastructure
Guideline, Transport and Main Roads, February 2019 7
Table 2.3(A) – Consequence estimates for path user encounters with specific hazards
Hazard type¹ Hazard
description
Encounter
conditions
Crash
response
Severity
category
Consequence
severity
• Vertical drops
• Batters of 1:1 or steeper
• Smooth batters steeper than 1:4 to waterways, roads or vertical drops
Heff <0.25 m All Fall Insignificant 1
Heff = 0.25–0.5 m All Launch Minor 2
Heff = 0.25–1.0 m All Launch Moderate 3
Heff = 1.0–2.0 m All Launch Major 4
Heff = 2.0 m+ All Launch Severe 5
Fixed obstacles with vertical elements
Hit obstacle >30 km/hr
Approach <25° Snag/Fall Insignificant 1
Approach >25° Launch Moderate 3
Hit obstacle <30 km/hr
Approach <25° Stop Insignificant 1
Approach >25° Stop Minor 2
Moderate batters² Grassed Batter 1:3 to 1:1
Drop 0.25–1.0 m
Fall Insignificant 1
Drop 1.0–1.5 m Fall Minor 2
Drop >1.5 m Fall Moderate 3
Rocky Batter 1:8 to 1:4
Drop 0.25–1.0 m
Launch Minor 2
Drop >1.0 m Launch Moderate 3
Rocky Batter 1:4 to 1:1
Drop 0.25–1.0 m
Launch Moderate 3
Drop >1.0 m Fall Major 4
Impacted by motor vehicle
Motor vehicle impact Impact speed <20 km/hr
Hit Minor 2
Impact speed ≥20 and <30 km/hr
Hit Moderate 3
Impact speed ≥30 and <60 km/hr
Hit Major 4
Impact speed ≥60 km/hr
Hit Severe 5
1. If hazard is not described in this table, use the severity descriptions following to estimate a hazard score.
2. If obstacles are low and there may be a risk of launching, consider increasing severity by 1 point.
Score Category Severity description
1 Insignificant Injury requiring first aid at most
2 Minor Reversible injury to one or more persons requiring medical treatment.
3 Moderate Moderate irreversible injury or reversible injury with prolonged recovery
4 Major Considerable irreversible injury
5 Severe Fatality or significant disabling injury

Fencing and edging treatments for cycling infrastructure
Guideline, Transport and Main Roads, February 2019 8
Table 2.3(B) – Factors that contribute to likelihood of user encounters with hazards
Criteria Description Likelihood of user encountering hazard
Reduced Low Moderate High
Scores -1 0 1 2
Proximity to path
Hazards may pose greater risk to users than fencing
>3.0 m 1.5–3.0 m 0.5–1.5 m from path
0–0.5 m
Path shoulder
Shoulder provides recovery area or reduces likelihood cyclists encounter hazard
1.0 m shoulder 0.5 m shoulder 0.3 m shoulder 0 m shoulder
Batter slopes Where a downhill batter is likely to propel users towards a hazard
Inclining batter Batter range 1:8 to zero
Batter range 1:4 to 1:8
Batter 1:4 or steeper
Horizontal curves
Risk increases if radius <AGRD-6A Table 5.6 recommended values
NA Straight Hazard near bend
R <AGRD-6A
Sight visibility path legibility
Risk increases if sight distance less than recommended
Refer AGRD-6A, Part 5.7.1
Hazard obvious to all users all times of day
Hazard unlikely to be missed by users
Stopping distance not met for some riders
Stopping distance not met for most riders
Path gradients
Downhill gradients facilitate higher speeds
Riders are more likely to lose control and encounter hazards
Uphill (top of hill)
≤5% >10% for less than 50 m >5% for less than 300 m
>10% for 50 m or more >5% for more than 300 m
Narrow path <1.2 m
It is more likely users will stray from narrow facilities
NA Path width >1.5 m
Path width (<1.5 m)
Path width <1.0 m
Undersized paths
Use AGRD-6A Figure 5.4–5.5, or observations of delayed pass and meetings at point location in peak hour
No delayed passing and clearance to users
Adequate path size
No delays in 10 min
Path close to capacity or >1 delayed pass / 10 min
Path undersized or >1 delayed pass / 5 min
Traffic volumes
Where hazard is a road, consider traffic volumes
<6000 ≥6000 VPD
Total likelihood score / 16
Total likelihood score Description
-4–1 Reduced
2–6 Low
7–11 Moderate
12–16 High

Fencing and edging treatments for cycling infrastructure
Guideline, Transport and Main Roads, February 2019 9
Table 2.3(C) – Resulting level of risk
Consequence
severity score
(from
Table 2.3(B))
Likelihood scores
(from Table 2.3(A))
Reduced
range -4–1
Low range
2–5
Moderate
range
6–11
High range
12–16
1 Consider non-fencing options 3.1–3.4
Consider non-fencing options 3.1–3.4
Consider treatment options 3.3–3.6
Consider treatment options 3.3–3.6
2 Consider non-fencing options 3.1–3.4
Consider non-fencing options 3.1–3.4
Consider treatment options 3.3–3.6
Consider treatment options 3.6–3.8
3 Consider treatment options 3.3–3.6
Consider treatment options 3.3–3.6
Consider treatment options 3.6–3.8
Consider treatment options 3.7–3.8
4 or 5 Consider treatment options 3.3–3.6
Consider treatment options 3.6–3.8
Consider treatment options 3.7–3.8
Consider treatment options 3.7–3.8
Risk level
Low
Moderate
High
Very High
3 Fences and barriers options for cycleways and shared paths
This section describes ten separation and fencing treatments for cycleways. Eight treatments are
designed to mitigate risks identified in Section 2. The other treatments relate to vehicle barriers and
are not specifically referred to in the risks assessment process.
Each treatment has specific properties that are effective in treating some of the risks associated with
cycling environments. No treatment option will remove all risks. It is up to designers to understand the
risk and identify an appropriate treatment option that provides the lowest level of risks to users.
Where fencing and barrier treatments are required, it is recommended that designers consider least
intrusive options in the first instance, and progress towards more intrusive options where the risk
assessment demonstrates their requirement.
Fencing and edging treatments for cycling infrastructure
Guideline, Transport and Main Roads, February 2019 10
In summary, the treatment options are:
Non-fencing treatments:
• 3.1 Delineation
• 3.2 Rideable clear zones
• 3.3 Planting and landscaping
• 3.4 Inclined edge treatments and edge treatments
Fencing treatments to prevent cyclists from hazards:
• 3.5 Low walls
• 3.6 Partial barrier fence
• 3.7 Full barrier fence
• 3.8 Full barrier fence with screening
Fencing treatments associated with vehicle barriers:
• 3.9 Road safety barriers: smooth profile continuous
• 3.10 Road safety barriers: steel beam guardrail
Fencing and edging treatments for cycling infrastructure
Guideline, Transport and Main Roads, February 2019 11
3.1 Delineation
Treatment 3.1 – Delineation
Description Delineate path edge, features, hazards or path centre
Risks mitigated Reduces likelihood of cyclists leaving the path, or encroaching into space of other users
Risks generated
Does not introduce new risks to the system
Advantages • Avoids the introduction of new hazards to the ride zone
• Does not reduce path width
Where appropriate
• For managing low to moderate risks in some situations
• Where risk does not warrant a full or partial barrier treatment
• Where barrier treatments pose comparable risks to the ones generated by the hazard
Avoid where: • To mitigate severe risks from drop-offs or physical objects
• As stand-alone treatment for moderate risks
Combine with: • A buffer zone to provide an area for riders to self-correct
• Vegetation to provide a high-friction run-off area, or physical barrier to hazards
• Measures to reduce severity of the risk (that is, adjust batter slopes, remove hazards)
• Fencing treatments set back from the ride zone if hazard warrants
• A separately marked pedestrian path
Design considerations
• Non-slip line marking on edges of path
• Centre lines where there is limited sight distance around bends
• Consider providing lighting, or pavement treatments discernible at night
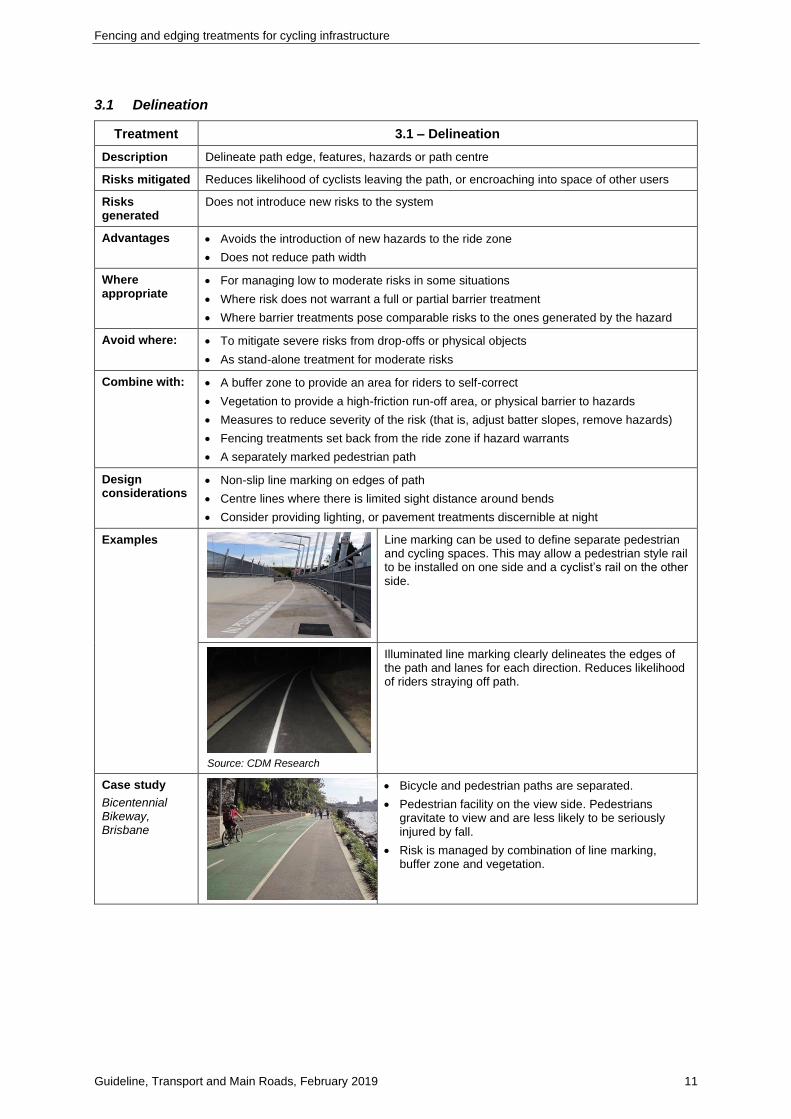
Examples
Line marking can be used to define separate pedestrian and cycling spaces. This may allow a pedestrian style rail to be installed on one side and a cyclist’s rail on the other side.
Source: CDM Research
Illuminated line marking clearly delineates the edges of the path and lanes for each direction. Reduces likelihood of riders straying off path.
Case study
Bicentennial Bikeway, Brisbane
• Bicycle and pedestrian paths are separated.
• Pedestrian facility on the view side. Pedestrians gravitate to view and are less likely to be seriously injured by fall.
• Risk is managed by combination of line marking, buffer zone and vegetation.

Fencing and edging treatments for cycling infrastructure
Guideline, Transport and Main Roads, February 2019 12
3.2 Rideable clear zone
Treatment 3.2 – Rideable clear zone
Description A flat or gently sloped clear zone preferably 1.0 m wide (0.6 m minimum) to allow riders to correct their path of travel
Risks mitigated • Reduces crash likelihood by providing forgiving path side environment so riders self-correct and avoid hazards
• May reduce hazard risks >1.0 m away from path to avoid fencing treatments need
Risks generated
Does not introduce new risks to the system
Advantages • Avoids the introduction of new hazards to the area
• Can reduce risks from hazards set back from the path
• Opportunities to reduce maintenance and address Safety in Design issues
Where appropriate
• Where space is available, and a relatively flat grade can be achieved
• Where risk does not warrant a full or partial barrier treatment
Avoid where: • As stand-alone treatment for severe risks from vertical drops or hazards
• As stand-alone treatment for compounding risks (bends and gradients) that incline users run off path
Combine with: • Line marking or pavement treatments
• Vegetation to provide high-friction run-off area, or physical barrier to hazards
• Measures to reduce severity of risk (that is, adjust batter slopes, remove hazards)
• Fencing treatments spaced away from the ride zone if hazard warrants
Site observations
Grassed, flat area allows riders to recover if they stray from path. If hazard is not severe, and there are no compounding risks, this treatment may be appropriate for moderate risks
Roads can generate moderate to severe risks to users. The grass area between path and road provides a tactile indication to users and space to recover their line
Design considerations
• 1.0 m-wide buffer, clear of hazards either side of path
• Maximum gradient 1:8
• Any flat area adjacent to the path can decrease the chance of cyclists crashing
• Desirable to provide tactile change in surface (grooved joint or different surface)
Case study
Sunshine Coast, coastal path
• Shared pathway over culverts, 2.0 m-wide shared coastal path, 3.2 m-wide culvert, 0.5 m buffer both sides (desirable = 1.0 m)
• Buffer delineated by coloured pavement, tactile joint
• Low edge treatments away from path of travel reduce risk to wheelchair users, provide shore line for people with vision impairments
• Edge treatments do not reduce risk to riders and can increase chance of fall
• More suitable in situations where path is wider (2.5 m+ for shared paths) and on straight sections

Fencing and edging treatments for cycling infrastructure
Guideline, Transport and Main Roads, February 2019 13
3.3 Planting and landscaping
Treatment 3.3 – Planting and landscaping
Description • Vegetation planted as a barrier between cycleways and hazards
• Vegetation should be relatively soft and provide a forgiving fall environment
• Vegetation needs to be less than 0.5 m high in areas where sight distance needs to be maintained between path users and vehicle drivers
Risks mitigated • Provides physical separation that slows riders down and reduces how far they are likely to stray off the path
• Reduces likelihood cyclists will intentionally move off path
• Provides a more forgiving fall environment that will reduce severity of harm
Risks generated
Riders are more likely to fall on a garden bed than a smoother surface (however, consequences may be lower)
Advantages • Can slow riders down more efficiently than a sealed or grassed surface
• Can provide a more forgiving fall environment
• Can be designed to complement streetscaping
• Avoids hard infrastructure that could injure riders or drivers
• Can be achieved in a compact environment (down to 0.5 m)
Where appropriate
• Where space is available to mitigate moderate risks to users
• Where vegetation can be safely and cost-effectively maintained
• Shopping precincts, around local streets, paths
• To protect users from low-risk hazards such as slopes, trees, rubbish bins
Avoid where: • As stand-alone treatment to mitigate severe risks from drop-offs or physical objects
• As stand-alone treatment for moderate risks
Combine with: • Line marking and delineation
• Fences at approaches to bridges or slopes
Design considerations
• 1.0 m-wide planting (0.5 m minimum desirable) – maximum height is 0.5 m
• Consider location of vegetation and providing access across desire lines
Examples
Vegetation used to separate shared pathway and arterial road, without introducing spear hazards or snag hazards to the system.
The vegetated area at the bottom of the hills is designed to slow cyclists and provide a forgiving environment in the event of a fall.
Case study
Brisbane Road Cycleway, Mooloolaba
Application:
• Cycle track with 0.6 m clearance to an arterial road (1.0 m to traffic)
• Vegetation roadside, thicker and higher than service lane side
• Vegetation less than 0.5 m high around intersections
• Prevents errant cyclists running onto the road
Fencing and edging treatments for cycling infrastructure
Guideline, Transport and Main Roads, February 2019 14
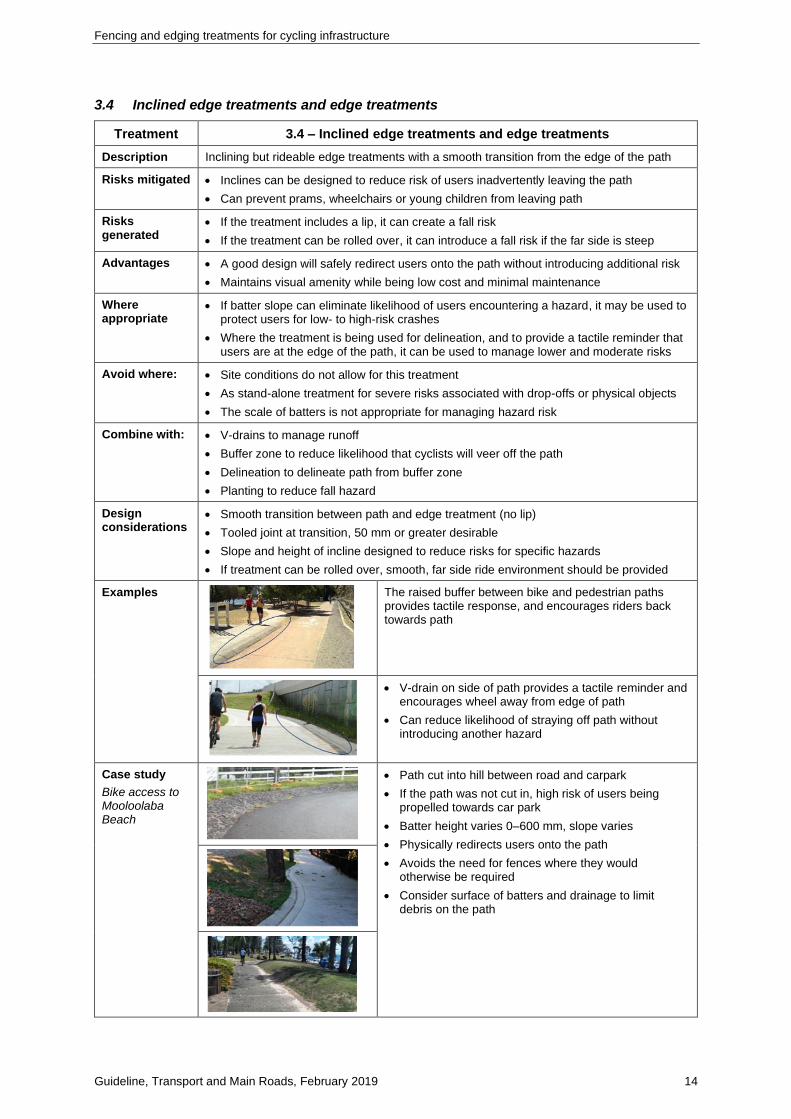
3.4 Inclined edge treatments and edge treatments
Treatment 3.4 – Inclined edge treatments and edge treatments
Description Inclining but rideable edge treatments with a smooth transition from the edge of the path
Risks mitigated • Inclines can be designed to reduce risk of users inadvertently leaving the path
• Can prevent prams, wheelchairs or young children from leaving path
Risks generated
• If the treatment includes a lip, it can create a fall risk
• If the treatment can be rolled over, it can introduce a fall risk if the far side is steep
Advantages • A good design will safely redirect users onto the path without introducing additional risk
• Maintains visual amenity while being low cost and minimal maintenance
Where appropriate
• If batter slope can eliminate likelihood of users encountering a hazard, it may be used to protect users for low- to high-risk crashes
• Where the treatment is being used for delineation, and to provide a tactile reminder that users are at the edge of the path, it can be used to manage lower and moderate risks
Avoid where: • Site conditions do not allow for this treatment
• As stand-alone treatment for severe risks associated with drop-offs or physical objects
• The scale of batters is not appropriate for managing hazard risk
Combine with: • V-drains to manage runoff
• Buffer zone to reduce likelihood that cyclists will veer off the path
• Delineation to delineate path from buffer zone
• Planting to reduce fall hazard
Design considerations
• Smooth transition between path and edge treatment (no lip)
• Tooled joint at transition, 50 mm or greater desirable
• Slope and height of incline designed to reduce risks for specific hazards
• If treatment can be rolled over, smooth, far side ride environment should be provided
Examples
The raised buffer between bike and pedestrian paths provides tactile response, and encourages riders back towards path
• V-drain on side of path provides a tactile reminder and encourages wheel away from edge of path
• Can reduce likelihood of straying off path without introducing another hazard
Case study
Bike access to Mooloolaba Beach
• Path cut into hill between road and carpark
• If the path was not cut in, high risk of users being propelled towards car park
• Batter height varies 0–600 mm, slope varies
• Physically redirects users onto the path
• Avoids the need for fences where they would otherwise be required
• Consider surface of batters and drainage to limit debris on the path

Fencing and edging treatments for cycling infrastructure
Guideline, Transport and Main Roads, February 2019 15
3.5 Low walls
Treatment 3.5 – Low walls
Description Barriers between 0.45 m and 1.0 m, with 0.5–1.0 m horizontal dimensions, with a smooth surface that is unlikely to catch pedals
Risks mitigated • Provides a horizontal and vertical physical barrier between cyclists and a hazard, such as a slope, feature, or road
• Prevents very young users from riding, or falling, off a path onto a hazard
• Provides a predictable visual clue delineating the edge of the path
Risks generated
• Launch hazards to cyclists if hit at high approach angle (>25°)
• May not be easy to see in low light if without contrasting colours
Advantages • Maintains views, site lines and amenity in most situations
• Provides informal seating
• Prevents vehicles from accessing a space
Where appropriate
• Shared use paths
• Where there is a need to provide extra protection for low speed users
• Shopping precincts, around local streets, paths
• To protect users from less serious hazards such as slopes, trees, rubbish bins
Avoid where: • Higher barriers are required to protect people from serious falls or severe hazards
• On narrow paths with high-speed commuters
• Around tight horizontal bends
Combine with: • Appropriately-sized paths for shared use
• Planting and hazard risk mitigation
• Delineation and paving treatments that place cyclists on the other side of the path
• Termination treatments (ends splayed away from path)
Design considerations
• 0.45–1.0 m high, 0.5–1.0 m wide
• Minimum height of 0.45 m to comply with walkway specifications for AS 1428.1
Examples
Walls provide physical separation between hazard and path. Provides informal seating opportunity for resting.
5.0 m-wide shared coastal path in Christchurch. Maintains amenity for pedestrians and cyclists. Wall provides vertical delineation and a horizontal buffer between the edge of the path and rock wall.
Case study
South Bank
• Wide shared riverway path in Brisbane’s Southbank precinct – maintains amenity for pedestrians and cyclists
• Separates the path and the rock wall hazard, prevents very young users from straying off path
• Path used by young and inexperienced users and commuters
• Smooth edge and predictable edge line unlikely to catch pedals

Fencing and edging treatments for cycling infrastructure
Guideline, Transport and Main Roads, February 2019 16
3.6 Partial barrier fence
Treatment 3.6 – Partial barrier fence
Description Incorporates horizontal rails (2–3) to prevent people from inadvertently leaving the path
Risks mitigated
Prevents adult cyclists and pedestrians from straying off the path and encountering a hazard whilst in the act of walking and cycling
Risks generated
• Balustrade and handrails can catch wheels, pedals and handlebars
• Fences typically include hard materials that can harm users
• If installed within 0.5 m of the path, it reduces the effective width of the path and can increase risk of collisions between users
• Can reduce sight lines and increase risk of collisions between users or with objects, some fences may encourage climbing and increase risk of falls
Advantages • Lower cost, lighter weight and less visually intrusive than full barrier and 1.4 m-high fences
• Higher permeability in flood-affected environments (may reduce blockage factors used for flood modelling and bridge design)
Where appropriate
• Where there is a requirement to protect users from small vertical drops that cannot be mitigated in other ways
• Where the risk of cyclists being vaulted over the rail is low
• More appropriate on the inside of bends than full barrier fences
Avoid where: • A less intrusive approach (planting, line marking or inclined edge treatments) is sufficient
• The hazard is such that someone who climbs or falls through the fence is likely to be seriously injured or killed (includes fall where the Effective Height >1 m)
• In constrained settings where risk associated with head-on collisions between users is greater than the risk generated by the hazard
Combine with: • A buffer between the path and fence: the minimum buffer to maintain effective path width is 0.5 m (desirable) – because fences can also be hazards (AGRD-6A, section 5.1.1), it is desirable to provide 1.0 m (AGRD-6A, section 5.5.1)
• Less intrusive treatments such as low vegetation at locations where risk is lower
Design considerations
• 1.2 m high: 1.4 m partial barrier fences are generally only considered when there is a vaulting risk, such as on tight horizontal bends (AGRD-6A, section 5.5.3)
• Handrails are required where the gradient exceeds 1:20: handrail height is required to be 0.85–1.0 m above the ramp surface, as per Figure 14 in AS 1428.1
• Termination points flared away from path; bar ends do not create a spearing hazard
Examples
Shared pathway boardwalk
Smooth horizontal rails and flush surface with posts reduce chance of handlebars snagging. Bottom rail contains small wheels. Partial barrier fence protects users from small vertical drop.
Coastal path
The fence reduces the effective width of the path and may increase risk of user conflict. A more efficient approach is to provide a 1.0 m buffer between fence and rock wall.

Fencing and edging treatments for cycling infrastructure
Guideline, Transport and Main Roads, February 2019 17
Treatment 3.6 – Partial barrier fence
Inside of horizontal bends, Toowong Overpass
Partial barrier fences are less likely to impact sight lines around corners than full barrier fences. This can reduce likelihood of head-on collisions. Photos show a full barrier fence (Toowong Overpass) and a partial barrier fence (Eleanor Schonell Bridge). Sight lines are mostly retained through the corner in the Eleanor Schonell Bridge example. Sight lines should always be considered around curves.
Inside of horizontal bends, Eleanor Schonell Bridge
Case study
Enoggera Creek, Kelvin Grove
• A partial barrier fence is used as a terminal treatment for a full barrier fence on the pedestrian and cycle bridge.
• The fence extends 1–2 panels past the hazard.
• The fence terminal is flared away from the path, as per AGRD-6A (Figure 5.13).
• The termination of the fence is 0.5 m from the path.
• The end of the fence folds around and does not pose a spearing hazard.
Case study
Gardner’s Creek Trail
Source: Cameron Munroe
Application:
• Fence is set back 0.3–0.5 m from path to maintain most of its effective width.
• Horizontal rails protect users from setback vertical elements. This reduces risk of cyclists snagging and encourages sliding, which will have lower impact.
Improvements and alternative options
• Provide at least 1.0 m clearance between path and fence.
• Consider whether the risk warrants fence treatment, or if a lower order treatment could be used.
Case study
Shared pathway bridge
• Fence is fitted with cyclist deflection rails. Rails are designed to deflect cyclists away from fences when they make contact between their elbow and shoulder (AGRD-6A).
• Deflection rails, their attachments, and termination points may increase risk to younger users.
• Consider placing poles behind horizontal elements, instead of deflection rail.
• Partial barrier fences protect users from less severe hazards such as obstacles and small vertical drops. A 1.2 m fence is generally suitable for this purpose.
Case study
Cycletrack, Caloundra
• Fence installed to protect users from a steep batter.
• Fence is adjacent to the cycle path, which reduces effective path width and increases likelihood of crashes with fence or other cyclists.
• Consider providing 1.0 m clearance between path and fence or a 1.0 m vegetated buffer instead of fence.
• Alternatively, install pedestrian path on fence side.
Fencing and edging treatments for cycling infrastructure
Guideline, Transport and Main Roads, February 2019 18
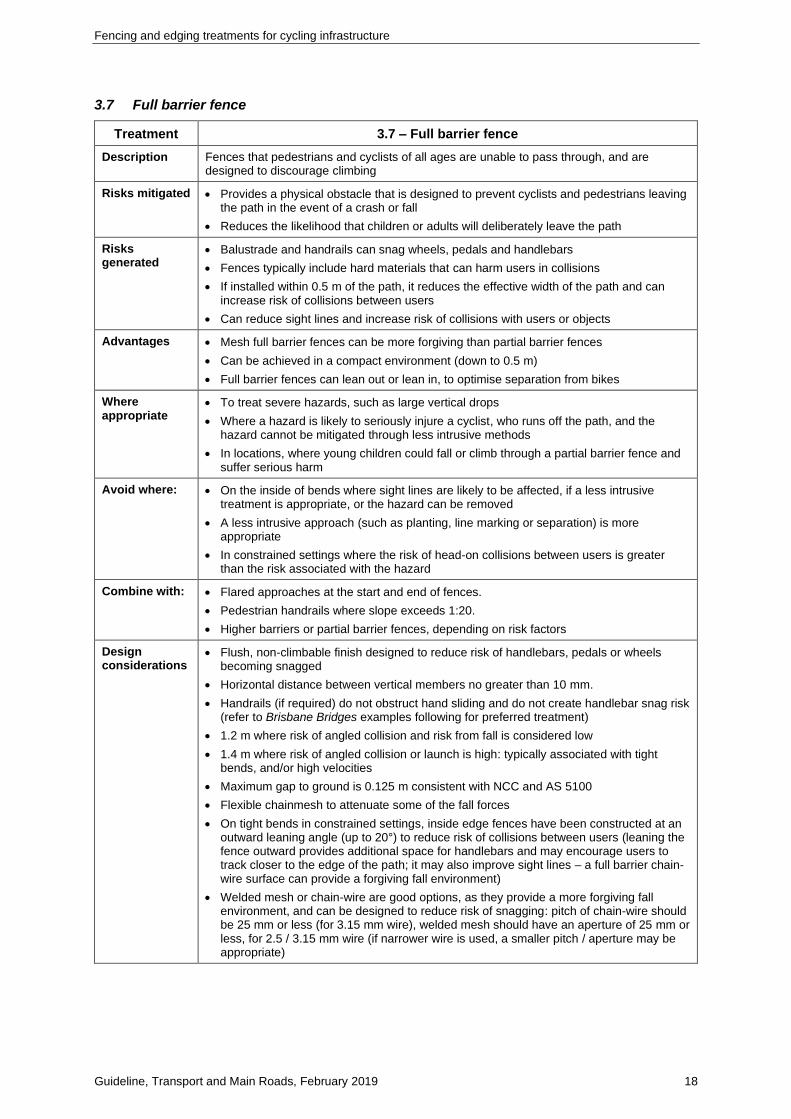
3.7 Full barrier fence
Treatment 3.7 – Full barrier fence
Description Fences that pedestrians and cyclists of all ages are unable to pass through, and are designed to discourage climbing
Risks mitigated • Provides a physical obstacle that is designed to prevent cyclists and pedestrians leaving the path in the event of a crash or fall
• Reduces the likelihood that children or adults will deliberately leave the path
Risks generated
• Balustrade and handrails can snag wheels, pedals and handlebars
• Fences typically include hard materials that can harm users in collisions
• If installed within 0.5 m of the path, it reduces the effective width of the path and can increase risk of collisions between users
• Can reduce sight lines and increase risk of collisions with users or objects
Advantages • Mesh full barrier fences can be more forgiving than partial barrier fences
• Can be achieved in a compact environment (down to 0.5 m)
• Full barrier fences can lean out or lean in, to optimise separation from bikes
Where appropriate
• To treat severe hazards, such as large vertical drops
• Where a hazard is likely to seriously injure a cyclist, who runs off the path, and the hazard cannot be mitigated through less intrusive methods
• In locations, where young children could fall or climb through a partial barrier fence and suffer serious harm
Avoid where: • On the inside of bends where sight lines are likely to be affected, if a less intrusive treatment is appropriate, or the hazard can be removed
• A less intrusive approach (such as planting, line marking or separation) is more appropriate
• In constrained settings where the risk of head-on collisions between users is greater than the risk associated with the hazard
Combine with: • Flared approaches at the start and end of fences.
• Pedestrian handrails where slope exceeds 1:20.
• Higher barriers or partial barrier fences, depending on risk factors
Design considerations
• Flush, non-climbable finish designed to reduce risk of handlebars, pedals or wheels becoming snagged
• Horizontal distance between vertical members no greater than 10 mm.
• Handrails (if required) do not obstruct hand sliding and do not create handlebar snag risk (refer to Brisbane Bridges examples following for preferred treatment)
• 1.2 m where risk of angled collision and risk from fall is considered low
• 1.4 m where risk of angled collision or launch is high: typically associated with tight bends, and/or high velocities
• Maximum gap to ground is 0.125 m consistent with NCC and AS 5100
• Flexible chainmesh to attenuate some of the fall forces
• On tight bends in constrained settings, inside edge fences have been constructed at an outward leaning angle (up to 20°) to reduce risk of collisions between users (leaning the fence outward provides additional space for handlebars and may encourage users to track closer to the edge of the path; it may also improve sight lines – a full barrier chain-wire surface can provide a forgiving fall environment)
• Welded mesh or chain-wire are good options, as they provide a more forgiving fall environment, and can be designed to reduce risk of snagging: pitch of chain-wire should be 25 mm or less (for 3.15 mm wire), welded mesh should have an aperture of 25 mm or less, for 2.5 / 3.15 mm wire (if narrower wire is used, a smaller pitch / aperture may be appropriate)

Fencing and edging treatments for cycling infrastructure
Guideline, Transport and Main Roads, February 2019 19
Treatment 3.7 – Full barrier fence
Examples
Chainmesh fence, 25 mm pitch, chainmesh fence, 50 mm pitch
Chainmesh fence
Recommend 25 mm pitch maximum where there is a chance of cyclists colliding at angles up to 25°. Posts located on outside of chainmesh to maintain smooth surface being thrown over. This type of treatment is also used as a full barrier treatment.
Chainmesh in marine setting, Elizabeth Quay Bridge (Perth)
Mesh provides a continuous surface that is unlikely to snag bike components. A bike rail is not required. Pedestrian rails are required on ramps. The attachments in this picture could pose a snagging risk to cyclists.
Brisbane Bridges
Cyclist rails not required if the surface is designed not to snag wheels, pedals and handlebars.
Brisbane Bridges
Pedestrians must be able to run their hand along rails without obstruction (AS 1428.1). Connections below the rail can snag handles. This is a good example of a rail that is consistent with AS 1428.1 and is unlikely to snag bicycles.
Sunshine Coast (bridge underpass)
• Fence limited to bend where users are more likely to veer off path.
• Vertical balustrade is not preferred as it can snag handlebars or pedals.
• 0.5 m set back from path reduces chance of snagging and collision between users.
• Treatment reduces risk of users falling, without increased risk of collisions.

Fencing and edging treatments for cycling infrastructure
Guideline, Transport and Main Roads, February 2019 20
Treatment 3.7 – Full barrier fence
Weldmesh fence in roadside environment
• Tightly spaced horizontal wires in the direction of travel, and posts on outside create a smooth surface that has low snag risk.
• Cyclist rail (or top bend) not required because surface is smooth.
• No horizontal rails. Suitable for road environments, as it does not pose a spearing hazard.
Stanley St on-ramp, Woolloongabba
A leaning out fence treatment was applied on the inside of a tight horizontal bend in Brisbane to reduce risk of collisions between riders. The fence angle increases from 0 to 20° through the bend.
Source:Veloway 1 Maintenance Works Site 4 Stanley Street On Ramp Handrail Plan and Elevation, Brisbane City Council (2017)
Fencing and edging treatments for cycling infrastructure
Guideline, Transport and Main Roads, February 2019 21
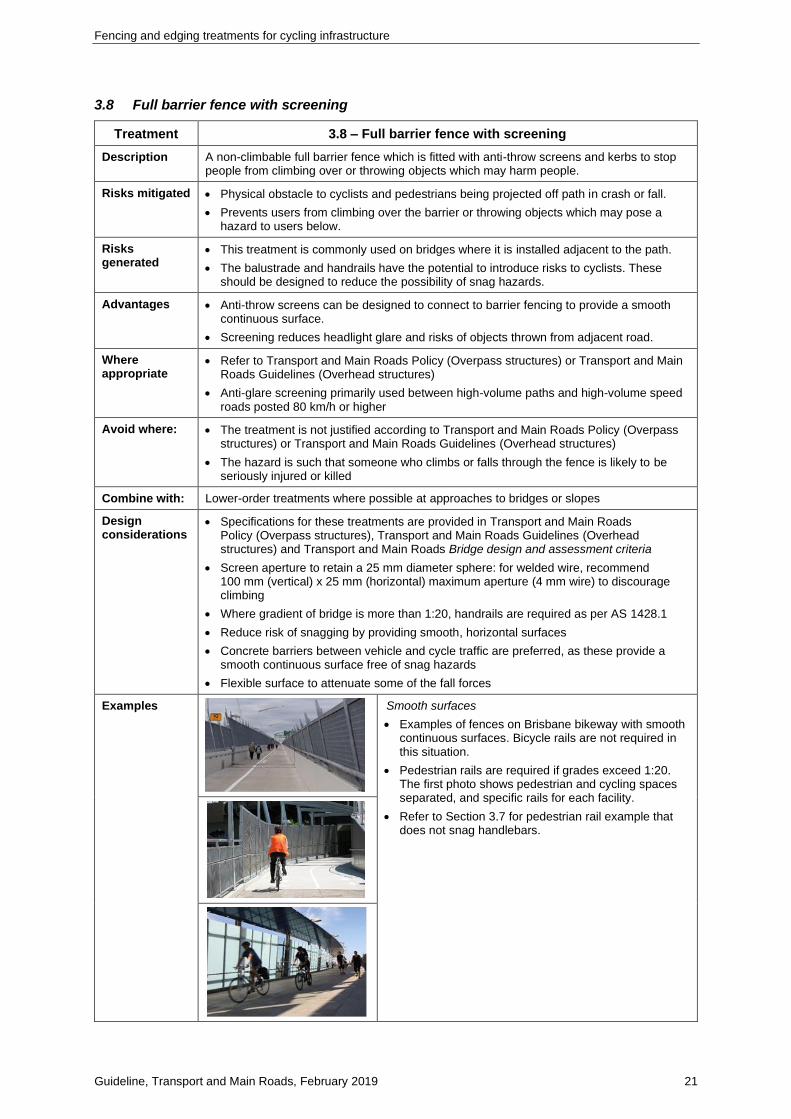
3.8 Full barrier fence with screening
Treatment 3.8 – Full barrier fence with screening
Description A non-climbable full barrier fence which is fitted with anti-throw screens and kerbs to stop people from climbing over or throwing objects which may harm people.
Risks mitigated • Physical obstacle to cyclists and pedestrians being projected off path in crash or fall.
• Prevents users from climbing over the barrier or throwing objects which may pose a hazard to users below.
Risks generated
• This treatment is commonly used on bridges where it is installed adjacent to the path.
• The balustrade and handrails have the potential to introduce risks to cyclists. These should be designed to reduce the possibility of snag hazards.
Advantages • Anti-throw screens can be designed to connect to barrier fencing to provide a smooth continuous surface.
• Screening reduces headlight glare and risks of objects thrown from adjacent road.
Where appropriate
• Refer to Transport and Main Roads Policy (Overpass structures) or Transport and Main Roads Guidelines (Overhead structures)
• Anti-glare screening primarily used between high-volume paths and high-volume speed roads posted 80 km/h or higher
Avoid where: • The treatment is not justified according to Transport and Main Roads Policy (Overpass structures) or Transport and Main Roads Guidelines (Overhead structures)
• The hazard is such that someone who climbs or falls through the fence is likely to be seriously injured or killed
Combine with: Lower-order treatments where possible at approaches to bridges or slopes
Design considerations
• Specifications for these treatments are provided in Transport and Main Roads Policy (Overpass structures), Transport and Main Roads Guidelines (Overhead structures) and Transport and Main Roads Bridge design and assessment criteria
• Screen aperture to retain a 25 mm diameter sphere: for welded wire, recommend 100 mm (vertical) x 25 mm (horizontal) maximum aperture (4 mm wire) to discourage climbing
• Where gradient of bridge is more than 1:20, handrails are required as per AS 1428.1
• Reduce risk of snagging by providing smooth, horizontal surfaces
• Concrete barriers between vehicle and cycle traffic are preferred, as these provide a smooth continuous surface free of snag hazards
• Flexible surface to attenuate some of the fall forces
Examples
Smooth surfaces
• Examples of fences on Brisbane bikeway with smooth continuous surfaces. Bicycle rails are not required in this situation.
• Pedestrian rails are required if grades exceed 1:20. The first photo shows pedestrian and cycling spaces separated, and specific rails for each facility.
• Refer to Section 3.7 for pedestrian rail example that does not snag handlebars.

Fencing and edging treatments for cycling infrastructure
Guideline, Transport and Main Roads, February 2019 22
Treatment 3.8 – Full barrier fence with screening
Case study
Development of designs for Veloway 1 Pacific Motorway Bridge Crossing
The draft cross-section shown is a good example of full barrier fences with anti-throw screens, and includes:
• Curved anti-throw screens are generally more effective at controlling objects than vertical screens and are recommended in Transport and Main Roads’ Bridge design and selection criteria (refer to Section 1.2).
• A bike rail 1400mm above the ride surface provides a buffer to the overhanging kerb. This rail is not required if the fence provides a smooth continuous surface, or small aperture weldmesh (refer to Section 3.7 for weldmesh criteria).
• No allowance for pedestrian rails, as the gradient is less than 1:20.
• 100 mm continuous kerb at the base of the fence and less than 125 mm from the fence base (AS 5100).
Kerbs extend 50 mm between the fence face and the path. Working width of path is measured between hand rails.
Case study
Weldmesh on Tibby Cotter Bridge (Sydney)
Source: Tensile design & construct
This is a good example of chainmesh fencing used as anti-throw protection.
Fencing and edging treatments for cycling infrastructure
Guideline, Transport and Main Roads, February 2019 23
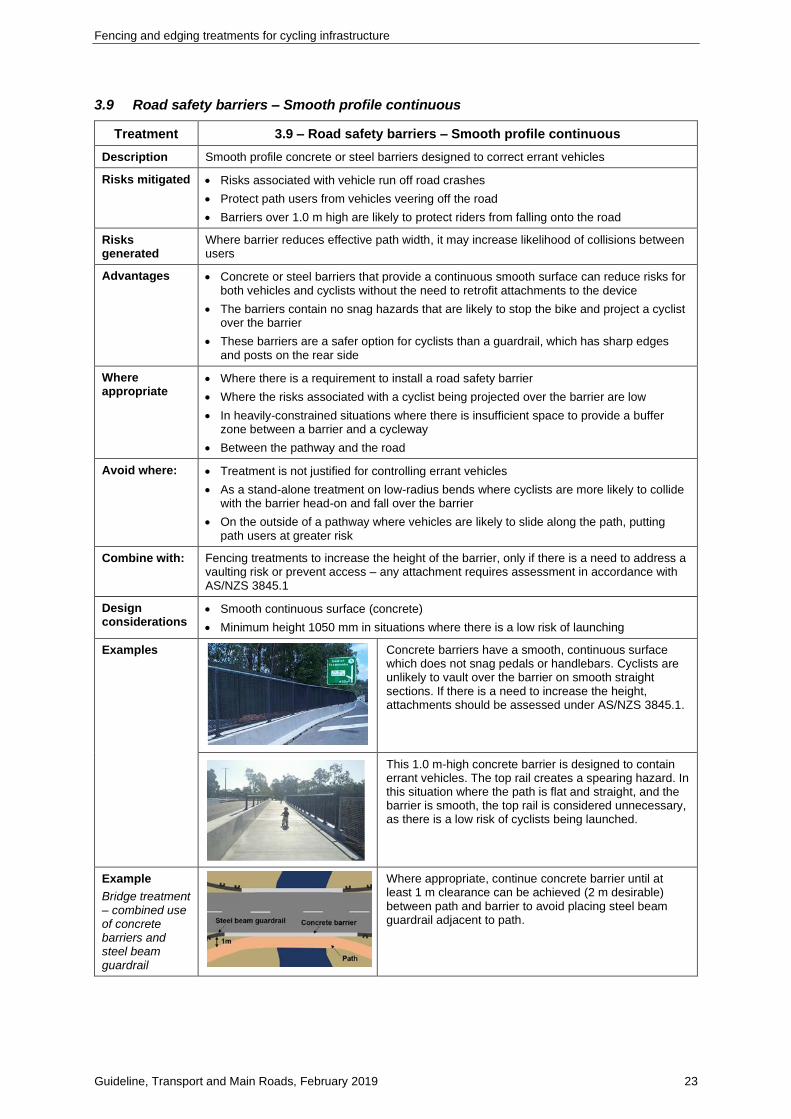
3.9 Road safety barriers – Smooth profile continuous
Treatment 3.9 – Road safety barriers – Smooth profile continuous
Description Smooth profile concrete or steel barriers designed to correct errant vehicles
Risks mitigated • Risks associated with vehicle run off road crashes
• Protect path users from vehicles veering off the road
• Barriers over 1.0 m high are likely to protect riders from falling onto the road
Risks generated
Where barrier reduces effective path width, it may increase likelihood of collisions between users
Advantages • Concrete or steel barriers that provide a continuous smooth surface can reduce risks for both vehicles and cyclists without the need to retrofit attachments to the device
• The barriers contain no snag hazards that are likely to stop the bike and project a cyclist over the barrier
• These barriers are a safer option for cyclists than a guardrail, which has sharp edges and posts on the rear side
Where appropriate
• Where there is a requirement to install a road safety barrier
• Where the risks associated with a cyclist being projected over the barrier are low
• In heavily-constrained situations where there is insufficient space to provide a buffer zone between a barrier and a cycleway
• Between the pathway and the road
Avoid where: • Treatment is not justified for controlling errant vehicles
• As a stand-alone treatment on low-radius bends where cyclists are more likely to collide with the barrier head-on and fall over the barrier
• On the outside of a pathway where vehicles are likely to slide along the path, putting path users at greater risk
Combine with: Fencing treatments to increase the height of the barrier, only if there is a need to address a vaulting risk or prevent access – any attachment requires assessment in accordance with AS/NZS 3845.1
Design considerations
• Smooth continuous surface (concrete)
• Minimum height 1050 mm in situations where there is a low risk of launching
Examples
Concrete barriers have a smooth, continuous surface which does not snag pedals or handlebars. Cyclists are unlikely to vault over the barrier on smooth straight sections. If there is a need to increase the height, attachments should be assessed under AS/NZS 3845.1.
This 1.0 m-high concrete barrier is designed to contain errant vehicles. The top rail creates a spearing hazard. In this situation where the path is flat and straight, and the barrier is smooth, the top rail is considered unnecessary, as there is a low risk of cyclists being launched.
Example
Bridge treatment – combined use of concrete barriers and steel beam guardrail
Where appropriate, continue concrete barrier until at least 1 m clearance can be achieved (2 m desirable) between path and barrier to avoid placing steel beam guardrail adjacent to path.

Fencing and edging treatments for cycling infrastructure
Guideline, Transport and Main Roads, February 2019 24
Treatment 3.9 – Road safety barriers – Smooth profile continuous
Example
Concrete barriers
Smooth, continuous concrete barriers are recommended to separate cyclists from vehicles. Current bridge guidance requires 1.4 m high barriers on bridges, regardless of the site conditions. This is not consistent with AGRD-6A, which allows 1.2 m barriers to be considered.
Case study
Sugarbag Road Overpass, Caloundra
Consider extending concrete barrier, until 1 m clear from path, then apply guardrail.
• W-beam guardrail installed adjacent to cycleway at approach to an overpass. Guardrail connects to a concrete barrier.
• W-beam posts can snag cyclist pedals. Posts and barrier have sharp edges that will cause more harm if hit.
• Extending the concrete barrier, to a point where there is 1 m clearance between path and barrier, would reduce risk to cyclists.
Case study
Bruce Highway Overpass
• Cyclists have reported feeling uncomfortable on this Bruce Highway overpass, which features an 800 mm guardrail and a narrow cycle lane. These are compounding risk factors.
• There are no specific standards for barriers on cycle lanes. Recommend 1050 mm smooth, concrete guardrail (as opposed to W-beam which creates snag hazards and is lower). Treat risk factors to reduce likelihood of vehicle and bike collision.

Fencing and edging treatments for cycling infrastructure
Guideline, Transport and Main Roads, February 2019 25
3.10 Road safety barriers – Steel beam guardrail
Treatment 3.10 – Road safety barriers – Steel beam guardrail
Description W-beam guardrail designed to protect vehicle occupants from hazards in the road clear zone
Risks mitigated • Protecting vehicle occupants from hazards in the road environment
• Path users outside the deflection zone may be protected from vehicles veering off the road
• May also protect cyclists from veering onto road or hazard
Risks generated
• If less than 1.0 m from path, increased risk of cyclist crashing into guardrail or other users
• Sharp edges and posts on W-beam guardrail pose a hazard to cyclists in the event of a crash
Advantages • Lower cost compared to concrete guardrail
• Allows water to drain underneath
Where appropriate
• Where all practical and feasible measures have been taken to prevent vehicles from leaving the road and to create a safe roadside environment where barriers are not required (refer to AGRD-6, Figure 4.1 and Commentary 1)
• Where smooth profile barrier systems are not practical or feasible
• Where a buffer can be provided to maintain the working width of the guardrail without affecting the path
Avoid where: • The guardrail encroaches on the usable path width
• Risk to vehicle occupants associated with the hazard is considered lower than the risk to path users of being harmed by guardrail
• It is not possible to provide clearance between the path and the guardrail equal to or greater than the working width of the guardrail
• On bends where cyclists may approach the angle at a high angle and are likely to be flung over the rail
• On the outside of a pathway where vehicles are likely to slide along the path, putting path users at greater risk
Combine with: • Treatments to reduce risk of guardrail injuring path users (post caps, appropriately secured rails or barriers, planting)
• Concrete barriers where appropriate (refer to Section 3.9, Bridge Treatment example)
Design considerations
• Desirable to locate outside deflection zone (typically 1–2 m from barrier)
• Desirable to locate outside clear zone for gating end treatments
• Guardrail post caps installed
• Consider changing the road environment to reduce the risk of drivers running off road so that barriers are not required (refer to AGRD-6).
Examples
• The guardrail in this photo has been treated with sheet metal to protect cyclists from posts and guardrail edge. This product has not been tested and approved under AS/NZS 3845.1.
• Maintenance issues have been reported with this style of treatment.
• Post caps can reduce injuries associated with the sharp edges of posts and should be installed adjacent to cycle lanes and paths.
• Post caps do not reduce likelihood of cyclists snagging pedals or severity of injuries from the top of guard rail.

Fencing and edging treatments for cycling infrastructure
Guideline, Transport and Main Roads, February 2019 26
4 Design and placement of fences to reduce risk
4.1 Risks associated with fences
A fence introduces a new hazard into cycling environments. Where possible, hazards should be
designed out of the system so that the treatments are not required. Where fences are required,
consideration should be given to:
• designing the fence to minimise crash severity, and
• installing the fence in such a way to minimise crash likelihood and reduce maintenance costs
by permitting high-productivity maintenance methods and Safety in Design principles.
Table 4.1 summarises common risks associated with fencing. These risks are associated with
three types of crashes:
• collisions with fences
• collisions with other users, resulting from operating space being reduced by fences, and
• falls from fences.
Where possible, fences should be offset from paths to avoid the high and moderate risks described in
Table 4.1. Further information on hazards associated with fences is provided in Appendix A.
Further information on how the placement of fences can influence usable path width is provided in
Appendix A.
Table 4.1 – Factors that increase risk of being harmed by fence
Influencing
factors
Location and treatments associated with insignificant to high risk
Insignificant Low risk Moderate risk High risk
Collision with fence
Offset from path to fence
Offset fence 1.0 m or more from path
Offset fence 0.5 m or more from path
Offset fence 0.1–<0.5 m from path
Fence is on path or <0.1 m
Splayed terminals
Terminals splayed away from path at 1:5
Offset = 1.5 m
Terminals splayed away from path at 1:5
Offset = 1.0 m
Terminals splayed away from path at 1:5
Offset = 0.5 m
Fence not splayed from path
Visibility Fence is in predictable and obvious location, not on a desire line
Fence clearly delineated and visible in all conditions from both directions
Fence is on a possible desire line and is not visible in all directions
Fence located on path or desire line, and not easily visible in all conditions
Pedal / Snag Smooth continuous profile fence, or chainmesh fence
<25 mm aperture (refer Section 3.7)
Smooth continuous profile fence, or chainmesh fence
<25 mm aperture (refer Section 3.7)
Vertical elements spaced >1 m apart (like partial barrier fences)
Closely spaced vertical elements, but wide enough to catch wheel or pedal

Fencing and edging treatments for cycling infrastructure
Guideline, Transport and Main Roads, February 2019 27
Influencing
factors
Location and treatments associated with insignificant to high risk
Insignificant Low risk Moderate risk High risk
Protrusions from fence
N/A Fence top is smooth and continuous
Smooth posts, no sharp edges protrude from fence
Posts with sharp edges protrude from fence
Terrain Fence is above path
Fence on level terrain
Approach to fence is downward sloping (steeper than 1:8)
Approach to fence is downward sloping (steeper than 1:4)
Collisions between users – risk is higher if path is not adequately sized for user volumes (refer to AGRD-6A Figures 5.4–5.5. for path size guidance)
Offset from path to fence
Offset fence 1.0 m or greater from path edge
Fence offset less than 0.5 m from path with free capacity
Fence is on path that is at or near capacity
Fence is on undersized path
Sight lines between users
Fence does not impact sight lines between users
Partial barrier fence, or low (<0.5 m vegetation) around inside bends
Full barrier fence, located on inside of bend
Full barrier fence, located on inside of tight bend
Falls from fences
Climbable fences Fence is not climbable
Partial barrier fence located above minor hazard
Partial barrier fence located above moderate hazard
Partial barrier fence located above serious fall hazards

Fencing and edging treatments for cycling infrastructure
Guideline, Transport and Main Roads, February 2019 28
4.2 Examples of good fence placement
Figure 4.2(A) shows the preferred arrangement for fences over a hazard. The fence is offset 1.0 m
from the edge of the path and terminal ends are splayed 1.5 m. This arrangement reduces the risk that
cyclists will crash into the fence, or into other path users.
Figure 4.2(A) – Preferred fencing arrangement showing fence terminations splayed away from
path at either side of creek crossing
Figures 4.2(B)–4.2(D) show fences installations that reduce risk of harm. In Figure 4.2(B), the fence is
well set back from the path and follows the hazard, not the path. The offsets increase the effective
path width and can improve sight distance around bends.
Figure 4.2(B) – Example of good fence placement where the fence borders the hazard and is
set back from the path

Fencing and edging treatments for cycling infrastructure
Guideline, Transport and Main Roads, February 2019 29
Figure 4.2(C) – Example of good fence choice and placement, featuring a chainmesh fence set
back 0.5 m from the path edge
Richlands Railway Station Precinct
Source: Fullframe Photographics
Figure 4.2(D) – A good example of splayed, fence termination points (Caloundra)
5 Further information
For further information on this Technical Note, please contact:
Transport and Main Roads – Engineering & Technology Branch
Email: [email protected]

Fencing and edging treatments for cycling infrastructure
Guideline, Transport and Main Roads, February 2019 30
Appendix A: Commentary
Commentary 1: Examples of factors that affect likelihood of encounters with hazards
Cycling facilities should be designed to reduce the likelihood of encounters with hazards. This can be
achieved by:
1. keeping facilities clear of fixed object hazards (including fences); where treatments are
required, they are clearly delineated and obvious to users, and
2. reducing the likelihood that cyclists will leave the path, where they can encounter hazards.
The likelihood that cyclists will stray off a path is affected by:
a. physical properties of the path and the hazard, and
b. path operating conditions.
The likelihood of encounters may increase significantly where there are multiple contributing factors;
for example, a cyclist travelling downhill at high speed and around a narrow bend is more likely to
collide with something on the outside of a bend, than a cyclist travelling in a straight line downhill.
1 Proximity
Where other factors are neutral, riders are more likely to interact with obstacles on or near the path,
and certainly within 0.5 m. This risk generally decreases as distance increases.
AGRD-6, Commentary 8 shows a relationship between vehicle speed, lateral offset and crash
probability for vehicles. Data for cyclists is less robust; however, graph shape is expected to be
similar, whereby the probability of encounters will generally decrease as distance increases.
Figure A1 shows a fence located on the path. Riders are more likely to interact and be harmed by the
fence than the trees / batter slope it is designed to protect them from.
Figure A1 – The fence on the path may pose a greater risk to users than other hazards
Transport and Main Roads guidelines for cycle tracks may be relevant for establishing a safe buffer
distance. Cycle tracks require 0.4–1.0 m separation to traffic. It is desirable for separators to have a
vertical component, but it is also acceptable to include only a downwards-facing kerb. In this way, it is
like using a buffer zone between paths and hazards. Widths of 1.0 m or more are used in higher-risk
environments (Transport and Main Roads TN128).
An assumption underlying this type of infrastructure is that, where other risks are controlled, cyclists
are unlikely to depart from a defined cycling area. The requirements for this infrastructure include high
standards for path width, delineation and treatment of point source hazards. Figure A2 shows a
best practice-style separation device. Figure A3 shows a narrow device, in a constrained setting.

Fencing and edging treatments for cycling infrastructure
Guideline, Transport and Main Roads, February 2019 31
Figure A2 –1.0 m raised buffer separates users from potentially high severity crashes.
Figure A3 –Small separator between cycle path and traffic lane
2 Path shoulder
Shoulders provide a rideable recovery area that can allow cyclists to regain control. It is desirable that
they:
• are no steeper than 1:8
• provide a tactile response to riders: grass or vegetation is a good surface treatment as it can
also have a slowing effect, and
• be free of obstacles where possible, and free of obstacles that may cause serious harm.
Figure A4– A low risk facility, in a predictable environment with a rideable shoulder zone

Fencing and edging treatments for cycling infrastructure
Guideline, Transport and Main Roads, February 2019 32
3 Batter slopes and downhill gradients
Downward sloping batters and downhill gradients can increase the likelihood that riders will stray
further from a path or faster towards a hazard, as they may fail to recover after departure. Figure A5
shows examples where this likelihood factor interacts with other factors to increase risk of harm.
The photo on the left shows a narrow path adjacent to a downhill batter. A child rode off the path, lost
control of his bike and landed in the road shoulder. The shoulder protected him from serious injury.
The photo on the right shows a narrow path, on a bend, with a mild gradient, and batter slope adjacent
to the road environment. A mistake in this location could lead to a rider falling in front of a motor
vehicle.
Figure A5 – Batter slopes adjacent to paths may propel users towards hazards
4 Sight distance and observation time
Sight distance provides time for cyclists to observe a hazard and take actions to avoid it. Distance is
measured from the hazard to the observation point. If sight distance is limited, signs and line marking
may alert cyclists sooner, or encourage faster reaction times. Sight distance to other path users
should also be considered. Full barrier fences on the inside of bends can significantly reduce sight
distances and increase possibility of head-on collisions. AGRD-6A, Section 5.7 defines sight distance
requirements.
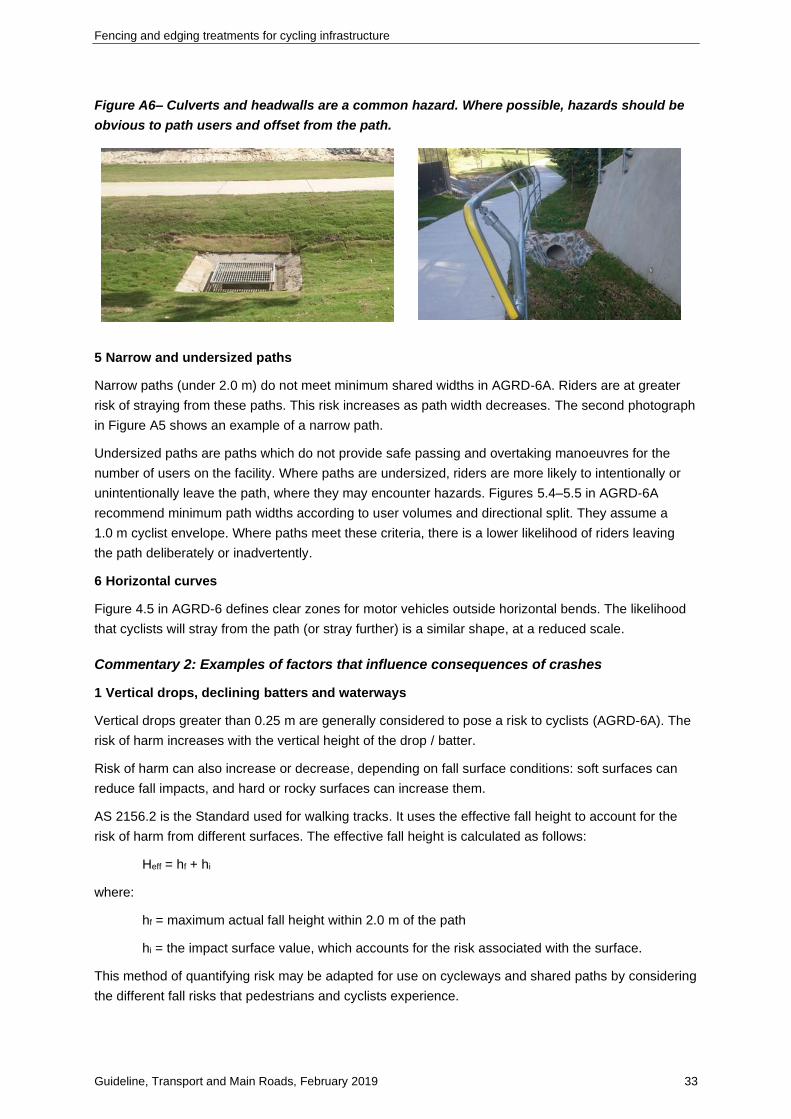
Figure A6 shows two photos: on the left, the hazard is separated from the path and has clear sight
lines. Users are less likely to encounter this hazard, untreated, than the culvert on the right, which is
obscured if approached from behind. The culvert has been treated but the fence reduces the effective
operating width of the path. Identify whether hazards can be designed out of the system before
considering treatment options.
Fencing and edging treatments for cycling infrastructure
Guideline, Transport and Main Roads, February 2019 33
Figure A6– Culverts and headwalls are a common hazard. Where possible, hazards should be
obvious to path users and offset from the path.
5 Narrow and undersized paths
Narrow paths (under 2.0 m) do not meet minimum shared widths in AGRD-6A. Riders are at greater
risk of straying from these paths. This risk increases as path width decreases. The second photograph
in Figure A5 shows an example of a narrow path.
Undersized paths are paths which do not provide safe passing and overtaking manoeuvres for the
number of users on the facility. Where paths are undersized, riders are more likely to intentionally or
unintentionally leave the path, where they may encounter hazards. Figures 5.4–5.5 in AGRD-6A
recommend minimum path widths according to user volumes and directional split. They assume a
1.0 m cyclist envelope. Where paths meet these criteria, there is a lower likelihood of riders leaving
the path deliberately or inadvertently.
6 Horizontal curves
Figure 4.5 in AGRD-6 defines clear zones for motor vehicles outside horizontal bends. The likelihood
that cyclists will stray from the path (or stray further) is a similar shape, at a reduced scale.
Commentary 2: Examples of factors that influence consequences of crashes
1 Vertical drops, declining batters and waterways
Vertical drops greater than 0.25 m are generally considered to pose a risk to cyclists (AGRD-6A). The
risk of harm increases with the vertical height of the drop / batter.
Risk of harm can also increase or decrease, depending on fall surface conditions: soft surfaces can
reduce fall impacts, and hard or rocky surfaces can increase them.
AS 2156.2 is the Standard used for walking tracks. It uses the effective fall height to account for the
risk of harm from different surfaces. The effective fall height is calculated as follows:
Heff = hf + hi
where:
hf = maximum actual fall height within 2.0 m of the path
hi = the impact surface value, which accounts for the risk associated with the surface.
This method of quantifying risk may be adapted for use on cycleways and shared paths by considering
the different fall risks that pedestrians and cyclists experience.

Fencing and edging treatments for cycling infrastructure
Guideline, Transport and Main Roads, February 2019 34
Values for hi have been adjusted from AS 2156.2 to account for hazards in urban areas and increased
risk to cyclists around sharp and rough surface areas. These values are provided in Table A1.
Table A1 – Risk categories and adjustment factor for effective height of falls
Risk category hi (m) Examples of surface condition
Benign -0.5 • Deep moss, soft vegetation, swamp
• Shallow still water (still deep enough to cushion a fall)
• Beach
Favourable 0 • Loose gravel, sand
• Deep water with reasonable means of exit
• Grass, low planting
Unfavourable +0.5 • Hard surface including pavers, concrete and asphalt
• Deep water without reasonable means of exit
Hazardous +1 Jagged stones or rocks
Most hazardous +3.0 • Swiftly flowing water without means of exit
• Extended falls arising from rolling or sliding, following initial impact, on terrain whose slope exceeds 35°
• Vegetation likely to arrest rolling shall be considered when assessing extended fall
2 Object hazards
Figure A7 simulates a rider losing control at low speed (top row of frames) and high speed (bottom
row of frames). In the low-speed crash, ‘the rider fell sideways onto their shoulder. At higher speeds
the cyclist was projected forward over the handlebars and their head struck the ground’ (McNally,
2013). Figure A8 shows the simulation of a six-year-old child rider colliding with a low barrier.
Similarly, the crash simulation shows the rider being projected over the barrier.
Figure A7 – Simulation of a low-speed and high-speed cyclist falling after losing control
Source: (McNally 2013)

Fencing and edging treatments for cycling infrastructure
Guideline, Transport and Main Roads, February 2019 35
Figure A8 – Simulation of young bicycle rider colliding with barrier and falling over handlebars
3 Moderate to steep batters
Moderate batters are steep enough that they may cause a rider to lose control and become injured;
however, batter slopes steeper than 1:1 are simply considered as vertical drops because they are
likely to cause similar injuries to cyclists.
4 Kinetic potential
Risk of harm from roads is related to traffic volumes, traffic speeds and heavy vehicle volumes. If a
cyclist collides with a vehicle travelling at speeds greater than 30 km/hr, there is a significant chance
that they will be seriously injured or killed.
Cyclists travelling down long gradients can build up significant kinetic potential, impacting
non-frangible fixtures that engage a rider (instantaneous deceleration) and will likely result in serious
harm.
Visibility between road users is also likely to impact the consequences of collisions. Improvements to
visibility may increase reaction time, allowing road users a chance to reduce speeds.
Commentary 3: Comparison of cyclist fence height requirements in America
Differences between requirements in AS 5100 and AGRD-6A mirror what previously occurred in
American bridge and highway standards. American standards were reviewed to provide consistent
guidance on barrier height, determined by risk and not facility type. It is recommended that Australian
bridge design criteria adopt a similar approach by allowing designers to identify the preferred height of
barriers (where they are required) according to the risk conditions.
AGRD-6A recommends 1.4 m-high fences where the severity of the hazard is considered high (for
example, fall from structure into water or rocks) and 1.2 m only where the severity of the hazard is
considered low and there are no contributing features such as tight horizontal bends and downhill
gradients.
The American publication Determination of appropriate railing heights for bicyclists documents a
review of bicycle railing heights in America. This review found 1.4 m railings (that were recommended
up until 1999 in America) were ‘chosen arbitrarily, with no empirical evidence for its defence’ (NCHRP,
2004 p168). The AASHTO Guide for the Development of Bicycle Facilities has required 1.1 m barriers

Fencing and edging treatments for cycling infrastructure
Guideline, Transport and Main Roads, February 2019 36
on paths since 1999; however, like Australia, the requirement for bridges and structures remained at
1.4 m. The most recent review of the AASHTO LRFD Bridge Design Specifications (2017) adopted
1.1 m railing heights for standard situations, consistent with the bicycle guideline. Consistent with the
approach used on bicycle paths, it recommends higher railings in situations where there are
compounding risk factors such as tight turns, reduced visibility and high-speed riders (AASHTO 2017,
Section 13.9.2). It does not, however, recommend higher railing heights for more severe hazards,
under the assumption that vaulting is unlikely unless there are risk factors associated with the path.
Commentary 4: Barriers adjacent to cycle lanes
There are no specific requirements for barriers on bridges adjacent to cycle lanes (AS 5100). Concrete
barriers built to 1050 mm are expected to provide a reasonable level of protection to cyclists; however,
barriers less than this height should not be relied upon for cyclist safety. Cyclists have reported feeling
uncomfortable riding next to 800 mm barriers.
The following incidents involving cyclists and traffic barriers were identified in a brief internet search
into this issue:
• Serious injury – Gold Coast crash – MyGC (26/08/2016)
• Serious injury – Vista (SA), 2014, The Advertiser (27/11/2014)
• Serious injury – Newcastle, 2016, The Herald (01/05/2017)
• Fatality – Goulburn, 2015, The Mercury (03/05/2017).
Higher concrete barriers provide a safer alternative to guardrails where cyclists are using facilities.
Figure A9 – Maydmo simulation of crash where a rider lost control after striking a concrete
kerb and collided with a guardrail
Commentary 5: Kerbs as separation devices on bridges
AGRD-6A requires fences where vertical drops greater than 0.25 m occur within 2.0 m of a path. The
Transport and Main Roads Bridge design and assessment criteria recommends a 0.3 m kerb to
separate shared paths on bridges from traffic lanes where vehicle speeds are less than
70 km/hr (provided the path is not used by schoolchildren). AS 5100 has similar guidance but the

Fencing and edging treatments for cycling infrastructure
Guideline, Transport and Main Roads, February 2019 37
speed limit is 60 km/hr. The Transport and Main Roads Bridge design and assessment criteria may be
putting riders at risk if other risk factors are not considered in recommending this treatment.
For vehicles, the Bridge design and assessment criteria recommends different types of traffic barriers
according to traffic volumes, speeds and site-specific risks. A similar approach could be used to
identify where different cyclist / pedestrian rails are appropriate.
Figure A10 – Photo showing path used by cyclists with a kerb separation to traffic lane
Commentary 6: Cyclist rails
Existing standards (AGRD-6A; Transport and Main Roads Bridge design and assessment criteria)
suggest ‘cyclist deflection rails’ 1.2–1.4 m high. The rails are designed to deflect cyclists away from
fences by making contact between the shoulder and elbow. Connectors between the rails and
balustrade can pose a hazard in themselves, especially to young riders whose heads may be at the
same height. The rails can also reduce the effective width of paths for some users.
Figure A11 – Photo showing separate hand rails for pedestrians and cyclists
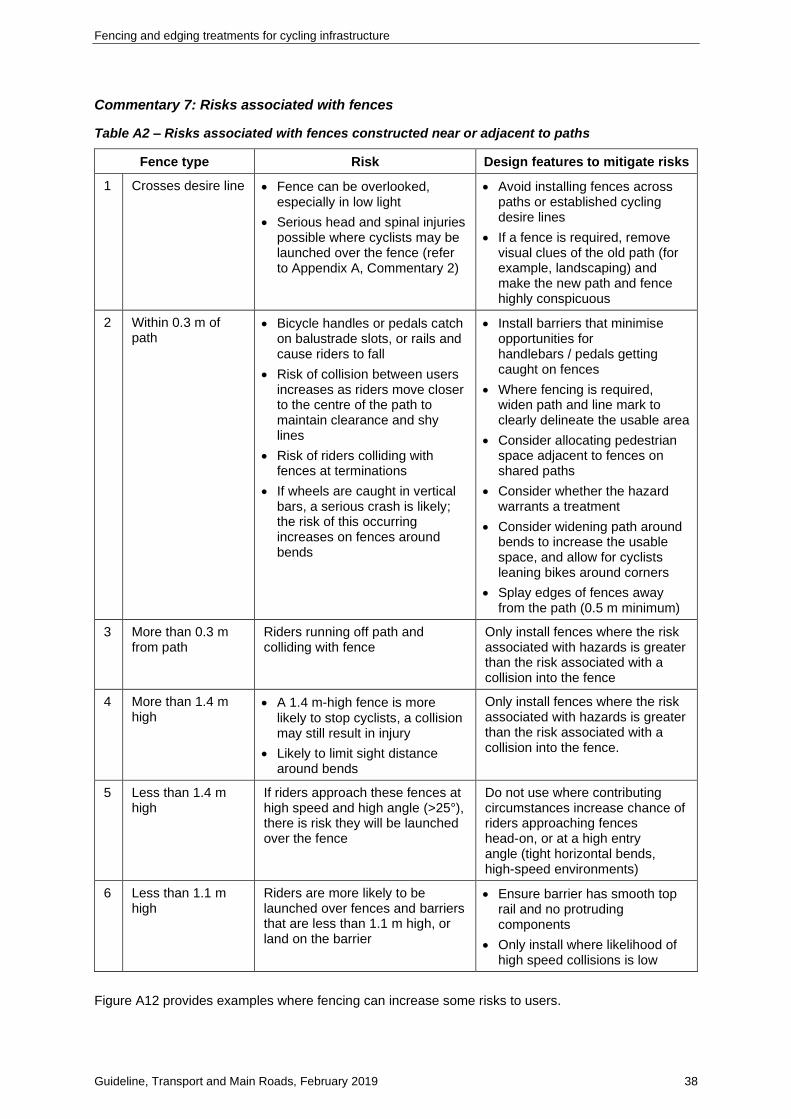
Fencing and edging treatments for cycling infrastructure
Guideline, Transport and Main Roads, February 2019 38
Commentary 7: Risks associated with fences
Table A2 – Risks associated with fences constructed near or adjacent to paths
Fence type Risk Design features to mitigate risks
1 Crosses desire line • Fence can be overlooked, especially in low light
• Serious head and spinal injuries possible where cyclists may be launched over the fence (refer to Appendix A, Commentary 2)
• Avoid installing fences across paths or established cycling desire lines
• If a fence is required, remove visual clues of the old path (for example, landscaping) and make the new path and fence highly conspicuous
2 Within 0.3 m of path
• Bicycle handles or pedals catch on balustrade slots, or rails and cause riders to fall
• Risk of collision between users increases as riders move closer to the centre of the path to maintain clearance and shy lines
• Risk of riders colliding with fences at terminations
• If wheels are caught in vertical bars, a serious crash is likely; the risk of this occurring increases on fences around bends
• Install barriers that minimise opportunities for handlebars / pedals getting caught on fences
• Where fencing is required, widen path and line mark to clearly delineate the usable area
• Consider allocating pedestrian space adjacent to fences on shared paths
• Consider whether the hazard warrants a treatment
• Consider widening path around bends to increase the usable space, and allow for cyclists leaning bikes around corners
• Splay edges of fences away from the path (0.5 m minimum)
3 More than 0.3 m from path
Riders running off path and colliding with fence
Only install fences where the risk associated with hazards is greater than the risk associated with a collision into the fence
4 More than 1.4 m high
• A 1.4 m-high fence is more likely to stop cyclists, a collision may still result in injury
• Likely to limit sight distance around bends
Only install fences where the risk associated with hazards is greater than the risk associated with a collision into the fence.
5 Less than 1.4 m high
If riders approach these fences at high speed and high angle (>25°), there is risk they will be launched over the fence
Do not use where contributing circumstances increase chance of riders approaching fences head-on, or at a high entry angle (tight horizontal bends, high-speed environments)
6 Less than 1.1 m high
Riders are more likely to be launched over fences and barriers that are less than 1.1 m high, or land on the barrier
• Ensure barrier has smooth top rail and no protruding components
• Only install where likelihood of high speed collisions is low
Figure A12 provides examples where fencing can increase some risks to users.
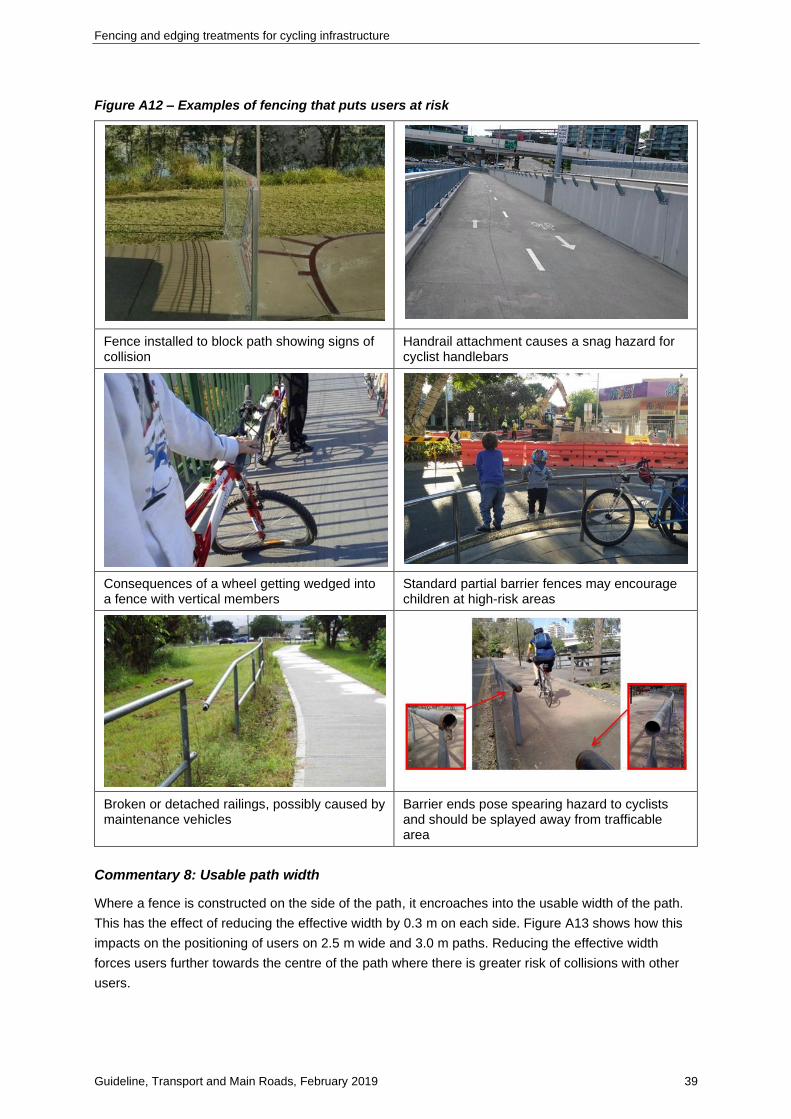
Fencing and edging treatments for cycling infrastructure
Guideline, Transport and Main Roads, February 2019 39
Figure A12 – Examples of fencing that puts users at risk
Fence installed to block path showing signs of collision
Handrail attachment causes a snag hazard for cyclist handlebars
Consequences of a wheel getting wedged into a fence with vertical members
Standard partial barrier fences may encourage children at high-risk areas
Broken or detached railings, possibly caused by maintenance vehicles
Barrier ends pose spearing hazard to cyclists and should be splayed away from trafficable area
Commentary 8: Usable path width
Where a fence is constructed on the side of the path, it encroaches into the usable width of the path.
This has the effect of reducing the effective width by 0.3 m on each side. Figure A13 shows how this
impacts on the positioning of users on 2.5 m wide and 3.0 m paths. Reducing the effective width
forces users further towards the centre of the path where there is greater risk of collisions with other
users.

Fencing and edging treatments for cycling infrastructure
Guideline, Transport and Main Roads, February 2019 40
Providing an offset between the path and the fence, or rearranging the space so pedestrians are on
the fence side, would reduce risk to cyclists in the example shown in Figure A13.
Figure A13 – Photo from AGRD-6B not consistent with current guidance which recommends
offsets between paths and fences
Figure A14 –Cyclist travelling downhill has positioned himself on the centre of the path away
from the fence, which remains a snag hazard for children

Fencing and edging treatments for cycling infrastructure
Guideline, Transport and Main Roads, February 2019 41
Figure A15 – Diagram showing cyclist envelope and far left ride line with and without a fence
Figure A16 – Shared path and bicycle path operation before and after installation of fences
AGRD, Adopted from AGRD, Figure A2
*Assumes fences (yellow lines) reduce cyclist operating space by 0.3 m and pedestrian operating space by 0 m

Fencing and edging treatments for cycling infrastructure
Guideline, Transport and Main Roads, February 2019 42
Appendix B: Risks assessment worksheet examples
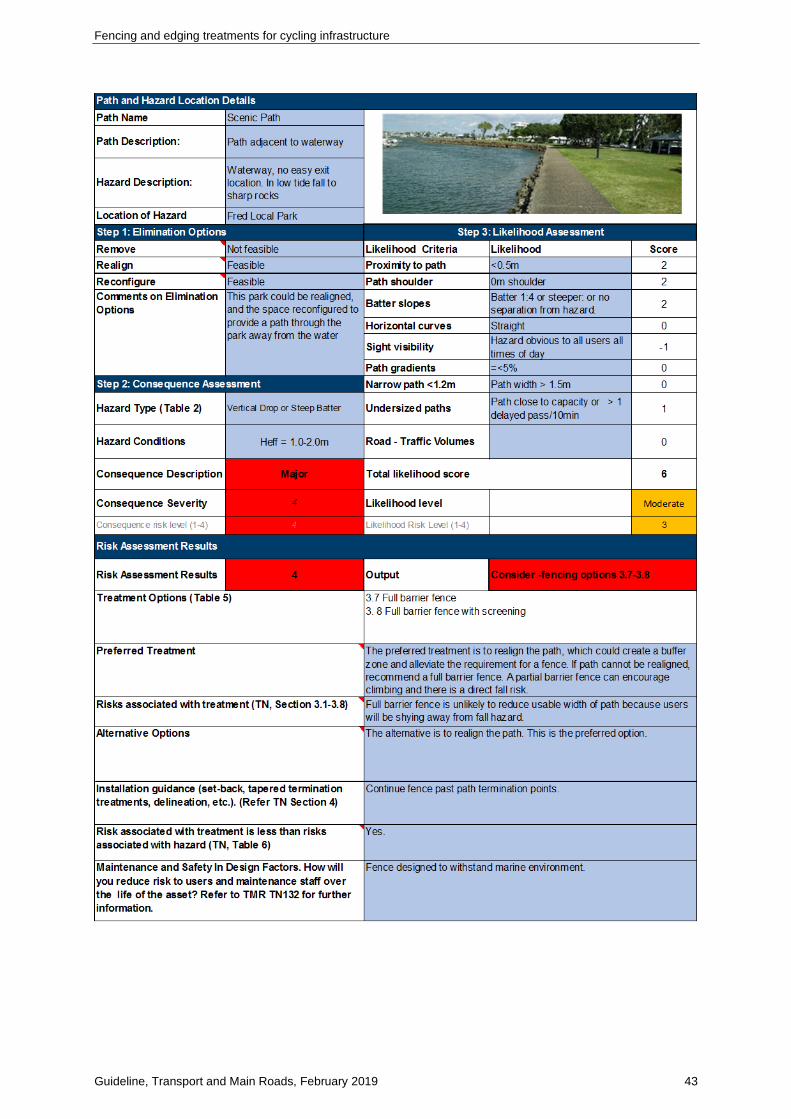
Fencing and edging treatments for cycling infrastructure
Guideline, Transport and Main Roads, February 2019 43

Fencing and edging treatments for cycling infrastructure
Guideline, Transport and Main Roads, February 2019 44