growth in vietnam, 2004-2012: who has benefitted most?
DESCRIPTION
Growth in Vietnam, 2004-2012: Who Has Benefitted Most?. Reena Badiani -Magnusson World Bank and Loren Brandt University of Toronto. Objectives. L ook at growth in incomes and distributive outcomes between 2004-2012 using the VHLSS Several key questions: - PowerPoint PPT PresentationTRANSCRIPT
Growth in Vietnam, 2004-2012: Who Has Benefitted Most?
Reena Badiani-MagnussonWorld Bank
andLoren Brandt
University of Toronto
Objectives• Look at growth in incomes and distributive outcomes
between 2004-2012 using the VHLSS
• Several key questions:– Where is the growth in incomes coming from?– What is the link between this growth and distributive outcomes? – What role are age, educational background and location playing
in sorting households into the most rapidly growing activities?– Who has been hurt by the post-IFC slowdown?

Preliminary Findings (focus on rural here)
• Ongoing structural change in the economy– Shift from agricultural to non-agricultural– Declining role of family-run businesses, especially participation– Movement into the labor market
• Important role of growth in wage earnings, but segmented• Urban: more highly skilled service sector jobs• Rural: less skilled jobs in manufacturing
• Critical role of labor markets in intermediating flows between agricultural and non-agriculture, and the countryside and the cities
• Rapid manufacturing sector wage growth playing equalizing role in countryside and helping to offset declining role of agriculture; agriculture should not be ignored however
• Geography matters:– Sub-regional differences in rise of manufacturing; – Critical differences between North and South in growth in agriculture
• Education increasingly important, especially at the bottom• Overall, modest rise in inequality: decline in fortunes at the bottom offset by rising
middle

Distribution of Income, Vietnam
0.0
0002.0
0004.0
0006.0
0008.0
001
Density
0 20000 40000 60000Income per capita, spatially deflated using Gibson (2012)
2004
2010
2012
kernel = epanechnikov, bandwidth = 836.7920
Income in 2004, 2010 and 2012

0.0
000
2.00
00
4.00
00
6.00
00
8.00
01
De
nsi
ty
0 20000 40000 60000Income per capita, spatially deflated using Gibson (2012)
2004
2010
2012
kernel = epanechnikov, bandwidth = 712.7532
Rural Incomes in 2004, 2010 and 2012

Measures of Incomes and Distribution
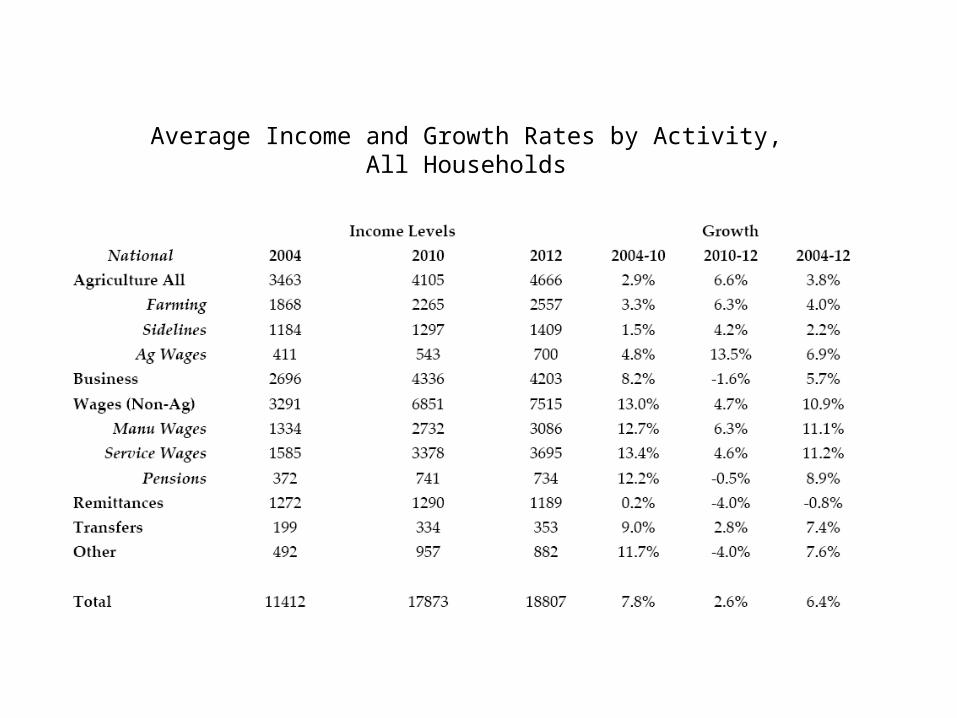
Average Income and Growth Rates by Activity,All Households
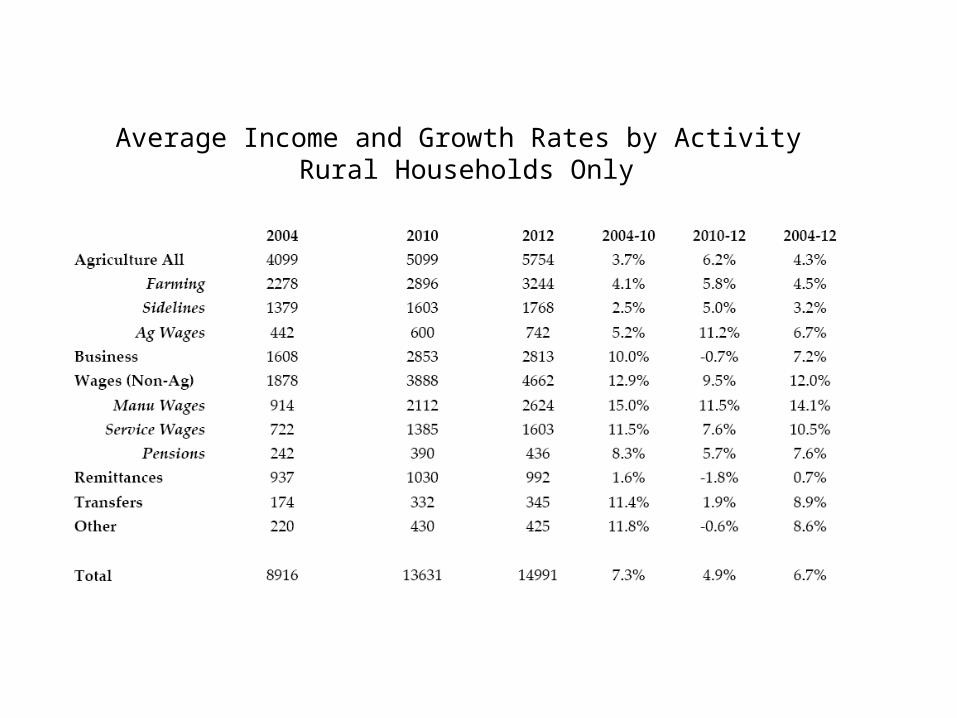
Average Income and Growth Rates by Activity Rural Households Only
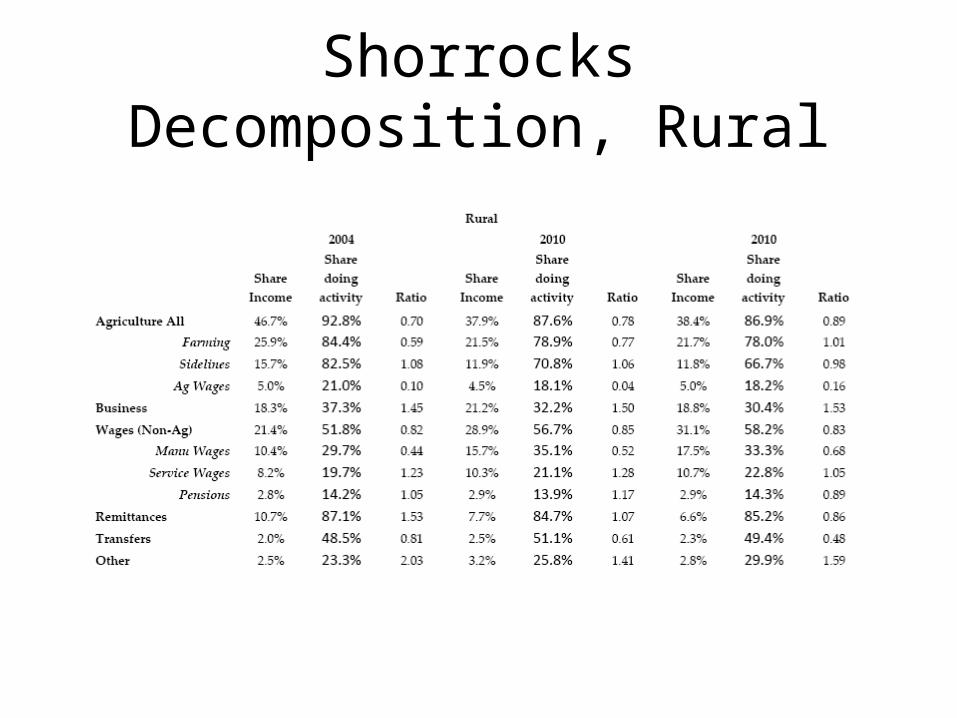
Shorrocks Decomposition, Rural

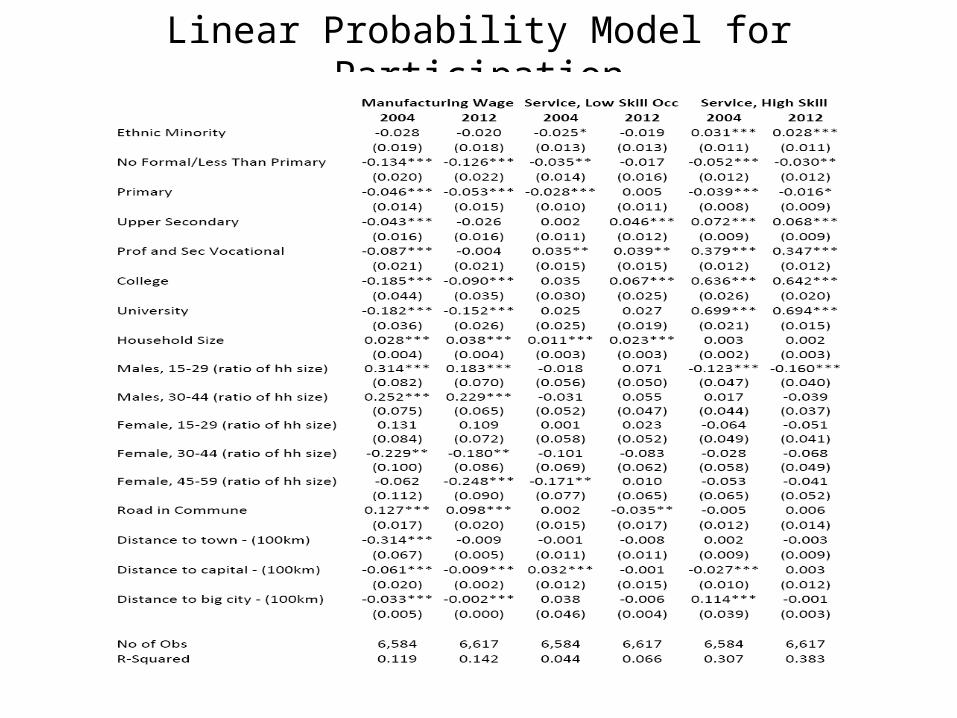
Linear Probability Model for Participation

Summary: Participation Regressions
• Lower secondary education increases likelihood of working in manufacturing relative to primary or below
• Males/females 15-29 much more likely in mfg• Market access matters for mfg
– Paved road in commune – Distance to towns and cities
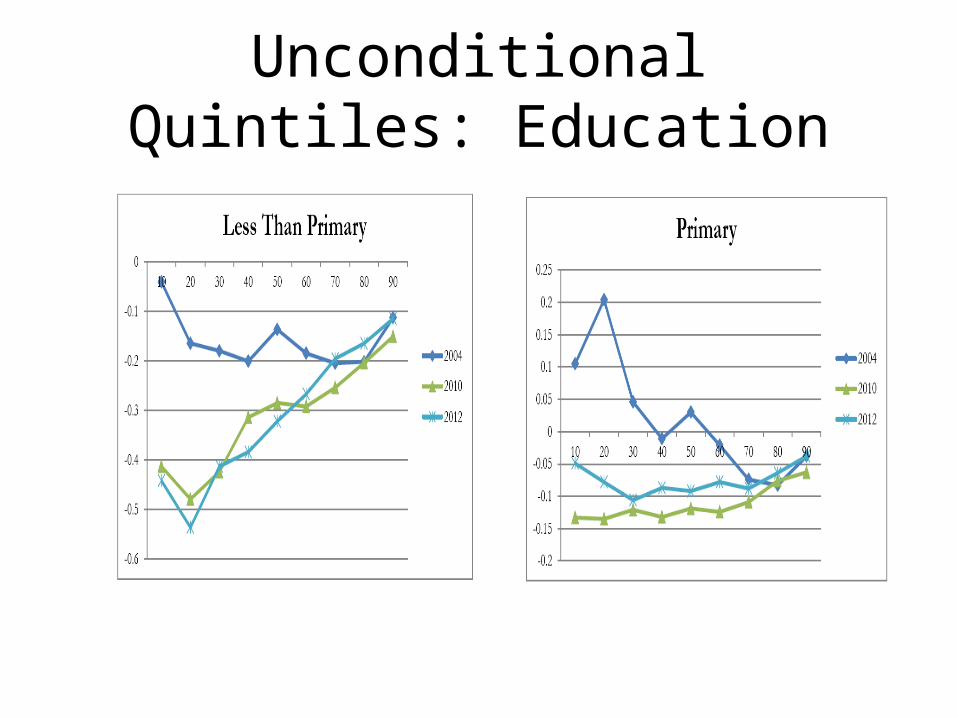
Unconditional Quintiles: Education
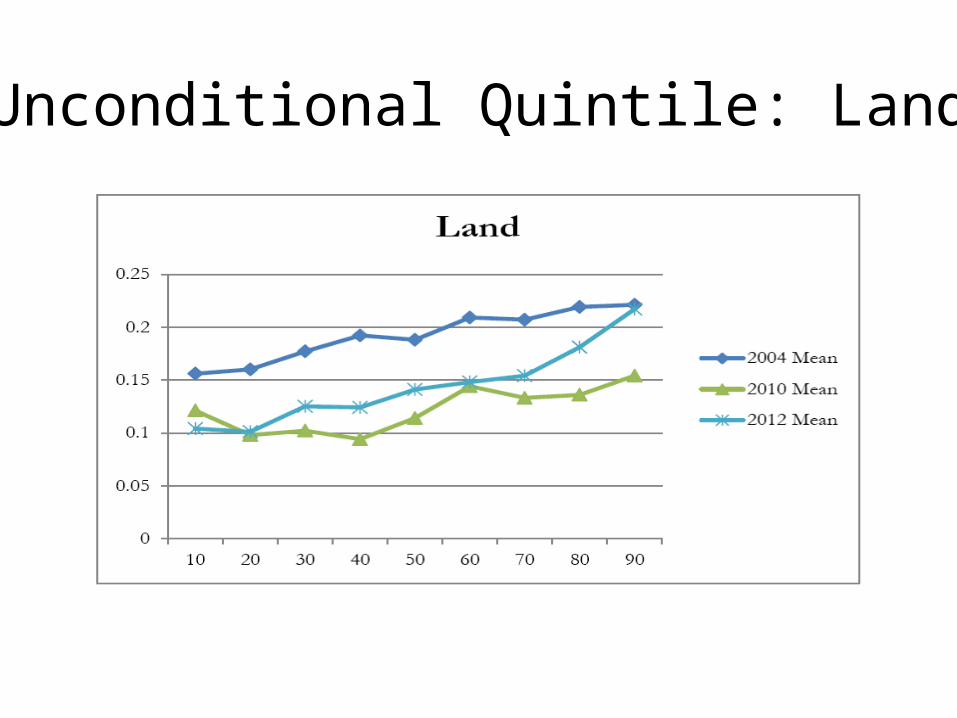
Unconditional Quintile: Land
Final Thoughts
• Need to sort through transitory versus permanent changes in distribution
• Functioning of labor markets increasingly important; same is true for land
• Can’t ignore agriculture and its role in the process of structural transformation
• Lot more to do!