grow fiscal year 2013 earnings webcast
TRANSCRIPT

usfunds.com 1.800.US.FUNDS August 29, 2013 • 13-350
GROW Fiscal Year 2013 Earnings Webcast Frank Holmes, CEO and Chief Investment Officer
Susan McGee, President and General Counsel
Lisa Callicotte, Chief Financial Officer
Susan Filyk, Investor Relations

www.usfunds.com August 2013 13-350 2
Today’s Presenters
Frank Holmes Susan McGee Lisa Callicotte Susan Filyk

www.usfunds.com August 2013 13-350
Forward-Looking Statements
3
During this webcast we may make forward-looking statements about our relative business outlook. Any forward-looking statements and all other statements made during this webcast that don’t pertain to historical facts are subject to risks and uncertainties that may materially affect actual results. Please refer to our press release and the corresponding Form 10-K filing for more detail on factors that could cause actual results to differ materially from any described today in forward-looking statements. Any such statements are made as of today, and U.S. Global Investors accepts no obligation to update them in the future.

www.usfunds.com August 2013 13-350
About U.S. Global Investors (GROW)
A boutique publicly listed investment adviser specializing in gold, natural resources and emerging markets opportunities around the world.
4

www.usfunds.com August 2013 13-350
GROW Strengths
Go-to stock for exposure to emerging markets and resources
Debt-free, strong balance sheet with a reflexive cost structure Monthly dividend and return on equity discipline
5

www.usfunds.com August 2013 13-350
Top Institutional Holders of GROW
6
1. Royce and Associates 16%
2. Financial and Investment 14% Management Group
3. Perritt Capital Management 4%
4. The Vanguard Group 4%
5. BlackRock Fund Advisors 3%
Percentage of shares outstanding as of 6/30/2013 Source: FactSet Data Systems

www.usfunds.com August 2013 13-350
GROW Dividends — Paid Monthly
7
*At share price of $2.11 as of 6/28/2013

www.usfunds.com August 2013 13-350
Share Repurchase Program in Motion
The board approved a repurchase of up to $2.75 million of its outstanding common stock on the open market through calendar year 2013
As of June 30, 2013, the company repurchased 55,052 class A shares at an average price of $3.15 using cash of $173,608
Algorithm is used to buy back shares on down days, in accordance with all applicable rules and regulations that restrict amounts and times of repurchases
May be suspended or discontinued at any time
8

www.usfunds.com August 2013 13-350
Strategic Partnership with Galileo
9
GROW completed its investment in Galileo Global Equity Advisors by purchasing 50% of issued and outstanding shares*
Toronto-based company, 320 million Canadian dollars in AUM + growing Accretive to GROW 5-Star fund 2013 Lipper fund award for best small/mid cap over 5 years
*Effective 3/31/13 The Galileo Funds are not offered for sale in the United States.

www.usfunds.com August 2013 13-350
Quarterly Average Assets Under Management
10

www.usfunds.com August 2013 13-350
Asset Breakdown
11
Data for SEC-registered funds as of June 28, 2013.

www.usfunds.com August 2013 13-350
Balance Sheet Strength – No Debt
12

www.usfunds.com August 2013 13-350
Annual Earnings Per Share
13

www.usfunds.com August 2013 13-350
Annual Pre-Tax Profit Margin
14

www.usfunds.com August 2013 13-350 15
Growth 3 Year Average
EPS Growth
Value 3 Year Average
Return on Equity
Income Dividend
Yield
GROW -130.6% 7.5% 1.9%
Peers* 5.1% 18.9% 2.4%
GROW Peer Comparison
Dividend yields calculated as of 8/23/2013. All peer data as of 6/30/2013 except for Eaton Vance (7/31/2013). * Median calculations based from quarterly results ended 6/30/2013 by Affiliated Managers Group Inc., AllianceBernstein Holding L.P., Blackrock Inc., Calamos Asset Management Inc., Cohen & Steers Inc., Eaton Vance Corp., Hennessy Advisors Inc., Federated Investors Inc., Franklin Resources Inc., GAMCO Investors Inc., INVESCO Ltd., Janus Capital Group Inc., Legg Mason Inc., Pzena Investment Management Inc., T. Rowe Price Group Inc., Virtus Investment Partners Inc., Waddell & Reed Financial Inc. and Westwood Holdings Group Inc.
Source: FactSet

www.usfunds.com August 2013 13-350
Company Snapshot
16
10-Year Annualized
GROW 10.64% Russell
2000 Index 9.49%
NASDAQ: GROW Price on 6/28/13: $2.11
Market Cap: $28.3 million 52-wk Range: $2.11 - $6.32

www.usfunds.com August 2013 13-350
GROW Performance — Past Twelve Months Correlated with Gold Stocks
17
Past performance does not guarantee future results.

www.usfunds.com August 2013 13-350
GROW: Best Performer Since June 30
18

www.usfunds.com August 2013 13-350
Massive Liquidation of Financial Gold
19

www.usfunds.com August 2013 13-350
Gold Shifts from Weak Hands to Strong Hands
20

www.usfunds.com August 2013 13-350
Gold Companies Are Getting Leaner with Write-Downs of $23.1 Billion, which Has Impacted Gold Equity Funds
21

www.usfunds.com August 2013 13-350
Fear of QE3 Slowing Triggered Massive Outflows in Funds
22
Ben Bernanke

www.usfunds.com August 2013 13-350
Although Yields on Long-Term Bonds and Mortgages Rose, Money Markets Remained Unchanged
23

www.usfunds.com August 2013 13-350
Formation of Capital Model is Changing Fund Flows and Growth in Assets 2008-2012
24
Source: Investment Company Institute

www.usfunds.com August 2013 13-350
Growth Strategy for 2013
1. Acquire assets
2. Streamline costs of products and services
3. Reposition products with a suite of ETFs
25

www.usfunds.com August 2013 13-350
Streamline and Reposition Products and Services
The costs for the Adviser to maintain the cap on fund expenses for small funds and money market funds are becoming a financial burden and distraction for the Adviser. Costs are now at an annualized rate of about
$600,000 or $50,000 per month.
26

www.usfunds.com August 2013 13-350
Revenue per Employee
27
U.S. Global Investors T. Rowe Price Janus Funds
$280,000 $593,000 $740,000
Losing Money Making Money Making Money
Important Metric to Consider in Streamlining and Reorganizing Products and Services

www.usfunds.com August 2013 13-350
Additional Considerations in Streamlining and Repositioning Products and Services
28
Customer Needs 1940 Act State Law Costs

www.usfunds.com August 2013 13-350
Streamlining and Reorganizing our Products and Services
Liquidate U.S. Treasury Securities Cash Fund Convert U.S. Government Securities Savings
Fund to an Ultra-Short Government Bond Fund Merge Tax Free Fund into Near-Term
Tax Free Fund Partner with U.S. Bancorp for Transfer
Agency Services Increase Administrative Fee
29

www.usfunds.com August 2013 13-350
Cost and Cash Flow Benefit to the Adviser from Streamlining Products and Services
Estimated Cost Estimated Cash Flow Benefit $620,000 $1.2 Million
30

www.usfunds.com August 2013 13-350
A Consistent Track Record of Achievements Near-Term Tax Free (NEARX)
31
Lipper ratings for Preservation reflect funds’ historical loss avoidance relative to other funds within the same asset class, as of 6/30/2013. Preservation ratings are relative, rather than absolute, measures, and funds named Lipper Leaders for Preservation may still experience losses periodically; those losses may be larger for equity and mixed equity funds than for fixed income funds. Lipper ratings for Tax Efficiency reflect funds’ historical success in postponing taxable distributions relative to peers as of 6/30/2013. Tax Efficiency offers no benefit to in tax-sheltered accounts such as investors retirement plans. Past performance does not guarantee future results.

www.usfunds.com August 2013 13-350 32
NEARX – Need Steady Growth for Your Cash?
Many investors have been seeking higher yields from short-term bond funds. The Near-Term Tax Free Fund may help you earn more, lower your tax bill and reduce risk in your portfolio through diversification.
The chart illustrates the performance of a hypothetical $10,000 investment made in the fund during the depicted time frame. Figures include reinvestment of capital gains and dividends, but the performance does not include the effect of any direct fees described in the fund s prospectus which, if applicable, would lower your total returns.

www.usfunds.com August 2013 13-350
NEARX – A Track Record of Performance
33
Past performance is no guarantee of future results.
The Near-Term Tax Free Fund has generated consistent positive annual total returns (yield + appreciation) for investors for over 10 years in a row.

www.usfunds.com August 2013 13-350
NEARX – Seeks Stability in its $2 Share Price
34
In recent years, many investors have sought shelter from the volatility of the stock market. To provide stability, the fund seeks minimal fluctuation in its share price of approximately $2.

www.usfunds.com August 2013 13-350
NEARX – Credit Quality Is Important
35
The Near-Term Tax Free Fund invests at least 80 percent of its net assets in investment grade municipal securities. At the time of purchase for the fund s portfolio, the ratings on the bonds must be one of the four highest ratings by Moody s Investors Service or Standard & Poor s Corporation (or, if not rated, determined to be of comparable quality).

www.usfunds.com August 2013 13-350 36
NEARX – Compare and Discover Opportunities to Improve Your Yield
With interest rates at 50-year lows, many investors need alternatives to bank CDs.
NEARX yields as of 06/30/13. CD rates from Bankrate.com national average as of 07/16/13.

www.usfunds.com August 2013 13-350
Couch Potato Portfolio Near-Term Tax Free Fund (NEARX) and All American Equity Fund (GBTFX)
37
The chart illustrates the performance of a hypothetical $10,000 investment made in the funds and strategy during the depicted time frame. Figures include reinvestment of capital gains and dividends, but the performance does not include the effect of any direct fees described in the fund’s prospectus (e.g., short-term trading fees) which, if applicable, would lower your total returns. This hypothetical portfolio is presented for educational and illustrative purposes only and is not a recommendation to engage in any particular investment strategy. Past performance does not guarantee future results.

www.usfunds.com August 2013 13-350
Income Statement – Financial Analysis
38
Lisa Callicotte CFO

www.usfunds.com August 2013 13-350 39
Income Statement

www.usfunds.com August 2013 13-350 40
Income Statement

www.usfunds.com August 2013 13-350
Income Statement
41

www.usfunds.com August 2013 13-350 42
Balance Sheets

www.usfunds.com August 2013 13-350 43
Balance Sheets

www.usfunds.com August 2013 13-350
Significant Events
44
Susan McGee President and General Counsel

www.usfunds.com August 2013 13-350 45
Performance and Results Oriented
Winner of 29 Lipper performance awards, certificates and top rankings since 2000
(Four out of 13 U.S. Global Investors Funds received Lipper performance awards from 2005 to 2008, six out of 13 received certificates from 2000 to 2007,
and two out of 13 received top rankings from 2009 to 2010.)
Investment leadership results in performance

www.usfunds.com August 2013 13-350
Fund Recognition: 2 Funds in the Top 12 Percent for 10-Year Period
46

www.usfunds.com August 2013 13-350
Fund Recognition: Lipper Leaders
47
Lipper ratings for Preservation reflect funds’ historical loss avoidance relative to other funds within the same asset class, as of 6/30/2013. Preservation ratings are relative, rather than absolute, measures, and funds named Lipper Leaders for Preservation may still experience losses periodically; those losses may be larger for equity and mixed equity funds than for fixed income funds. Lipper ratings for Tax Efficiency reflect funds’ historical success in postponing taxable distributions relative to peers as of 6/30/2013.Tax Efficiency offers no benefit to in tax-sheltered accounts such as investors retirement plans. Past performance does not guarantee future results.
Global Emerging Markets Fund
Near-Term Tax Free Fund

www.usfunds.com August 2013 13-350 48
Based on Risk-Adjusted Return

www.usfunds.com August 2013 13-350
Focus on Education
49
43 MFEA STAR Awards for Excellence in Education

www.usfunds.com August 2013 13-350
Branding – Education
50
Investor Alert and Advisor Alert are key communication tools
Our original, award-winning educational content is in high demand from investors via email, website, social media platforms, apps

www.usfunds.com August 2013 13-350 51
Branding – Education
E-mail subscriptions for Frank Talk blog posts continue to grow Syndication continues to expand reach through commentaries, infographics, interactives and slideshows “World of Gold” presentation from Agora was posted on Business Insider on August 14, receiving 184,500 page views to date Business Insider posts “28 Charts Every Gold Investor Must See” from U.S. Global presentation, garnering nearly 300,000 hits

www.usfunds.com August 2013 13-350
Branding and Marketing of GROW
52
13 TV/Radio/Podcasts 37 Total Interviews 1,078 Web mentions
23 Frank Talk blog entries 124 Newsletter
recommendations
Data from 3/31/2013 – 6/30/2013
CNBC Reuters
Bloomberg

www.usfunds.com August 2013 13-350
Branding and Marketing of GROW Viral Marketing Sucess
53
Tweeted to his loyal 600,000 readers

www.usfunds.com August 2013 13-350 54
Managing Expectations — Yearly Volatility The Math
View the presentation Anticipate Before You Participate at www.usfunds.com/investor-resources/publications/research
Rolling 1 Year
U.S. Global Investors (GROW) 116.3% NYSE Arca Gold BUGS Index (HUI) 35.7%
WTI Crude Oil 34.8%
MSCI Emerging Markets (MXEF) 30.6%
S&P 500 Index (SPX) 17.5%
Gold Bullion 15.2%
12-month rolling volatility of price action over 10-year period
Standard Deviation (as of 6/30/13) based on 10-Year Data

www.usfunds.com August 2013 13-350 55
Card Counting Allowed Managing Expectations — Anticipate Before You Participate
Measuring Monthly Volatility Number of
+10% Moves Number of
-10% Moves Frequency of ±10% Moves
U.S. Global Investors (GROW) 727 622 52% NYSE Arca Gold BUGS Index (HUI) 468 323 30%
WTI Crude Oil 401 276 26%
MSCI Emerging Markets (MXEF) 135 174 12%
Gold Bullion 126 71 8%
S&P 500 Index (SPX) 33 68 4%
Calculated over rolling 20-trading day periods. Based on approximately 2,550 total occurrences over the past 10 years as of 6/30/2013.
www.usfunds.com August 2013 13-350
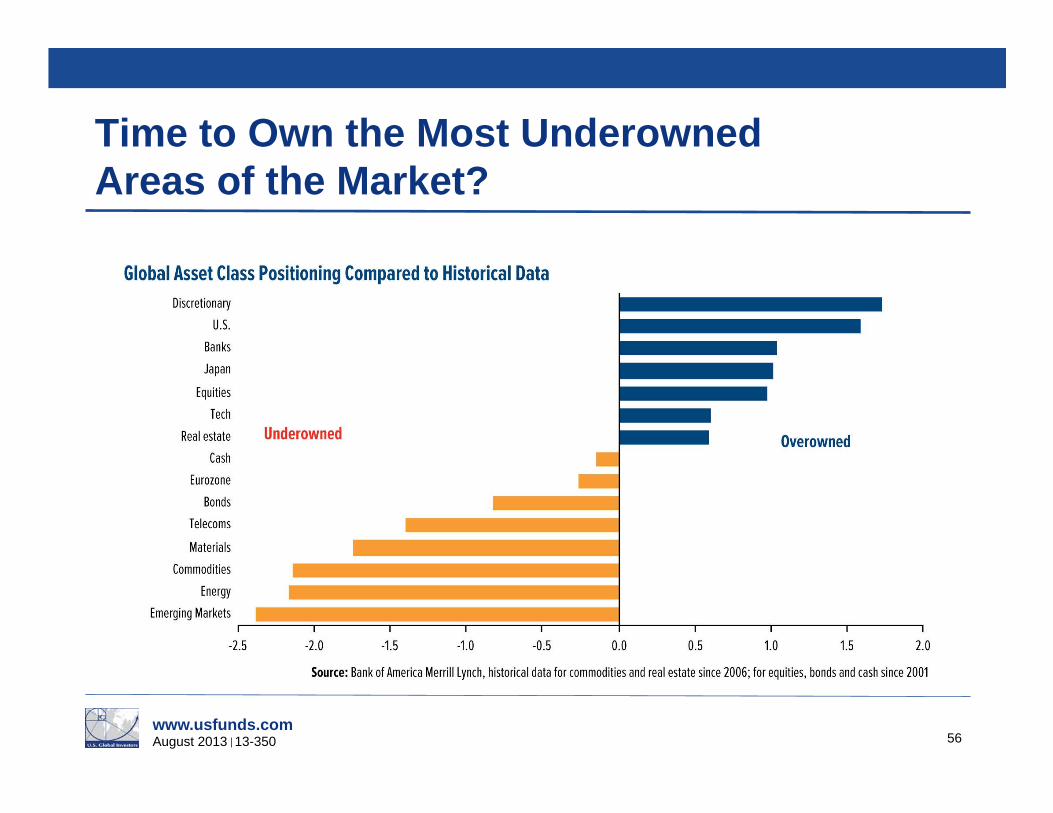
Time to Own the Most Underowned Areas of the Market?
56

www.usfunds.com August 2013 13-350
Managing Expectations — Year-over-Year Rolling Oscillator
57

www.usfunds.com August 2013 13-350
Even After a 2 Year Gold Selloff, Investors Are Ahead
58
The chart illustrates the performance of a hypothetical $10,000 investment made in the funds and strategy during the depicted time frame. Figures include reinvestment of capital gains and dividends, but the performance does not include the effect of any direct fees described in the fund’s prospectus (e.g., short-term trading fees) which, if applicable, would lower your total returns. This hypothetical portfolio is presented for educational and illustrative purposes only and is not a recommendation to engage in any particular investment strategy. Past performance does not guarantee future results.

www.usfunds.com August 2013 13-350
Gold Demand Drivers
59
Elvis Presley

www.usfunds.com August 2013 13-350
Follow the Money — Unprecedented Cash Injections from Central Banks
60
www.usfunds.com August 2013 13-350
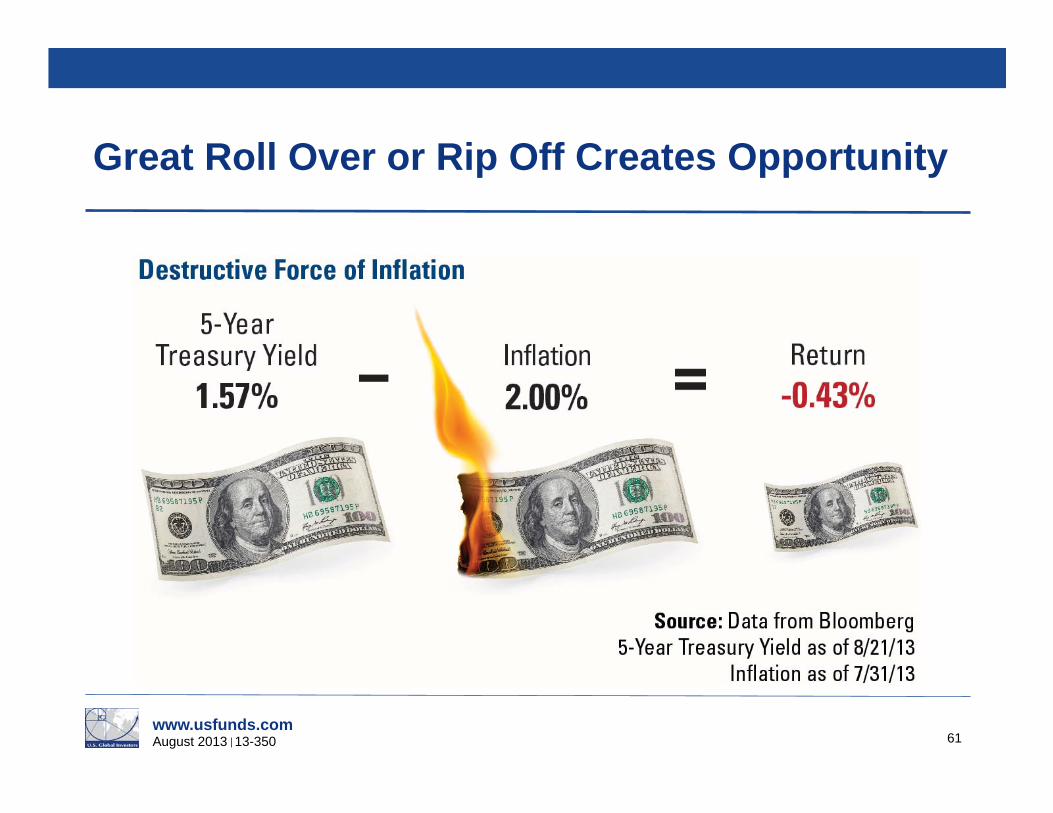
Great Roll Over or Rip Off Creates Opportunity
61

www.usfunds.com August 2013 13-350
Central Banks Remain Net Buyers of Gold
62

www.usfunds.com August 2013 13-350
Low Real Interest Rates Historically Fuel Gold, Silver and Oil
63
Tipping Point for Gold 2%
Gold & silver perform well in low or negative real interest rate environments
+2%

www.usfunds.com August 2013 13-350
Gold’s Ascent Doesn’t Look Like a Bubble
64
www.usfunds.com August 2013 13-350
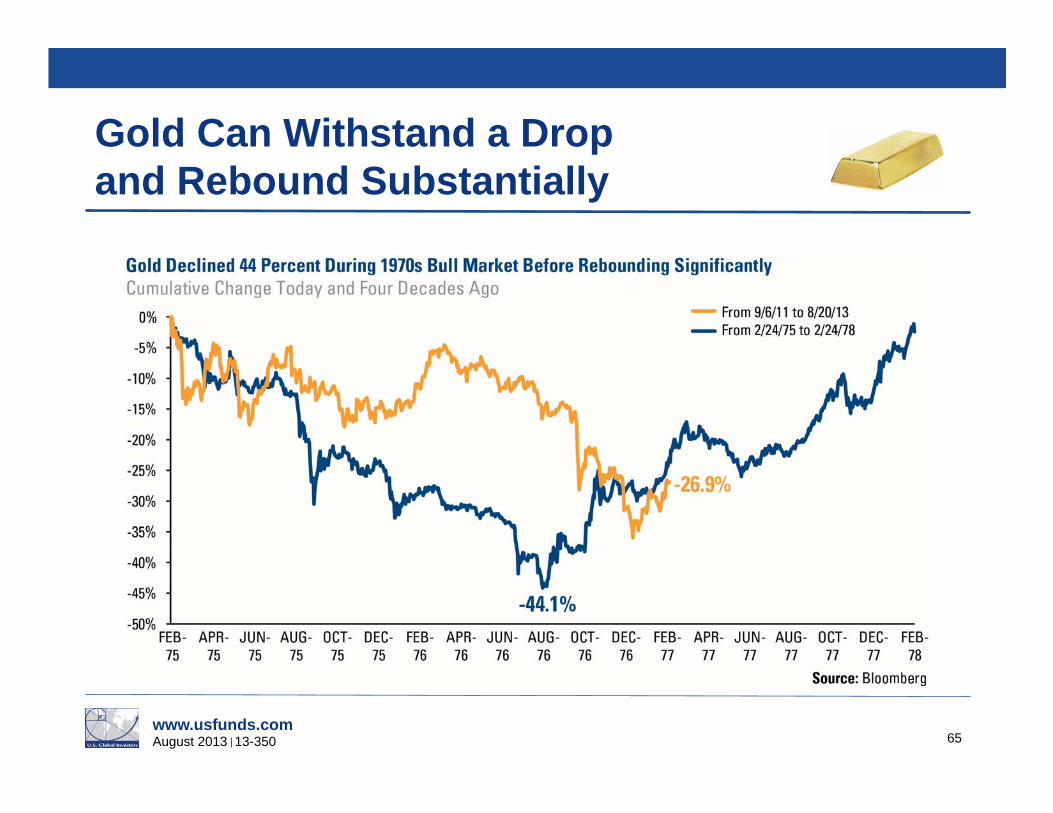
Gold Can Withstand a Drop and Rebound Substantially
65

www.usfunds.com August 2013 13-350
Gold Would Need to Be Much Higher to Cover U.S. Money Supply
66

www.usfunds.com August 2013 13-350
Driver: The Love Trade
67

www.usfunds.com August 2013 13-350
Holidays Drive Gold Demand
68

www.usfunds.com August 2013 13-350
China’s Rush to Buy Gold on Lower Prices
69
August 9, 2013

www.usfunds.com August 2013 13-350
Gold Stocks Offer Higher Dividend Yields
70

www.usfunds.com August 2013 13-350
Price Reversal — Chinese Stocks Undervalued
71
Chinese Stocks Looking Like a Bargain October 22, 2012

www.usfunds.com August 2013 13-350
The New Camelot
72
President Xi Jinping and Peng Liyuan

www.usfunds.com August 2013 13-350
Chinese Copper Imports Rise for Third Straight Month
73
Source: Weldon

www.usfunds.com August 2013 13-350
Chinese Crude Oil Imports Surge to New Record High
74
Source: Weldon

www.usfunds.com August 2013 13-350
China’s Changing Urban Consumption
75
How they spend it in China February 13, 2013

www.usfunds.com August 2013 13-350
Only One-Third of China’s Population Holds an Urban Hukou
76

www.usfunds.com August 2013 13-350 77
A Case for Commodities in a Rising Rate Environment
Download Your Free Copy of Our New
Special Commodities Report at usfunds.com
Also available on the
“Resources” tab on your webcast screen.

www.usfunds.com August 2013 13-350 78

www.usfunds.com August 2013 13-350
Fund Performance
79

www.usfunds.com August 2013 13-350
Disclosures
Please consider carefully a fund’s investment objectives, risks, charges and expenses. For this and other important information, obtain a fund prospectus by visiting www.usfunds.com or by calling 1-800-US-FUNDS (1-800-873-8637). Read it carefully before investing. Distributed by U.S. Global Brokerage, Inc. Unlike bank savings accounts, an investment in a municipal bond fund is neither insured nor guaranteed by the Federal Deposit Insurance Corporation or any other government agency. Foreign and emerging market investing involves special risks such as currency fluctuation and less public disclosure, as well as economic and political risk. By investing in a specific geographic region, a regional fund’s returns and share price may be more volatile than those of a less concentrated portfolio. Gold, precious metals, and precious minerals funds may be susceptible to adverse economic, political or regulatory developments due to concentrating in a single theme. The prices of gold, precious metals, and precious minerals are subject to substantial price fluctuations over short periods of time and may be affected by unpredicted international monetary and political policies. We suggest investing no more than 5% to 10% of your portfolio in these sectors. The Emerging Europe Fund invests more than 25% of its investments in companies principally engaged in the oil & gas or banking industries. The risk of concentrating investments in this group of industries will make the fund more susceptible to risk in these industries than funds which do not concentrate their investments in an industry and may make the fund’s performance more volatile. Because the Global Resources Fund concentrates its investments in a specific industry, the fund may be subject to greater risks and fluctuations than a portfolio representing a broader range of industries.
80

www.usfunds.com August 2013 13-350
Disclosures
Tax-exempt income is federal income tax free. A portion of this income may be subject to state and local income taxes, and if applicable, may subject certain investors to the Alternative Minimum Tax as well. Each tax free fund may invest up to 20% of its assets in securities that pay taxable interest. Income or fund distributions attributable to capital gains are usually subject to both state and federal income taxes. Bond funds are subject to interest-rate risk; their value declines as interest rates rise. The tax free funds may be exposed to risks related to a concentration of investments in a particular state or geographic area. These investments present risks resulting from changes in economic conditions of the region or issuer. Morningstar Ratings are based on risk-adjusted return. The Morningstar Rating for a fund is derived from a weighted-average of the performance figures associated with its three-, five- and ten-year (if applicable) Morningstar Rating metrics. Past performance does not guarantee future results. For each fund with at least a three-year history, Morningstar calculates a Morningstar Rating™ based on a Morningstar Risk-Adjusted Return measure that accounts for variation in a fund’s monthly performance (including the effects of sales charges, loads, and redemption fees), placing more emphasis on downward variations and rewarding consistent performance. The top 10% of funds in each category receive 5 stars, the next 22.5% receive 4 stars, the next 35% receive 3 stars, the next 22.5% receive 2 stars and the bottom 10% receive 1 star. (Each share class is counted as a fraction of one fund within this scale and rated separately, which may cause slight variations in the distribution percentages.) The Lipper ratings are subject to change every month and are based on an equal-weighted average of percentile ranks for the Preservation and Tax Efficiency over three-, five-, and ten-year periods (if applicable). The highest 20% of funds in each peer group are named Lipper Leader or a score of 5, the next 20% receive a score of 4, the middle 20% are scored 3, the next 20% are scored 2, and the lowest 20% are scored 1. Near-Term Tax Free Fund, in Lipper’s Short-Intermediate Municipal Debt classification, received the following ratings for the 3-, 5-, and 10-year periods, respectively: Preservation: 5 (4530 funds), 5 (3928 funds) and 5 (2731 funds). Tax Efficiency: 5 (42 funds), 5 (34 funds) and 5 (26 funds). The Global Emerging Markets Fund, in Lipper’s Emerging Markets classification, received the following ratings for the 3- and 5-year periods, respectively. Tax Efficiency: 5 (355 funds) and 5 (259 funds). Lipper ratings are not intended to predict future results, and Lipper does not guarantee the accuracy of this information. More information is available at www.lipperweb.com. Lipper Leader Copyright 2013, Reuters, All Rights Reserved.
81

www.usfunds.com August 2013 13-350 82
Disclosures
It’s important to consider the differences between the Near-Term Tax Free Fund and a Bank CD before investing.
Compare Near-Term Tax Free Fund Bank CD
Type of Investment and Objective Municipal bond fund; seeks current income that is exempt from federal income tax and seeks preservation of capital
Certificate of deposit; entitles the bearer to receive interest
Primary Investments Investment grade municipal bonds with relatively short maturity A promissory note issued by a bank
Stable share price? No, but seeks minimal fluctuations Yes
Withdrawal penalty? No Yes, withdrawal before the maturity date usually incurs a penalty
FDIC insured? No Yes, up to $250,000
The CD interest rate is typically a fixed rate of interest, and payable on a set maturity date. The 30-day yield is used for bond funds, balanced funds, and stock funds. It consists of the interest income the fund pays over a 30-day period, net of expenses, expressed as an annualized percentage of the fund s share price. Tax Equivalent Yield is the before-tax yield you would have to get from a higher-paying but taxable investment to equal the yield from a tax-exempt investment and was computed assuming a 43.4% tax rate.

www.usfunds.com August 2013 13-350
Disclosures
The Nasdaq Composite Index is a capitalization-weighted index of all Nasdaq National Market and SmallCap stocks. The Russell 2000 Index is a U.S. equity index measuring the performance of the 2,000 smallest companies in the Russell 3000. The Russell 3000 Index consists of the 3,000 largest U.S. companies as determined by total market capitalization. The S&P 500 Stock Index is a widely recognized capitalization-weighted index of 500 common stock prices in U.S. companies. The NYSE Arca Gold BUGS (Basket of Unhedged Gold Stocks) Index (HUI) is a modified equal dollar weighted index of companies involved in gold mining. The HUI Index was designed to provide significant exposure to near term movements in gold prices by including companies that do not hedge their gold production beyond 1.5 years. The FTSE Gold Mines Index Series encompasses all gold mining companies that have a sustainable and attributable gold production of at least 300,000 ounces a year, and that derive 75% or more of their revenue from mined gold. The Morgan Stanley Commodity Related Index (CRX) is an equal-dollar weighted index of 20 stocks involved in commodity related industries such as energy, non-ferrous metals, agriculture, and forest products. The index was developed with a base value of 200 as of March 15, 1996. The MSCI Emerging Markets Index is a free float-adjusted market capitalization index that is designed to measure equity market performance in the global emerging markets. The NYSE Arca Gold Miners Index is a modified market capitalization weighted index comprised of publicly traded companies involved primarily in the mining for gold and silver. The index benchmark value was 500.0 at the close of trading on December 20, 2002. The Philadelphia Stock Exchange Gold and Silver Index (XAU) is a capitalization-weighted index that includes the leading companies involved in the mining of gold and silver. The S&P/TSX Venture Composite Index is a broad market indicator for the Canadian venture capital market. The index is market capitalization weighted and, at its inception, included 531 companies. A quarterly revision process is used to remove companies that comprise less than 0.05% of the weight of the index, and add companies whose weight, when included, will be greater than 0.05% of the index.
83

www.usfunds.com August 2013 13-350
Disclosures
M1 Money Supply includes funds that are readily accessible for spending. M2 Money Supply is a broad measure of money supply that includes M1 in addition to all time-related deposits, savings deposits, and non-institutional money-market funds. Standard deviation is a measure of the dispersion of a set of data from its mean. The more spread apart the data, the higher the deviation. Standard deviation is also known as historical volatility. The Consumer Price Index (CPI) is one of the most widely recognized price measures for tracking the price of a market basket of goods and services purchased by individuals. The weights of components are based on consumer spending patterns. The Purchasing Manager’s Index is an indicator of the economic health of the manufacturing sector. The PMI index is based on five major indicators: new orders, inventory levels, production, supplier deliveries and the employment environment. Holdings in the U.S. Global Investors Funds mentioned as a percentage of net assets as of 6/30/2013: Anglogold Ashanti (Gold and Precious Metals Fund 0.01%, World Precious Minerals Fund 0.01%); Barrick Gold (Gold and Precious Metals Fund 2.18%, World Precious Minerals Fund 0.12%); BHP Billiton (Global Resources Fund 0.15%); Goldcorp (Global Resources Fund 1.89%, Gold and Precious Metals Fund 0.21%, World Precious Minerals Fund 0.12%); Gold Fields (Gold and Precious Metals Fund 0.01%, World Precious Minerals Fund 0.01%); iShares Russell 2000 ETF 0.00%; Kinross Gold (Gold and Precious Metals Fund 1.00%, World Precious Minerals Fund 0.14%); Michael Kors Holdings Ltd. (Holmes Growth Fund 2.54%); Newcrest Mining (Gold and Precious Metals Fund 1.56%); Newmont Mining (Gold and Precious Metals Fund 2.25%, World Precious Minerals Fund 0.06%); Prada SpA 0.00%; Salvatore Ferragamo SpA (Emerging Europe Fund 0.60%); SPDR Gold Trust (GLD) (Gold and Precious Metals Fund 4.45%, World Precious Minerals Fund 2.59%); SPDR S&P Global Natural Resources ETF 0.00%.
84

www.usfunds.com August 2013 13-350
Disclosures
Investment Objective: The Gold and Precious Metals Fund is an actively managed mutual fund that focuses on gold and precious metals producing companies. The World Precious Minerals Fund is an actively managed fund that focuses on junior and intermediate precious metals exploration companies around the world. The SPDR S&P 500 ETF Trust (SPY) is a passively managed fund that, before expenses, seeks to correspond generally to the price and yield performance of the S&P 500 Index. Liquidity: The Gold and Precious Metals Fund and World Precious Minerals Fund can be purchased or sold at a net asset value (NAV) determined at the end of each trading day. The SPDR S&P 500 ETF can be purchased or sold intraday. These purchases and redemptions may generate brokerage commissions and other charges not reflected in the ETF’s published expense ratio. Safety/Fluctuations of principal/return: Loss of money is a risk of investing in the Gold and Precious Metals Fund, the World Precious Minerals Fund and the SPDR S&P 500 ETF. Shares of the three securities are subject to sudden fluctuations in value. The SPDR S&P 500 ETF may also be subject to bid-ask premiums or discounts to net asset value (NAV) that could adversely affect a shareholder’s actual returns. Tax features: The Gold and Precious Metals Fund and World Precious Minerals Fund intend to make distributions that may be taxed as ordinary income or capital gains. Under current federal law, long-term capital gains for individual investors in the fund are taxed at a maximum rate of 15%. For the SPDR S&P 500 ETF, long-term capital gain distributions will result from gains on the sale or exchange of capital assets held by the fund for more than one year. Any long-term capital gains distributions you receive from a fund are taxable as long-term capital gain regardless of how long you have owned your shares. Long-term capital gains are currently taxed at a maximum of 15%. Information provided here is neither tax nor legal advice and is general in nature. Federal and state laws and regulations are subject to change.
85