full year and fourth-quarter 2016 earnings webcast...
TRANSCRIPT
Confidential 1Confidential 1
——
Full Year and Fourth-Quarter 2016
Earnings Webcast
February 23, 2017
Confidential 2Confidential 2
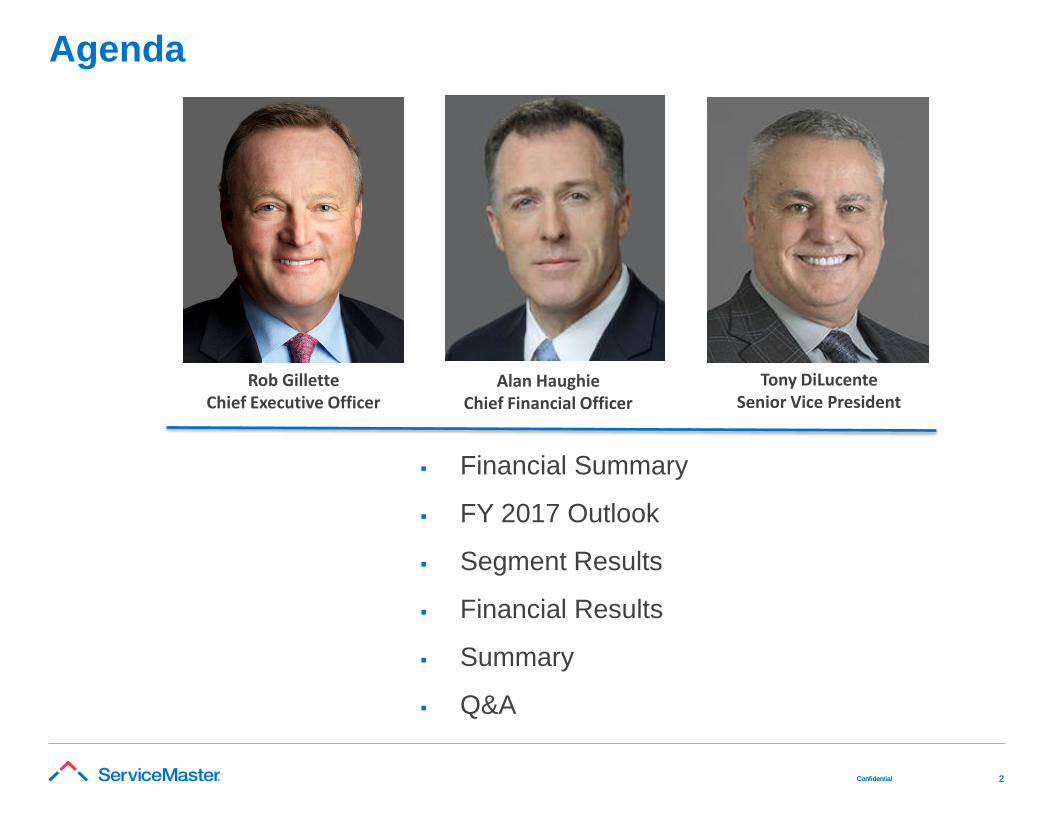
Agenda
Financial Summary
FY 2017 Outlook
Segment Results
Financial Results
Summary
Q&A
Alan HaughieChief Financial Officer
Rob GilletteChief Executive Officer
Tony DiLucenteSenior Vice President
Confidential 3Confidential 3
Cautionary StatementsSafe Harbor Statement
This presentation contains “forward-looking statements,” including 2017 revenue and Adjusted EBITDA outlook, that are based on management’s beliefs
and assumptions and on information currently available to management. Most forward-looking statements contain words that identify them as forward-
looking, such as “anticipates,” “believes,” “continues,” “could,” “seeks,” “estimates,” “expects,” “intends,” “may,” “plans,” “potential,” “predicts,” “projects,”
“should,” “will,” “would” or similar expressions and the negatives of those terms that relate to future events. Forward-looking statements involve known and
unknown risks, uncertainties and other factors that may cause ServiceMaster’s actual results, performance or achievements to be materially different from
any projected results, performance or achievements expressed or implied by the forward-looking statements. Forward-looking statements represent the
beliefs and assumptions of ServiceMaster only as of the date of this presentation and ServiceMaster undertakes no obligation to update or revise publicly
any such forward-looking statements, whether as a result of new information, future events or otherwise. As such, ServiceMaster’s future results may vary
from any expectations or goals expressed in, or implied by, the forward-looking statements included in this presentation, possibly to a material degree.
ServiceMaster cannot assure you that the assumptions made in preparing any of the forward-looking statements will prove accurate or that any long-term
financial or operational goals and targets will be realized. For a discussion of some of the important factors that could cause ServiceMaster’s results to
differ materially from those expressed in, or implied by, the forward-looking statements included in this presentation, investors should refer to the
disclosure contained under the heading “Risk Factors” in our Quarterly Report on Form 10-Q for the quarter ended September 30, 2016 and our other
filings with the SEC.
Note to Non-GAAP Financial Measures
This presentation contains certain non-GAAP financial measures. Non-GAAP measures should not be considered as an alternative to GAAP financial
measures. Non-GAAP measures may not be calculated or comparable to similarly titled measures of other companies. See non-GAAP reconciliations
below in this presentation for a reconciliation of these measures to the most directly comparable GAAP financial measures. Adjusted EBITDA, adjusted
net income, adjusted earnings per share and free cash flow are not measurements of the company’s financial performance under GAAP and should not
be considered as an alternative to net income, net cash provided by operating activities from continuing operations or any other performance or liquidity
measure derived in accordance with GAAP. Management uses these non-GAAP financial measures to facilitate operating performance and liquidity
comparisons, as applicable, from period to period. We believe these non-GAAP financial measures are useful for investors, analysts and other interested
parties as they facilitate company-to-company operating performance and liquidity comparisons, as applicable, by excluding potential differences caused
by variations in capital structures, taxation, the age and book depreciation of facilities and equipment, restructuring initiatives and equity-based, long-term
incentive plans.
Adjusted EBITDA is defined as net income before: depreciation and amortization expense; 401(k) Plan corrective contribution; fumigation related
matters; insurance reserve adjustment; non-cash stock-based compensation expense; restructuring charges; gain on sale of Merry Maids branches; non-
cash impairment of software and other related costs; loss from discontinued operations, net of income taxes; provision for income taxes; loss on
extinguishment of debt; interest expense; and other non-operating expenses. Adjusted net income is defined as net income before: amortization
expense; 401(k) Plan corrective contribution; fumigation related matters; insurance reserve adjustment; restructuring charges; gain on sale of Merry Maids
branches; impairment of software and other related cots; loss from discontinued operations, net of taxes; loss on extinguishment of debt; and the tax
impact of the aforementioned adjustments. Adjusted earnings per share is calculated as adjusted net income divided by the weighted-average diluted
common shares outstanding. Free Cash Flow is defined as net cash provided from operating activities from continuing operations less property additions.
Confidential 4Confidential 4
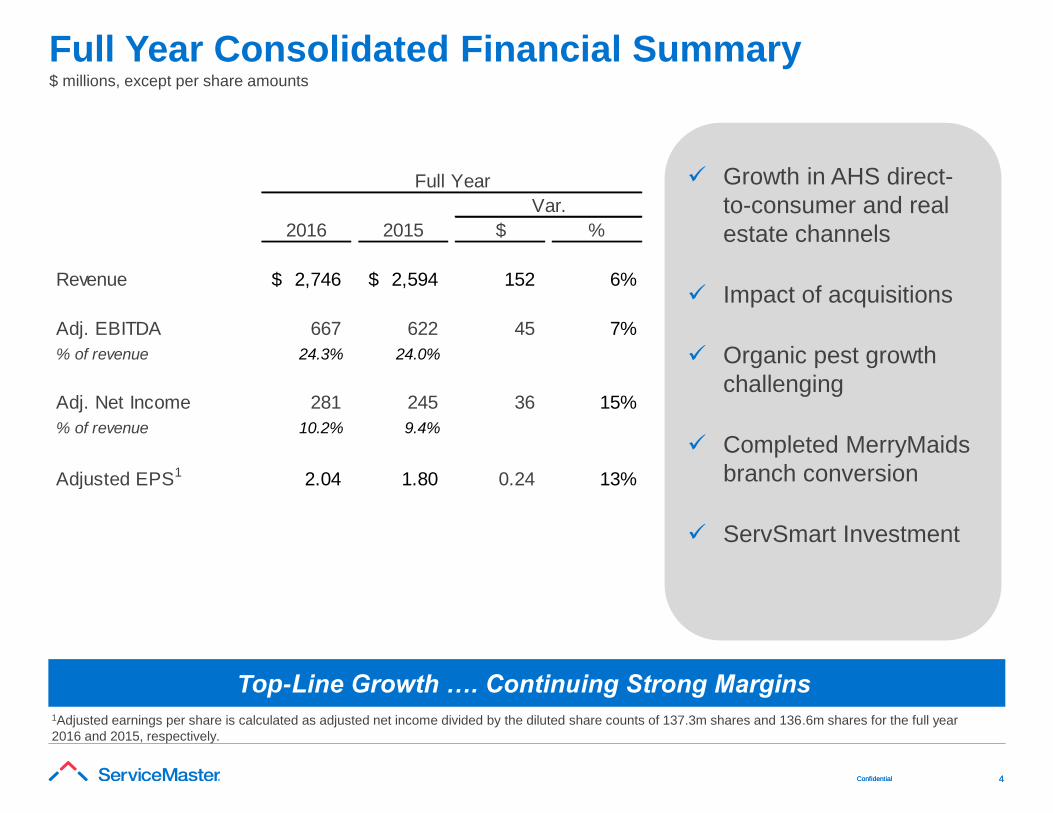
Full Year Consolidated Financial Summary$ millions, except per share amounts
Top-Line Growth …. Continuing Strong Margins1Adjusted earnings per share is calculated as adjusted net income divided by the diluted share counts of 137.3m shares and 136.6m shares for the full year
2016 and 2015, respectively.
Growth in AHS direct-
to-consumer and real
estate channels
Impact of acquisitions
Organic pest growth
challenging
Completed MerryMaids
branch conversion
ServSmart Investment
2016 2015 $ %
Revenue 2,746$ 2,594$ 152 6%
Adj. EBITDA 667 622 45 7%
% of revenue 24.3% 24.0%
Adj. Net Income 281 245 36 15%
% of revenue 10.2% 9.4%
Adjusted EPS1 2.04 1.80 0.24 13%
Full Year
Var.
Confidential 5Confidential 5
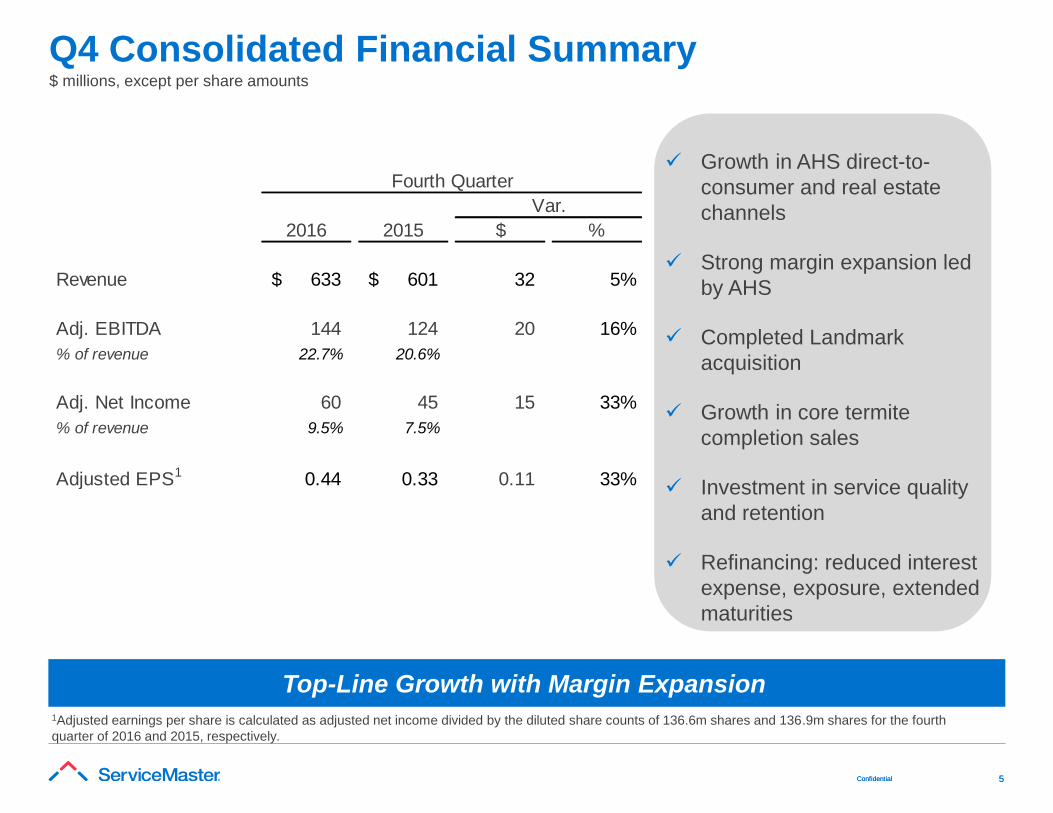
Q4 Consolidated Financial Summary$ millions, except per share amounts
Top-Line Growth with Margin Expansion1Adjusted earnings per share is calculated as adjusted net income divided by the diluted share counts of 136.6m shares and 136.9m shares for the fourth
quarter of 2016 and 2015, respectively.
Growth in AHS direct-to-
consumer and real estate
channels
Strong margin expansion led
by AHS
Completed Landmark
acquisition
Growth in core termite
completion sales
Investment in service quality
and retention
Refinancing: reduced interest
expense, exposure, extended
maturities
2016 2015 $ %
Revenue 633$ 601$ 32 5%
Adj. EBITDA 144 124 20 16%
% of revenue 22.7% 20.6%
Adj. Net Income 60 45 15 33%
% of revenue 9.5% 7.5%
Adjusted EPS1 0.44 0.33 0.11 33%
Var.
Fourth Quarter
Confidential 6Confidential 6
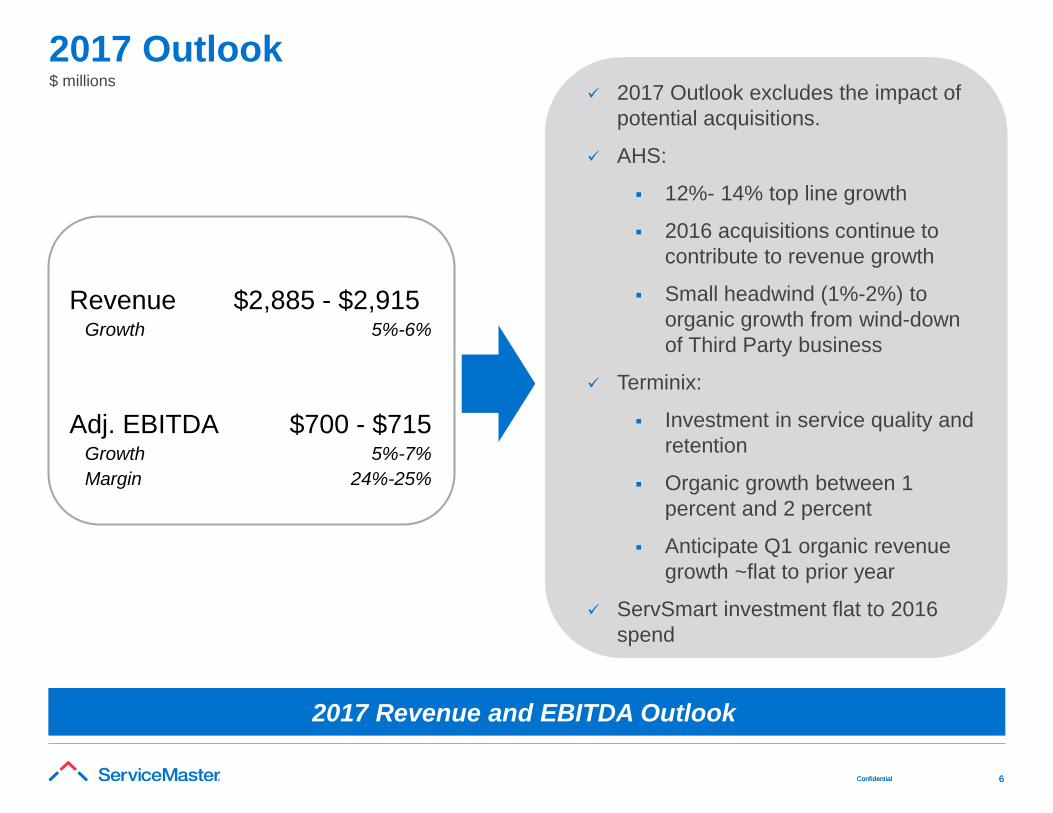
2017 Outlook
2017 Revenue and EBITDA Outlook
2017 Outlook excludes the impact of
potential acquisitions.
AHS:
12%- 14% top line growth
2016 acquisitions continue to
contribute to revenue growth
Small headwind (1%-2%) to
organic growth from wind-down
of Third Party business
Terminix:
Investment in service quality and
retention
Organic growth between 1
percent and 2 percent
Anticipate Q1 organic revenue
growth ~flat to prior year
ServSmart investment flat to 2016
spend
$ millions
Revenue $2,885 - $2,915Growth 5%-6%
Adj. EBITDA $700 - $715Growth 5%-7%
Margin 24%-25%
Confidential 7Confidential 7
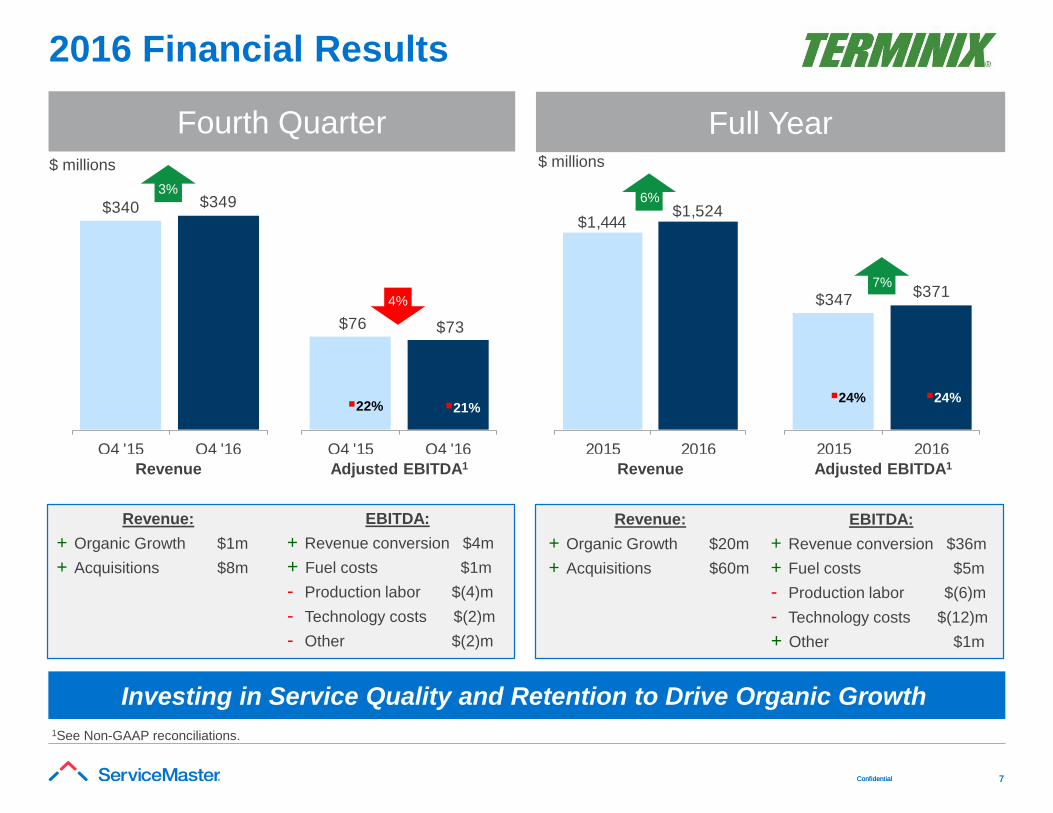
2016 Financial Results
Investing in Service Quality and Retention to Drive Organic Growth
1See Non-GAAP reconciliations.
Fourth Quarter Full Year
$76 $73
Q4 '15 Q4 '16
$340 $349
Q4 '15 Q4 '16
3%
4%
22% 21%
$1,444 $1,524
2015 2016
$347 $371
2015 2016
6%
24% 24%
7%
Revenue Adjusted EBITDA1 Revenue Adjusted EBITDA1
Revenue:
+ Organic Growth $1m
+ Acquisitions $8m
EBITDA:
+ Revenue conversion $4m
+ Fuel costs $1m
- Production labor $(4)m
- Technology costs $(2)m
- Other $(2)m
$ millions $ millions
Revenue:
+ Organic Growth $20m
+ Acquisitions $60m
EBITDA:
+ Revenue conversion $36m
+ Fuel costs $5m
- Production labor $(6)m
- Technology costs $(12)m
+ Other $1m
Confidential 8Confidential 8
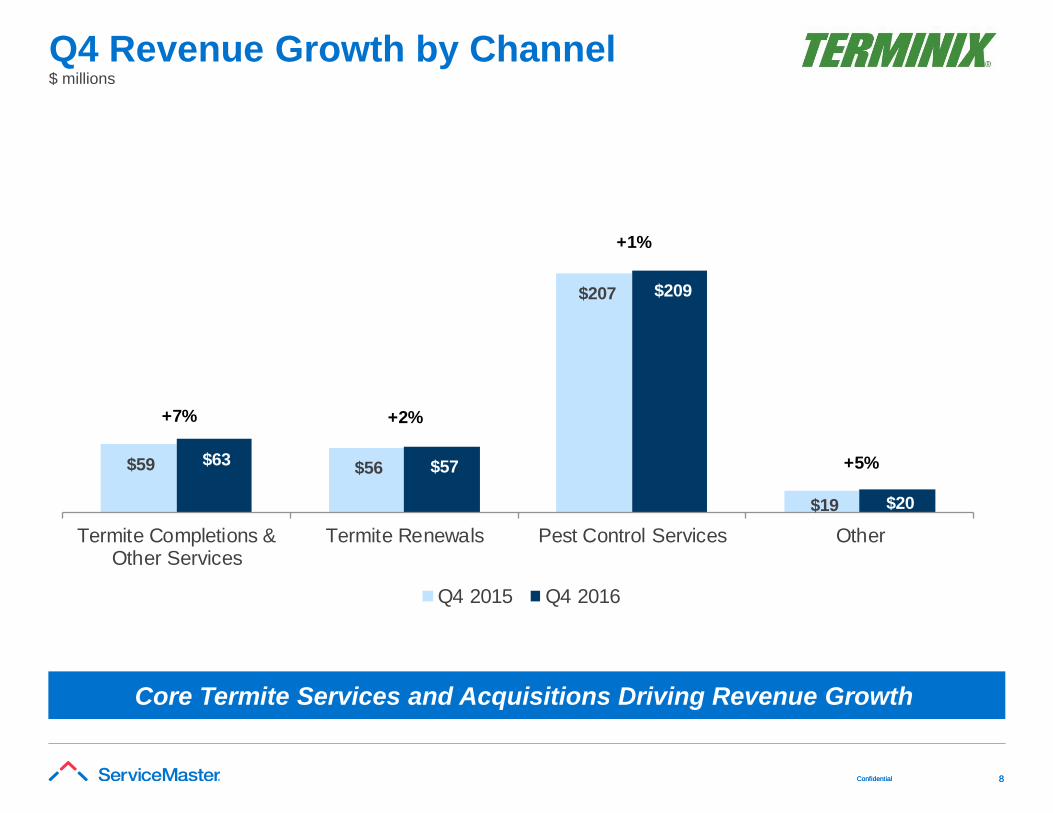
Q4 Revenue Growth by Channel
Core Termite Services and Acquisitions Driving Revenue Growth
$59 $56
$207
$19
$63 $57
$209
$20
Termite Completions &Other Services
Termite Renewals Pest Control Services Other
Q4 2015 Q4 2016
+2%
+1%
+5%
+7%
$ millions
Confidential 9Confidential 9
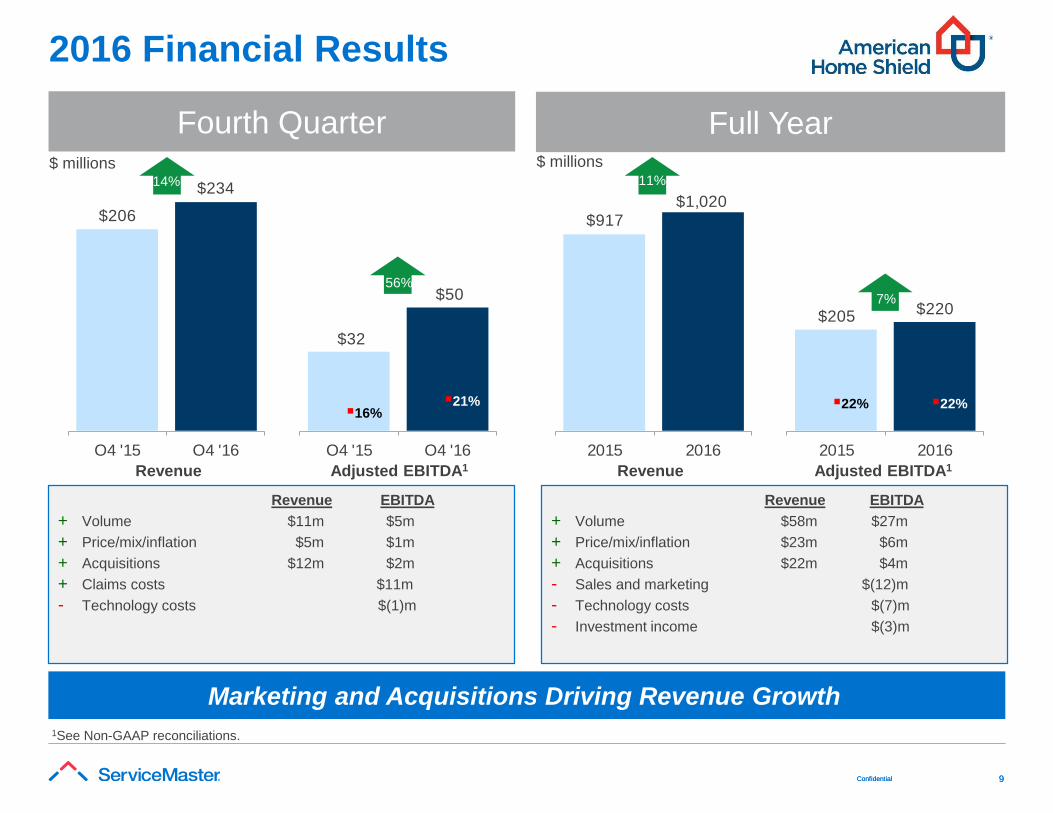
2016 Financial Results
Marketing and Acquisitions Driving Revenue Growth
1See Non-GAAP reconciliations.
Fourth Quarter Full Year
$32
$50
Q4 '15 Q4 '16
$205 $220
2015 2016
$206
$234
Q4 '15 Q4 '16
$917 $1,020
2015 2016
14%
56%
11%
7%
16%22%21% 22%
Revenue Adjusted EBITDA1 Revenue Adjusted EBITDA1
Revenue EBITDA
+ Volume $11m $5m
+ Price/mix/inflation $5m $1m
+ Acquisitions $12m $2m
+ Claims costs $11m
- Technology costs $(1)m
$ millions $ millions
Revenue EBITDA
+ Volume $58m $27m
+ Price/mix/inflation $23m $6m
+ Acquisitions $22m $4m
- Sales and marketing $(12)m
- Technology costs $(7)m
- Investment income $(3)m
Confidential 10Confidential 10
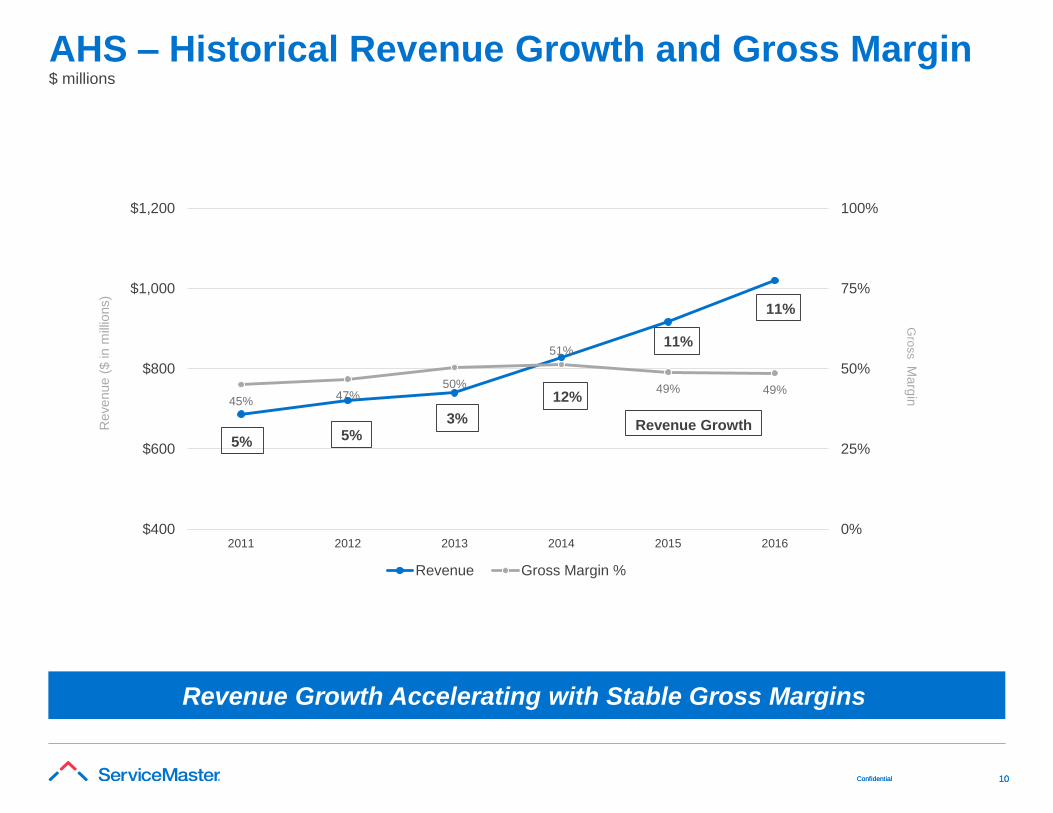
AHS – Historical Revenue Growth and Gross Margin
45%47%
50%
51%
49% 49%
0%
25%
50%
75%
100%
$400
$600
$800
$1,000
$1,200
2011 2012 2013 2014 2015 2016
Revenue Gross Margin %
5% 5%3%
12%
11%
11%
Revenue Growth
$ millions
Revenue (
$ in m
illio
ns)
Gro
ss M
arg
in
Revenue Growth Accelerating with Stable Gross Margins
Confidential 11Confidential 11
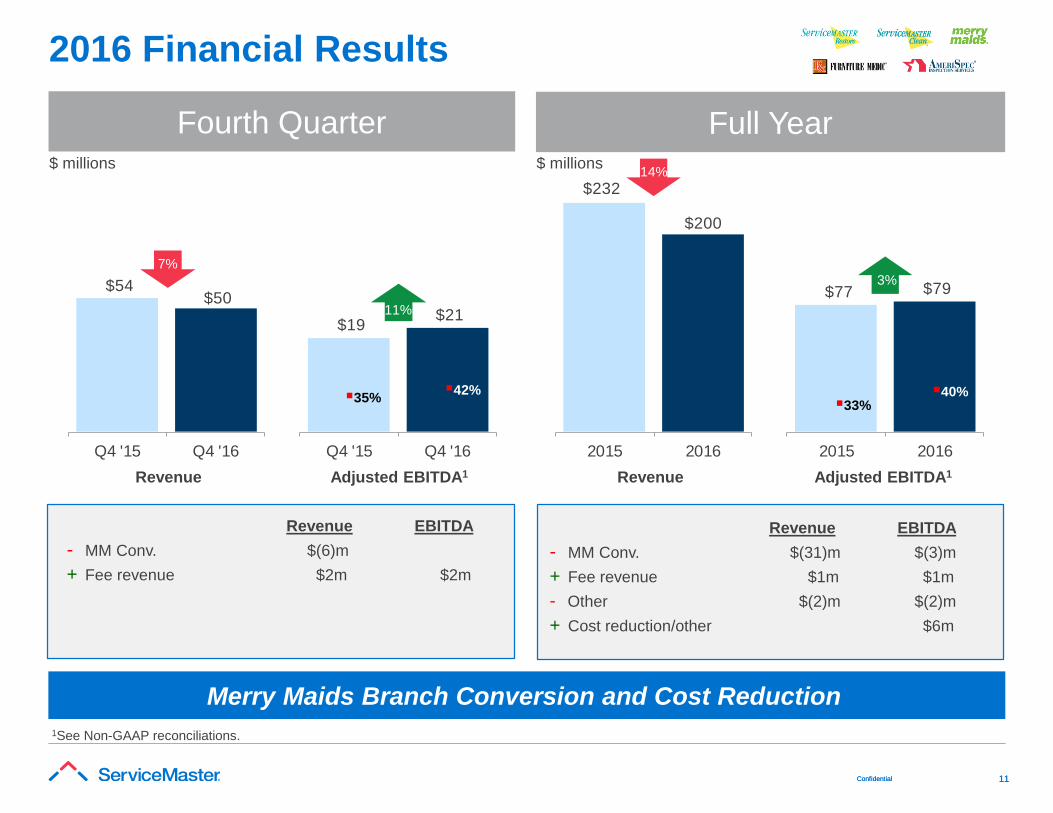
2016 Financial Results
Merry Maids Branch Conversion and Cost Reduction
1See Non-GAAP reconciliations.
Fourth Quarter Full Year
$19 $21
Q4 '15 Q4 '16
$54 $50
Q4 '15 Q4 '16
$232
$200
2015 2016
7%
11%
14%
3%
35%42%
$77 $79
2015 2016
33%40%
3%
Revenue Adjusted EBITDA1 Revenue Adjusted EBITDA1
$ millions $ millions
Revenue EBITDA
- MM Conv. $(31)m $(3)m
+ Fee revenue $1m $1m
- Other $(2)m $(2)m
+ Cost reduction/other $6m
Revenue EBITDA
- MM Conv. $(6)m
+ Fee revenue $2m $2m
Confidential 12Confidential 12
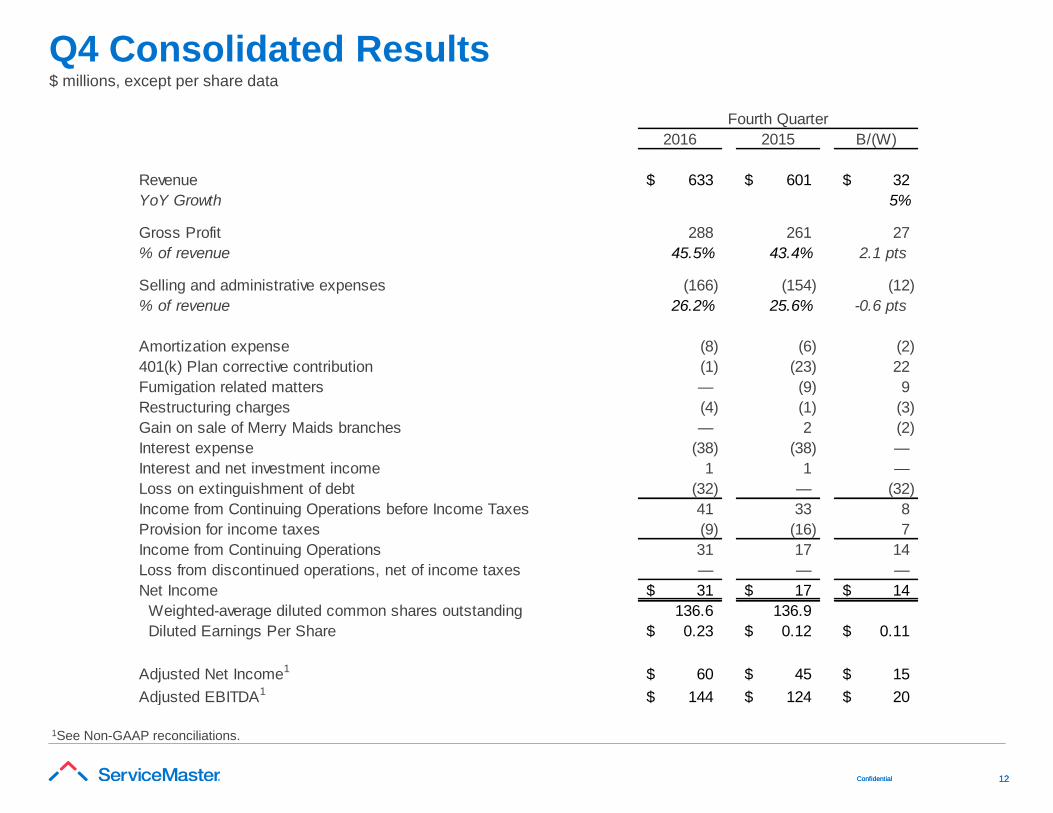
Q4 Consolidated Results$ millions, except per share data
2016 2015 B/(W)
Revenue 633$ 601$ 32$
YoY Growth 5%
Gross Profit 288 261 27
% of revenue 45.5% 43.4% 2.1 pts
Selling and administrative expenses (166) (154) (12)
% of revenue 26.2% 25.6% -0.6 pts
Amortization expense (8) (6) (2)
401(k) Plan corrective contribution (1) (23) 22
Fumigation related matters — (9) 9
Restructuring charges (4) (1) (3)
Gain on sale of Merry Maids branches — 2 (2)
Interest expense (38) (38) —
Interest and net investment income 1 1 —
Loss on extinguishment of debt (32) — (32)
Income from Continuing Operations before Income Taxes 41 33 8
Provision for income taxes (9) (16) 7
Income from Continuing Operations 31 17 14
Loss from discontinued operations, net of income taxes — — —
Net Income 31$ 17$ 14$
Weighted-average diluted common shares outstanding 136.6 136.9
Diluted Earnings Per Share 0.23$ 0.12$ 0.11$
Adjusted Net Income1 60$ 45$ 15$
Adjusted EBITDA1 144$ 124$ 20$
Fourth Quarter
1See Non-GAAP reconciliations.
Confidential 13Confidential 13
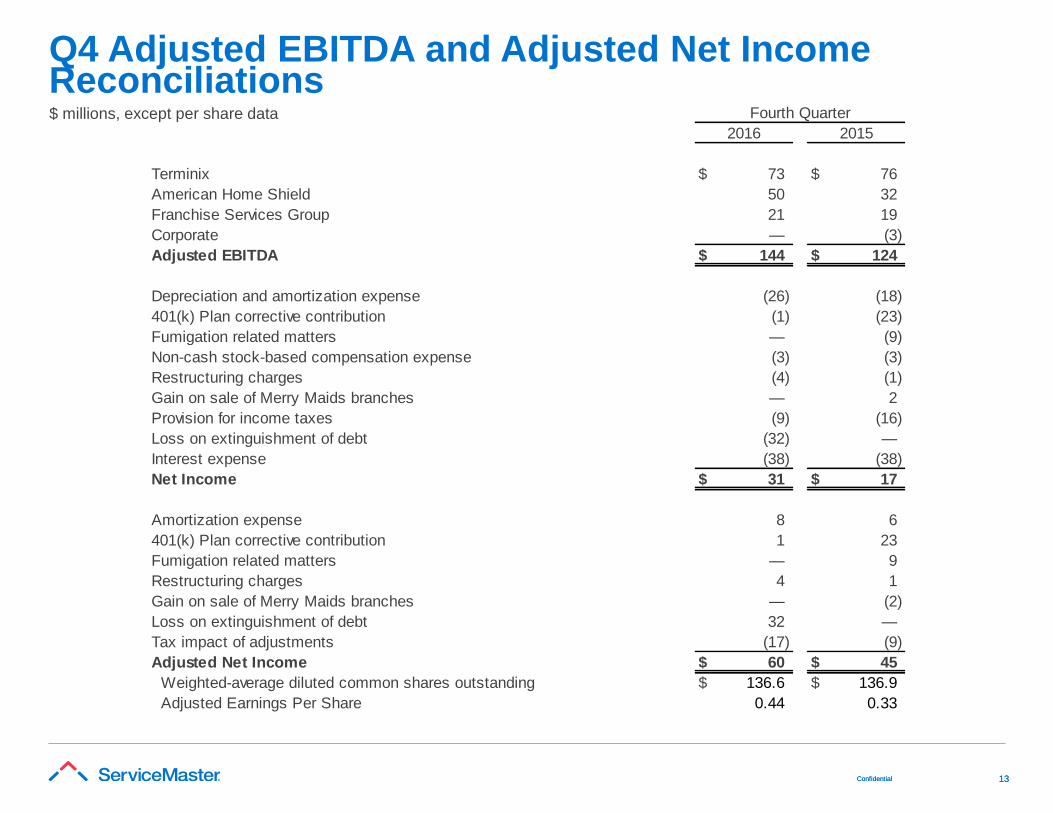
Q4 Adjusted EBITDA and Adjusted Net Income Reconciliations$ millions, except per share data
Terminix $ 73 $ 76
American Home Shield 50 32
Franchise Services Group 21 19
Corporate — (3)
Adjusted EBITDA $ 144 $ 124
Depreciation and amortization expense (26) (18)
401(k) Plan corrective contribution (1) (23)
Fumigation related matters — (9)
Non-cash stock-based compensation expense (3) (3)
Restructuring charges (4) (1)
Gain on sale of Merry Maids branches — 2
Provision for income taxes (9) (16)
Loss on extinguishment of debt (32) —
Interest expense (38) (38)
Net Income $ 31 $ 17
Amortization expense 8 6
401(k) Plan corrective contribution 1 23
Fumigation related matters — 9
Restructuring charges 4 1
Gain on sale of Merry Maids branches — (2)
Loss on extinguishment of debt 32 —
Tax impact of adjustments (17) (9)
Adjusted Net Income $ 60 $ 45
Weighted-average diluted common shares outstanding $ 136.6 $ 136.9
Adjusted Earnings Per Share 0.44 0.33
Fourth Quarter
2016 2015
Confidential 14Confidential 14
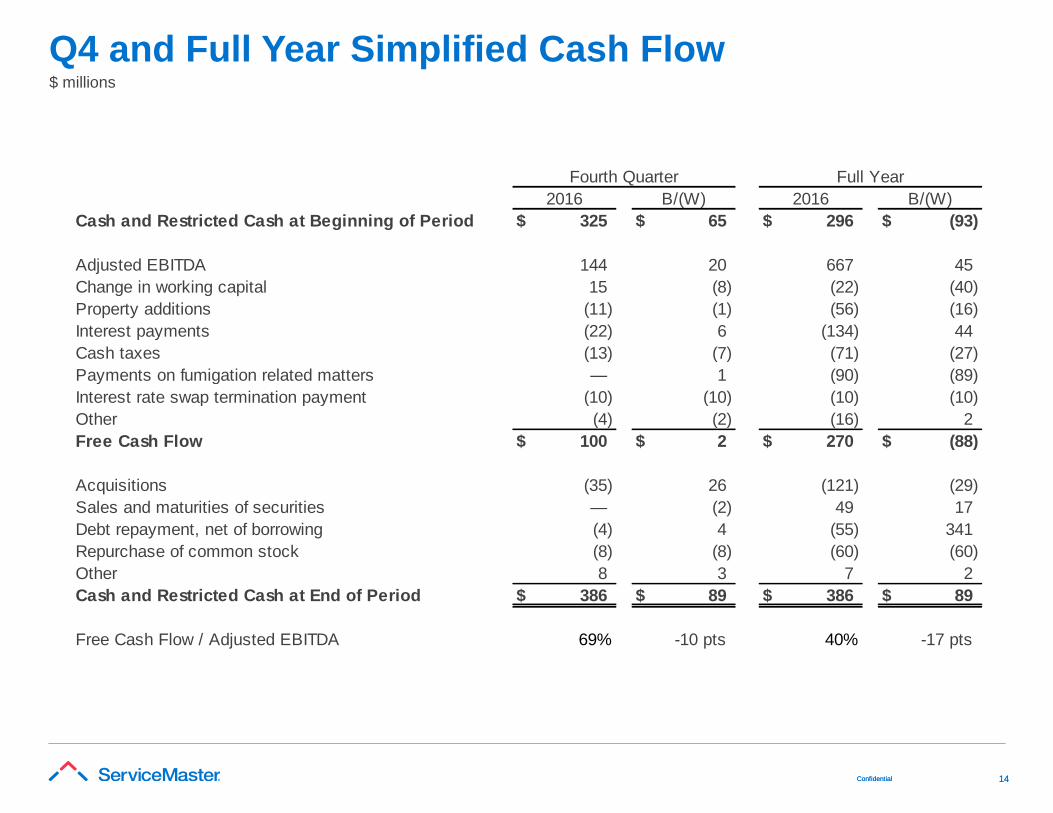
Q4 and Full Year Simplified Cash Flow$ millions
Cash and Restricted Cash at Beginning of Period $ 325 $ 65 $ 296 $ (93)
Adjusted EBITDA 144 20 667 45
Change in working capital 15 (8) (22) (40)
Property additions (11) (1) (56) (16)
Interest payments (22) 6 (134) 44
Cash taxes (13) (7) (71) (27)
Payments on fumigation related matters — 1 (90) (89)
Interest rate swap termination payment (10) (10) (10) (10)
Other (4) (2) (16) 2
Free Cash Flow $ 100 $ 2 $ 270 $ (88)
Acquisitions (35) 26 (121) (29)
Sales and maturities of securities — (2) 49 17
Debt repayment, net of borrowing (4) 4 (55) 341
Repurchase of common stock (8) (8) (60) (60)
Other 8 3 7 2
Cash and Restricted Cash at End of Period $ 386 $ 89 $ 386 $ 89
Free Cash Flow / Adjusted EBITDA 69% -10 pts 40% -17 pts
2016 B/(W) 2016 B/(W)
Full YearFourth Quarter

Confidential 15Confidential 15
Summary
• Strong customer growth at AHS
• Termite business continues to improve
• Pest organic growth a challenge
Investing in service quality to improve retention and
reinvigorate growth
• Continue to invest in technology (ServSmart) and marketing
• Refinancing; Reduce interest expense, exposure and extended
maturities
• Businesses remain strong
Building on our Accomplishments and Investing in Service Quality

Confidential 16Confidential 16
Q&A
Confidential 17Confidential 17
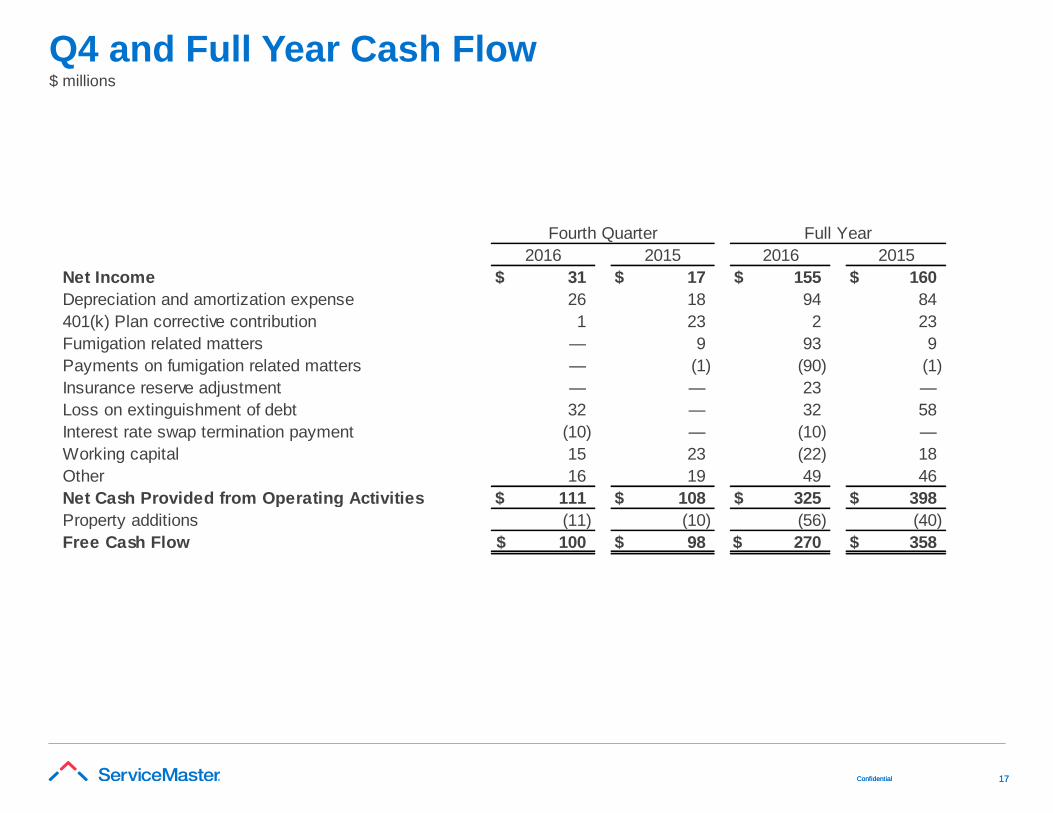
Q4 and Full Year Cash Flow$ millions
Net Income $ 31 $ 17 $ 155 $ 160
Depreciation and amortization expense 26 18 94 84
401(k) Plan corrective contribution 1 23 2 23
Fumigation related matters — 9 93 9
Payments on fumigation related matters — (1) (90) (1)
Insurance reserve adjustment — — 23 —
Loss on extinguishment of debt 32 — 32 58
Interest rate swap termination payment (10) — (10) —
Working capital 15 23 (22) 18
Other 16 19 49 46
Net Cash Provided from Operating Activities $ 111 $ 108 $ 325 $ 398
Property additions (11) (10) (56) (40)
Free Cash Flow $ 100 $ 98 $ 270 $ 358
Fourth Quarter
2016 2015 2016 2015
Full Year
Confidential 18Confidential 18
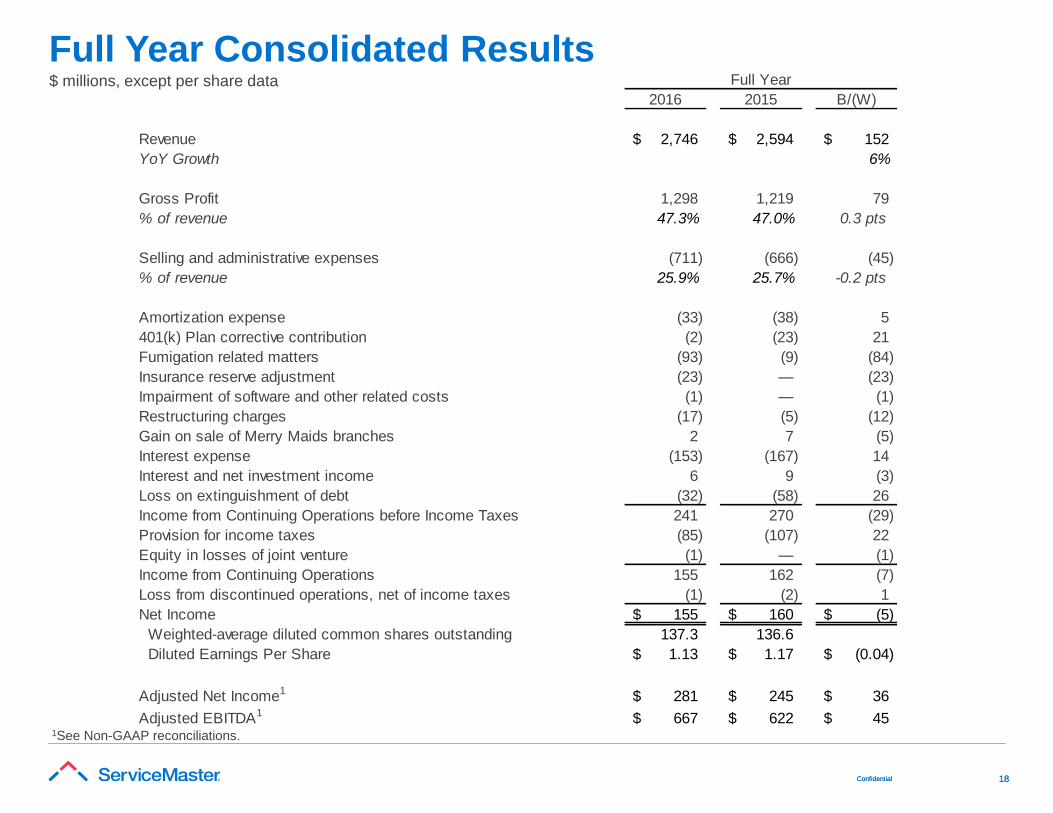
Full Year Consolidated Results$ millions, except per share data
2016 2015 B/(W)
Revenue 2,746$ 2,594$ 152$
YoY Growth 6%
Gross Profit 1,298 1,219 79
% of revenue 47.3% 47.0% 0.3 pts
Selling and administrative expenses (711) (666) (45)
% of revenue 25.9% 25.7% -0.2 pts
Amortization expense (33) (38) 5
401(k) Plan corrective contribution (2) (23) 21
Fumigation related matters (93) (9) (84)
Insurance reserve adjustment (23) — (23)
Impairment of software and other related costs (1) — (1)
Restructuring charges (17) (5) (12)
Gain on sale of Merry Maids branches 2 7 (5)
Interest expense (153) (167) 14
Interest and net investment income 6 9 (3)
Loss on extinguishment of debt (32) (58) 26
Income from Continuing Operations before Income Taxes 241 270 (29)
Provision for income taxes (85) (107) 22
Equity in losses of joint venture (1) — (1)
Income from Continuing Operations 155 162 (7)
Loss from discontinued operations, net of income taxes (1) (2) 1
Net Income 155$ 160$ (5)$
Weighted-average diluted common shares outstanding 137.3 136.6
Diluted Earnings Per Share 1.13$ 1.17$ (0.04)$
Adjusted Net Income1 281$ 245$ 36$
Adjusted EBITDA1 667$ 622$ 45$
Full Year
1See Non-GAAP reconciliations.
Confidential 19Confidential 19
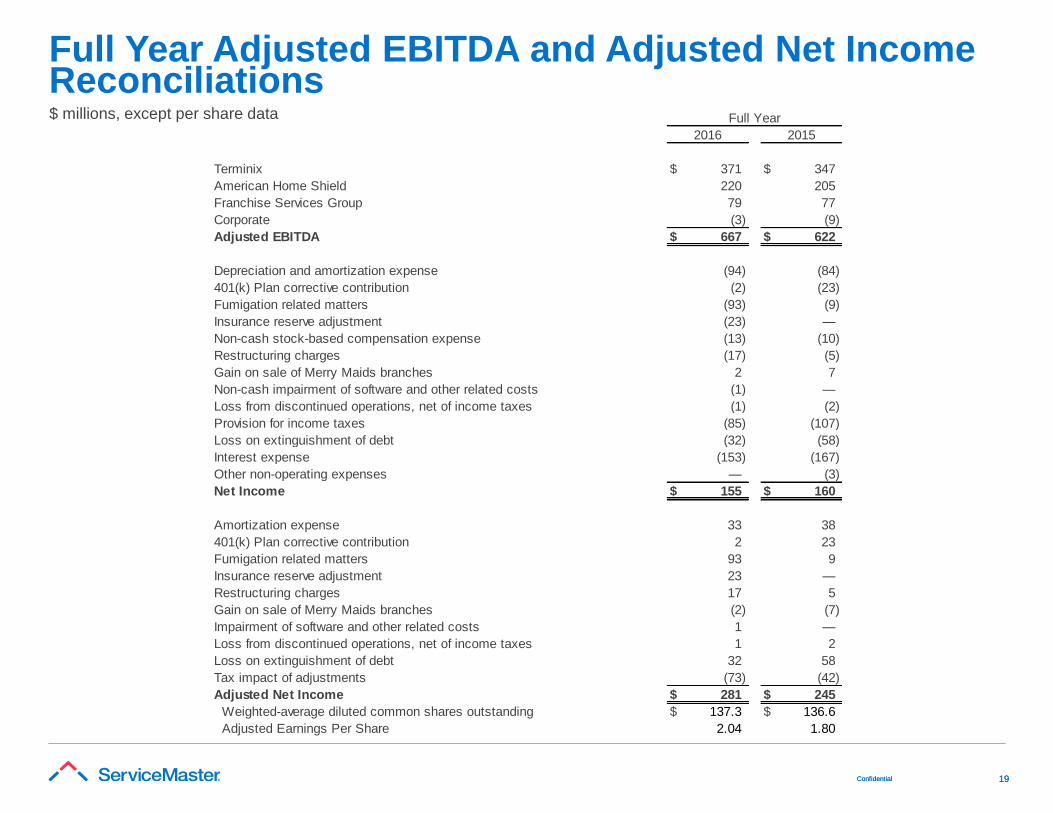
Full Year Adjusted EBITDA and Adjusted Net Income Reconciliations$ millions, except per share data
Terminix $ 371 $ 347
American Home Shield 220 205
Franchise Services Group 79 77
Corporate (3) (9)
Adjusted EBITDA $ 667 $ 622
Depreciation and amortization expense (94) (84)
401(k) Plan corrective contribution (2) (23)
Fumigation related matters (93) (9)
Insurance reserve adjustment (23) —
Non-cash stock-based compensation expense (13) (10)
Restructuring charges (17) (5)
Gain on sale of Merry Maids branches 2 7
Non-cash impairment of software and other related costs (1) —
Loss from discontinued operations, net of income taxes (1) (2)
Provision for income taxes (85) (107)
Loss on extinguishment of debt (32) (58)
Interest expense (153) (167)
Other non-operating expenses — (3)
Net Income $ 155 $ 160
Amortization expense 33 38
401(k) Plan corrective contribution 2 23
Fumigation related matters 93 9
Insurance reserve adjustment 23 —
Restructuring charges 17 5
Gain on sale of Merry Maids branches (2) (7)
Impairment of software and other related costs 1 —
Loss from discontinued operations, net of income taxes 1 2
Loss on extinguishment of debt 32 58
Tax impact of adjustments (73) (42)
Adjusted Net Income $ 281 $ 245
Weighted-average diluted common shares outstanding $ 137.3 $ 136.6
Adjusted Earnings Per Share 2.04 1.80
Full Year
2016 2015