enersys fy2019 q4 earnings call webcast presentation.05-30
TRANSCRIPT

May 30, 2019
4th Quarter Earnings Conference Call
May 30, 2019

May 30, 2019 2
As a reminder, we will be presenting certain forward-looking statements on this call that are based onManagement’s current expectations and views regarding future events and operating performance andare subject to uncertainties and changes in circumstances. Our actual results may differ materially fromthe forward-looking statements for a number of reasons. Our forward-looking statements are applicableonly as of the date of this presentation. For a list of the factors which could affect our future results,including our earnings estimates, see forward-looking statements included in “Item 7. Management’sDiscussion and Analysis of Financial Condition and Results of Operations,” set forth in our Annual Reporton Form 10-K for the fiscal year ended March 31, 2019, which was filed with the U.S. Securities andExchange Commission.
In addition, we will also be presenting certain non-GAAP financial measures. For an explanation of thedifferences between the comparable GAAP financial information and the non-GAAP information, pleasesee our company’s Form 8-K which includes our press release dated May 29th, 2019, which is located onour web site at www.enersys.com.
Forward-Looking Information
David M. ShafferDirector, President and Chief Executive Officer
Michael J. SchmidtleinExecutive Vice President and Chief Financial Officer

May 30, 2019 3
4th Quarter Fiscal 2019 Results($ Millions)
Alpha amortization is excluded.
Presented on an as adjusted basis. See appendix at end of presentation for more detailed information.
w/AlphaQ4 F'19
Legacy ENSQ4 F'19
Legacy ENSQ4 F'18
SALES $796.6 $660.9 $683.0
GROSS PROFIT $ $208.4 $168.7 $170.5
OP EARNINGS $ $83.2 $69.3 $73.6
OP EARNINGS % 10.4% 10.5% 10.8%
EPS $1.43 $1.28 $1.24

May 30, 2019 4
Global Business ReviewGLOBAL• Strong demand for Motive Power products in all regions• Record Motive Power backlog due to strong markets and growth of NexSys Pure TPPL
AMERICAS• U.S. Reserve Power up slightly in Q4, however U.S. telecoms deferring spending on legacy
networks• Motive Power demand strong, but Q4 organic sales down YoY due to ERP implementation
EMEA• Double-digit Motive Power organic growth• Reserve Power growth strong due to Middle East and Africa and UPS for datacenters
ASIA• Reserve Power Q4 sales volume down due to China Tower YoY tough comparable• Double-digit Motive Power organic growth
AEROSPACE & DEFENSE• Aerospace and Defense sales lower in Q4 YoY due to timing; orders already picking up

May 30, 2019 5
EnerSys at ProMat 2019
• Historic level of customer attendance
• Maintenance-free was main topic
May 30, 2019
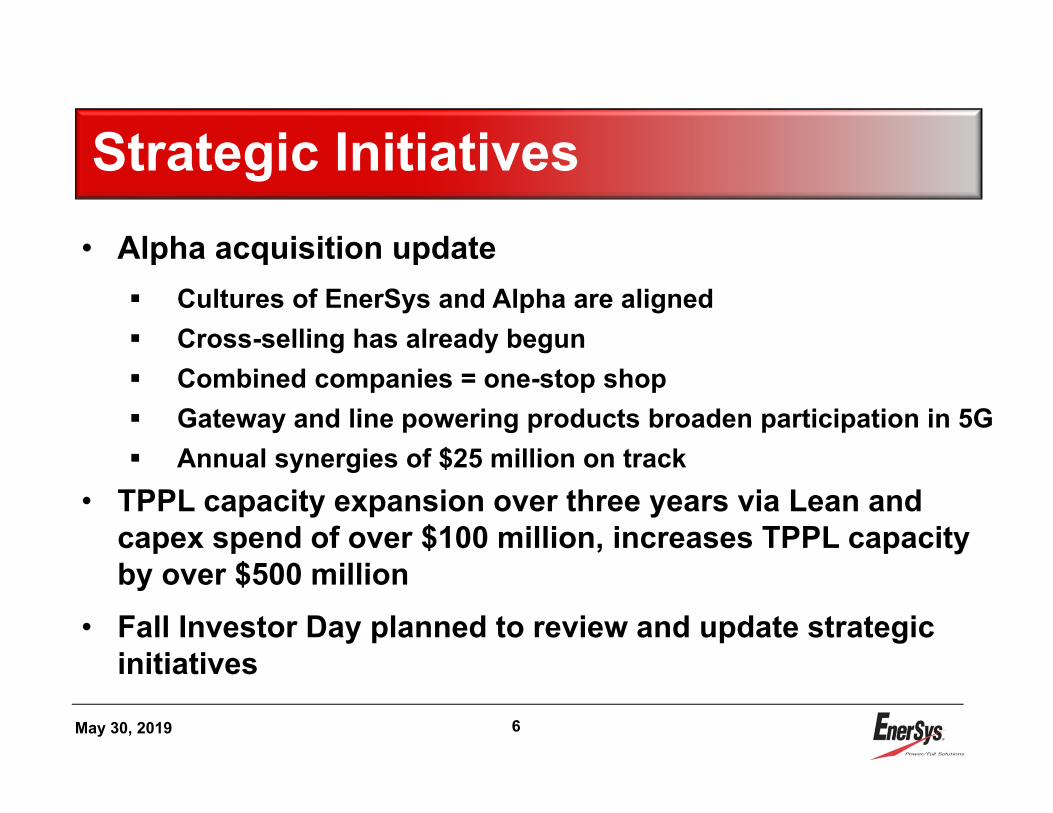
Strategic Initiatives• Alpha acquisition update
Cultures of EnerSys and Alpha are aligned Cross-selling has already begun Combined companies = one-stop shop Gateway and line powering products broaden participation in 5G Annual synergies of $25 million on track
• TPPL capacity expansion over three years via Lean and capex spend of over $100 million, increases TPPL capacity by over $500 million
• Fall Investor Day planned to review and update strategic initiatives
6

May 30, 2019
Alpha Products
7
Nokia Small Cell Alpha
Gateway
Gateway Powered Over HFC Network

May 30, 2019
Alpha Products
8
Telco Cabling Splice Case
-48Vdc ±190Vdc
AlphaDown-Converter
Ericsson 2203 Small Cell
Dual Antennas
Small Cells Powered Over Twisted Pair

May 30, 2019
Broad Industry Trends• Maintenance-free is the future for industrial batteries
NexSys Pure / NexSys Ion modular solutions EnerSys uniquely positioned
• Competition Many competitors struggling financially Their products are outdated and commoditized Should lead to improved EnerSys market share in U.S. and EMEA
• EnerSys well positioned to capitalize on 5G and broadband 5G buildout in U.S. and Canada could be 5.5 million small cell sites If EnerSys captures 25% of this market, additional sales would exceed
$1 billion Expanding DOCSIS 3.1 infrastructure will fuel additional sales
9

May 30, 2019
Rounding may cause minor differences.
10
F’19 4th Qtr. YOY SalesBy Region & Line Of Business
($ Millions)
F'19 Q4 F'18 Q4 $ % Volume Price M&A Fx
Americas $508 $381 $127 33% -2% 1% 36% -2%
EMEA $228 $228 $1 - 11% -1% - -10%
Asia $61 $75 ($14) -19% -14% - - -5%
Total Net Sales $797 $683 $114 17% 1% 1% 20% -5%
Motive Power $347 $360 ($12) -3% 2% -1% - -5%
Reserve Power $449 $323 $126 39% - 2% 42% -5%
Total Net Sales $797 $683 $114 17% 1% 1% 20% -5%
Fav/(Unfav)

May 30, 2019
F'19 Q4 F'19 Q3 $ %
Americas $508 $402 $106 26%
EMEA $228 $218 $10 5%
Asia $61 $60 $1 1%
Total Net Sales $797 $680 $117 17%
Motive Power $347 $351 ($3) -1%
Reserve Power $449 $329 $120 36%
Total Net Sales $797 $680 $117 17%
-1% Price, 0% Fx
Fav/(Unfav)
2% Organic, 16% Acquisitions
11
Rounding may cause minor differences.
F’19 4th Qtr. Sequential SalesBy Region & Line Of Business
($ Millions)

May 30, 2019
Alpha amortization is excluded. Rounding may cause minor differences. Presented on an as adjusted basis.
12
Year Over Year F'19 Q4 F'18 Q4 $ %
Operating Earnings
Americas $47.3 $49.6 ($2.3) -5%12.7% 13.0%
EMEA 23.3 22.1 1.2 6%10.2% 9.7%
Asia (1.3) 1.9 (3.2) -166%-2.1% 2.5%
Total Operating Earnings (Legacy ENS) $69.3 $73.6 ($4.3) -2%As % Net Sales 10.5% 10.8%
Total Operating Earnings (with Alpha) $83.2As % Net Sales 10.4%
Sequential F'19 Q4 F'19 Q3 $ %
Operating Earnings
Americas $47.3 $50.9 ($3.6) -7%12.7% 13.5%
EMEA 23.3 17.1 6.2 36%10.2% 7.9%
Asia (1.3) 0.6 (1.9) -317%-2.1% 1.0%
Total Operating Earnings (Legacy ENS) $69.3 $68.6 $0.7 1%As % Net Sales 10.5% 10.5%
Total Operating Earnings (with Alpha) $83.2 $67.5 $15.7 23%As % Net Sales 10.4% 9.9%
Fav/(Unfav)
Fav/(Unfav)
F’19 4th Qtr. Operating Earnings by Region($ Millions)

May 30, 2019
Alpha amortization is excluded. Rounding may cause minor differences. Presented on an as adjusted basis.
13
F’19 4th Qtr. Net Earnings and EPS($ Millions, Except Per Share Amounts)
F'19 Q4 F'18 Q4 $ %
Operating Earnings (Legacy ENS) $69.3 $73.6 ($4.3) -6% As % Net Sales 10.5% 10.8% (0.3)Pts.
Book Tax Rate 13% 20%
Operating Earnings (with Alpha) $83.2 As % Net Sales 10.4%
Net Earnings (Legacy ENS) $54.5 $52.5 $2.0 4% As % Net Sales 8.2% 7.7% 0.0 Pts.
Net Earnings (w/Alpha) $62.1 As % Net Sales 7.8%
EPS diluted (Legacy ENS) $1.28 $1.24 $0.04 3%
EPS diluted (w/Alpha) $1.43
Avg. Diluted Shares Outstanding (Legacy ENS) 42.400 42.442 ― ― (Millions)Avg. Diluted Shares Outstanding (w/Alpha) 43.586 (Millions)
Fav/(Unfav)

May 30, 2019 14
Rounding may cause minor differences. Presented on an as adjusted basis.
F’19 Sales By Region & Line Of Business(Legacy ENS, $ Millions)
F'19 F'18 $ % Volume Price M&A Fx
Americas $1,691 $1,430 $261 18% 6% 3% 11% -2%
EMEA $861 $849 $11 1% 5% - - -4%
Asia $257 $303 ($46) -15% -14% 2% - -3%
Total Net Sales $2,808 $2,582 $226 9% 3% 2% 6% -2%
Motive Power $1,392 $1,334 $58 4% 5% 1% - -2%
Reserve Power $1,416 $1,248 $168 13% 1% 2% 13% -2%
Total Net Sales $2,808 $2,582 $226 9% 3% 2% 6% -2%
Fav/(Unfav)

May 30, 2019 15
Alpha amortization is excluded. Rounding may cause minor differences. Presented on an as adjusted basis.
F’19 Net Earnings and EPS(Legacy ENS, $ Millions, Except Per Share Amounts)
F'19 F'18 $ %
Operating Earnings $285.6 $284.1 $1.5 -1% As % Net Sales 10.2% 11.0% (0.8)Pts.
Book Tax Rate 19% 20% − −
Net Earnings $212.1 $200.5 $11.6 6% As % Net Sales 7.6% 7.8% (0.2)Pts.
EPS diluted $4.93 $4.65 $0.28 6%
Avg. Diluted Shares Outstanding 43.009 43.120 .111 −(Millions)
Fav/(Unfav)

May 30, 2019 16
Financial Position Highlights($ Millions)
Cash & Cash Equivalents
Net Debt (Gross Debt − Investments)
Net Cash from Operations YTD
Capital Expenditures
Leverage Ratio (per US Credit Agreement)
Primary Working Capital as a % of Sales
$299.2 $522.1
Full Full Fiscal Year Fiscal Year 2019 2018
$841.2 $187.8
$197.9 $211.0
$70.4 $69.8
26.2% 25.7%
2.0X 0.7X

May 30, 2019 17
Fourth Quarter Fiscal 2019 Results($ Millions, Except Per Share Information)
Alpha amortization is excluded. Presented on an as adjusted basis.
TotalCompany Alpha Legacy ENS
NET SALES $796.6 $135.7 $660.9
COST OF SALES 588.2 95.9 492.3
GROSS PROFIT 208.4 39.7 168.7
OP EXPENSES 125.2 25.8 99.4
OP EARNINGS 83.2 13.9 69.3
INTEREST & OTHER 11.3 4.3 7.0
EARNINGS BEFORE TAX 71.9 9.2 62.7
TAX 9.8 2.0 7.8
NON-CONTROLLING INTEREST 0.0 ― 0.0
ADJUSTED NET EARNINGS 62.1 7.6 54.5
EPS $1.43 $0.15 $1.28
Appendix - 1

May 30, 2019
Premium Products % of Net Sales 43% 42% 40%
LME Lead Average $0.90 $1.03 $1.04
Net Cost Reduction Savings * $2M $11M $25M
System Costs in P&L(SAP, Salesforce, HRIS) $3M $11M $8M
Engineering Costs YoY $1M $7M $8M
Q4 FY19 FY 2019 FY 2018
18
Information Metrics(Legacy ENS Only)
• Premium product percentage of sales continues to rise• YoY net lead cost minus pricing P&L tailwind for Q4 headwind for FY19
Appendix - 2
* FY’19 gross cost reduction savings of $28M minus variances, freight, etc. of $17M