groundwater chemistry in an area covered by lava …euacademic.org/uploadarticle/312.pdfmagdy el...
TRANSCRIPT

4436
ISSN 2286-4822
www.euacademic.org
EUROPEAN ACADEMIC RESEARCH
Vol. I, Issue 11/ February 2014
Impact Factor: 3.1 (UIF)
DRJI Value: 5.9 (B+)
Groundwater Chemistry in an Area Covered by
Lava Flows, Aqool Area, Eastern Al Madinah
Al Munawarah City, Saudi Arabia
MAGDY EL MAGHRABY Geology Department, Faculty of Science
Alexandria University
Egypt
Abstract:
The groundwater of Al Aqool area, 30 km to the east of Al
Madina Al Munawarah City, Saudi Arabia is present in alluvium
deposits underlying vesicular lava flows. Groundwater occurs under confined, semi-confined and confined conditions in recent alluvial
deposits. The groundwater is the main source of water for drinking
and agricultural uses in the area of study. The twenty seven collected groundwater samples were chemically analyzed for major ions in order
to assess the groundwater quality and to understand the different
geochemical processes affecting the quality. The salinity of the groundwater samples of the area of study were ranged between 487–
997 mg/l indicating medium salinity. According to the chemical
analysis and the constructed diagrams (Piper, Durov, Schoeller) the prevalent chemical facies is Na-Cl water type. The geochemical change
of groundwater in the study area was observed where the water types
were changed from Ca-HCO3 of rain water into Na-Cl of groundwater
samples. The calculated ionic ratios ((Na+K-Cl)/(Na+K-Cl+Ca),
Na/(Na+Cl), Mg/(Ca+Mg), and Ca/(Ca+SO4)) indicate possible
plagioclase weathering, ion exchange, limestone-dolomite weathering and gypsum dissolution; respectively. From chloride mass-balance
equation the study area has a recharge (2.54 mm/y) of 4.97 % of
precipitation. Major elements analyses and calculated hydrochemical parameters (SAR, RSC, MH) of the groundwater samples from the
area of study revealed its suitability for both drinking and irrigation
purposes.
Key words: groundwater hydrochemistry, Aqool, Quaternary aquifer,
assessment, Saudi Arabia

Magdy El Maghraby- Groundwater Chemistry in an Area Covered by Lava Flows,
Aqool Area, Eastern Al Madinah Al Munawarah City, Saudi Arabia
EUROPEAN ACADEMIC RESEARCH - Vol. I, Issue 11 / February 2014
4437
Introduction
About one-third of the world’s population lives in countries
suffering from moderate-to-high water stress. Some 80
countries, constituting 40 per cent of the world’s population,
were suffering from serious water shortages by the mid-1990s.
Increasing water demand has been caused by population
growth, industrial development and the expansion of irrigated
agriculture (UNEP 2002).
Kingdom Saudi Arabia (KSA) is located in the arid zone
of south west Asia, where surface water supplies are absent
except during the floods which occur after intensive rainfall and
thus some intermittent ponds are formed. Groundwater is the
primary source of the water for human consumption, as well as
for agricultural and industrial uses, which make it an
important resource in KSA (Al-Ahmadi 2013a). So, growing
population, agricultural expansion and urbanization have
placed a heavy demand on water resources, which are among
the challenging issues especially in arid and semi-arid regions,
where the water resources are limited. The fresh water
resources are limited to the groundwater system, where the
groundwater in alluvial aquifer, which is dependent on direct
recharge from rainfall.
Water quality is important as for its quantity and
quality as it moves through the soils and sediments, and hence,
its composition is then changed by chemical reactions such as
weathering, dissolution, leaching, precipitation, ion exchange,
impact of agriculture and urbanization (Al-Ahmadi 2013b). The
quality of groundwater has been studied in several basins by
many researchers (Magnus et al. 2011; Ramesh and Bhuvana
2012; Cobbina et al. 2012; Emmannoel et al. 2009; El Maghraby
et al. 2013; Khashogji and El Maghraby 2013).
The attention to the quality of groundwater of the Al
Madinah Al Munawarah region has been increased (Bokhari
and Khan 1992; Matsah and Hossain 1993; El Maghraby 2004;

Magdy El Maghraby- Groundwater Chemistry in an Area Covered by Lava Flows,
Aqool Area, Eastern Al Madinah Al Munawarah City, Saudi Arabia
EUROPEAN ACADEMIC RESEARCH - Vol. I, Issue 11 / February 2014
4438
Bayumi, 2008). The hydrogeology and hydrochemistry of
groundwater of the western region of the KSA has also been a
focus of many researchers such as: Pieke (1985); De Jong et al.
(1989); Lloyd and Pirn (1990); Hussain and Sadiq (1991);
Bazuhair and Wood (1996); Al-Bassam (1998); Alyamani (2000);
Al-Bassam et al. (2003); Subyani (2004); Abderrahman (2006);
Al-Sefry and Sen (2006); Al-Shaibani (2008).
This work aims to assess the groundwater quality and to
understand the different geochemical processes affecting its
quality.
Study area
The study area lies at about 30 km to the east of Al Madinah Al
Munawarah City between latitudes 24o 21’ 45'' and 24o 27’ 54''
N and longitudes 39o 45’ 54'' and 39o 49’ 21'' E (Fig. 1).
Fig. 1 Location map of the water samples of the study area
The area of study lies within the desert belt which is
characterized by very high temperature and semi-arid to
extremely arid conditions. The mean temperature range is 25-
42oC in summer and 10-24oC in winter. The maximum rainfall
may be up to 85 mm/y. The average annual precipitation is
about 49.3 mm/y. Topographic elevations in the study area

Magdy El Maghraby- Groundwater Chemistry in an Area Covered by Lava Flows,
Aqool Area, Eastern Al Madinah Al Munawarah City, Saudi Arabia
EUROPEAN ACADEMIC RESEARCH - Vol. I, Issue 11 / February 2014
4439
range from 783 to 849 m above sea level.
Hydrogeology of the study area
The study area is located within the Arabian Shield. The area
of study is underlain by Proterozoic basement rocks that
comprise two major volcanosedimentary groups ranging in age
from approximately 800 to 670 Ma. (Pellaton 1981; Johnson
1983; George and Shorbaji 1987). The western part of the
Arabian Shield is formed of Precambrian rock that folded,
metamorphosed, granitized and intruded during several
tectonic phases prior to the Cambrian (Fig. 2). During the
Tertiary, olivine basalt flows were extruded in many parts of
the Al Madinah Al Munawarah area. This volcanic activity
continued into the Quaternary.
Fig. 2 Geological map of the study area, (Ministry of Petroleum and
Mineral Resources KSA 1987)
The area of study is covered by surficial deposits which
comprise eluvial deposits, sabkhah and khabra deposits, wadi

Magdy El Maghraby- Groundwater Chemistry in an Area Covered by Lava Flows,
Aqool Area, Eastern Al Madinah Al Munawarah City, Saudi Arabia
EUROPEAN ACADEMIC RESEARCH - Vol. I, Issue 11 / February 2014
4440
deposits and alluvial deposits. Wadi deposits carrie water for a
few days, but most water is lost through direct infiltration and
evaporation.
According to lithologic characteristics and hydraulic
behavior, aquifers of the study area are classified into two
types; (i) continuous and alluvial, which range from unconfined
in the surficial deposits, Paleozoic formations, and weathered
Proterozoic bedrock formations, to semiconfined and confined
whether these formations are overlain by lava flows or are
intercalated with clayey and silty deposits; and (ii)
discontinuous bedrock or suballuvial in the fractured Cenozoic
lava flows intercalated with volcanic ash or sediment layers,
and in the fractured bedrock formations (George and Shorbaji
1987; Bokhari and Khan 1992).
Depth to the water table ranges from 40 to 90 m below
ground surface. Rainfall is main source of recharge of the
aquifer. Discharge from the aquifer takes place through the
controlled pumping and by evaporation.
Recharge Estimation
The recharge amount at the study area was estimated using the
chloride mass-balance equation. Wood and Sanford (1995)
proposed the equation to estimate the recharge as follows:
Q = R Clwav / Clgw
where, Q=recharge flux (LT−1), R=average annual rainfall
(LT−1), Clwav=weighted average chloride concentration in
rainfall (ML−3), Clgw=average chloride concentration in
groundwater (ML−3), M= mass unit, L=length unit, and T=time
unit.
The average annual rainfall at the study area is 49.3
mm. The regional precipitation-weighted chloride concentration
in the study area is 6.5 mg/l. Average chloride concentration in

Magdy El Maghraby- Groundwater Chemistry in an Area Covered by Lava Flows,
Aqool Area, Eastern Al Madinah Al Munawarah City, Saudi Arabia
EUROPEAN ACADEMIC RESEARCH - Vol. I, Issue 11 / February 2014
4441
groundwater from the recharge part of the aquifer of the study
area is 126 mg/l. From chloride mass-balance equation the
study area has a recharge (2.54 mm/y) of 4.97 % of
precipitation.
Sampling and Analytical Procedures
Twenty-seven groundwater samples were collected from drilled
wells for hydrochemical investigation (Fig. 1). Sampling was
done in accordance with to the US Environmental Protection
Agency guidelines (EPA 2004), and strict consideration was
given to individual parameter holding time criteria as outlined
by the American Public Health Association (APHA 1998). All
the samples were analyzed for major and some minor
constituents. Results of chemical analyses are presented in
Table 1.
Duplicate water samples were taken at each well. One
duplicate sample was collected at its natural pH, in
polyethylene bottles after rinsing several times with water from
the point of collection and preserved (approximately at 4C) for
anion analysis. The second sample was also collected in
polyethylene bottles and acidified using HNO3 to pH < 2 for
cation analysis. All the samples for laboratory analyses were
filtered through 0.45 m membrane filters. The cation and
anion concentrations in groundwater samples were determined
in the laboratories of Chemistry Department, Faculty of
Science, Taibah University, Al Madinah Al Munawarah, Saudi
Arabia.
Hydrogen ion concentration (pH), Electrical conductivity
(EC) and Total Dissolved Solids (TDS) were measured at the
wellhead using portable HI 991300 Hanna Instruments.
Analysis of major ions (Ca, Mg, Na, K, HCO3, SO4, and
Cl) and some trace constituents (NO3, NO2, Fe, Mn, Cd, Cr, Cu,
Pb) were performed in the groundwater samples using the
standard methods (APHA, 1998). The values were observed to
Magdy El Maghraby- Groundwater Chemistry in an Area Covered by Lava Flows,
Aqool Area, Eastern Al Madinah Al Munawarah City, Saudi Arabia
EUROPEAN ACADEMIC RESEARCH - Vol. I, Issue 11 / February 2014
4442
be within a standard limit of ±5% (Domenico and Schwartz
1998).
Bicarbonate concentration was determined using
titration against HCl. Chloride was estimated by titration
against standard solution of AgNO3. Sulfate, nitrate and nitrite,
concentrations were determined using DR4000 HACH
Spectrophotometer. Calcium and Mg concentrations were
determined using titration against EDTA. Sodium and K were
determined using by PFP7 Flame Photometer. Whereas,
Induced Coupled Plasma Mass Spectrometry (ICP/MS) was
used to measure iron, manganese, cadmium, chromium, copper
and lead. The concentrations of Mn, Cd, Cr, Cu and Pb were
below detection limit.
The geochemical computer program PHREEQC
(Parkhurst and Appelo 1999) was used to calculate saturation
indices in the groundwater.
Results and discussion
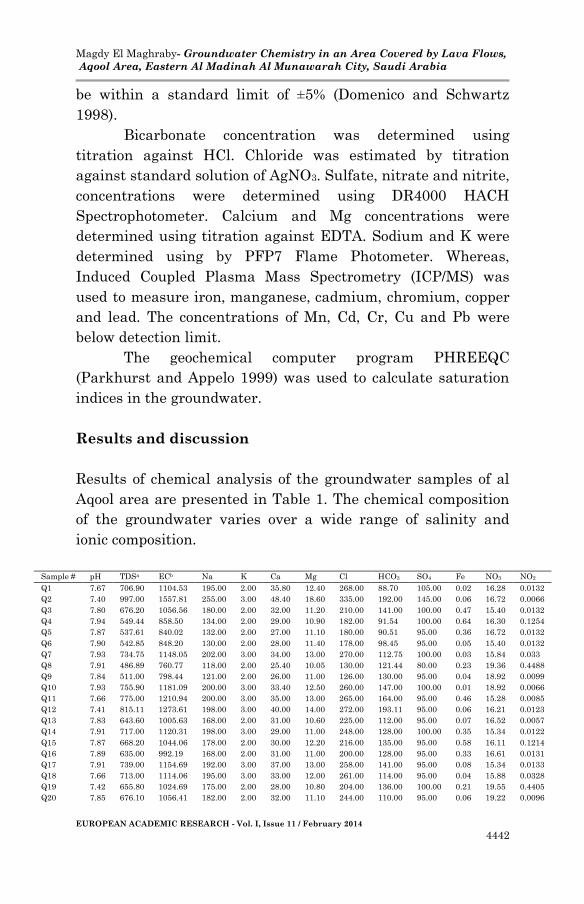
Results of chemical analysis of the groundwater samples of al
Aqool area are presented in Table 1. The chemical composition
of the groundwater varies over a wide range of salinity and
ionic composition.
Sample # pH TDSa ECb Na K Ca Mg Cl HCO3 SO4 Fe NO3 NO2
Q1 7.67 706.90 1104.53 195.00 2.00 35.80 12.40 268.00 88.70 105.00 0.02 16.28 0.0132
Q2 7.40 997.00 1557.81 255.00 3.00 48.40 18.60 335.00 192.00 145.00 0.06 16.72 0.0066
Q3 7.80 676.20 1056.56 180.00 2.00 32.00 11.20 210.00 141.00 100.00 0.47 15.40 0.0132
Q4 7.94 549.44 858.50 134.00 2.00 29.00 10.90 182.00 91.54 100.00 0.64 16.30 0.1254
Q5 7.87 537.61 840.02 132.00 2.00 27.00 11.10 180.00 90.51 95.00 0.36 16.72 0.0132
Q6 7.90 542.85 848.20 130.00 2.00 28.00 11.40 178.00 98.45 95.00 0.05 15.40 0.0132
Q7 7.93 734.75 1148.05 202.00 3.00 34.00 13.00 270.00 112.75 100.00 0.03 15.84 0.033
Q8 7.91 486.89 760.77 118.00 2.00 25.40 10.05 130.00 121.44 80.00 0.23 19.36 0.4488
Q9 7.84 511.00 798.44 121.00 2.00 26.00 11.00 126.00 130.00 95.00 0.04 18.92 0.0099
Q10 7.93 755.90 1181.09 200.00 3.00 33.40 12.50 260.00 147.00 100.00 0.01 18.92 0.0066
Q11 7.66 775.00 1210.94 200.00 3.00 35.00 13.00 265.00 164.00 95.00 0.46 15.28 0.0085
Q12 7.41 815.11 1273.61 198.00 3.00 40.00 14.00 272.00 193.11 95.00 0.06 16.21 0.0123
Q13 7.83 643.60 1005.63 168.00 2.00 31.00 10.60 225.00 112.00 95.00 0.07 16.52 0.0057
Q14 7.91 717.00 1120.31 198.00 3.00 29.00 11.00 248.00 128.00 100.00 0.35 15.34 0.0122
Q15 7.87 668.20 1044.06 178.00 2.00 30.00 12.20 216.00 135.00 95.00 0.58 16.11 0.1214
Q16 7.89 635.00 992.19 168.00 2.00 31.00 11.00 200.00 128.00 95.00 0.33 16.61 0.0131
Q17 7.91 739.00 1154.69 192.00 3.00 37.00 13.00 258.00 141.00 95.00 0.08 15.34 0.0133
Q18 7.66 713.00 1114.06 195.00 3.00 33.00 12.00 261.00 114.00 95.00 0.04 15.88 0.0328
Q19 7.42 655.80 1024.69 175.00 2.00 28.00 10.80 204.00 136.00 100.00 0.21 19.55 0.4405
Q20 7.85 676.10 1056.41 182.00 2.00 32.00 11.10 244.00 110.00 95.00 0.06 19.22 0.0096

Magdy El Maghraby- Groundwater Chemistry in an Area Covered by Lava Flows,
Aqool Area, Eastern Al Madinah Al Munawarah City, Saudi Arabia
EUROPEAN ACADEMIC RESEARCH - Vol. I, Issue 11 / February 2014
4443
Q21 7.95 669.00 1045.31 178.00 2.00 30.00 11.00 231.00 122.00 95.00 0.02 18.12 0.0061
Q22 7.77 532.90 832.66 137.00 2.00 27.00 10.90 178.00 88.00 90.00 0.05 17.57 0.0084
Q23 7.88 670.00 1046.88 182.00 2.00 29.00 12.00 229.00 116.00 100.00 0.06 16.05 0.0127
Q24 7.92 623.00 973.44 169.00 2.00 27.00 11.00 193.00 126.00 95.00 0.08 16.71 0.0059
Q25 7.89 650.00 1015.63 172.00 2.00 29.00 12.00 197.00 138.00 100.00 0.51 17.92 0.0121
Q26 7.81 539.00 842.19 128.00 2.00 26.00 11.00 156.00 121.00 95.00 0.62 16.53 0.1141
Q27 7.94 563.50 880.47 137.00 2.00 27.00 10.50 164.00 128.00 95.00 0.35 16.68 0.0142 cRW 7.10 35.64 55.69 4.10 1.02 3.77 1.20 6.50 14.65 4.40
aTDS: Total Dissolved Solids in (mg/L) bEC : in µmohs/cm at 25oC cRW : Rain Water
Table 1. Results of chemical analysis of major constituents in the
study area (concentrations are in mg/l)
Major constituents
The pH values of the groundwater were varied between 7.4 and
7.95, which indicates that alkalinity is predominately in the
form of HCO3 (Adams et al. 2001). The EC values vary from
760.77 (Q8) to 1557.81 μS/cm (Q2). TDS of groundwater were
ranged between 486.89 mg/l (Q8) and 997 mg/l (Q2) indicating
fresh water type. Little variations in the salinity of the study
area could be attributed to the same hydrochemical processes
affecting the chemistry of groundwater (silicate weathering
(TDS<500 mg/l; one sample Q8), or carbonate weathering
(TDS>500 mg/l; the rest of samples) (Hounslow, 1995)).
Sodium is the dominant cation in all the analyzed
groundwater samples, followed by Ca and Mg (Na>Ca>Mg).
The concentration of Na in the study area varies from 118.0
(Q8) to 255.0 mg/l (Q2) (Table 1). The high concentrations may
be attributed to cation exchange which results in the release of
Na into the groundwater. Potassium shows concentrations
range from 2.0 to 3.0 mg/l (Table 1).
The country silicate rocks in the region are mainly
composed of gabbro, basalt, diorite, andesite and few granitic
rocks. Therefore, Na and Ca are expected to be released during
weathering reactions of these rocks according to the following
reactions:

Magdy El Maghraby- Groundwater Chemistry in an Area Covered by Lava Flows,
Aqool Area, Eastern Al Madinah Al Munawarah City, Saudi Arabia
EUROPEAN ACADEMIC RESEARCH - Vol. I, Issue 11 / February 2014
4444
2NaAlSi3O8 + 2H2CO3 + 9H2O Al2Si2O5 (OH)4 + 2Na+ + 4H4SiO4 + 2HCO3
-(1)
Albite Kaolinite silicic acid
Calcium was found in groundwater samples in concentrations
that vary from 25.4 to 48.40 mg/l (Table 1). Calcium
concentrations may be due to the presence of calcic plagioclase
feldspar in the alluvium which is derived from surrounding
basic igneous rocks. Magnesium concentrations of groundwater
in Al Aqool area were varied between 10.05 and 18.60 mg/l
(Table 1). Mg content is also attributed to the dissolution of
ferromagnesian silicate minerals found in the aquifer matrix.
Ca and Mg are also derived from the dissolution of the
carbonate minerals which are precipitated in the soil zone by
high rates of evaporation and then leached by the agricultural
return flow.
Therefore, it is to be expected that most of this
dissolution will take place a few hours after the infiltration of
precipitation water and mainly close to the land surface (soil
zone) and, to a lesser extent, in deeper zone. Dissolution of
calcite and dolomite in the soil zone takes place according to the
following reactions:
CaCO3 + H2O + CO2 Ca2+ + 2HCO3-
Calcite
CaMg(CO3(2 + 2H2O + 2CO2 Ca2+ + Mg2+ + 4HCO3-
Dolomite
Chloride is the most dominant anion in all samples, followed by
HCO3- or SO4
2- (Cl->HCO3- or Cl->SO4
2+). The concentration of Cl
in the groundwater of the study area ranged between 126 and
335 mg/l (Table 1). The concentrations of chloride may be
attributed to leaching by rain water of the readily soluble salts
(e.g., NaCl salt) precipitated in soil due to high evaporation
rates that increases Cl concentration in the underlying
groundwater.

Magdy El Maghraby- Groundwater Chemistry in an Area Covered by Lava Flows,
Aqool Area, Eastern Al Madinah Al Munawarah City, Saudi Arabia
EUROPEAN ACADEMIC RESEARCH - Vol. I, Issue 11 / February 2014
4445
The possible sources of bicarbonate include presence of
organic matter in the groundwater which is oxidized to produce
carbon dioxide, which in turn promotes dissolution of minerals.
This weathering enriches groundwater in Ca, Mg and
bicarbonates. Weathering of silicate minerals may also be
accounted as a source for bicarbonate (Gastmans et al. 2010), in
addition to cations such as Ca and Mg. The presence of HCO3 in
the groundwater of the study area indicates presence of
recharge areas.
The concentrations of bicarbonate in the groundwater
samples of the study area ranged from 88 mg/l to 193.11 mg/l
(Table 1).
The sources of sulfate in the groundwater samples in the
study area may be attributed to the breaking of organic
substance from top soil/water, leachable sulfate present in
fertilizer, and other human influences (Srinivasamoorthy et al.
2008). The concentrations of sulfate in the groundwater
samples of the study area ranged from 80 and 145 mg/l (Table
1).
Hydrochemical facies
One of the most common methods for the hydrochemical data
presentation is the Piper (1944) trilinear diagram which can
help in hydrochemical classification (Back and Hanshaw 1965).
Distribution of groundwater of Aqool area is shown on the Piper
diagram (Fig. 3). It is clear that the groundwater samples have
the alkali metals (Na+ K) exceeding the alkaline earth elements
(Ca+Mg). These alkali metals are probably derived from the
effect of cation exchange on clay exchange sites.
This geochemical change of groundwater of the study
area is indicated by the arrow in Fig. 3 from the rain water (Ca-
HCO3 water-type) to the groundwater of the study area (Na-Cl
water-type). The water chemistry of the study area is related to
dissolution of more acidic silicate minerals found in the

Magdy El Maghraby- Groundwater Chemistry in an Area Covered by Lava Flows,
Aqool Area, Eastern Al Madinah Al Munawarah City, Saudi Arabia
EUROPEAN ACADEMIC RESEARCH - Vol. I, Issue 11 / February 2014
4446
alluvium and their interaction with water which tend to alter
the groundwater quality.
Fig. 3 Piper diagram of the groundwater samples of the study area
All groundwater samples have Cl followed by SO4 or HCO3 as
the dominant anions. The water samples have the same
hydrochemical facies of Na–Cl, which indicates the final stage
of the geochemical evolution of groundwater.
In order to facilitate interpretations of the evolutionary
spatial trends and hydrochemical processes in the aquifer in
relation to the groundwater flow, chemical data of groundwater
samples have been plotted on the Durov diagram (Burdon and
Mazloum 1958; Lloyd 1965) (Fig. 4). As shown in Fig. 5, all the
groundwater samples are plotted in fields 8 and 9 indicating
reverse ion-exchange reactions and end point waters.
The arrow on the Durov diagram shows possible
geochemical evolution of the groundwater of Aqool area from
Ca–HCO3 recharge water (rain water) to Na-Cl water type.
Rain water is subjected to different processes of evaporation
and interaction with soils and sediments that infiltrate through
them to reach the groundwater. Moreover, as the groundwater

Magdy El Maghraby- Groundwater Chemistry in an Area Covered by Lava Flows,
Aqool Area, Eastern Al Madinah Al Munawarah City, Saudi Arabia
EUROPEAN ACADEMIC RESEARCH - Vol. I, Issue 11 / February 2014
4447
flows through the alluvial aquifer, additional processes of
dissolution/precipitation, cation exchange, and mixing with
return flow will act to increase the groundwater salinity and
change the dominance of ions from Ca to Mg, and finally to Na-
rich water. Simultaneously, anion dominance is changed from
HCO3 to SO4 and finally to Cl, representing end point waters.
Plotting the results of groundwater chemical analysis on
Schoeller's diagram (Fig. 5) (1962) revealed that the
groundwater samples in the study area had nearly the same
trends of increase and decrease with rain water.
Fig. 4 Durov's diagram of the groundwater samples of the study area

Magdy El Maghraby- Groundwater Chemistry in an Area Covered by Lava Flows,
Aqool Area, Eastern Al Madinah Al Munawarah City, Saudi Arabia
EUROPEAN ACADEMIC RESEARCH - Vol. I, Issue 11 / February 2014
4448
Fig. 5 Schoeller's diagram of the groundwater samples of the study
area
Nitrate and nitrite
Nitrate (NO3) contamination of groundwater is a common
occurrence in many parts of the world. The U.S. Environmental
Protection Agency has set 10 mg N/l as the Maximum
Contaminant Level (MCL) for nitrate in drinking water
(Federal Register 2002), as consumption of high-nitrate water
can cause methemoglobinemia, a potentially fatal condition in
infants (Exner et al. 2010).
The nitrate concentration in the study area lower than
the WHO (2011) and Saudi drinking water standards (SASO
1984) of 50 mg/l and the nitrite is lower than 3 mg/l (Table 1)
which means that they are within the safety limits for drinking
purposes.
Trace elements
The main sources of different trace elements in the
groundwater of the study area may be from the leaching
processes.
The analyses of Fe, Mn, Cd, Cr, Cu and Pb constituents
of groundwater samples of the study area reveal that Mn, Cd,

Magdy El Maghraby- Groundwater Chemistry in an Area Covered by Lava Flows,
Aqool Area, Eastern Al Madinah Al Munawarah City, Saudi Arabia
EUROPEAN ACADEMIC RESEARCH - Vol. I, Issue 11 / February 2014
4449
Cr, Cu and Pb are below detection limit. The Fe shows
concentrations ranged between 0.01 and 0.64 mg/l as shown in
Table 1. This indicates less effect of leaching process and recent
recharge water.
Geochemical modeling
The geochemical interactions lead to changes in water
chemistry. The potential for a chemical reaction can be
determined by calculating the chemical equilibrium of the
water with the minerals phases. The equilibrium state of the
water with respect to a mineral phase can be determined by
calculating a saturation index (SI) using analytical data.
Where, the reactive mineralogy of the subsurface can be
predicted by using the saturation index approach from
groundwater data without collecting the samples of the solid
phase and analyzing the mineralogy (Deutsch 1997). The
potential for mineral precipitation or dissolution is assessed
using the saturation index (SI), which is based on the relation
between analytic activities (the ion activity product, IAP) and
the thermodynamic calculation of the solubility product (Ksp).
The SI of a mineral is calculated based on the following
equation (Parkhurst 1995):
sp
10K
IAPlogSI
If SI > 0 the solution is theoretically oversaturated with respect
to the mineral and precipitation may be expected. For SI = 0,
the mineral and solution are in equilibrium and neither
dissolution nor precipitation is predicted to occur. If SI < 0, the
solution is theoretically undersaturated with respect to the
mineral, and if present in the system, dissolution might be
possible.
The geochemical modeling program PHREEQC
(Parkhurst and Appelo 1999); interfaced with Aquachem
2010.1; was used to calculate saturation indices in the

Magdy El Maghraby- Groundwater Chemistry in an Area Covered by Lava Flows,
Aqool Area, Eastern Al Madinah Al Munawarah City, Saudi Arabia
EUROPEAN ACADEMIC RESEARCH - Vol. I, Issue 11 / February 2014
4450
groundwater of the study area. Table 2 shows the results of SI
calculations for the groundwater with respect to various specific
minerals.
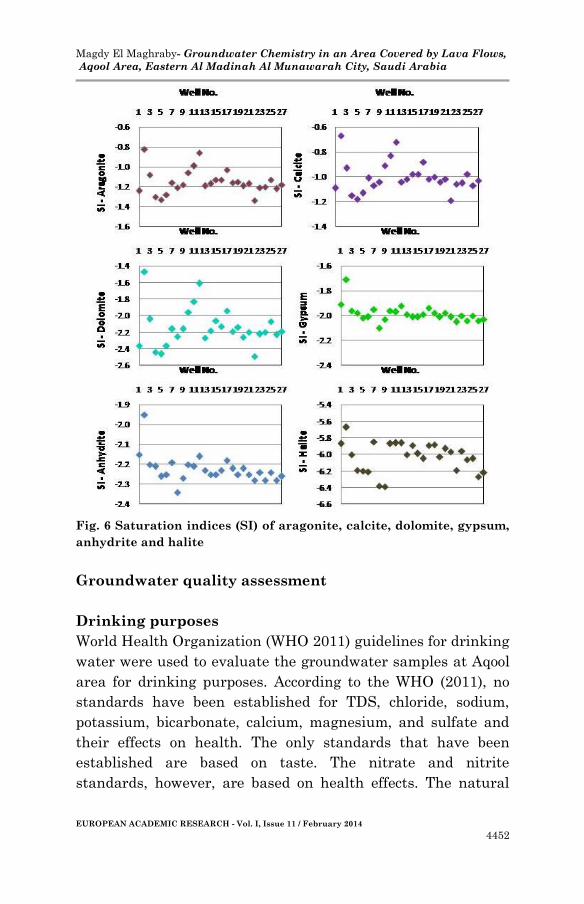
The saturation index of the most common carbonate
minerals are undersaturation with respect to these minerals. SI
varies from -1.34 to -0.82 for aragonite, from -1.19 to -0.67 for
calcite and from -2.49 to -1.47 for dolomite.
It is evident that undersaturation with respect to
carbonate minerals is enhanced by high rate of evaporation
which leads to concentration and precipitation of these
minerals in soil. The formation of white carbonate crust was
noticed in some farms after irrigation process, as well as some
clogging of narrow irrigation pipes in the area of study.
Calculations of SI values in the studied groundwater
indicate that these waters are moderately undersaturated with
respect to sulfate minerals (gypsum and anhydrite) and
strongly undersaturated with respect to halite (-2.10 - -1.71 for
gypsum, -2.34 - -1.94 for anhydrite, -6.39 - -5.67 for halite).
Figure 6 shows that the groundwater samples are
slightly undersaturation with respect to aragonite, calcite,
dolomite, gypsum and anhydrite, and highly undersaturated
with respect to halite.
Well No. Aragonite Calcite Dolomite Gypsum Anhydrite Halite
1 -1.24 -1.09 -2.36 -1.91 -2.15 -5.87
2 -0.82 -0.67 -1.47 -1.71 -1.95 -5.67
3 -1.08 -0.93 -2.04 -1.96 -2.20 -6.00
4 -1.30 -1.15 -2.44 -1.98 -2.21 -6.19
5 -1.33 -1.18 -2.46 -2.02 -2.26 -6.20
6 -1.28 -1.13 -2.36 -2.01 -2.25 -6.21
7 -1.16 -1.01 -2.16 -1.95 -2.19 -5.85
8 -1.21 -1.07 -2.25 -2.10 -2.34 -6.38
9 -1.18 -1.04 -2.16 -2.03 -2.27 -6.39
10 -1.06 -0.91 -1.96 -1.96 -2.20 -5.87
11 -0.99 -0.83 -1.83 -1.97 -2.21 -5.86
12 -0.86 -0.72 -1.61 -1.92 -2.16 -5.86
13 -1.19 -1.04 -2.27 -1.99 -2.23 -6.00
14 -1.17 -1.02 -2.18 -2.01 -2.25 -5.89
15 -1.13 -0.98 -2.06 -2.01 -2.25 -5.99
16 -1.13 -0.98 -2.13 -1.99 -2.23 -6.05
17 -1.03 -0.88 -1.94 -1.94 -2.18 -5.89
18 -1.16 -1.02 -2.19 -1.98 -2.22 -5.88
19 -1.15 -1.00 -2.14 -2.01 -2.25 -6.03
20 -1.19 -1.04 -2.26 -1.98 -2.22 -5.93
21 -1.17 -1.02 -2.20 -2.01 -2.25 -5.97
22 -1.34 -1.19 -2.49 -2.05 -2.28 -6.19

Magdy El Maghraby- Groundwater Chemistry in an Area Covered by Lava Flows,
Aqool Area, Eastern Al Madinah Al Munawarah City, Saudi Arabia
EUROPEAN ACADEMIC RESEARCH - Vol. I, Issue 11 / February 2014
4451
23 -1.21 -1.06 -2.22 -2.00 -2.24 -5.96
24 -1.20 -1.05 -2.20 -2.04 -2.28 -6.06
25 -1.13 -0.98 -2.07 -2.00 -2.24 -6.05
26 -1.22 -1.07 -2.23 -2.04 -2.28 -6.27
27 -1.18 -1.03 -2.19 -2.03 -2.26 -6.22
Table 2. Values of saturation indices for groundwater samples of the
study area with respect to specific minerals
Ionic ratios
Specific ionic ratios were calculated to gain insight into the
possible origin of the water sample and to reveal the possible
hydrochemical processes that dominated in the area of study
(Hounslow, 1995). These ionic ratios are (Na+K-Cl)/(Na+K-
Cl+Ca), Na/(Na+Cl), Mg/(Ca+Mg), and Ca/(Ca+SO4). Their
calculated values showed little variations (Table 3). The
computed values for (Na+K-Cl)/(Na+K-Cl+Ca) ionic ratio of the
groundwater samples are ranged between 0.33 and 0.59 (> 0.2
and < 0.8) indicating possible plagioclase weathering
(Hounslow, 1995).
The computed values for Na/(Na+Cl) ionic ratio of the
groundwater samples are ranged between 0.53 and 0.60 (>0.5)
indicating that the sodium source other than halite - albite, ion
exchange (Hounslow, 1995).
The computed values for Mg/(Ca+Mg) ionic ratio of the
groundwater samples are ranged between 0.36 and 0.41 (<0.5)
indicating limestone-dolomite weathering (Hounslow, 1995).
The computed values for Ca/(Ca+SO4) ionic ratio of the
groundwater samples are ranged between 0.40 and 0.50 (0.5)
indicating gypsum dissolution (Hounslow, 1995). The calculated
SI for gypsum is ranged between -2.10 - -1.71.
Magdy El Maghraby- Groundwater Chemistry in an Area Covered by Lava Flows,
Aqool Area, Eastern Al Madinah Al Munawarah City, Saudi Arabia
EUROPEAN ACADEMIC RESEARCH - Vol. I, Issue 11 / February 2014
4452
Fig. 6 Saturation indices (SI) of aragonite, calcite, dolomite, gypsum,
anhydrite and halite
Groundwater quality assessment
Drinking purposes
World Health Organization (WHO 2011) guidelines for drinking
water were used to evaluate the groundwater samples at Aqool
area for drinking purposes. According to the WHO (2011), no
standards have been established for TDS, chloride, sodium,
potassium, bicarbonate, calcium, magnesium, and sulfate and
their effects on health. The only standards that have been
established are based on taste. The nitrate and nitrite
standards, however, are based on health effects. The natural

Magdy El Maghraby- Groundwater Chemistry in an Area Covered by Lava Flows,
Aqool Area, Eastern Al Madinah Al Munawarah City, Saudi Arabia
EUROPEAN ACADEMIC RESEARCH - Vol. I, Issue 11 / February 2014
4453
concentrations of trace constituents present in groundwater
used for drinking are not of health concern.
The palatability of water with a total dissolved solids
(TDS) level of less than about 600 mg/l is generally considered
to be good; drinking-water becomes significantly and
increasingly unpalatable at TDS levels greater than about 1000
mg/l (WHO 2011). The presence of high levels of TDS may also
be objectionable to consumers, owing to excessive scaling in
water pipes, heaters, boilers and household appliances. No
health-based guideline value for TDS has been proposed
However, all the groundwater samples of the study area
have TDS values less than 1000 mg/l, NO3 values less than 50
mg/l and NO2 values less than 3 mg/l which are considered
below the safe limits for drinking purposes. Consequently,
groundwater of Aqool area can be used safely for drinking.
Sample # (Na+K-Cl)/
(Na+K-Cl+Ca)
Na/
(Na+Cl)
Mg/
(Ca+Mg)
Ca/
(Ca+SO4) SARa RSCb MHc
Q1 0.35 0.53 0.36 0.45 7.16 -1.35 36.35
Q2 0.42 0.54 0.39 0.44 7.90 -0.80 38.79
Q3 0.55 0.57 0.37 0.43 6.98 -0.21 35.59
Q4 0.34 0.53 0.38 0.41 5.38 -0.84 38.26
Q5 0.35 0.53 0.40 0.41 5.40 -0.78 40.40
Q6 0.33 0.53 0.40 0.41 5.23 -0.72 40.17
Q7 0.42 0.54 0.39 0.45 7.47 -0.92 38.67
Q8 0.54 0.58 0.39 0.43 5.02 -0.10 39.48
Q9 0.58 0.60 0.41 0.40 5.02 -0.07 41.09
Q10 0.46 0.54 0.38 0.44 7.49 -0.29 38.16
Q11 0.43 0.54 0.38 0.47 7.33 -0.13 37.98
Q12 0.34 0.53 0.37 0.50 6.86 0.02 36.59
Q13 0.40 0.54 0.36 0.44 6.64 -0.58 36.05
Q14 0.54 0.55 0.38 0.41 7.94 -0.25 38.48
Q15 0.53 0.56 0.40 0.43 6.92 -0.29 40.14
Q16 0.53 0.56 0.37 0.44 6.60 -0.35 36.91
Q17 0.38 0.53 0.37 0.48 6.92 -0.61 36.68
Q18 0.42 0.54 0.37 0.45 7.39 -0.77 37.49
Q19 0.58 0.57 0.39 0.40 7.12 -0.06 38.88
Q20 0.40 0.53 0.36 0.45 7.07 -0.71 36.39
Q21 0.46 0.54 0.38 0.43 7.06 -0.40 37.68
Q22 0.42 0.54 0.40 0.42 5.63 -0.80 39.96
Q23 0.51 0.55 0.41 0.41 7.18 -0.53 40.56
Q24 0.59 0.57 0.40 0.41 6.93 -0.19 40.18
Q25 0.58 0.57 0.41 0.41 6.78 -0.17 40.56
Q26 0.48 0.56 0.41 0.40 5.31 -0.22 41.09
Q27 0.51 0.56 0.39 0.41 5.67 -0.11 39.07
aSAR : Sodium Adsorption Ratio bRSC: Residual Sodium Carbonate cMH: Magnesium Hazard
Table 3. Ionic ratios, SAR, RSC and MH of the groundwater of Al

Magdy El Maghraby- Groundwater Chemistry in an Area Covered by Lava Flows,
Aqool Area, Eastern Al Madinah Al Munawarah City, Saudi Arabia
EUROPEAN ACADEMIC RESEARCH - Vol. I, Issue 11 / February 2014
4454
Aqool area
Irrigation purposes
The suitability of groundwater for irrigation depends on the
effects of mineral content of the water on plant as well as soil.
The salts can harm the plants through growth stage by limiting
the uptake of water through modification of osmotic processes.
In addition, the damage can be chemical through the toxic
constituents. On the other hand, the effects of salts can be on
soils by changing the soil structure and permeability, which
directly affect plant growth (Todd 1980).
The assessment of groundwater for irrigation purposes
depends upon irrigation quality parameters, including total
dissolved solids, sodium adsorption ratio (SAR), residual
sodium carbonate (RSC) and magnesium hazard (MH).
A better measure of the sodium hazard for irrigation is
the SAR, which is used to express reactions with the soil (Fetter
1994). SAR is computed as:
2
22
MgCa
NaSAR
in which Na, Ca and Mg are in meq/l.
The SAR is an important parameter because high Na
content in irrigation water may increase soil hardness and
reduce its permeability. The SAR values of the groundwater
samples of the study area (Table 3) range between 5.02 and
7.94 (i.e. <10), indicating excellent water for irrigation (USSL
1954).
Wilcox classification diagram (1955) was used to identify
the suitability of groundwater for irrigation purposes (Fig. 7).
Wilcox graph classifies groundwater for irrigation
purposes based on SAR and EC. The use of saline waters in
permeable rocks may also increase the salinity of
groundwaters. The plots of groundwater samples of the study
area in Wilcox diagram (Fig. 7) show that the groundwater

Magdy El Maghraby- Groundwater Chemistry in an Area Covered by Lava Flows,
Aqool Area, Eastern Al Madinah Al Munawarah City, Saudi Arabia
EUROPEAN ACADEMIC RESEARCH - Vol. I, Issue 11 / February 2014
4455
samples of the study area are grouped within two fields: C3S1,
and C3S2; which indicate high salinity hazard and low to
medium sodium hazard.
The groundwater of the study area can be used safely for
irrigation on almost all soils; though it may be sensible to keep
control on salinity by suitable management and also by
selecting plants which have good salt tolerance.
Fig. 7 Wilcox diagram of salinity and sodium adsorption ratio (SAR)
hazards for all groundwater samples in the study area
The excesses of carbonate and bicarbonate values in
groundwater samples over those of calcium and magnesium
affect the suitability of groundwater for irrigation. This is
expressed as RSC, which is widely used to indicate the
suitability of groundwater for irrigation purposes and it can be
calculated as follows (Eaton 1950, McLean et al. 2000):
RSC = (CO32- + HCO3-) – (Ca2 + Mg2)
where all ions are expressed in meq/l. The calculated RSC
Magdy El Maghraby- Groundwater Chemistry in an Area Covered by Lava Flows,
Aqool Area, Eastern Al Madinah Al Munawarah City, Saudi Arabia
EUROPEAN ACADEMIC RESEARCH - Vol. I, Issue 11 / February 2014
4456
values of groundwater samples in the study area are found to
range from to -0.35 to 0.02 (Table 3). The classification of
groundwater for irrigation purposes according to RSC values
indicates that all the groundwater samples are <1.25 and hence
it is a good category (USSL 1954).
Szabolcs and Darab (1964) proposed magnesium hazard
(MH) value for irrigation water as given below:
MH = Mg+2/(Ca2+ + Mg2+) 100
where all ions are expressed in meq/l. If MH>50, the water is
considered harmful and unsuitable for irrigation use. The
calculated values of MH of the groundwater samples in the
Aqool area are ranged between 36.05 and 41.09 (Table 3); which
mean they are within the acceptable limits for irrigation.
Refereeing to the TDS values (Table 1) and the
calculated SAR, RSC and MH (Table 3) for the groundwater
samples of Aqool area, it is concluded that these waters are
suitable for irrigation purposes.
Conclusions
The results of chemical analyses of twenty seven groundwater
samples from Aqool area 30 km to the east of Al Madinah Al
Munawarah were used to assess the groundwater quality and
to understand the different geochemical processes affecting its
quality.
The estimated recharge rate of the aquifer of the study
area was 4.97 % of the annual precipitation using the chloride
mass-balance method. Different hydrochemical processes such
as cation-exchange and leaching had been influenced the water
quality of groundwater of the study area. The geochemical
change of groundwater in the study area was observed where
the water types were changed from Ca-HCO3 of rain water into
Na-Cl of groundwater samples.

Magdy El Maghraby- Groundwater Chemistry in an Area Covered by Lava Flows,
Aqool Area, Eastern Al Madinah Al Munawarah City, Saudi Arabia
EUROPEAN ACADEMIC RESEARCH - Vol. I, Issue 11 / February 2014
4457
The drawn Piper and Durov diagrams showed almost all
the samples fall in one zone indicating similar chemical
signature. The constructed Schoeller's diagram revealed that
the groundwater samples in the study area had nearly the
same trends of increase and decrease with rain water.
The saturation index (SI) of the most common carbonate
minerals are undersaturation with respect to aragonite, calcite
and dolomite. It is evident that undersaturation with respect to
carbonate minerals is enhanced by high rate of evaporation
which leads to concentration and precipitation of these
minerals in soil. Calculations of SI values in the studied
groundwater indicate that these waters are moderately
undersaturated with respect to sulfate minerals (gypsum and
anhydrite) and strongly undersaturated with respect to halite.
The calculated specific ionic ratios (Na+K-Cl)/(Na+K-Cl+Ca),
Na/(Na+Cl), Mg/(Ca+Mg), and Ca/(Ca+SO4) indicate possible
plagioclase weathering, ion exchange limestone-dolomite
weathering, and gypsum dissolution; respectively.
Groundwater of Aqool area showed lower concentrations
for TDS, NO3 and NO2, consequently, it can be used safely for
drinking purposes.
The TDS values, and the calculated SAR, RSC and MH
parameters of the groundwater samples of Aqool area indicated
excellent water for irrigation.
It is recommended that drip irrigation method must be
applied in this area to prevent aquifer depletion which results
due to over pumping. On the other hand, monitoring the
groundwater quality including the possibility of leaching soils of
the agricultural land which causes an increase in salinity of the
water in this area.
BIBLIOGRAPHY:
Abderrahman, W.A. 2006. “Water Management in ArRiyadh.”

Magdy El Maghraby- Groundwater Chemistry in an Area Covered by Lava Flows,
Aqool Area, Eastern Al Madinah Al Munawarah City, Saudi Arabia
EUROPEAN ACADEMIC RESEARCH - Vol. I, Issue 11 / February 2014
4458
Int J Wat Resour Dev 22(2): 281.
Adams, S, Titus, R, Pietersen, K, Tredoux, G, and Harris, C.
2001. “Hydrochemical characteristics of aquifer near
Sutherland in the Western Karoo, South Africa.” J
Hydrol 241:91–103.
Al-Ahmadi, M E. 2013a. “Hydrochemical characterization of
groundwater in wadi Sayyah, Western Saudi Arabia.”
Appl Water Sci 3:721–732, DOI 10.1007/s13201-013-
0118-x
Al-Ahmadi, M E. 2013b. “Groundwater quality assessment in
Wadi Fayd, Western Saudi Arabia. Arab J Geosci
6:247–258. DOI 10.1007/s12517-011-0337-0
Al-Bassam, AM. 1998. “Determination of hydrochemical
processes and classification of hydrochemical facies for
Sakakah Aquifer, North Eastern Saudi Arabia.” J Afr
Earth Sci 27(1): 27-38.
Al-Bassam, AM, Hussein, MT, and Sharaf, MA. 2003. “Areal
distribution of the dissolved major and minor ions in the
Sakaka aquifer, Saudi Arabia.” Ann Geol Surv Egypt
32:453-466.
Al-Sefry, SA, and Sen, Z. 2006. “Groundwater rise problem and
risk evaluation in major cities of arid lands-Jeddah case
in Kingdom of Saudi Arabia.” Wat Resour Manag 20: 91-
108.
Al-Shaibani, AM. 2008. “Hydrogeology and hydrochemistry of a
shallow alluvial aquifer, western Saudi Arabia.”
Hydrogeol J 16:155–165.
Alyamani, M. 2000. “Salinity problem of groundwater in the
Wadi Tharad basin, Saudi Arabia.” GeoJournal 48:291–
297.
APHA (American Public Health Association). 1998. Standard
Methods for the Examination of Water and Wastewater,
20th ed. APHA-AWWA-WET, Washington, DC, USA.
Back, W. and Hanshaw, BB. 1965. “Chemical geohydrology.”
Adv Hydro Sci 1:49–109.

Magdy El Maghraby- Groundwater Chemistry in an Area Covered by Lava Flows,
Aqool Area, Eastern Al Madinah Al Munawarah City, Saudi Arabia
EUROPEAN ACADEMIC RESEARCH - Vol. I, Issue 11 / February 2014
4459
Bayumi, TH. 2008. “Impact of natural and human activities on
the groundwater quality in the southern part of Al-
Madinah Al-Munawarah, Saudi Arabia.” Ann Geol Surv
Egypt xxx: 557-578.
Bazuhair, AS and Wood, WW. 1996. “Chloride mass-balance
method for estimating ground water recharge in arid
areas: examples from western Saudi Arabia.” J Hydrol
186:153–159.
Bokhari, AY and Khan, MZA. 1992. “Deterministic modeling of
Al-Madinah Al-Munawarah groundwater quality using
Lumped parameter approach.” J King Abdulaziz Univ:
Earth Sci 5:89-107
Burdon, D.J. and Mazloum, S. 1958. “Some chemical types of
groundwater from Syria.” UNESCO Symposium,
Tehran, pp 73–90
Cobbina, SJ, Nyame, FK, and Obiri, S. 2012. “Groundwater in
the Sahelian region of Northern Ghana, West Africa.”
Res J Environ Earth Sci 4(4):482–2491.
De Jong, RL, Yazicigil, H, and Al-Layla, RI. 1989. “Scenario
planning for water resources: Saudi Arabian case study.”
Wat Int 14:6-12.
Deutsch, WJ. 1997. Groundwater geochemistry: Fundamentals
and application to contamination. Lewis Publisher Boca
Raton
Domenico, PA and Schwartz, FW. 1998. Physical and chemical
hydrogeology. 2nd ed. New York: Wiley.
Gastmans, D, Chang, HK, and Hutcheon, I. 2010.
“Groundwater geochemical evolution in the northern
portion of the Guarani Aquifer System (Brazil) and its
relationship to diagenetic features.” App Geoch 25:16-33.
Eaton, EM. 1950. “Significance of carbonate in irrigation
water.” Soil Sci 69:12–133.
El Maghraby, MM. 2004. “Salinization of groundwater at the
Quba area, Al Madinah Al Munawarah, Saudi Arabia.”
Proceed6th Int Conf on Geochem. Alex Univ, Egypt. 15-16

Magdy El Maghraby- Groundwater Chemistry in an Area Covered by Lava Flows,
Aqool Area, Eastern Al Madinah Al Munawarah City, Saudi Arabia
EUROPEAN ACADEMIC RESEARCH - Vol. I, Issue 11 / February 2014
4460
September. 309-318.
El Maghraby, M M S, Abu El Nasr A Kh O, and Hamouda M S
A. 2013. “Quality assessment of groundwater at south Al
Madinah Al Munawarah area, Saudi Arabia.” Environ
Earth Sci 70: 1525–1538 DOI 10.1007/s12665-013-2239-
9
EPA (Environmental Protection Agency). 2004. 2004 edition of
the drinking water standards and health advisories.
EPA 822-R-04-004 Office of Water US EPA Washington
DC.
Exner, ME, Perea-Estrada H, and Spalding RF. 2010. “Long-
term response of groundwater nitrate concentrations to
management regulations in Nebraska’s Central Platte
Valley.” The Sci World J 10:286–297.
Federal Register. 2002. National Primary Drinking Water
Standards. Title 40 Chap 1 Part 141:62 (7-1-02 edition)
Fetter, CW. 1994. Applied hydrogeology. 3rd ed. New York:
Macmillan College Publication.
George, M. and Shorbaji, H. 1987. “Explanatory notes to the
hydrogeologic and hydrochemical maps of the Al
Madinah quadrangle.” Sheet 24D KDS Open-file rep
BRGM-OF-07-23 Ministry of Petroleum and Mineral
Resources KSA.
Hounslow, AW. 1995. Water Quality Data: Analysis and
Interpretation. CRC Press LLC, 416p.
Hussain, G. and Sadiq, M. 1991. “Metal chemistry of irrigation
and drainage waters of Al-Hassa Oasis of Saudi Arabia
and its effects on soil properties.” Wat Air Soil Poll 57-
58:773-783.
Johnson, PR. 1983. “A preliminary lithofacies map of the Saudi
Arabian Shield, An interpretation of the lithofacies and
lithostratigraphy of the Late Proterozoic layered rocks of
Saudi Arabia: Saudi Arabian Deputy Ministry of
Mineral Resources Jiddah.” Technical Rep RF-TR-03-2,
72.

Magdy El Maghraby- Groundwater Chemistry in an Area Covered by Lava Flows,
Aqool Area, Eastern Al Madinah Al Munawarah City, Saudi Arabia
EUROPEAN ACADEMIC RESEARCH - Vol. I, Issue 11 / February 2014
4461
Khashogji, M S and El Maghraby M M S. 2013. “Evaluation of
groundwater resources for drinking and agricultural
purposes, Abar Al Mashi area, south Al Madinah Al
Munawarah City, Saudi Arabia.” Arab J Geosci 6: 3929–
3942 DOI 10.1007/s12517-012-0649-8.
Lloyd, JW. 1965. “The hydrochemistry of the aquifer of north
eastern Jordan.” J Hydrol
Lloyd, JW and Pirn, RH. 1990. “The hydrogeology and
groundwater resources development of the Cambro-
Ordovician sandstone aquifer in Saudi Arabia and
Jordan.’ J Hydrol 121:1-20.
Magnus, Igboekwe MU, Akankpo AO, and Udoinyang IE. 2011.
“Hydrochemical evaluation of groundwater quality in
Michael Okpara University of Agriculture, Umudike and
its environs, Southeastern Nigeria.” J Water Resour Prot
3:925–929.
Matsah, MI and Hossain, D. 1993. “Ground conditions in Al-
Madinah Al-Munawarah, Saudi Arabia.” J King
Abdulaziz Univ: Earth Sci 6:47-77.
McLean, W, Jankowski, J, and Lavitt, N. 2000. “Groundwater
quality and sustainability in an alluvial aquifer,
Australia.” In Proceedings of the XXX IAH congress on
groundwater: past achievements and future challenges,
edited by Sililo et al, 567–573. A.A., Balkema,
Rotterdam.
Ministry of Petroleum and Mineral Resources KSA. 1987.
Geologic map of Kingdom of Saudi Arabia.
Parkhurst, DL. 1995. “User’s Guide to PHREEQC – A
Computer program for speciation, reaction-path,
advective-transport, and inverse geochemical
calculations.” US Geolog Surv Wat-Resour Inv Rep 95-
4227.
Parkhurst, DL and Appelo, AAJ. 1999. “User’s Guide to
PHREEQC (V 2) – A computer program for speciation,
batch-reaction, one-dimensional transport, and inverse

Magdy El Maghraby- Groundwater Chemistry in an Area Covered by Lava Flows,
Aqool Area, Eastern Al Madinah Al Munawarah City, Saudi Arabia
EUROPEAN ACADEMIC RESEARCH - Vol. I, Issue 11 / February 2014
4462
geochemical modeling.” US Geolog Surv Wat-Resour Inv
99–4259:312.
Pellaton, C. 1981. “Explanatory noted to the geologic map of the
Al-Madinah Quadrangle.” Sheet 24D KSA Geolog Map
GM-52C DGMR Govt KSA.
Pieke, JG. 1985. “Ground Water Resources and Development in
the central region of the Arabian Gulf.” IAH- Memoires
of the 18th congress Hydrogeology in the service of Man
18/2 Cambridge (IAHS) 46-55.
Piper, AM. 1944. “A graphic procedure in the geochemical
interpretation of water analyses.” Am Geophys Un
Transac 25:914-923
Ramesh, K, Bhuvana and Jagadeewari P. 2012. “Hydrochemical
characteristics of groundwater for domestic and
irrigation purposes in Periyakulam Taluk of Theni
District, Tamil Nadu.” I. Res J Environ Sci 1:19–27.
SASO (Saudi standards, metrology and quality Organization).
1984. Saudi Standards, metrology and quality
Organization. Iss 409/84 Riyadh KSA
Schoeller, H. 1962. “Geochemie des eaux souterraines.” Rev de
I' Inst Francais du Petrole 10:230–244.
Silva-Filho, Emmannoel V., Renato G. Sobral Barcellos,
Christophe Emblanch, Bernard Blavoux, Silvia Maria
Sella, Michel Daniel, Roland Simler, Julio Cesar
Wasserman. 2009. “Groundwater chemical
characterization of a Rio De Janeiro aquifer, SE-Brazil.”
J S Am Earth Sci 27:100–108.
Srinivasamoorthy, K, Chidambaram, S, Prasanna, MV,
Vasanthavihar, M, Peter, J, and Anandhan, P. 2008.
“Identification of major sources controlling groundwater
chemistry from hard rock terrain - a case study from
Mettur taluk, Salem district, Tamil Nadu, India.” J
Earth Syst Sci 117(1):49–58
Subyani, AM. 2004. “Use of chloride-mass balance and
environmental isotopes for evaluation of groundwater
Magdy El Maghraby- Groundwater Chemistry in an Area Covered by Lava Flows,
Aqool Area, Eastern Al Madinah Al Munawarah City, Saudi Arabia
EUROPEAN ACADEMIC RESEARCH - Vol. I, Issue 11 / February 2014
4463
recharge in the alluvial aquifer Wadi Tharad western
Saudi Arabia.” Environ Geol 46:741–749.
Szabolcs, I. and Darab, C. 1964. “The influence of irrigation
water of high sodium carbonate content of soils.” In
Proceedings of 8th International Congress of Isss, Trans,
v. II: 803–812.
Todd, D. 1980. Groundwater hydrology. 2nd ed. New York:
Wiley.
United Nations Environmental program (UNEP). 2002. Global
Environmental outlook 2002. London: Earthscan
Publications Ltd.
US Salinity Laboratory Staff. 1954. Diagnosis and improvement
of saline and alkali soils. US Department of Agriculture
Handbook no. 60, Washington, DC.
Wilcox, LV. 1955. “Classification and Use of Irrigation Waters.”
US Dep Agric Circ 969:19.
Wood, WW and Sandford, WE. 1995. “Chemical and isotopic
method for quantifying ground-water recharge in a
regional, semiarid environment.” Gr Wat 33(3):458–486.
WHO (World Health Organization). 2011. Guidelines for
Drinking-water Quality. 4th ed Geneva 541 [electronic
resource]